

Fermatean Fuzzy-Based Personalized Prioritization of Barriers to IoT Adoption within the Clean Energy Context
 , and
, and
Abstract
:1. Introduction
Motivation and Research Contributions
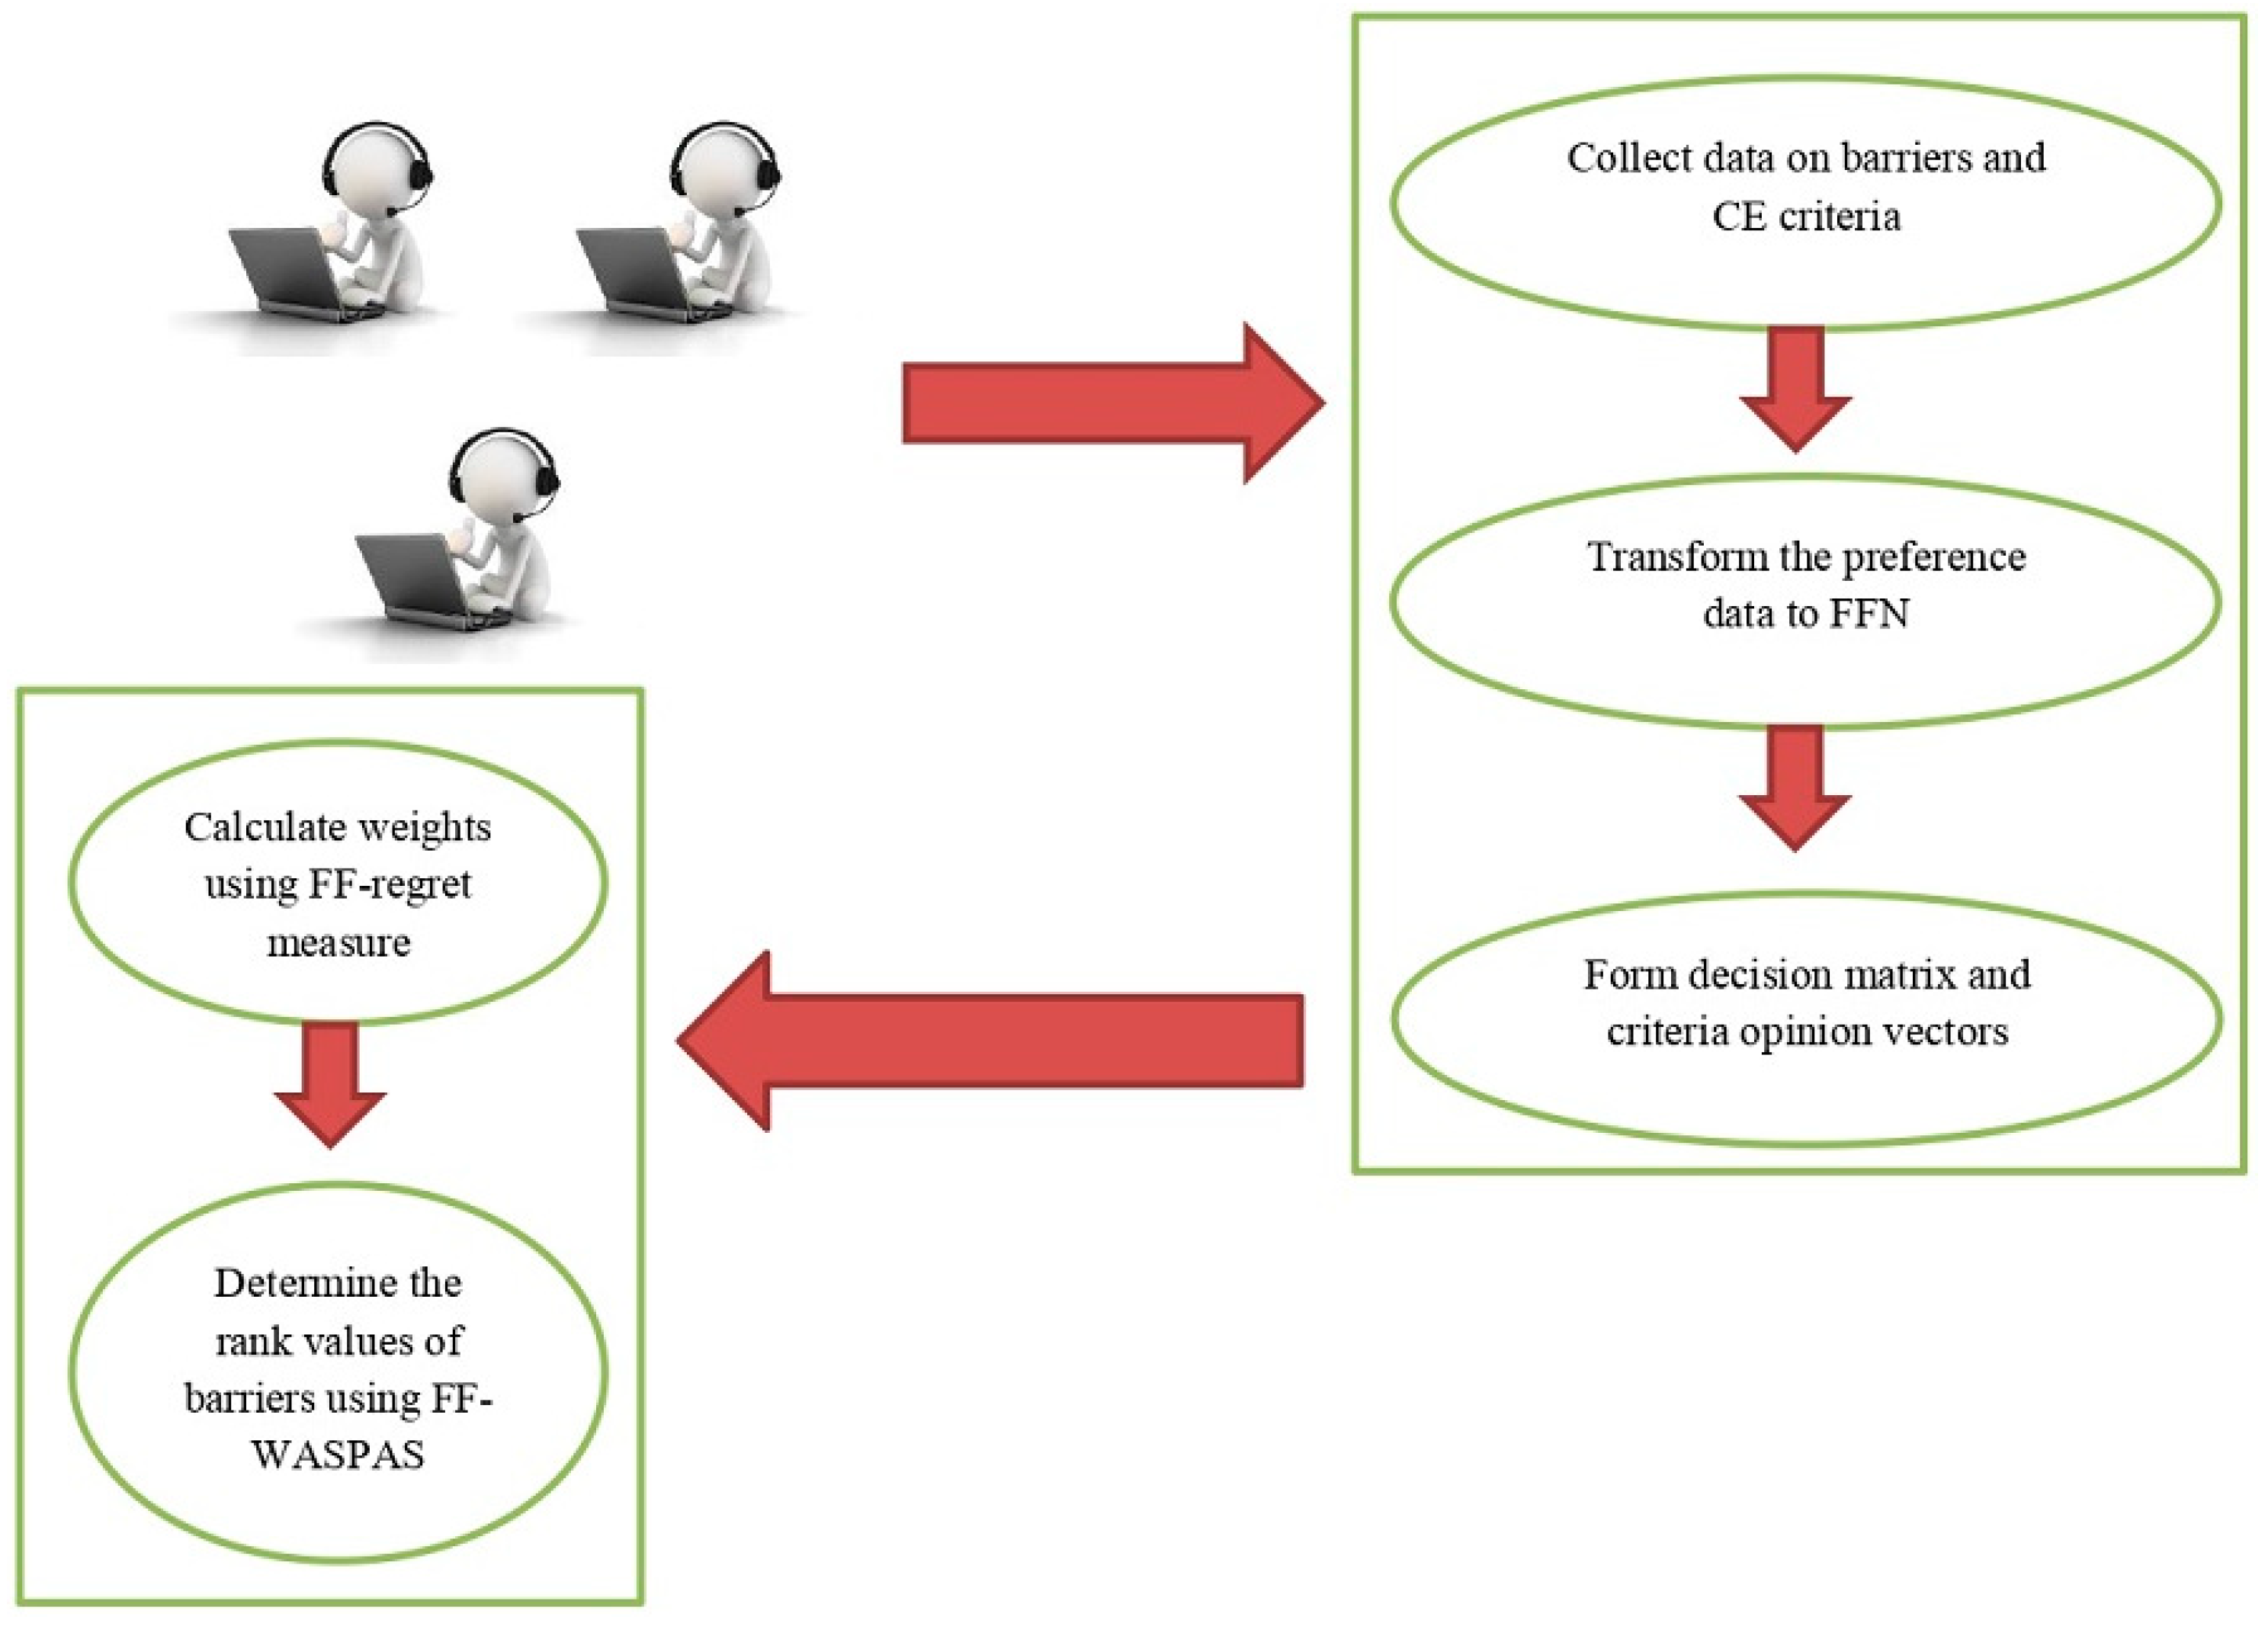
- Initial qualitative rating data from experts via questionnaires are converted to Fermatean fuzzy data (FFD) [13], which not only offers flexibility to experts in terms of opinion sharing from both preference and non-preference aspects but also helps to model uncertainty better by using three grades of uncertainty viz., membership, hesitancy, and non-membership as claimed in [13]. The inequality constraint ( is the membership grade and is the non-membership grade) allows flexibility in the orthopair values, thereby providing a window for experts to express their opinions effectively compared to fuzzy set, intuitionistic, and Pythagorean fuzzy sets. Based on the discussion with experts regarding the quantification of the qualitative terms for the degree of preference and non-preference, the conversion is made by adhering to the constraint of FFD.
- Weights of criteria are determined methodically by presenting a regret measure, which not only captures the hesitation of experts but also considers the nature of criteria during weight assessment.
- A new ranking algorithm is developed by considering the formulation of “weighted aggregated sum product assessment” (WASPAS) and personal choices from experts to obtain personalized ordering of barriers, which not only provides a sense of personalization but also adds rationality to the decision process by considering the rating for each criterion and their overall opinion for a particular option (barrier in this case).
- Further, a case example of barriers to IoT adoption in the clean energy sector within India is demonstrated to understand the model’s usefulness.
- Finally, sensitivity analysis for weight values followed by a comparison of the proposed model with extant models from both the application and method perspectives is performed to understand the merits and limitations of the current work.
2. Literature Review
2.1. Decision Models for Barriers Ranking
2.2. Fermatean Fuzzy-Based Decision Models
3. Methodology
3.1. Preliminaries
3.2. Weight Etimation by Regret Measure
3.3. Rank Algorithm for Ordering Barriers
4. Case Example of Barrier Ranking in the Clean Energy Sector
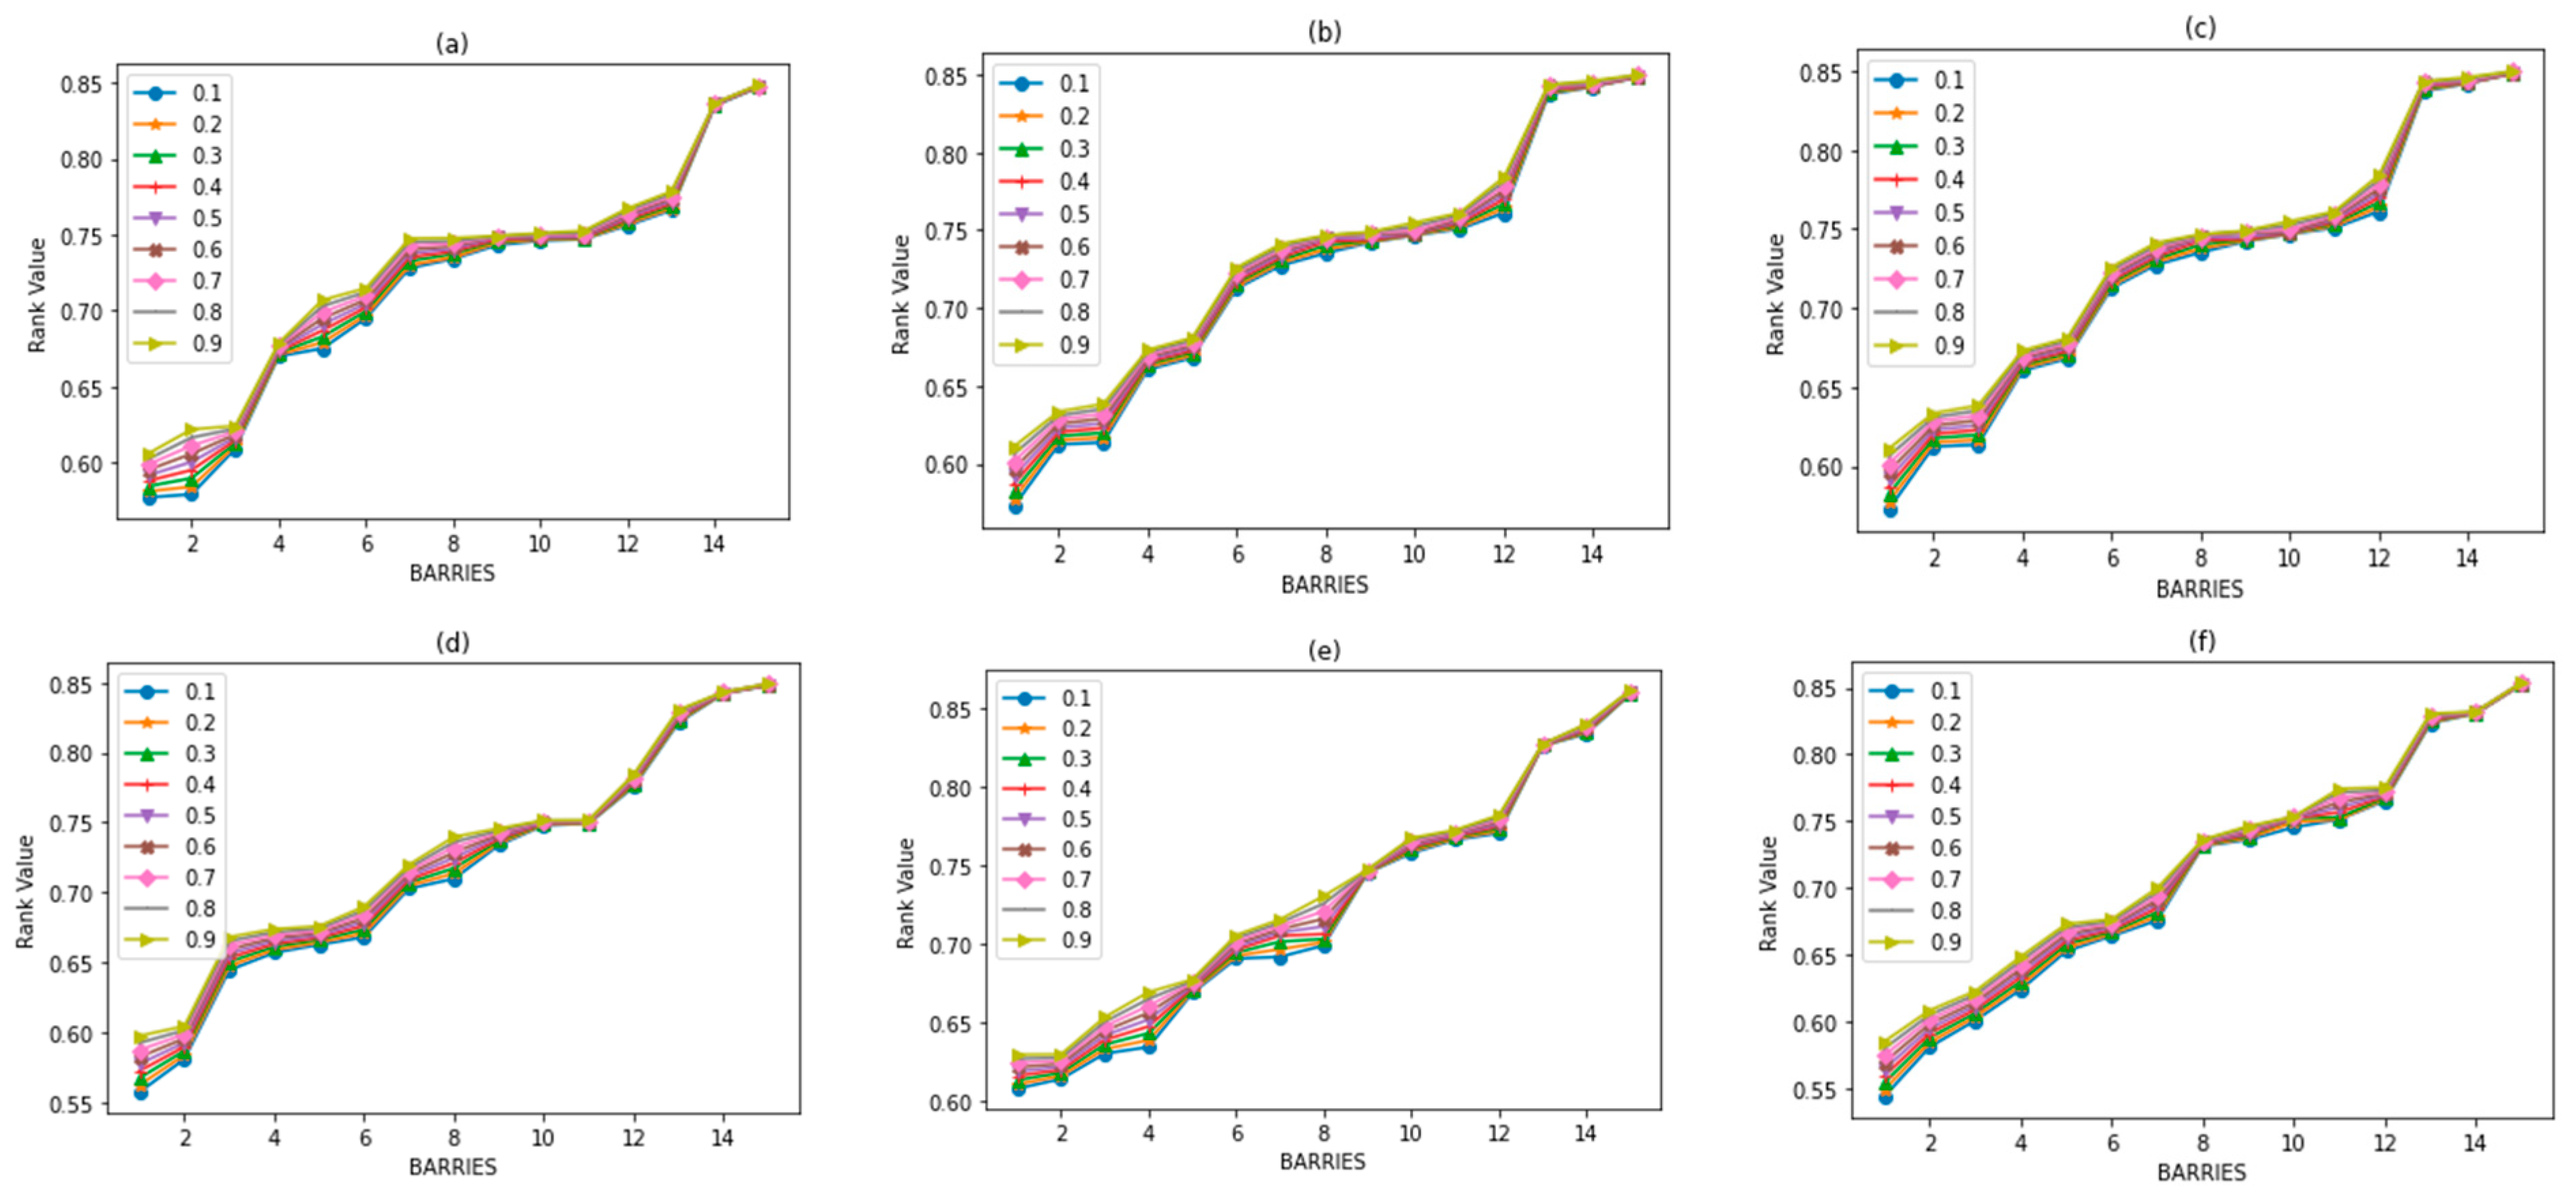
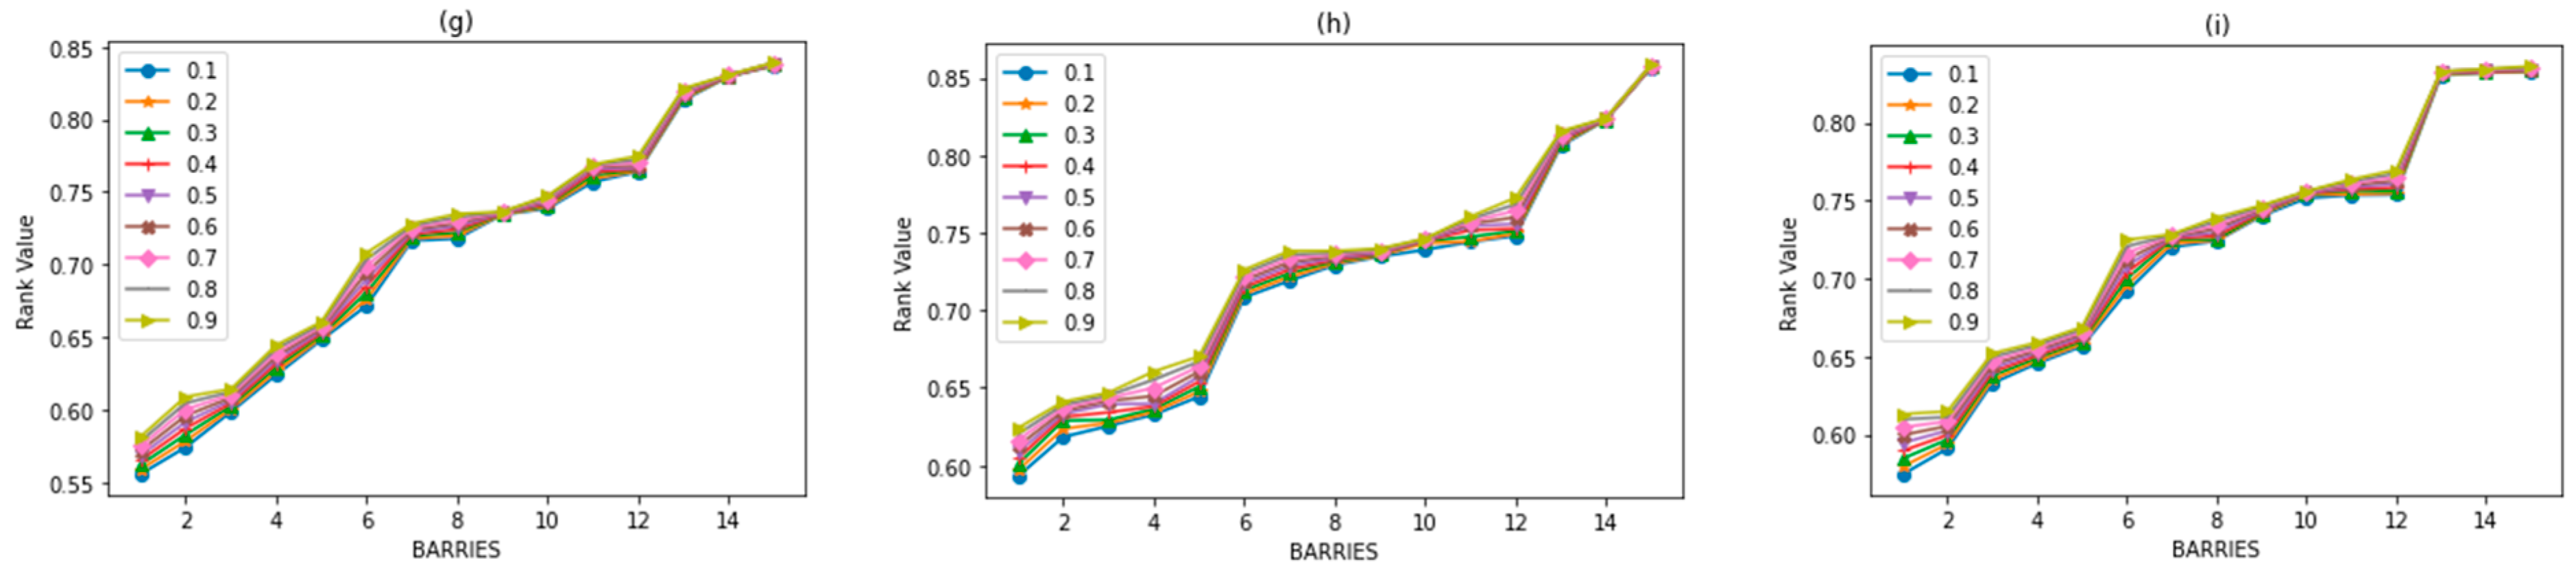
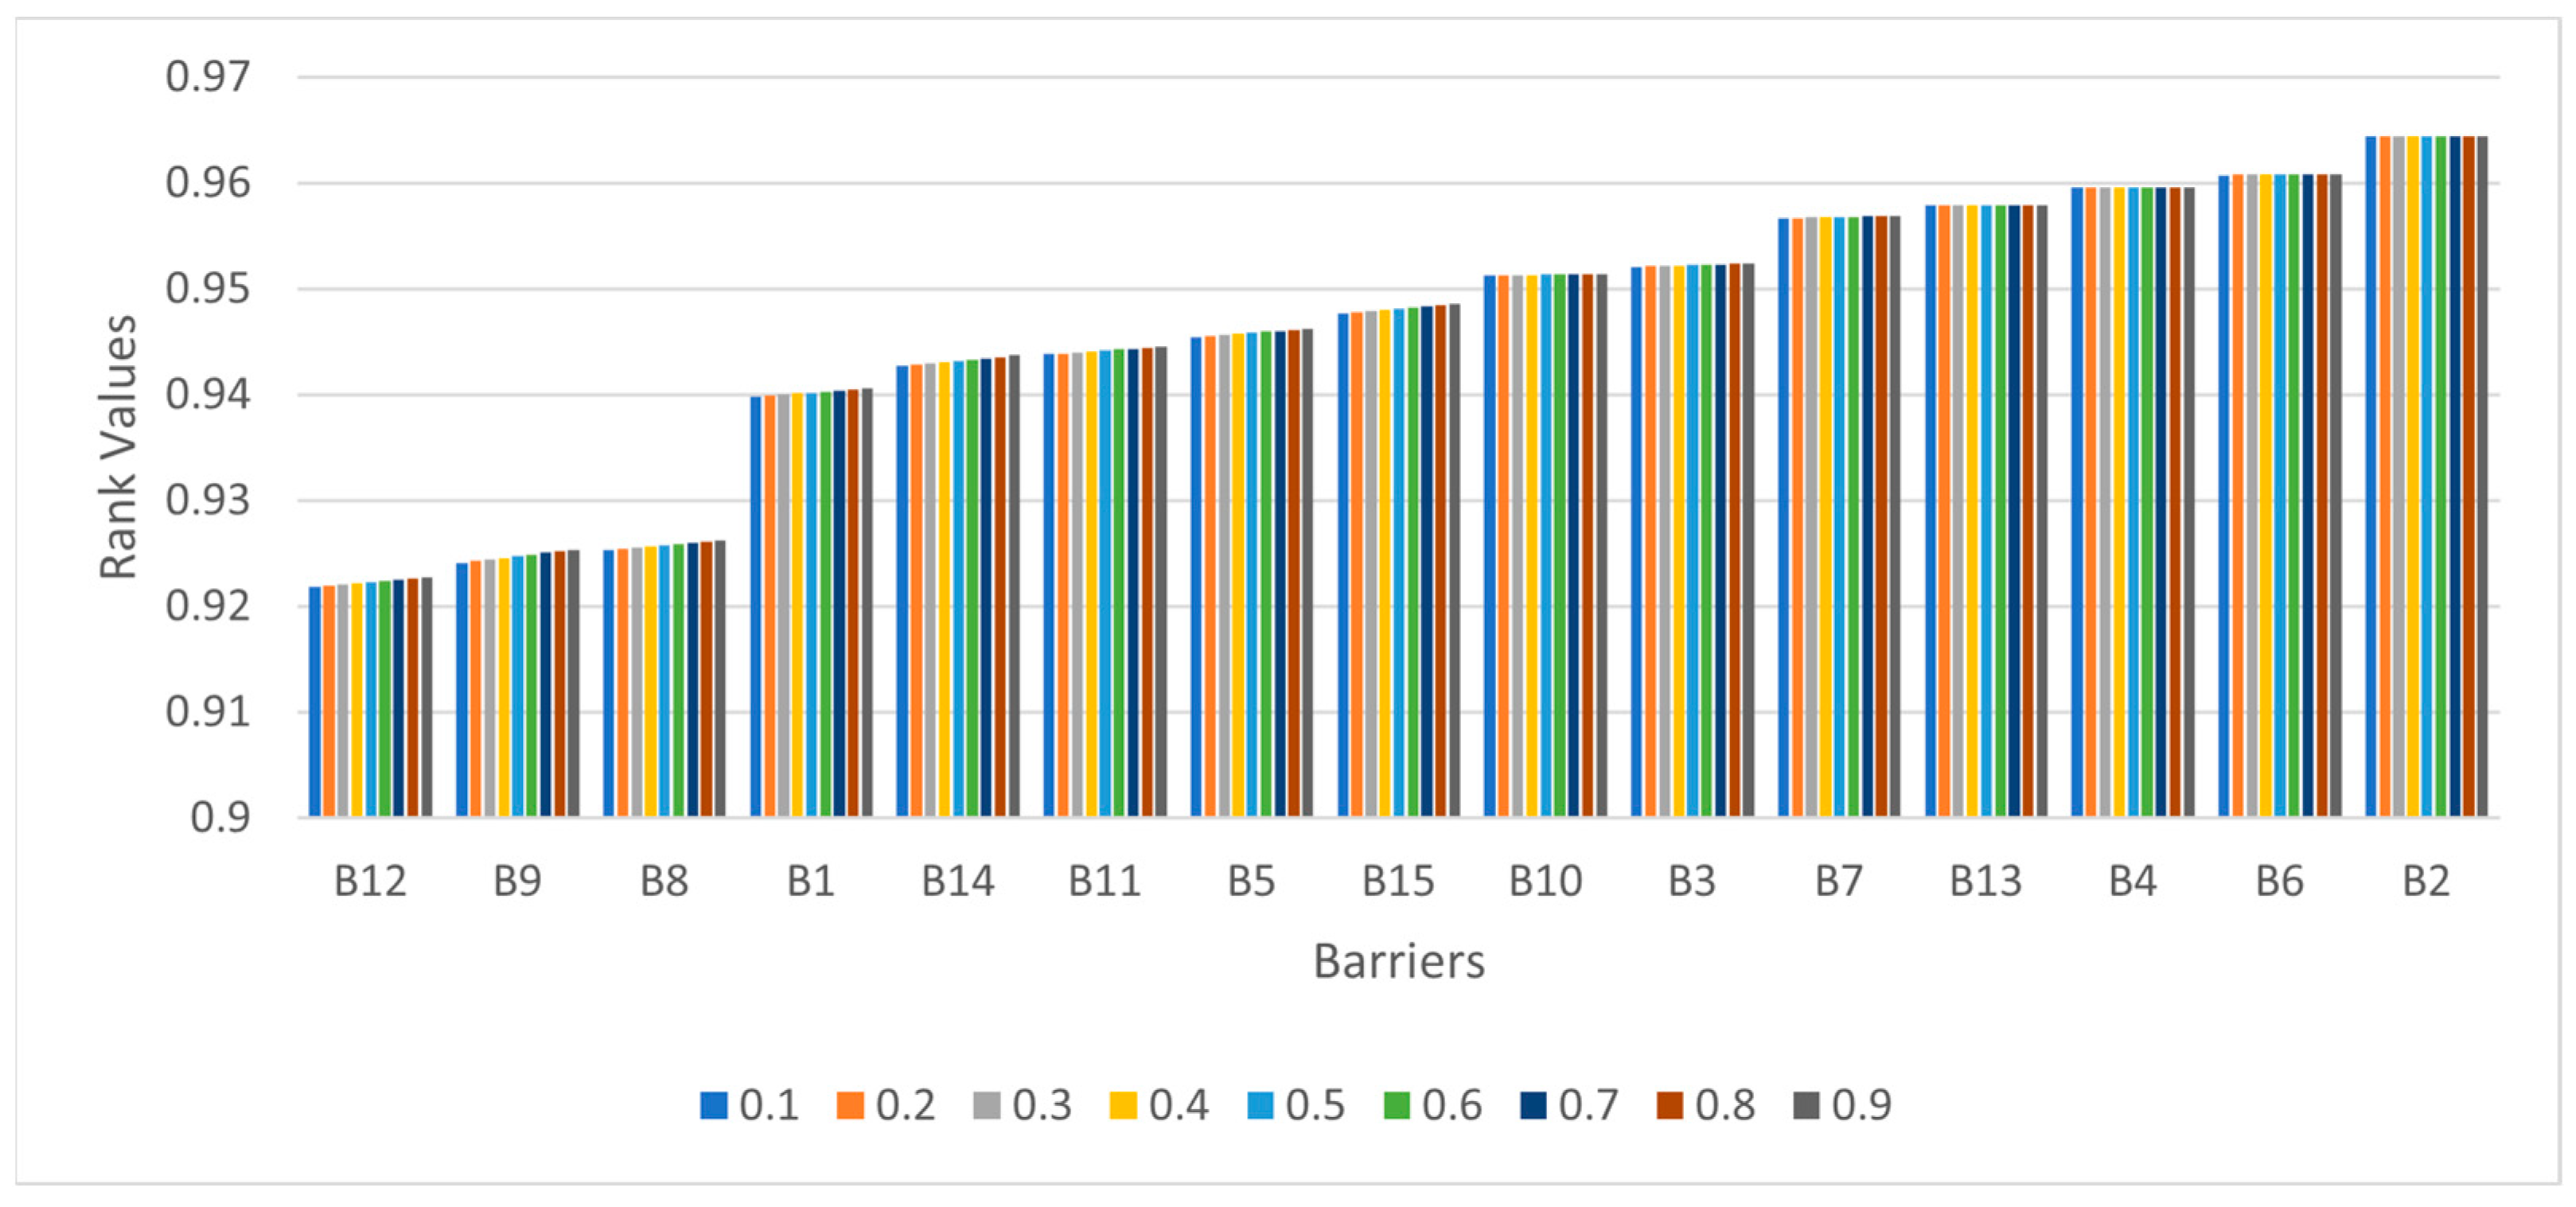
Sensitivity Analysis
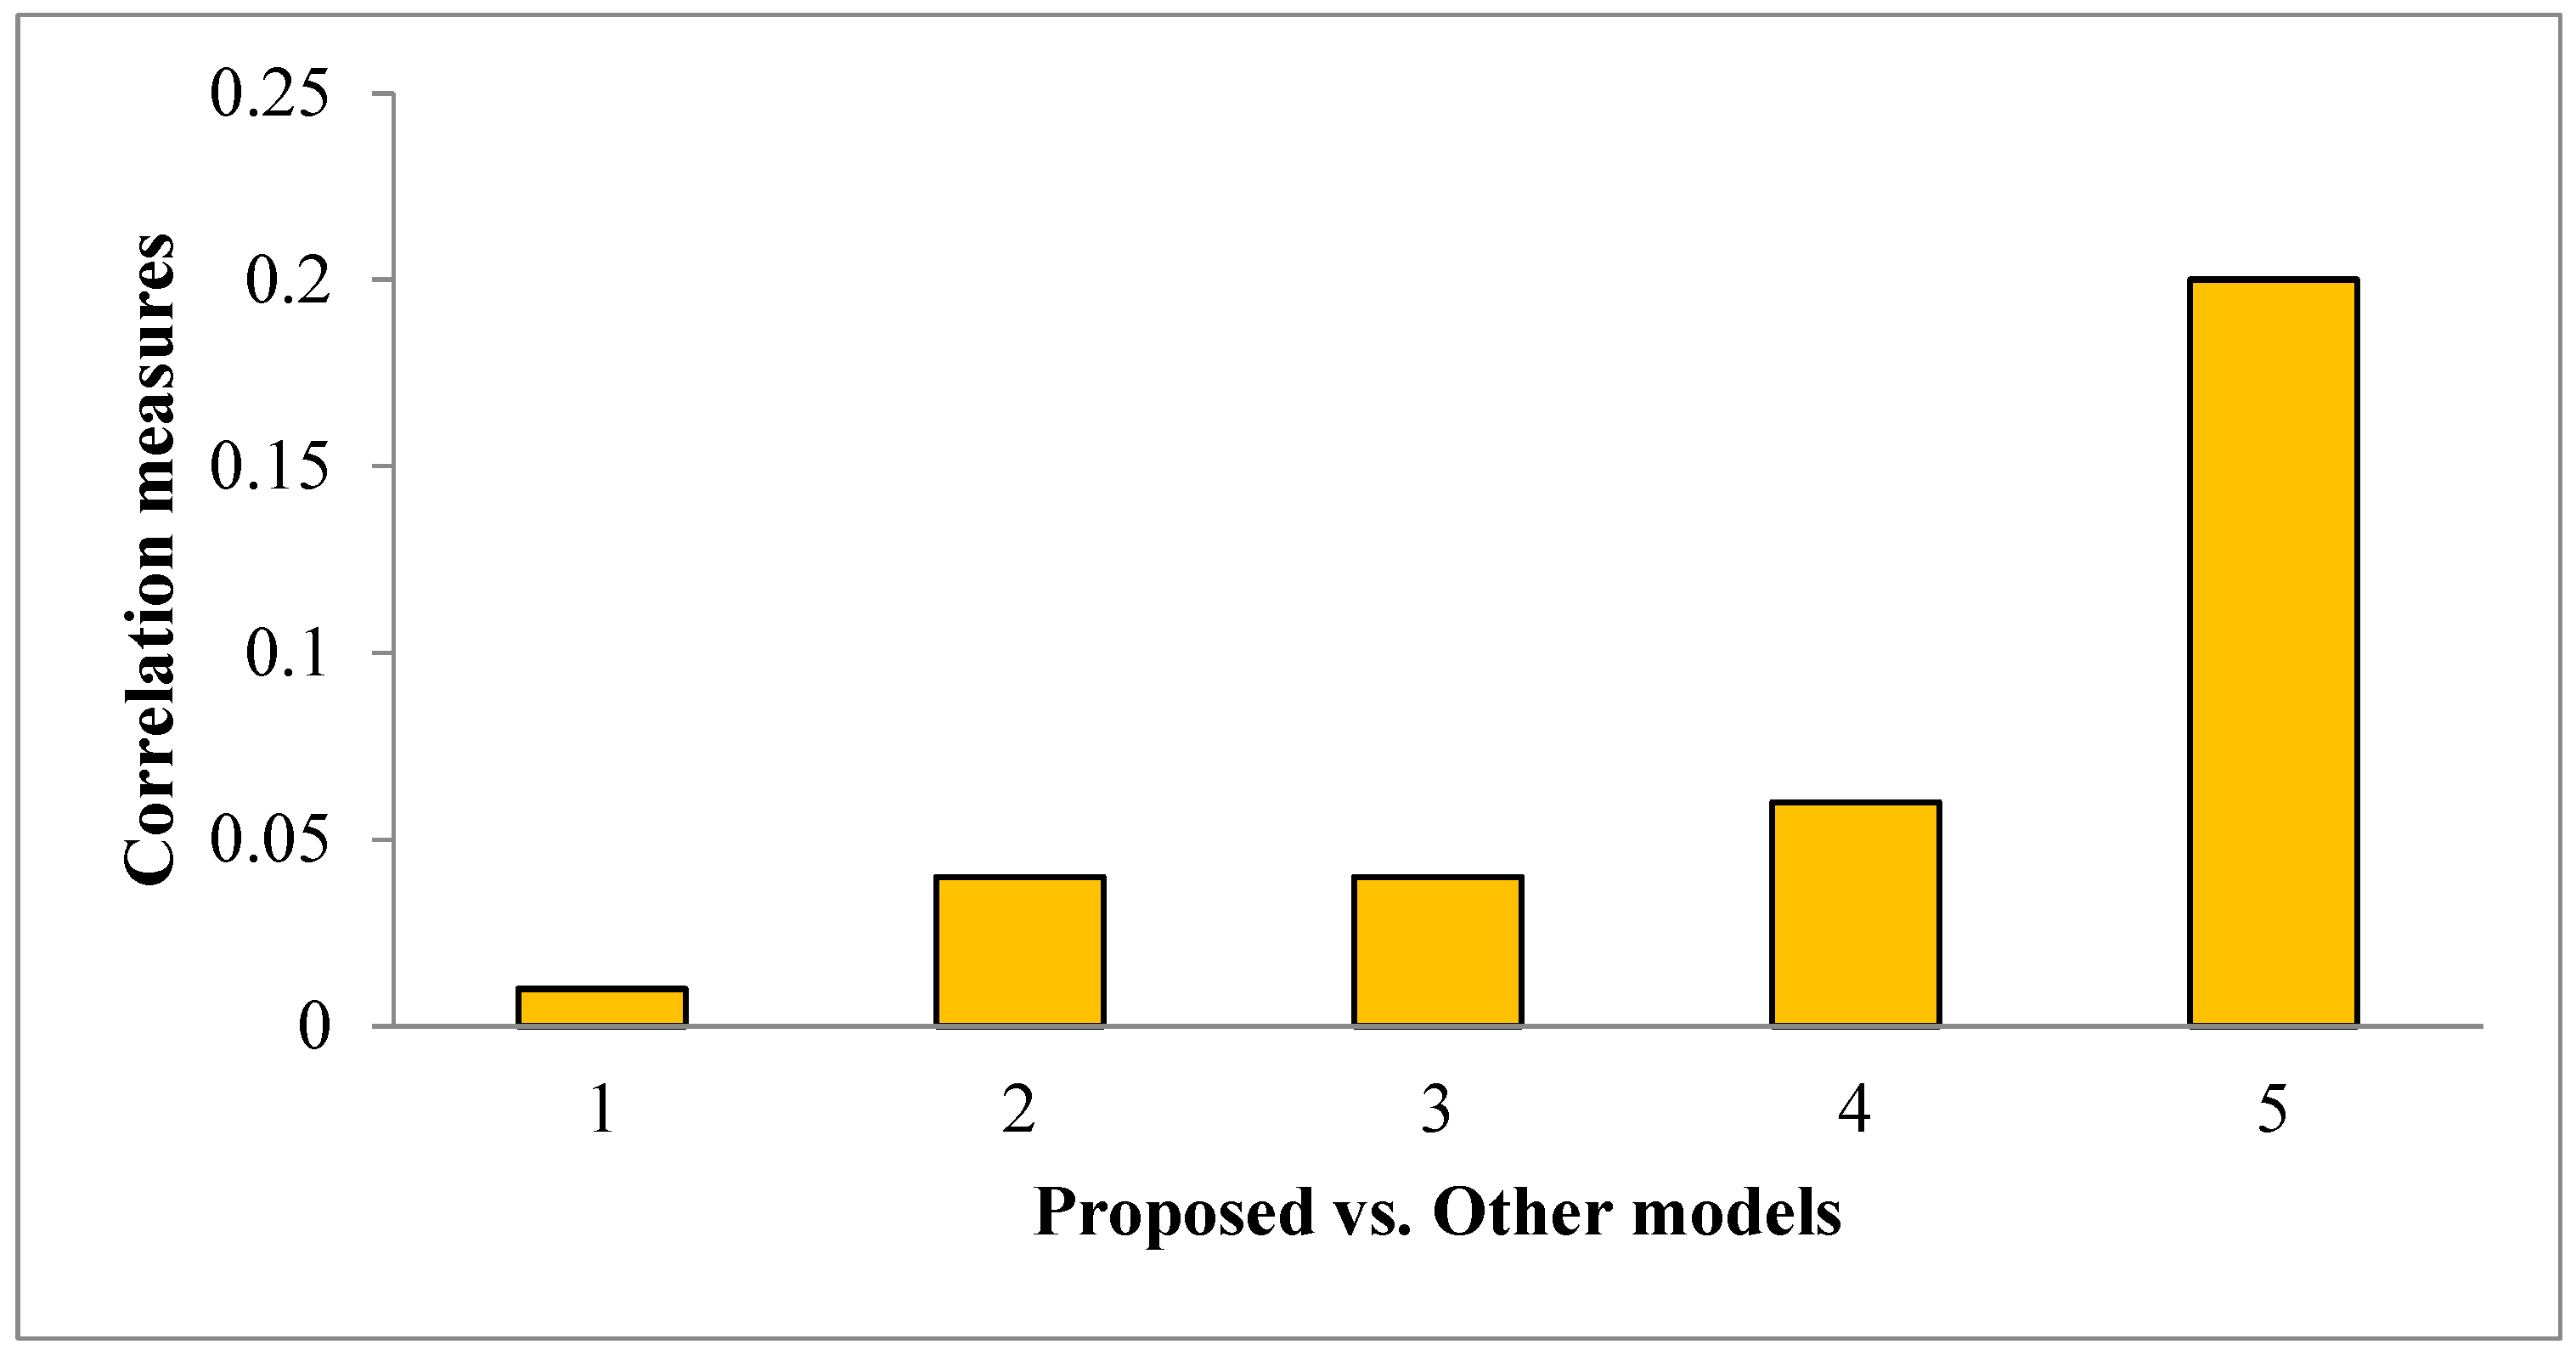
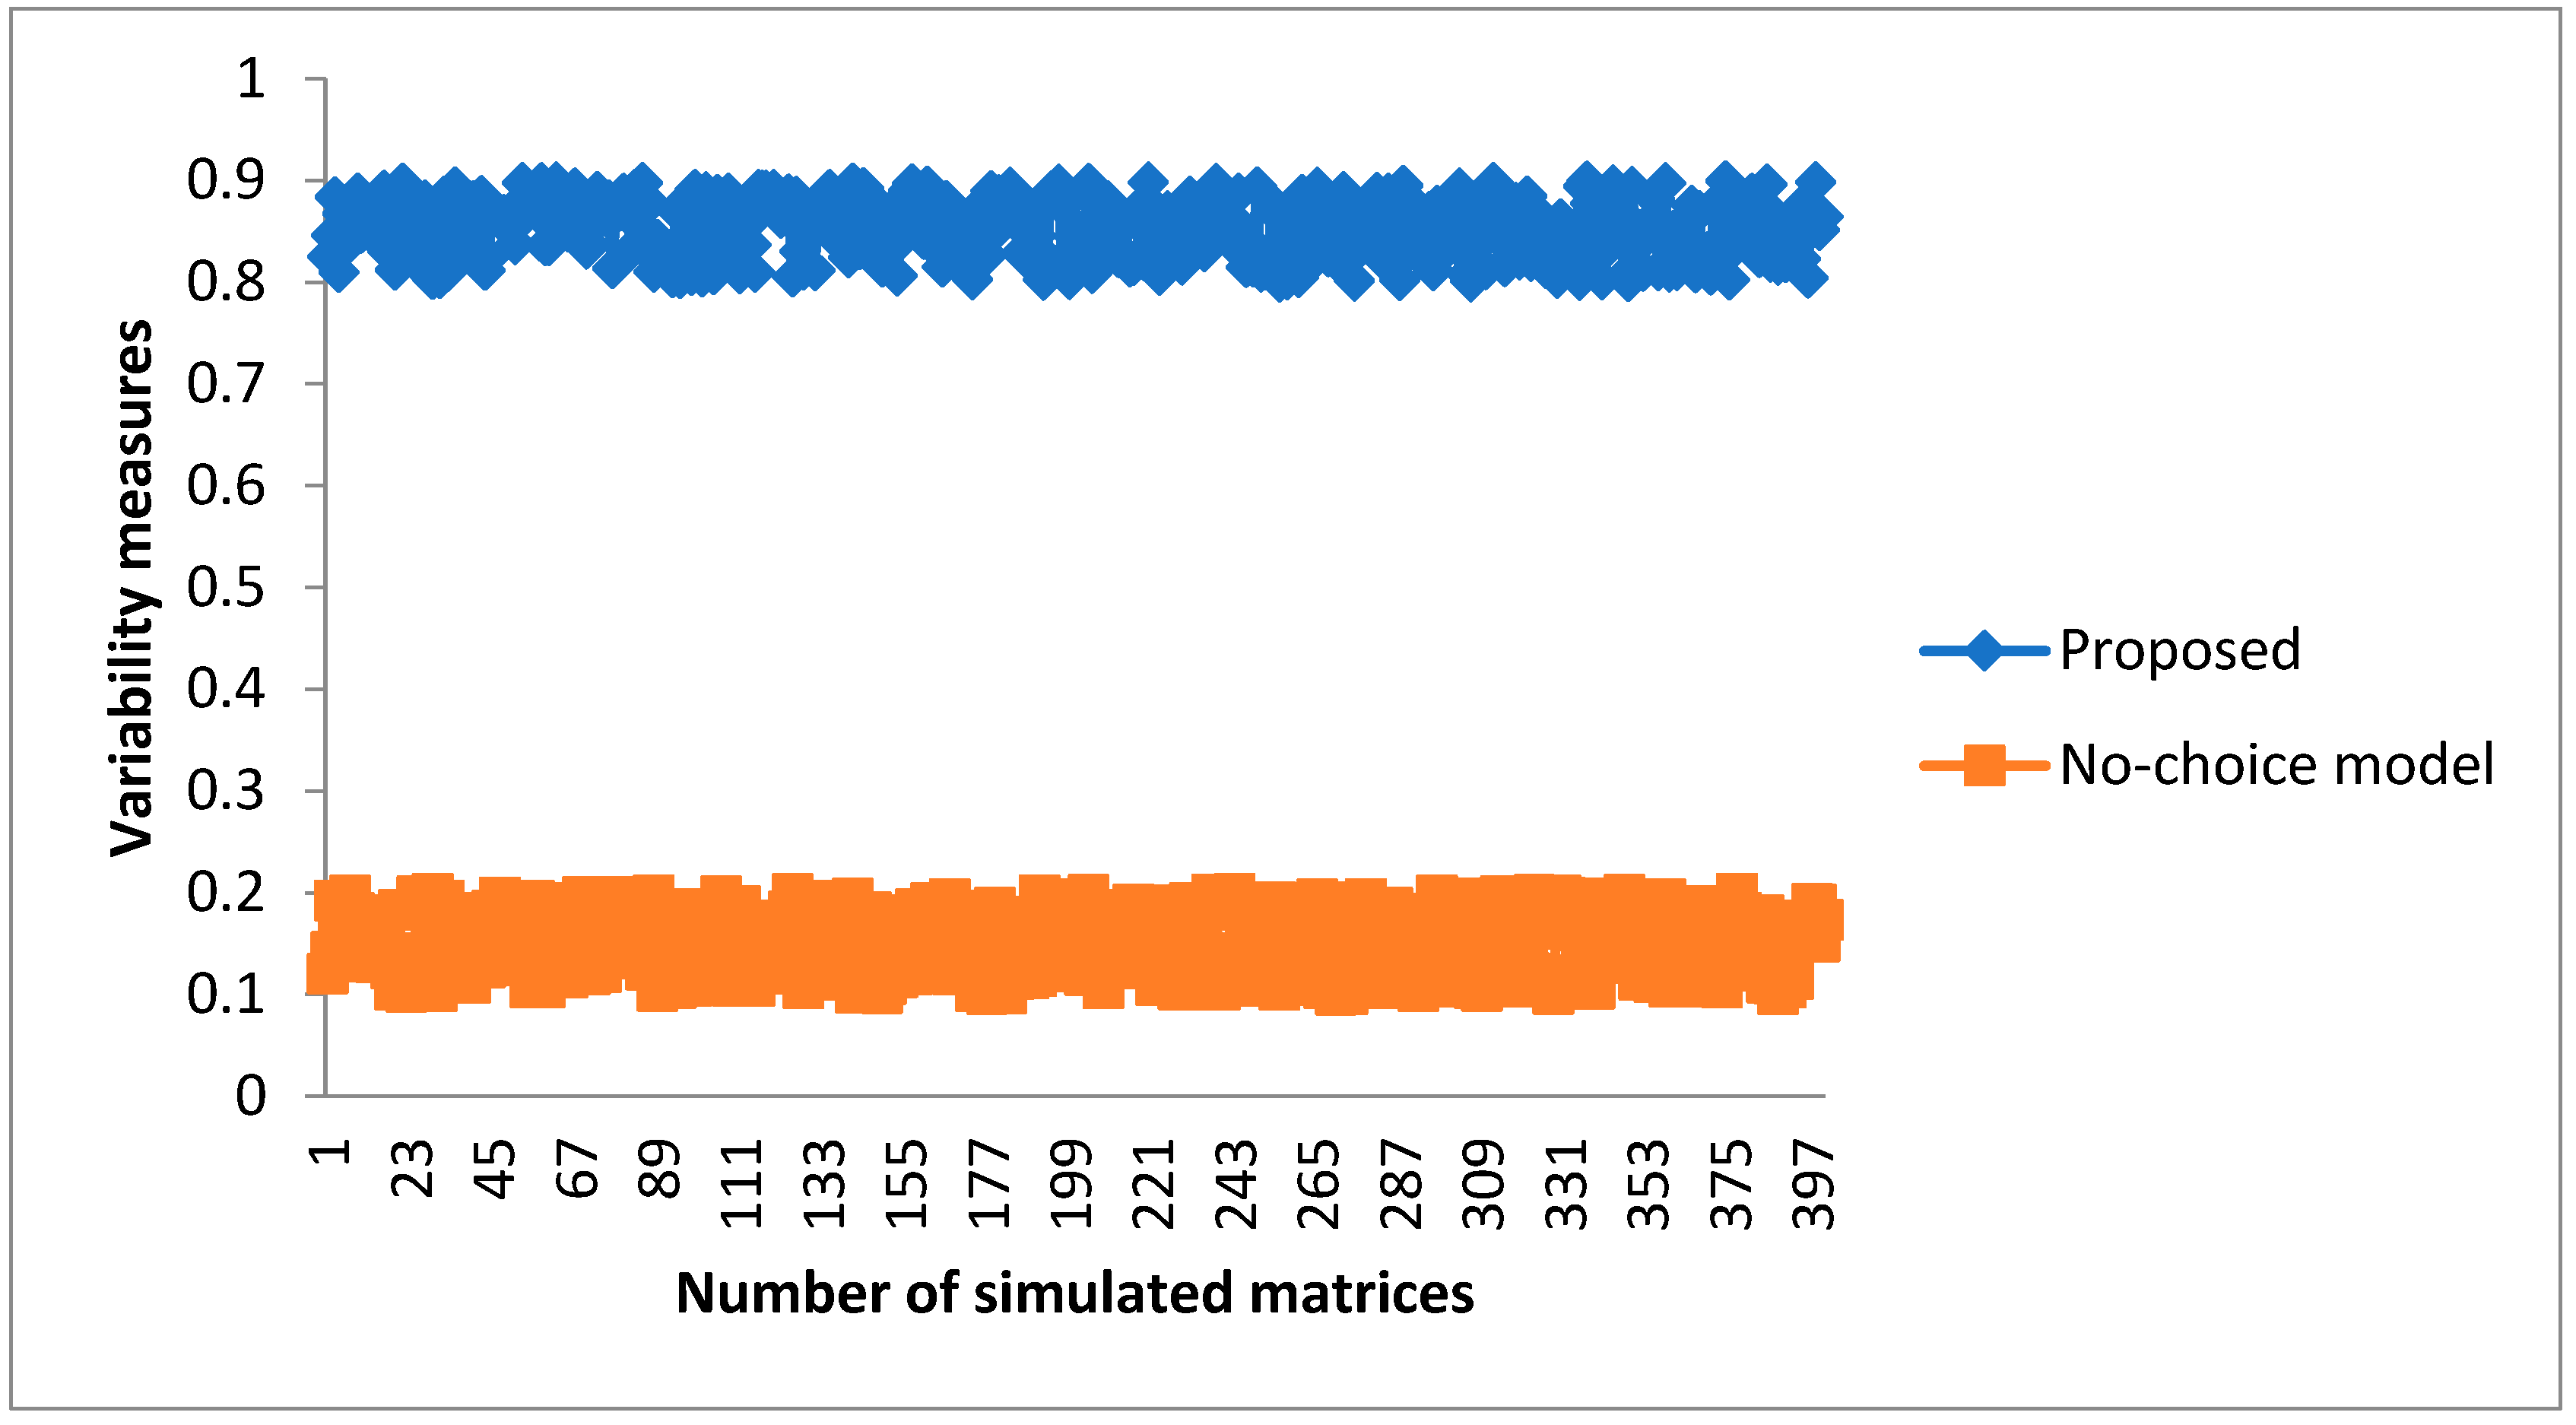
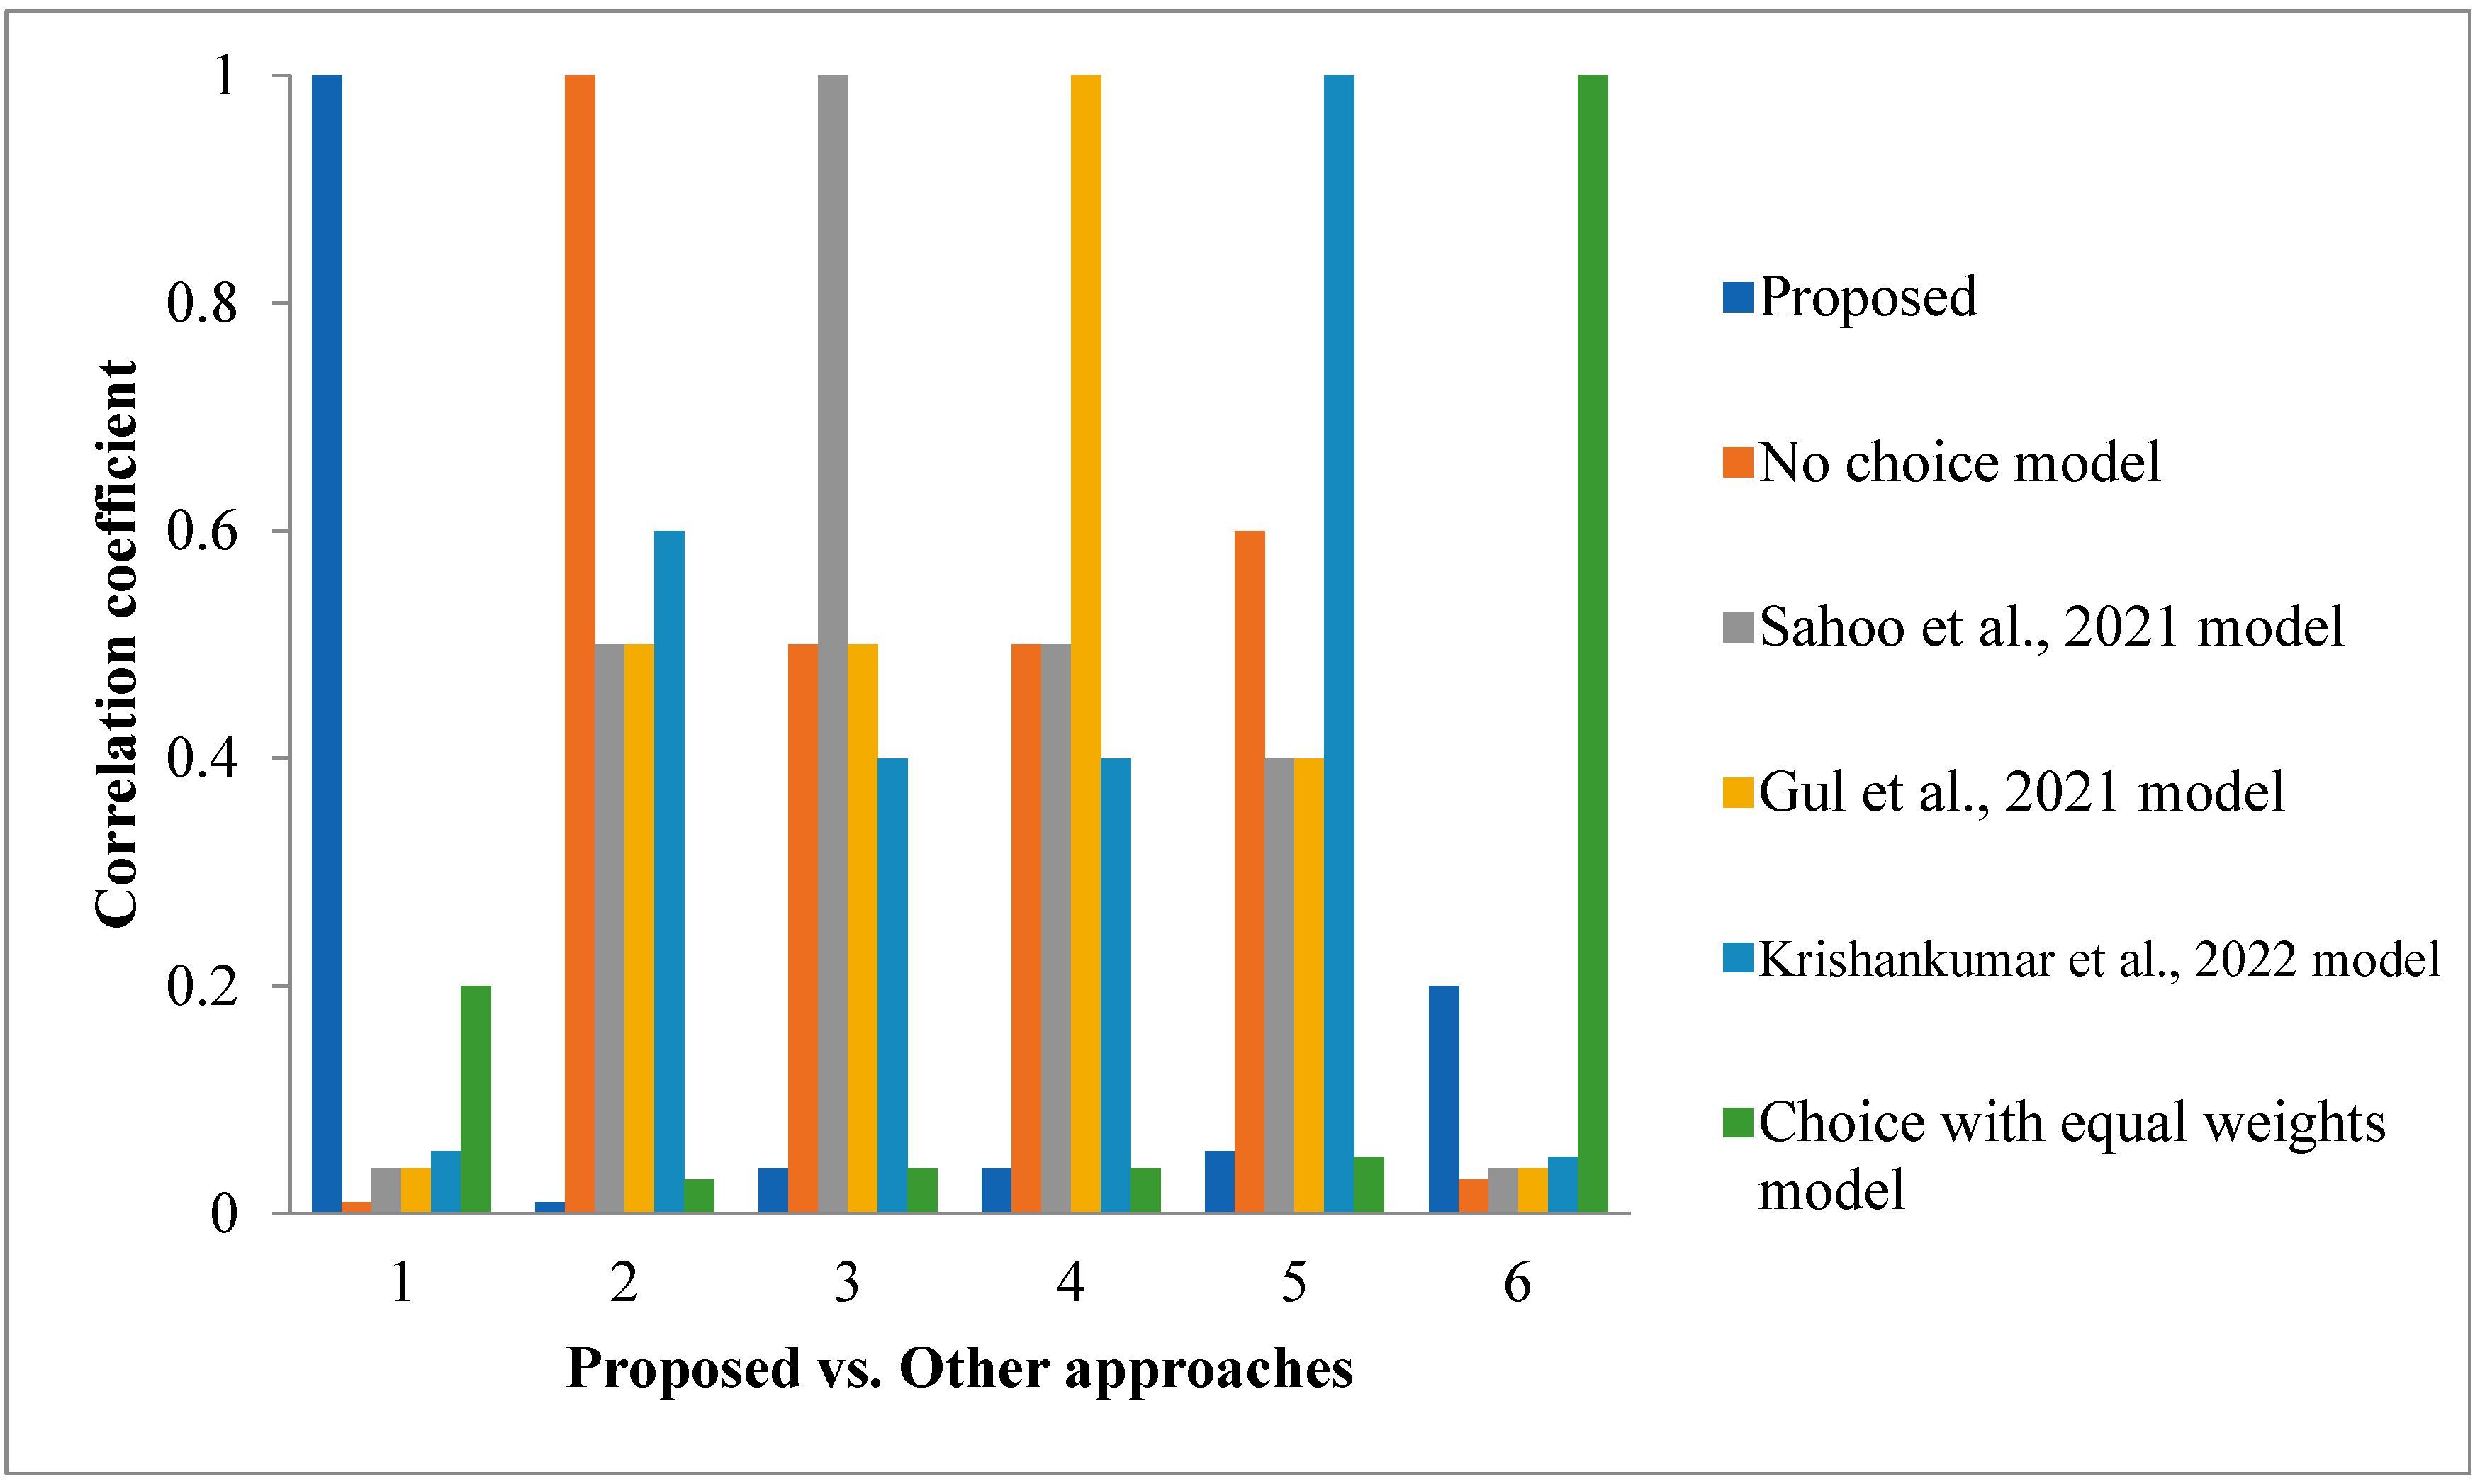
5. Comparative Analysis of the Proposed Model vs. Other Models
- FFN is used as the preferred structure that could not only model uncertainty from three dimensions, viz., membership, non-membership, and hesitation but also allow flexible elicitation of preferences by providing a broader window for preference expression, which is lacking in the extant barrier ranking models considered for comparison. As evidence to the claim, readers can refer to the work in [13], which is the inception of FFNs, where the authors clarify the flexibility that FFNs offer to experts during the preference elicitation process by extending the window of expression, which is lacking in classical fuzzy sets and PFS.
- Furthermore, it can be observed that the weights are methodically determined by considering the nature of the criteria and experts’ hesitation. Unlike the extant models, in the proposed method, criteria type is considered that intuitively aids in the rationality of weight calculation. Precisely, when experts provide similar opinions or ratings to a particular criterion, at that time, the effect of the risk component measured via the Von Neumann measure becomes subtle owing to the criteria type factor of the Von Neumann measure in the utility function that suppresses the risk component. As a result, there is only a regret component, and the risk component is either negligible or zero, indicating that the particular criterion is less important than others and that experts exhibit a higher level of hesitation towards that criterion. On the other hand, if both the risk and regret components are involved, and their aversion values and , respectively, are chosen close to the complete aversion that unity, the risk and regret values become negligible or close to zero, with high rejoice and as a result, the criterion gets high importance with less hesitation from the experts’ viewpoint. The hesitation of experts is mapped onto the consideration of risk and regret components. When a particular component is suppressed (either by considering less aversion of risk/regret or less variability in the preference distribution), the hesitancy level of experts is high, and the net utility value is small for the criterion indicating less importance. In other words, if risk and regret are high, hesitation is high, and utility value is low, eventually leading to less weight for the criterion.
- Further, the importance of experts is considered during the criteria weight determination, as the experts are crucial owing to their choice sharing for each criterion. Unlike other models, in the proposed model, consideration is given to the weights of experts that can be intuitively observed as potential information in the decision process. Moreover, the complexity of the proposed model is moderate. At the same time, some approaches have high complexity owing to their pairwise comparison formulation that adds overhead to the model and increases the computational complexity.
- Finally, the personal choices of experts on each barrier are collected in the form of a vector and utilized in the formulation for determining rank values of barriers with a sense of personalization intuitively; the process provides rationality in the rank estimation and gives a feel of the customizable ordering of barriers. Such a feature needs to be improved in the extant barrier ranking models compared to the proposed model.
6. Conclusions
Author Contributions
Funding
Data Availability Statement
Conflicts of Interest
Appendix A

| Symbol | Meaning |
|---|---|
| Degree of membership or membership grade | |
| Degree of non-membership or non-membership grade | |
| Degree of hesitancy or hesitancy grade | |
| Fermatean fuzzy number | |
| Any scalar value greater than 0 | |
| Number of experts | |
| Number of criteria | |
| von-Neumann value of expert rating criterion | |
| Regret value of expert rating criterion | |
| Index of expert | |
| Index of criterion | |
| Parameter reflecting risk aversion coefficients | |
| Parameter reflecting regret aversion coefficient | |
| The utility value of criterion | |
| Weight of criterion | |
| Number of barriers | |
| The choice value associated with barrier | |
| Index of barrier | |
| Weighted accuracy value associated with barrier rated over criterion | |
| The weighted sum of barrier | |
| Weighted product of barrier | |
| The final rank value of barrier | |
| Strategy value | |
| The score value of * | |
| Accuracy value of * |
Appendix B
| Correlation | Proposed | No Choice Mode | [31] | [37] | [44] | Choice with Equal Weights |
|---|---|---|---|---|---|---|
| Proposed | 1 | 0.01 | 0.04 | 0.04 | 0.055 | 0.2 |
| No choice model | 0.01 | 1 | 0.5 | 0.5 | 0.6 | 0.03 |
| [31] | 0.04 | 0.5 | 1 | 0.5 | 0.4 | 0.04 |
| [37] | 0.04 | 0.5 | 0.5 | 1 | 0.4 | 0.04 |
| [44] | 0.055 | 0.6 | 0.4 | 0.4 | 1 | 0.05 |
| Choice with equal weights | 0.2 | 0.03 | 0.04 | 0.04 | 0.05 | 1 |

| Barriers | Set 1 | Set 2 | Set 3 | Set 4 | Set 5 | Set 6 | Set 7 | Set 8 | Set 9 |
|---|---|---|---|---|---|---|---|---|---|
| 8 | 10 | 7 | 7 | 6 | 5 | 6 | 4 | 5 | |
| 1 | 1 | 1 | 2 | 1 | 1 | 1 | 1 | 2 | |
| 7 | 5 | 8 | 4 | 10 | 7 | 9 | 8 | 7 | |
| 2 | 2 | 2 | 1 | 3 | 2 | 2 | 2 | 3 | |
| 4 | 3 | 3 | 3 | 2 | 3 | 3 | 3 | 1 | |
| 6 | 7 | 5 | 5 | 5 | 8 | 4 | 7 | 9 | |
| 3 | 9 | 6 | 9 | 4 | 9 | 5 | 0 | 4 | |
| 15 | 14 | 15 | 14 | 13 | 14 | 15 | 15 | 14 | |
| 14 | 15 | 14 | 15 | 12 | 15 | 14 | 13 | 15 | |
| 12 | 11 | 10 | 12 | 11 | 13 | 11 | 14 | 12 | |
| 10 | 13 | 13 | 13 | 15 | 12 | 12 | 11 | 13 | |
| 13 | 12 | 12 | 11 | 13 | 10 | 13 | 12 | 11 | |
| 5 | 6 | 4 | 6 | 7 | 6 | 7 | 6 | 6 | |
| 9 | 8 | 9 | 10 | 8 | 11 | 8 | 10 | 8 | |
| 11 | 4 | 11 | 8 | 9 | 4 | 10 | 5 | 10 |
References
- Tollefson, J.; Weiss, K.R. Nations adopt historic global climate accord: Agreement commits the world to holding warming well below’2 [degrees] C. Nature 2015, 582, 315–317. [Google Scholar] [CrossRef]
- Vaishnavi, V.; Suresh, M. Assessment of readiness level for implementing lean six sigma in healthcare organization using fuzzy logic approach. Int. J. Lean Six Sigma 2021, 12, 175–209. [Google Scholar] [CrossRef]
- Goswami, H. Opportunities and challenges of digital India programme. Int. Educ. Res. J. 2016, 2, 78–79. [Google Scholar]
- Ganchev, I.; Ji, Z.; O’Droma, M. A generic IoT architecture for smart cities. In Proceedings of the 25th IET Irish Signals & Systems Conference 2014 and 2014 China-Ireland International Conference on Information and Communications Technologies (ISSC 2014/CIICT 2014), Limerick, Ireland, 26–27 June 2014; pp. 196–199. [Google Scholar]
- Sehrawat, D.; Gill, N.S. Smart sensors: Analysis of different types of IoT sensors. In Proceedings of the 2019 3rd International Conference on Trends in Electronics and Informatics (ICOEI), Tirunelveli, India, 23–25 April 2019; pp. 523–528. [Google Scholar]
- Chen, S.; Xu, H.; Liu, D.; Hu, B.; Wang, H. A Vision of IoT: Applications, Challenges, and Opportunities With China Perspective. IEEE Internet Things J. 2014, 1, 349–359. [Google Scholar] [CrossRef]
- Motlagh, N.H.; Mohammadrezaei, M.; Hunt, J.; Zakeri, B. Internet of Things (IoT) and the Energy Sector. Energies 2020, 13, 494. [Google Scholar] [CrossRef]
- Mahajan, P.; Naik, C. Development of Integrated IoT and Machine Learning based data collection and analysis system for the effective prediction of agricultural residue/biomass availability to regenerate clean energy. In Proceedings of the 2019 9th International Conference on Emerging Trends in Engineering and Technology-Signal and Information Processing (ICETET-SIP-19), Nagpur, India, 1–2 November 2019; pp. 1–5. [Google Scholar]
- Smith, R.M.; Pathak, P. Urban sustainability in India: Green buildings, AMRUT yojana, and smart cities. In Metropolitan Governance in Asia and the Pacific Rim; Springer: Singapore, 2018; pp. 163–190. [Google Scholar]
- Mardani, A.; Saraji, M.K.; Mishra, A.R.; Rani, P. A novel extended approach under hesitant fuzzy sets to design a framework for assessing the key challenges of digital health interventions adoption during the COVID-19 outbreak. Appl. Soft Comput. 2020, 96, 106613. [Google Scholar] [CrossRef]
- Cui, Y.; Liu, W.; Rani, P.; Alrasheedi, M. Internet of Things (IoT) adoption barriers for the circular economy using Pythagorean fuzzy SWARA-CoCoSo decision-making approach in the manufacturing sector. Technol. Forecast. Soc. Change 2021, 171, 120951. [Google Scholar] [CrossRef]
- Kumar, P.; Singh, R.K.; Kumar, V. Managing supply chains for sustainable operations in the era of industry 4.0 and circular economy: Analysis of barriers. Resour. Conserv. Recycl. 2020, 164, 105215. [Google Scholar] [CrossRef]
- Senapati, T.; Yager, R.R. Fermatean fuzzy sets. J. Ambient. Intell. Humaniz. Comput. 2020, 11, 663–674. [Google Scholar] [CrossRef]
- Zhenmin, L.; Espinosa, P. Tackling climate change to accelerate sustainable development. Nat. Clim. Chang. 2019, 9, 494–496. [Google Scholar] [CrossRef]
- Krishankumar, R.; Amritha, P.P.; Ravichandran, K.S. An integrated fuzzy decision model for prioritization of barriers affecting sustainability adoption within supply chains under unknown weight context. Oper. Manag. Res. 2022, 15, 1010–1027. [Google Scholar] [CrossRef]
- Rahman, H.U.; Raza, M.; Afsar, P.; Alharbi, A.; Ahmad, S.; Alyami, H. Multi-Criteria Decision Making Model for Application Maintenance Offshoring Using Analytic Hierarchy Process. Appl. Sci. 2021, 11, 8550. [Google Scholar] [CrossRef]
- Roy, S.; Paul, A.; Paul, A.; Kashyap, S.; Jana, A. Ranking Barriers of Supply Chain Management by MCDM Method during Disaster Management: A Case Study of India. Int. J. Syst. Dyn. Appl. 2021, 10, 1–16. [Google Scholar] [CrossRef]
- Chowdhury, N.M.; Reshad, A.I.; Rahman, M.M. Identifying Barriers of Implementing IoT in Manufacturing Industry using Analytical Hierarchy Process (AHP): A Bangladeshi Perspective. Available online: https://www.kuet.ac.bd/icmiee2022/Technical_and_Keynote_papers/All_Paper/ICMIEE20-006.pdf(accessed on 9 February 2023).
- Torkabadi, A.M.; Pourjavad, E.; Mayorga, R.V. An integrated fuzzy MCDM approach to improve sustainable consumption and production trends in supply chain. Sustain. Prod. Consum. 2018, 16, 99–109. [Google Scholar] [CrossRef]
- Kumar, V.; Vrat, P.; Shankar, R. Prioritization of strategies to overcome the barriers in Industry 4.0: A hybrid MCDM approach. Opsearch 2021, 58, 711–750. [Google Scholar] [CrossRef]
- Mishra, A.R.; Rani, P.; Saha, A.; Hezam, I.M.; Pamucar, D.; Marinovic, M.; Pandey, K. Assessing the Adaptation of Internet of Things (IoT) Barriers for Smart Cities’ Waste Management Using Fermatean Fuzzy Combined Compromise Solution Approach. IEEE Access 2022, 10, 37109–37130. [Google Scholar] [CrossRef]
- Schitea, D.; Deveci, M.; Iordache, M.; Bilgili, K.; Akyurt, I.Z.; Iordache, I. Hydrogen mobility roll-up site selection using intuitionistic fuzzy sets based WASPAS, COPRAS and EDAS. Int. J. Hydrogen Energy 2019, 44, 8585–8600. [Google Scholar] [CrossRef]
- Erol, I.; Ar, I.M.; Peker, I.; Searcy, C. Alleviating the Impact of the Barriers to Circular Economy Adoption Through Blockchain: An Investigation Using an Integrated MCDM-based QFD With Hesitant Fuzzy Linguistic Term Sets. Comput. Ind. Eng. 2022, 165, 107962. [Google Scholar] [CrossRef]
- Nimawat, D.; Gidwani, B.D. Prioritization of barriers for Industry 4.0 adoption in the context of Indian manufacturing industries using AHP and ANP analysis. Int. J. Comput. Integr. Manuf. 2021, 34, 1139–1161. [Google Scholar] [CrossRef]
- Kumar, V.; Kalita, K.; Chatterjee, P.; Zavadskas, E.K.; Chakraborty, S. A SWARA-CoCoSo-based approach for spray painting robot selection. Informatica 2022, 33, 35–54. [Google Scholar] [CrossRef]
- Jena, R.; Dwivedi, Y. Prioritizing the barriers to tourism growth in rural India: An integrated multi-criteria decision making (MCDM) approach. J. Tour. Futur. 2021. ahead-of-print. [Google Scholar] [CrossRef]
- Khan, S.; Haleem, A. Investigation of circular economy practices in the context of emerging economies: A CoCoSo approach. Int. J. Sustain. Eng. 2021, 14, 357–367. [Google Scholar] [CrossRef]
- Atanassov, K. Review and New Results on Intuitionistic Fuzzy Sets. Prepr. Im-MFAIS-1-88 Sofia 1988, 5. Available online: http://www.biomed.bas.bg/bioautomation/2016/vol_20.s1/files/20.s1_03.pdf (accessed on 9 February 2023).
- Yager, R.R. Pythagorean Membership Grades in Multicriteria Decision Making. IEEE Trans. Fuzzy Syst. 2013, 22, 958–965. [Google Scholar] [CrossRef]
- Keshavarz-Ghorabaee, M.; Amiri, M.; Hashemi-Tabatabaei, M.; Zavadskas, E.K.; Kaklauskas, A. A New Decision-Making Approach Based on Fermatean Fuzzy Sets and WASPAS for Green Construction Supplier Evaluation. Mathematics 2020, 8, 2202. [Google Scholar] [CrossRef]
- Sahoo, L. Some Score Functions on Fermatean Fuzzy Sets and Its Application to Bride Selection Based on TOPSIS Method. Int. J. Fuzzy Syst. Appl. 2021, 10, 18–29. [Google Scholar] [CrossRef]
- Senapati, T.; Yager, R.R. Some New Operations Over Fermatean Fuzzy Numbers and Application of Fermatean Fuzzy WPM in Multiple Criteria Decision Making. Informatica 2019, 30, 391–412. [Google Scholar] [CrossRef]
- Senapati, T.; Yager, R.R. Fermatean fuzzy weighted averaging/geometric operators and its application in multi-criteria decision-making methods. Eng. Appl. Artif. Intell. 2019, 85, 112–121. [Google Scholar] [CrossRef]
- Xu, C.; Shen, J. Multi-criteria decision making and pattern recognition based on similarity measures for Fermatean fuzzy sets. J. Intell. Fuzzy Syst. 2021, 41, 5847–5863. [Google Scholar] [CrossRef]
- Akram, M.; Shahzadi, G.; Ahmadini, A.A.H. Decision-Making Framework for an Effective Sanitizer to Reduce COVID-19 under Fermatean Fuzzy Environment. J. Math. 2020, 2020, 3263407. [Google Scholar] [CrossRef]
- Silambarasan, I. New operators for Fermatean fuzzy sets. Ann. Commun. Math 2020, 3, 116. [Google Scholar]
- Gül, S. Fermatean fuzzy set extensions of SAW, ARAS, and VIKOR with applications in COVID-19 testing laboratory selection problem. Expert Syst. 2021, 38, e12769. [Google Scholar] [CrossRef]
- Aydin, S. A Novel Multi-Expert Mabac Method Based on Fermatean Fuzzy Sets. J. Mult. Valued Log. Soft Comput. 2021, 37, 533–552. [Google Scholar]
- Deng, Z.; Wang, J. New distance measure for Fermatean fuzzy sets and its application. Int. J. Intell. Syst. 2022, 37, 1903–1930. [Google Scholar] [CrossRef]
- Jeevaraj, S. Ordering of interval-valued Fermatean fuzzy sets and its applications. Expert Syst. Appl. 2021, 185, 115613. [Google Scholar] [CrossRef]
- Krishankumar, R.; Mishra, A.R.; Cavallaro, F.; Zavadskas, E.K.; Antuchevičienė, J.; Ravichandran, K.S. A New Approach to the Viable Ranking of Zero-Carbon Construction Materials with Generalized Fuzzy Information. Sustainability 2022, 14, 7691. [Google Scholar] [CrossRef]
- Mishra, A.R.; Liu, P.; Rani, P. COPRAS method based on interval-valued hesitant Fermatean fuzzy sets and its application in selecting desalination technology. Appl. Soft Comput. 2022, 119, 108570. [Google Scholar] [CrossRef]
- Hadi, A.; Khan, W.; Khan, A. A novel approach to MADM problems using Fermatean fuzzy Hamacher aggregation operators. Int. J. Intell. Syst. 2021, 36, 3464–3499. [Google Scholar] [CrossRef]
- Krishankumar, R.; Ecer, F.; Mishra, A.R.; Ravichandran, K.S.; Gandomi, A.H.; Kar, S. A SWOT-Based Framework for Personalized Ranking of IoT Service Providers With Generalized Fuzzy Data for Sustainable Transport in Urban Regions. IEEE Trans. Eng. Manag. 2022, 1–14. [Google Scholar] [CrossRef]
- Kirişci, M. Fermatean Hesitant Fuzzy Sets with Medical Decision Making Application. Mapp. Intimacies 2022. Available online: https://www.researchsquare.com/article/rs-1151389/latest.pdf (accessed on 9 February 2023). [CrossRef]
- Sindhu, M.S.; Siddique, I.; Ahsan, M.; Jarad, F.; Altunok, T. An Approach of Decision-Making under the Framework of Fermatean Fuzzy Sets. Math. Probl. Eng. 2022, 2022, 8442123. [Google Scholar] [CrossRef]
- Ali, G.; Ansari, M.N. Multiattribute decision-making under Fermatean fuzzy bipolar soft framework. Granul. Comput. 2022, 7, 337–352. [Google Scholar] [CrossRef]
- Atanassov, K. Intuitionistic fuzzy sets. Fuzzy Sets Syst. 1986, 20, 87–96. [Google Scholar] [CrossRef]
- Yager, R.R. Generalized Orthopair Fuzzy Sets. IEEE Trans. Fuzzy Syst. 2016, 25, 1222–1230. [Google Scholar] [CrossRef]
- Anbuudayasankar, S.; Srikanthan, R.; Karthik, M.; Nair, P.R.; Sivakarthik, N.; Indukumar, P. Cloud-based technology for small and medium scale enterprises: A decision-making paradigm using IPA, AHP and fuzzy-AHP techniques. Int. J. Integr. Supply Manag. 2020, 13, 335. [Google Scholar] [CrossRef]
- Liu, L.; Wu, J.; Wei, G.; Wei, C.; Wang, J.; Wei, Y. Entropy-Based GLDS Method for Social Capital Selection of a PPP Project with q-Rung Orthopair Fuzzy Information. Entropy 2020, 22, 414. [Google Scholar] [CrossRef]
- Rani, P.; Ali, J.; Krishankumar, R.; Mishra, A.R.; Cavallaro, F.; Ravichandran, K.S. An Integrated Single-Valued Neutrosophic Combined Compromise Solution Methodology for Renewable Energy Resource Selection Problem. Energies 2021, 14, 4594. [Google Scholar] [CrossRef]
- Ghoushchi, S.J.; Dorosti, S.; Khazaeili, M.; Mardani, A. Extended approach by using best–worst method on the basis of importance–necessity concept and its application. Appl. Intell. 2021, 51, 8030–8044. [Google Scholar] [CrossRef]
- Sivagami, R.; Krishankumar, R.; Sangeetha, V.; Ravichandran, K.S.; Kar, S.; Gandomi, A.H. Assessment of cloud vendors using interval-valued probabilistic linguistic information and unknown weights. Int. J. Intell. Syst. 2021, 36, 3813–3851. [Google Scholar] [CrossRef]
- Krishankumar, R.; Ravichandran, K.S.; Saeid, A.B. A new extension to PROMETHEE under intuitionistic fuzzy environment for solving supplier selection problem with linguistic preferences. Appl. Soft Comput. 2017, 60, 564–576. [Google Scholar] [CrossRef]
- Hu, Y.; Al-Barakati, A.; Rani, P. Investigating the Internet-of-Things (IoT) risks for supply chain management using q-rung orthopair fuzzy-SWARA-ARAS framewor. Technol. Econ. Dev. Econ. 2022, 1–26. [Google Scholar] [CrossRef]


| Source | Application | Methods Proposed | No of Alternatives | No of Criteria | Whether Sensitivity Analysis Is Done or Not | Whether Comparative The Analysis Is Done or Not | Fuzzy Set Used |
|---|---|---|---|---|---|---|---|
| [11] | IoT barriers | CoCoSo SWARA | 4 | 25 | Yes | No | PFS |
| [12] | Sustainability barriers | AHP ELECTRE | 15 | 9 | No | Yes | Fuzzy set |
| [16] | Offshore outsourcing barriers evaluation | AHP | 3 | 10 | Yes | No | Interval fuzzy set |
| [17] | Supply chain management barriers | ELECTRE | 6 | 9 | No | Yes | IFS |
| [18] | IoT barriers in manufacturing industry | AHP TOPSIS | 10 | 13 | No | Yes | Fuzzy set |
| [19] | Sustainable consumption barriers | ANP | 20 | 4 | No | Yes | Fuzzy set |
| [20] | Industry 4.0 implementation barriers | SWARA WASPAS | 6 | 5 | Yes | No | Fuzzy set |
| [21] | Waste management barriers | COCOSO | 15 | 4 | Yes | Yes | FFS |
| [22] | Hydrogen up-site barriers | WASPAS COPRAS | 14 | 4 | No | Yes | IFS |
| [23] | Blockchain in CE adoption barriers | ANP | 14 | 7 | Yes | Yes | HFLTS |
| [24] | Prioritization of barriers in Indian manufacturing industries | AHP ANP | 15 | 4 | Yes | No | Fuzzy set |
| [25] | Spray painting robot barriers | SWARA COCOSO | 6 | 7 | No | Yes | IFS |
| [26] | Tourism barrier evaluation | DEMATEL ISM | 17 | 4 | No | Yes | IFS |
| [27] | CE barriers | CoCoSo | 15 | 5 | Yes | No | Fuzzy set |
| [10] | Digital technology barrier selection | SWARA WASPAS | 4 | 24 | Yes | Yes | HFS |
| Sources | Expressing Both Preference and Non-Preference | Level of Broadness for Choice Expression | Experts’ Hesitation during Weight Calculation | Criteria Type during Weight Calculation | Personalized Ranking |
|---|---|---|---|---|---|
| [11] | Yes | Moderate | Not considered | Not considered | No |
| [12] | No | No | Not considered | Not considered | No |
| [16] | No | No | Not considered | Not considered | No |
| [17] | Yes | Low | Not considered | Not considered | No |
| [18] | No | No | Not considered | Not considered | No |
| [19] | No | No | Not considered | Not considered | No |
| [20] | No | No | Not considered | Not considered | No |
| [21] | Yes | High | Not considered | Not considered | No |
| [22] | Yes | Low | Not considered | Not considered | No |
| [23] | No | No | Not considered | Not considered | No |
| [24] | No | No | Not considered | Not considered | No |
| [25] | Yes | Low | Not considered | Not considered | No |
| [26] | Yes | Low | Yes | Not considered | No |
| [27] | No | No | Not considered | Not considered | No |
| [10] | No | No | Not considered | Not considered | No |
| Proposed | Yes | High | Yes | Yes | Yes |
| Likert Scale | FIN | Likert Scale | FIN |
|---|---|---|---|
| Extremely low (EL) | (0.10,0.95) | Very highly preferred (VHP) | (0.95, 0.10) |
| Very low (VL) | (0.60,0.90) | Highly preferred (HP) | (0.80, 0.60) |
| Moderately low (ML) | (0.70,0.80) | Moderately preferred (MP) | (0.80, 0.65) |
| Low (L) | (0.60,0.70) | Preferred (P) | (0.75, 0.60) |
| Moderate (M) | (0.50,0.50) | Neutral (N) | (0.50, 0.50) |
| High (H) | (0.75,0.60) | Slightly preferred (SP) | (0.60, 0.70) |
| Moderately high (MH) | (0.80,0.65) | Less preferred (LP) | (0.70, 0.80) |
| Very high (VH) | (0.80,0.60) | Very less preferred (VLP) | (0.60, 0.90) |
| Extremely high (EH) | (0.95,0.10) | Not preferred (NP) | (0.10, 0.95) |
| CE Criteria | |||||||||
|---|---|---|---|---|---|---|---|---|---|
| M | M | VH | ML | L | L | L | MH | ML | |
| MH | MH | VH | ML | H | MH | VL | MH | MH | |
| MH | MH | H | VH | L | L | M | VL | H | |
| MH | MH | VH | H | L | L | H | ML | VH | |
| VL | M | MH | MH | L | MH | ML | ML | L | |
| VH | MH | L | L | MH | H | VL | MH | H | |
| H | H | ML | MH | VL | M | MH | L | MH | |
| L | M | H | ML | M | M | MH | H | VH | |
| MH | M | M | VL | MH | M | L | M | VL | |
| MH | VH | H | L | H | M | H | MH | VH | |
| M | ML | H | ML | H | M | M | MH | H | |
| VH | M | L | L | M | VH | M | VH | VH | |
| H | L | MH | MH | L | H | H | MH | MH | |
| ML | VL | ML | L | L | M | L | M | M | |
| ML | L | VH | VL | M | VL | VL | VH | M | |
| CE Criteria | |||||||||
|---|---|---|---|---|---|---|---|---|---|
| N | P | LP | MP | P | SP | P | MP | N | |
| N | P | N | SP | MP | N | N | SP | MP | |
| VLP | P | P | SP | N | P | P | N | MP | |
| N | P | VLP | SP | P | VLP | LP | P | P | |
| 0.749 | 0.732 | 0.741 | |
| 0.849 | 0.847 | 0.848 | |
| 0.754 | 0.742 | 0.748 | |
| 0.837 | 0.835 | 0.836 | |
| 0.780 | 0.764 | 0.772 | |
| 0.751 | 0.746 | 0.749 | |
| 0.769 | 0.754 | 0.761 | |
| 0.609 | 0.574 | 0.591 | |
| 0.627 | 0.573 | 0.600 | |
| 0.680 | 0.669 | 0.674 | |
| 0.717 | 0.692 | 0.705 | |
| 0.626 | 0.607 | 0.616 | |
| 0.749 | 0.747 | 0.748 | |
| 0.750 | 0.725 | 0.738 | |
| 0.711 | 0.671 | 0.691 |
| Characteristics | Proposed | Mardani et al. (2021) [10] | Cui et al. (2021) [11] | Rahman et al. (2021) [16] | Kumar et al. (2021) [12] |
|---|---|---|---|---|---|
| Data | FFN | HFS | PFS | Fuzzy set | Fuzzy set |
| Criteria weights | Considered | Considered | Considered | Considered | Considered |
| Flexibility | High | Moderate | Moderate | Low | Low |
| Uncertainty | Modeled in three ways | Modeled in one way | Modeled in three ways | Modeled in one way | Modeled in one way |
| Hesitation | Considered | Not considered | Not considered | Not considered | Not considered |
| Criteria nature (weight calculation) | Considered | Not considered | Not considered | Not considered | Not considered |
| Experts’ importance | Considered | Not considered | Not considered | Not considered | Not considered |
| Complexity | Moderate | Moderate | Moderate | High | High |
| Personal choices | Considered | Not considered | Not considered | Not considered | Not considered |
Disclaimer/Publisher’s Note: The statements, opinions and data contained in all publications are solely those of the individual author(s) and contributor(s) and not of MDPI and/or the editor(s). MDPI and/or the editor(s) disclaim responsibility for any injury to people or property resulting from any ideas, methods, instructions or products referred to in the content. |
© 2023 by the authors. Licensee MDPI, Basel, Switzerland. This article is an open access article distributed under the terms and conditions of the Creative Commons Attribution (CC BY) license (https://creativecommons.org/licenses/by/4.0/).
Share and Cite
Reddy, N.S.S.; Krishankumar, R.; Priya, S.S.; Cavallaro, F.; Mardani, A.; Ravichandran, K.S. Fermatean Fuzzy-Based Personalized Prioritization of Barriers to IoT Adoption within the Clean Energy Context. Information 2023, 14, 309. https://doi.org/10.3390/info14060309
Reddy NSS, Krishankumar R, Priya SS, Cavallaro F, Mardani A, Ravichandran KS. Fermatean Fuzzy-Based Personalized Prioritization of Barriers to IoT Adoption within the Clean Energy Context. Information. 2023; 14(6):309. https://doi.org/10.3390/info14060309
Chicago/Turabian StyleReddy, N Sai Snehitha, Raghunathan Krishankumar, S Shanmugha Priya, Fausto Cavallaro, Abbas Mardani, and Kattur Soundarapandian Ravichandran. 2023. "Fermatean Fuzzy-Based Personalized Prioritization of Barriers to IoT Adoption within the Clean Energy Context" Information 14, no. 6: 309. https://doi.org/10.3390/info14060309