
Human Factors in Leveraging Systems Science to Shape Public Policy for Obesity: A Usability Study

Abstract
:1. Introduction
2. Background
2.1. Principles and Challenges of Systems Thinking for Obesity Research
2.2. Embodying the Principles of Systems Thinking for Obesity via Software Solutions
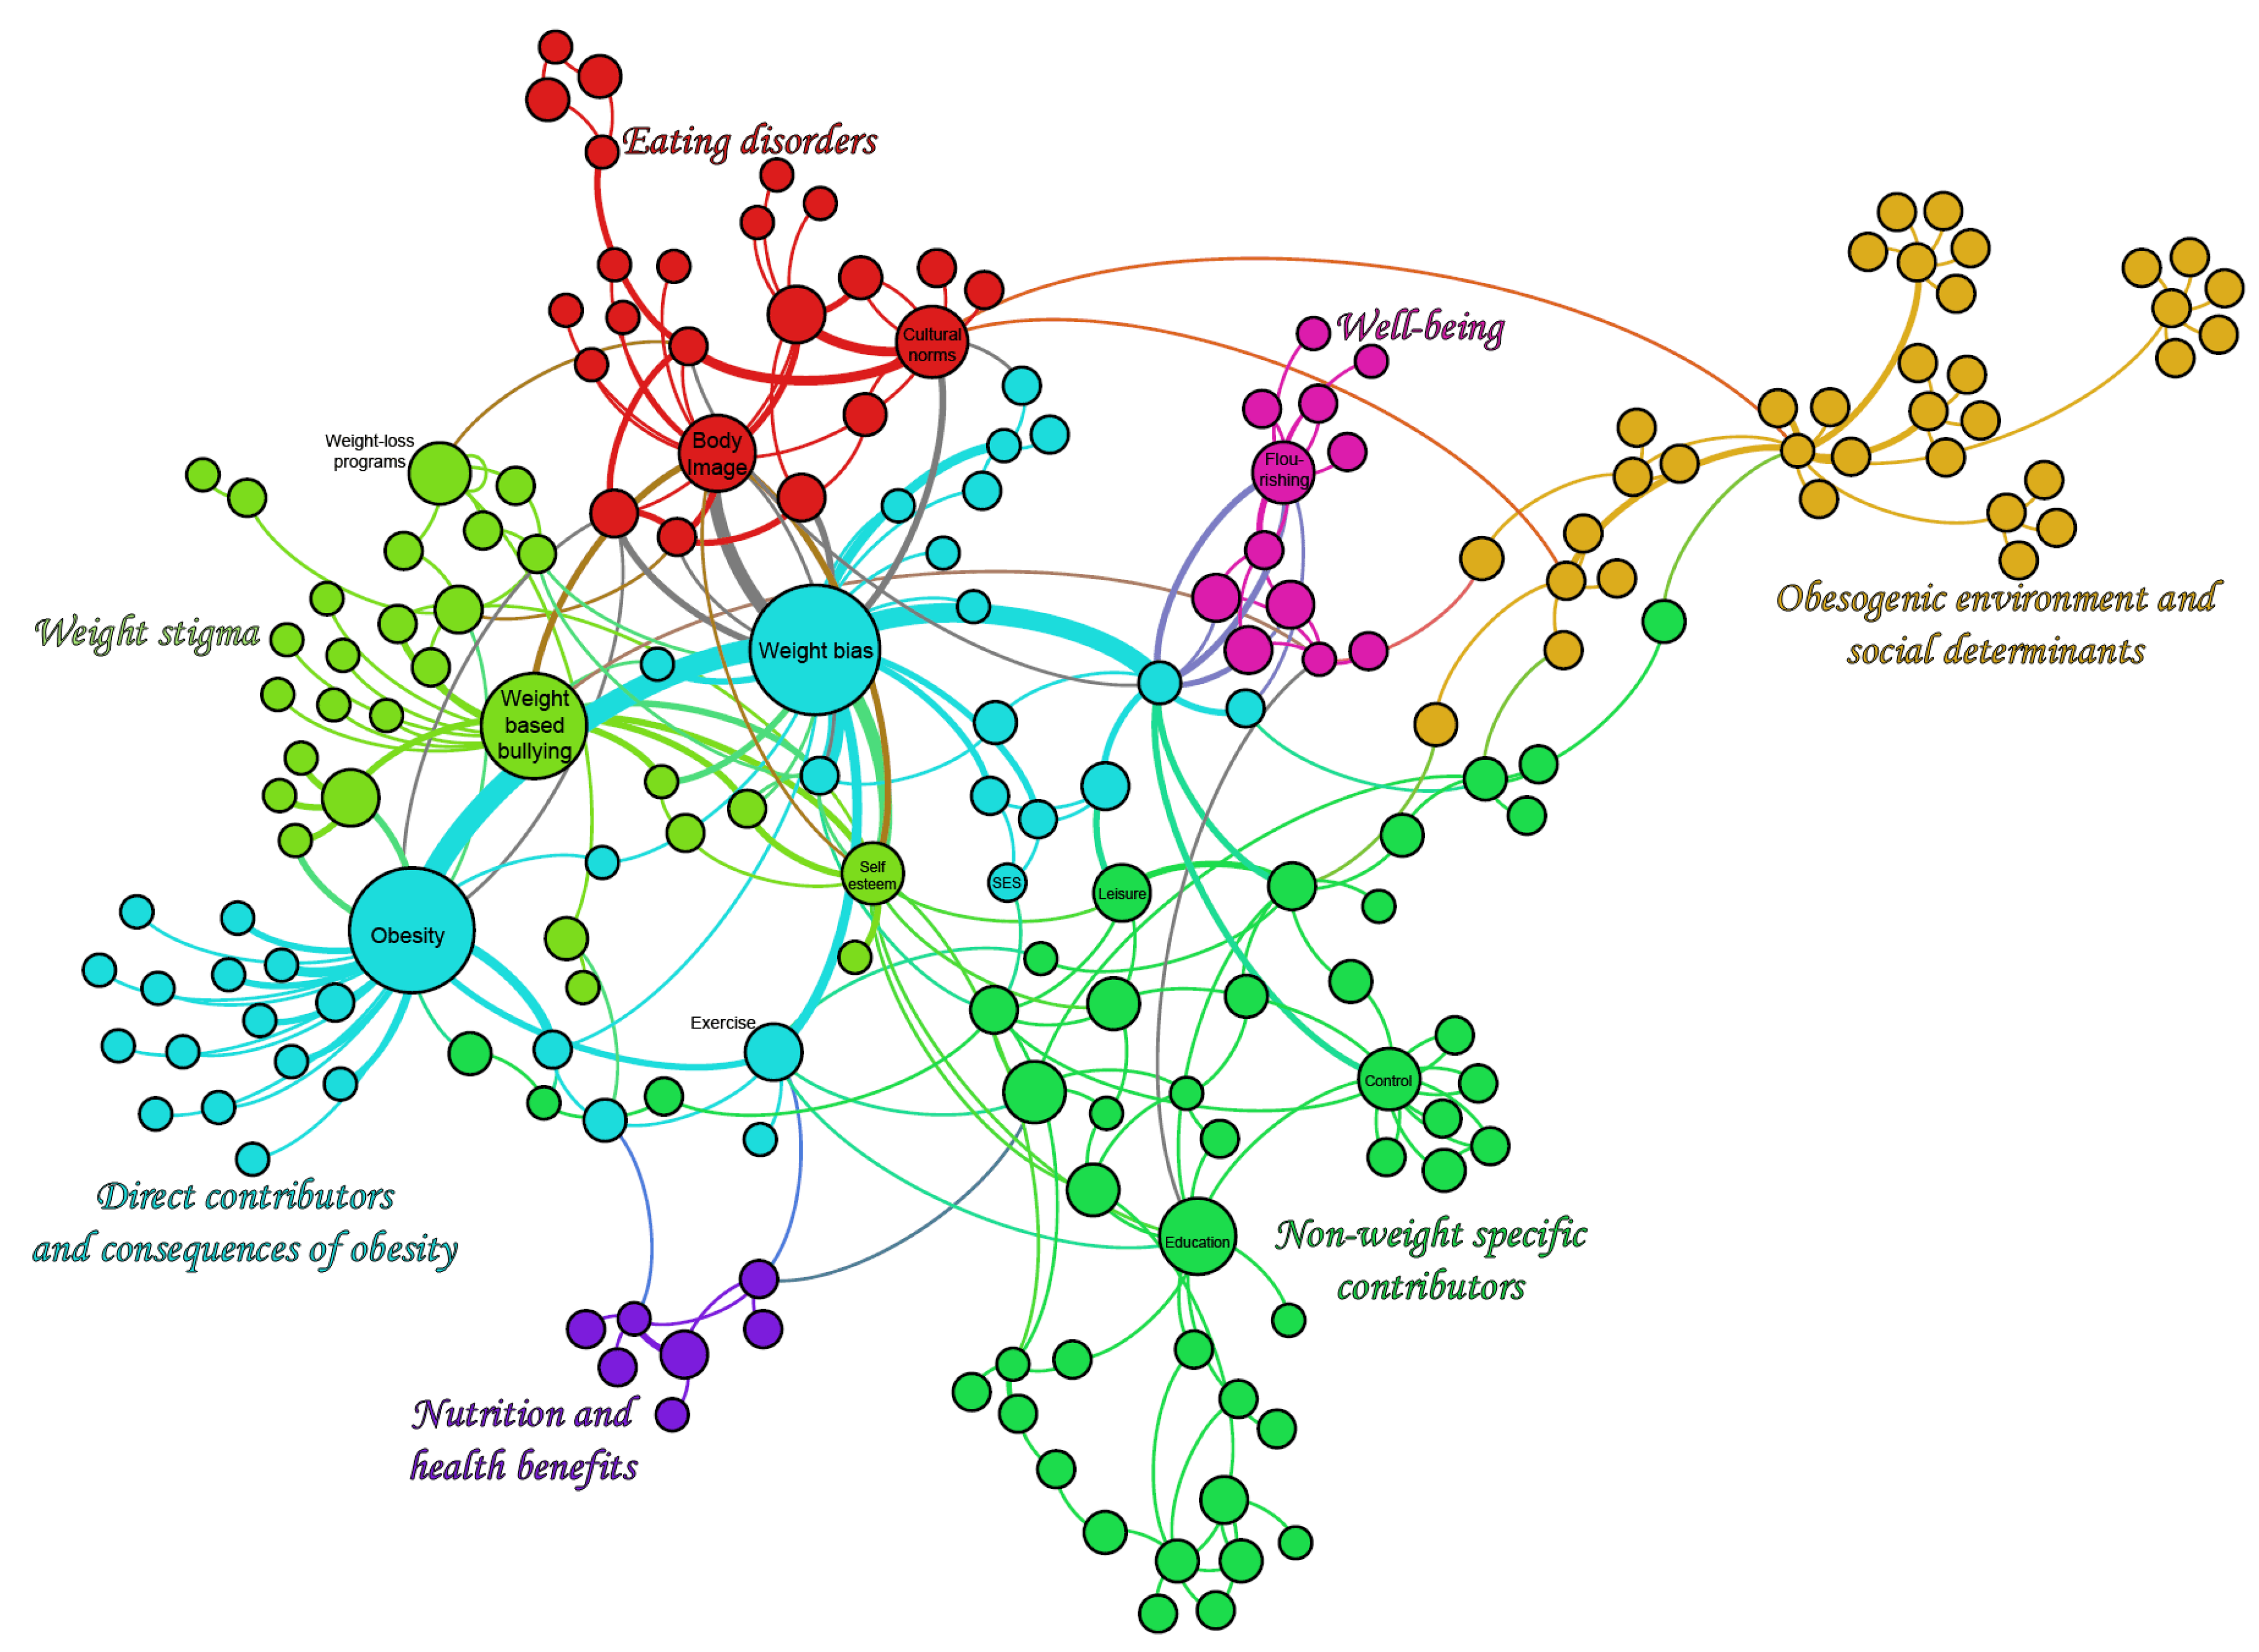
- An exploration tool (Figure 4) to interactively visualize the factors and their relationships. For example, one may ask “my work is on weight stigma, how does it relate to other parts? What increases stigma?”;
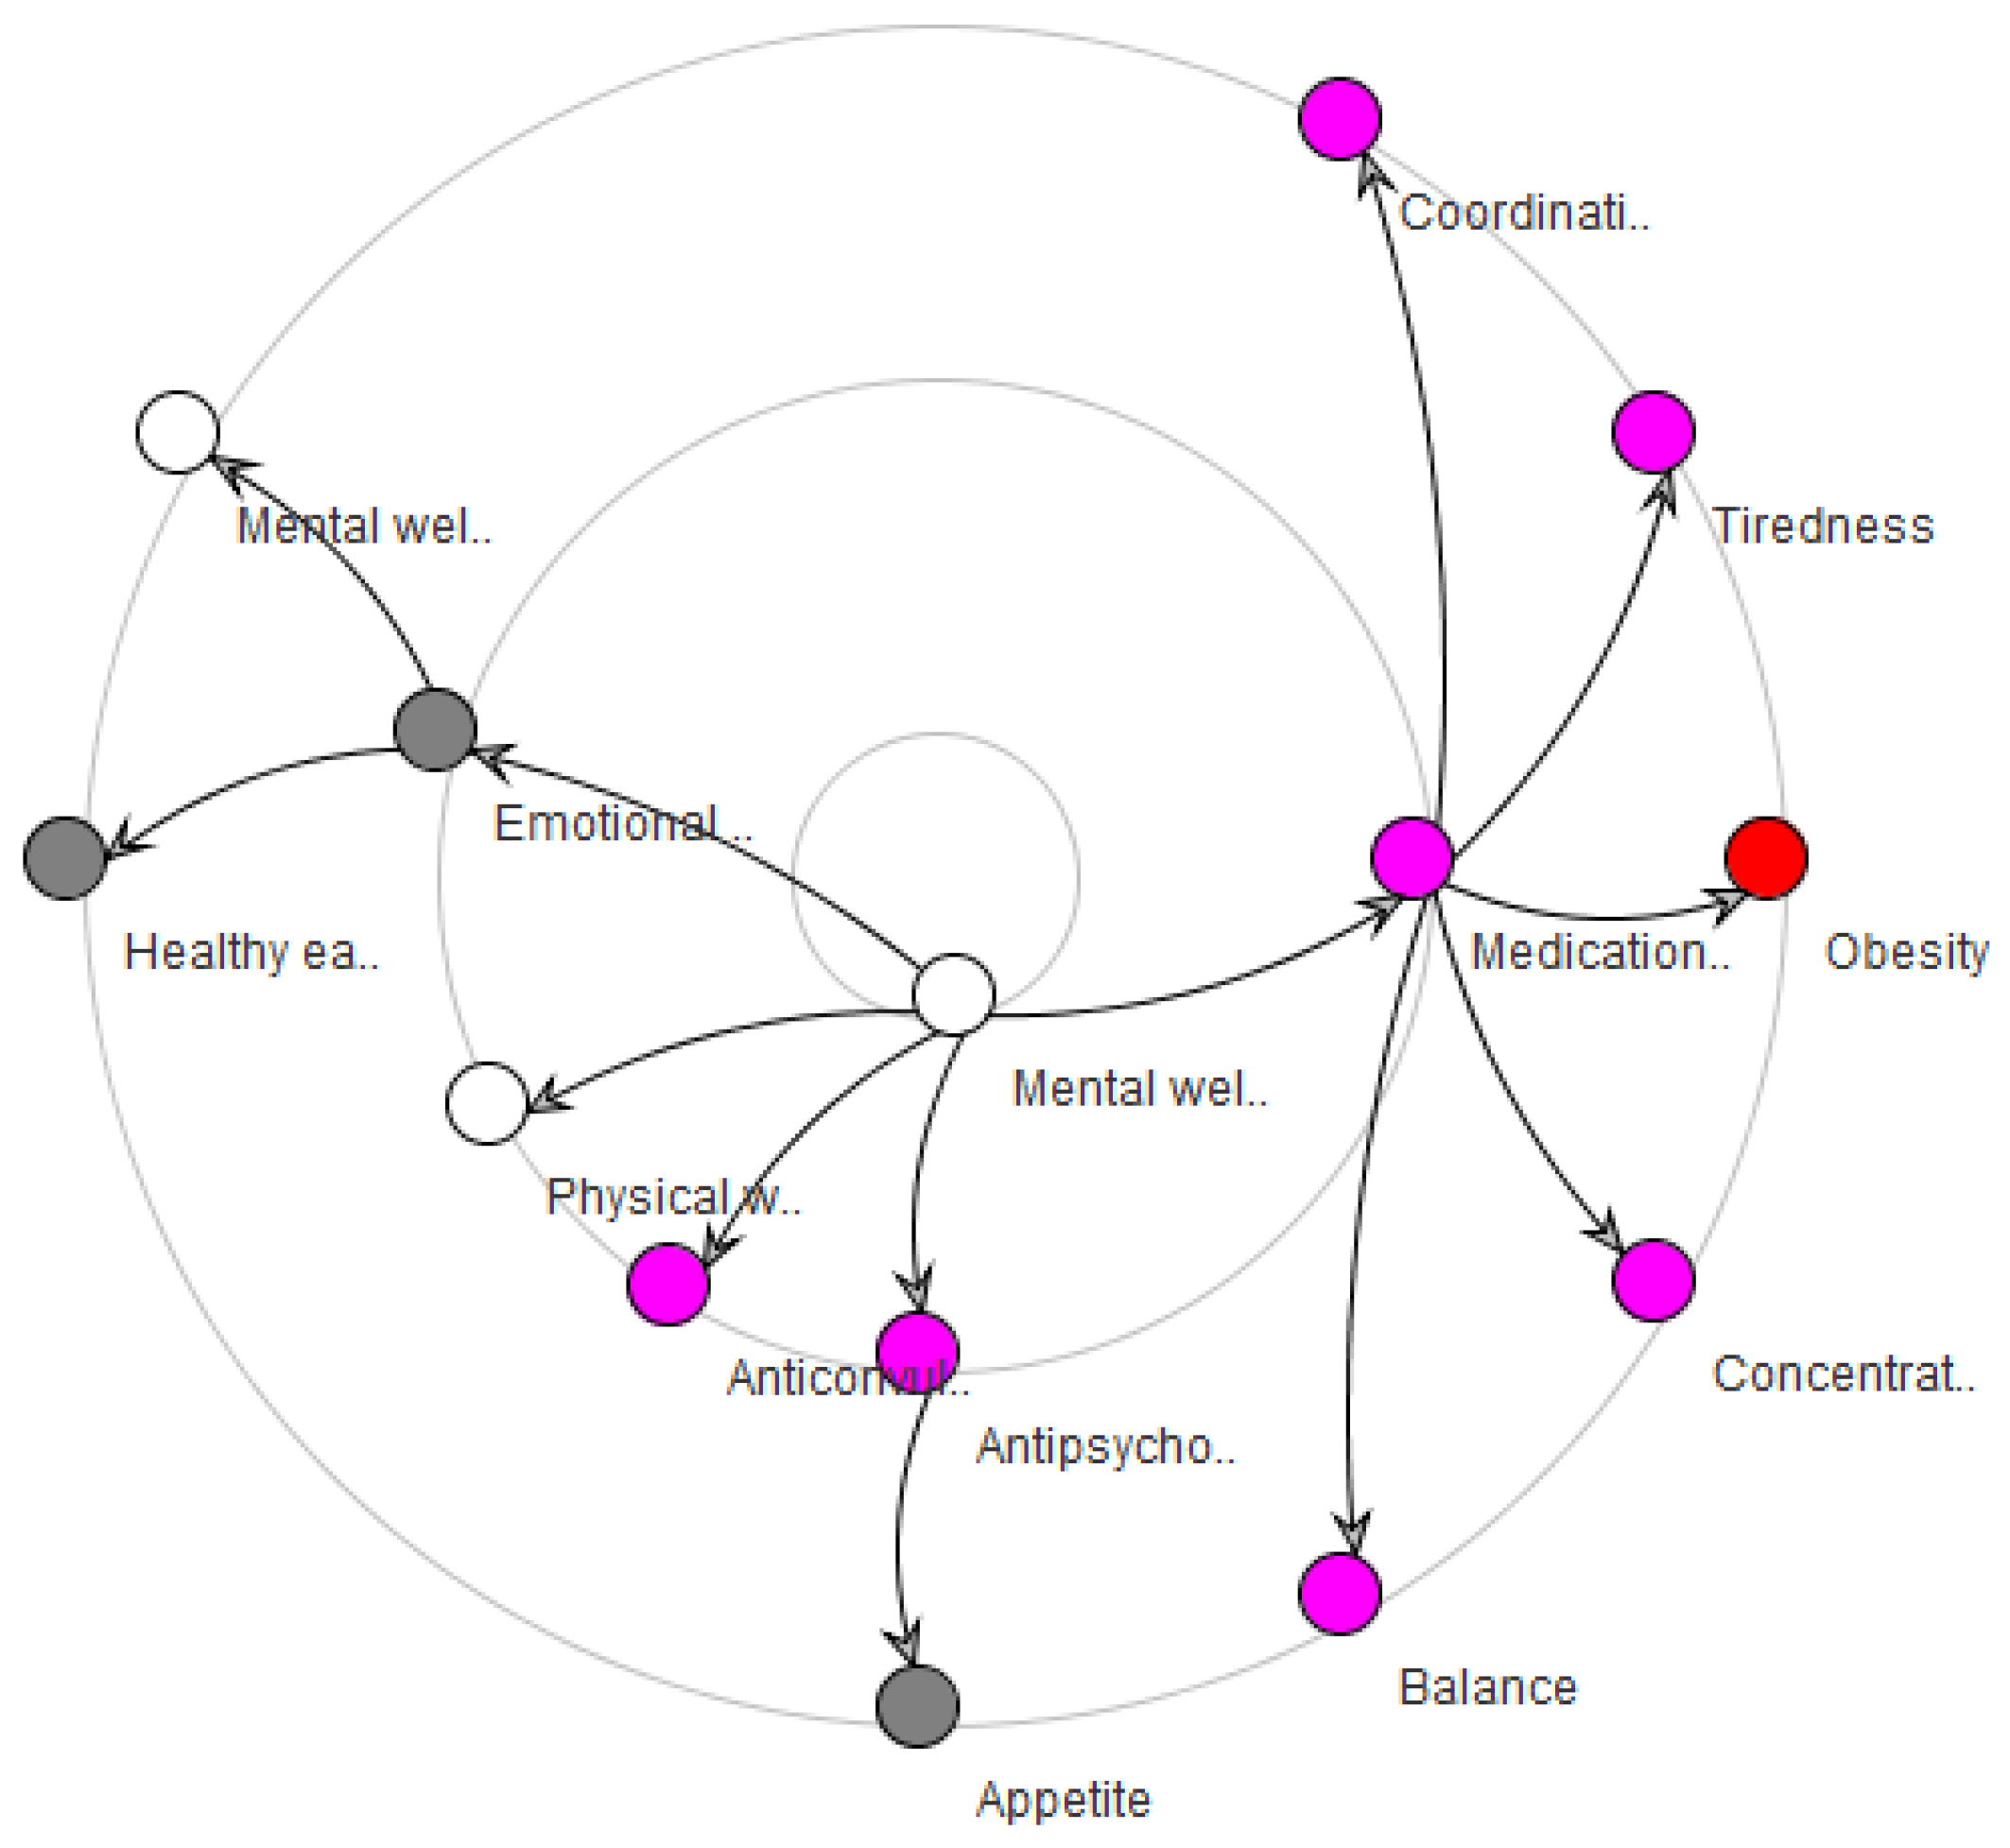
- A tool for rippling consequences (Figure 5) to identify what would be (in)directly affected by a policy. For example, one may ask “we aim at creating vibrant communities, what will that directly impact?”;
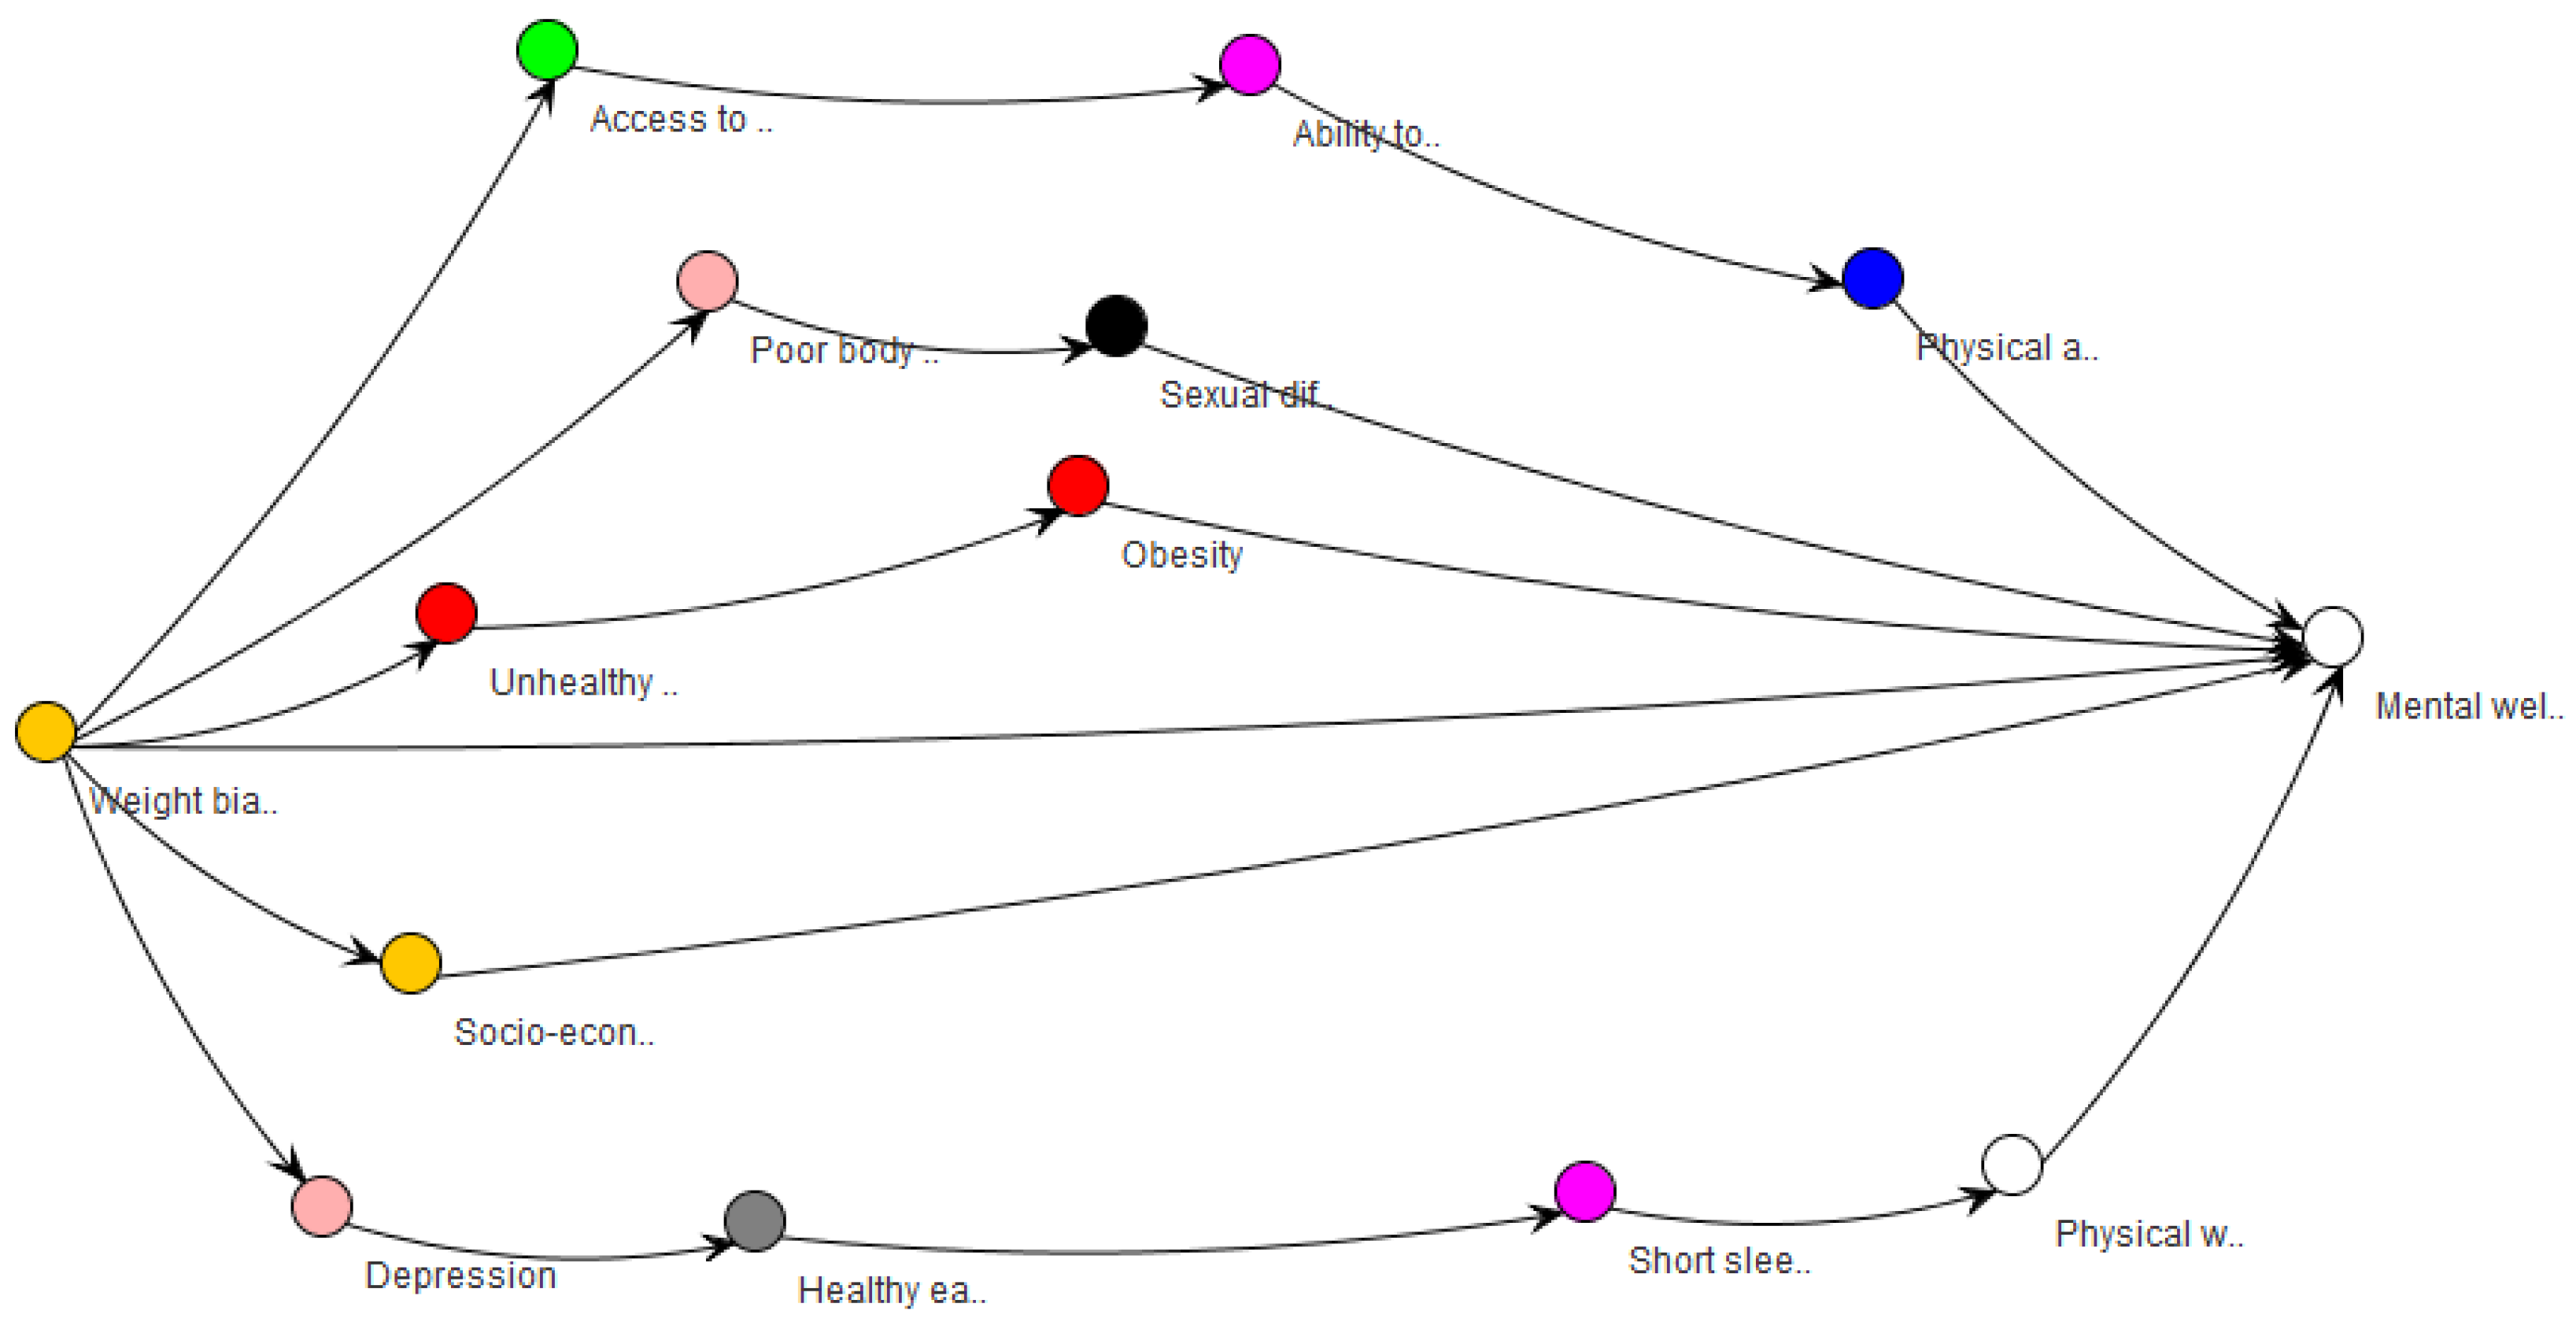
- A pathway tool (Figure 6) to find the multiple pathways connecting two factors. For example, one may ask “I promote a policy against bullying, and I am interested in the outcome on well-being. What is between them?”;
- An importance tool, which ranks factors by how central they are in the system. For example, one may look for what lies at the core of the whole system, which may lead to questioning paradigms about the system itself.
2.3. Purposes and Core Concepts of Usability Testing
2.4. Conducting Usability Testing
3. Methods
3.1. Software Assessment and Updates
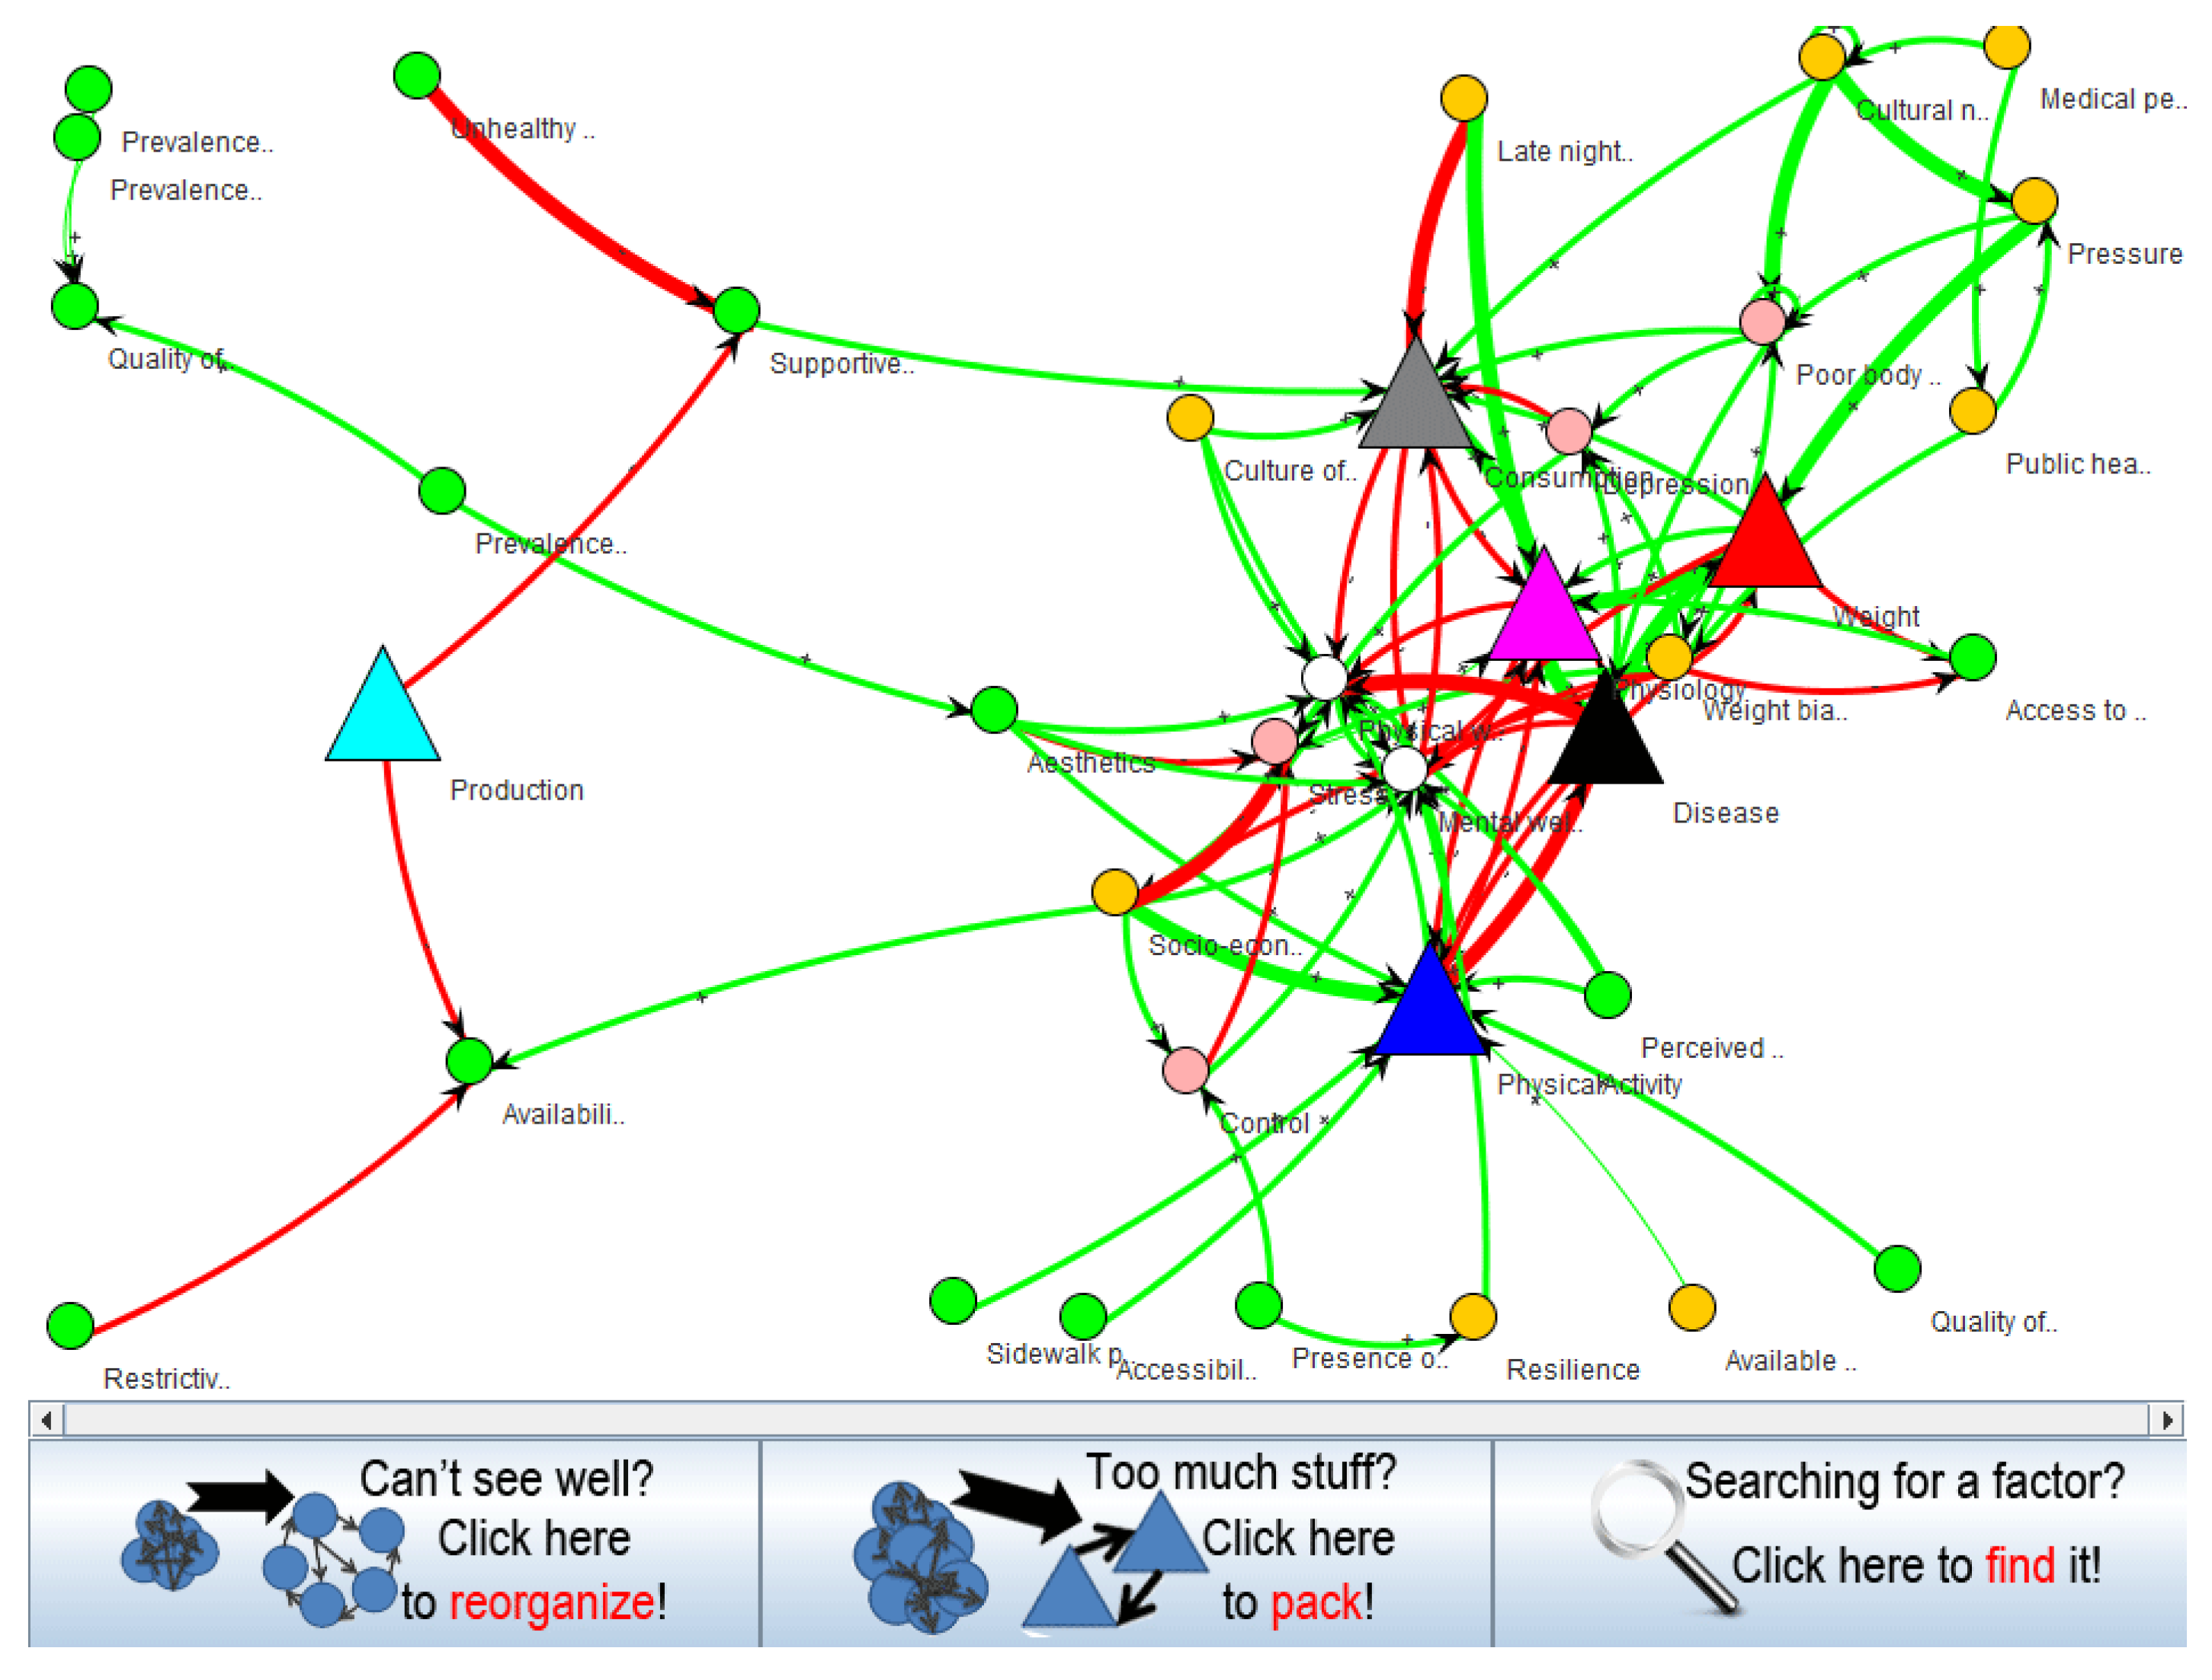
- The conceptual model was not conveyed by the interface. The initial screen, when the software is launched, was overwhelming. Users were not given a chance to mentally process what was going on. The effect of such clutter leads very quickly to mental fatigue. For a user who has other tasks to get to, this can quickly lead to “I’ll figure this out later” or at worst “This is too complicated”.
- Unexpected techniques were needed to navigate the map with a mouse. It is common to click and drag on an interface in order to move to a new area of focus. Given that this map is large, and users will need to move around and expand different areas, they will initially expect that clicking and dragging will allow them to drag the canvas (map). This interaction style, however, was not available. Additionally, it was noticed that scrolling the mouse’s wheel upward zooms out the view, which is the opposite of what is commonly found in other software (e.g., Google Maps).
- The search function displayed more than was needed. Due to the interface being very busy, users will rely heavily on the “Search” feature. While the search feature does expand the factor of interest, it still displays the entire map on the screen. This will, again, reinforce a sense that the software is “unnecessarily complex”.
- Several bugs hindered usability. Instructions mention a right click which does not seem to be enabled.
- a-1
- Rather than show all relationships at the beginning, we displayed a simple relationship between a few factors only (with other factors closed; therefore, not overwhelming the user). We accomplished this by starting the map at the theme level, with no theme expanded; thus, minimizing the relationships displayed.
- a-2
- We included a persistent legend that explains the different shapes, thickness of lines, and arrowhead directions.
- a-3
- We created an initial “welcome screen” that briefly explains what this software is to be used for/what value the software hopes to deliver. The popup included an option for “Do not show this again”.
- b-1
- We implemented a click and drag interaction style for the map.
- b-2
- It would be preferable to allow users to zoom in by scrolling the mouse wheel upward and zoom out by scrolling downward. However, this recommendation could not be implemented, as this behavior was controlled by a third-party library.
- c-1
- When search is used, it is desirable to display a “zoomed-in” view of the resulting factor; therefore, hiding most of the map. However, the third-party library does not allow this functionality.
- d-1
- We enabled the right click.
3.2. Session Design
3.3. Analysis Plan
4. Results
4.1. Overview
4.2. Statistical Analyses
4.3. Thematic Analysis
5. Discussion
6. Conclusions
Author Contributions
Funding
Informed Consent Statement
Data Availability Statement
Acknowledgments
Conflicts of Interest
Appendix A. Key Informants

| Name | Organization | Position |
|---|---|---|
| Megan Oakey, MPH | Vancouver Coastal Health (VCH) | Healthy Communities Coordinator, North Shore |
| Dr Helena Swinkels | Fraser Health Authority (FHA) | Medical Health Officer (MHO), Lead for Chronic Disease Prevention and Healthier Community Partnerships |
| Melanie Kurrein, MA, RD | Provincial Health Services Authority (PHSA) | Provincial Manager, Food Security |
| Shelley Canitz | Ministry of Health | Director, Tobacco Control and Injury Prevention Healthy Living and Health Promotion Branch Population and Public Health Division |
| Matt Herman, MSc | Ministry of Health | Executive Director Chronic Disease/Injury Prevention and Built Environment |
| Anna Wren, RD, MPH | Ministry of Health | Project Manager, Office of the Provincial Dietician |
| Kitty Yung | Vancouver Coastal Health (VCH) | Registered Dietician |
| Nadine Baerg | Interior Health Authority (IHA) | Public Health Dietician |
Appendix B. Introductory Script to the Session
Appendix C. Scripts of Questions and Tasks During the Session
Appendix C.1. Questionnaire Script
- (1)
- Could you please tell me about your role here?
- (2)
- In your work do you engage directly with policy?
- (3)
- When you think about the policy work that you do, do you think about it involving or affecting the larger policy environment?
- (a)
- What does the policy environment look like? How are the different players or pieces relate to each other?
- (b)
- Can you give me a specific example of a policy that you were involved with and how it fits within a larger policy environment?
- (4)
- Could you tell me about a policy that was done in isolation or not considering the larger context?
- (5)
- Could you please describe your work-flow in relation to policy?
- (6)
- What tools do you currently use? Any software?
- (7)
- These tools and software, do they help you think about or understand your policy in relation to the broader context that it is related to and that might be effected by it? [will use previous example given if need be] How so? Can you give a specific example?
- (8)
- Can you think of any tools or software that might help you think about your policy work in relation to this broader context?
- (9)
- If you had these tools or software, how would they be part of your work-flow?
- (10)
- In your realm of expertise, how would you use $200,000 to improve well-being? What would this project look like?
- (11)
- Is there anything else about policy, the evaluation of potential impacts of a policy, or software that you would like to mention?
Appendix C.2. Usability Study Script
- Network structure questions:
- Find the “Physiology” theme.
- Find factor “emotional eating”.
- How many factors directly influence “emotional eating”?
- What directly influences “emotional eating”?
- How many factors does “emotional eating” influence?
- What does “emotional eating” directly influence?
- Does “depression” influence “emotional eating”?
- Can you find a relationship that you were previously unaware of?
- Multiple pathways:
- Does “Weight Bias” indirectly influence “Blood pressure”?
- How many pathways are there from “Healthy eating” to “Blood pressure”?
- How does the relationship between “Exercise” and “Blood pressure” compare to the relationship between “Appetite” and “Blood pressure”?
- Unintended consequences:
- What might be an unintended consequence of changing “Medications”?
- You are considering impacting “Late night TV watching”, what else needs to be considered for it to have a maximum effect on “Healthy eating”?
- What else might you think about while considering a policy on “Public health messaging around thinness”?
- Loops:
- How many factors are in the path starting at “Insulin resistance”, going through “Cells intake of fatty acids” and a few others factors, ended at “Insulin resistance” again?
- Please describe the relationship between “healthy eating” and “short sleep duration”?
- Exploratory task:
- Let’s come back to the question of “how would you use $200,000 to tackle obesity in your realm of expertise? What would this project look like?” Understanding that this tool is not a resource allocation tool, how could you use this map to make that project a success?” (education, presentation, guiding data collection…)
- Questions about the tutorials:
- If you were unsure of how to do something with this tool, how would you seek help?
- Additional loop questions, if there is time:
- Can you find a loop that you were previously unaware of?
- Is this a positive feedback loop or a negative feedback loop?
Appendix C.3. “Overall Thoughts” Script
- How likely are you to recommend this tool to a colleague (1 = very unlikely, 10 = very likely)
- How would you explain this tool to a colleague who opened it for the first time?
- Overall, what are your thoughts on the Map Explorer?
- What did you like about it and what were your frustrations?
- Do you think this tool could be useful for you?
- Who [else] do you think could find this tool useful?
Appendix D. Complementary Analyses
| Identification | Understanding | Evaluation | |
|---|---|---|---|
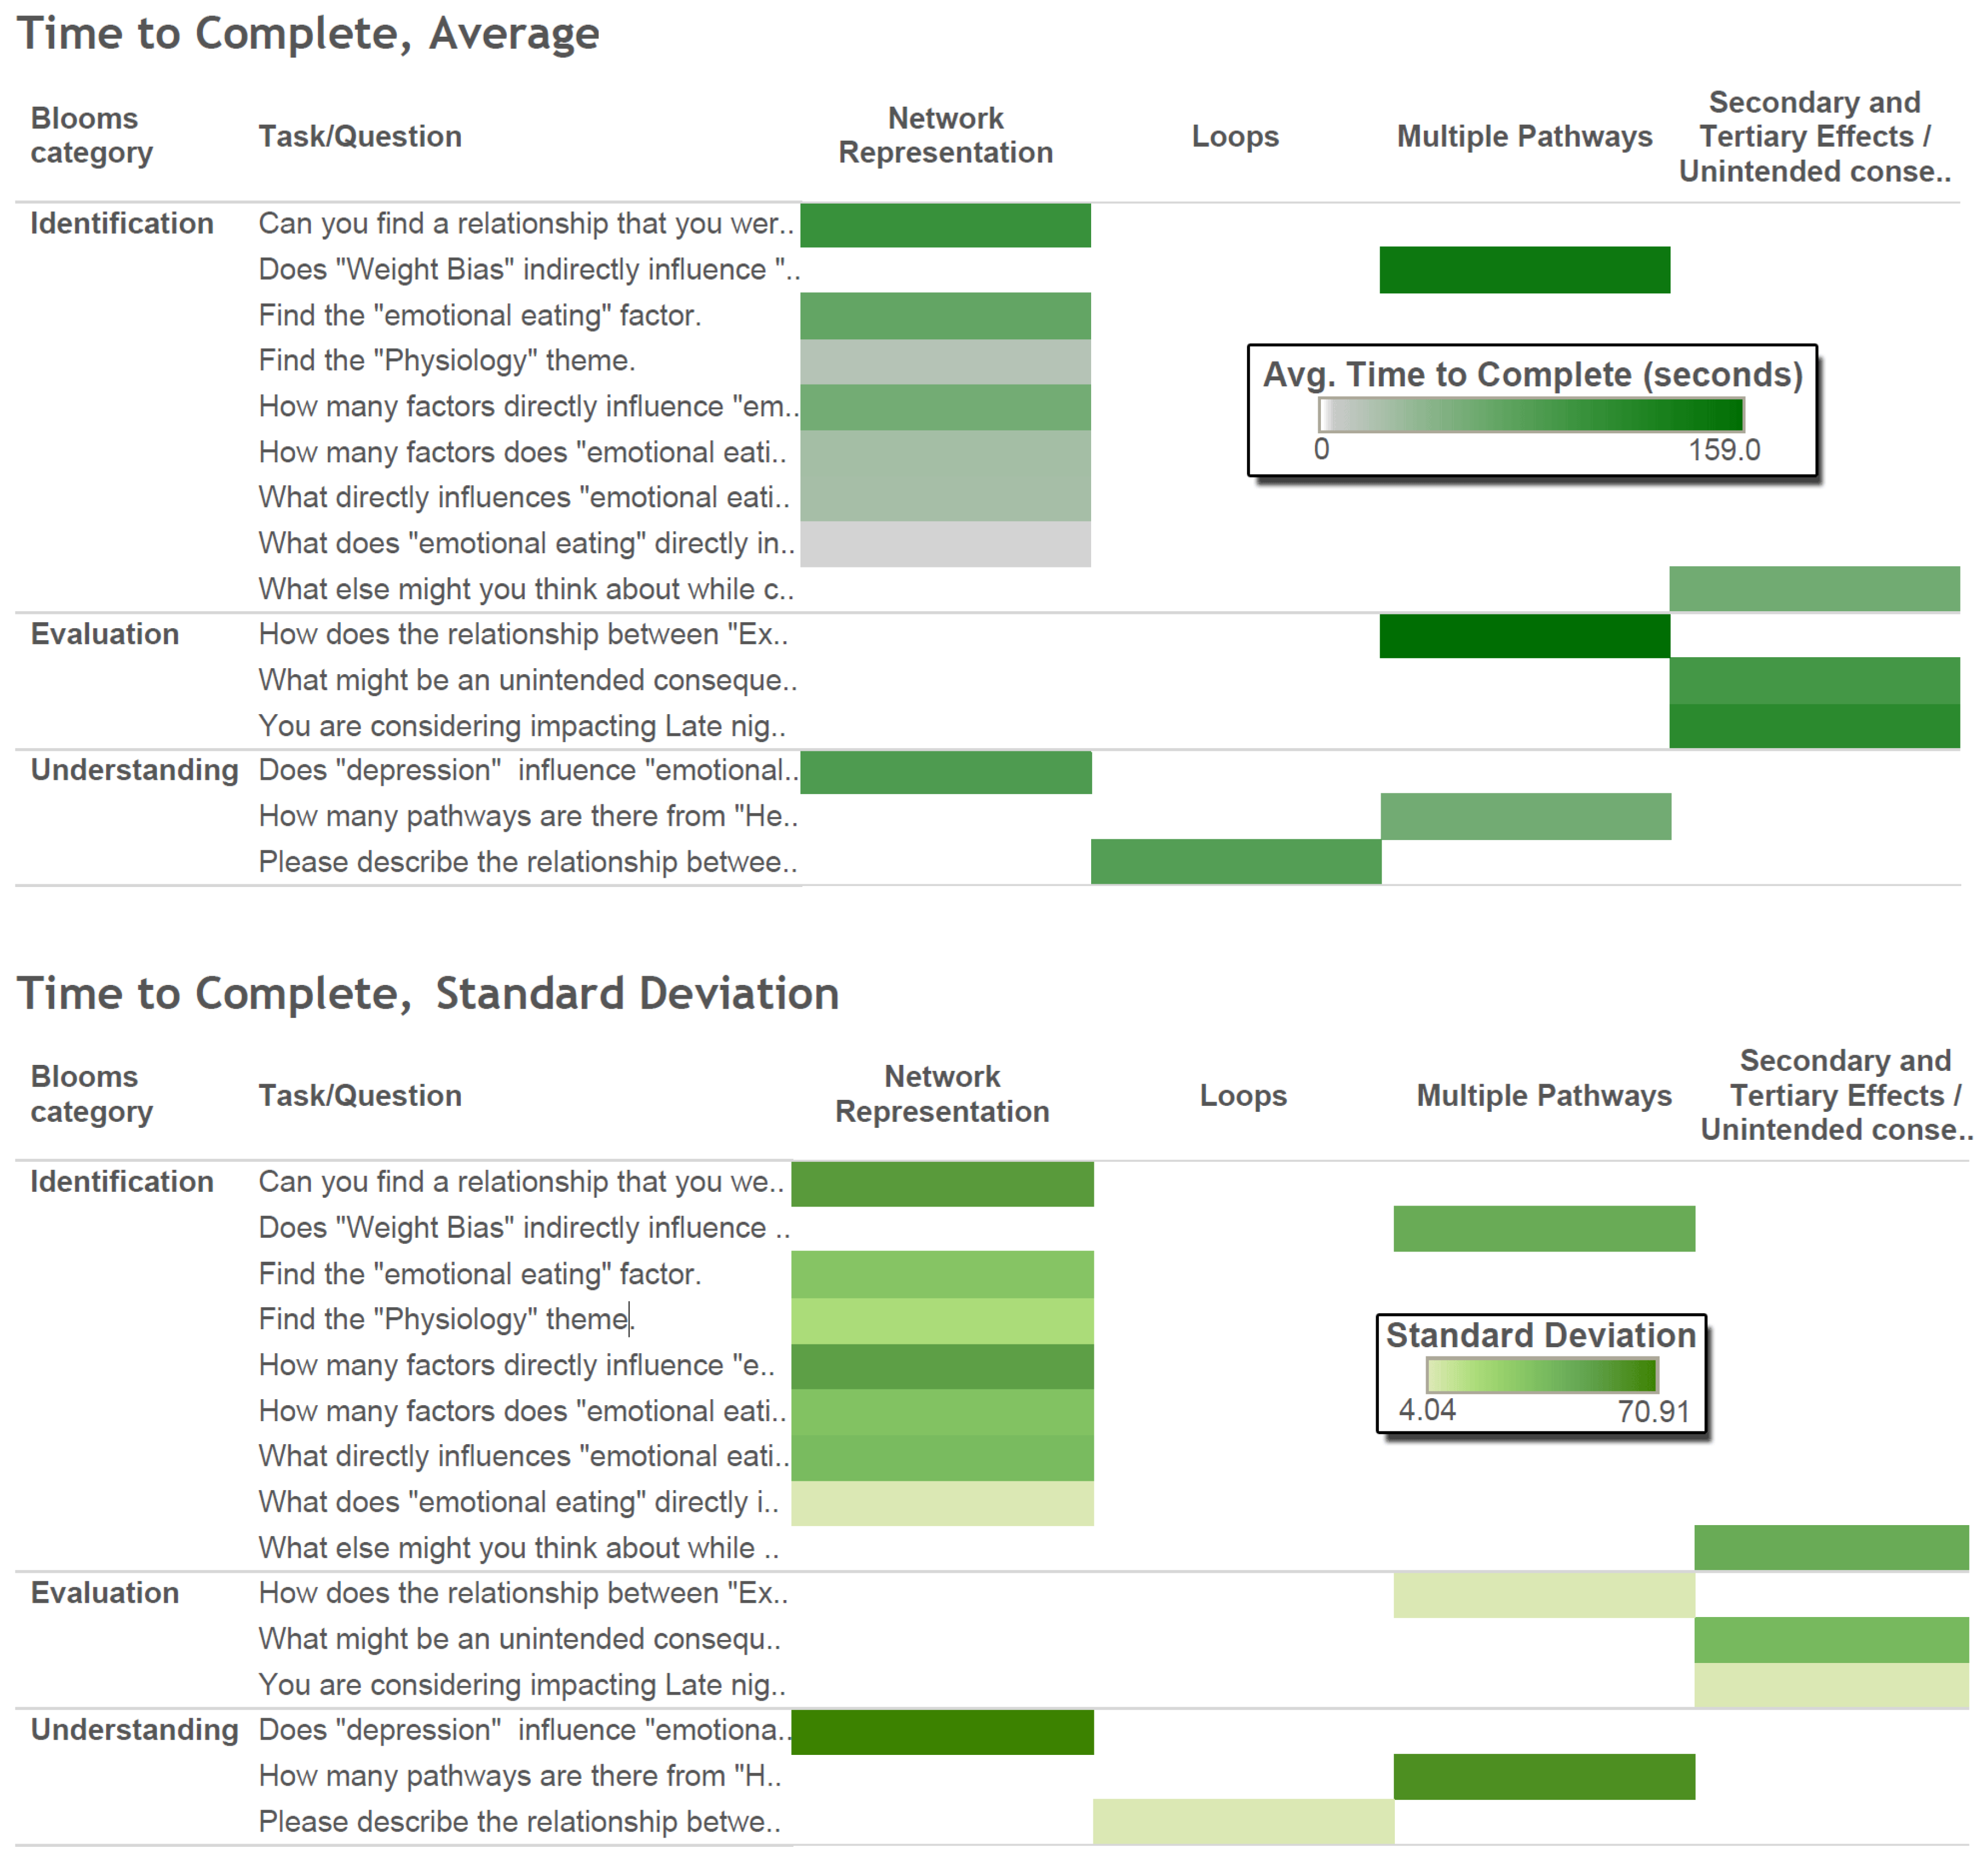
| Network Representation | Find the “Physiology” theme. Time: 15.7 ± 18 Accuracy: 0.857 ± 0.378 Find factor “emotional eating”. Time: 66.3 ± 32.7 Accuracy: 0.833 ± 0.408 How many factors directly influence “emotional eating”? Time: 55.6 ± 52.9 Accuracy: 0.571 ± 0.535 What directly influences “emotional eating”? Time: 24 ± 38.4 Accuracy: 0.167 ± 0.408 How many factors does “emotional eating” influence? Time: 25.2 ± 34.3 Accuracy: 0.8 ± 0.447 What does “emotional eating” directly influence? Time: 3.3 ± 4 Accuracy: 0 ± 0 | Does “depression” influence “emotional eating”? Time: 82.3 ± 70.9 Accuracy: 0.333 ± 0.516 | |
| Loops | How many factors are in the path starting at “Insulin resistance”, going through “Cells intake of fatty acids” and a few others, ended at “Insulin resistance” again? Time: N/A STD: N/A Accuracy: N/A STD: N/A | Please describe the relationship between “healthy eating” and “short sleep duration”? Time: 78 STD: N/A Accuracy: 1 STD: N/A | Is this a positive feedback loop or a negative feedback loop? Time: N/A STD: N/A Accuracy: N/A STD: N/A |
| Multiple Pathways | Does “Weight Bias” indirectly influence “Blood pressure”? Time: 143.4 ± 46 Accuracy: 1 | How many pathways are there from “Healthy eating” to “Blood pressure”? Time: 56.7 ± 63 Accuracy: 1 ± 0 | How does the relationship between “Exercise” and “Blood pressure” compared to the relationship between “Appetite” and “Blood pressure”? Time: 159 STD: N/A Accuracy: 1 STD: N/A |
| Secondary and Tertiary Effects | What else might you think about while considering a policy on “Public health messaging around thinness”? Time: 57.3 ± 45.9 Accuracy: 0.667 ± 0.577 | What might be an unintended consequence of changing “Medications”? Time: 90 ± 38.9 Accuracy: 1 ± 0 You are considering impacting “Late night TV watching”, what else needs to be considered for it to have a maximum effect on “Healthy eating”? Time: 112 STD: N/A Accuracy: 0 STD: N/A |
Appendix E. Usability Recommendations
Appendix E.1. Improvements in Network Representation (26 Recommendations)
- -
- Having node labels touch their nodes.
- -
- Having the full label name pop up when hovering over the text instead of hovering over the node.
- -
- Reducing full text popup delay time to 0.
- -
- The two level representation of the network (themes vs. factors) was not well understood. Replacing the theme triangles with something that visually suggests that a subnetwork is contained within it would be helpful.
- -
- Double clicking a factor should “zoom in more” and pull up a description of the factor.
- -
- Calling the themes “theme clusters” or “groups” would better indicate that they contain many members.
- -
- The colors of the arrow heads should match the color of the link.
- -
- The color of the links (red, green) shouldn’t be used as colors of themes as well.
- -
- The small +, − signs are too hard to read, consider removing them.
- -
- Users would like to be able to pan the map like in Google maps.
- -
- Clarify in legend if “strong” or a thick line is a strong relationship or strong evidence for relationship.
- -
- The legend has a grey triangle for Thematic area but grey is the color for the food consumption theme only. Use triangles beside theme names instead of squares.
- -
- When you expand or pack a theme the network redraws itself and you lose spatial orientation. Consider redrawing only the part of the graph that is affected.
- -
- Add all line thicknesses to legend.
- -
- Ability to filter or hide the themes or factors to reduce “the amount going on.”
- -
- Add common shortcut keys like ctrl-F to bring up the search feature.
- -
- Add synonyms to the search feature so that searching “binge eating” returns “eating disorders.”
- -
- Search feature should search for any of the words in the phrase not just from the first word.
- -
- The result of searching for an item should result in the target item flashing or continuously changing color until clicked. Or changing the size smoothly from large to small until clicked. Putting a red circle around the item or a big red arrow would also work.
- -
- Include in the search popup window an indication of what change to look for after the search has been completed.
- -
- The search feature could be a blank search box located in the tool and always available instead of generating a popup window.
- -
- Show the number of items within a theme by a number on the triangle or by the number of nodes in a mini-graph glyph inside of the theme triangle.
- -
- The popup tooltip should be consistent between both themes and factors. Displaying the full name is recommended.
- -
- The length of the line does not carry any meaning and it would be clearer if all links were of equal length.
- -
- There could be more than two levels of organization. Ex. Blood pressure could be “under” cardiovascular.
- -
- The ability to export the relationships as a list would be helpful for users. They can take the list and do further action on each of the items on the list (e.g., research it further, or formulate policy recommendations).
Appendix E.2. Improvements in Multiple Pathways (Two Recommendations)
- -
- The “See multiple pathways between two factors” tool should be a single pop up window where you can choose both the start and end nodes at the same time.
- -
- The “See multiple pathways between two factors” tool should also produce the results of swapping the start and end nodes to show both directions at once. This could be shown as two separate graphs.
Appendix E.3. Improvements in Secondary and Tertiary Effects (Four Recommendations)
- -
- At the identification level, we make the following three recommendations:
- -
- “find the effects of intervening” tool should show that there are further links beyond the level chosen. Maybe by having outgoing links but not showing the nodes or by showing the n + 1 level but at a smaller scale. This would solve the issue of things looking like they “just end”
- -
- For the tree map representation, add some jitter in the Y direction so that the node labels don’t overlap quite so much. Or make labels slanted.
- -
- The “find the effects of intervening” tool should have the centre most factor in the centre of the circles.
- -
- Having a tool similar to “find the effects of intervening” but instead of starting at a chosen node, we end at the chosen node. This helps answer the question “what can I do to impact obesity, directly and indirectly?”
Appendix F. Sample Quotes from Participants


References
- Bryan, C.J. Rethinking Suicide: Why Prevention Fails, and How We Can do Better; Oxford University Press: Oxford, UK, 2021. [Google Scholar]
- Giabbanelli, P.J.; Rice, K.L.; Galgoczy, M.C.; Nataraj, N.; Brown, M.M.; Harper, C.R.; Nguyen, M.D.; Foy, R. Pathways to suicide or collections of vicious cycles? Understanding the complexity of suicide through causal mapping. Soc. Netw. Anal. Min. 2022, 12, 60. [Google Scholar] [CrossRef]
- Perry, J. Climate change adaptation in the world’s best places: A wicked problem in need of immediate attention. Landsc. Urban Plan. 2015, 133, 1–11. [Google Scholar] [CrossRef]
- Finegood, D.T. The importance of systems thinking to address obesity. In Obesity Treatment and Prevention: New Directions; Karger Publishers: Basel, Switzerland, 2012; Volume 73, pp. 123–137. [Google Scholar]
- Parkinson, J.; Dubelaar, C.; Carins, J.; Holden, S.; Newton, F.; Pescud, M. Approaching the wicked problem of obesity: An introduction to the food system compass. J. Soc. Mark. 2017, 7, 387–404. [Google Scholar] [CrossRef]
- Heitman, K. Reductionism at the Dawn of Population Health. In Systems Science and Population Health; El-Sayed, A.M., Galea, S., Eds.; Oxford University Press: Oxford, UK, 2017; pp. 9–24. [Google Scholar]
- Chen, H.T. Interfacing theories of program with theories of evaluation for advancing evaluation practice: Reductionism, systems thinking, and pragmatic synthesis. Eval. Program Plan. 2016, 59, 109–118. [Google Scholar] [CrossRef]
- Trochim, W.M.; Cabrera, D.A.; Milstein, B.; Gallagher, R.S.; Leischow, S.J. Practical challenges of systems thinking and modeling in public health. Am. J. Public Health 2006, 96, 538–546. [Google Scholar] [CrossRef] [PubMed]
- Mooney, S.J. Systems Thinking in Population Health Research and Policy. In Systems Science and Population Health; El-Sayed, A.M., Galea, S., Eds.; Oxford University Press: Oxford, UK, 2017; pp. 49–60. [Google Scholar]
- Grewatsch, S.; Kennedy, S.; Bansal, P. Tackling wicked problems in strategic management with systems thinking. Strateg. Organ. 2021, 2021, 14761270211038635. [Google Scholar] [CrossRef]
- de Pinho, H. Generation of Systems Maps: Mapping Complex Systems of Population Health. In Systems Science and Population Health; El-Sayed, A.M., Galea, S., Eds.; Oxford University Press: Oxford, UK, 2017; pp. 61–76. [Google Scholar]
- Barbrook-Johnson, P.; Penn, A.S. Running Systems Mapping Workshops. In Systems Mapping; Palgrave Macmillan: Cham, Switzerland, 2022; pp. 145–159. [Google Scholar]
- Giabbanelli, P.J.; Baniukiewicz, M. Navigating complex systems for policymaking using simple software tools. In Advanced Data Analytics in Health; Springer: Cham, Switzerland, 2018; pp. 21–40. [Google Scholar]
- Giabbanelli, P.J.; Tison, B.; Keith, J. The application of modeling and simulation to public health: Assessing the quality of agent-based models for obesity. Simul. Model. Pract. Theory 2021, 108, 102268. [Google Scholar] [CrossRef]
- Naumova, E.N.; Hennessy, E. Presenting models to policymakers: Intention and perception. J. Public Health Policy 2018, 39, 189–192. [Google Scholar] [CrossRef]
- Gittelsohn, J.; Novotny, R.; Trude, A.C.B.; Butel, J.; Mikkelsen, B.E. Challenges and lessons learned from multi-level multi-component interventions to prevent and reduce childhood obesity. Int. J. Environ. Res. Public Health 2019, 16, 30. [Google Scholar] [CrossRef] [Green Version]
- Nam, C.S.; Ross, A.; Ruggiero, C.; Ferguson, M.; Mui, Y.; Lee, B.Y.; Gittelsohn, J. Process evaluation and lessons learned from engaging local policymakers in the B’More Healthy Communities for Kids trial. Health Educ. Behav. 2019, 46, 15–23. [Google Scholar] [CrossRef]
- Seifu, L.; Ruggiero, C.; Ferguson, M.; Mui, Y.; Lee, B.Y.; Gittelsohn, J. Simulation modeling to assist with childhood obesity control: Perceptions of Baltimore City policymakers. J. Public Health Policy 2018, 39, 173–188. [Google Scholar] [CrossRef]
- Srivastava, S.; Nambiar, D. Pivoting from systems “thinking” to systems “doing” in health systems—Documenting stakeholder perspectives from Southeast Asia. Front. Public Health 2022, 10, 2521. [Google Scholar] [CrossRef]
- Drasic, L.; Giabbanelli, P.J. Exploring the interactions between physical well-being, and obesity. Can. J. Diabetes 2015, 39, S12–S13. [Google Scholar] [CrossRef]
- McPherson, K.; Marsh, T.; Brown, M. Foresight report on obesity. Lancet 2007, 370, 1755. [Google Scholar] [CrossRef] [PubMed]
- McGlashan, J.; Hayward, J.; Brown, A.; Owen, B.; Millar, L.; Johnstone, M.; Creighton, D.; Allender, S. Comparing complex perspectives on obesity drivers: Action-driven communities and evidence-oriented experts. Obes. Sci. Pract. 2018, 4, 575–581. [Google Scholar] [CrossRef] [PubMed] [Green Version]
- Siokou, C.; Morgan, R.; Shiell, A. Group model building: A participatory approach to understanding and acting on systems. Public Health Res. Pract. 2014, 25, e2511404. [Google Scholar] [CrossRef] [Green Version]
- Jack, A. Foresight report on obesity–Author’s reply. Lancet 2007, 370, 1755. [Google Scholar] [CrossRef]
- Allender, S.; Owen, B.; Kuhlberg, J.; Lowe, J.; Nagorcka-Smith, P.; Whelan, J.; Bell, C. A community based systems diagram of obesity causes. PloS ONE 2015, 10, e0129683. [Google Scholar] [CrossRef] [Green Version]
- Grant, S.; Soltani Panah, A.; McCosker, A. Weight-Biased Language across 30 Years of Australian News Reporting on Obesity: Associations with Public Health Policy. Obesities 2022, 2, 103–114. [Google Scholar] [CrossRef]
- Papoutsi, C.; Shaw, J.; Paparini, S.; Shaw, S. We need to talk about complexity in health research: Findings from a focused ethnography. Qual. Health Res. 2021, 31, 338–348. [Google Scholar] [CrossRef]
- Kwamie, A.; Ha, S.; Ghaffar, A. Applied systems thinking: Unlocking theory, evidence and practice for health policy and systems research. Health Policy Plan. 2021, 36, 1715–1717. [Google Scholar] [CrossRef]
- Chughtai, S.; Blanchet, K. Systems thinking in public health: A bibliographic contribution to a meta-narrative review. Health Policy Plan. 2017, 32, 585–594. [Google Scholar] [CrossRef] [PubMed] [Green Version]
- Weinerth, K.; Koenig, V.; Brunner, M.; Martin, R. Concept maps: A useful and usable tool for computer-based knowledge assessment? A literature review with a focus on usability. Comput. Educ. 2014, 78, 201–209. [Google Scholar] [CrossRef]
- Giabbanelli, P.J.; Tawfik, A.A.; Wang, B. Designing the next generation of map assessment systems: Open questions and opportunities to automatically assess a student’s knowledge as a map. J. Res. Technol. Educ. 2023, 55, 79–93. [Google Scholar] [CrossRef]
- Giabbanelli, P.J.; Tawfik, A.A. Reducing the gap between the conceptual models of students and experts using graph-based adaptive instructional systems. In Proceedings of the International Conference on Human-Computer Interaction, Copenhagen, Denmark, 19–24 July 2020; Springer: Cham, Switzerland, 2020; pp. 538–556. [Google Scholar]
- Machado, C.T.; Carvalho, A.A. Concept mapping: Benefits and challenges in higher education. J. Contin. High. Educ. 2020, 68, 38–53. [Google Scholar] [CrossRef]
- Huang, J.; Yu, H.; Marin, E.; Brock, S.; Carden, D.; Davis, T. Physicians’ weight loss counseling in two public hospital primary care clinics. Acad. Med. 2004, 79, 156–161. [Google Scholar] [CrossRef]
- Shiffman, S.; Sweeney, C.T.; Pillitteri, J.L.; Sembower, M.A.; Harkins, A.M.; Wadden, T.A. Weight management advice: What do doctors recommend to their patients? Prev. Med. 2009, 49, 482–486. [Google Scholar] [CrossRef]
- Giabbanelli, P.J. Analyzing the complexity of behavioural factors influencing weight in adults. In Advanced Data Analytics in Health; Springer: Cham, Switzerland, 2018; pp. 163–181. [Google Scholar]
- Verigin, T.; Giabbanelli, P.J.; Davidsen, P.I. Supporting a systems approach to healthy weight interventions in british columbia by modeling weight and well-being. In Proceedings of the 49th Annual Simulation Symposium, Pasadena, CA, USA, 3–6 April 2016; pp. 1–10. [Google Scholar]
- Huiberts, I.; Singh, A.; van Lenthe, F.J.; Chinapaw, M.; Collard, D. Evaluation proposal of a national community-based obesity prevention programme: A novel approach considering the complexity perspective. Int. J. Behav. Nutr. Phys. Act. 2022, 19, 31. [Google Scholar] [CrossRef]
- Dubé, L.; Addy, N.A.; Blouin, C.; Drager, N. From policy coherence to 21st century convergence: A whole-of-society paradigm of human and economic development. Ann. N. Y. Acad. Sci. 2014, 1331, 201–215. [Google Scholar] [CrossRef]
- Hammond, R.A.; Dubé, L. A systems science perspective and transdisciplinary models for food and nutrition security. Proc. Natl. Acad. Sci. USA 2012, 109, 12356–12363. [Google Scholar] [CrossRef] [PubMed] [Green Version]
- Giabbanelli, P.J.; Crutzen, R. Creating groups with similar expected behavioural response in randomized controlled trials: A fuzzy cognitive map approach. BMC Med. Res. Methodol. 2014, 14, 130. [Google Scholar] [CrossRef] [Green Version]
- Dube, L.; Wolfert, S.; Zimmerman, K.; Yang, N.; Diaz-Lopez, F.; Arvanitis, R.; Sandra Schillo, R.; Hamalova, S.; Nie, J.Y.; Brown, S. Convergence research and innovation digital backbone: Behavioral analytics, artificial intelligence, and digital technologies as bridges between biological, social, and agri-food systems. In How is Digitalization Affecting Agri-food? Routledge: Abingdon, UK, 2020; pp. 111–125. [Google Scholar]
- Giabbanelli, P.J.; Crutzen, R. Using agent-based models to develop public policy about food behaviours: Future directions and recommendations. Comput. Math. Methods Med. 2017, 2017, 5742629. [Google Scholar] [CrossRef] [Green Version]
- Vermeer, W.H.; Smith, J.D.; Wilensky, U.; Brown, C.H. High-fidelity agent-based modeling to support prevention decision-making: An open science approach. Prev. Sci. 2022, 23, 832–843. [Google Scholar] [CrossRef] [PubMed]
- Carey, G.; Malbon, E.; Carey, N.; Joyce, A.; Crammond, B.; Carey, A. Systems science and systems thinking for public health: A systematic review of the field. BMJ Open 2015, 5, e009002. [Google Scholar] [CrossRef] [PubMed]
- Hong, Q.N.; Bangpan, M.; Stansfield, C.; Kneale, D.; O’Mara-Eves, A.; van Grootel, L.; Thomas, J. Using systems perspectives in evidence synthesis: A methodological mapping review. Res. Synth. Methods 2022, 13, 667–680. [Google Scholar] [CrossRef]
- Luna Pinzon, A.; Stronks, K.; Dijkstra, C.; Renders, C.; Altenburg, T.; den Hertog, K.; Waterlander, W. The ENCOMPASS framework: A practical guide for the evaluation of public health programmes in complex adaptive systems. Int. J. Behav. Nutr. Phys. Act. 2022, 19, 33. [Google Scholar] [CrossRef]
- Malbon, E.; Parkhurst, J. System dynamics modelling and the use of evidence to inform policymaking. Policy Stud. 2022, 1–19. [Google Scholar] [CrossRef]
- Hamid, T.K. Thinking in Circles about Obesity: Applying Systems Thinking to Weight Management; Springer Science & Business Media: Berlin, Germany, 2009; Volume 202. [Google Scholar]
- Axelrod, R. (Ed.) Structure of Decision: The Cognitive Maps of Political Elites; Princeton University Press: Princeton, NJ, USA, 2015. [Google Scholar]
- Vennix, J.A.; Akkermans, H.A.; Rouwette, E.A. Group model-building to facilitate organizational change: An exploratory study. Syst. Dyn. Rev. J. Syst. Dyn. Soc. 1996, 12, 39–58. [Google Scholar] [CrossRef]
- Giabbanelli, P.J.; Tawfik, A.A. How Perspectives of a System Change Based on Exposure to Positive or Negative Evidence. Systems 2021, 9, 23. [Google Scholar] [CrossRef]
- Meadows, D.H. Thinking in Systems: A Primer; Chelsea Green Publishing: Chelsea, VT, USA, 2008. [Google Scholar]
- Malhi, L.; Karanfil, Ö.; Merth, T.; Acheson, M.; Palmer, A.; Finegood, D.T. Places to intervene to make complex food systems more healthy, green, fair, and affordable. J. Hunger. Environ. Nutr. 2009, 4, 466–476. [Google Scholar] [CrossRef] [Green Version]
- Johnston, L.M.; Matteson, C.L.; Finegood, D.T. Systems science and obesity policy: A novel framework for analyzing and rethinking population-level planning. Am. J. Public Health 2014, 104, 1270–1278. [Google Scholar] [CrossRef]
- Provincial Health Services Authority. From Weight to Well-Being: Time for a Shift in Paradigm? Provincial Health Services Authority: Vancouver, BC, Canada, 2013. [Google Scholar]
- Giabbanelli, P.; Flarsheim, R.A.; Vesuvala, C.X.; Drasic, L. Developing technology to support policymakers in taking a systems science approach to obesity and well-being. Obes. Rev. 2016, 17, 194–195. [Google Scholar]
- Riihiaho, S. Usability Testing. Wiley Handb. Hum. Comput. Interact. 2018, 1, 255–275. [Google Scholar]
- Hertzum, M. Usability Testing: A Practitioner’s Guide to Evaluating the User Experience. Synth. Lect. Hum.-Cent. Inform. 2020, 13, i-105. [Google Scholar]
- Gappa, H.; Nordbrock, G.; Mohamad, Y.; Velasco, C.A. Group-based expert walkthroughs to compensate for limited access to target user groups as in case of chronically ill patients. In Proceedings of the International Conference on Computers Helping People with Special Needs, Linz, Austria, 11–13 July 2018; Springer: Cham, Switzerland, 2018; pp. 71–74. [Google Scholar]
- Kostakos, V. The big hole in HCI research. Interactions 2015, 22, 48–51. [Google Scholar] [CrossRef]
- Fan, M.; Lin, J.; Chung, C.; Truong, K.N. Concurrent think-aloud verbalizations and usability problems. ACM Trans. Comput. -Hum. Interact. (TOCHI) 2019, 26, 1–35. [Google Scholar] [CrossRef]
- Krathwohl, D.R. A revision of Bloom’s taxonomy: An overview. Theory Into Pract. 2002, 41, 212–218. [Google Scholar] [CrossRef]
- McGrath, M.; Willcutt, W. The creative use of Thinking Maps to embed Blooms’ Taxonomy within teaching, learning and assessment. EDUCATIO J. Educ. 2022, 6, 346–372. [Google Scholar] [CrossRef]
- Gorman, J. Learning Objectives for Concept Mapping Based on the Complete Bloom’s Taxonomy to Promote Meaningful Learning. In Proceedings of the Eighth International Conference on Concept Mapping, Medellín, Colombia, 26–28 September 2018; Nipmuc Regional High School: Upton, MA, USA, 2018; pp. 1–11. [Google Scholar]
- Deep, A.; Pathan, R.; Mitra, R. Comparing Experts’ Systems Thinking Skill Across Contexts. In Proceedings of the 2018 IEEE Tenth International Conference on Technology for Education(T4E), Kuala Lumpur, Malaysia, 8–9 November 2018; IEEE: Piscataway Township, NJ, USA, 2018; pp. 154–157. [Google Scholar]
- Hogan, K.; Pressley, M. Scaffolding Student Learning: Instructional Approaches and Issues; Brookline Books: Cambridge, MA, USA, 1997. [Google Scholar]
- Sharma, A.M.; Padwal, R. Obesity is a sign—over-eating is a symptom: An aetiological framework for the assessment and management of obesity. Obes. Rev. 2009, 11, 362–370. [Google Scholar] [CrossRef]
- Fraenkel, L.; McGraw, S. What are the essential elements to enable patient participation in medical decision making? J. Gen. Intern. Med. 2007, 22, 614–619. [Google Scholar] [CrossRef] [Green Version]
- Mead, N.; Bower, P. Patient-centredness: A conceptual framework and review of the empirical literature. Soc. Sci. Med. 2000, 51, 1087–1110. [Google Scholar] [CrossRef] [PubMed]
- Giabbanelli, P.J.; Adams, J.; Pillutla, V.S. Feasibility and framing of interventions based on public support: Leveraging text analytics for policymakers. In Proceedings of the Human-Computer Interaction conference, Toronto, ON, Canada, 17–22 July 2016; Springer International Publishing: Cham, Switzerland, 2016. [Google Scholar]
- Prpic, J.; Taeihag, A.; Melton, J. Crowdsourcing the policy cycle. In Proceedings of the Collective Intelligence conference, Seoul, Korea, 24–26 September 2014; MIT Center for Collective Intelligence: Madrid, Spain, 2014. [Google Scholar]


| Before Assessment by Senior PHSA Staff | After Assessment |
|---|---|
| The software starts in a small window, creating a very packed map with many labels overlapping. | The software starts in full screen and the map occupies all available space, thus decreasing cluttering. |
| Some labels on the legend (e.g., Food production) differ from those visible on the map (e.g., Production). | Labels on the map are coherent with those in the legend. |
| Only the exploratory tool has a detailed legend. | All tools have a detailed legend. |
| There is a tool to find the most important factor, resulting in a table of numbers. The tool requires extensive expertise to be used but draws in user attention because of the idea of ‘importance’. | The tool was deactivated. |
| Only the exploratory tool uses the red and green line convention for connections. | All tools use the red and green line convention. |
| The ‘find the impact tool’ does not run with its default values: users must select one. | The ‘find the impact tool’ runs even if users do not change the default value. |
| ‘Quality of sport infrastructure’ was duplicated in the map. | ‘Quality of sport infrastructure’ appears only once. |
| Identification | Understanding | Evaluation | |
|---|---|---|---|
| Network Represen-tation |
|
| |
| Loops |
|
|
|
| Multiple Pathways |
|
|
|
| Secondary and Tertiary Effects |
|
|
| Participant. | Count | Sum | Average | Variance | ||
|---|---|---|---|---|---|---|
| 1 | 9 | 368 | 40.88889 | 2732.111 | ||
| 2 | 9 | 305 | 33.88889 | 1242.861 | ||
| 3 | 10 | 672 | 67.2 | 3915.289 | ||
| 4 | 12 | 823 | 68.58333 | 2010.447 | ||
| 5 | 8 | 735 | 91.875 | 7561.554 | ||
| 6 | 12 | 601 | 50.08333 | 3137.356 | ||
| 7 | 8 | 585 | 73.125 | 3758.982 | ||
| 8 | 2 | 181 | 90.5 | 4.5 | ||
| ANOVA | ||||||
| Source of Variation | SS | df | MS | F | p-value | Fcrit |
| Between Groups | 23,302.54 | 7 | 3328.934 | 1.017162 | 0.428226 | 1.816007 |
| Within Groups | 202,911.5 | 62 | 3272.766 | |||
| Total | 226,214 | 69 |
| Groups | Count | Sum | Average | Variance | ||
|---|---|---|---|---|---|---|
| 1 | 8 | 4 | 0.5 | 0.285714 | ||
| 2 | 8 | 6 | 0.75 | 0.214286 | ||
| 3 | 8 | 4 | 0.5 | 0.285714 | ||
| 4 | 2 | 2 | 1 | 0 | ||
| 5 | 10 | 6 | 0.6 | 0.266667 | ||
| 6 | 7 | 5 | 0.714286 | 0.238095 | ||
| 7 | 11 | 7 | 0.636364 | 0.254545 | ||
| 8 | 8 | 7 | 0.875 | 0.125 | ||
| ANOVA | ||||||
| Source of Variation | SS | df | MS | F | p-value | Fcrit |
| Between Groups | 1.138071 | 7 | 0.162582 | 0.688633 | 0.681104 | 1.831093 |
| Within Groups | 12.74903 | 54 | 0.236093 | |||
| Total | 13.8871 | 61 |
Disclaimer/Publisher’s Note: The statements, opinions and data contained in all publications are solely those of the individual author(s) and contributor(s) and not of MDPI and/or the editor(s). MDPI and/or the editor(s) disclaim responsibility for any injury to people or property resulting from any ideas, methods, instructions or products referred to in the content. |
© 2023 by the authors. Licensee MDPI, Basel, Switzerland. This article is an open access article distributed under the terms and conditions of the Creative Commons Attribution (CC BY) license (https://creativecommons.org/licenses/by/4.0/).
Share and Cite
Giabbanelli, P.J.; Vesuvala, C.X. Human Factors in Leveraging Systems Science to Shape Public Policy for Obesity: A Usability Study. Information 2023, 14, 196. https://doi.org/10.3390/info14030196
Giabbanelli PJ, Vesuvala CX. Human Factors in Leveraging Systems Science to Shape Public Policy for Obesity: A Usability Study. Information. 2023; 14(3):196. https://doi.org/10.3390/info14030196
Chicago/Turabian StyleGiabbanelli, Philippe J., and Chirag X. Vesuvala. 2023. "Human Factors in Leveraging Systems Science to Shape Public Policy for Obesity: A Usability Study" Information 14, no. 3: 196. https://doi.org/10.3390/info14030196