Article

Architecture-Oriented Agent-Based Simulations and Machine Learning Solution: The Case of Tsunami Emergency Analysis for Local Decision Makers

1
Faculty of Informatics and Management, University of Hradec Kralove, Rokitanskeho 62, 500 03 Hradec Kralove, Czech Republic
2
Faculty of Electrical Engineering and Informatics, Technical University of Košice, Letná 9, 042 01 Košice, Slovakia
3
Department of Computer Technical Engineering, College of Information Technology, Imam Ja’afar Al-Sadiq University, Al-Muthanna 66002, Iraq
4
Indian National Centre for Ocean Information Services, Hyderabad 500090, Telangana, India
5
Department of Geology and Geoenvironment, National & Kapodistrian University of Athens, 10679 Athens, Greece
*
Author to whom correspondence should be addressed.
Information 2023, 14(3), 172; https://doi.org/10.3390/info14030172
Submission received: 27 January 2023 / Revised: 24 February 2023 / Accepted: 7 March 2023 / Published: 8 March 2023
(This article belongs to the Special Issue Feature Papers in Information in 2023)

Abstract

:
Tsunamis are a perilous natural phenomenon endangering growing coastal populations and tourists in many seaside resorts. Failures in responding to recent tsunami events stresses the importance of further research in building a robust tsunami warning system, especially in the “last mile” component. The lack of detail, unification and standardisation in information processing and decision support hampers wider implementation of reusable information technology solutions among local authorities and officials. In this paper, the architecture of a tsunami emergency solution is introduced. The aim of the research is to present a tsunami emergency solution for local authorities and officials responsible for preparing tsunami response and evacuation plans. The solution is based on a combination of machine learning techniques and agent-based modelling, enabling analysis of both real and simulated datasets. The solution is designed and developed based on the principles of enterprise architecture development. The data exploration follows the practices for data mining and big data analyses. The architecture of the solution is depicted using the standardised notation and includes components that can be exploited by responsible local authorities to test various tsunami impact scenarios and prepare plans for appropriate response measures.

1. Introduction

A tsunami hazard is a very low probability but potentially of a very high impact on humans and property. Yet, the growing coastal population and related rapid construction in popular coastal areas bring new vulnerabilities and challenges to the risk assessment and response orchestration procedures. In recent years, considerable effort has been devoted to tsunami source identification [1,2,3], early warning systems [4,5], tsunami modeling [6,7,8], simulations and resilience programmes [9,10,11]. Despite these efforts, incorrect forecasts of tsunami magnitude and devastation, lack of preparedness and evacuation failures reveal severe gaps in research and the corresponding practices [12,13]. The end-to-end tsunami-instigated activities are organised into so-called tsunami warning systems (TWS). A TWS is supposed to reduce disaster risk and economic damage significantly. The TWS builds on the preparedness and commitment of local authorities as critical elements for success [14]. However, as recent tsunami events show, the “last mile” component of the TWS is often rendered inadequate and ineffective at many locations worldwide [15]. The lack of detail, unification and standardisation in information processing and decision support hampers the wider implementation of reusable information technology solutions among local authorities and officials. In this paper, the architecture of a tsunami emergency solution is introduced to design appropriate decision-making support that can be easily adjusted to local geographic settings and provides advanced data exploration features. This paper aims to present a tsunami emergency solution for local authorities and officials responsible for preparing tsunami response and evacuation plans. The solution comprises an approach based on a combination of machine learning techniques with agent-based simulations. The novelty of the research is in the integration of the machine learning approaches for data exploration, agent-based technologies for evacuation simulation and web-based GIS information for map display together with a notification system. While these components are often mentioned in tsunami research, the unification into one solution is rare. Such integration is grounded in the mutual interconnection through application programming interfaces and specific protocols and enables employment, analysis and exploitation of both real and simulated datasets. The solution architecture is inspired by the Wächter et al. [16] component-based architecture and is documented using standardised notation. The architecture is designed and developed based on the principles of enterprise architecture development documented in the The Open Group Architecture Framework (TOGAF) [17]. The data exploration follows the CRISP-DM (cross industry standard process for data mining) methodology for data mining and big data analyses [18]. The architecture provides interoperability of various components, realizes services data exploration based on machine learning approaches, agent-based evacuation simulations, and provides notification and navigation services in case of initiated evacuation orders. There is a plethora of specific applications that facilitate tsunami detection, characterisation and response activities. However, many of these applications target simulations and estimations on a macro scale [19,20] and are intended for scientists with complicated parametrisation [21]. Others are location-specific and cannot be easily used elsewhere. The present solutions try to reduce such inefficiencies.
The structure of the paper is divided into five main parts. Section 2 reviews current, often referenced TWS and their architecture. Section 3 introduces the solution architecture and describes the key components. There is also a categorisation of the components into layers and a description of the key components. The present architecture follows the principles of developing enterprise architecture and is visualised with widely used notation. Section 4 further expands on the application components, including the Tsunami Emergency Dashboard and the Tsunami Emergency Assistant. In Section 5, the data exploration components based on machine learning approaches is detailed. Finally, Section 6 focuses on the agent-based simulation component used for evacuation planning and evaluating impact scenarios.

2. Tsunami Warning Systems Architectures

Tsunami warning systems are used fairly broadly for any actions that reduce the risk of tsunami hazards and can include various participants and agencies with specific roles and commitments. The term is also associated with necessary information technology (IT) infrastructure used for monitoring tsunami sources, estimation of tsunami parameters, simulation of tsunami propagation, decision-making support and communication of warnings and response manoeuvres. In this paper, the focus is mainly on the architecture of the TWS. Architecture refers to the constitutional arrangements of key system components and their relations, as well as rules that govern the organisation of such components and relations [17]. There are several architectural conceptualisations of tsunami warning systems. The conceptualisations usually try to encompass the full complexity of tsunami hazards but differ in focus and the types of components they describe. Some conceptualisations integrate various technological components [16] or processes [22], while others are more collaborative-based and instead present roles and responsibilities [14,23] or data and information flows [24]. The Sendai framework for disaster risk reduction is a key document in tackling natural hazards [25]. The framework does not provide any specific architecture, but enumerates the guiding principles, priorities and capabilities to improve governance, preparedness and response to disaster risks. Thus, the framework provides a well-established methodological background for building TWS architectures. Widely referenced in TWS is the tsunami early warning and mitigation system in the North-eastern Atlantic, the Mediterranean and Connected Seas (NEAMTWS) facilitated by the Intergovernmental Oceanographic Commission, under the auspices of UNESCO [14]. The architecture of NEAMTWS determines the roles of national or regional authorities from detection to dissemination of warnings. The data and messaging flows are depicted among the authorities. The roles and responsibilities are defined rather broadly and give only general guidance. The architecture lacks the infrastructure necessary for supporting the data and information flows. The Australian Tsunami Warning System also follows a similar operational focus on roles and responsibilities [26]. The Indonesia Tsunami Early Warning System (InaTEWS) supports vertical and horizontal information exchange among stakeholders [27]. The information is divided into upstream and downstream parts. The upstream parts consist of monitoring equipment, such as buoys, seismic sensors, tide gauges, etc. The gathered data are processed by the Meteorological, Climatological, and Geophysical Agency, and in the case of eminent tsunami danger, sent downstream through traditional electronic media, GSM or Internet providers. Wächter et al. [16] introduced the component-based architecture of TWS integrating resources, services and application layers. The resources, such as sea monitoring sensor data or computational power, are processed by service platforms to provide access and perform simulations. The services are consumed by the application functions, such as monitoring, decision making and warning dissemination.
The reviewed architectures lack recent updates that would systematise new scientific research, cover new approaches and opening opportunities, and provide a vision of the future state. Further, the architectures are on a highly abstract level. Implementation requires further elaboration that is rather hectic in research and practices given the number of various discoveries with a specific setting and limited potential for reuse. Further, none of the listed architectures uses a standardised notation even though there is a widely used open standard notation. The standardised notation would support architectural artefacts’ exploration, development and unambiguous communication.

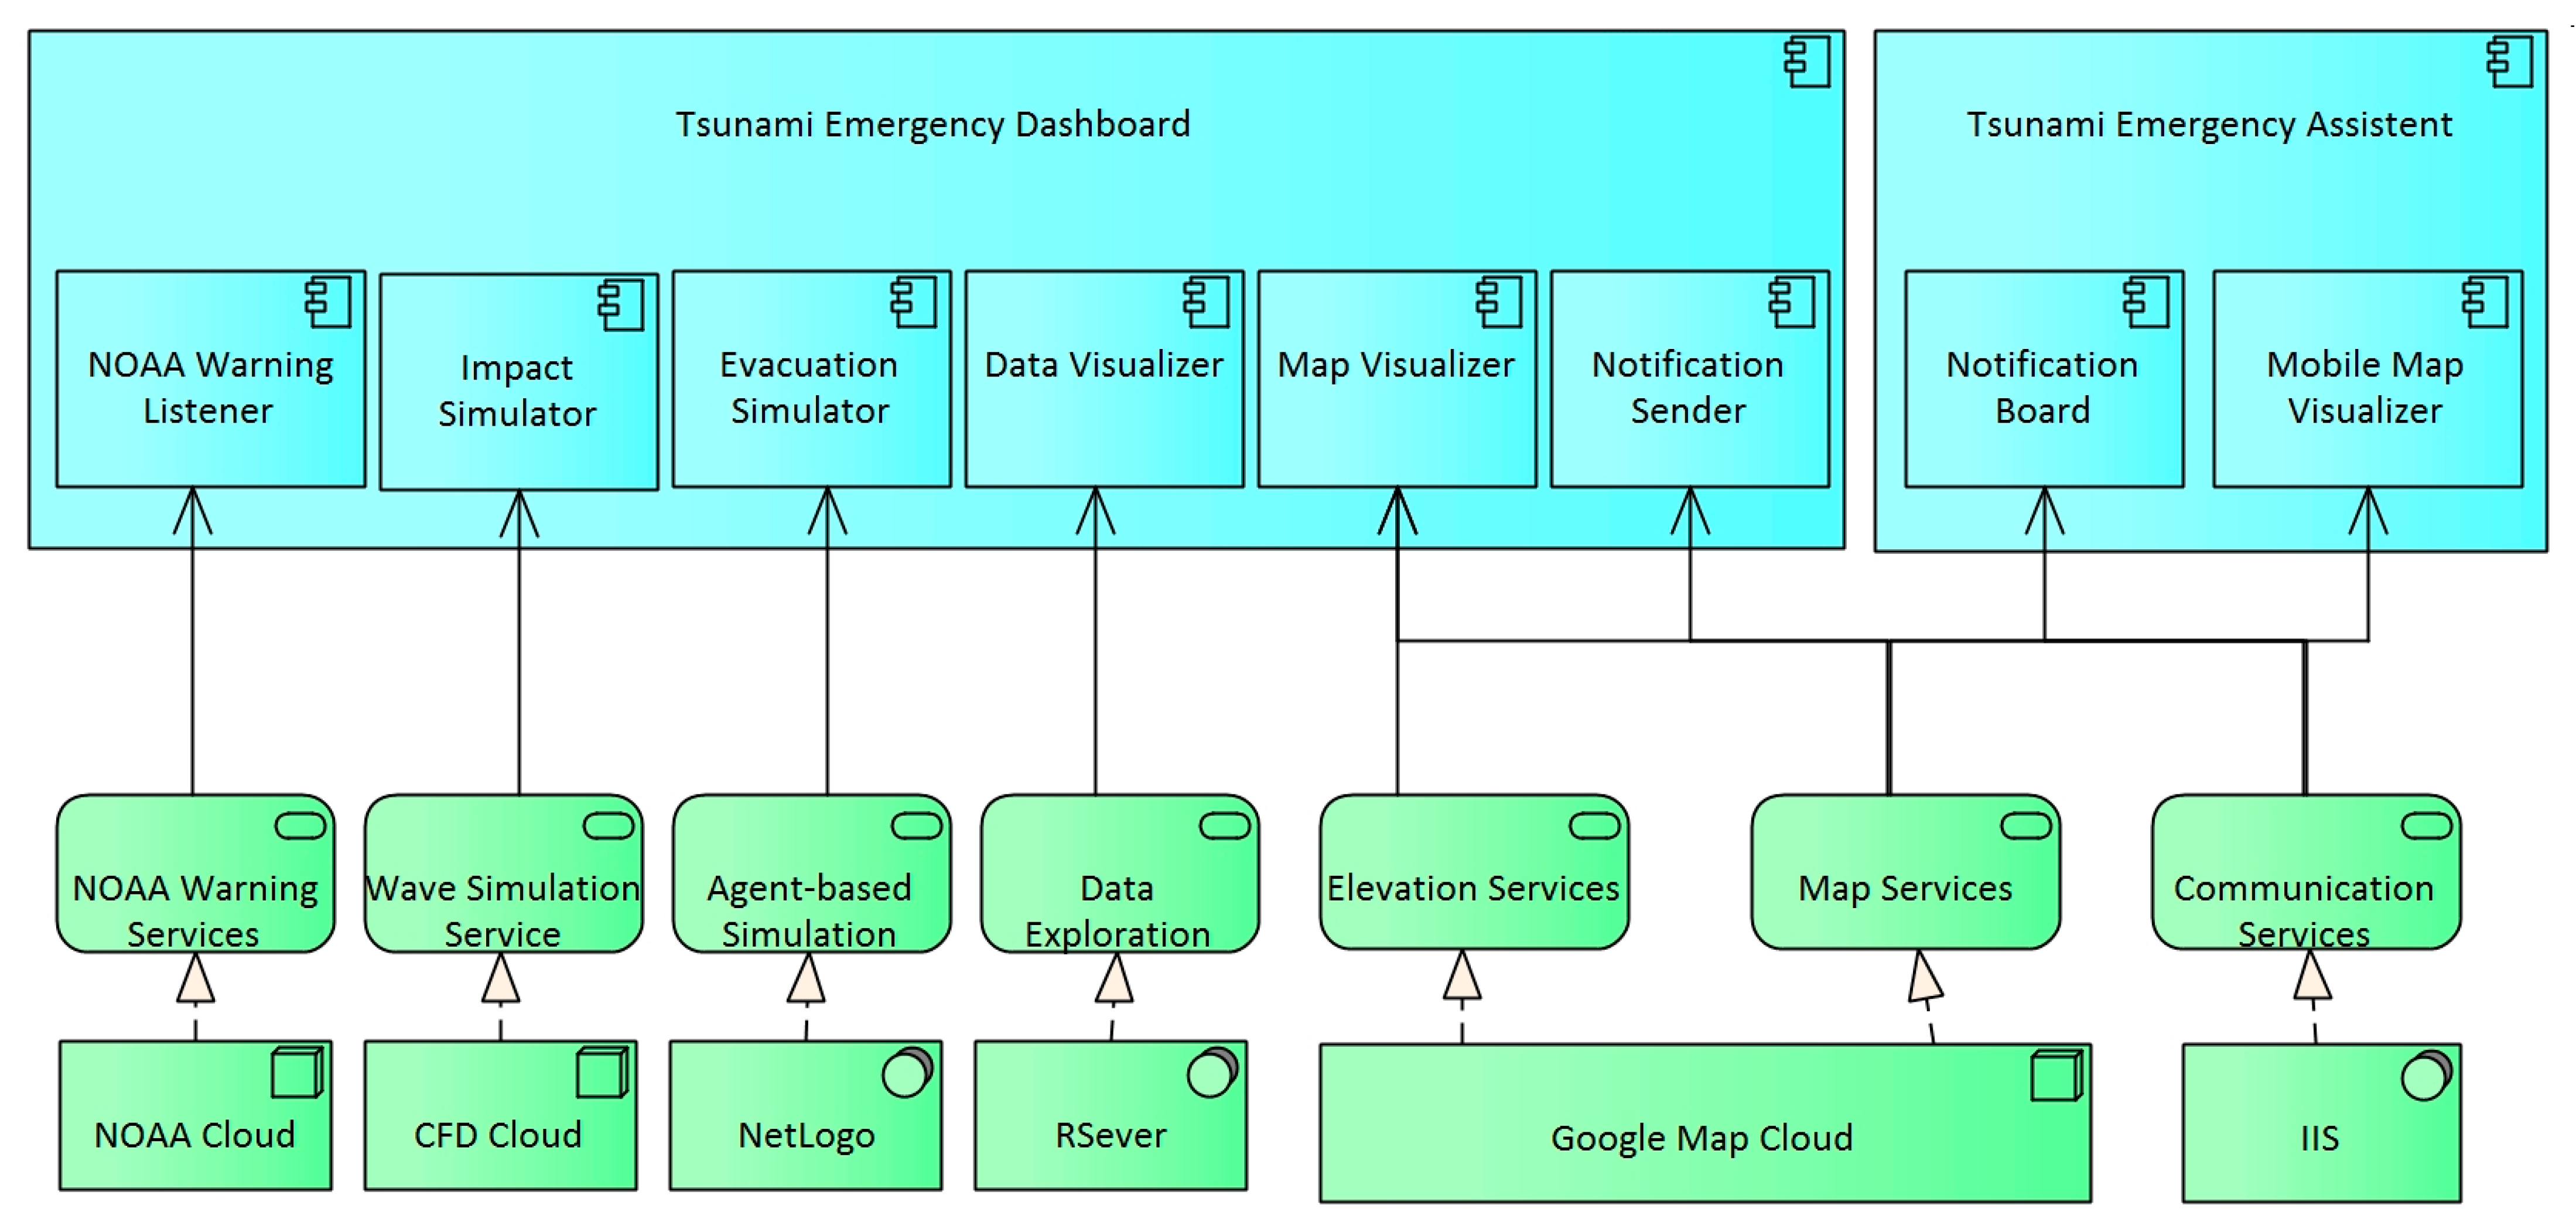
3. Tsunami Emergency Solution Architecture

The tsunami emergency solution is based on the modular architecture in which the complete system is decomposed into several self-contained units, referred to here as components. Each component encapsulates specific structures and functionalities that can be deployed relatively independently. In addition, the components utilise particular infrastructure, i.e., software and hardware technological elements or complete solutions. The architecture is modelled using the ArchiMate specification (see Figure 1). ArchiMate distinguishes several layers. In the model, the application and the technological layer are depicted. The application layer in blue comprises an application component. The application components make use of specific technology services, denoted with an ellipse. The technology services are realised by particular technological solutions, denoted as general computational nodes or system software elements. In the following application, the components and technological elements are described.
The application layer consists of two parts: a tsunami emergency dashboard and a mobile assistant. The dashboard provides decision-making support for local emergency authorities and administration in case of eminent tsunami danger. The responsible personnel can use the application to determine the endangered areas given specific tsunami parameters and plan appropriate response actions. The application enables estimation of the population required to be evacuated and possible evacuation routes. The evacuation routing respects the capacity of the safe area and, if necessary, recalculates the routes accordingly. The population at risk can be notified using the mobile assistant. The mobile assistant can safely navigate people when issued a tsunami warning. The safe location is determined based on the current location and the remaining capacity. The evacuation process can be simulated using the agent-based environment. The simulation might help determine possible evacuation problems and prepare for various modalities.
The basic scenario of using the solution is divided into planning that is done before the tsunami event and the response phase performed at the onset of the tsunami strike. During the planning, the solution enables the authorities to set geographic context i.e., the area of interest and also the shelter locations or centers with high concentration of people in advance. The data exploration is also performed prior to a tsunami event. The data exploration can be used for parametrized evacuation simulation and prepare several evacuation scenarios, for example, tsunamis with different wave heights or tsunami origins during the planning phase. In the response phase, i.e., in case of a tsunami event, the warning information from national warning centres is gathered so that the tsunami can be simulated and an appropriate evacuation scenario can be selected. The necessary information can be disseminated using the notification functionality. The application layer components are further elaborated in Section 4.
The National Oceanic and Atmospheric Administration (NOAA) provides timely warnings and information about tsunamigenic earthquakes through the online U.S. Tsunami Warning System. The specialised data feeds can be monitored for updates. The application requests the data, especially to locate the origin of the tsunami. Further data can also be utilised for estimating the tsunami wave parameters.
The computational fluid dynamics (CFD) cloud is used to estimate the tsunami wave parameters, such as travel time and wave heights. The tsunami wave parameters are often computed using the non-linear shallow water equation, Navier–Stokes or Reynolds-averaged Navier–Stokes solvers and other derived techniques. The use of such techniques assumes appropriate data about the tsunami origin and weather conditions, as well as the bathymetry of the coastline. Similarly, most of the techniques are rather complicated and require specific knowledge and experience in the field of CFD. Hence, the application assumes such computation will be performed by third-party services and computational packages. The specific tsunami computational models would simulate several scenarios and assign probabilities and confidence intervals to the tsunami parameters. The obtained results would then be used by the local authorities to determine several tsunami inundation scenarios while incorporating the specific condition of the coastline (such as seawalls, breakwater blocks, buildings along the coast, etc.).
During the evacuation, people who are stressed and panicking might behave rather irrationally and impulsively. Such behaviour might hinder evacuation and increase the risk of unnecessary mistakes and injuries. Similarly, the coordination between onsite response personnel might be difficult to practice in live drills. The agent-based technology allows the simulation of complicated non-linear processes with many types of agents. Previously, the agent simulation has been successfully used for modelling evacuation processes in many situations. Thus, the application provides the export of evacuation routes from endangered locations to a safe location. The routes can be imported into agent-based simulation environments and the evacuation process can be simulated under different input parameters. Due to considerable uncertainty in predicting the tsunami impact and human behaviour, the simulations might help the decision makers to plan the response actions with different scenarios.
The uncertainty inherent to tsunami risk and mitigation planning can be reduced by data exploration and machine learning approaches. The data analyses can find similar situations or corresponding cases by comparing a number of attributes. The local administration can use the previous cases and machine learning approaches to predict given tsunami variables of interest and determine the scale of the potential hazard. The present solution is based on the statistical packages and data analytic methods in R language hosted by RServer. The data exploration component is further elaborated in Section 5.
The map display, location and navigation functionality are based mainly on the Google Map Platform. The Google Map Platform provides a rich and reliable API (application programming interface) to access accurate geographical data and render the data visually. The Google platform also offers directional services that provide navigation information. The directional services find the shortest path between points when given a specific mode of transport, such as driving or walking. The application calculates the shortest paths for all endangered and safe locations. This way, the closest safe location is determined for each endangered location. The access to Google’s API is billed based on the number of requests. Due to the potentially large number of requests generated by the application, alternative mapping platforms might also be considered.
The communication between the dashboard and the assistant is provided through the specialised web server deployed on Internet information services (IIS). The dashboard and the assistant exchange data with asynchronous calls to the web server based on AJAX (asynchronous JavaScript and XML) principles. Therefore, the page does not need to be reloaded for data updates. Instead of XML (extensible markup language), JSON (JavaScript object notation) is used as a data exchange format.
Both the tsunami emergency dashboard and assistant were developed as JavaScript web applications. The user interface utilises the bootstrap front-end toolkit to ensure the responsive design and fit to screens of different sizes. The application as a whole is still under development and new features are incorporated based on discussions with stakeholders.

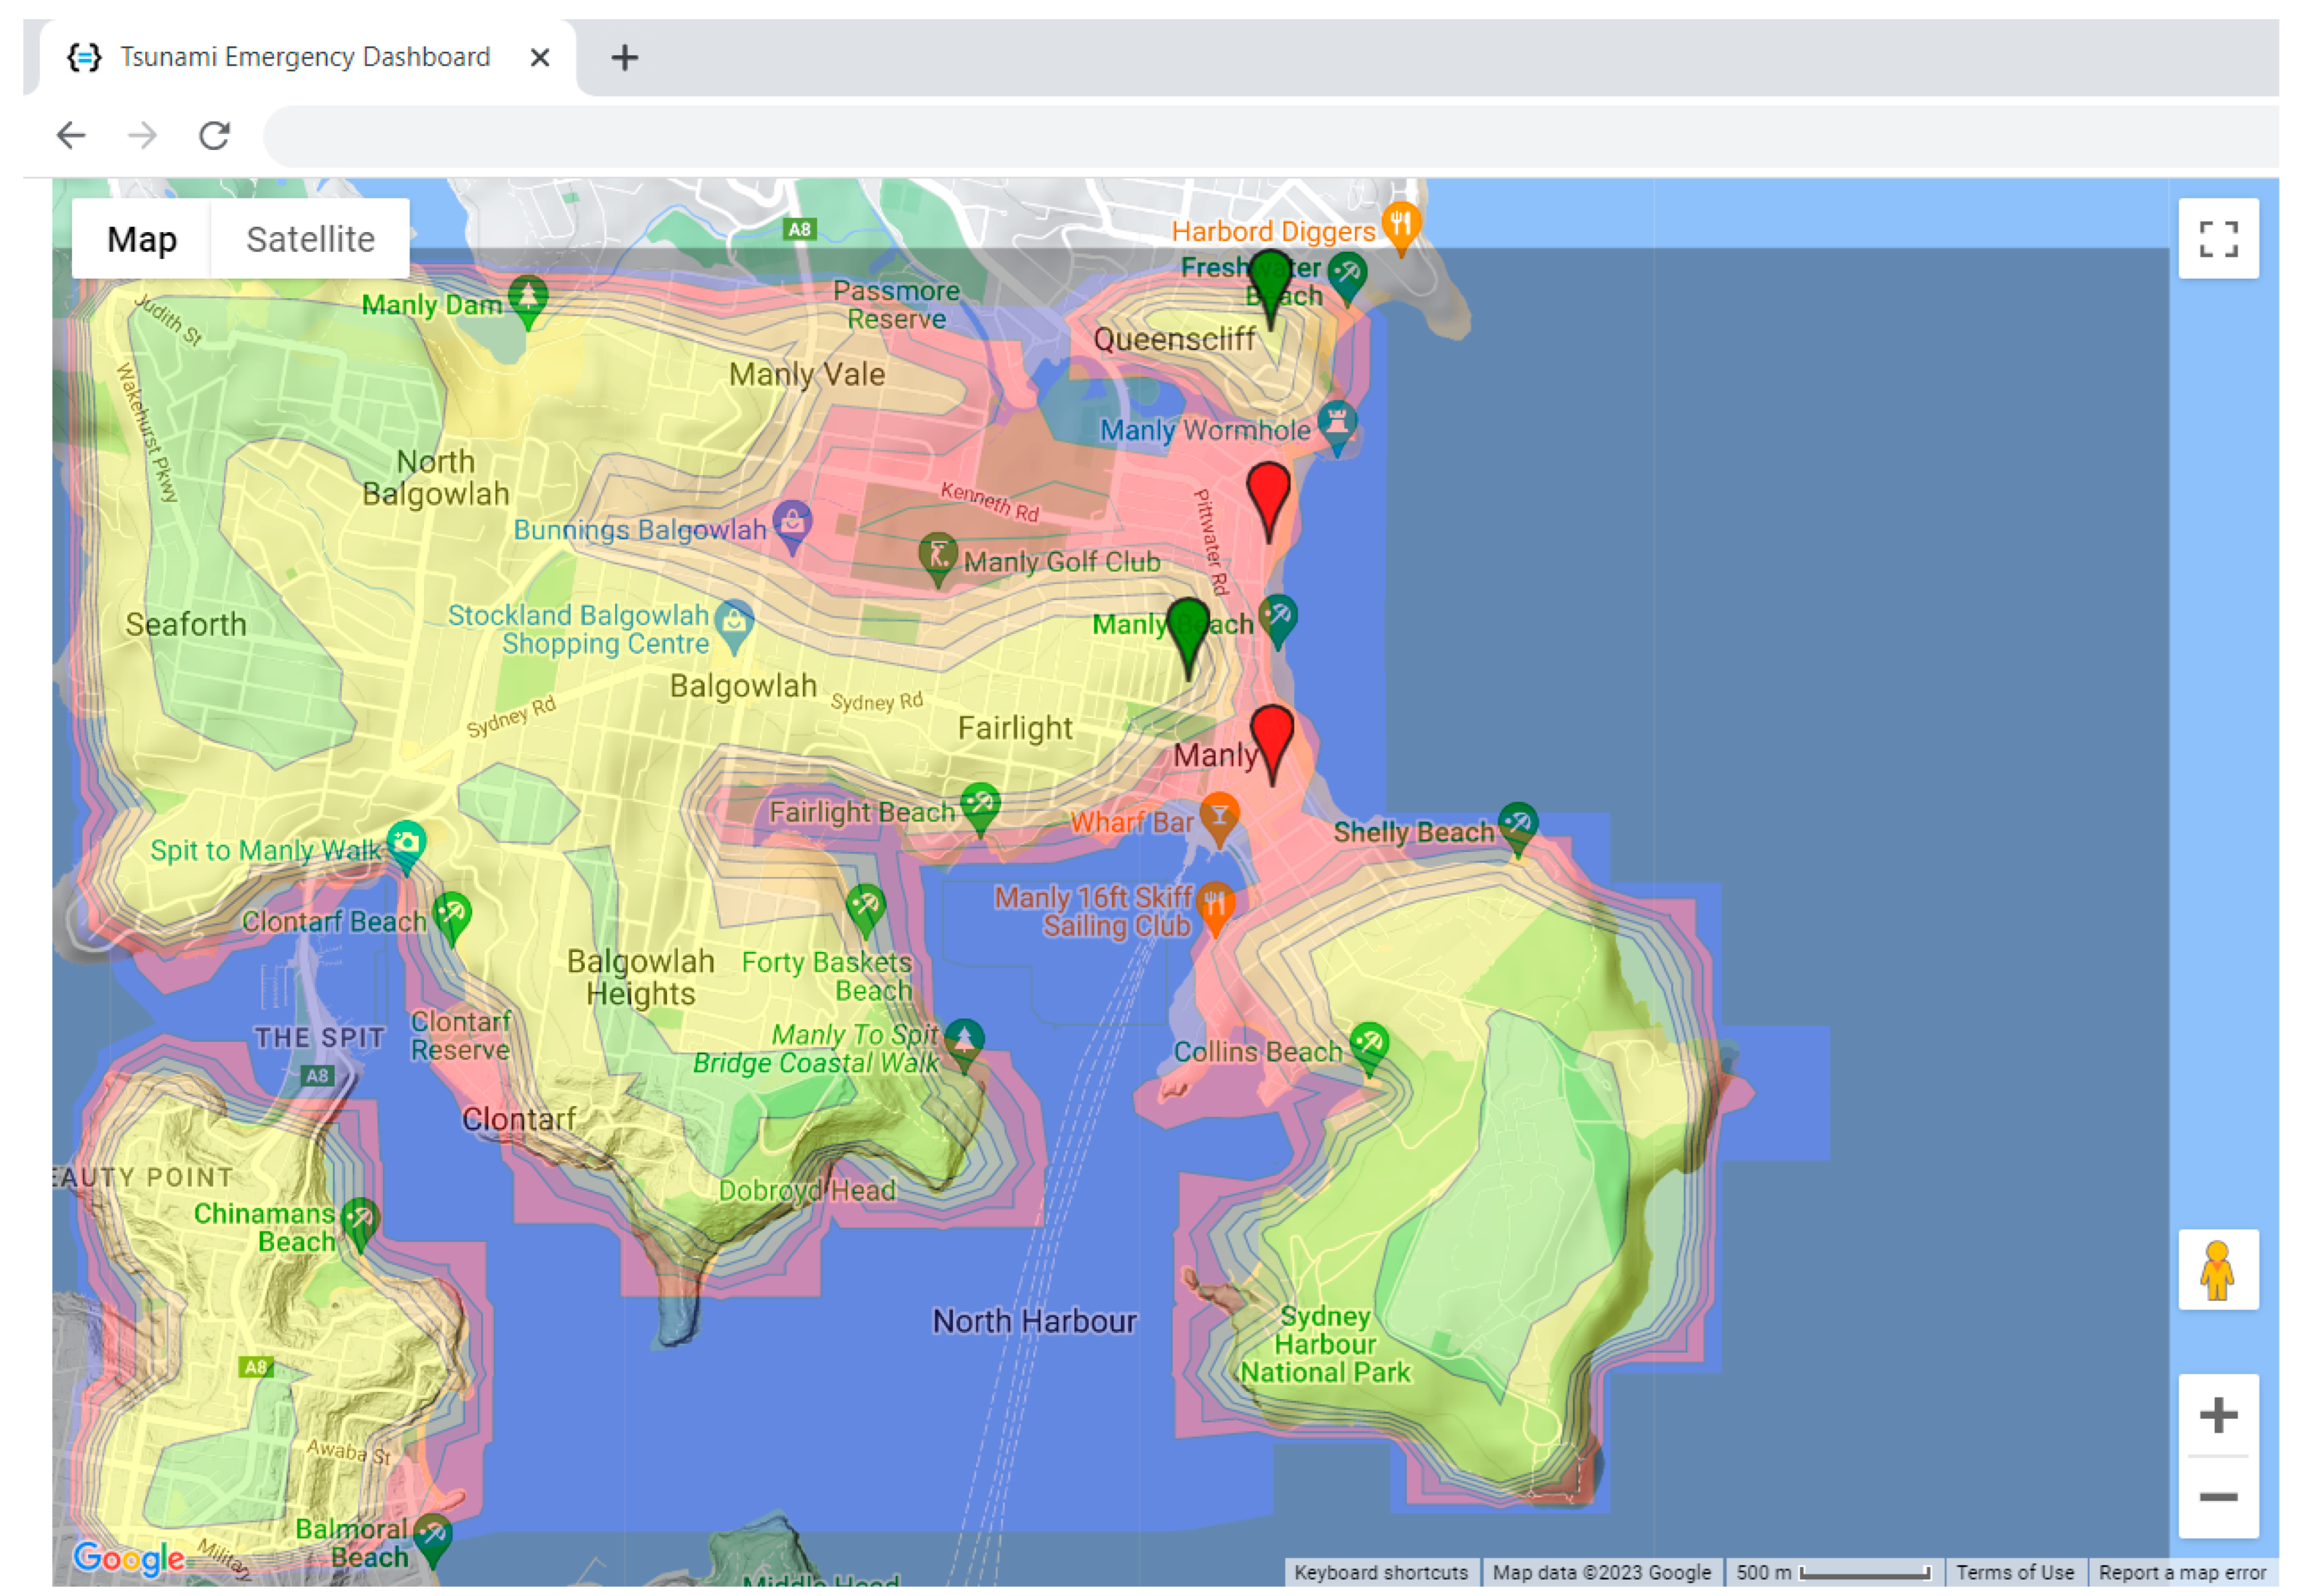
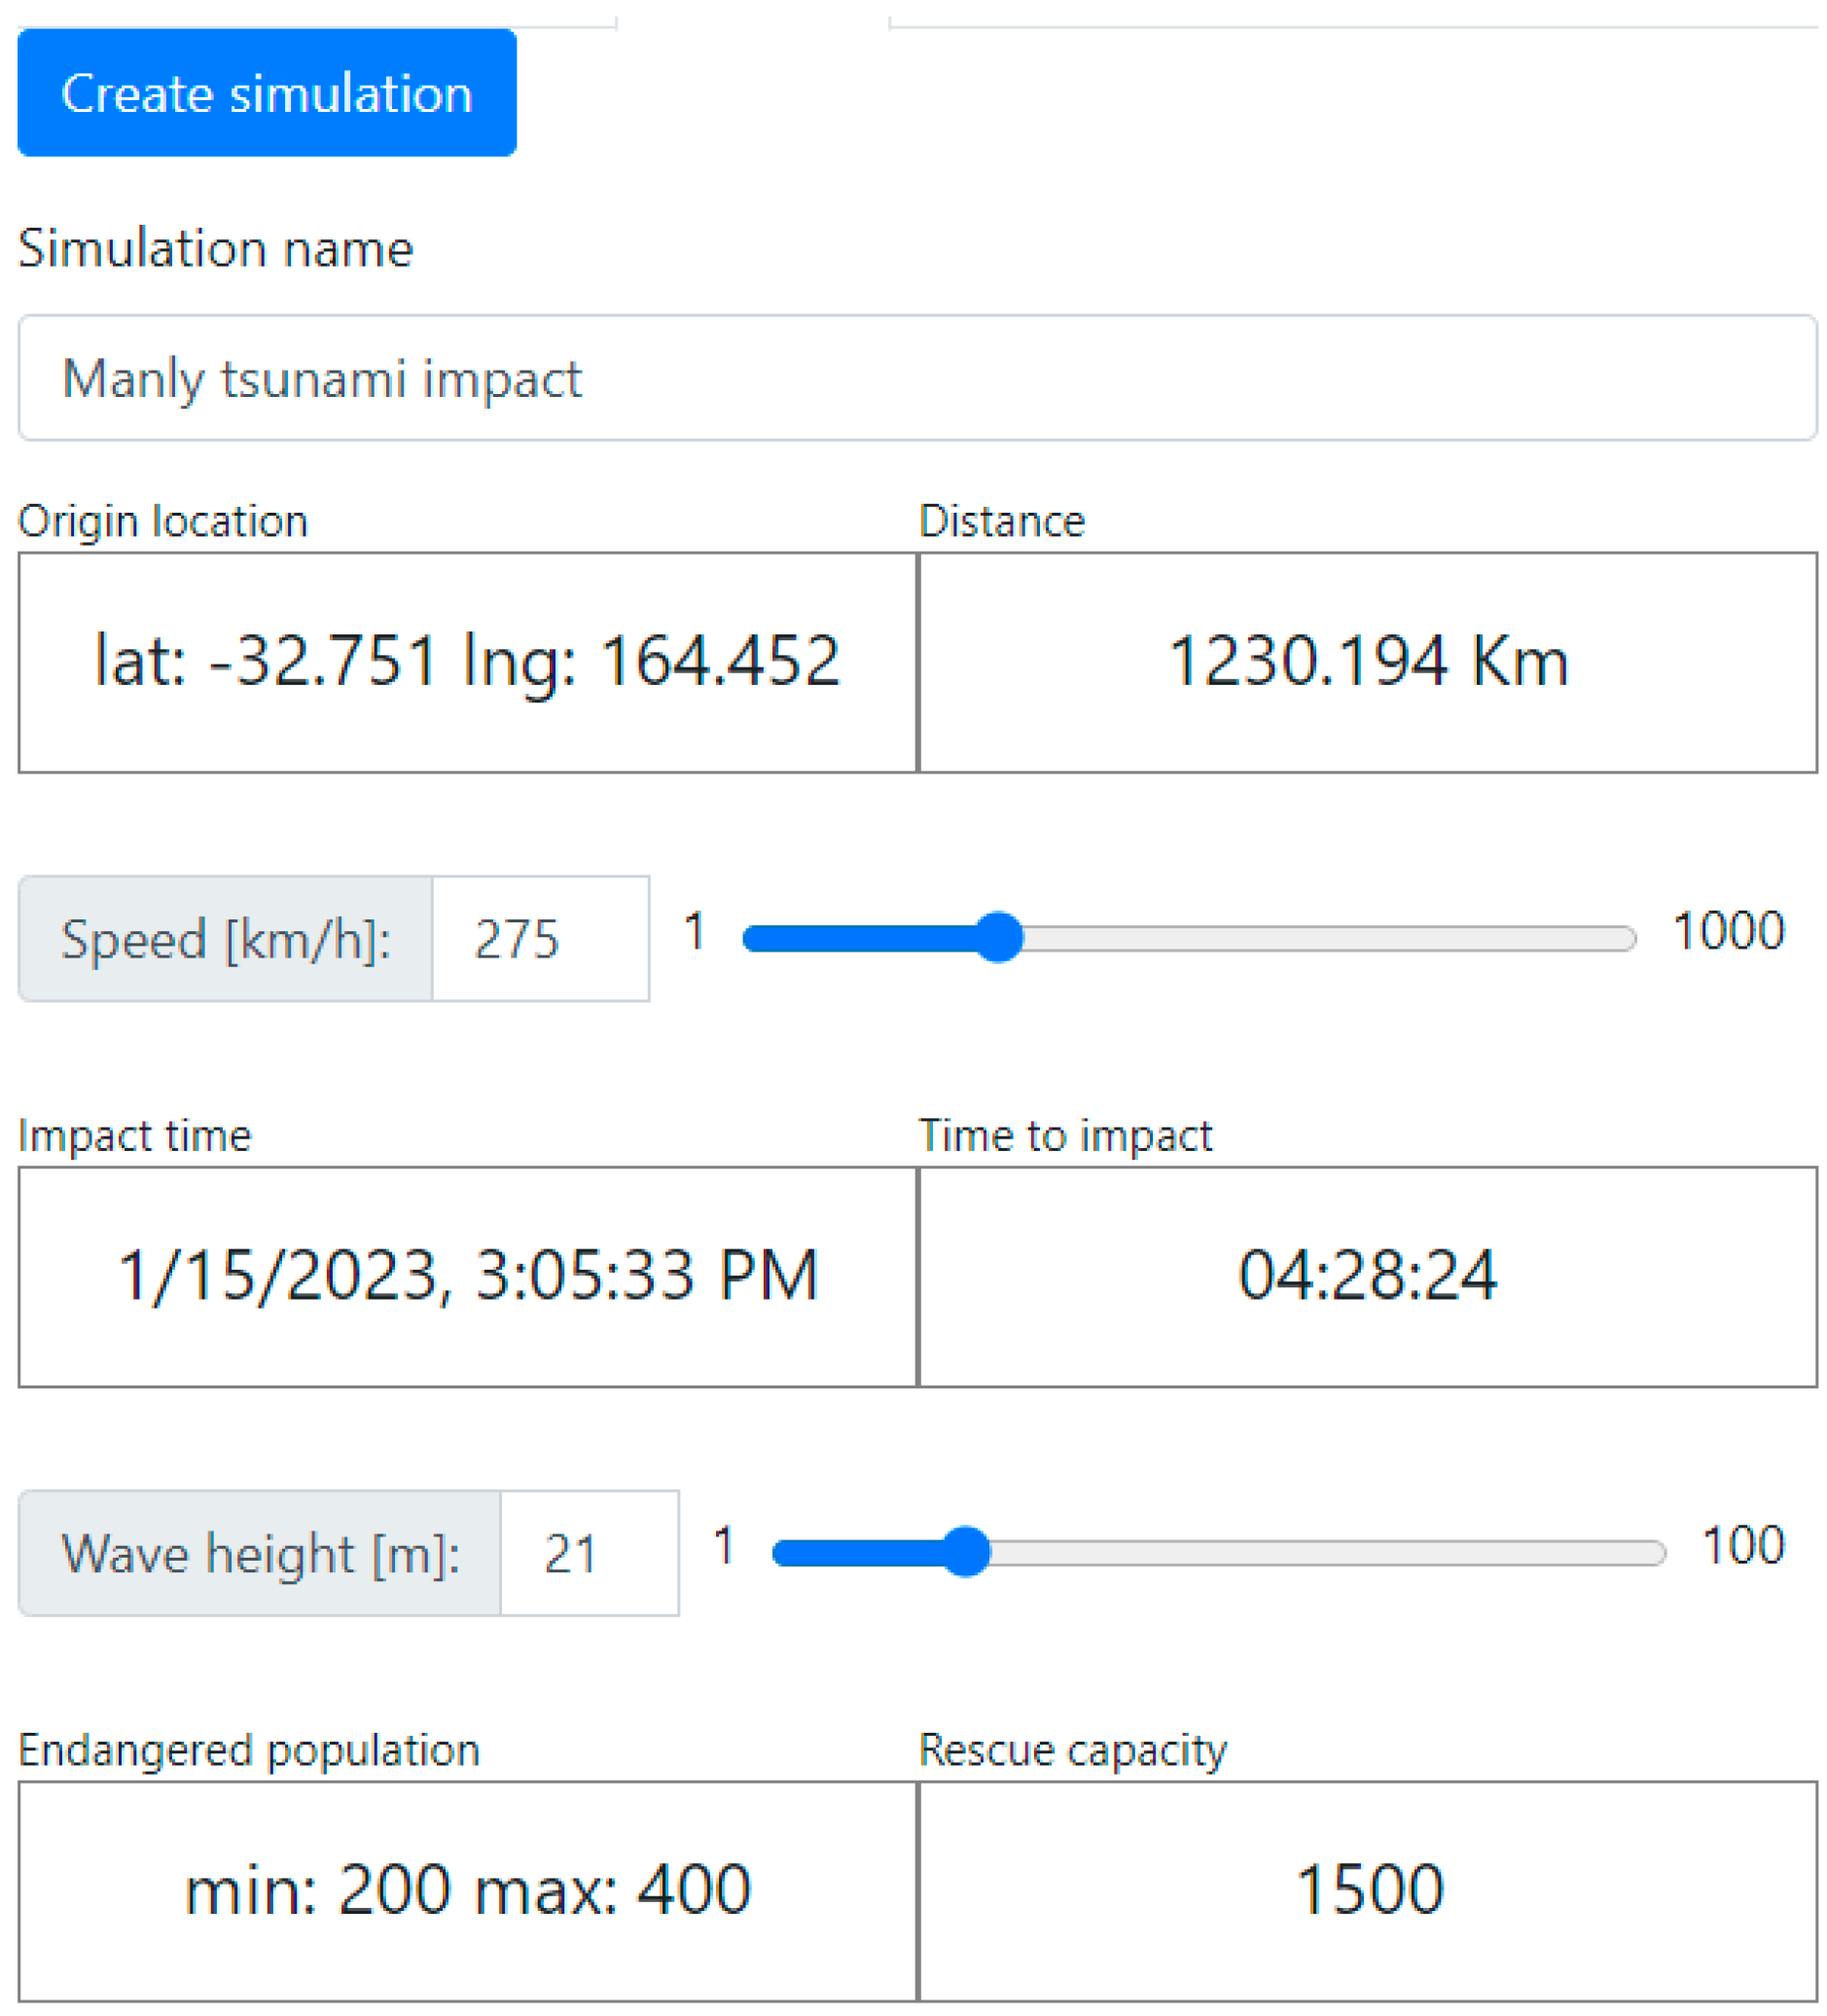
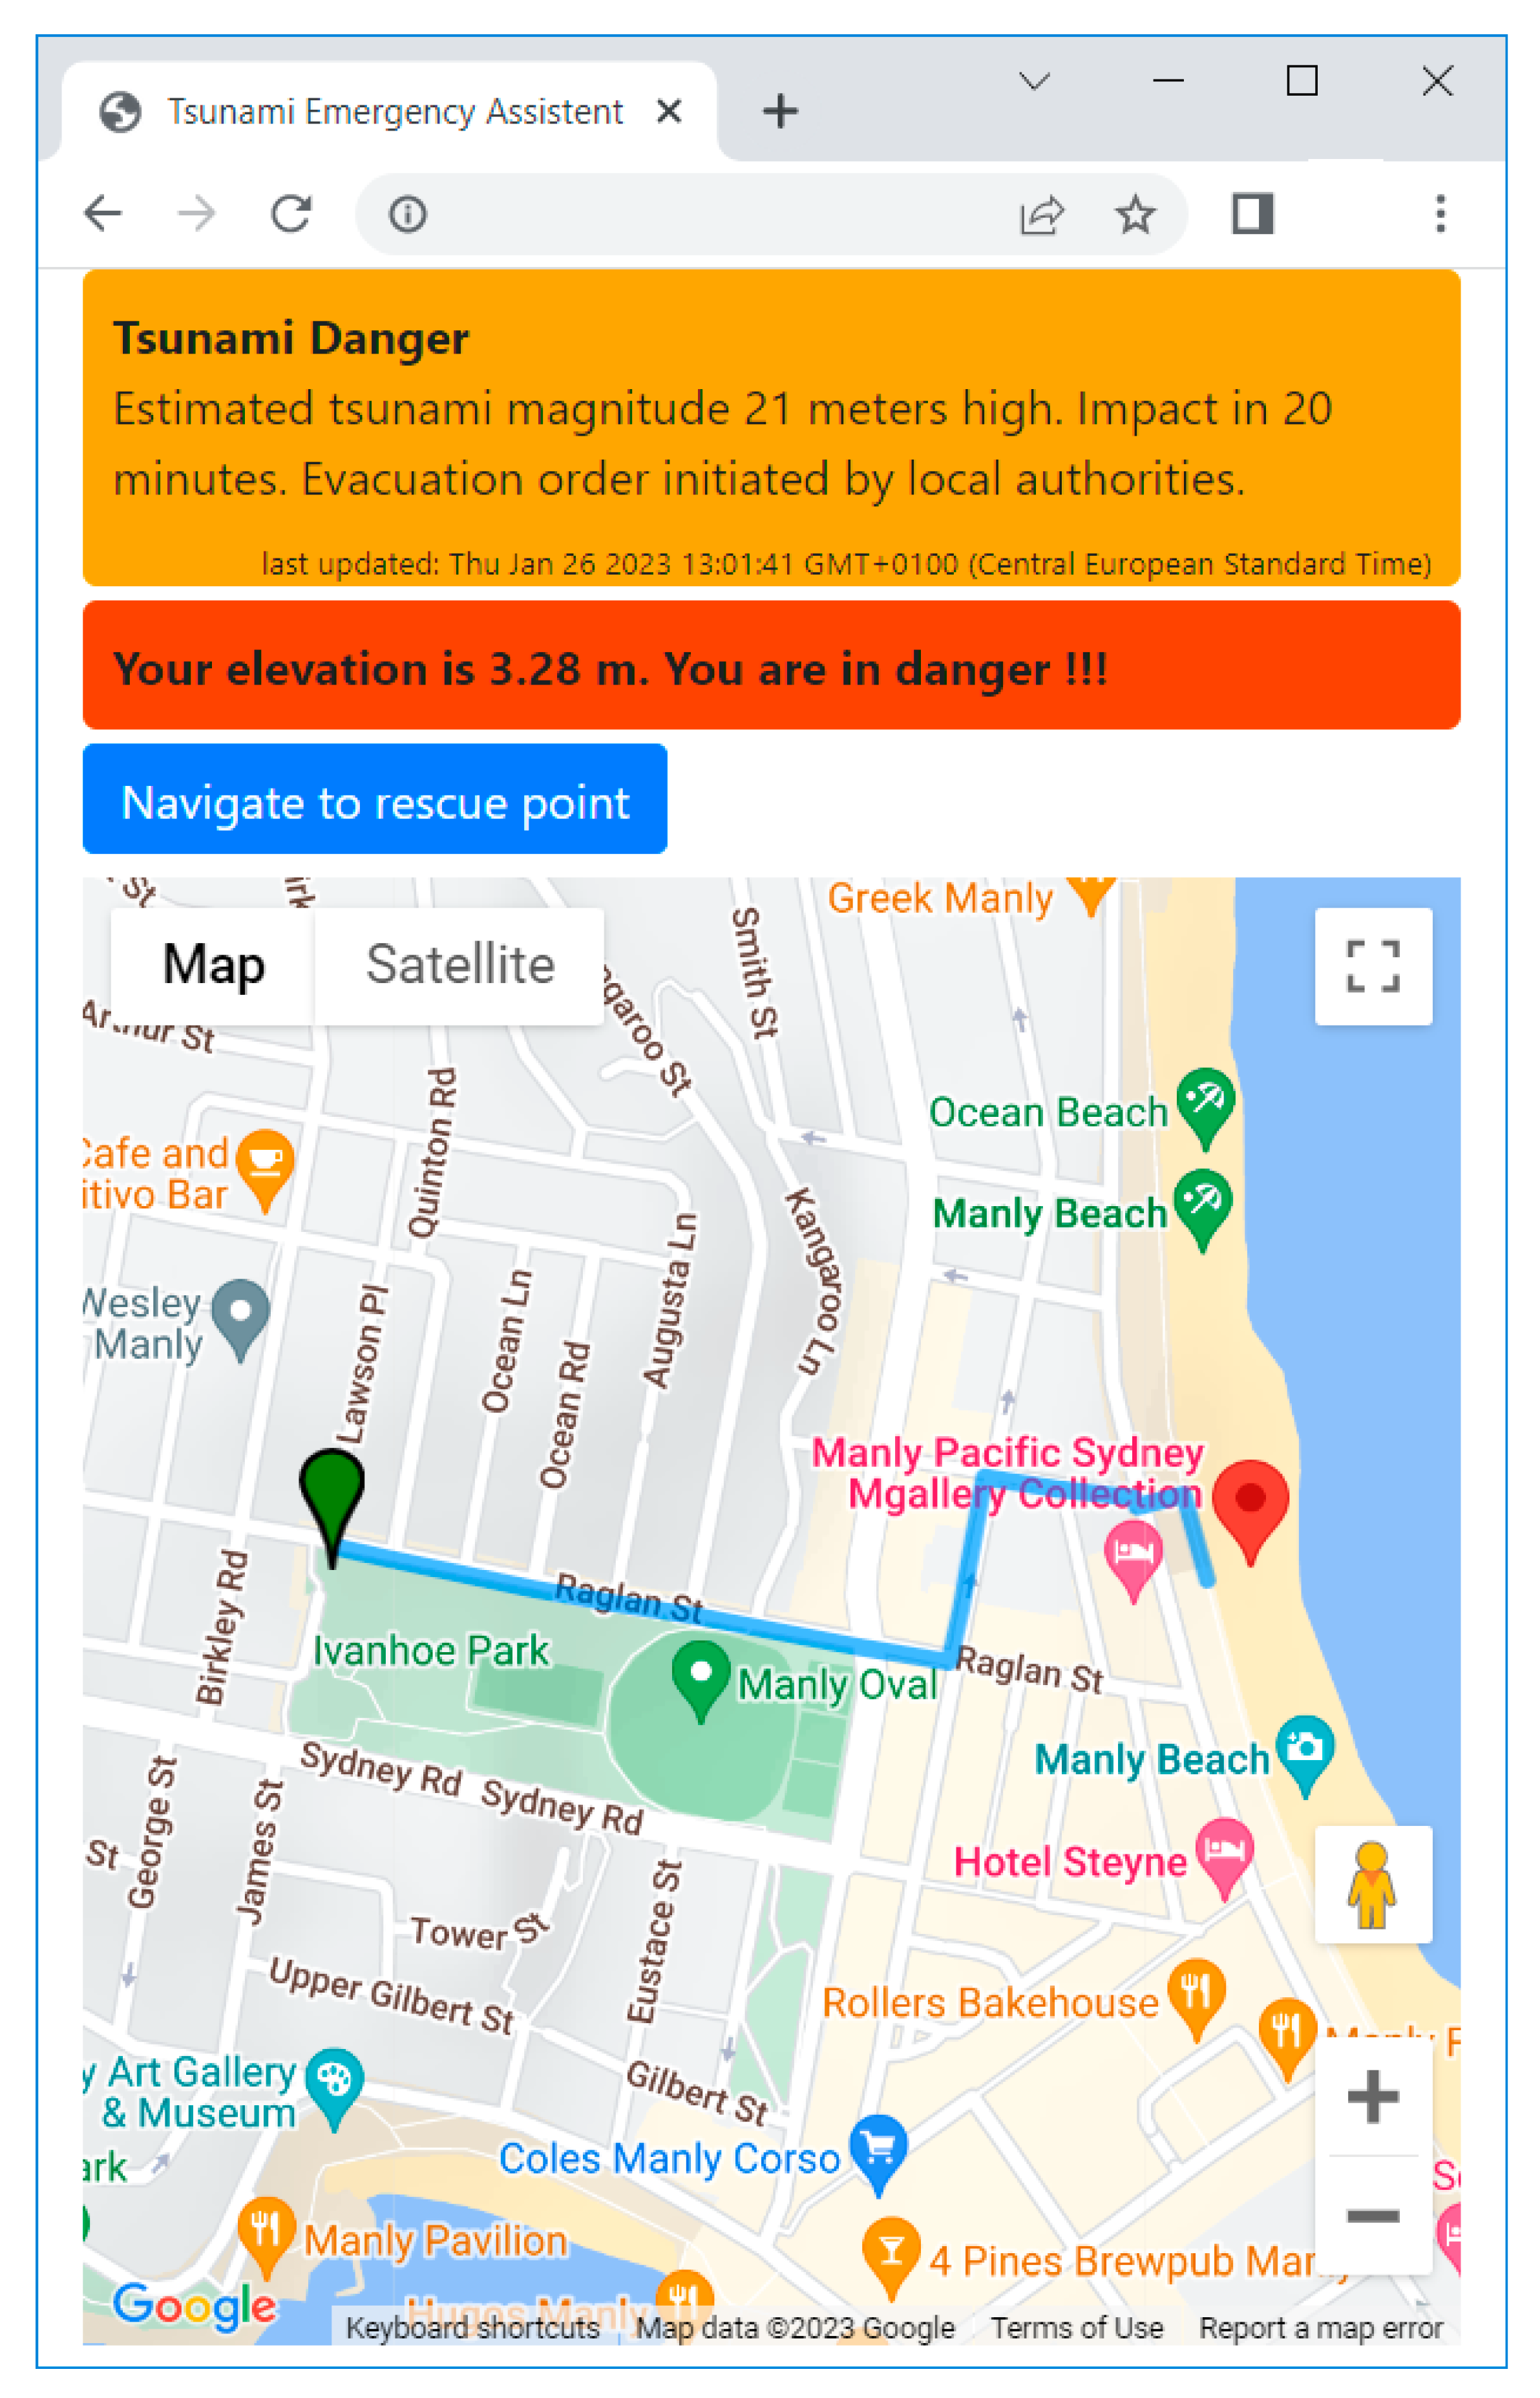
4. Application Components

The tsunami emergency dashboard includes the map and parameters setting controls (see Figure 2 and Figure 3). The map part contains the overlayed Google map control and shows the target area with defined locations (larger green and red location icons). The locations represent places with a high concentration of people, such as supermarkets, stadiums, theatres, stations, etc., requiring special attention when planning the tsunami response actions. Each location is attributed with an approximate number of people given by a min–max range and capacity in case the location is used as an evacuation point. The colour of the icon is based on the elevation above sea level and the estimated wave height. The red colour denotes locations that should be evacuated. The green colour is used for the evacuation points that are elevated enough with respect to the estimated tsunami wave height. The application allows for adjusting the estimated wave height, which renders locations to turn dynamically into a given colour. The approximate number of endangered people is also calculated accordingly, together with the capacity of the evacuation points. The coloured contour overlay of the map is produced based on the elevation above sea level. The contours are colour-coded from red to green. The red areas are the most vulnerable to tsunami impact. The green are safe from a tsunami of the estimated height. Figure 2 shows the Manly suburb in Sydney, Australia. The tsunami emergency application allows for easy implementation to other regions as well.
The parameter setting controls (Figure 3) are used to specify locations and tsunami parameters. The particular locations are added and edited using the map control. The locations can be identified and entered into the application prior to the simulations based on local knowledge of public places with a high concentration of citizens. The location coordinates and elevation data are obtained using the Google Map services. The tsunami origin can be retrieved from the NOAA warning service or set using the map control or even manually specifying the latitude and longitude coordinates. The application assumes that the height and speed of the tsunami is known. The tsunami wave details are estimated by deploying third-party computation engines and supplied through the CFD cloud component. The calculated wave parameters serve only as a rough estimate and can be further adjusted manually using the sliders. The estimated parameters are used to calculate the time to impact and determine the locations in danger. Correspondingly, the number of people in danger is inferred together with the capacity in locations that remain above the estimated wave height. The dashboard allows the response personnel to notify people that are in danger. The notification is received through the tsunami emergency assistant mobile application. The notification data contains the message, impact time, estimated wave height and safe location information.
The tsunami emergency assistant is a mobile application aimed to assist people in danger of a tsunami, i.e., people in the area likely to be struck by a tsunami wave. The application is used mainly to notify and inform people about imminent danger, inform them about their situation, especially their position and elevation, and possibly navigate them to a safe place. The notification received is based on data sent through the dashboard’s notification-sending function. The application follows the four levels of tsunami alerts: warning, advisory, watch and information statement, which are based on NOAA tsunami message definitions [28]. In case of a tsunami warning and watch, the application verifies the user’s position and retrieves the elevation at the current position. If the position is in the evacuation area, the application provides navigation to the nearest safe place specified by local authorities in the dashboard. The assistant application updates the notification and safe places regularly. Thus, the safe place determination can be coordinated with the onsite response teams. This should prevent crowds from panicking to block certain pathways or exceed the capacity of a given safe place. The user interface of the tsunami emergency assistant is shown in Figure 4. The upper part of the screen is used for notifications. Below the notification area is the area for personalised information, especially the elevation at the current position. The current position is also shown in the map using the red icon. The map also displays the safe places (green icon) as determined by the local authorities. The route to the nearest safe place is calculated upon request, and the path is rendered on the map as the blue coloured line.
The tsunami emergency assistant is currently a browser-based application that can be accessed by following a link or setting the web address. The application does not need to be installed and can be used with any modern browser that provides location services. The user should grant permission to use the location information to the browser for the application to determine the current position properly. The browser-based application serves mainly as a prototype for verification of the basic functionality. Due to browser-based applications being limited in exploiting specific features of the user’s device, native versions for the mainstream operating systems are also considered.

5. Data Exploration and Machine Learning

Data exploration and machine learning techniques can bring added value in investigating and analysing natural disasters. Tsunami predictions are frequently based on the evaluation of earthquake parameters. However, an earthquake is a complex process that can have different impacts on tsunami waves. The research study proposed by An et al. [29] is focused on the analysis (predictions) of the three well-documented tsunamis (Tohoku (2011), Iquique (2014) and Illapel (2015)) using the optimum uniform slip models. Research leads to more accurate predictions of tsunami events. Interesting results were presented by Mulia et al. in [30]. A deep learning-based model was used for prediction of the inundation heights due to the tsunami disaster occurrence. Several scenarios of earthquakes along the Japan Trench were used for tsunami simulations. The predictions were compared against observations coming from two locations in Japan that are close to each other—Rikuzentakata and Otsuchi—where tsunamis occurred in the past. Their approach leads to comparable results, which are received by standard deterministic simulations with less computing time.
Liu et al. [31] also applied the machine learning-based approach to tsunami investigation. Machine learning models used a support vector machine (SVM) algorithm and two deep convolutional neural networks to forecast tsunami amplitudes. The Salish Sea was a target location for tsunami forecasts in this case study. The interconnection between machine learning-based modelling and tsunami predictions brings added value to the development of early warning systems.

5.1. Data Exploration Component

The data exploration component followed the hierarchy of the CRISP-DM methodology. The navigation menu of the first level represents the phases of the mentioned methodology. In the main part of each of the tabs, there are successively different side panels or navigation menus of other levels, thanks to which a higher clarity of the user interface is ensured. These sections then contain all the prepared functionalities. In general, the meaning of the tabs is as follows:
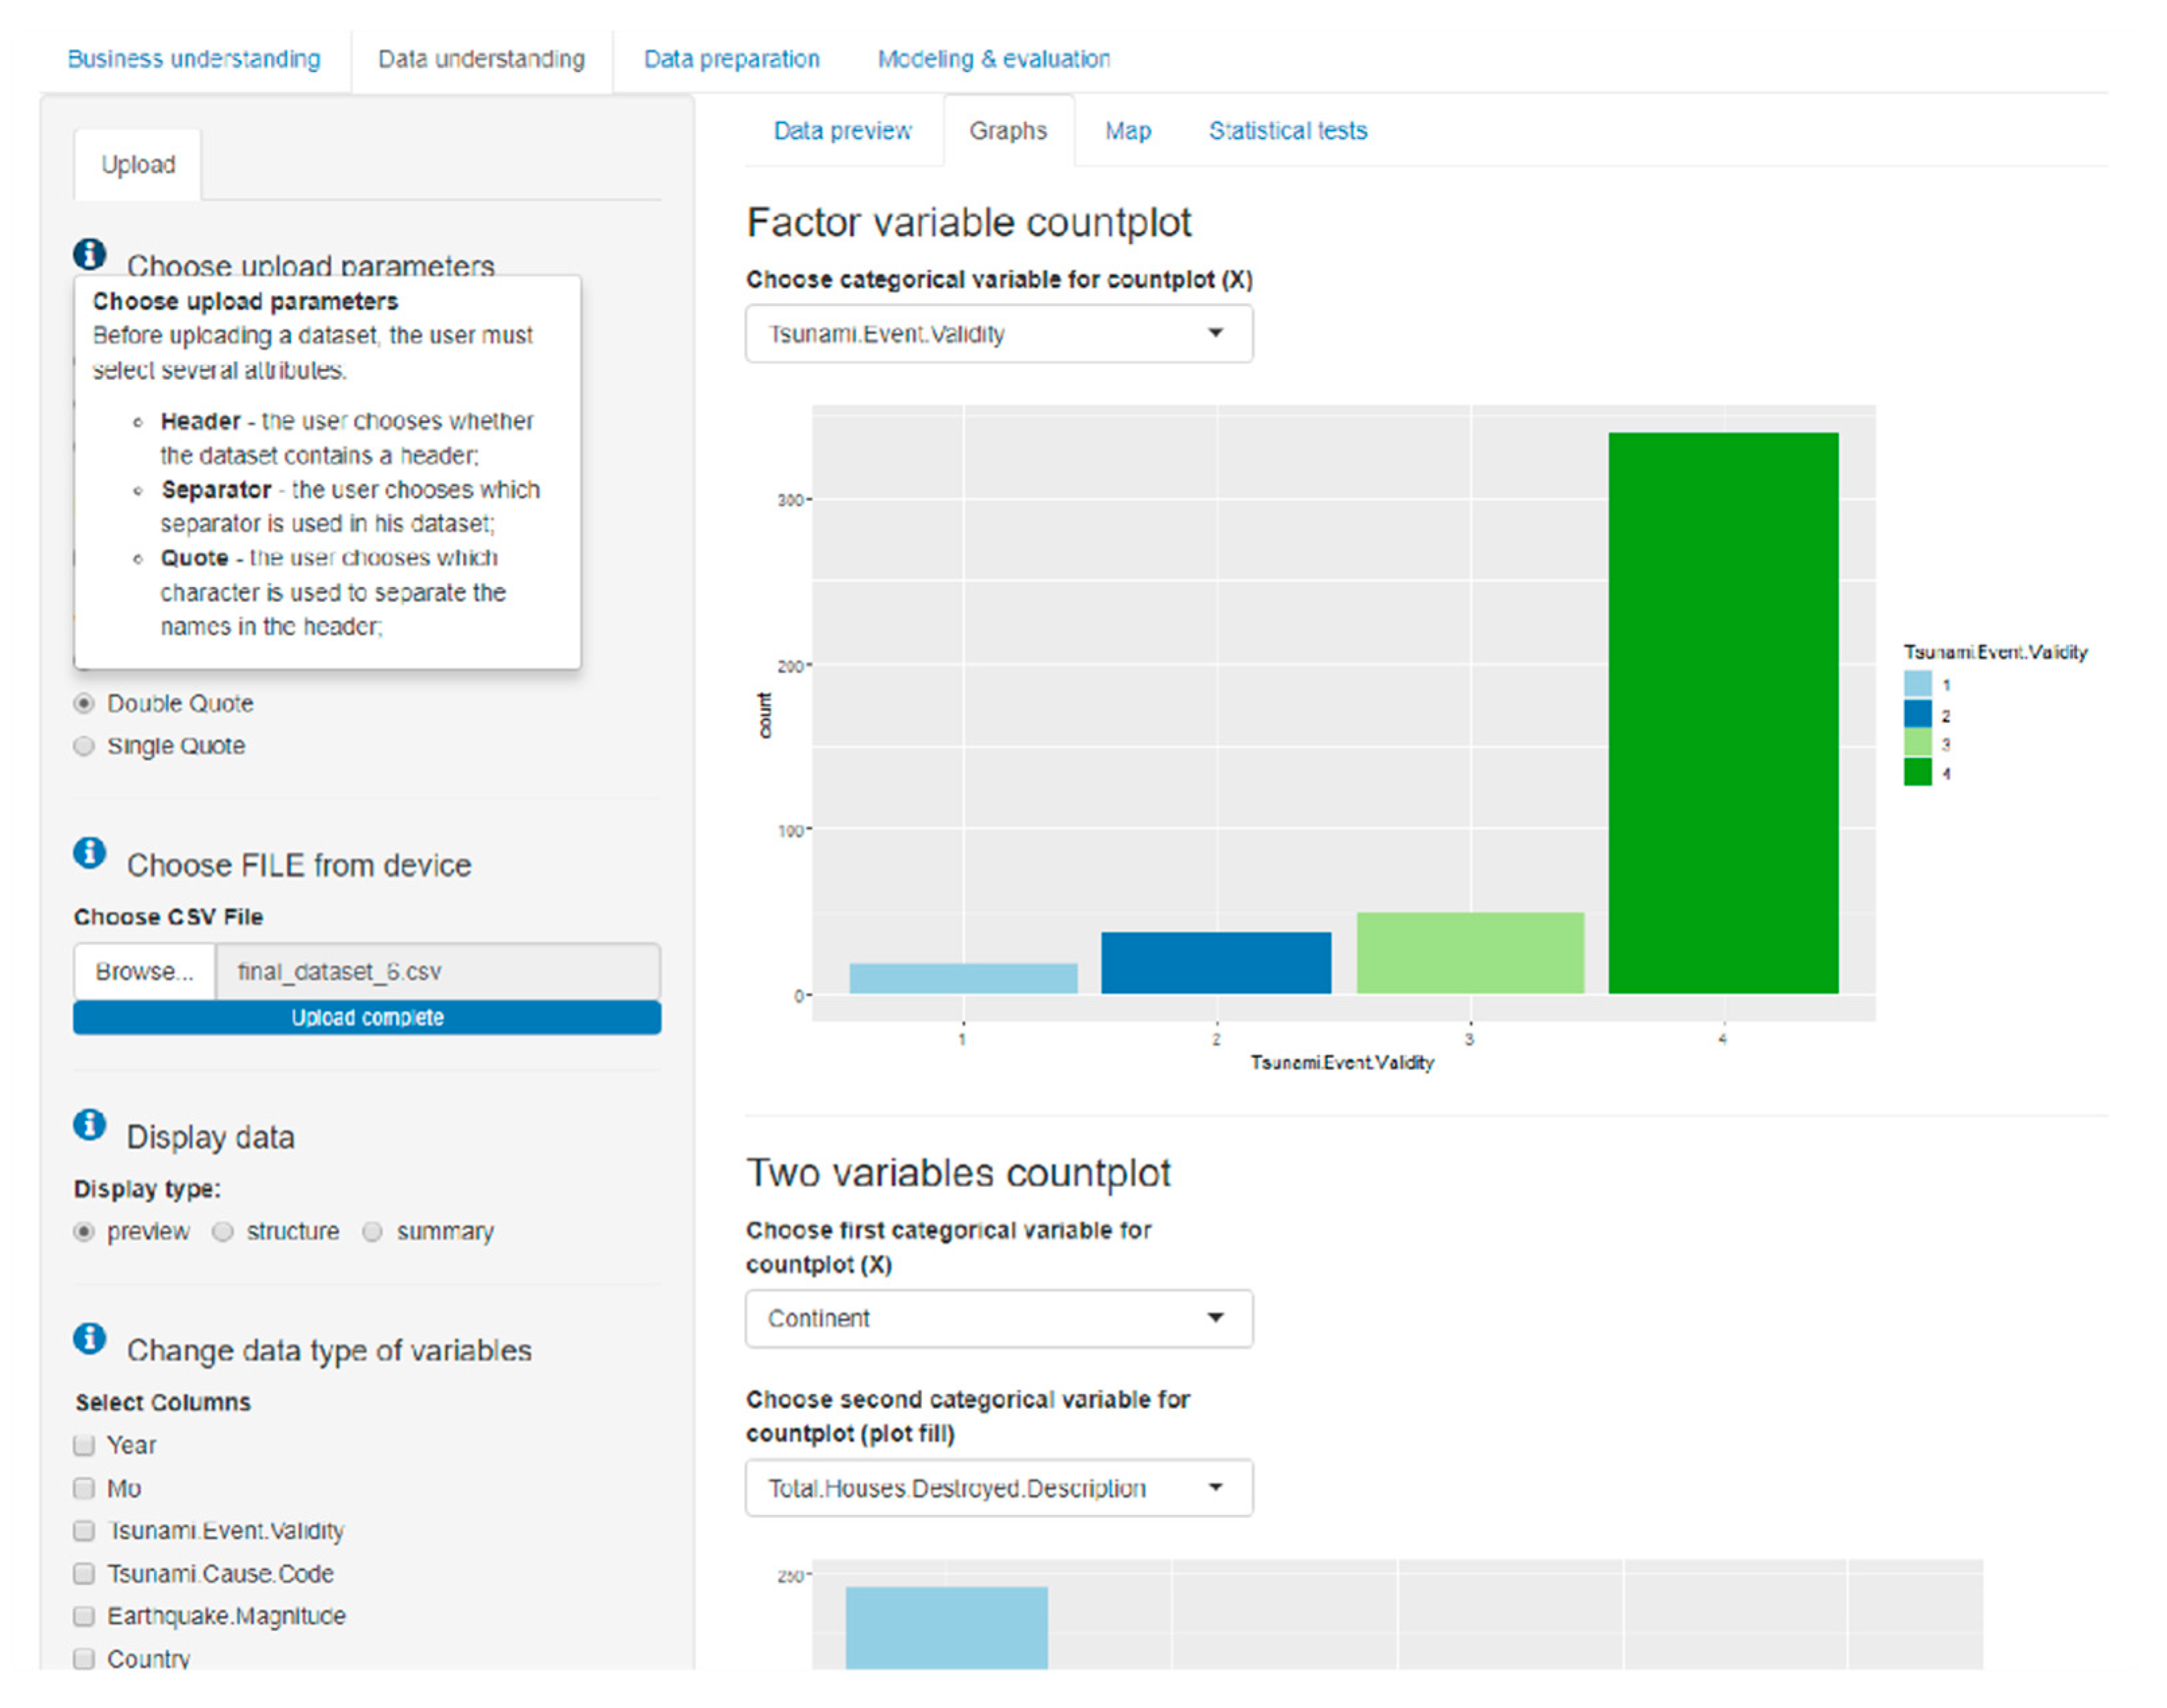
  • Business understanding: The tab is used to explain the issue under investigation. If the user is familiar with tsunami issues, the card also serves to unify the application terminology with the terminology experienced by the user.
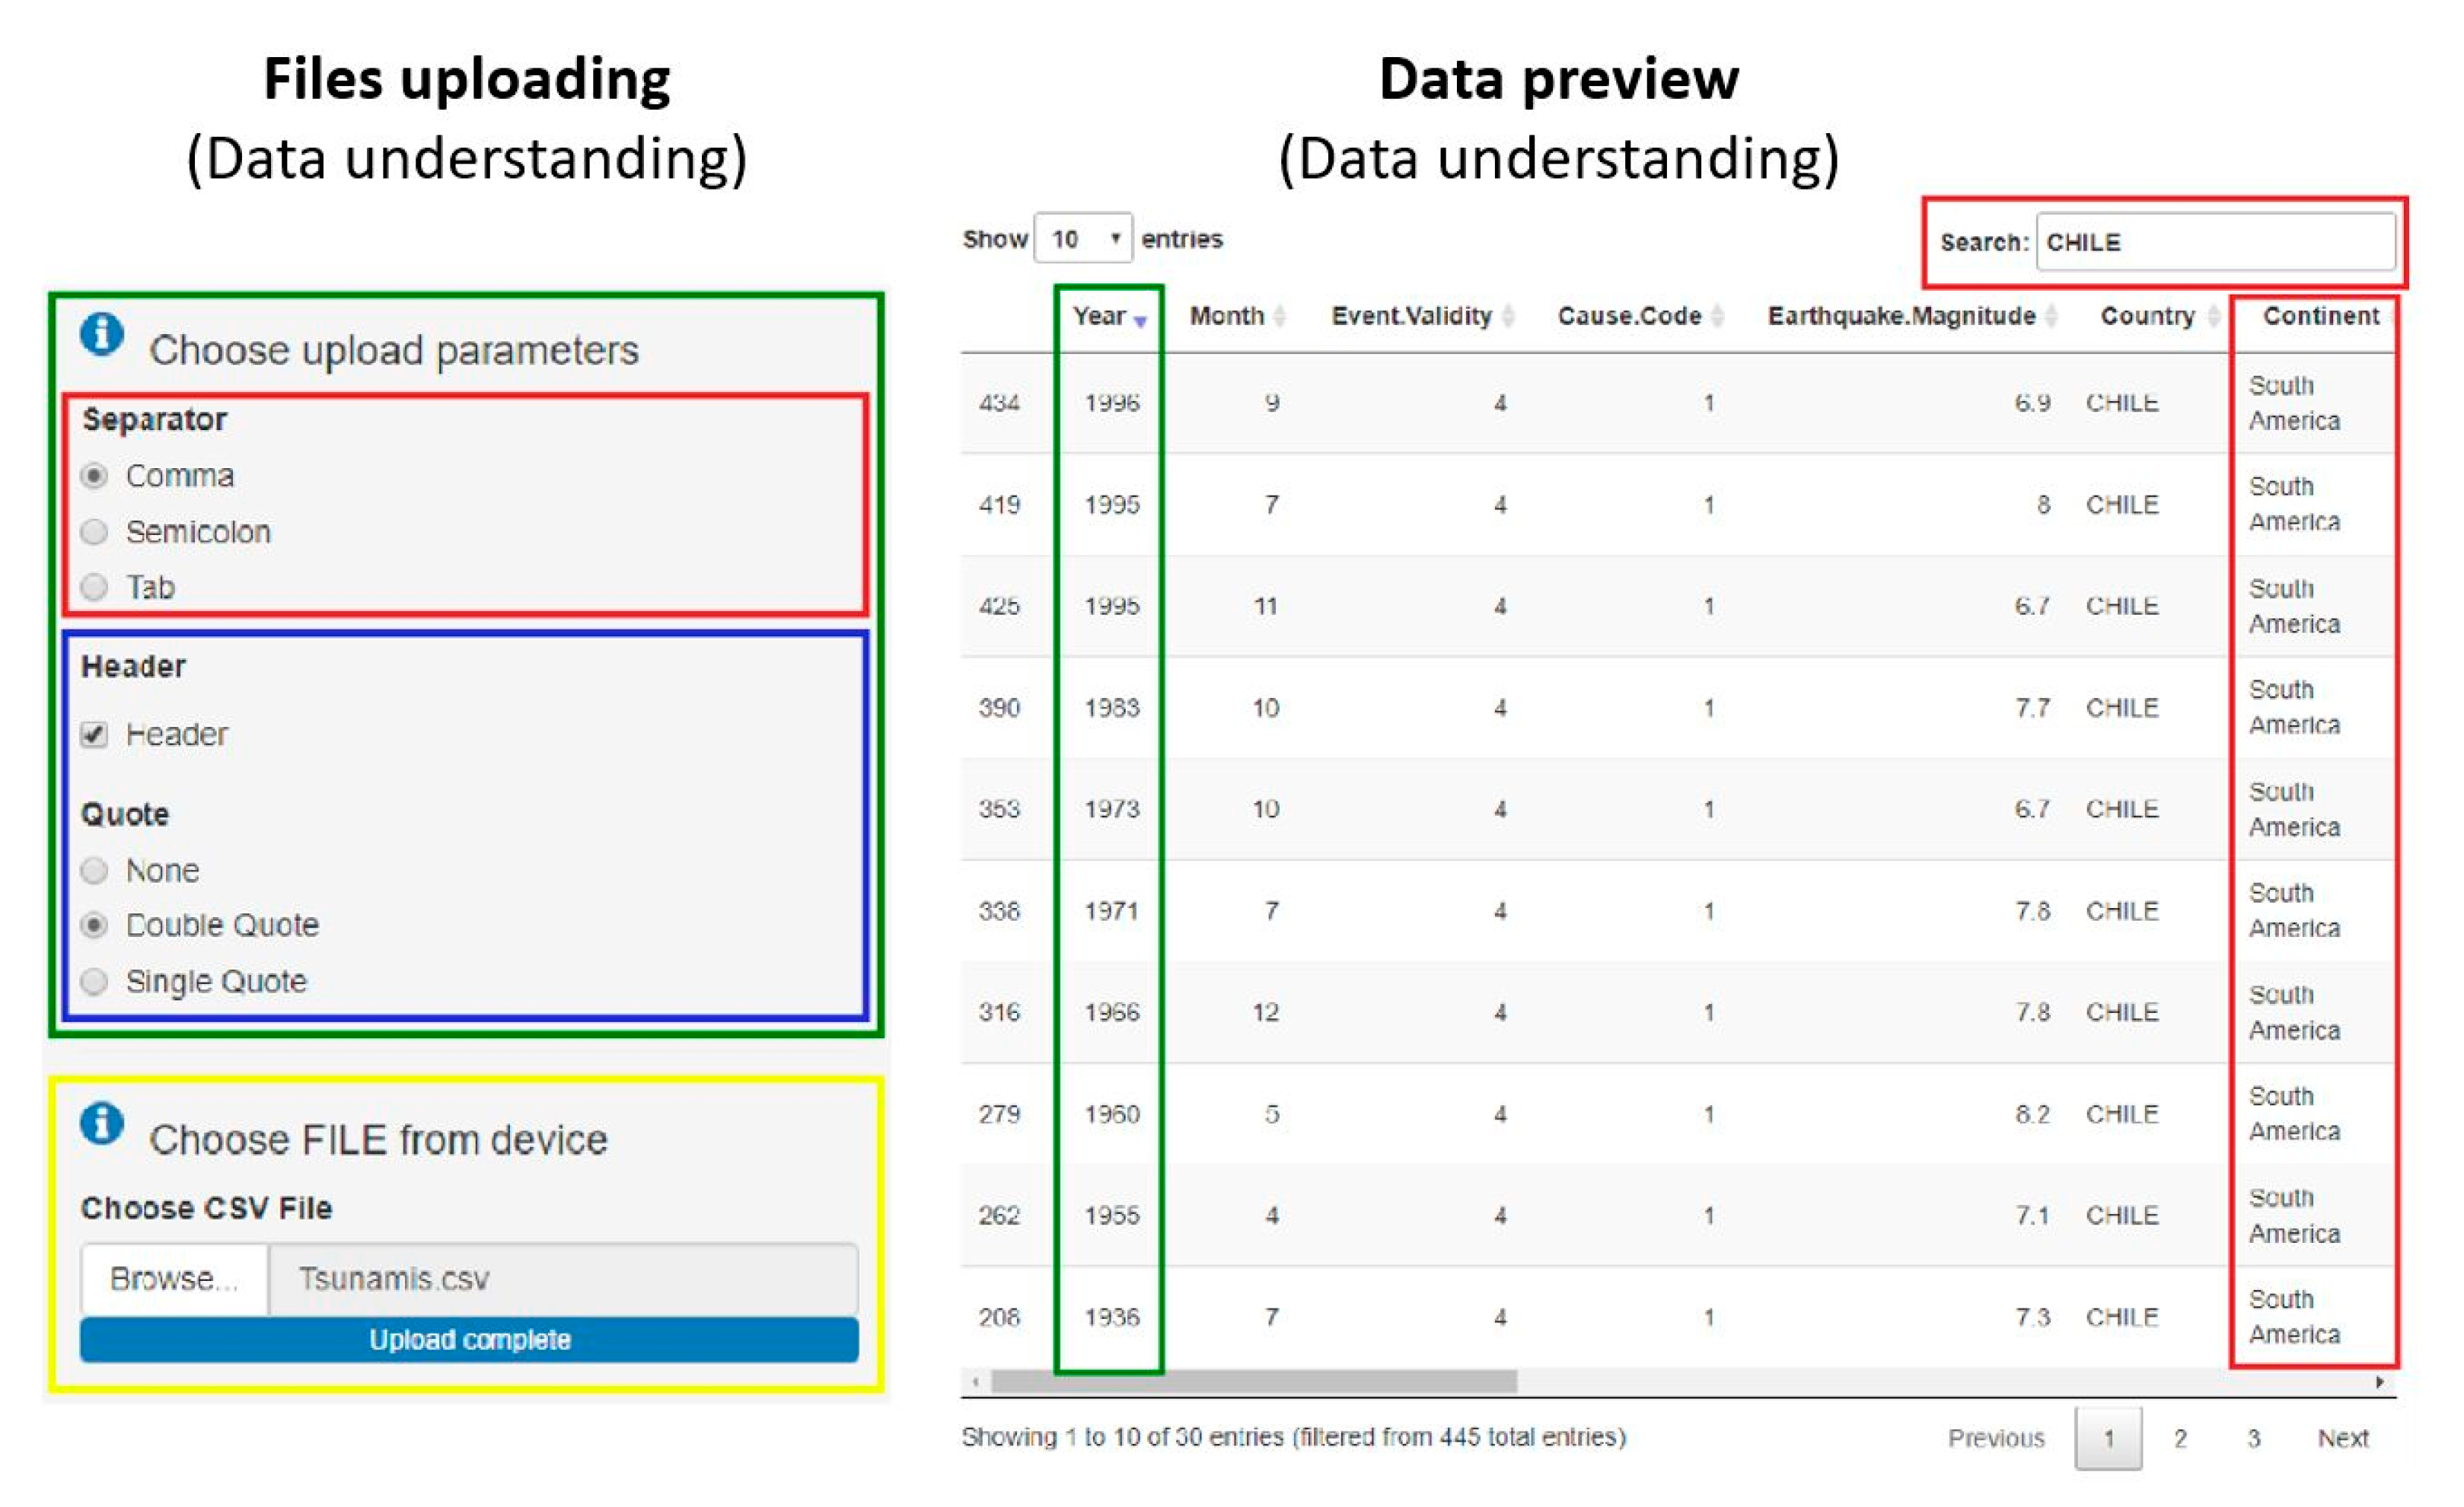
  • Data understanding: The tab offers resources for understanding the data itself or visualising data in the form of a graph, table or map. Data can also be uploaded here.
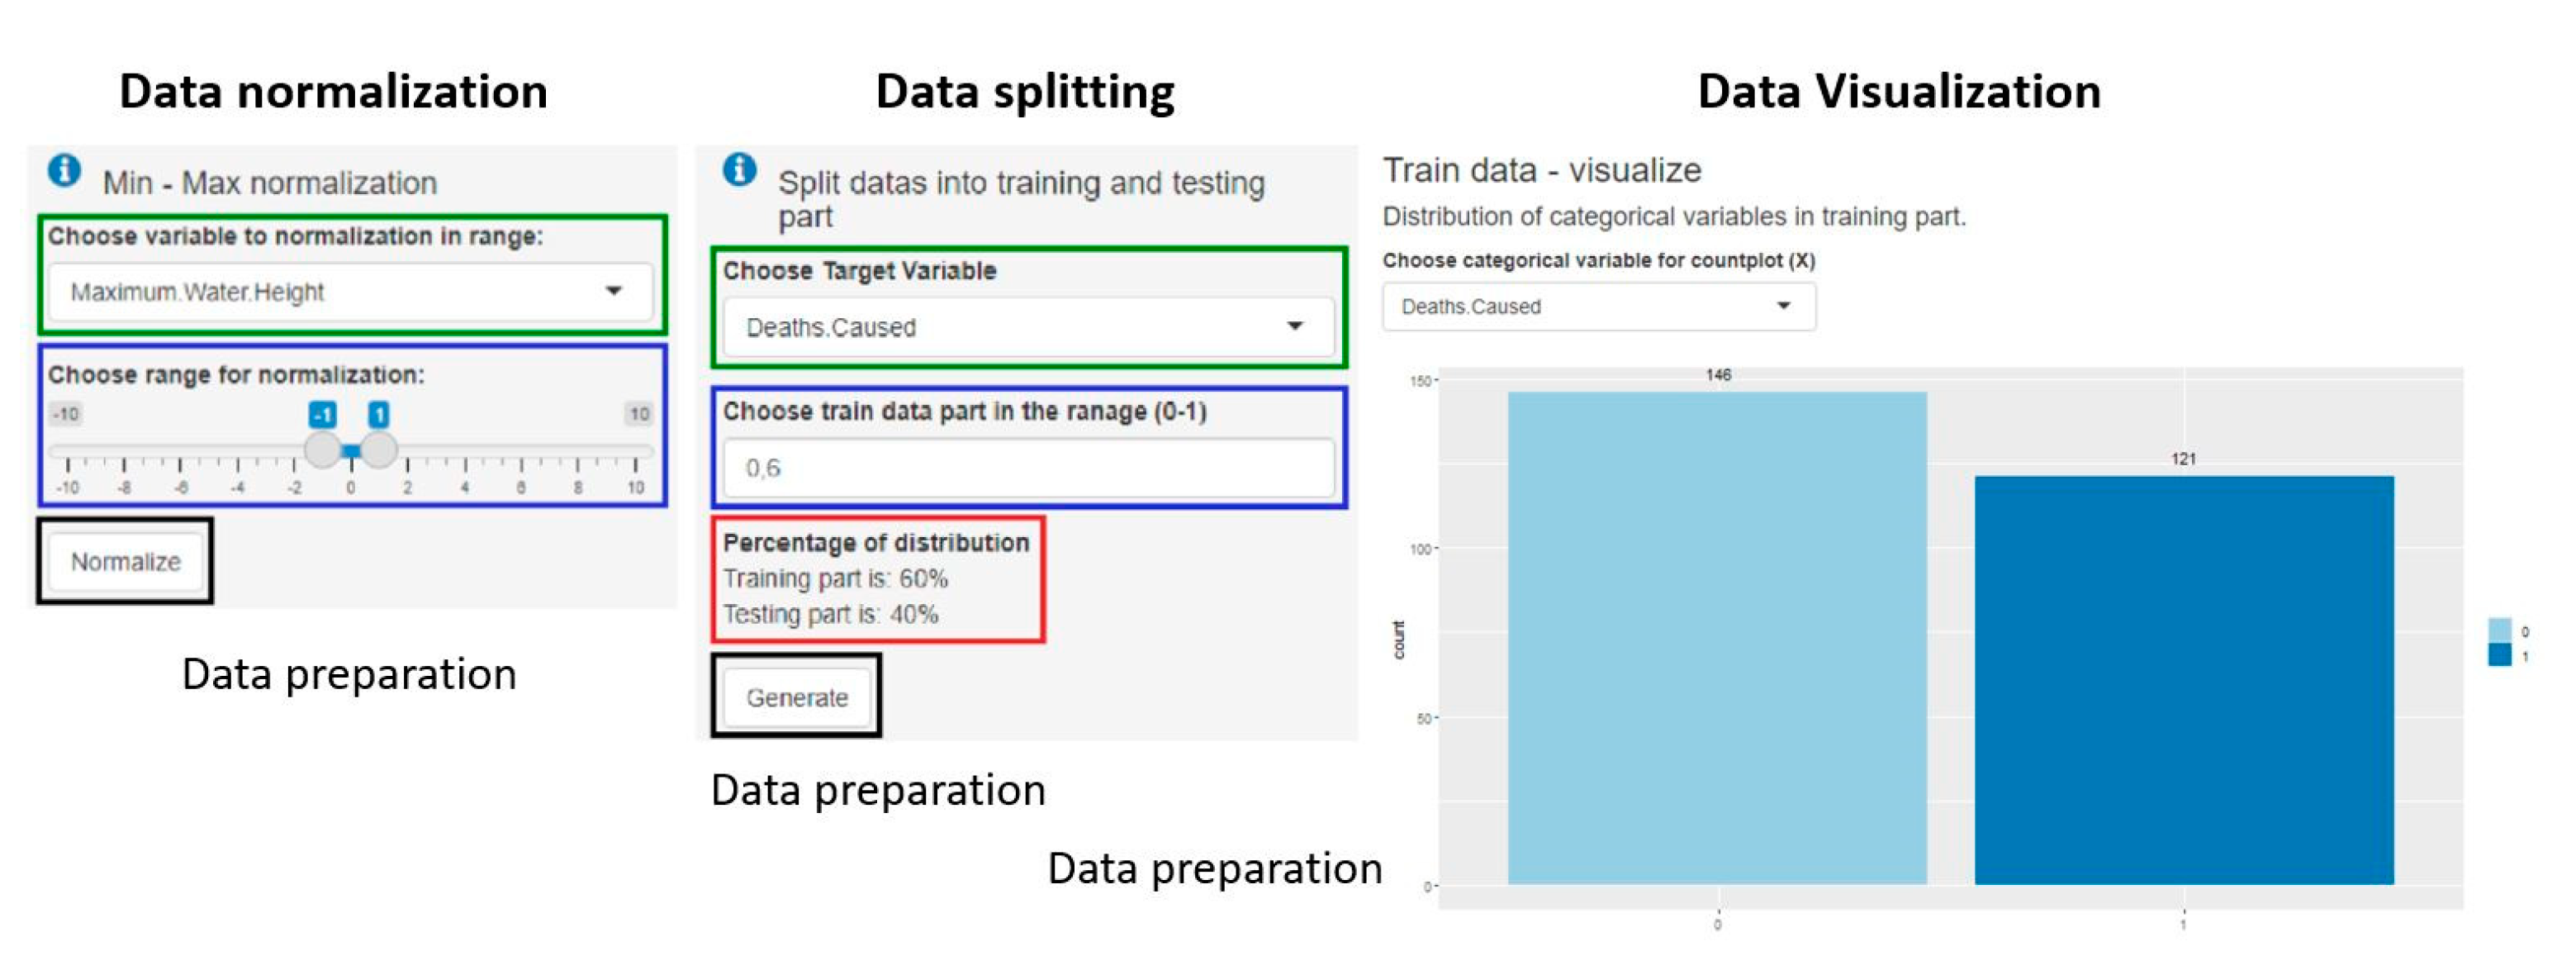
  • Data preparation: The tab is used for the preparation of data, which are subsequently used in modelling and evaluating the model.
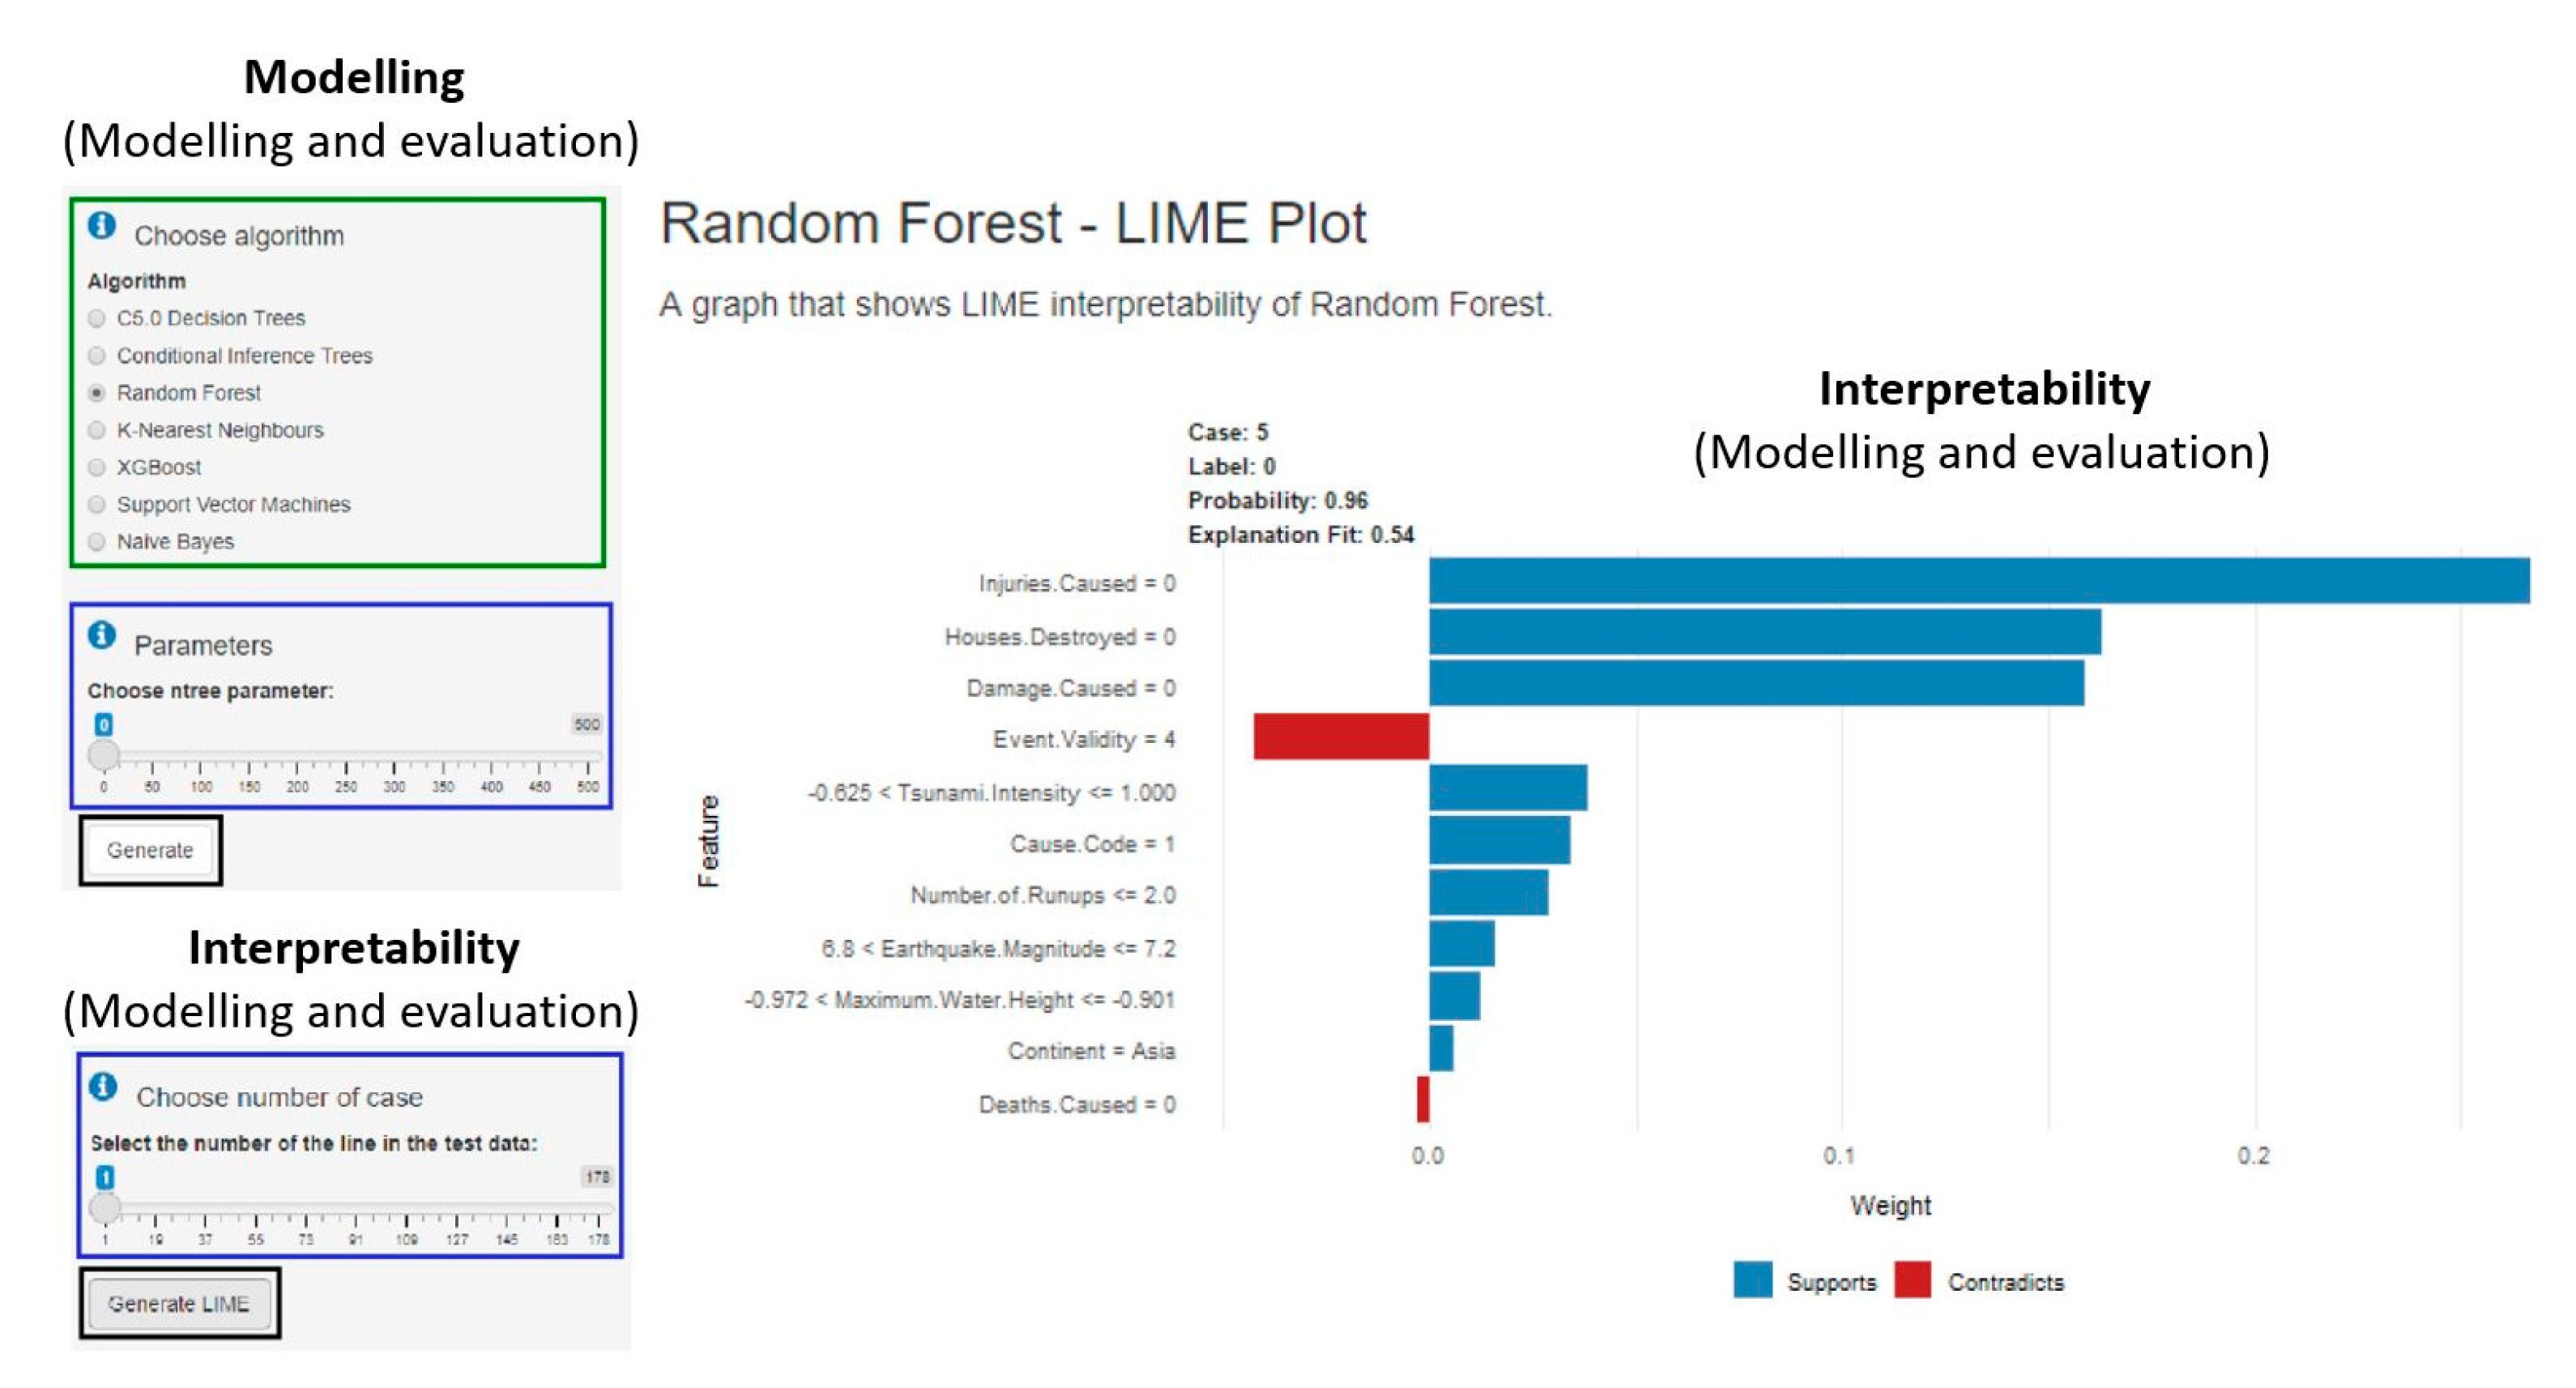
  • Modelling and evaluation: The tab is used to develop the model itself or initialise its parameters, training and evaluation. From the point of view of evaluation, the user is offered metrics for evaluating the quality of the model.
Specific conditions and principles must be followed to acquire the correct operation of the application. These terms and conditions include:
  • Continuous access to the application: The application should be accessed continuously, i.e., proceeding from the first tab to the last tab so that a distorted and therefore useless model is not created. For example, if the data are divided into training and testing (modeling and evaluation tab), then it is not appropriate to edit it again (data preparation tab).
  • Complete data: The data representing the model’s input should not contain missing values. Missing values are solved in the data preparation process (data preparation tab), not in the modeling phase (modeling and evaluation tab)
  • Text values of variables: Non-text data type variables are calculated for the creation of the model. If such a variable occurs in the data, it is advisable to transform it into a categorical form (data understanding tab).
  • Categorical attribute: The target attribute must always be categorical, which is binary in nature (i.e., it works with two classes—0 and 1).
  • Input data: By default, the application offers a sample dataset, “Tsunamis.csv”, which is created from the historical database of tsunami events, the author of which is NOAA (National Oceanic and Atmospheric Administration). However, the application allows users to upload their own datasets.

5.2. Development Phases and Prototyping

For the design, development and associated ongoing testing process, we selected a historical tsunami dataset from NOAA (https://www.noaa.gov/ (accessed on 5 January 2023)) due to the complexity and size of the provided datasets [32]. The data consisted of approximately 2800 records and 49 attributes about tsunami events. Through gradual adjustments, we created a full-scale data sample that contained 445 records and 16 attributes and was used for ongoing testing.
We used the incremental model in the component development phase itself [33]. First, we compiled a list of specific functionalities that the application should contain and prepared a work plan. Then we went into developing the application, continuously testing and improving the functions in the form of four prototypes. The presentation of the resulting application to the target group and the associated final testing were carried out only after the application was fully developed.
The aim of the first prototype was to create a layout of the user interface—four tabs in the navigation menu of the first level, which corresponded to the names of the phases of the CRISP-DM methodology, namely “Business understanding”, “Data understanding”, “Data preparation” and “Modeling & Evaluation”.
The first version of the prototype contained the possibility to upload data to the application, display it in the form of a simple table, change the data type from numerical to categorical, divide the data into a training and testing set, select the target variable and generate a model from the training data based on the C5.0 algorithm, where the output was a summarisation of the model and its graph.
Within the second prototype of the application, we modified the “Data understanding” tabs with the functionality of changing the data type of the selected column, and on the “Modeling & Evaluation” tab, we modified the function of dividing data into subsets and adding information fields. We have also added new extensions, such as filling out the “Business understanding” table on the “Data understanding” tab, and we have also added data visualisation using graphs (histogram for categorical and boxplot for numerical data). Furthermore, we added the function of displaying all the uploaded data on the world map. On the “Data preparation” tab, we have provided the user with the option to edit data in the form of deleting or renaming selected columns, removing rows with a missing value or rows with a missing value in a specific column. On the “Modeling & Evaluation” tab, in addition to the option to select the target variable, we have also added the choice of predictors that will enter the model generation process.
In the third prototype, a number of functions were processed into their final form, but we also added several new functionalities on almost every tab of the first-level navigation menu. On the “Data understanding” tab, we have added the ability to perform various statistical tests. On the “Data preparation” tab, we have added the option to replace the missing values with the mean and median value of the corresponding column. In addition, we have added functions for data normalisation and discretisation. We expanded the “Modeling & Evaluation” tab with six more algorithms (caret, C5.0, RF, XGBoost, SVM with radial kernel, KNN and NB). We added several metrics to the phase of evaluating the generated models: AUC, F1-score, sensitivity and specificity.
All the application functions were finally supplemented and modified within the fourth prototype. The main change was the possibility of editing the data sampling in the training set, adding algorithms with the choice of parameter values, and interpretation of the generated models using the LIME method. The final version of the “Business understanding” tab included basic information about natural disasters and tsunami principles. On the “Data understanding” tab, there was the possibility of data upload with the selection of parameters, display of data in the form of a preview, structure and summarisation, visualisation of data in four different graphs, a world map and statistical tests. The “Data preparation” tab contained several functions, especially in the side panel: data editing in the form of deleting and renaming columns, deleting the first row or all rows with a missing value, replacing missing values with the average or median value of the column, various forms of data normalisation and discretisation, the choice of the target variable and predictors, the division of the data into the training and test set in the selected ratio, the adjustment of data sampling by over-/under-sampling, the preview of the data in the training set and the visualisation of categorical data in the form of a graph. Examples of the functionalities mentioned above from the CRISP-DM methodology are demonstrated in Figure 5, Figure 6, Figure 7, Figure 8 and Figure 9.
The presented data exploration component in this section is oriented to connecting modern data exploration approaches with the tsunami phenomenon and unifying various functions needed for tsunami analysis, especially regarding the impact and response actions. The component intends to hide the complexity of developing and refining machine learning models. Thus, the component targets local authorities and regional decision makers who are intensively dealing with tsunami risk but do not have specific knowledge of machine learning approaches.

6. Agent-Based Evacuation Simulations

There is an extensive body of research in evacuation preparedness, resilience and simulations to reveal tsunami vulnerability and the corresponding risks. The studies are conducted using surveys of households [10] and identification of socioeconomic activities [34], specific numerical modelling [35,36] and agent-based models [37,38,39]. An agent-based model (ABM) is a computation model replicating real-world phenomena using the metaphor of autonomous entities (agents) interacting with each other and with the virtual environment surrounding them. Models are usually built from the bottom up by specifying the basic components (agents) with simple behaviour and interactions. With a rising number of agents in the model, new patterns emerge even though these are not directly encoded into the model. Emerging effects or patterns, such as system archetypes, can be successfully applied in the decision-making process [21].
Agent-based models are spatiotemporal simulations with discrete time steps. Using ABM with appropriate spatial and temporal scales and alternative scenarios, it is possible to explore complex phenomena, such as traffic, urban growth, climate change or spreading epidemics. The environment in which agents are situated is either geographical or abstract. A common principle in evacuation ABM is to combine an environment based on real GIS data with a synthetic population of agents (in our case, agents correspond to individual evacuees, groups of evacuees or vehicles). The attributes and behaviour of agents are derived from research on observed properties of real-world individuals, typically using census data, surveys or sensor information [10].

6.1. Agent-Based Evacuation Component

Our model defined two types of agents: person-agents and vehicle-agents with a crew on board. Person-agents either try to get to the closest evacuation point or move inland. Additionally, person-agents may be users of guiding mobile applications. Vehicle-agents move inland only (or the crew leaves the vehicle and walks to the evacuation point). State variables of agents are defined for both types of agents:
  • Position (int[x, y]);
  • Speed (m/s);
  • Group size (int);
  • Conviction (int 0–100);
  • Probability of having guiding application (% float);
  • Is waiting for confirmation of emergency message? (boolean).
The environment was specified using OpenStreetMap data, which is freely available and includes additional information about objects, such as building height, capacity and the number of lanes of roads. Geographic Information System (GIS) data from OpenStreetMap format (*.osm) was converted to *.shp format using the open source Geographic Information System (QGIS) tool. The QGIS provides functions for partly manually editing GIS data, which must be completed before importing to agent-based platforms, such as NetLogo. For example, some street objects were marked by a single composite line passing through several breakpoints. To correctly move agents along the street, the street was divided into smaller segments with breakpoints. In NetLogo, the environment is represented by a grid of patches of 15 × 15 m. A built-in extension in NetLogo is used for loading GIS data.
Three layers of GIS data were specified: buildings, roads for vehicle-agents and routes for pedestrian-agents.
The buildings layer was imported without further modifications and is mainly used for clearer visualisation. Two building parameters are used: height and capacity. The height was available in the OpenStreetMap data. In the model interface, the user chooses from what height a building is considered a safe shelter from a propagating water wave. The capacity of the buildings was not available in the OpenStreetMap data used, so for simulation purposes, it is derived from the total area of the building.
Vehicle-agents’ roads and pedestrian-agents’ routes were imported as graphs composed of links and nodes. The separation of roads and routes prevents a vehicle-agent from driving through alleys where it would not physically fit. Pedestrian-agents only use their routes. The movement of individuals along roads or across the lawn has not been considered because the location of the fences on the lawns is not stored in OpenStreetMap data.
A node represents a breaking point at which the direction of the path changes. Due to the scale of the model, some refractive points were merged; for example, a roundabout consisting of 50 refractive nodes was simplified to two nodes.
Incorporating the gradual clogging of paths into the model was also necessary. Since the OpenStreetMap data lacked information on the width of the road, the deceleration was recorded in nodes. Each node has its waiting time, from which the slowdown of the vehicle-agent’s movement is derived. Vehicle-agents move at their usual speeds, stopping at nodes for a time that is derived from the number of other agents in the node (a higher number of agents means a longer waiting time). According to the length of the waiting time, the vehicle-agent can change its strategy, i.e., the crew leaves the vehicle and continues on foot, while the abandoned vehicles become obstacles in the environment.
A node may also contain information signs about the nearby evacuation points. Pedestrian-agents can learn from the signs if the place they are heading to has already reached its capacity and agents can possibly be redirected to another evacuation point. Redirecting of pedestrian-agents reduces their optional delay in finding a new route.
In summary, the environment has the following components:
  • Pedestrian routes;
  • Vehicle roads with breakpoints that can be equipped with information signs;
  • Disaster zones on the map;
  • Safe zones (shelters) with their capacity (maximum number of evacuees, integer);
  • Three information channels (mobile application, radio broadcasting and information signs on roads).

6.2. Specification of the Evacuation Process

The initialisation of the simulation consists of loading maps of buildings, roads and routes, the creation of agent persons and vehicles and their placement on the map.
Flood wave propagation is an environmental process that triggers evacuation. The user sets the time on the slider, after which the wave starts to propagate. Historical data shows that on average, it takes about 20 min for a wave to arrive [11], so agents have a short time to make decisions and try to escape.
The wave gradually covers the area with water (Figure 10). Its speed slows down with each building it encounters and the distance it travels. The agent hit by the wave becomes the victim. Evacuation sites affected by the disaster are removed from the list of available sites, even if their capacity is not fully occupied.
Agents were stationed around the area, either in buildings or on roads. The basic behaviour of both types of agents is the same, but they differ in detail.
At the beginning of the simulation, the agents receive a message about an impending disaster. The message is relayed through one of the information channels. Depending on the channel type, a waiting time is generated for the agent before starting their evacuation. Thus, the simulation captures the fact that different channels provide information at different rates and agents are willing to believe and react to the information to different degrees. An agent in the model needs to obtain 100 belief points to evacuate. When evacuating, agents move along the shortest path (along the direct link between nodes) to the designated location.
Vehicle-agents are moving at higher speeds and are not trying to get to evacuation points, but further inland, as far away from the incoming wave as possible. A vehicle-agent represents a group of no more than four people. The waiting time at junctions is greater because vehicle-agents can only follow each other on the road. If the waiting time at a junction exceeds the agent’s patience level, the crew will check for an evacuation point nearby. If so, he decides to get out of the vehicle-agent and tries to reach this evacuation point instead of going inland.
Pedestrian-agents try to get to the nearest safe place. If they reach a crowded place, they change direction and seek another, as yet unfilled shelter. If they come across an information board on the way, they find out the current capacity of the chosen place and can change direction. The owners of the warning app get earlier information about the approaching wave and, subsequently, information about the occupancy of the evacuation sites, so they can react faster. As a result, the slowdown at the nodes is shorter for pedestrian-agents than for vehicle-agents.
One simulation step corresponds to 1 s. The process overview (Figure 11) and schedule are as follows.
  • Person-agents and vehicle-agents are distributed randomly in the environment.
  • Information channels are activated after a specific delay.
  • Person-agents and vehicle-agents receive evacuation signals through information channels (guiding application, radio broadcasting or social networks).
  • If the person-agent is not convinced, he waits for a message from another information channel.
  • Person-agents try to evacuate to the closest safe zone (there is a time before the disaster).
  • Person-agents with the smartphone guiding application will receive the best routing information. Others can join someone with a guiding application, or they can move on their own.
  • In general, person-agents with the smartphone guiding application make faster decisions (because they do not waste time searching for information).
  • Vehicle-agents (with people on board) try to evacuate inland.
  • There will be a point of danger which disables part of the map with its safe zones.
Using the process above, the simulation can help to determine the approximate time for evacuation of a given population and identify bottlenecks in evacuation routes, milling and other specific emergent behaviour that would be difficult to estimate without the simulation. The simulation is always an approximation of the complex behaviour and would need an interpretation by a human decision-maker.

7. Conclusions

The paper addresses the gap that exists in TWS and the TWS architectures and corresponding decision support of the “last mile” component. The attention is devoted especially to the lack of detail, unification and standardisation in information processing and advanced decision support, including machine learning data exploration and agent-based evacuation simulations. With the combination of these two approaches, the starting point for utilisation of smart environment possibilities can be established [40] to set a direction for implementing reusable IT solutions among local authorities and officials responsible for testing various tsunami impact scenarios and planning appropriate response actions.
The major advantages of the present solution over existing applications are in the integration and interoperability of components that specialize in a specific part in the TWS. The integration enables the prepared data and possible inferred information using machine learning techniques in the data exploration component to be used in agent-based simulations. Such interconnection is unique among existing applications. Further, the solution architecture is documented using standardized notation that allows for better understanding and reuse. None of the architectures mentioned in Section 2 use well-documented specification. The study tries to open and promote the use of standardized specifications for TWS description. The application is web-based and does not need to be installed. It can be easily shared by sending a text message with a link. The use of the application is intended for officials that do not have extensive expertise in tsunami source identification or modeling, but have the authority to conduct evacuation orders. Agent-based evacuation simulations are quite common in the literature. The difference in the present solution is that the agent-based evacuation area given by map and GIS information can be set up by the tsunami dashboard. The evacuation is also based on the sufficiently fine elevation and contour model that allows for more accurate routing in horizontal evacuation. The interconnection with the data exploration component and machine learning techniques enables estimation of the simulation parameters, such as population density, building capacities and speed of movement.
The present architecture of the tsunami emergency solution is open for further elaboration and extension. The present study has several limitations. The application is in a prototype version and further testing and development is essential. A usability study is especially required to verify the user interface suitability under different stress conditions. Furthermore, the application programming interfaces between the map component and simulation engine still need refinements to allow for more seamless evacuation simulation of given areas. The solution notification and navigation functionality require an Internet connection, which might be problematic, especially after an earthquake. These limitations confirm that building tsunamis warning systems is an ongoing quest.

Author Contributions

P.Č. Conceptualisation, Validation, Writing—original draft; M.M. Sofware, Data curation, Writing—original draft; V.A. Software, Data curation; F.B. Conceptualisation, Resources, Supervision, Writing—original draft; B.N.A. Investigation; V.B. Funding acquisition, Resources, Supervision, Writing—original draft; M.K. Developing agent-based evacuation simulation, process definition—original draft; K.Š. Writing about agent-based simulation—original draft; M.H. Investigation, Writing—original draft; M.Z. Visualisation, Writing—original draft; S.M. Validation, Writing—review and editing; I.T. Validation, Writing—review and editing. All authors have read and agreed to the published version of the manuscript.

Funding

The APC was funded by the VES20 Inter-Cost LTC 20020 project.

Acknowledgments

This manuscript is supported by the Slovak Research and Development agency projects APVV-20-0232 and APVV-17-0550, and the project VEGA 1/0685/2. The VES20 Inter-Cost LTC 20,020 project supported this research, as well. The authors also express gratitude to the COST Action AGITHAR leaders and team members.

Conflicts of Interest

The authors declare no conflict of interest.

References

  1. Heidarzadeh, M.; Gusman, A.R.; Ishibe, T.; Sabeti, R.; Šepić, J. Estimating the Eruption-Induced Water Displacement Source of the 15 January 2022 Tonga Volcanic Tsunami from Tsunami Spectra and Numerical Modelling. Ocean. Eng. 2022, 261, 112165. [Google Scholar] [CrossRef]
  2. Cordrie, L.; Feuillet, N.; Gailler, A.; Biguenet, M.; Chaumillon, E.; Sabatier, P. A Megathrust Earthquake as Source of a Pre-Colombian Tsunami in Lesser Antilles: Insight from Sediment Deposits and Tsunami Modeling. Earth-Sci. Rev. 2022, 228, 104018. [Google Scholar] [CrossRef]
  3. Mori, N.; Satake, K.; Cox, D.; Goda, K.; Catalan, P.A.; Ho, T.-C.; Imamura, F.; Tomiczek, T.; Lynett, P.; Miyashita, T.; et al. Giant Tsunami Monitoring, Early Warning and Hazard Assessment. Nat. Rev. Earth Environ. 2022, 3, 557–572. [Google Scholar] [CrossRef]
  4. Lin, S.C.; Wu, T.-R.; Yen, E.; Chen, H.-Y.; Hsu, J.; Tsai, Y.-L.; Lee, C.-J.; Liu, P.L.-F. Development of a Tsunami Early Warning System for the South China Sea. Ocean. Eng. 2015, 100, 1–18. [Google Scholar] [CrossRef]
  5. Falck, C.; Ramatschi, M.; Subarya, C.; Bartsch, M.; Merx, A.; Hoeberechts, J.; Schmidt, G. Near Real-Time GPS Applications for Tsunami Early Warning Systems. Nat. Hazards Earth Syst. Sci. 2010, 10, 181–189. [Google Scholar] [CrossRef]
  6. Richard, G.L.; Msheik, K.; Duran, A. A Preliminary Depth-Integrated Model for Tsunamis Propagation Including Water Compressibility and Seafloor Elasticity. Eur. J. Mech.-B/Fluids 2023, 99, 84–97. [Google Scholar] [CrossRef]
  7. Solano-Hernández, E.A.; Vázquez Caamal, L.; Melgar, D. Tsunami Modeling and Inundation Maps of the ∼M8.6, 1787 Earthquake along the Oaxacan Coast. J. S. Am. Earth Sci. 2022, 119, 103982. [Google Scholar] [CrossRef]
  8. Ajmar, A.; Annunziato, A.; Boccardo, P.; Tonolo, F.G.; Wania, A. Tsunami Modeling and Satellite-Based Emergency Mapping: Workflow Integration Opportunities. Geosciences 2019, 9, 314. [Google Scholar] [CrossRef] [Green Version]
  9. Kubo, T.; Suzuki, W.; Ooi, M.; Takahashi, N.; Asao, K.; Yoshioka, K. Application of a Real-Time Tsunami Forecast System to the Disaster Response of Local Governments during a Major Tsunami Disaster. Geosciences 2019, 9, 102. [Google Scholar] [CrossRef] [Green Version]
  10. Chen, C.; Wang, H.; Lindell, M.K.; Jung, M.C.; Siam, M.R.K. Tsunami Preparedness and Resilience: Evacuation Logistics and Time Estimations. Transp. Res. Part D Transp. Environ. 2022, 109, 103324. [Google Scholar] [CrossRef]
  11. Mas, E.; Suppasri, A.; Imamura, F.; Koshimura, S. Agent-Based Simulation of the 2011 Great East Japan Earthquake/Tsunami Evacuation: An Integrated Model of Tsunami Inundation and Evacuation. J. Nat. Disaster Sci. 2012, 34, 41–57. [Google Scholar] [CrossRef] [Green Version]
  12. Behrens, J.; Løvholt, F.; Jalayer, F.; Lorito, S.; Salgado-Gálvez, M.A.; Sørensen, M.; Abadie, S.; Aguirre-Ayerbe, I.; Aniel-Quiroga, I.; Babeyko, A.; et al. Probabilistic Tsunami Hazard and Risk Analysis: A Review of Research Gaps. Front. Earth Sci. 2021, 9, 628772. [Google Scholar] [CrossRef]
  13. Rafliana, I.; Jalayer, F.; Cerase, A.; Cugliari, L.; Baiguera, M.; Salmanidou, D.; Necmioğlu, Ö.; Ayerbe, I.A.; Lorito, S.; Fraser, S.; et al. Tsunami Risk Communication and Management: Contemporary Gaps and Challenges. Int. J. Disaster Risk Reduct. 2022, 70, 102771. [Google Scholar] [CrossRef]
  14. UNESCO. Reducing and Managing the Risk of Tsunamis—UNESCO Digital Library; Intergovernmental Oceanographic Commission: Paris, France, 2011; Volume 2011. [Google Scholar]
  15. Løvholt, F.; Fraser, S.; Salgado-Gálvez, M.; Lorito, S.; Selva, J.; Romano, F.; Suppasri, A.; Mas, E.; Polet, J.; Behrens, J.; et al. Global Trends in Advancing Tsunami Science for Improved Hazard and Risk Understanding. In Global Assesment Report on Disater and Risk Reduction 2019; United Nations Office for Disaster Risk Reduction: Geneva, Switzerland, 2019; Volume 2019. [Google Scholar]
  16. Wächter, J.; Babeyko, A.; Fleischer, J.; Häner, R.; Hammitzsch, M.; Kloth, A.; Lendholt, M. Development of Tsunami Early Warning Systems and Future Challenges. Nat. Hazards Earth Syst. Sci. 2012, 12, 1923–1935. [Google Scholar] [CrossRef] [Green Version]
  17. The Open Group TOGAF 9—The Open Group Architecture Framework Version 9; The Open Group: San Francisco, CA, USA, 2009; p. 744.
  18. Wirth, R.; Hipp, J. CRISP-DM: Towards a Standard Process Model for Data Mining. In Proceedings of the 4th international conference on the practical applications of knowledge discovery and data mining, Manchester, UK, 11–13 April 2000; Volume 1, pp. 29–39. [Google Scholar]
  19. Galaz, J.; Cienfuegos, R.; Echeverría, A.; Pereira, S.; Bertín, C.; Prato, G.; Karich, J.C. Integrating Tsunami Simulations in Web Applications Using BROWNI, an Open Source Client-Side GPU-Powered Tsunami Simulation Library. Comput. Geosci. 2022, 159, 104976. [Google Scholar] [CrossRef]
  20. Grzan, D.P.; Rundle, J.B.; Wilson, J.M.; Song, T.; Ward, S.N.; Donnellan, A. Tsunami Squares: Earthquake Driven Inundation Mapping and Validation by Comparison to the Regional Ocean Modeling System. Prog. Disaster Sci. 2021, 12, 100191. [Google Scholar] [CrossRef]
  21. Tadibaght, A.; El M’rini, A.; Siame, L.; Bellier, O. Tsunami Impact Assessment for Low-Lying Cities along the Northern Atlantic Coast of Morocco Using MIRONE Software. J. Afr. Earth Sci. 2022, 192, 104580. [Google Scholar] [CrossRef]
  22. Jin, D.; Lin, J. Managing Tsunamis through Early Warning Systems: A Multidisciplinary Approach. Ocean. Coast. Manag. 2011, 54, 189–199. [Google Scholar] [CrossRef] [Green Version]
  23. Australian Government Joint Australian Tsunami Warning Centre. Available online: http://www.bom.gov.au/tsunami/about/atws.shtml (accessed on 23 January 2023).
  24. Rahayu, H.P.; Comfort, L.K.; Haigh, R.; Amaratunga, D.; Khoirunnisa, D. A Study of People-Centered Early Warning System in the Face of near-Field Tsunami Risk for Indonesian Coastal Cities. Int. J. Disaster Resil. Built Environ. 2020, 11, 241–262. [Google Scholar] [CrossRef]
  25. United Nations. Sendai Framework for Disaster Risk Reduction 2015–2030; United Nations: San Francisco, CA, USA, 2015. [Google Scholar]
  26. Canterford, R.; Hibbins, R.; Jarrott, K.; Lenc, D.; Muller, C.; Wong, K. The Australian Tsunami Warning System—Contribution to the WMO Integrated Global Observing System For The Indian and Pacific Oceans. WMO Library 2008, 2008. Available online: https://studylib.net/doc/7835582/the-australian-tsunami-warning-system-and-its-contributio (accessed on 6 March 2023).
  27. Murjaya, J. Tsunami Early Warning Service Guidebook for InaTEWS; Badan Metereologi Klimatologi & Geofisika: Jakarta Pusat, Indonesia, 2012; Available online: https://iotic.ioc-unesco.org/country-resources/tsunami-early-warning-service-guidebook-for-inatews/ (accessed on 6 March 2023).
  28. National Weather Service National Weather Service—Tsunami Hazards. Available online: https://tsunami.gov/?page=message_definitions (accessed on 23 February 2023).
  29. An, C.; Liu, H.; Ren, Z.; Yuan, Y. Prediction of Tsunami Waves by Uniform Slip Models. J. Geophys. Res. Oceans 2018, 123, 8366–8382. [Google Scholar] [CrossRef]
  30. Mulia, I.E.; Gusman, A.R.; Satake, K. Applying a Deep Learning Algorithm to Tsunami Inundation Database of Megathrust Earthquakes. J. Geophys. Res. Solid Earth 2020, 125, e2020JB019690. [Google Scholar] [CrossRef]
  31. Liu, C.M.; Rim, D.; Baraldi, R.; LeVeque, R.J. Comparison of Machine Learning Approaches for Tsunami Forecasting from Sparse Observations. Pure Appl. Geophys. 2021, 178, 5129–5153. [Google Scholar] [CrossRef]
  32. Nacházel, T.; Babič, F.; Baiguera, M.; Čech, P.; Husáková, M.; Mikulecký, P.; Mls, K.; Ponce, D.; Salmanidou, D.; Štekerová, K.; et al. Tsunami-Related Data: A Review of Available Repositories Used in Scientific Literature. Water 2021, 13, 2177. [Google Scholar] [CrossRef]
  33. Hinkel, G. Implicit Incremental Model Analyses and Transformations; KIT Scientific Publishing: Karlsruhe, Germany, 2021; ISBN 3-7315-0763-3. [Google Scholar]
  34. Hou, J.; Ren, Z.; Wang, P.; Wang, J.; Gao, Y. Tsunami Assessment and Evacuation Analysis Using Remote Sensing for Tianya District of Sanya City, China. J. Earthq. Tsunami 2019, 13, 1941003. [Google Scholar] [CrossRef]
  35. Vranken, T.; Sliwa, B.; Wietfeld, C.; Schreckenberg, M. Adapting a Cellular Automata Model to Describe Heterogeneous Traffic with Human-Driven, Automated, and Communicating Automated Vehicles. Phys. A Stat. Mech. Its Appl. 2021, 570, 125792. [Google Scholar] [CrossRef]
  36. Makinoshima, F.; Imamura, F.; Abe, Y. Enhancing a Tsunami Evacuation Simulation for a Multi-Scenario Analysis Using Parallel Computing. Simul. Model. Pract. Theory 2018, 83, 36–50. [Google Scholar] [CrossRef]
  37. Fathianpour, A.; Evans, B.; Jelodar, M.B.; Wilkinson, S. Tsunami Evacuation Modelling via Micro-Simulation Model. Prog. Disaster Sci. 2023, 17, 100277. [Google Scholar] [CrossRef]
  38. Kim, K.; Kaviari, F.; Pant, P.; Yamashita, E. An Agent-Based Model of Short-Notice Tsunami Evacuation in Waikiki, Hawaii. Transp. Res. Part D Transp. Environ. 2022, 105, 103239. [Google Scholar] [CrossRef]
  39. Mostafizi, A.; Wang, H.; Cox, D.; Dong, S. An Agent-Based Vertical Evacuation Model for a near-Field Tsunami: Choice Behavior, Logical Shelter Locations, and Life Safety. Int. J. Disaster Risk Reduct. 2019, 34, 467–479. [Google Scholar] [CrossRef]
  40. Mikulecky, P.; Olsevicova, K.; Bures, V.; Mls, K. Possibilities of Ambient Intelligence and Smart Environments in Educational Institutions. In Handbook of Research on Ambient Intelligence and Smart Environments: Trends and Perspectives; Information Science Reference: Hershey, PA, USA, 2011; pp. 620–639. ISBN 978-1-61692-858-2. [Google Scholar]
Figure 1. Solution architecture using ArchiMate specification. The blue colour denotes application layer elements. Green is for technology layer elements.
Information 14 00172 g001
Figure 2. Map part of the tsunami emergency dashboard. The map is overlayed with contours. The contours are colour-coded from red through yellow to green. The red colour represents areas with the lowest elevation and highest tsunami risk. The green colour is used for places with the highest elevation and lowest tsunami risk. The location depicted is a Manly suburb in Sydney, Australia.
Information 14 00172 g002
Figure 3. The figure shows the tsunami wave parameter setting screen that is used to estimate the impact of the tsunami. The user can use the sliders to change the calculated values from the CFD cloud component, such as speed and wave height. In reference to the tsunami origin, the application recalculates the impact time and time-to-impact fields. The endangered people are also recalculated based on the location definitions and the wave height.
Information 14 00172 g003
Figure 4. The figure shows the screen of the tsunami emergency assistant. The upper orange part displays the notification received from the tsunami emergency dashboard. The grey bar contains information about the user’s status. The map can be used to navigate to the closest available safe location. The large red location icon on the map shows the current user position. The green location icon is for a safe location. The shortest path from the current user position to the safe location is marked with the blue line.
Information 14 00172 g004
Figure 5. Files uploading and data preview (data understanding).
Information 14 00172 g005
Figure 6. Data visualisation with a map: tsunami events on the map (data understanding).
Information 14 00172 g006
Figure 7. Data normalisation, splitting and visualisation (data preparation).
Information 14 00172 g007
Figure 8. Algorithms/parameters settings, interpretability of a model (modelling and evaluation).
Information 14 00172 g008
Figure 9. The main screen of the data exploration component.
Information 14 00172 g009
Figure 10. Visualisation of evacuation simulation of the Manly suburb in Sydney, Australia (see Figure 2 for the map of the area). The blue colour represents the tsunami wave propagating approximately from right to left. The white lines are the roads taken from the Open Street Map data. Yellow are the buildings also based on Open Street Map data. The white points are the intersections or places with differing elevations. The agents are moving along these lines. The coloured lines are the elevation contours. Red crosses represent inhabitants struck by the tsunami. The charts on the right show the number of inhabitants successfully finding shelter and inhabitants struck by the tsunami, respectively.
Information 14 00172 g010
Figure 11. Simulated evacuation process overview using BPMN notation.
Information 14 00172 g011
Disclaimer/Publisher’s Note: The statements, opinions and data contained in all publications are solely those of the individual author(s) and contributor(s) and not of MDPI and/or the editor(s). MDPI and/or the editor(s) disclaim responsibility for any injury to people or property resulting from any ideas, methods, instructions or products referred to in the content.

