Article

An Overview of Renewable Energy Technologies in the Eastern Cape Province in South Africa and the Rural Households’ Energy Poverty Coping Strategies

by
Patrick Mukumba
and
Shylet Y. Chivanga
*
Department of Physics, University of Fort Hare, P/Bag X1314, Alice 5700, South Africa
*
Author to whom correspondence should be addressed.
Challenges 2023, 14(1), 19; https://doi.org/10.3390/challe14010019
Submission received: 16 January 2023 / Revised: 6 March 2023 / Accepted: 14 March 2023 / Published: 22 March 2023
(This article belongs to the Section Renewable Energies)

Abstract

:
Despite technological innovation and vast renewable energy sources in rural areas, a significant number of rural households are living in energy poverty, and there is a pressing need to come up with strategies to mitigate this. This paper presents an overview of the energy sources in the Eastern Cape Province, the status of renewable energy technologies and the household energy poverty coping strategies in rural areas. The analysis of this study is based on conducted studies on renewable technologies in the Eastern Cape. This paper aims to help to provide a deeper understanding in the selection of the most appropriate renewable energy technologies suited to rural households’ energy needs and to fill the knowledge gap existing in renewable energy technologies to make it easier to map a way forward into the households’ energy poverty coping strategies in the Eastern Cape.

1. Introduction

The problem of energy poverty in rural areas is not uniquely linked to lack of renewable energy sources, but is arguably uniquely linked to biased policies, social, economic, technological and cultural issues. Energy poverty can be expressed in income and non-income terms. Inadequate access to electricity and the use of unclean sources is a sign of energy poverty. Energy poverty exists in America, Asia and Africa. About 940 million households in the whole world do not have access to electricity and about 3 billion people do not have access to clean sources of energy. However, the degree of poverty is increasing at a higher level in African countries compared to other continents. For example, about 573 million people in Sub-Saharan Africa lack access to electricity, and for every ten people in the world without electricity, seven live in Sub-Saharan Africa [1] The aim of this paper is to discover the rural households’ energy poverty coping strategies suited to their energy needs, and to fill the knowledge gap existing in renewable energy technologies to make it easier to map a way forward into the households’ energy poverty coping strategies in the Eastern Cape. The noticeable number of households experiencing energy poverty necessitates innovation in renewable energy technology and the coping strategies beyond the indigent energy policy, which most poor households largely depend on. The indigent energy policy was introduced in 2003. To mitigate energy poverty, it offers 50 kWh of free energy to poor households every month [2]). Despite the improvement in access to electricity from 30% in 1994 to currently over 87% of the population [3]), and the numerous benefits of the indigent energy policy, the expected household energy needs are rarely met in full because 50 kWh is less than the minimum required energy. Moreover, not all poor households benefit from the indigent energy policy because of the budget constraints of some municipalities. This study focused on the Eastern Cape. The Eastern Cape is among the poorest provinces in South Africa, with about 67.3% of people living in poor households [4] This paper focused on the energy situation in rural areas, the renewable energy technologies in the Eastern Cape, the coping strategies used by rural households and finally, discusses what can be done to reduce energy poverty in rural areas in South Africa.

2. An Overview of Energy in South Africa

In South Africa, about 78% of the electricity is generated from coal-fired plants [5]), most of which were built during the apartheid era around the 1960s and 1970s. As a result of using coal, South Africa ranges 7th in terms of per capita carbon dioxide emissions globally and produces about 40% of carbon dioxide emissions in Africa [6] Currently, there is a challenge of load shedding in South Africa due to ageing infrastructure and corruption in coal purchasing and power plant procurement, which has led Eskom into USD 24 billion of debt. Load shedding is the deliberate shutdown of electricity in the country to relieve the grid from demand pressure. About 6.7% of energy comes from renewable energy technologies. This is very low, compared to energy from coal, a non-renewable energy source. There is a slight improvement in energy from renewables compared to previous years [7]. For example, compared to 2013, there is an improvement in the use of renewable energy, namely wind, solar and concentrated power solar energy. The operational capacity of wind, solar and concentrated solar power improved from 2013 to 2021 as indicated in Figure 1 [8].
As indicated in Table 1, coal contributes larger percentage of energy compared to the contribution from renewable sources of energy such as wind, hydro and solar energy. While there is an improvement in the renewable energy sector, the contribution of renewable sources of energy is still low.

3. Renewable Energy Technologies in the Eastern Cape

Figure 2 compares the Eastern Cape and other provinces’ electric generation by different technologies, namely solar PV, wind, concentrated solar power, biomass energy and hydropower (pumped water storage).
As indicated in Figure 2, the Northern Cape is on the top, followed by Eastern Cape and Western Cape when it comes to electricity generation through solar PV, Concentrated Solar Power (CSP) and biomass energy. Compared to other provinces, the Eastern Cape has good wind- energy potential, and this is followed by the Western Cape. Proximity to the sea is among the reasons why the Eastern Cape and Western Cape have good wind energy potential.

3.1. Wind Energy Technologies

South Africa has areas with good, moderate and low wind potential. The Eastern Cape is among the provinces with the best wind energy potential which can be harnessed for electricity production because it is a coastal area. It has an average annual wind speed of over 4 m/s at 10 m above the ground [9]. Because of its good wind energy potential, the Eastern Cape has wind farms. The wind farms have plenty of wind turbines that generate electricity. Table 2 lists some wind farms in the Eastern Cape Province.

3.2. Solar Energy Technologies

Like in other provinces, solar energy is among the sources of energy used in the Eastern Cape. Solar electrical energy is produced through photovoltaic or concentrated solar power technologies [18] The difference between photovoltaic and concentrated solar power technologies is that photovoltaic uses semi-conducting materials such as silicon to convert solar energy into electrical energy. In contrast, concentrated solar power technologies use mirrors to produce thermal energy that can be used indirectly to produce electricity [9]. Steam produced by the thermal energy is then used to generate electricity e [18]. Some households in the Eastern Cape have solar installations mainly for lighting purposes. There are also solar farms in the Eastern Cape, namely Dreunberg, with a capacity of 75 MW; Grassridge, with 60 MW and Herbert, with 19.9 MW as indicated in Table 3.

3.3. Concentrated Solar Power Energy Technologies

As a way of meeting the National Development Plan and Sustainable Development Goal number 7, South Africa intends to generate over 1.7 GW of energy from renewable energy by 2030. Therefore, concentrated solar power technology is also among the energy sources used in the Eastern Cape to meet people’s energy needs. Concentrated solar power technology has the potential to generate renewable energy because of the availability of solar energy in the country [19]. Figure 3 shows the ranks of solar radiation in the Eastern Cape Province in relation to other provinces.
As shown in Figure 3, the solar radiation scores of the Eastern Cape are between 6000 and 6500 MJm−2, which is significantly below that of other provinces, and this is why the Eastern Cape is ranked among the provinces with the lowest solar radiation in South Africa. The Northern Cape is ranked among the provinces with the highest levels of solar radiation as indicated by a solar radiation rank of 9000 to 9500 MJm−2. The perceived radiation levels were rated from 6000 to 9500 MJm−2. Scores from 6000 to 6500 MJm−2 indicate low levels of radiation, with scores of 9000 to 9500 MJm−2 being allocated to provinces which are considered to have the highest level of solar radiation.

3.4. Biomass Energy Technologies

The Eastern Cape is the second highest after the Western Cape in terms of biomass energy technology installation in South Africa. Biomass energy is a type of renewable energy derived directly or indirectly from organic material [21]. Biomass can be in solid, liquid or gas form. The conversion of biomass to usable heat can occur through combustion, gasification and pyrolysis. Biomass combustion is a form of thermal conversion whereby biomass is burned in an oxygenated environment to generate heat and electricity [22]. Another type of biomass energy is biogas.

3.5. Biogas Technology in the Eastern Cape

About 700 biogas digesters were installed in South Africa since 1957 [23]. Biogas digesters generate biogas. Biogas is a renewable source of energy which consists of a mixture of gases, namely carbon dioxide, hydrogen, methane and sulphide [24]. Biogas is produced by anaerobic digestion with organisms. The temperature of the slurry is important in biogas production because it determines the quantity and quality of biogas production [25]. Sources of biogas include forestry, agriculture and human waste. Biogas, like natural gas, can be compressed after removing carbon dioxide and hydrogen sulphide and can be used as fuel to power vehicles [26]. Table 4 shows some of the biogas digesters in the Eastern Cape.

3.6. Geothermal Technologies

Geothermal energy technologies involve the use of either heat from the earth or coolness from the ground. Heat sources for producing electricity through geothermal technology range from shallow ground heat, hot water beneath the earth’s surface and hot rocks beneath the earth’s surface to very high temperature molten rock called magma [28]. The advantage of using geothermal energy in South Africa is that it is renewable. It was also discovered that there is a potential for geothermal energy in Cradock in the Eastern Cape. Rather than using fossil fuels such as coal, geothermal energy can be an alternative for the Eastern Cape. The disadvantage is that it is costly to construct new power plants for geothermal energy when it is already difficult to maintain the existing thermal power plants in South Africa. Figure 4 illustrates the areas with a potential for geothermal energy.

3.7. Hydropower Technologies

Hydropower is a form of renewable energy that uses the power of moving water to generate electricity. Currently, South Africa has a 38 MW of hydropower capacity. However, it has the potential to produce hydropower of 11,000 GWh\year (Department of Energy, 2015). South Africa is importing hydroelectricity. For instance, in 2022, it imported around 9000 GWh from the Cabora Bassa hydroelectric generation station in Mozambique [6]. Small-scale 247 MW hydropower plant installations are taking place in Kwazulu Natal, the Free State and the Eastern Cape [6] (Uhunamure and Shale, 2021). In addition, in the Eastern Cape, in Kwa-Madiba village near Mthatha, about 54 households will benefit electricity from a small-scale hydropower plant. The plant demonstrates the potential of renewable energy in the Eastern Cape. The hydroelectricity will be generated by drawing water from the top of Thina Falls which is located near Madiba village [29].

4. Energy Coping Strategies for Low-Income Households

How people in rural areas cope in times of energy crises is an issue of concern and can no longer be ignored. Energy poverty is part of life in rural areas. Energy poverty, in the case of this study, refers to inadequate supply of energy resources, which in turn will be insufficient to match the corresponding human energy demand. In terms of cost, energy poverty refers to a situation where people cannot afford to consume modern and relatively more expensive renewable energy sources [30]. Energy poverty in rural areas does not happen in isolation. It is an aspect of existing income, social and access inequalities. For instance, energy poverty mainly affects low-income households, which spend a significant portion of their income on energy.
Income poverty, geographic barriers, rural–urban discriminatory policies and unwillingness to pay leave households vulnerable to severe energy hardships. In Sub-Saharan Africa, about 600 million people in rural areas lack access to energy [31,32]. Most of the people in Kenya, Uganda and Tanzania still use kerosene (Harrison et al., 2016), and in South Africa, about 75% of households are deprived of electricity [33]. Presently, about 80% of the rural population in South Africa is connected to electricity. However, rural low-income households are struggling abysmally to meet their energy needs. Non-electrified households depend on unclean sources of energy. Some households connected to electricity, especially low-income households, depend on government-provided electricity since they cannot afford electricity. When that energy has been used, poor households look for unclean sources of energy such as firewood. Indigent energy policy is whereby the government gives low-income households a free 50 kWh of electricity to fight energy poverty. Despite the fact that 80% of the population in rural areas are connected to the grid, low-income households still face the challenge of renewable energy access since they still use a larger amount of unclean, unhealthy and dangerous sources of energy such as paraffin, firewood and cow dung [34]. There is great inequality regarding renewable energy access in rural areas. Access to sustainable modern energy technologies is essential for promoting health, quality education and sustainable livelihoods—yet millions of people have no access to sustainable energy technologies which leaves them with the option of using dangerous and unhealthy fuels for lighting and cooking. In order to save their income, low-income households in rural areas opt for readily available sources of energy such as cow dung and firewood [35].
Despite the presence of different energy technologies in South Africa, rural households continue to struggle to meet their energy demands. For several years, some rural areas have struggled with inadequate national grid coverage and poor electricity supply. The government has made many efforts towards grid connection in the Eastern Cape. However, in electrified places, because of poverty, people are not able to pay, which shows that energy poverty makes access to electricity unreliable. Rural areas in the Eastern Cape rank extra very low in terms of renewable energy access despite enormous energy resources such as wind, solar, biomass and micro-hydrokinetic energy sources.
Energy coping strategies include the use of electricity and the use of firewood as a backup. Households can insure themselves by looking for bulk firewood in summer, which they deplete in the rainy season and winter. Alternatively, some households use illegal connections to the main grid in case of hardship. Energy coping strategies refer to what people use when experiencing energy crises.
Firewood is mostly used in the Eastern Cape in areas not connected to the grid and in poor households which cannot afford to supplement the free basic electricity. The other reason for the use of firewood in rural areas of the Eastern Cape is the availability of woodlands and affordability. Firewood is used for cooking and heating during winter due to the high costs of electric heaters.
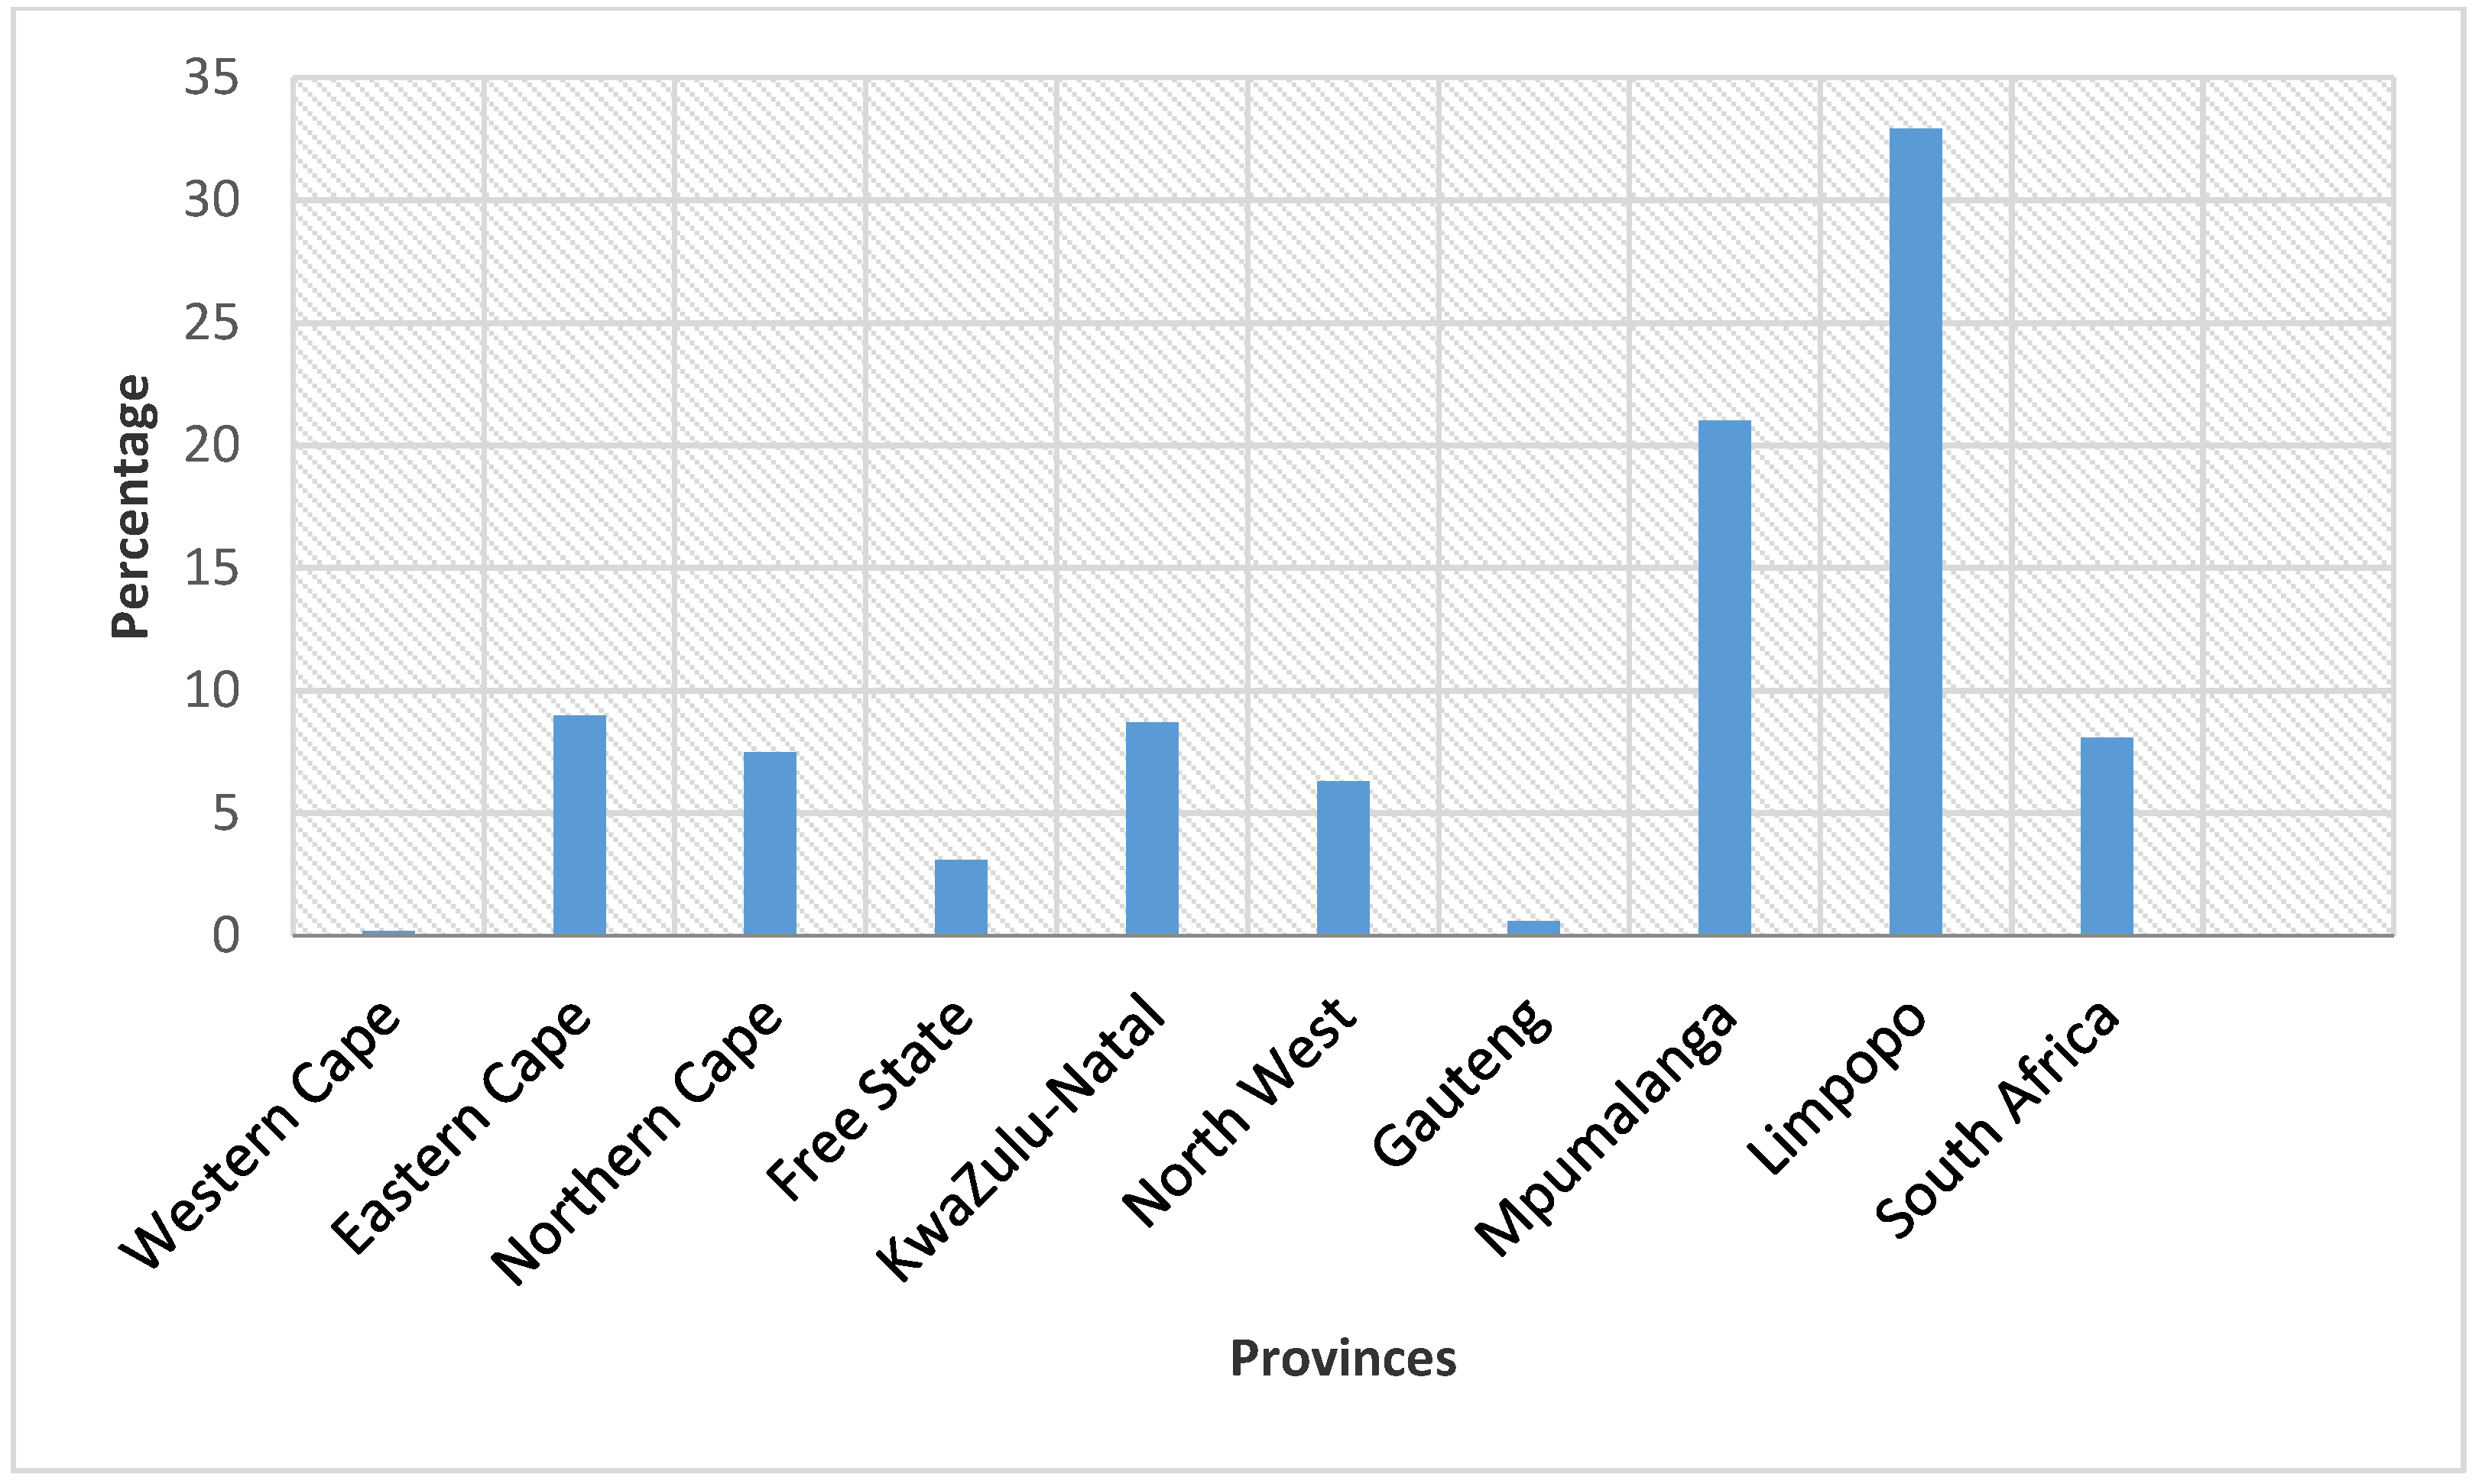
The Eastern Cape is the third province with a huge number of households using firewood for cooking as indicated in Figure 5, Limpopo has the highest number of households using firewood at 32.9% followed by Mpumalanga with a percentage of 21.0%, Eastern Cape 9.0% and KwaZulu-Natal 8.7%. The Western Cape and Gauteng provinces have the lowest percentage of households using firewood, as indicated by less than one percent of households using firewood for cooking (0.2% and 0.6%), respectively [36].
Table 5 shows the number of consumer units receiving basic electricity in the Eastern Cape compared to other provinces in South Africa,
The Eastern Cape is among the poorest provinces in South Africa. It is among the provinces that receive the highest number of units of basic electricity services at 303,753, and 21.7% of the proportion benefitting, which is higher than Kwazulu Natal at 15.8; North West at 10.4; Mpumalanga at 8.1 and Limpopo at 5.5. Free basic electricity is received by poor households which receive 50 kWh of electricity free per household per month.
Table 6 summarises the considerable contributions made by the government to indigent households in the Eastern Cape in the form of free basic alternative energy, namely candles, paraffin gas and solar energy, to combat energy poverty among poor households.
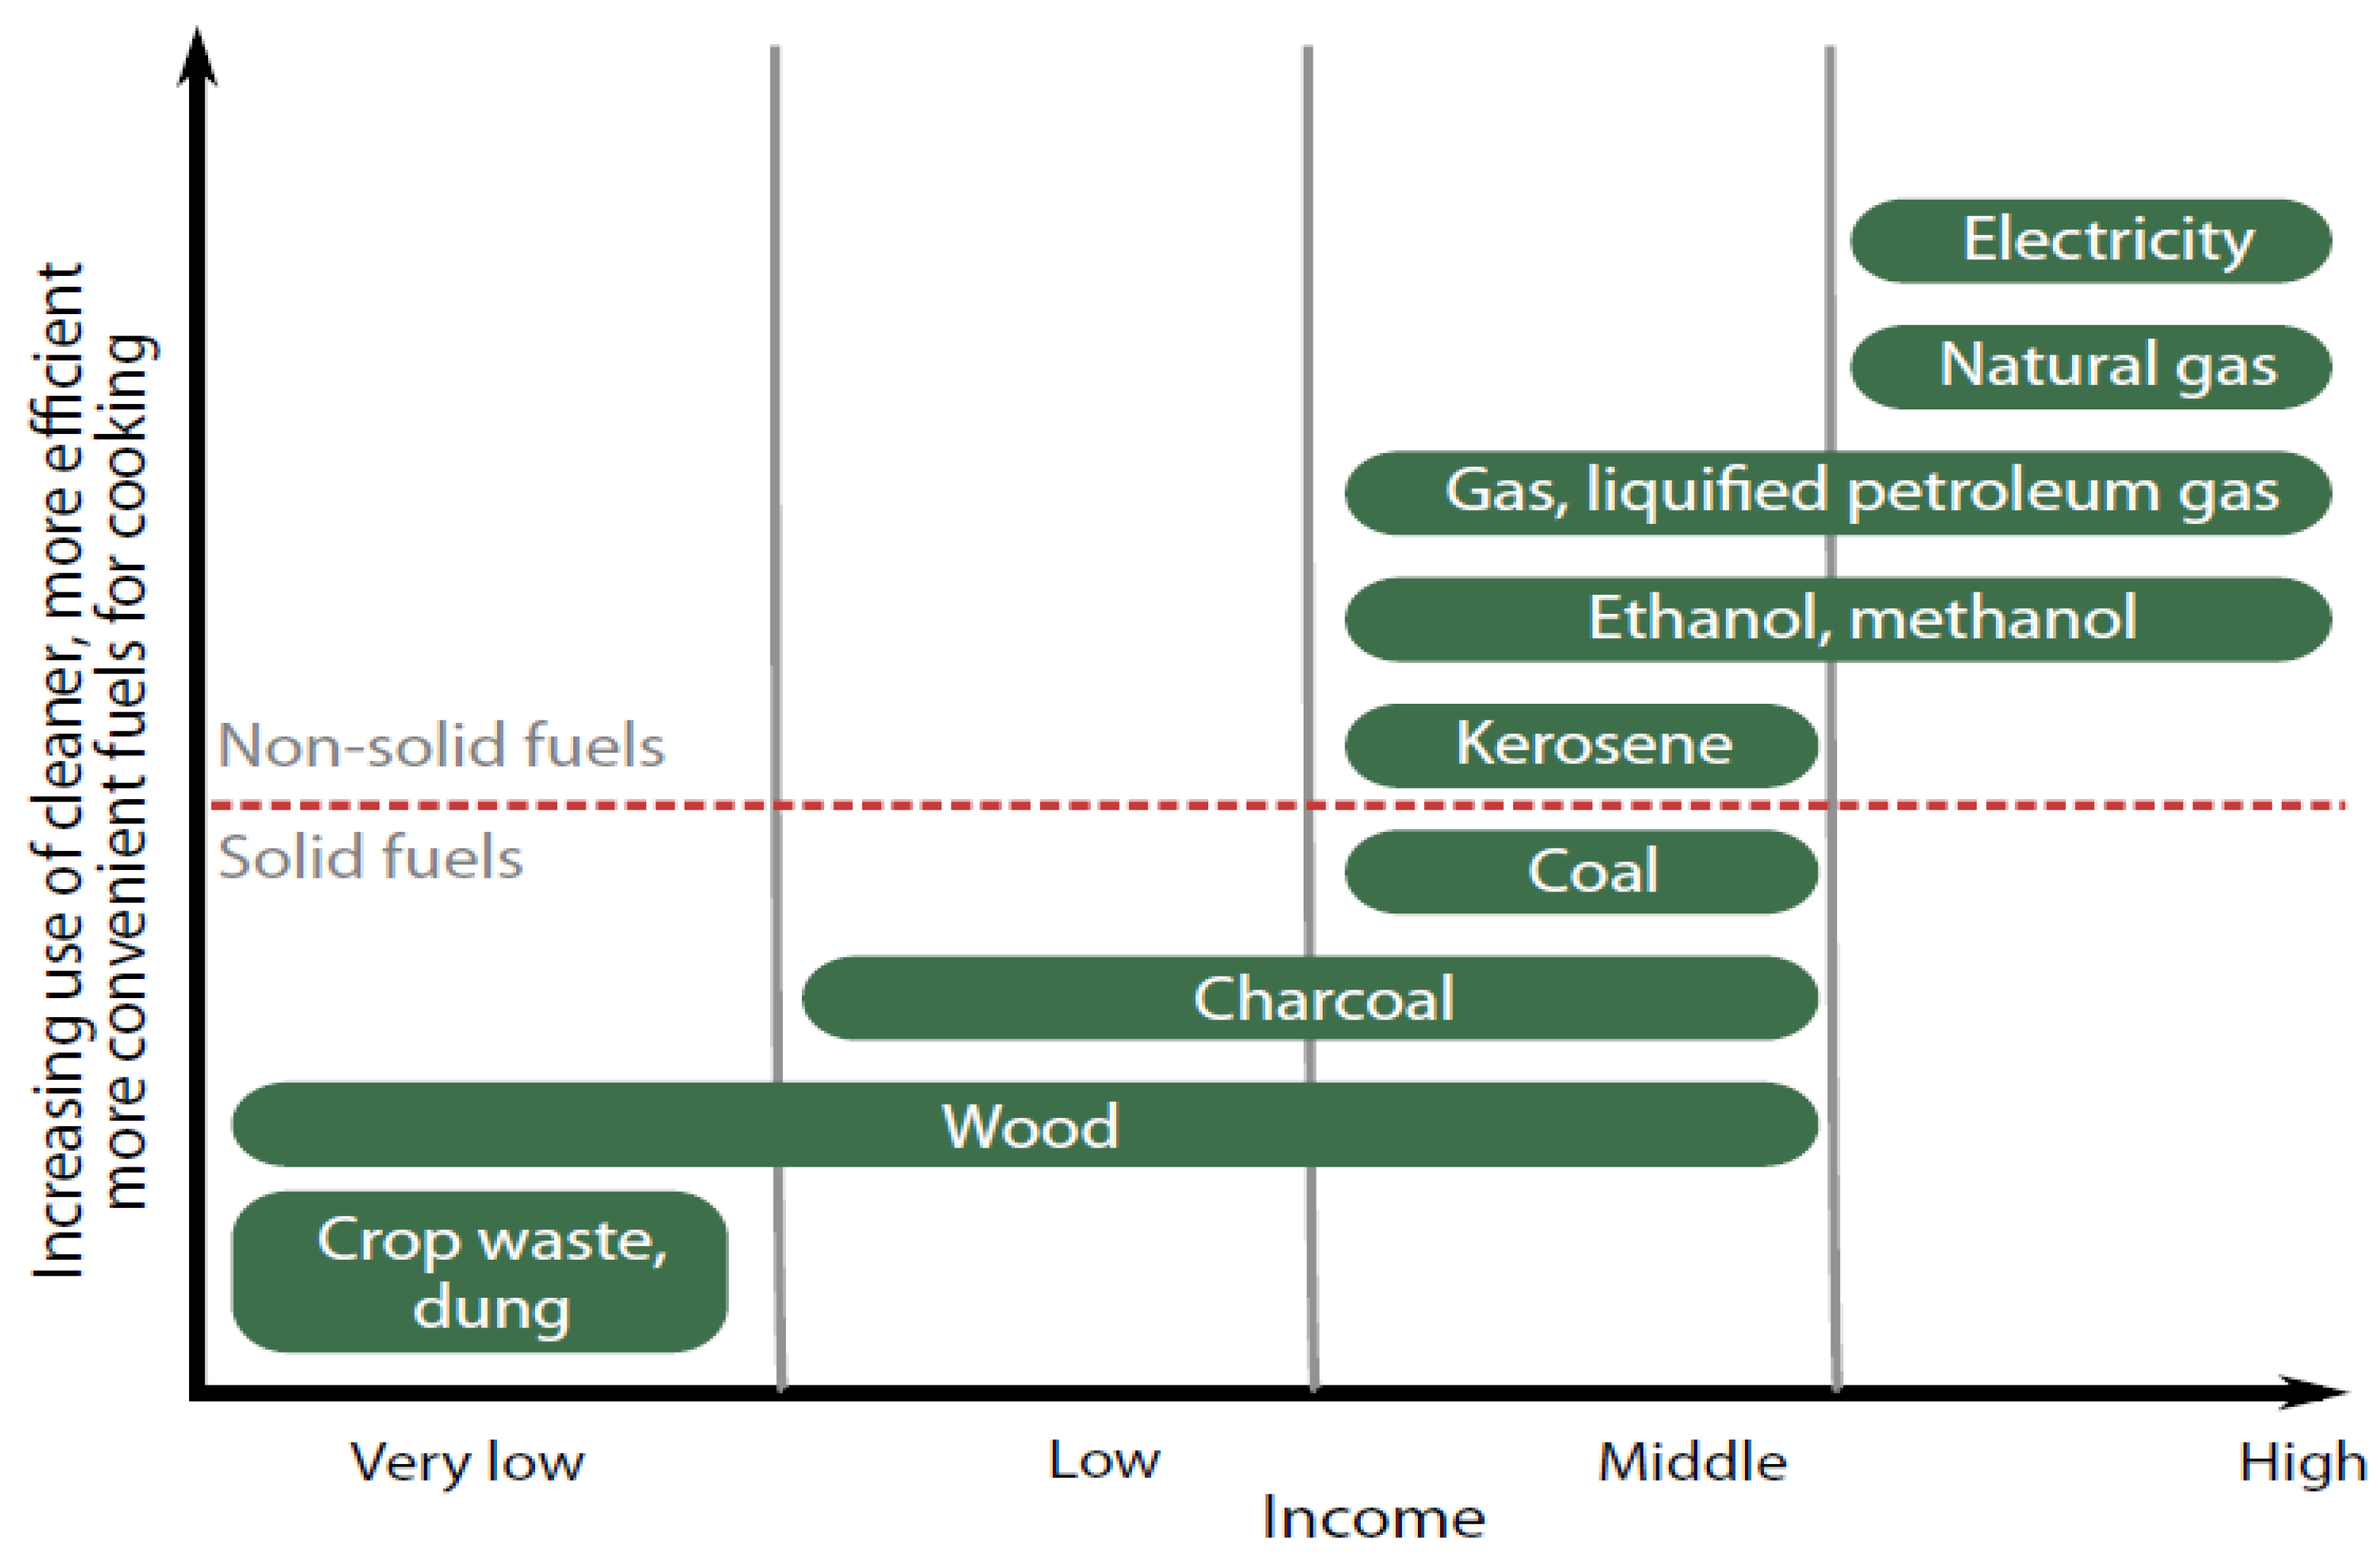
A free basic alternative is non-grid electricity free electricity given to low-income households in areas not yet connected to the grid or to mountainous, remote and sparsely populated areas for which it would be uneconomical to connect to the grid. It is important to note that not all low-income households receive free basic alternative energy because of budget constraints of certain municipalities. Although the government has demonstrated commendable commitment, some of the interventions, however, have loopholes because some municipalities are providing the indigent households with non-renewable sources for example, 24,680 households in the Eastern Cape were provided with paraffin. Using traditional kerosene lights may be detrimental to health and the property because it may result in the burning of houses if not properly monitored. In 2020, 625 candles were provided to indigent households and 4320 households were provided with Liquefied petroleum gas. Although liquefied petroleum gas is a cleaner source of energy, it is a non-renewable source of energy. The South African government made efforts to combat energy poverty in the Eastern Cape however, there remains a great need to focus on renewable energy sources and to tackle the root causes of energy poverty with sustainable solutions. In many instances, energy poverty is an outward manifestation of income poverty. The energy ladder in Figure 6 indicates that income determines the type of energy households use.
The energy ladder in Figure 6 was used to illustrate the energy status of the Eastern Cape, starting with the most traditional to the most advanced technology. At the bottom of the ladder is crop waste, dung, wood, charcoal and kerosene, which the poorest households in the Eastern Cape mainly use. However, dung is rarely used in the Eastern Cape because there is plenty of wood. Poor households also use electricity, mainly government-provided electricity. They supplement the free energy with the sources that are at the bottom of the ladder to save costs. Middle-income households use ethanol, gas, liquefied gas, natural gas and electricity. High-income households use electricity as in times of load shedding. The choice of energy type is determined by the amount of income which the household has [38]. In areas without grid connection, kerosene, firewood and candles are used in poor households, whilst solar PV modules and diesel/petrol generators are used by middle- and high-income households.
For indigent households, there are few options for energy choices as they continue to be dependent on the government. Due to inadequate government support, poor households supplement government energy support with cheaper sources of energy, most of which are detrimental to health. Although adopting renewable energy technology is essential, the ongoing use of non-renewable energy technologies in indigent households is largely driven by income poverty. Poor people generally do not turn to non-renewable energy sources willingly, but they tend to do so in the absence of income to install renewable energy technologies. A closer look at the energy situation in the rural areas in the Eastern Cape reveals that undeniable efforts have been made by the South African government; however, there is a great need for innovation in the energy sector to significantly reduce energy poverty in rural areas [39].
People in rural areas use firewood for cooking due to the availability of forests; however, it was found that the use of a solar oven for about 6–8 months a year will save about 16.8 million tons of firewood and will reduce emissions by 38.4 million tons of carbon dioxide per year [40]. This would also reduce diseases such as lung cancer and premature death which are associated with the use of firewood. At the same time, living in energy-poor households without enough warmth may result in diseases such as asthma, stroke and heart diseases [41]. The challenge of biomass traditional cooking stoves is that they release carbon monoxide, nitrous oxide, methane and black carbon, which cause climate change. Improved cooking stoves save trees, reduce emissions of air pollutants and save time [42].

5. Recommendations

Investing in renewable energy technologies that are available but underutilised, can be a solution for energy poverty-stricken households in rural areas. Using such technologies will reduce the current problem of load shedding, which the countries in Southern Africa, such as South Africa is currently facing. There is also a need for taking into consideration the energy needs, the acceptability of the technology by the community and the income of the people where the technology will be implemented to avoid loss in the long run.
Moreover, there is need for increasing the number of wind farms for power generation and utilisation of biogas electricity generated from rural Blair toilets. Furthermore, the authors also recommend more research on geothermal and hydro power energy in the Eastern Cape Province.

6. Conclusions

Like other countries, South Africa is facing the challenge of energy poverty, and in such a scenario, rural people use different energy coping strategies. This paper focused on the experience of South Africa by providing a comprehensive overview of the energy status in the Eastern Cape, and the measures adopted to attempt to combat energy poverty. The evidence presented in this paper shows that rural areas in South Africa, like in other African countries with good renewable energy technologies potential, are still a long way from being fully implemented, as indicated by some households still struggling to meet their energy needs. Thus, there is a need for innovation in renewable energy technologies taking into consideration the income and available energy coping strategies for rural households rather than depending on help from the government. Although the help from the government is not sufficient to ensure that all of the energy needs of the energy poor households can be successfully met, the indigent energy policy has played a significant role in low-income households. Despite the failure of the government to meet all the energy needs of the rural people, the progress which has been made, largely owing to the different renewable energy technologies projects, should not be discounted, as it represents a viable starting point towards the implementation of the renewable energy technologies in the province.

Author Contributions

Conceptualisation: P.M. Writing Original draft: S.Y.C. and P.M.; Methodology: S.Y.C.; Supervision/Resources/Project administration: P.M.; Writing review and editing: S.Y.C. and P.M. All authors have read and agreed to the published version of the manuscript.

Funding

This research was supported by the National Research Foundation of South Africa No. 138534, and the Govani Mbeki Research and Development Centre.

Data Availability Statement

Further details regarding data presented in this study are available on the request from the corresponding author.

Acknowledgments

This research was supported by the National Research Foundation of South Africa and the Govan Mbeki Research and Development Centre. Its contents are solely the responsibility of the authors and do not necessarily represent the official views of the Govan Mbeki Research and Development Centre and the National Research Foundation of South Africa.

Conflicts of Interest

The authors declare no conflict of interest.

References

  1. Sweeney, S. Leaping Backwards: Why Is Energy Poverty Rising in Africa? A Journal of Ideas, Analysis and Debate. July 2022. Available online: https://newlaborforum.cuny.edu/2022/07/18/leaping-backwards-why-is-energy-poverty-rising-in-africa/ (accessed on 1 January 2023).
  2. Ayamolowo, O.J.; Manditereza, P.; Kusakana, K. South Africa power reforms: The Path to a dominant renewable energy-sourced grid. Energy Rep. 2022, 8, 1208–1215. [Google Scholar] [CrossRef]
  3. Nkosi, N.S.; Govender, K.K. Electricity Price Increases and Energy Demand: The Case of an Electricity Supplier in South Africa. Int. J. Energy Econ. Policy 2022, 12, 138–145. [Google Scholar] [CrossRef]
  4. STATS, SA. General Household Survey 2020. Available online: https://www.statssa.gov.za/publications/P0318/P03182020.pdf (accessed on 1 January 2023).
  5. Makgetla, N.; Patel, M. The Coal Value Chain in South Africa; Trade & Industrial Policy Strategies: Pretoria, South Africa, 2021. [Google Scholar]
  6. Uhunamure, S.E.; Shale, K. A SWOT Analysis Approach for a Sustainable Transition to Renewable Energy in South Africa. Sustainability 2021, 13, 3933. [Google Scholar] [CrossRef]
  7. Briers, S. Outrage: Load Shedding in South Africa. Architectural Review. 12 October 2022. Available online: https://www.architectural-review.com/essays/outrage/outrage-load-shedding-in-south-africa (accessed on 1 January 2023).
  8. Department of Energy. State of Renewable Energy in South Africa; Department of Energy: Pretoria, South Africa, 2015. [Google Scholar]
  9. Aliyu, A.K.; Modu, B.; Tan, C.W. A review of renewable energy development in Africa: A focus in South Africa, Egypt and Nigeria. Renew. Sustain. Energy Rev. 2018, 81, 2502–2518. [Google Scholar] [CrossRef]
  10. Chaba Wind Farm|South African Wind Energy Association. Available online: https://sawea.org.za/chaba-wind-farm/ (accessed on 1 June 2020).
  11. South African Wind Farms|South African Wind Energy Association. Available online: https://sawea.org.za/wind-map/wind-ipp-table/ (accessed on 2 June 2020).
  12. Nojoli Wind Farm, Azari Group. (n.d.). Available online: https://azarigroup.com/project/nojoli-wind-farm/ (accessed on 2 June 2020).
  13. Sunderasan, S. Amakhala wind: Turbulence in the detail? In Cleaner-Energy Investments; Springer: Berlin/Heidelberg, Germany, 2015; pp. 37–51. [Google Scholar]
  14. Doty, A.; Martin, A. Assessment of bat and avian mortality at a pilot wind turbine at Coega, Port Elizabeth, Eastern Cape, South Africa. N. Z. J. Zool. 2013, 40, 75–80. [Google Scholar] [CrossRef] [Green Version]
  15. Baker, L. The evolving role of finance in South Africa’s renewable energy sector. Geoforum 2015, 64, 146–156. [Google Scholar] [CrossRef]
  16. Pollet, B.G.; Staffell, I.; Adamson, K.-A. Current energy landscape in the Republic of South Africa. Int. J. Hydrogen Energy 2015, 40, 16685–16701. [Google Scholar] [CrossRef]
  17. Metro Wind Van Stadens Wind Farm. Available online: https://www.energy.org.za/data-and-tools/project-database/metrowind-van-stadenswind-farm (accessed on 2 June 2020).
  18. Pegels, A. Renewable energy in South Africa: Potentials, barriers and options for support. Energy Policy 2010, 38, 4945–4954. [Google Scholar] [CrossRef]
  19. Fluri, T.P. The potential of concentrating solar power in South Africa. Energy Policy 2009, 37, 5075–5080. [Google Scholar] [CrossRef]
  20. Banks, D.; Schaffler, J. The Potential Contribution of Renewable Energy in South Africa; Sustainable Energy & Climate Change Project: Johannesburg, South Africa, 2006. [Google Scholar]
  21. Siwal, S.S.; Zhang, Q.; Devi, N.; Saini, A.K.; Saini, V.; Pareek, B.; Gaidukovs, S.; Thakur, V.K. Recovery processes of sustainable energy using different biomass and wastes. Renew. Sustain. Energy Rev. 2021, 150, 111483. [Google Scholar] [CrossRef]
  22. Osman, A.I.; Mehta, N.; Elgarahy, A.M.; Al-Hinai, A.; Al-Muhtaseb, A.H.; Rooney, D.W. Conversion of biomass to biofuels and life cycle assessment: A review. Environ. Chem. Lett. 2021, 19, 4075–4118. [Google Scholar] [CrossRef]
  23. Nethengwe, N.S.; Uhunamure, S.E.; Tinarwo, D. Potentials of biogas as a source of renewable energy: A case study of South Africa. Int. J. Renew. Energy Res. 2018, 8, 1112–1123. [Google Scholar]
  24. Saikia, K.; Kakati, B.K.; Boro, B.; Verma, A. Current Advances and Applications of Fuel Cell Technologies. In Recent Advancements in Biofuels and Bioenergy Utilization; Springer: Singapore, 2018; pp. 303–337. [Google Scholar] [CrossRef]
  25. Mukumba, P.; Makaka, G.; Mamphweli, S.; Masukume, P.-M. Design, construction and mathematical modelling of the performance of a biogas digester for a family in the Eastern Cape province, South Africa. Afr. J. Sci. Technol. Innov. Dev. 2019, 11, 391–398. [Google Scholar] [CrossRef]
  26. Winter, M.; Brodd, R.J. What Are Batteries, Fuel Cells, and Supercapacitors? Chem. Rev. 2004, 104, 4245–4270. [Google Scholar] [CrossRef] [Green Version]
  27. Mutungwazi, A.; Mukumba, P.; Makaka, G. Biogas digester types installed in South Africa: A review. Renew. Sustain. Energy Rev. 2018, 81, 172–180. [Google Scholar] [CrossRef]
  28. Jeruma, J.; Inambao, F. Energy security: Investigating geothermal heat sinks for air conditioning systems at airports in South Africa–a techno economic assessment. Int. J. Mech. Prod. Eng. Res. Dev. 2021, 11, 231–246. [Google Scholar]
  29. Department of Science and Innovation. Small-Scale Hydropower Becomes a Reality in the Eastern Cape. Stay Safe. 5 October 2021. Available online: https://www.dst.gov.za/index.php/media-room/latest-news/3505-small-scale-hydropower-becomes-a-reality-in-the-eastern-cape (accessed on 1 January 2023).
  30. Murshed, M.; Ozturk, I. Rethinking energy poverty reduction through improving electricity accessibility: A regional analysis on selected African nations. Energy 2023, 267, 126547. [Google Scholar] [CrossRef]
  31. Kulkarni, V.; Kulkarni, K. A Blockchain-based Smart Grid Model for Rural Electrification in India. In Proceedings of the 2020 8th International Conference on Smart Grid (icSmartGrid), Paris, France, 17–19 June 2020; pp. 133–139. [Google Scholar] [CrossRef]
  32. Dongzagla, A.; Adams, A.-M. Determinants of urban household choice of cooking fuel in Ghana: Do socioeconomic and demographic factors matter? Energy 2022, 256, 124613. [Google Scholar] [CrossRef]
  33. Karakara, A.A.; Osabuohien, E.S. Clean versus dirty energy: Empirical evidence from fuel adoption and usage by households in Ghana. Afr. J. Sci. Technol. Innov. Dev. 2020, 13, 785–795. [Google Scholar] [CrossRef]
  34. Ningi, T.; Taruvinga, A.; Zhou, L. Determinants of energy security for rural households: The case of Melani and Hamburg communities, Eastern Cape, South Africa. Afr. Secur. Rev. 2020, 29, 299–315. [Google Scholar] [CrossRef]
  35. Monyai, P.B.; Chivanga, S. Overcoming the household energy gap in South Africa. IMIESA 2020, 45, 45–47. [Google Scholar]
  36. STATS, SA. General Household Survey 2021. Available online: https://www.statssa.gov.za/?p=15482 (accessed on 1 January 2023).
  37. Paunio, M. Kicking Away the Energy Ladder—How Environmentalism Destroys Hope for the Poorest. The Global Warming Policy Foundation (GWPF Briefing 30). 2018. Available online: https://www.thegwpf.org/content/uploads/2018/05/Paunio-EnergyLadder.pdf (accessed on 15 December 2019).
  38. Butera, F.M.; Adhikari, R.S.; Caputo, P.; Facchini, A. The challenge of energy in informal settlements. A review of the literature for Latin America and Africa. Anal. Energy Consum. Energy Effic. Informal Settl. Dev. Ctries. 2015, 1–32. Available online: https://www.enelx.com/content/dam/enel-found/topic-download/The%20challenge%20of%20Energy%20in%20Informal%20settlements.pdf (accessed on 1 January 2023).
  39. Chivanga, S.Y.; Monyai, P.B. Inequalities in Access to Energy in Informal Settlements: Towards Energy Justice in Gqeberha and Komani in South Africa. Water-Energy Nexus 2023, 6, 1–5. [Google Scholar] [CrossRef]
  40. Nandwani, S.S. Solar cookers—Cheap technology with high ecological benefits. Ecol. Econ. 1996, 17, 73–81. [Google Scholar] [CrossRef]
  41. Halkos, G.; Gkampoura, E.-C. Coping with Energy Poverty: Measurements, Drivers, Impacts, and Solutions. Energies 2021, 14, 2807. [Google Scholar] [CrossRef]
  42. Jenkins, B.M.; Baxter, L.L.; Koppejan, J. Biomass combustion. In Thermochemical Processing of Biomass: Conversion into Fuels, Chemicals and Power; John Wiley & Sons: Hoboken, NJ, USA, 2019; pp. 49–83. [Google Scholar]
Figure 1. Operational capacity of solar, wind and concentrated solar power energy from 2013 to 2021. Adapted from [8].
Challenges 14 00019 g001
Figure 2. Eastern Cape electricity generation by different technologies compared to other provinces [4].
Challenges 14 00019 g002
Figure 3. Annual solar radiation Adapted from [20].
Challenges 14 00019 g003
Figure 4. Areas with the potential of geothermal energy Adopted from [28].
Challenges 14 00019 g004
Figure 5. Percentage of households which use firewood and coal for cooking. Adapted from [36].
Challenges 14 00019 g005
Figure 6. The energy ladder—Adapted from [37].
Challenges 14 00019 g006
Table 1. Energy mix of South Africa.
Energy SourcePercentage Contribution
Coal78
OCGT5.9
Wind5.7
Hydro3.9
Solar3.6
Nuclear3.2
Table 2. The wind farms in the Eastern Cape.
Wind Farm NameCapacity MWYear LaunchedReference
Gibson bay111.02017[10]
Waainek24.02016[11]
Kouga80.02015[11]
Nojoli88.02016[12]
Grassridge60.02016[11]
Amakhala emoyeni139.02016[13]
Coega43.22010[14]
Cookhouse138.62014[15]
Jeffreys Bay138.02014[11]
Dorper100.02015[15]
Glassridge61.52016[16]
Metrowind27.02014[17]
Chaba21.02015[10]
Adapted from [9].
Table 3. Solar PV installation in Eastern Cape.
NameCapacity MW
Dreunberg75
Grassridge60
Herbert19.9
Table 4. Biogas digesters in the Eastern Cape.
AreaDeveloperSubstrate InputPower Output
Alice, Eastern capeCAE/University of Fort Hare4000 m3 of dairy and piggery manure2 × 132 kVa electricity generator
Eastern Cape (Alice, Fort Corx and Melani villages), Western Cape (Phillipi), Kwazululu NatalAGAMAManure from 2+ cows, school organic and sewage wasteRural cooking fuel
QueenstowniBert42 tonnes mixed waste from a piggery per dayNo data
Adapted from [27].
Table 5. Number of consumer units receiving basic electricity in the Eastern Cape compared to other provinces in South Africa.
ProvinceNumber of Consumer Units Receiving Electricity ServicesNumber of Consumer Units Receiving Free Basic Electricity ServicesProportion Benefiting (%)
Western Cape1,623,133456,40828.1
Eastern Cape1,396,930303,75321.7
Northern Cape315,31176,53524.3
Free State846,087158,75818.8
KwaZulu-Natal2,012,343317,81015.8
North West1,077,730112,27210.4
Gauteng2,711,876784,73528.9
Mpumalanga1,037,27183,7088.1
Limpopo1,459,31780,0045.5
South Africa12,479,9982,373,98319.0
Adapted from [28].
Table 6. Number of indigent households in each province provided with free basic alternative energy, 2020.
ProvinceCoalLiquefied Petroleum GasParaffinCandlesSolar Home SystemFire GelOther
Western Cape0000162000
Eastern Cape0432024,68062530,42761124873
Northern Cape0062552725000527
Free State0000645000
KwaZulu-Natal0000454814490
North West0000000
Gauteng000084,94000
Mpumalanga00 0000
Limpopo00 4449700
South Africa00 134,59275615400
Adapted from [28].
Disclaimer/Publisher’s Note: The statements, opinions and data contained in all publications are solely those of the individual author(s) and contributor(s) and not of MDPI and/or the editor(s). MDPI and/or the editor(s) disclaim responsibility for any injury to people or property resulting from any ideas, methods, instructions or products referred to in the content.

