
Measurement Invariance of Prayer Importance Scale: Religiosity, Gender, Age

Abstract
:1. Introduction
2. Results
2.1. Method
2.2. Participants
2.3. Procedure
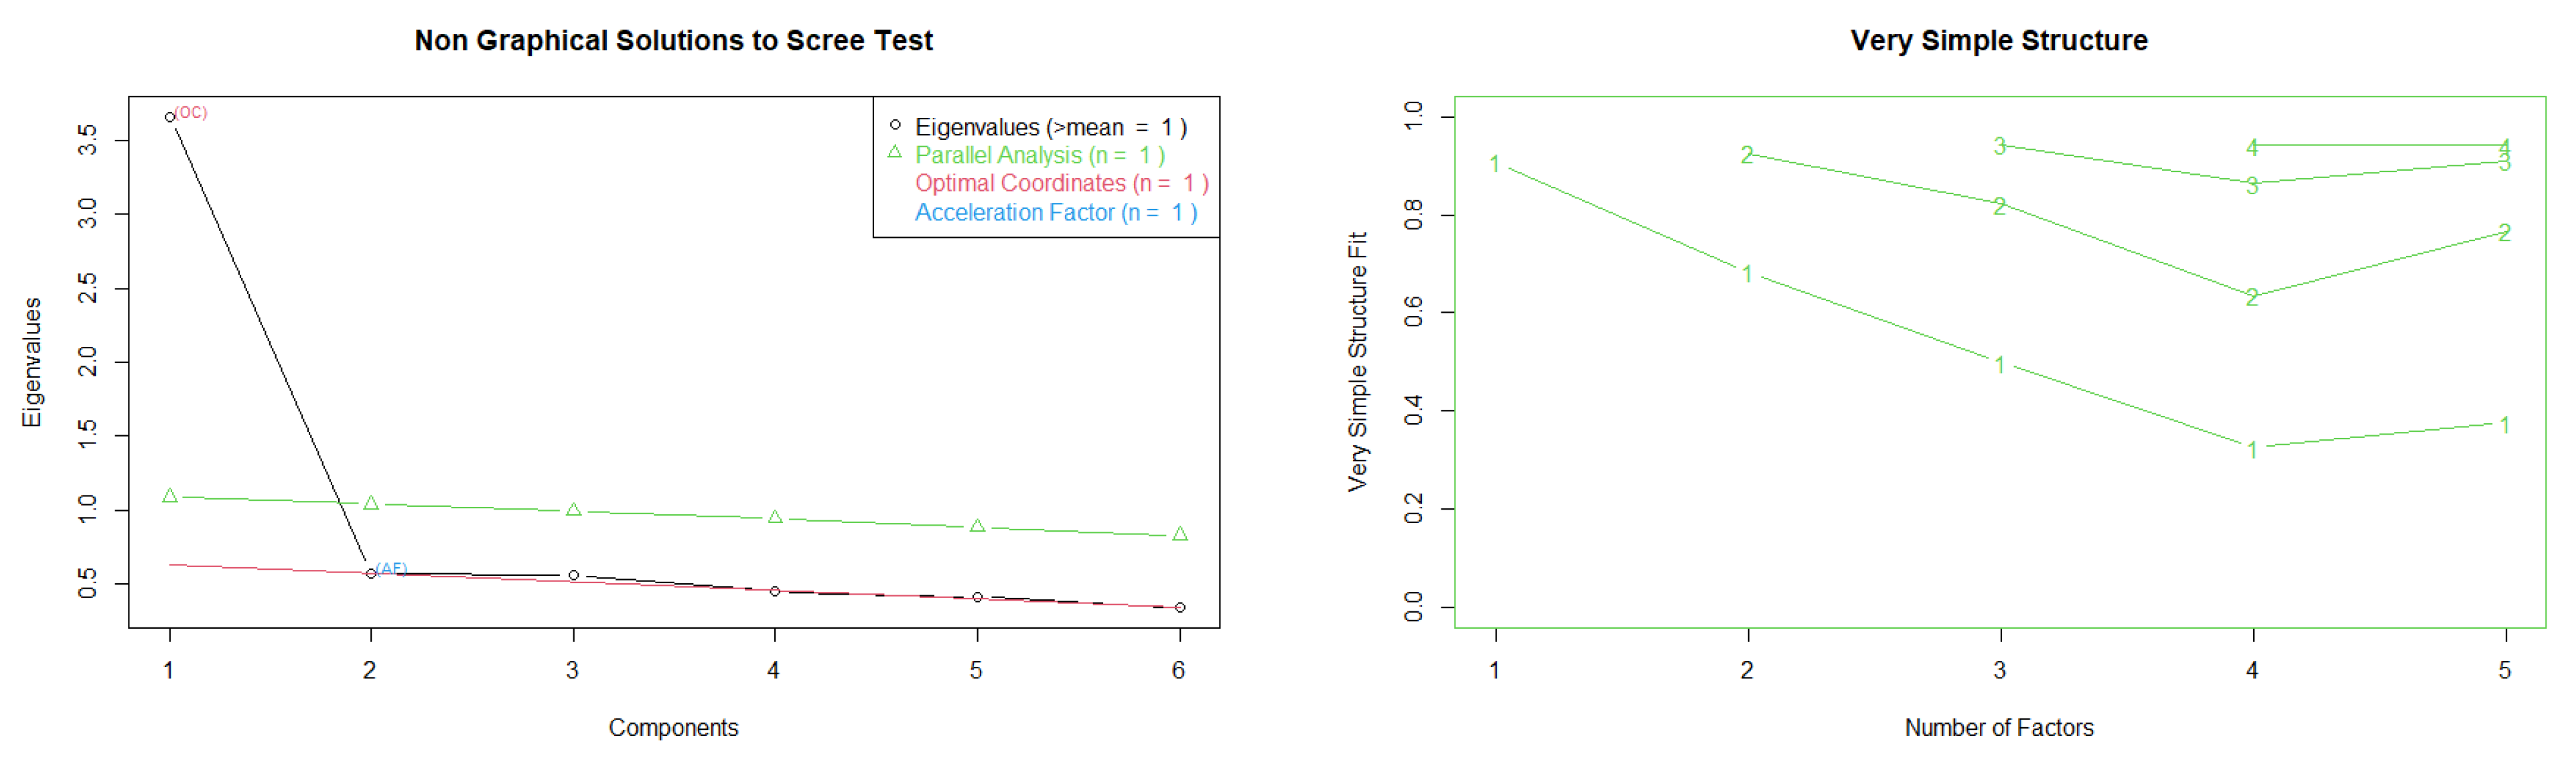
2.4. Analysis
2.4.1. Religiosity
2.4.2. Gender
2.4.3. Age
3. Discussion
Author Contributions
Funding
Institutional Review Board Statement
Informed Consent Statement
Data Availability Statement
Conflicts of Interest
Appendix A
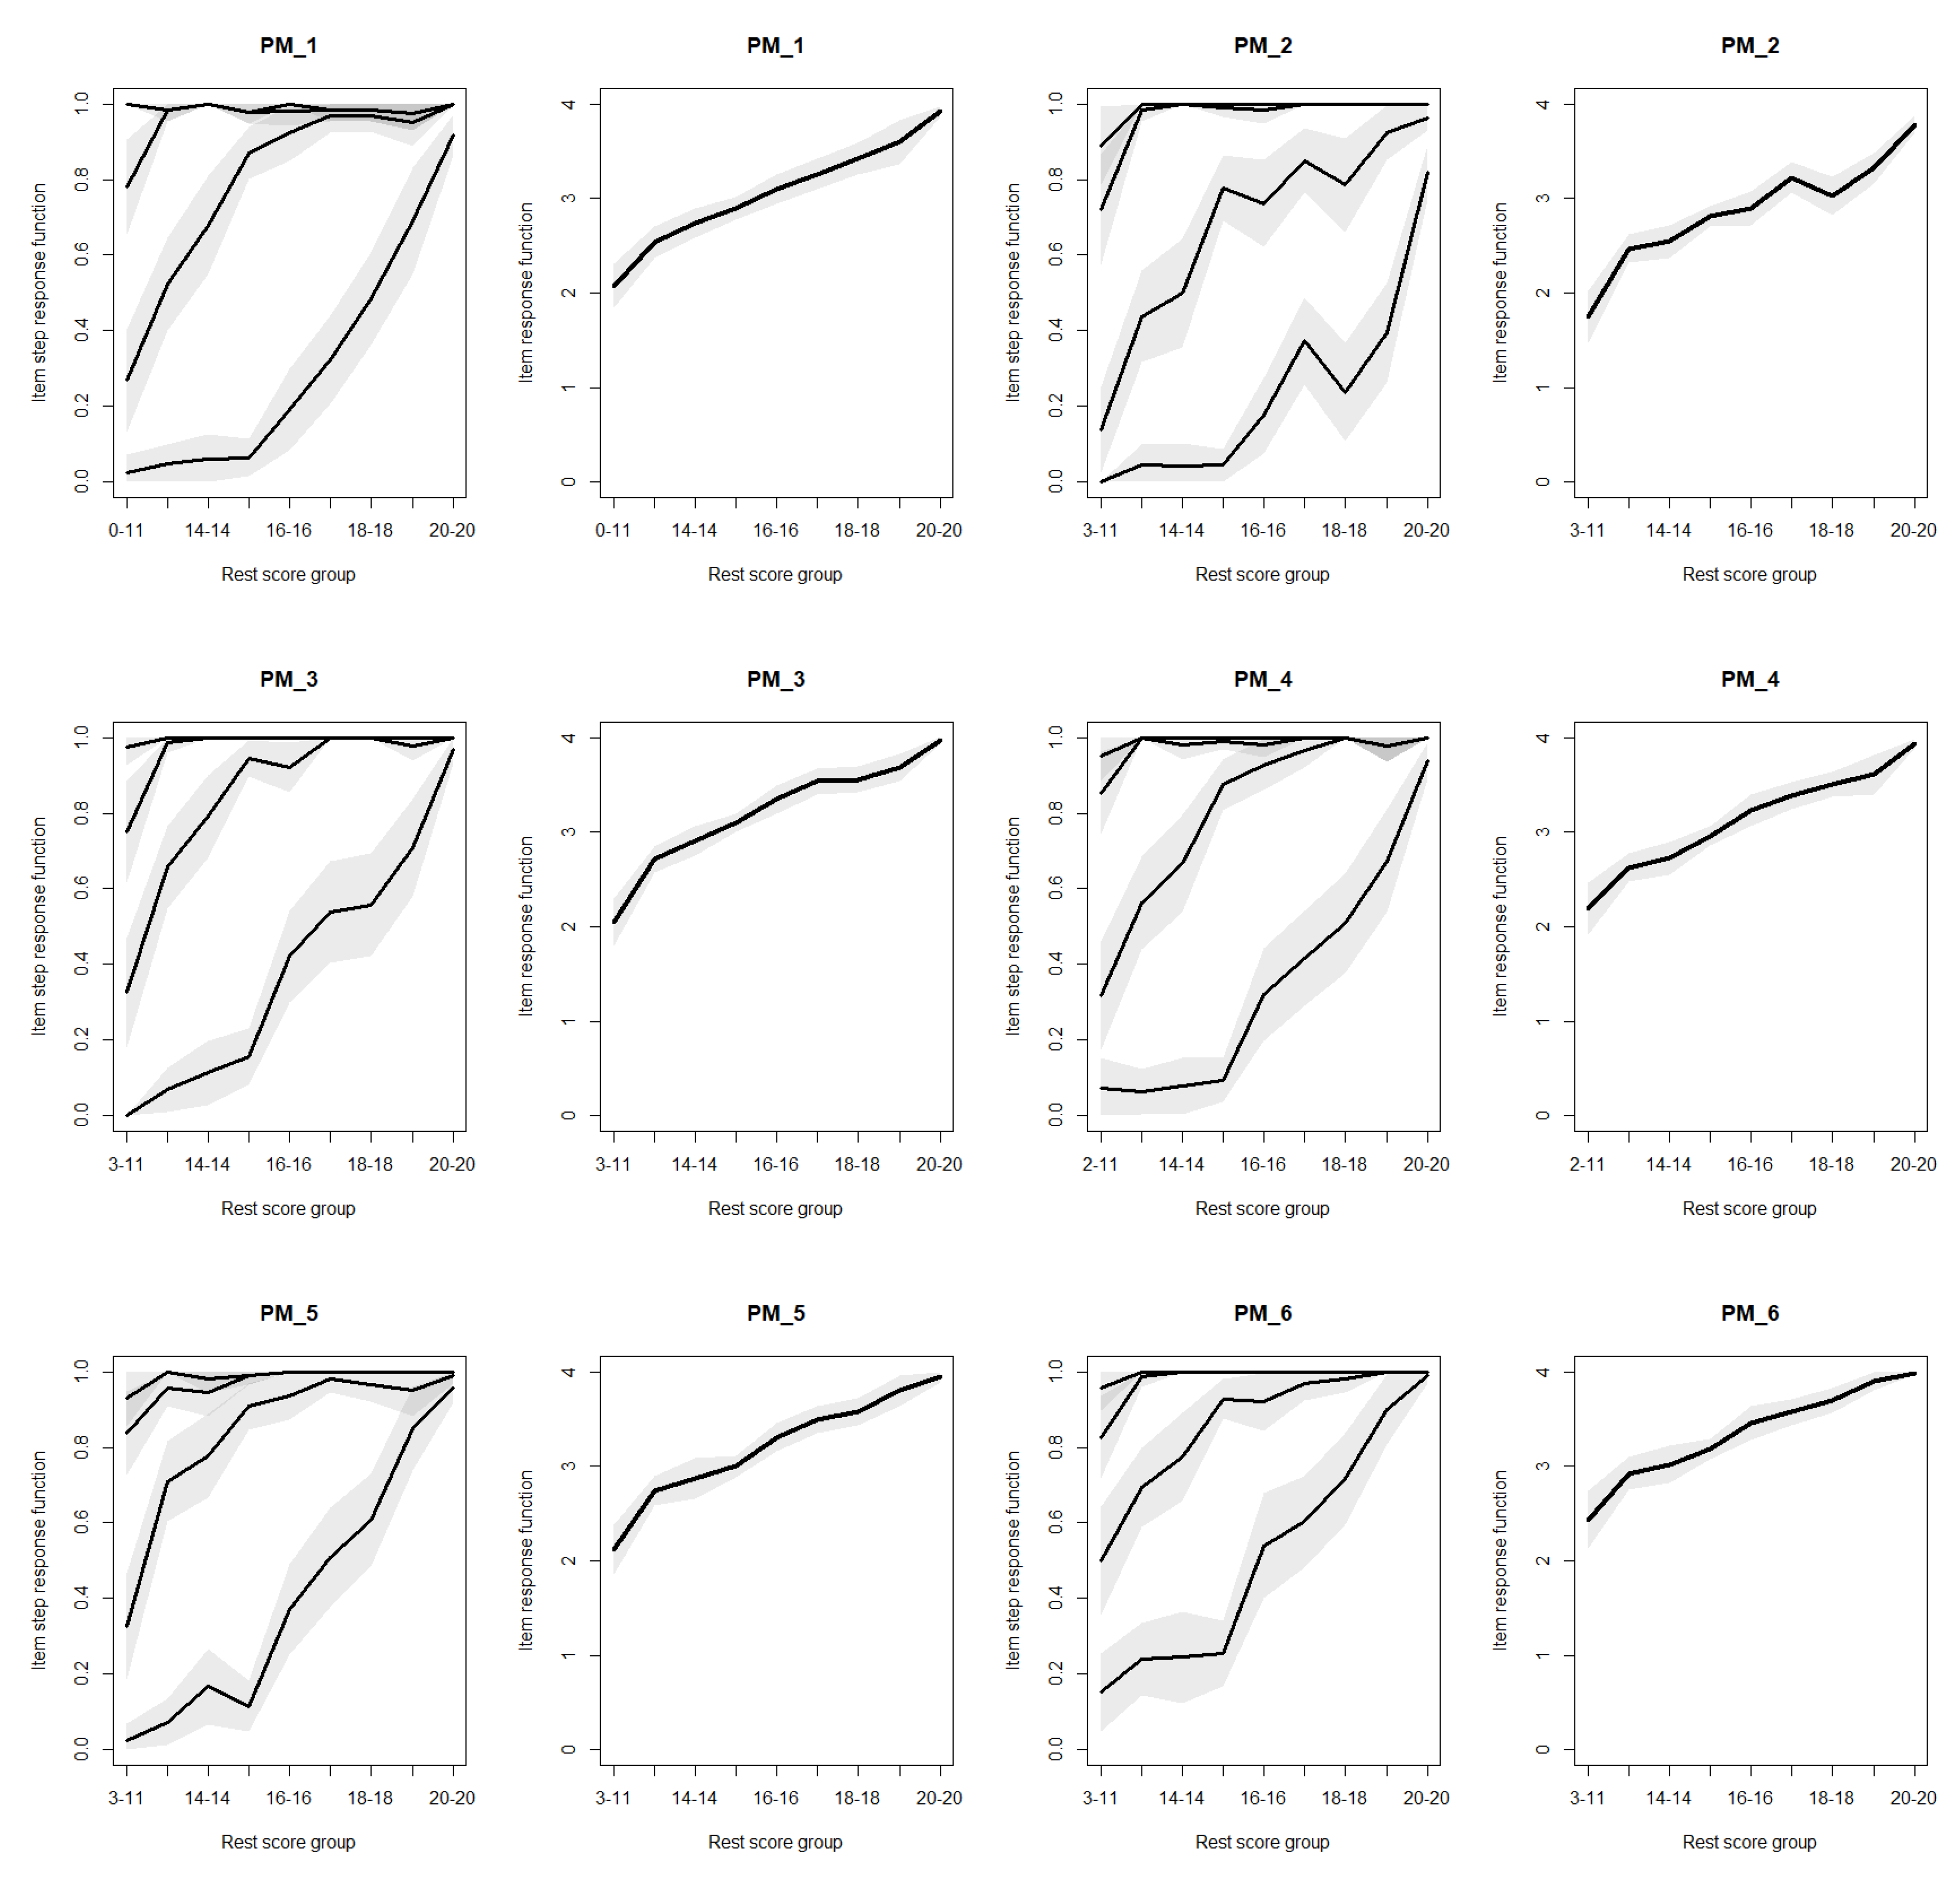
- I persist in prayer even when I don’t see the results/Trwam na modlitwie nawet wtedy, gdy nie dostrzegam jej skutków
- Although other events force priority, I find time to pray/Mimo że inne sprawy wymuszają pierwszeństwo, znajduję czas na modlitwę
- Even though I experience misfortune, I persist in prayer/Mimo że spotyka mnie nieszczęście, trwam na modlitwie
- I persist in prayer, even when God seems distant/Trwam na modlitwie nawet wtedy, gdy Bóg wydaje mi się odległy
- Even though I am aware of the bad things I have done, I do not give up on praying/Mimo świadomości popełnionego przeze mnie zła, nie rezygnuję z modlitwy
- Daily prayer gives me strength to overcome difficulties/Codzienna modlitwa daje mi siły do przezwyciężania trudności
References
- Attali, Dean, and Christopher Baker. 2022. ggExtra: Add Marginal Histograms to ‘ggplot2’, and More ‘ggplot2’ Enhancements. R Package Version 0.10.0. Available online: https://cran.r-project.org/web/packages/ggExtra/index.html (accessed on 3 January 2023).
- Bache, Stefan, Hadley Wickham, Lionel Henry, and RStudio. 2022. Magrittr: A Forward-Pipe Operator for R. R Package Version 2.0.3. Available online: https://cran.r-project.org/web/packages/magrittr/index.html (accessed on 3 January 2023).
- Bänziger, Sarah, Marinus van Uden, and Jacques Janssen. 2008. Praying and coping: The relation between varieties of praying and religious coping styles. Mental Health, Religion & Culture 11: 101–18. [Google Scholar]
- Bernaards, Coen A., and Robert I. Jennrich. 2005. Gradient Projection Algorithms and Software for ArbitraryRotation Criteria in Factor Analysis. Educational and Psychological Measurement 65: 676–96. [Google Scholar] [CrossRef]
- Borowska, Monika. 2020. Psychologiczne tendencje w religijności osób żyjących w związkach niesakramentalnych. [Psychological tendencies in the religiosity of people living in nonscramental relationships]. In Konteksty religijności i rodziny [Contexts of Religiosity and Family]. Edited by Monika Red Borowska and Jolanta Kraśniewska. Krakowie: Wydawnictwo Naukowe Uniwersytet Papieski Jana Pawła II w Krakowie, pp. 301–29. [Google Scholar]
- Dima, Alexandra L. 2018. Scale validation in applied health research: Tutorial for a 6-step r-based psychometrics protocol. Health Psychology and Behavioral Medicine 6: 136–61. [Google Scholar] [CrossRef] [PubMed]
- Epskamp, Sacha, Simon Stuber, Jason Nak, Myrthe Veenman, and Terrence Jorgensen. 2022. semPlot: Path Diagrams and Visual Analysis of Various SEM Packages’ Output. R Package Version 1.1.6. Available online: https://cran.r-project.org/web/packages/semPlot/index.html (accessed on 3 January 2023).
- Harrell, Frank, and Charles Dupont. 2022. Hmisc: Harrell Miscellaneous. R Package Version 4.7-2. Available online: https://cran.r-project.org/web/packages/Hmisc/index.html (accessed on 3 January 2023).
- Huber, Stefan, and Odilo Huber. 2012. The Centrality of Religiosity Scale (CRS). Religions 3: 710–24. [Google Scholar] [CrossRef]
- Jorgensen, Terrence D., Sunthud Pornprasertmanit, Alexander M. Schoemann, Yves Rosseel, Patrick Miller, Corbin Quick, and Mauricio Garnier-Villarreal. 2022. semTools: Useful Tools for Structural Equation Modeling. R package version 0.5-6. Available online: https://CRAN.R-project.org/package=semTools (accessed on 3 January 2023).
- Kassambara, Alboukadel. 2022. Ggpubr: ‘ggplot2’ Based Publication Ready Plots. R Package Version 0.5.0. Available online: https://cran.r-project.org/web/packages/ggpubr/index.html (accessed on 3 January 2023).
- Kirill, Müller, and Jennifer Bryan. 2020. Here: A Simpler Way to Find Your Files. R Package Version 1.0.1. Available online: https://cran.r-project.org/web/packages/here/index.html (accessed on 3 January 2023).
- Kulpaczyński, Stanisław, and Małgorzata Tatala. 2000. Zarys modelu wychowania do modlitwy w wybranych materiałach katechetycznych: (cz. I). [Outline of the model education to prayer in selected catechetical materials: (part 1)]. Seminare. Poszukiwania Naukowe 16: 289–99. [Google Scholar]
- Laakasuo, Michael, Jussi Palomäki, Sami Abuhamdeh, Otto Lappi, and Benjamin Ultan Cowley. 2022. Psychometric analysis of the flow short scale translated to Finnish. Scientific Reports 12: 20067. [Google Scholar] [CrossRef]
- Ladd, Kevin L., and Daniel N. McIntosh. 2008. Meaning, God, and prayer: Physical and metaphysical aspects of social support. Mental Health, Religion and Culture 11: 23–38. [Google Scholar] [CrossRef]
- Lishinski, Alex. 2021. lavaanPlot: Path Diagrams for ‘Lavaan’ Models via ‘DiagrammeR’. R Package Version 0.6.2. Available online: https://cran.r-project.org/web/packages/lavaanPlot/index.html (accessed on 3 January 2023).
- Long, Jacob. 2022. Jtools: Analysis and Presentation of Social Scientific Data. R Package Version 2.2.1. Available online: https://cran.r-project.org/web/packages/jtools/index.html (accessed on 3 January 2023).
- Luong, Raymond, and Jessica Kay Flake. 2022. Measurement invariance testing using confirmatory factor analysis and alignment optimization: A tutorial for transparent analysis planning and reporting. Psychological Methods, published online ahead of print. [Google Scholar]
- Murdoch, Duncan, and Edward Chow. 2022. Ellipse: Functions for Drawing Ellipses and Ellipse-Like Confidence Regions. R Package Version 0.5-6. Available online: https://cran.r-project.org/web/packages/ellipse/index.html (accessed on 3 January 2023).
- Neuwirth, Erich. 2022. RColorBrewer: ColorBrewer Palettes. R Package Version 1.1-3. Available online: https://cran.r-project.org/web/packages/RcolorBrewer/index.html (accessed on 3 January 2023).
- Pew Research Center. 2018. Eastern and Western Europeans Differ on Importance of Religion, Views of Minorities and Key Social Issues. Available online: http://www.pewforum.org/2018/10/29/eastern-andwestern-europeans-differ-on-importance-of-religion-views-of-minorities-and-key-social-issues (accessed on 3 January 2023).
- R Core Team. 2022. R: A Language and Environment for Statistical Computing. Vienna: R Foundation for Statistical Computing. Available online: https://www.R-project.org/ (accessed on 3 January 2023).
- Raiche, Gilles, and David Magis. 2022. nFactors: Parallel Analysis and Other Non Graphical Solutions to the Cattell Scree Test. R Package Version 2.4.1.1. Available online: https://cran.r-project.org/web/packages/nFactors/index.html (accessed on 3 January 2023).
- Revelle, William R. 2022. psych: Procedures for Personality and Psychological Research. Version = 2.2.9. Evanston: Northwestern University. Available online: https://CRAN.R-project.org/package=psych (accessed on 3 January 2023).
- Rosseel, Yves. 2012. lavaan: An R Package for Structural Equation Modeling. Journal of Statistical Software 48: 1–36. [Google Scholar] [CrossRef]
- RStudio Team. 2022. RStudio: Integrated Development Environment for R. RStudio. Boston: PBC. Available online: http://www.rstudio.com/ (accessed on 3 January 2023).
- Rydz, Elżbieta, Czesław Walesa, and Małgorzata Tatala. 2017. Structure and Level of Religiosity Test. Polish Psychological Bulletin 48: 20–27. [Google Scholar] [CrossRef]
- Sijtsma, Klaas, and L. Andries van der Ark. 2017. A tutorial on how to do a Mokken scale analysis on your test and questionnaire data. British Journal of Mathematical and Statistical Psychology 70: 137–58. [Google Scholar] [CrossRef] [PubMed]
- Social Opinion Research Centre. 2022a. Polski pejzaż religijny—Z dalekiego planu. [Polish Religious Landscape—From the Distant Plan]. Available online: https://www.cbos.pl/SPISKOM.POL/2022/K_089_22.PDF (accessed on 12 December 2022).
- Social Opinion Research Centre. 2022b. Zmiany religijności Polaków po pandemii. [Changes in Poles’ Religiosity after the Pandemic]. Available online: https://www.cbos.pl/SPISKOM.POL/2022/K_085_22.PDF (accessed on 15 December 2022).
- Steiner, Markus D., and Silvia Grieder. 2020. EFAtools: An R package with fast and flexible implementations of exploratory factor analysis tools. Journal of Open Source Software 5: 2521. [Google Scholar] [CrossRef]
- Szcześniak, Małgorzata, Adam Falewicz, Zdzisław Kroplewski, Urszula Myszak, Hanna Borkowska, Anna Czaprowska, Maria A. Świątek, Klaudia Strochalska, Agata H. Świątek, and Sławomir Bukalski. 2021. Validation of the Polish Version of the Brief Measure of Peceived Divine Engagement and Disengagement in Response to Prayer (PDED). Religions 12: 1049. [Google Scholar] [CrossRef]
- Szymczak, Wioletta, Paweł Michał Mąkosa, and Tomasz Adamczyk. 2022. Attitudes of Polish Young Adults towards the Roman Catholic Church: A Sociological and Pastoral Analysis of Empirical Research among Young Adults and Teachers. Religions 13: 612. [Google Scholar] [CrossRef]
- Tatala, Małgorzata, and Marcin Wojtasiński. 2021. The Validity of Prayer Importance Scale (PIS). Religions 12: 1032. [Google Scholar] [CrossRef]
- van der Ark, L. Andries. 2007. Mokken Scale Analysis in R. Journal of Statistical Software 20: 1–19. Available online: https://www.jstatsoft.org/article/view/v020i11 (accessed on 3 January 2023).
- van der Ark, L. Andries. 2012. New Developments in Mokken Scale Analysis in R. Journal of Statistical Software 48: 1–27. Available online: https://www.jstatsoft.org/article/view/v048i05 (accessed on 3 January 2023).
- van der Linden, Wim J. 2016. Handbook of Item Response Theory: Volume One: Models. Boca Raton: CRC Press. [Google Scholar]
- van Lissa, Caspar. 2022. tidySEM: Tidy Structural Equation Modeling. R package Version 0.2.3. Available online: https://cran.r-project.org/web/packages/tidySEM/index.html (accessed on 3 January 2023).
- Walesa, Czesław, and Małgorzata Tatala. 2020. Rozwój religijności człowieka. Tom II: Młodzież. [Development of Religiosity. Volume II: Youth]. Lublin: Wydawnictwo KUL. [Google Scholar]
- Walesa, Czesław. 2005. Rozwój religijności człowieka. Tom I: Dziecko. [Development of Religiosity. Volume I: Child]. Lublin: Wydawnictwo KUL. [Google Scholar]
- Walesa, Czesław. 2014. Różnice w zakresie religijności kobiet i mężczyzn. [Gender differences in religiosity]. Horyzonty Psychologii 4: 45–66. [Google Scholar]
- Wei, Taiyun, and Viliam Simko. 2021. R package ‘corrplot’: Visualization of a Correlation Matrix (Version 0.92). Available online: https://github.com/taiyun/corrplot (accessed on 3 January 2023).
- Wickham, Hadley, and RStudio. 2022. Tidyverse: Easily Install and Load the ‘Tidyverse’. R Package Version 1.3.2. Available online: https://cran.r-project.org/web/packages/tidyverse/index.html (accessed on 3 January 2023).
- Wickham, Hadley, Evan Miller, Danny Smith, and RStudio. 2022a. haven: Import and Export ‘SPSS’, ‘Stata’ and ‘SAS’ Files. R Package Version 2.5.1. Available online: https://cran.r-project.org/web/packages/haven/index.html (accessed on 3 January 2023).
- Wickham, Hadley, R. François, L. Henry, and K. Müller. 2022b. dplyr: A Grammar of Data Manipulation. Available online: https://dplyr.tidyverse.org (accessed on 3 January 2023).
- Wickham, Hadley. 2016. ggplot2: Elegant Graphics for Data Analysis. New York: Springer. [Google Scholar]
- Wojciechowska, Ludwika. 2017. Subjectivity and generativity in midlife. Polish Psychological Bulletin 48: 38–43. [Google Scholar] [CrossRef]
- Wojtasik, Waldemar. 2021. Political sources of secularisation processes in Poland. European Journal of Science and Theology 17: 83–95. [Google Scholar]
- Zarzycka, Beata, Dariusz Krok, Kamil Tomaka, and Radosław Rybarski. 2022. Multidimensional Prayer Inventory: Psychometric properties and clinical applications. Religions 13: 79. [Google Scholar] [CrossRef]


| Item Name | Homogeneity Index | Standard Error |
|---|---|---|
| PIS_1 | 0.575 | 0.034 |
| PIS_2 | 0.618 | 0.028 |
| PIS_3 | 0.620 | 0.025 |
| PIS_4 | 0.577 | 0.035 |
| PIS_5 | 0.587 | 0.027 |
| PIS_6 | 0.582 | 0.029 |
| Item | Index of Homogeneity | |||||||
|---|---|---|---|---|---|---|---|---|
| 0.10 | 0.20 | 0.30 | 0.40 | 0.50 | 0.60 | 0.70 | 0.80 | |
| PIS_1 | 1 | 1 | 1 | 1 | 1 | 1 | 1 | 1 |
| PIS_2 | 1 | 1 | 1 | 1 | 1 | 1 | 1 | 1 |
| PIS_3 | 1 | 1 | 1 | 1 | 1 | 1 | 1 | 1 |
| PIS_4 | 1 | 1 | 1 | 1 | 1 | 1 | 1 | 1 |
| PIS_5 | 1 | 1 | 1 | 1 | 1 | 1 | 1 | 1 |
| PIS_6 | 1 | 1 | 1 | 1 | 1 | 1 | 1 | 1 |
| Item | ac | vi | vi/ac | zsig | crit |
|---|---|---|---|---|---|
| PIS_1 | 112 | 0 | 0.00 | 0 | 0 |
| PIS_2 | 72 | 3 | 0.04 | 0 | 18 |
| PIS_3 | 46 | 0 | 0.00 | 0 | 0 |
| PIS_4 | 81 | 0 | 0.00 | 0 | 0 |
| PIS_5 | 83 | 2 | 0.02 | 0 | 1 |
| PIS_6 | 58 | 0 | 0.00 | 0 | 0 |
| chisq. | df | p Value | RMSEA | CFI | TLI | SRMR | |
|---|---|---|---|---|---|---|---|
| Configural model | 27.37 | 18 | 0.072 | 0.043 | 0.985 | 0.976 | 0.031 |
| Metric model | 39.86 | 23 | 0.016 | 0.051 | 0.974 | 0.966 | 0.046 |
| Scalar model | 62.31 | 28 | 0.000 | 0.066 | 0.947 | 0.943 | 0.055 |
| Adjusted scalar model PIS_6 ~ 1 | 47.86 | 27 | 0.008 | 0.053 | 0.968 | 0.964 | 0.050 |
| Strict model (with free PIS_6 ~ 1) | 71.16 | 33 | 0.000 | 0.064 | 0.941 | 0.946 | 0.070 |
| Adjusted strict model PIS_6 ~~ PIS_6 (with free PIS_6 ~ 1) | 50.18 | 32 | 0.021 | 0.045 | 0.972 | 0.974 | 0.053 |
| chisq. diff. | |
|---|---|
| Configural model—metric model | 0.091 |
| Metric model—scalar model | <0.001 |
| Metric model—adjusted scalar model | 0.078 |
| Adjusted Scalar model—strict model | <0.001 |
| Adjusted scalar model—adjusted strict model | 0.562 |
| chisq. | df | p Value | RMSEA | CFI | TLI | SRMR | |
|---|---|---|---|---|---|---|---|
| Configural model | 31.58 | 18 | 0.025 | 0.052 | 0.977 | 0.961 | 0.029 |
| Metric model | 27.53 | 23 | 0.234 | 0.027 | 0.992 | 0.990 | 0.034 |
| Scalar model | 38.27 | 28 | 0.093 | 0.036 | 0.982 | 0.981 | 0.039 |
| Strict model | 42.29 | 34 | 0.156 | 0.030 | 0.986 | 0.987 | 0.046 |
| chisq. diff. | |
|---|---|
| Configural model—metric model | 0.588 |
| Metric model—scalar model | 0.056 |
| Scalar model—strict model | 0.503 |
| chisq. | df | p Value | RMSEA | CFI | TLI | SRMR | |
|---|---|---|---|---|---|---|---|
| Configural model | 40.96 | 27 | 0.042 | 0.053 | 0.972 | 0.953 | 0.031 |
| Metric model | 37.01 | 37 | 0.468 | 0.001 | 1.000 | 1.000 | 0.045 |
| Scalar model | 51.82 | 47 | 0.291 | 0.024 | 0.990 | 0.991 | 0.053 |
| Strict model | 73.77 | 59 | 0.093 | 0.037 | 0.970 | 0.977 | 0.089 |
| Adjusted strict model PIS_6 ~~ PIS_6 | 64.67 | 57 | 0.227 | 0.027 | 0.984 | 0.988 | 0.072 |
| chisq. diff. | |
|---|---|
| Configural model—metric model | 0.560 |
| Metric model—scalar model | 0.137 |
| Scalar model—strict model | 0.042 |
| Scalar model—adjusted strict model | 0.224 |
Disclaimer/Publisher’s Note: The statements, opinions and data contained in all publications are solely those of the individual author(s) and contributor(s) and not of MDPI and/or the editor(s). MDPI and/or the editor(s) disclaim responsibility for any injury to people or property resulting from any ideas, methods, instructions or products referred to in the content. |
© 2023 by the authors. Licensee MDPI, Basel, Switzerland. This article is an open access article distributed under the terms and conditions of the Creative Commons Attribution (CC BY) license (https://creativecommons.org/licenses/by/4.0/).
Share and Cite
Tatala, M.; Wojtasiński, M. Measurement Invariance of Prayer Importance Scale: Religiosity, Gender, Age. Religions 2023, 14, 215. https://doi.org/10.3390/rel14020215
Tatala M, Wojtasiński M. Measurement Invariance of Prayer Importance Scale: Religiosity, Gender, Age. Religions. 2023; 14(2):215. https://doi.org/10.3390/rel14020215
Chicago/Turabian StyleTatala, Małgorzata, and Marcin Wojtasiński. 2023. "Measurement Invariance of Prayer Importance Scale: Religiosity, Gender, Age" Religions 14, no. 2: 215. https://doi.org/10.3390/rel14020215