
Exposure to Electromagnetic Fields (EMF) from Submarine Power Cables Can Trigger Strength-Dependent Behavioural and Physiological Responses in Edible Crab, Cancer pagurus (L.)


 and
and
Abstract
:1. Introduction
2. Materials and Methods
2.1. Physiological Analysis
2.1.1. Helmholtz Coils
2.1.2. Haemolymph Analysis
d-Glucose
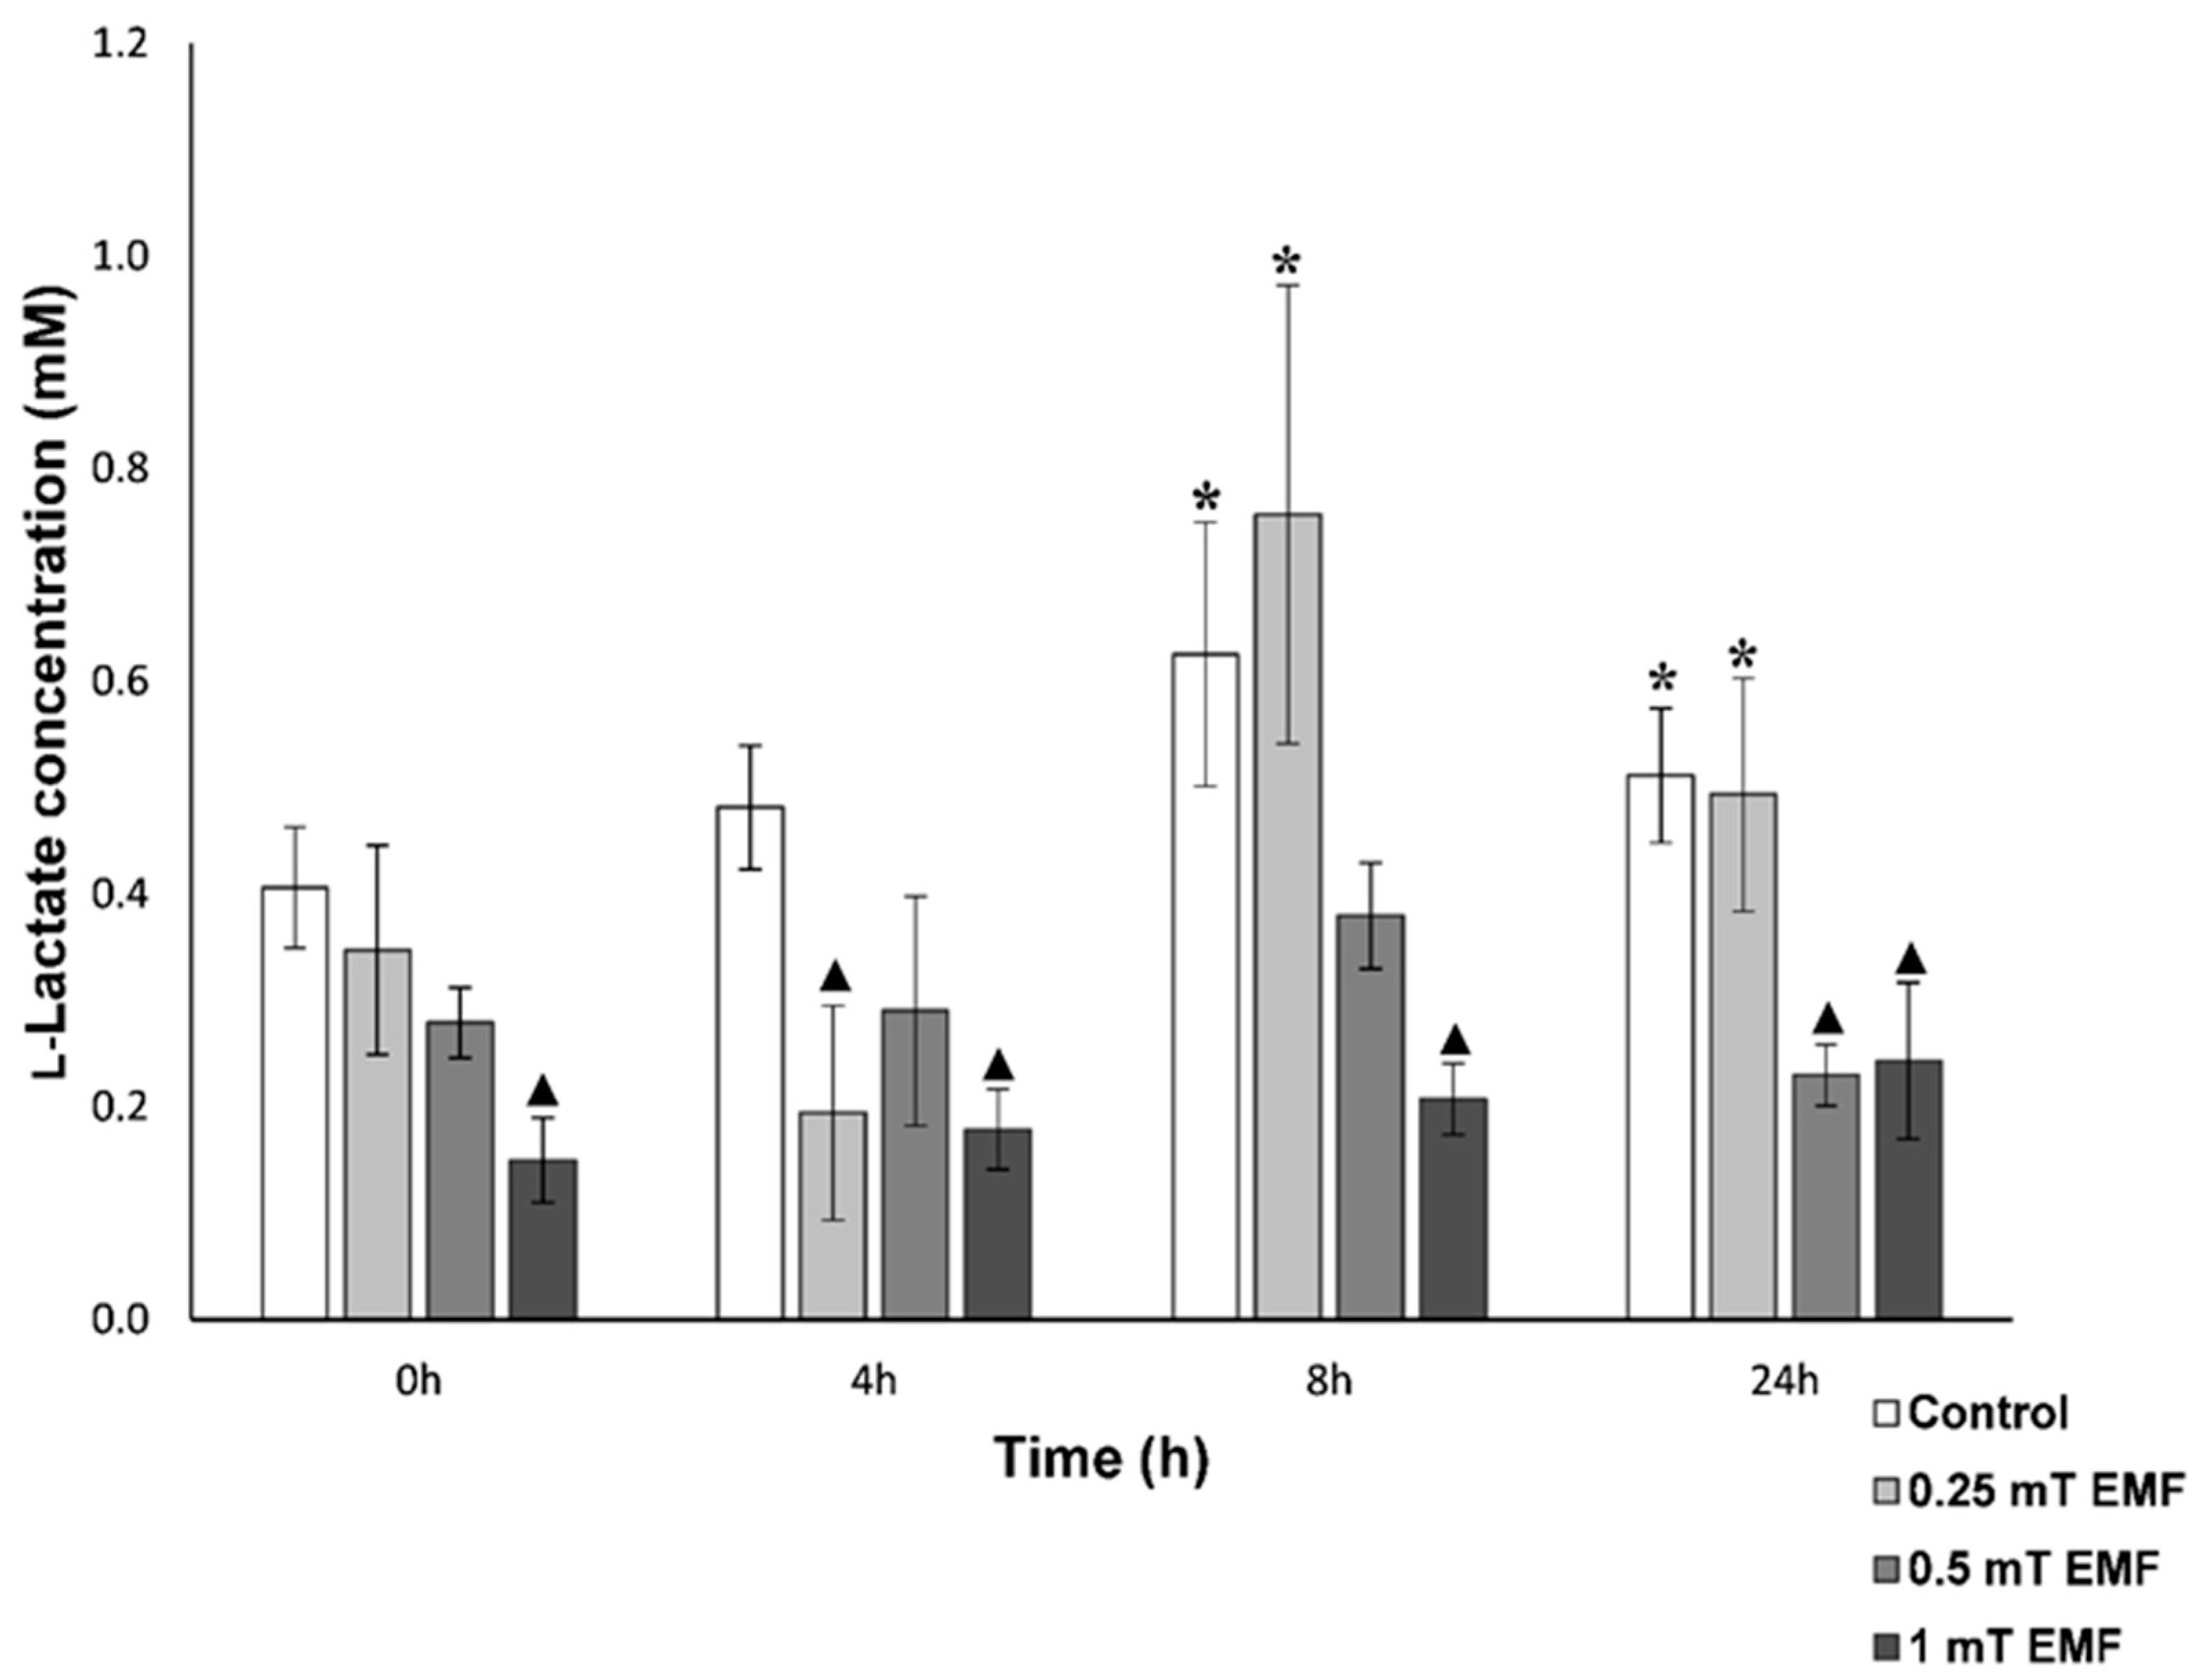
l-Lactate
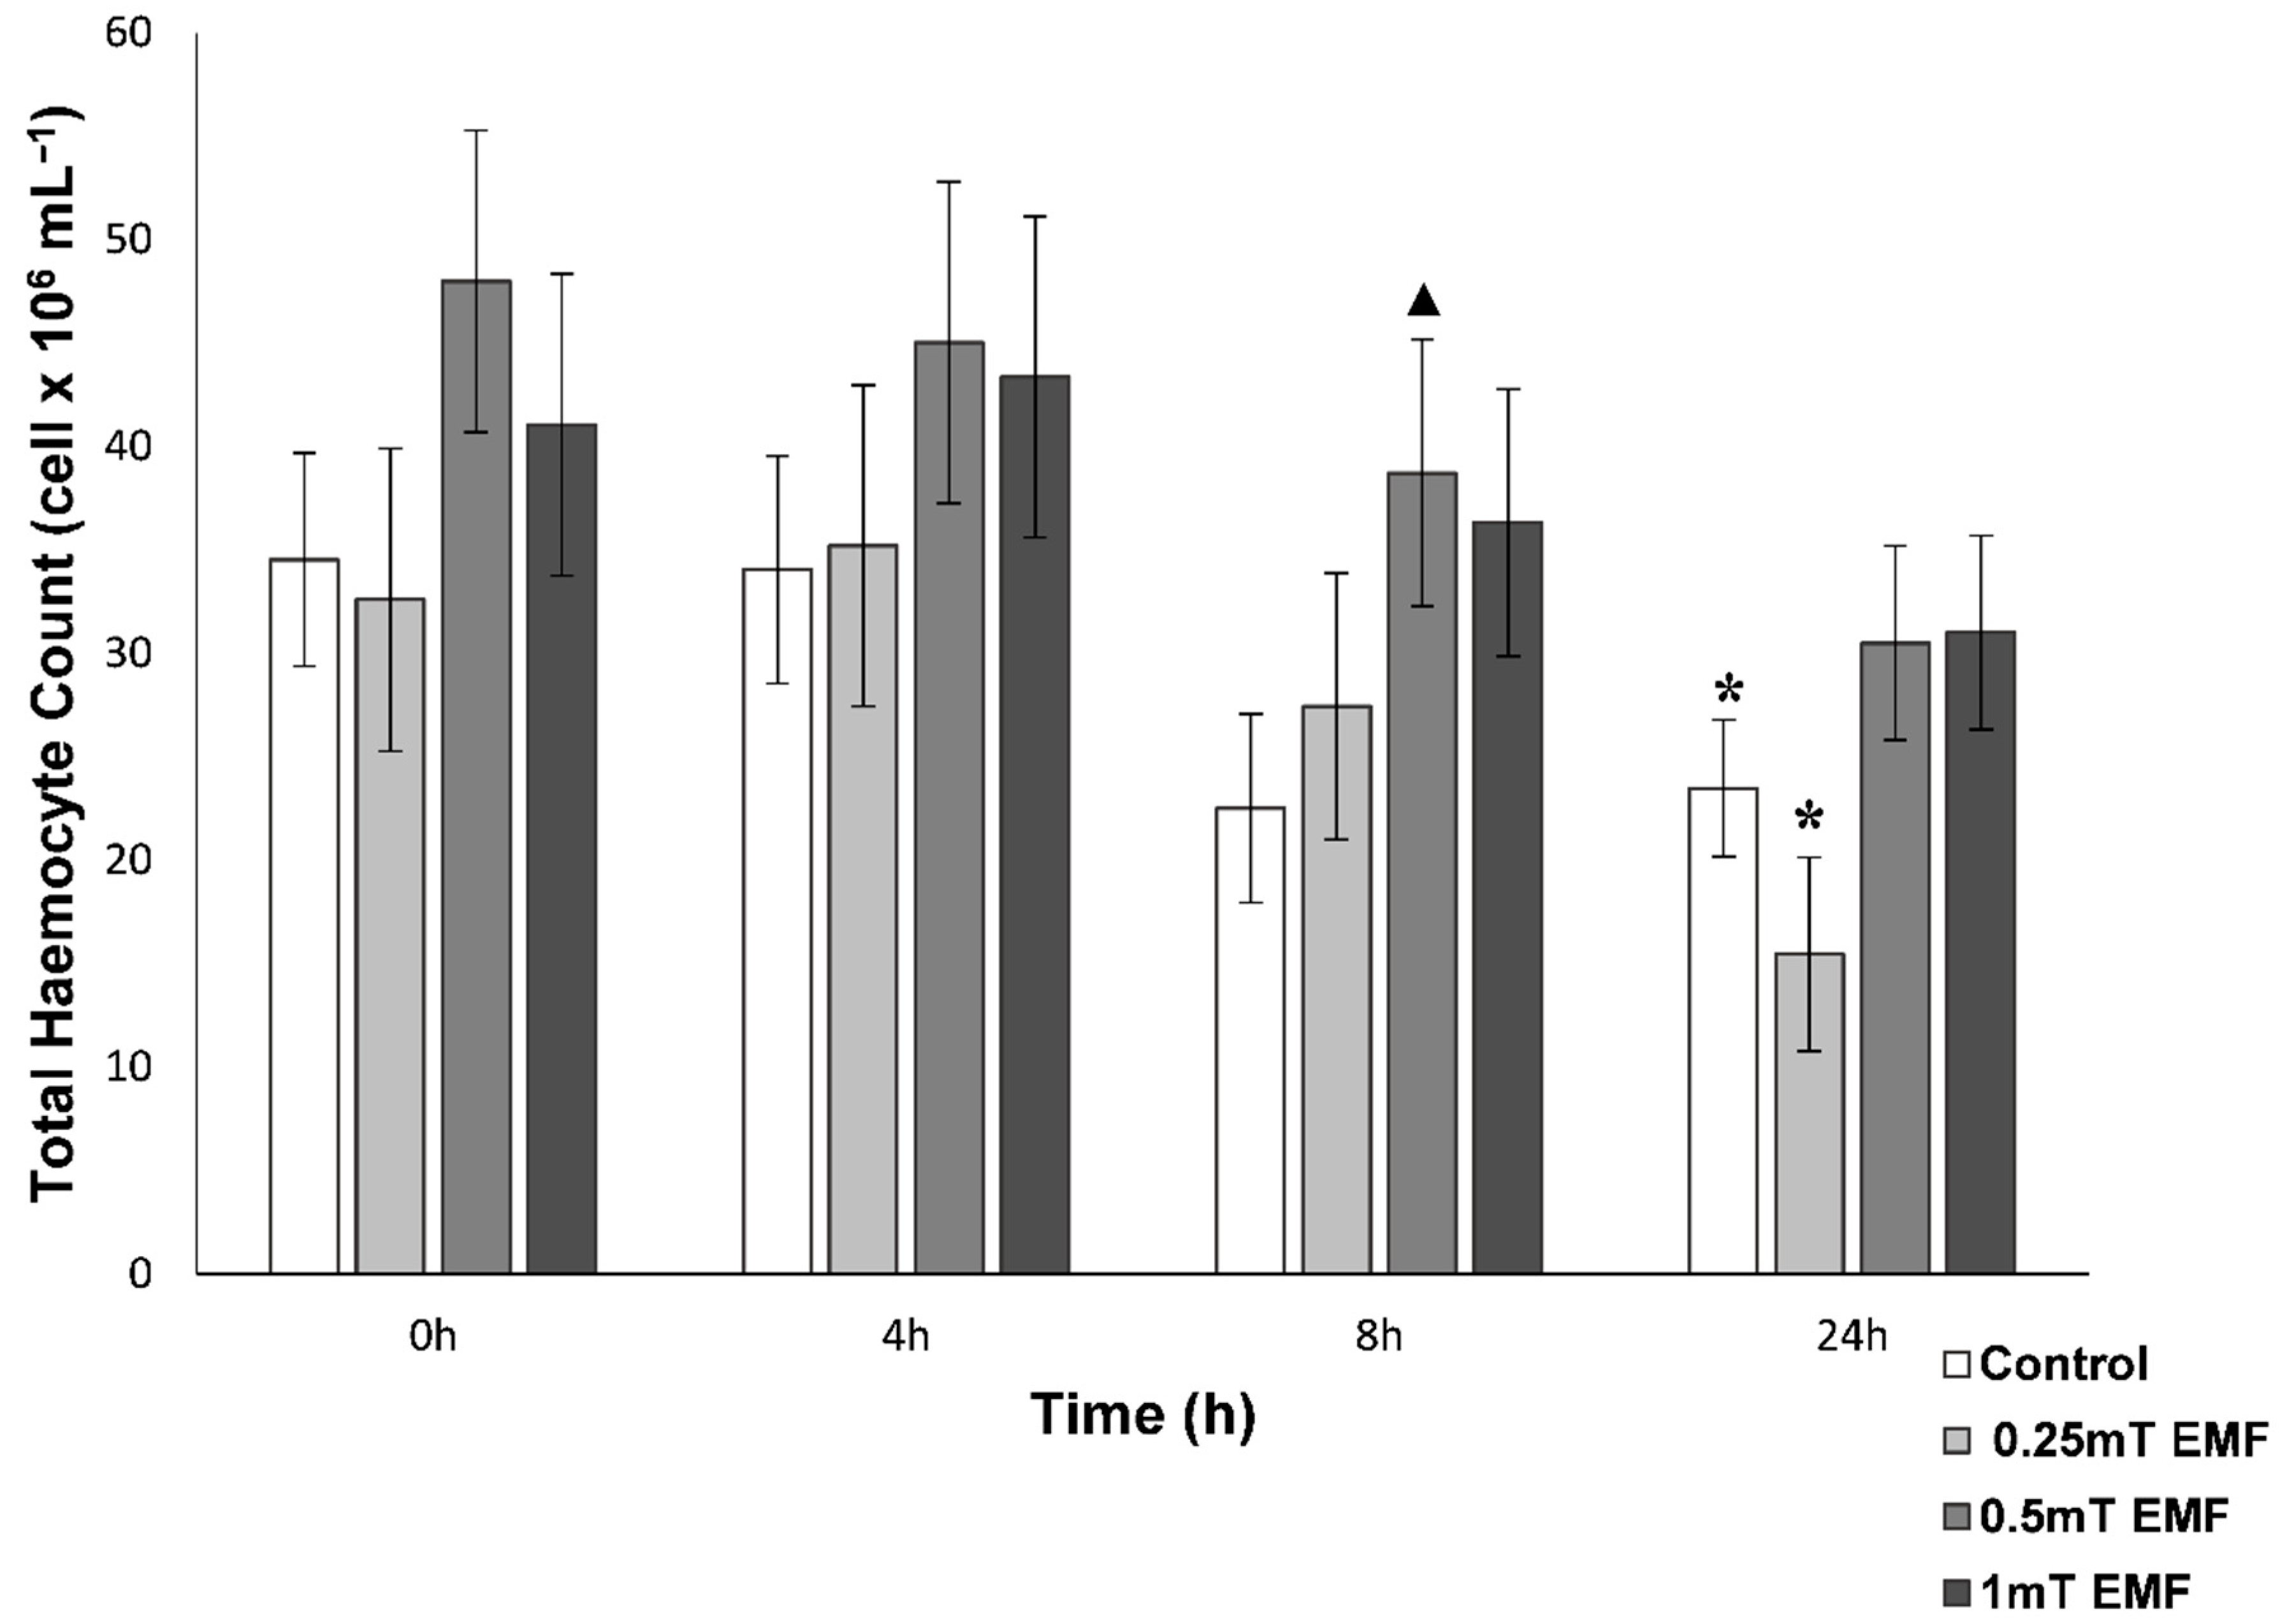
Total Haemocyte Count
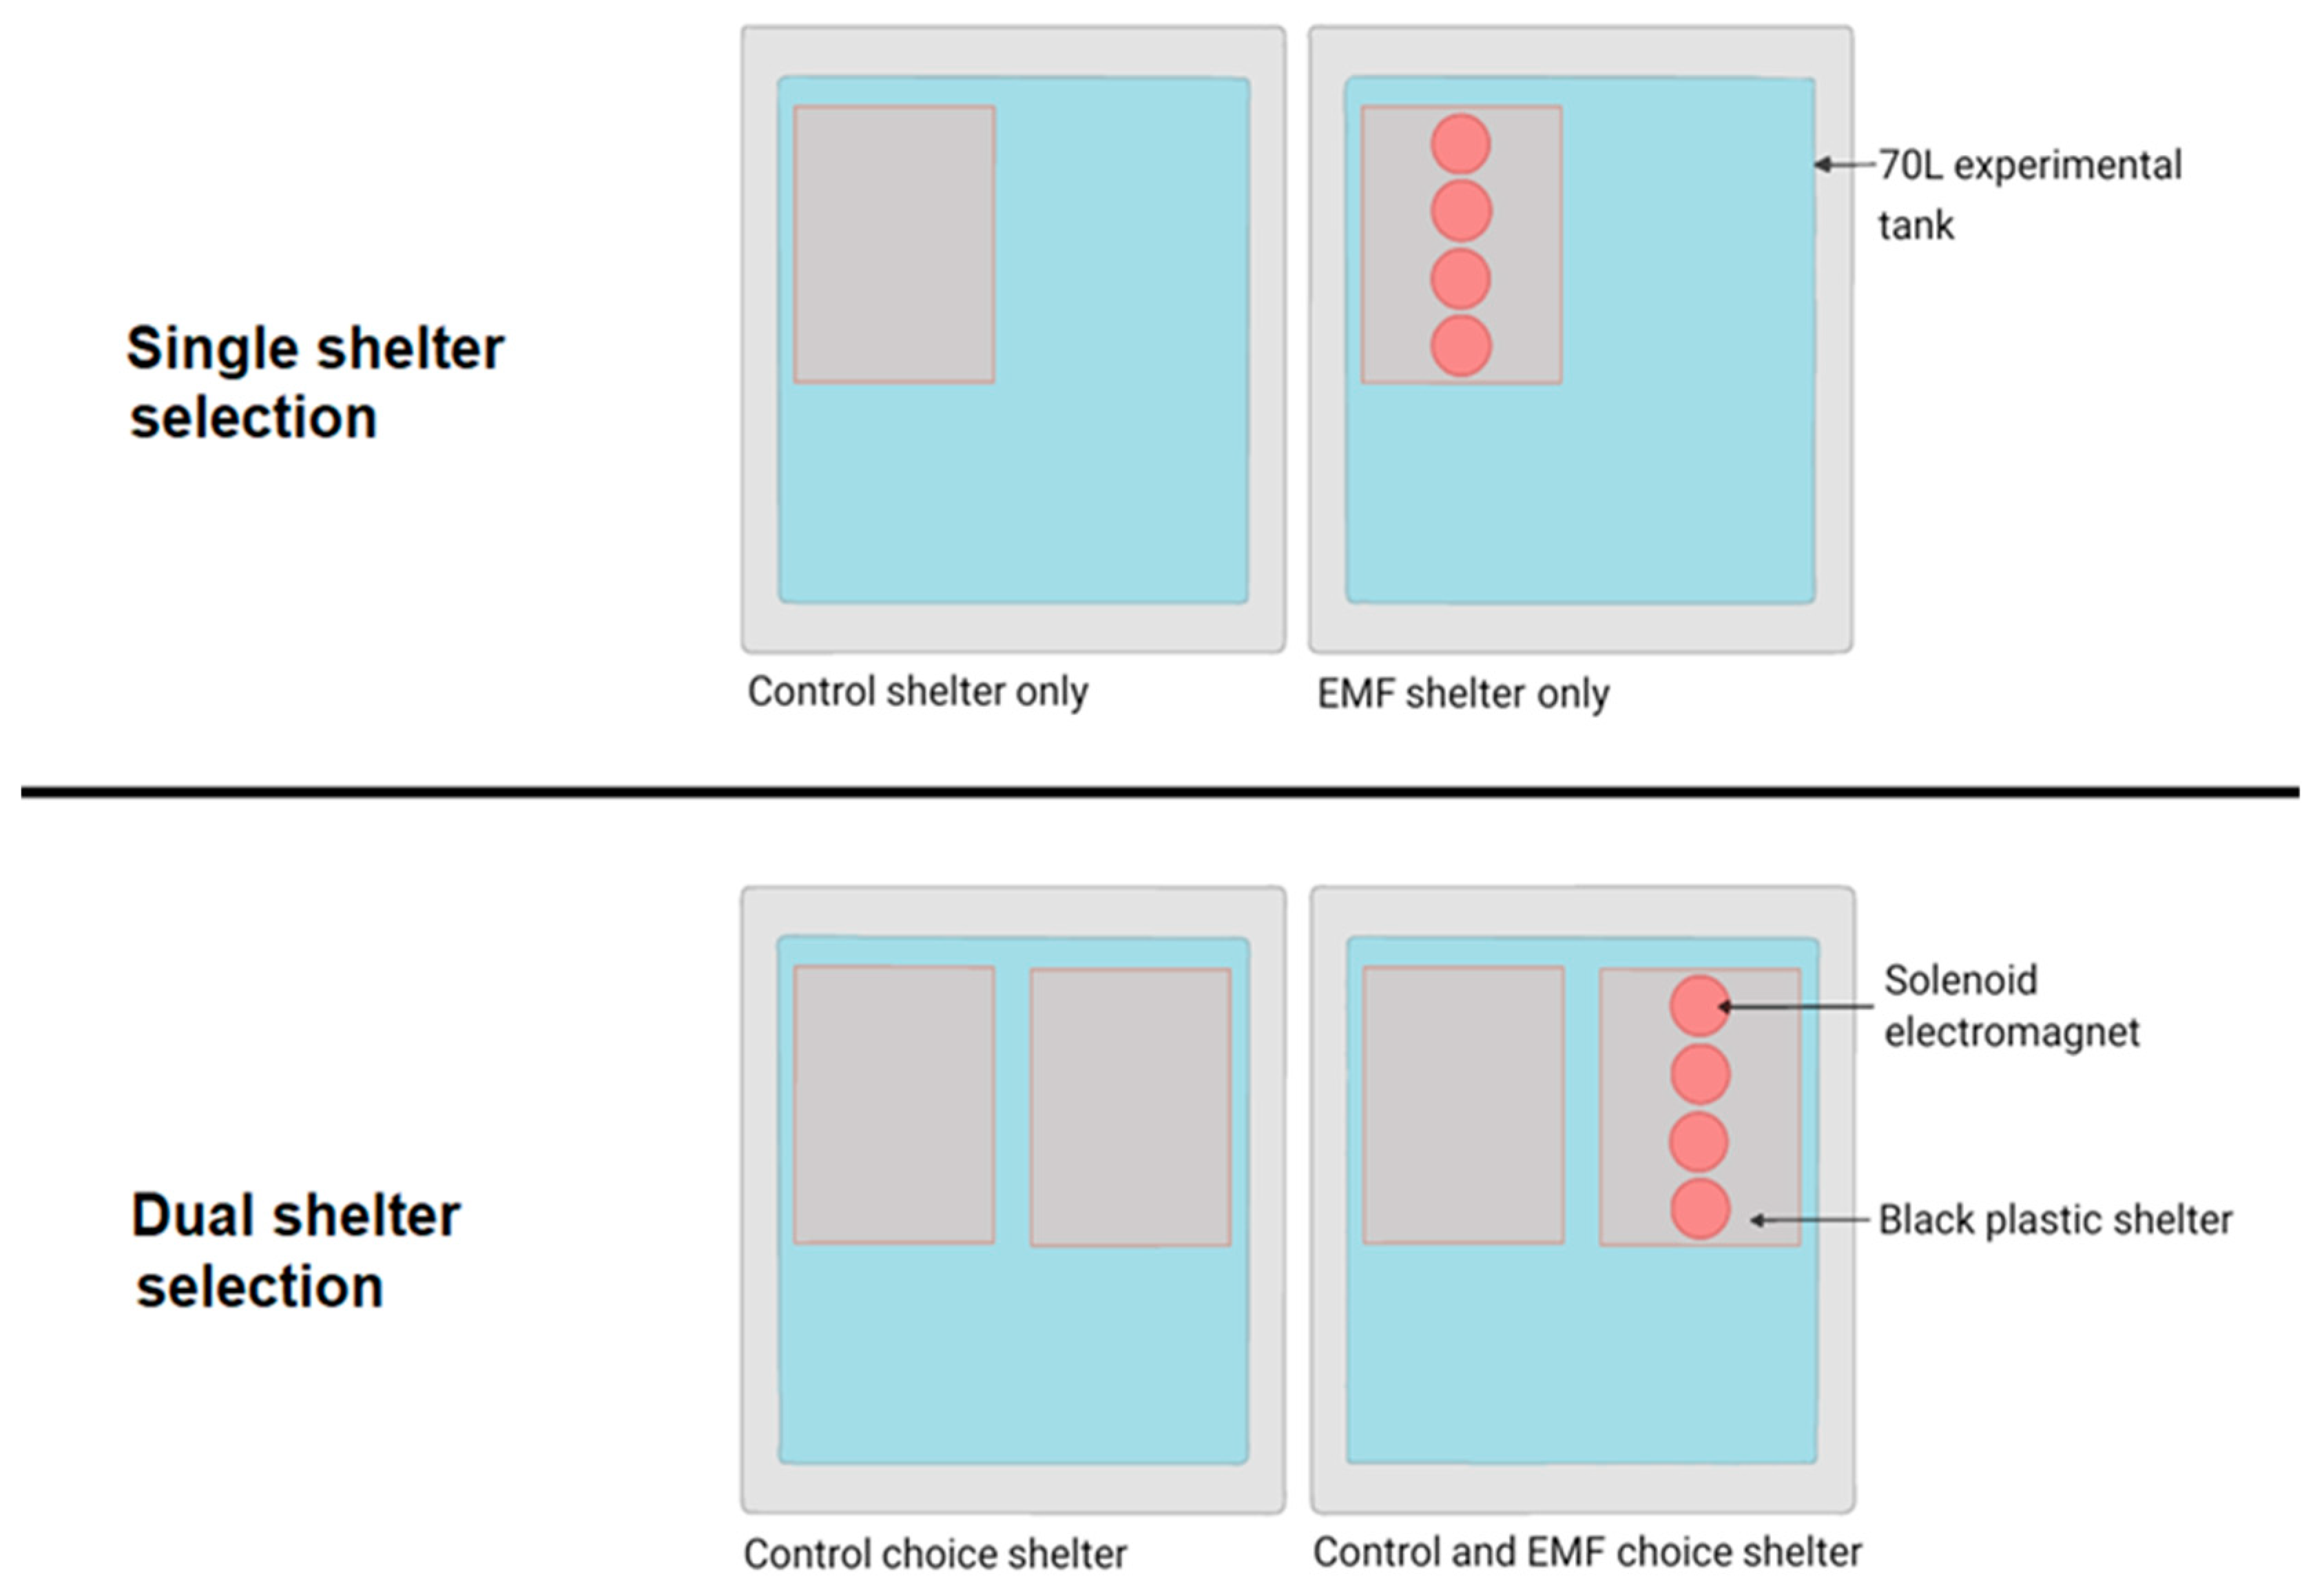
2.2. Behavioural Analysis
Shelter Selection
2.3. Statistical Analysis
3. Results
3.1. Physiological Analysis
3.1.1. Haemolymph Analysis
d-Glucose
l-Lactate
THC
3.2. Behavioural Analysis
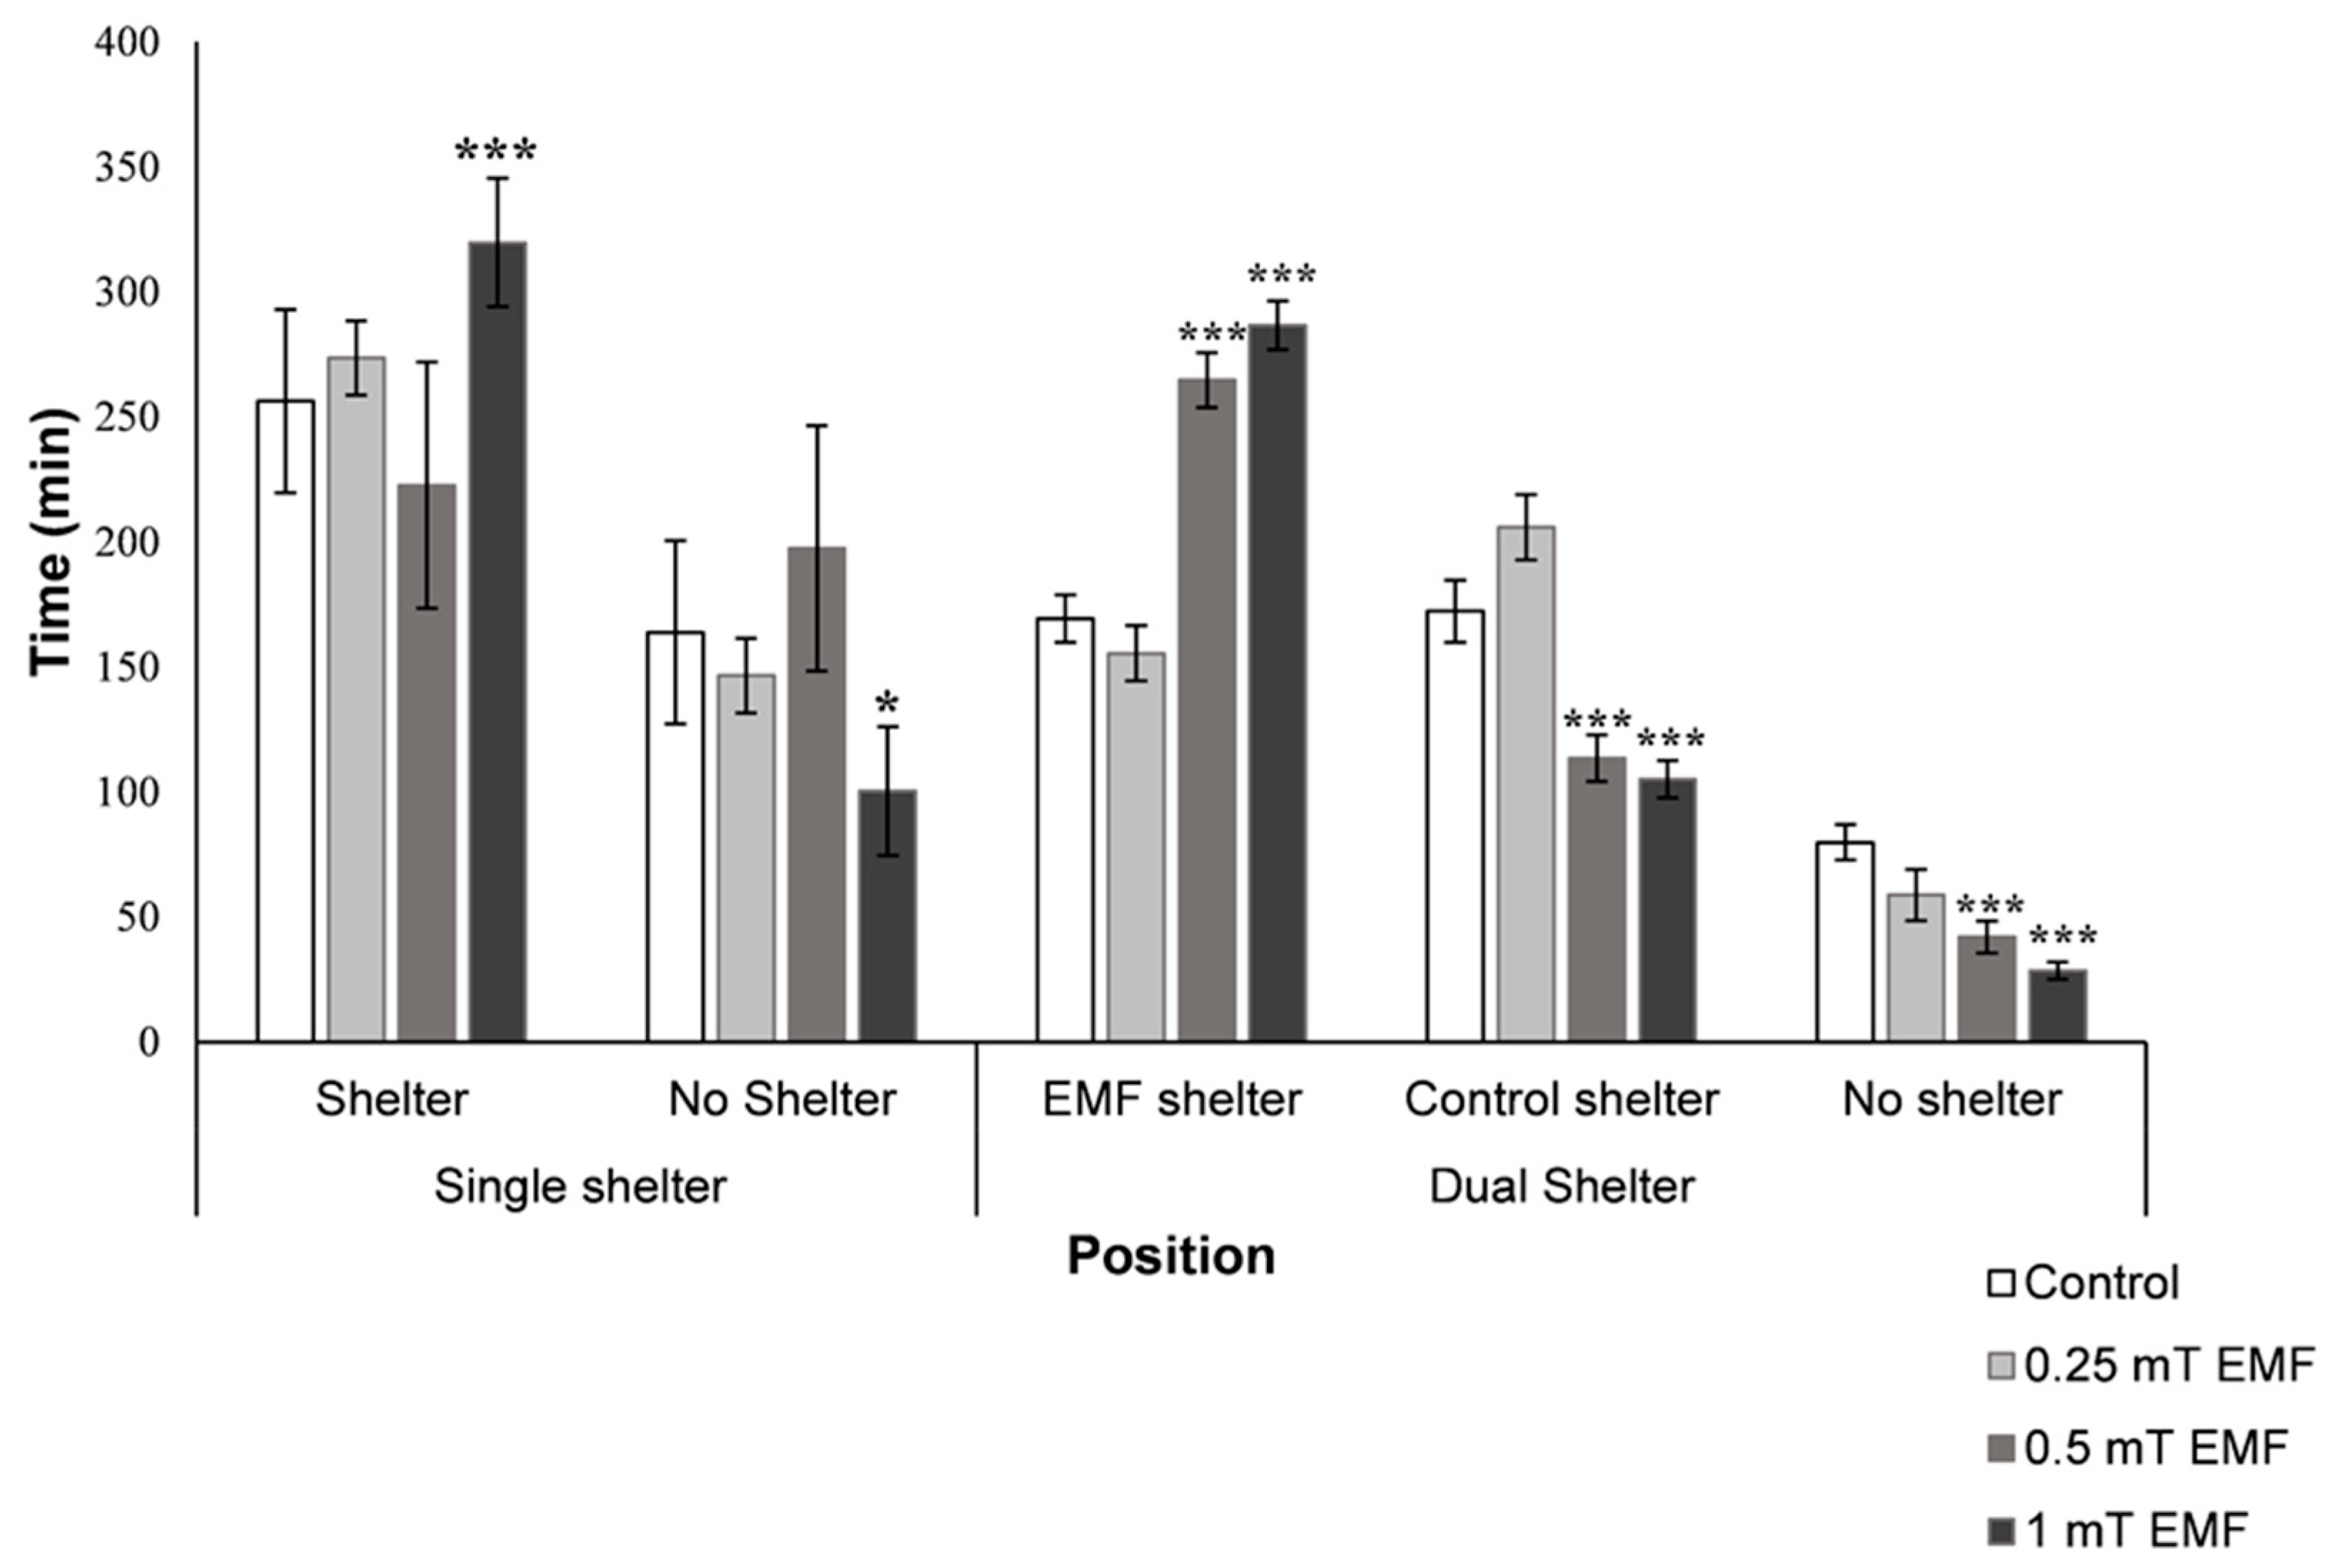
3.2.1. Single Shelter Selection
3.2.2. Dual Shelter Selection
4. Discussion
5. Conclusions
Author Contributions
Funding
Institutional Review Board Statement
Informed Consent Statement
Data Availability Statement
Acknowledgments
Conflicts of Interest
References
- Inger, R.; Attrill, M.J.; Bearhop, S.; Broderick, A.C.; Grecian, J.W.; Hodgson, D.J.; Mills, C.; Sheehan, E.; Votier, S.C.; Witt, M.J. Marine renewable energy: Potential benefits to biodiversity? An urgent call for research. J. Appl. Ecol. 2009, 46, 1145–1153. [Google Scholar] [CrossRef]
- Boehlert, G.W.; Gill, A.B. Environmental and ecological effects of ocean renewable energy development: A current synthesis. Oceanography 2010, 23, 68–81. [Google Scholar] [CrossRef] [Green Version]
- Dannheim, J.; Bergström, L.; Birchenough, S.N.; Brzana, R.; Boon, A.R.; Coolen, J.W.; Dauvin, J.-C.; De Mesel, I.; Derweduwen, J.; Gill, A.B. Benthic effects of offshore renewables: Identification of knowledge gaps and urgently needed research. ICES J. Mar. Sci. 2020, 77, 1092–1108. [Google Scholar] [CrossRef]
- Causon, P.D.; Gill, A.B. Linking ecosystem services with epibenthic biodiversity change following installation of offshore wind farms. Environ. Sci. Policy 2018, 89, 340–347. [Google Scholar] [CrossRef]
- Fichaux, N.; Wilkes, J.; Van Hulle, F.; Cronin, A. Oceans of Opportunity: Harnessing Europe’s Largest Domestic Energy Resource; European Wind Energy Association: Brussels, Belgium, 2009; Available online: http://www.ewea.org/fileadmin/files/library/publications/reports/Offshore_Report_2009.pdf (accessed on 16 July 2021).
- Komusanac, I.; Fraile, D.; Brindley, G. Wind energy in Europe in 2018-Trends and statistics. Wind Eur. 2019, 9–10. Available online: https://windeurope.org/about-wind/statistics/european/wind-energy-in-europe-in-2018/ (accessed on 16 July 2021).
- Fraile, D.M.A. Wind in Power: 2016 European Statistics; Wind Europe: Brussels, Belgium, 2017. [Google Scholar]
- TCE. The Crown Estate from Every Perspective; The Corwn Estate: London, UK, 2017. Available online: https://assets.publishing.service.gov.uk/government/uploads/system/uploads/attachment_data/file/622107/TCE_accounts_16-17.pdf (accessed on 16 July 2021).
- Pelc, R.; Fujita, R.M. Renewable energy from the ocean. Mar. Policy 2002, 26, 471–479. [Google Scholar] [CrossRef]
- Gill, A.B. Offshore renewable energy: Ecological implications of generating electricity in the coastal zone. J. Appl. Ecol. 2005, 42, 605–615. [Google Scholar] [CrossRef] [Green Version]
- Cada, G.; Ahlgrimm, J.; Bahleda, M.; Bigford, T.; Stavrakas, S.D.; Hall, D.; Moursund, R.; Sale, M. Potential impacts of hydrokinetic and wave energy conversion technologies on aquatic environments. Fisheries 2007, 32, 174–181. [Google Scholar] [CrossRef]
- Boehlert, G.W.; McMurray, G.R.; Tortorici, C.E. Ecological Effects of Wave Energy Development in the Pacific Northwest: A Scientific Workshop, October 11–12, 2007; NOAA: Silver Spring, MD, USA, 2008. Available online: https://nmsfarallones.blob.core.windows.net/farallones-prod/media/archive/manage/pdf/sac/13_02_workshop/wave_energy.pdf (accessed on 16 July 2021).
- Scott, K.; Harsanyi, P.; Lyndon, A.R. Understanding the effects of electromagnetic field emissions from Marine Renewable Energy Devices (MREDs) on the commercially important edible crab, Cancer pagurus (L.). Mar. Pollut. Bull. 2018, 131, 580–588. [Google Scholar] [CrossRef]
- De Luca, R. Lorentz force on sodium and chlorine ions in a salt water solution flow under a transverse magnetic field. Eur. J. Phys. 2009, 30, 459. [Google Scholar] [CrossRef]
- Tricas, T.C. Effects of Emfs from Undersea Power Cables on Elasmobranchs and Other Marine Species; DIANE Publishing: Darby, PA, USA, 2012. [Google Scholar]
- Thomsen, F.; Gill, A.; Kosecka, M.; Andersson, M.; Andre, M.; Degraer, S.; Folegot, T.; Gabriel, J.; Judd, A.; Neumann, T. Marven-Environmental Impacts of Noise, Vibrations and Electromagnetic Emissions From Marine Renewable Energy; Final Study Report; DG RTD (Directorate-General for Research and Innovation of the European Commission): Brussels, Belgium, 2015. Available online: https://tethys.pnnl.gov/publications/marven-environmental-impacts-noise-vibrations-electromagnetic-emissions-marine (accessed on 16 July 2021).
- Bochert, R.; Zettler, M.L. Effect of electromagnetic fields on marine organisms. In Offshore Wind Energy; Springer: Berlin/Heidelberg, Germany, 2006; pp. 223–234. [Google Scholar]
- Cada, G.F.; Bevelhimer, M.S.; Riemer, K.P.; Turner, J.W. Effects on Freshwater Organisms of Magnetic Fields Associated with Hydrokinetic Turbines; ORNL/TM-2011/244; Oak Ridge National Laboratory: Oak Ridge, TN, USA, 2011.
- Brewer, H. Some preliminary studies of the effects of a static magnetic field on the life cycle of the Lebistes reticulatus (Guppy). Biophys. J. 1979, 28, 305–314. [Google Scholar] [CrossRef] [Green Version]
- Formicki, K.; Sadowski, M.; Tański, A.; Korzelecka-Orkisz, A.; Winnicki, A. Behaviour of trout (Salmo trutta L.) larvae and fry in a constant magnetic field. J. Appl. Ichthyol. 2004, 20, 290–294. [Google Scholar] [CrossRef]
- Bochert, R.; Zettler, M. Long-term exposure of several marine benthic animals to static magnetic fields. J. Bioelectromagn. Soc. 2004, 25, 498–502. [Google Scholar] [CrossRef] [PubMed]
- Woodruff, D.L.; Schultz, I.R.; Marshall, K.E.; Ward, J.A.; Cullinan, V.I. Effects of Electromagnetic Fields on Fish and Invertebrates: Task 2.1.3: Effects on Aquatic Organisms-Fiscal Year 2011 Progress Report-Environmental Effects of Marine and Hydrokinetic Energy; Progress Report; Pacific Northwest National Lab. (PNNL): Richland, WA, USA, 2012.
- Bakke, S.; Buhl-Mortensen, L.; Buhl-Mortensen, P. Some observations of Cancer pagurus Linnaeus, 1758 (Decapoda, Brachyura) in deep water. Crustaceana 2019, 92, 95–105. [Google Scholar] [CrossRef] [Green Version]
- Statistics, N. UK Sea Fisheries Statistics 2019; MMO: Newcastle, UK, 2019. Available online: https://thefishingdaily.com/latest-news/mmo-releases-uk-sea-fisheries-annual-statistics-report-2019/ (accessed on 16 July 2021).
- Landers, D.F., Jr.; Keser, M.; Saila, S.B. Changes in female lobster (Homarus americanus) size at maturity and implications for the lobster resource in Long Island Sound, Connecticut. Mar. Freshw. Res. 2001, 52, 1283–1290. [Google Scholar] [CrossRef]
- Kawasaki, H.; Sano, M.; Shibuno, T. The relationship between habitat physical complexity and recruitment of the coral reef damselfish, Pomacentrus amboinensis: An experimental study using small-scale artificial reefs. Ichthyol. Res. 2003, 50, 0073–0077. [Google Scholar] [CrossRef]
- Langhamer, O.; Wilhelmsson, D. Colonisation of fish and crabs of wave energy foundations and the effects of manufactured holes–a field experiment. Mar. Environ. Res. 2009, 68, 151–157. [Google Scholar] [CrossRef] [Green Version]
- Burdon, D. Offshore and Coastal Renewable Energy: Potential Ecological Benefits and Impacts of Large-Scale Offshore and Coastal Renewable Energy; Final Report, Tethys; 2009. Available online: https://tethys.pnnl.gov/publications/offshore-coastal-renewable-energy-potential-ecological-benefits-impacts-large-scale (accessed on 16 July 2021).
- Lindeboom, H.; Kouwenhoven, H.; Bergman, M.; Bouma, S.; Brasseur, S.; Daan, R.; Fijn, R.; De Haan, D.; Dirksen, S.; Van Hal, R. Short-term ecological effects of an offshore wind farm in the Dutch coastal zone; a compilation. Environ. Res. Lett. 2011, 6, 035101. [Google Scholar] [CrossRef] [Green Version]
- Walker, M.M.; Diebel, C.E.; Haugh, C.V.; Pankhurst, P.M.; Montgomery, J.C.; Green, C.R. Structure and function of the vertebrate magnetic sense. Nature 1997, 390, 371–376. [Google Scholar] [CrossRef]
- Ernst, D.A.; Lohmann, K.J. Effect of magnetic pulses on Caribbean spiny lobsters: Implications for magnetoreception. J. Exp. Biol. 2016, 219, 1827–1832. [Google Scholar] [CrossRef] [Green Version]
- Kirschvink, J.L.; Walker, M.M.; Diebel, C.E. Magnetite-based magnetoreception. Curr. Opin. Neurobiol. 2001, 11, 462–467. [Google Scholar] [CrossRef]
- Walker, M.M. A model for encoding of magnetic field intensity by magnetite-based magnetoreceptor cells. J. Theor. Biol. 2008, 250, 85–91. [Google Scholar] [CrossRef] [PubMed]
- Lohmann, K.J. Magnetic remanence in the western Atlantic spiny lobster, Panulirus argus. J. Exp. Biol. 1984, 113, 29–41. [Google Scholar] [CrossRef]
- Paterson, B.D.; Spanoghe, P.T. Stress indicators in marine decapod crustaceans, with particular reference to the grading of western rock lobsters (Panulirus cygnus) during commercial handling. Mar. Freshw. Res. 1997, 48, 829–834. [Google Scholar] [CrossRef]
- Taylor, H.; Paterson, B.; Wong, R.; Wells, R. Physiology and live transport of lobsters: Report from a workshop. Mar. Freshw. Res. 1997, 48, 817–822. [Google Scholar] [CrossRef]
- Bergmann, M.; Taylor, A.C.; Moore, P.G. Physiological stress in decapod crustaceans (Munida rugosa and Liocarcinus depurator) discarded in the Clyde Nephrops fishery. J. Exp. Mar. Biol. Ecol. 2001, 259, 215–229. [Google Scholar] [CrossRef]
- Lorenzon, S.; Giulianini, P.G.; Libralato, S.; Martinis, M.; Ferrero, E. Stress effect of two different transport systems on the physiological profiles of the crab Cancer pagurus. Aquaculture 2008, 278, 156–163. [Google Scholar] [CrossRef]
- Hutchison, Z.; Sigray, P.; He, H.; Gill, A.; King, J.; Gibson, C. Electromagnetic Field (EMF) impacts on elasmobranch (shark, rays, and skates) and American lobster movement and migration from direct current cables. OCS Study BOEM 2018, 1–3. Available online: https://tethys.pnnl.gov/publications/electromagnetic-field-emf-impacts-elasmobranch-shark-rays-skates-american-lobster (accessed on 16 July 2021).
- Moray Offshore Renewables. Telford, Stevenson, MacColl Wind Farms and associated Transmission Infrastructure Environmental Statement-Technical Appendix 4.3 D–Electromagnetic Fields Modelling. 2019. Available online: https://www.morayeast.com/application/files/1515/8014/0011/Appendix-1-3-E-Preliminary-Decommissioning-Programme.pdf (accessed on 16 July 2021).
- Scott, K.; Harsanyi, P.; Lyndon, A.R. Baseline measurements of physiological and behavioural stress markers in the commercially important decapod Cancer pagurus (L.). J. Exp. Mar. Biol. Ecol. 2018, 507, 1–7. [Google Scholar] [CrossRef]
- Durand, F.; Devillers, N.; Lallier, F.H.; Regnault, M. Nitrogen excretion and changes in blood components during emersion of the subtidal spider crab Maia squinado (L.). Comp. Biochem. Physiol. Part A Mol. Integr. Physiol. 2000, 127, 259–271. [Google Scholar] [CrossRef]
- Lorenzon, S.; Martinis, M.; Ferrero, E.A. Ecological relevance of hemolymph total protein concentration in seven unrelated crustacean species from different habitats measured predictively by a density-salinity refractometer. J. Mar. Biol. 2011, 2011, 1–7. Available online: https://www.hindawi.com/journals/jmb/2011/153654/ (accessed on 16 July 2021). [CrossRef]
- Barrento, S.; Marques, A.; Vaz-Pires, P.; Nunes, M.L. Live shipment of immersed crabs Cancer pagurus from England to Portugal and recovery in stocking tanks: Stress parameter characterization. ICES J. Mar. Sci. 2010, 67, 435–443. [Google Scholar] [CrossRef] [Green Version]
- Scott, K. Understanding the Biology of Two Commercially Important Crustaceans in Relation to Fisheries and Anthropogenic Impacts. Ph.D. Thesis, Heriot-Watt University, Edinburgh, UK, 2019. Available online: https://www.ros.hw.ac.uk/handle/10399/4184 (accessed on 16 July 2021).
- Watt, A.; Whiteley, N.; Taylor, E. An in situ study of respiratory variables in three British sublittoral crabs with different routine rates of activity. J. Exp. Mar. Biol. Ecol. 1999, 239, 1–21. [Google Scholar] [CrossRef]
- Reddy, D.; Raghupathi, M.; Purushotham, K.; Naidu, B. Daily rhythms in levels of blood glucose and hepatopancreatic glycogen in the fresh water field crab Oziotelphusa senex senex (Fabricius). Indian J. Exp. Biol. 1981, 4, 403–404. Available online: https://pubmed.ncbi.nlm.nih.gov/7275199/ (accessed on 16 July 2021).
- Kallen, J.L.; Abrahamse, S.; Van Herp, F. Circadian rhythmicity of the crustacean hyperglycemic hormone (CHH) in the hemolymph of the crayfish. Biol. Bull. 1990, 179, 351–357. [Google Scholar] [CrossRef]
- Tilden, A.; McGann, L.; Schwartz, J.; Bowe, A.; Salazar, C. Effect of melatonin on hemolymph glucose and lactate levels in the fiddler crab Uca pugilator. J. Exp. Zool. 2001, 290, 379–383. [Google Scholar] [CrossRef] [PubMed]
- Sanders, N.; Childress, J. Specific effects of thiosulphate and L-lactate on hemocyanin-O2 affinity in a brachyuran hydrothermal vent crab. Mar. Biol. 1992, 113, 175–180. [Google Scholar] [CrossRef]
- Reddy, P.; Katyayani, R.; Fingerman, M. Cadmium and naphthalene-induced hyperglycemia in the fiddler crab, Uca pugilator: Differential modes of action on the neutroendocrine system. Bull. Environ. Contam. Toxicol. 1996, 56, 425–431. Available online: https://pubmed.ncbi.nlm.nih.gov/8825965/ (accessed on 16 July 2021). [CrossRef] [PubMed]
- Chang, E.S.; Keller, R.; Chang, S.A. Quantification of crustacean hyperglycemic hormone by ELISA in hemolymph of the lobster, Homarus americanus, following various stresses. Gen. Comp. Endocrinol. 1998, 111, 359–366. [Google Scholar] [CrossRef]
- Reiter, R.J. Static and extremely low frequency electromagnetic field exposure: Reported effects on the circadian production of melatonin. J. Cell. Biochem. 1993, 51, 394–403. [Google Scholar] [CrossRef]
- Schneider, T.; Thalau, H.-P.; Semm, P. Effects of light or different earth-strength magnetic fields on the nocturnal melatonin concentration in a migratory bird. Neurosci. Lett. 1994, 168, 73–75. [Google Scholar] [CrossRef]
- Wood, A.; Sait, M.; Armstrong, S.; Martin, M. Effects of 50 Hz magnetic fields on human physiology: Plasma melatonin levels. In Proceedings of the 2nd International Conference on Bioelectromagnetism (Cat. No. 98TH8269), Melbourne, Australia, 15–18 February 1998; pp. 161–162. [Google Scholar]
- Vogan, C.L.; Rowley, A.F. Effects of shell disease syndrome on the haemocytes and humoral defences of the edible crab, Cancer pagurus. Aquaculture 2002, 205, 237–252. [Google Scholar] [CrossRef]
- Parrinello, D.; Sanfratello, M.; Celi, M.; Vazzana, M. Hemocyte types and some plasmatic properties of two edible crabs Cancer borealis and Cancer pagurus. Invertebr. Surviv. J. 2015, 12, 195–202. [Google Scholar]
- Truscott, R.; White, K. The influence of metal and temperature stress on the immune system of crabs. Funct. Ecol. 1990, 4, 455–461. Available online: https://www.jstor.org/stable/2389609 (accessed on 16 July 2021). [CrossRef]
- Le Moullac, G.; Haffner, P. Environmental factors affecting immune responses in Crustacea. Aquaculture 2000, 191, 121–131. [Google Scholar] [CrossRef]
- Monari, M.; Matozzo, V.; Foschi, J.; Cattani, O.; Serrazanetti, G.P.; Marin, M.G. Effects of high temperatures on functional responses of haemocytes in the clam Chamelea gallina. Fish. Shellfish Immunol. 2007, 22, 98–114. [Google Scholar] [CrossRef]
- Stewart, J.E.; Cornick, J.W.; Dingle, J. An electronic method for counting lobster (Homarus americanus Milne Edwards) hemocytes and the influence of diet on hemocyte numbers and hemolymph proteins. Can. J. Zool. 1967, 45, 291–304. [Google Scholar] [CrossRef]
- Le Moullac, G.; Soyez, C.; Saulnier, D.; Ansquer, D.; Avarre, J.C.; Levy, P. Effect of hypoxic stress on the immune response and the resistance to vibriosis of the shrimpPenaeus stylirostris. Fish. Shellfish Immunol. 1998, 8, 621–629. [Google Scholar] [CrossRef]
- Valadez-Lira, J.A.; Medina-Chavez, N.O.; Orozco-Flores, A.A.; Heredia-Rojas, J.A.; Rodriguez-de la Fuente, A.O.; Gomez-Flores, R.; Alcocer-Gonzalez, J.M.; Tamez-Guerra, P. Alterations of immune parameters on Trichoplusia ni (Lepidoptera: Noctuidae) larvae exposed to extremely low-frequency electromagnetic fields. Environ. Entomol. 2017, 46, 376–382. [Google Scholar] [CrossRef]
- Skajaa, K.; Fernö, A.; Løkkeborg, S.; Haugland, E.K. Basic movement pattern and chemo-oriented search towards baited pots in edible crab (Cancer pagurus L.). Hydrobiologia 1998, 371, 143–153. [Google Scholar] [CrossRef]
- Kawakami, S.; Kashiwagi, K.; Furuno, N.; Yamashita, M.; Kashiwagi, A.; Tanimoto, Y. Effects of strong static magnetic fields on amphibian development and gene expression. Jpn. J. Appl. Phys. 2006, 45, 6055. [Google Scholar] [CrossRef]
- Sakhnini, L.; Dairi, M. Effects of static magnetic fields on early embryonic development of the sea urchin Echinometra mathaei. IEEE Trans. Magn. 2004, 40, 2979–2981. [Google Scholar] [CrossRef]
- Petrov, E.; Martinac, B. Modulation of channel activity and gadolinium block of MscL by static magnetic fields. Eur. Biophys. J. 2007, 36, 95. [Google Scholar] [CrossRef] [PubMed]
- Holm, P.; Buck, B.H.; Langan, R. Introduction: New approaches to sustainable offshore food production and the development of offshore platforms. In Aquaculture Perspective of Multi-Use Sites in the Open Ocean; Springer: Berlin/Heidelberg, Germany, 2017; pp. 1–20. [Google Scholar]


| EMF Levels | Physiological Analyses | Behavioural Analyses | |||
|---|---|---|---|---|---|
| l-Lactate Changes | d-Glucose Changes | THC | Single Shelter Selection | Dual Shelter Selection | |
| 250 µT | Followed circadian rhythm, but lower concentrations after 4 h | No significant difference to control | No significant difference to control | No significant difference in time spent inside shelter or roaming compared to control | No significant difference in time spent in either shelter or roaming compared to control |
| 500 µT | Did not follow circadian rhythm, lower concentrations after 24 h | Followed circadian rhythm, but hyperglycaemia seen after 4 h and 8 h | No fluctuations in levels nor significant decrease after 24 h (as seen in control), elevated levels after 8 h | No significant difference in time spent inside shelter or roaming compared to control | Increased time in EMF shelter and reduced time roaming |
| 1000 µT | Did not follow circadian rhythm, lower concentrations throughout 24 h period | Followed circadian rhythm, but hyperglycaemia seen after 4 h and 8 h | No fluctuations in levels nor significant decrease after 24 h (as seen in control) | Significantly more time spent in the shelter | Increased time in EMF shelter and reduced time roaming |
| 2.8 mT | Did not follow circadian rhythm, lower concentrations throughout 24 h period (without usual peaks at dawn) | Followed circadian rhythm, but did not show significant rise in levels after 8 h, as seen in control | Not assessed | Significantly more time spent in the shelter and reduced roaming | Increased time in EMF shelter and reduced time roaming |
| 40 mT | Followed circadian rhythm, but significantly lower concentrations at 4 h and 8 h compared to 0 h (not seen in control) | No significant difference to control | Not assessed | Not assessed | Not assessed |
Publisher’s Note: MDPI stays neutral with regard to jurisdictional claims in published maps and institutional affiliations. |
© 2021 by the authors. Licensee MDPI, Basel, Switzerland. This article is an open access article distributed under the terms and conditions of the Creative Commons Attribution (CC BY) license (https://creativecommons.org/licenses/by/4.0/).
Share and Cite
Scott, K.; Harsanyi, P.; Easton, B.A.A.; Piper, A.J.R.; Rochas, C.M.V.; Lyndon, A.R. Exposure to Electromagnetic Fields (EMF) from Submarine Power Cables Can Trigger Strength-Dependent Behavioural and Physiological Responses in Edible Crab, Cancer pagurus (L.). J. Mar. Sci. Eng. 2021, 9, 776. https://doi.org/10.3390/jmse9070776
Scott K, Harsanyi P, Easton BAA, Piper AJR, Rochas CMV, Lyndon AR. Exposure to Electromagnetic Fields (EMF) from Submarine Power Cables Can Trigger Strength-Dependent Behavioural and Physiological Responses in Edible Crab, Cancer pagurus (L.). Journal of Marine Science and Engineering. 2021; 9(7):776. https://doi.org/10.3390/jmse9070776
Chicago/Turabian StyleScott, Kevin, Petra Harsanyi, Blair A. A. Easton, Althea J. R. Piper, Corentine M. V. Rochas, and Alastair R. Lyndon. 2021. "Exposure to Electromagnetic Fields (EMF) from Submarine Power Cables Can Trigger Strength-Dependent Behavioural and Physiological Responses in Edible Crab, Cancer pagurus (L.)" Journal of Marine Science and Engineering 9, no. 7: 776. https://doi.org/10.3390/jmse9070776