1. Introduction
In the process industry, the application of techniques for risk assessment aims not only to identify possible accident scenarios but also to consider and implement appropriate safety devices and operations to prevent or mitigate them [
1]. Various terms are used to indicate such safety devices and operations, such as countermeasure [
2], layer of protection [
3], and the most used, safety barrier. These terms all refer to a physical and/or non-physical means planned to prevent, control, or mitigate undesired events or accidents [
4]. The importance of monitoring the performance of such safety barriers is constantly increasing. Technical barrier components may degrade over time and/or have random failures, for example, as a result of scour-induced collapse [
5] or fatigue-induced collapse [
6]; therefore, their performance is not constant and needs frequent testing and inspection. Similar to technical barriers, operational and organizational barrier elements’ performance and competence change over time and need to be verified according to the requirements by regulations [
7].
This is demonstrated by the introduction of references to safety performance indicators in the European Council Directive on the control of major accident hazards involving dangerous substances [
8] and guidelines on safety barrier management by national safety authorities [
7]. For this reason, a number of studies on risk analysis are shifting their focus towards performance assessment of safety barriers and how this performance could decrease with time due to various degradation factors, from corrosion to improper maintenance [
9,
10]. An example of these studies is represented by the frequency modification methodology based on technical, operational, and organizational factors (TEC2O) developed by Landucci and Paltrinieri [
11] to evaluate expected release frequencies specific for the facilities of the Oil and Gas upstream sector. The methodology aims at determining modification factors able to dynamically update the frequency values and support dynamic risk assessment studies.
On the other hand, it must be pointed out that continuous monitoring of equipment performance and degradation does not represent a novel perspective for safety-critical industries. Standards and guidelines for risk-based inspection provide the tools for risk estimation over time based on material degradation and allow the definition of appropriate inspection (and, in turn, maintenance) programmes on equipment. The American Petroleum Institute has defined the standards API 580 on risk-based inspection [
12] and API 581 on risk-based inspection methodology [
13], while DNV-GL has produced the recommended practices for risk-based inspection of offshore top-side static mechanical equipment [
14].
From the Santa Barbara blowout in 1969 to the Macondo blowout in 2010, inadequate barrier risk management has been one of the main causes of many major accidents in the offshore Oil and Gas industry that caused hundreds of life losses, critical environmental damages, and substantial financial losses [
15,
16]. While quantitative risk analyses are performed in companies, they lack establishing performance requirements for barriers and use default fatality-based risk metrics and generic failure data, which is insensitive information for barrier functions during the operational phase [
17]. To bridge this gap to create a close connection between real situations and their analysis, safety barriers’ performance needs to be actively followed up during operation. Therefore, their maintenance and inspection will be an essential activity for failure control and functional restoration.
The barrier maintenance and monitoring can be planned similar to the RBI approach, based on ranking and prioritizing barrier importance to risk control. By developing a method that is understandable and capable of developing comprehensive indicators to monitor safety barriers over time, it will be possible to quantitatively evaluate and communicate how the frequency of potential major accidents changes. The higher risk affecting some barriers would be classified as a higher priority for maintenance with respect to other barriers. The RBI approach can provide better safety at a lower cost than current barrier management processes [
18]. However, the particular challenge in establishing risk-based inspection that also includes safety barriers during the operational phase is how to provide an easily applicable framework for performance assessment of not only the technical barriers but also the operational and organizational aspects.
One of the novelties of this work is the adaptation and improvement of the existing risk-based methods to monitor safety barriers and, at the same time, comply with acceptance criteria on the frequency of dangerous events. In fact, the method suggested by this work will have a twofold aim: assessing the performance of safety barriers and, at the same time, supporting their inspection and maintenance. A tool such as the software Synergi Plant RBI by DNV-GL is considered the starting point for the method development. This approach is integrated with techniques for monitoring management performance through appropriate indicators [
11,
19] in order to provide a complete overview on safety barriers, which are not composed only by technical elements, but also operational and organizational ones.
In the next section, the risk-based inspection role and its general approach within the Oil and Gas sector is explored. In
Section 3, the performance assessment of safety barriers is explained, and the methodological approach for considering technical and management modification factors is presented. The Norwegian Oil and Gas platform on the Goliat field was chosen as a case study in
Section 4 to demonstrate the method’s effectiveness. Since this platform is located in a sensitive area in terms of safety and environment (the subarctic region of the Barents Sea), the case acquires further value for safety-barrier management [
20]. Furthermore, the results from the case study are demonstrated in
Section 5. Based on the findings from the case study, the risk-based approach for safety barrier management is discussed in
Section 6 for an effective and efficient inspection and maintenance plan, and
Section 7 concludes this study.
2. Risk-Based Inspection in the Oil and Gas Sector
Risk-based inspection (RBI) is well established and used in the Oil and Gas and Chemical industries. This approach, along with risk-based maintenance, is described by API RP 581 [
12], originally developed for application in the refining industry. The standard represents a correlation between maintenance activities and main events in the industries [
21]. RBI is also adapted and applied in many other sectors and inspection activities, allowing for the identification of failure mechanisms and rates based on equipment status.
RBI is focused on maintaining the mechanical integrity of pressure equipment items and minimizing the risk of loss of containment due to deterioration, and it is not a substitute for PHA (Process Hazard Analysis) or hazard and operability assessment (HAZOP). RBI is also complementary to RCM (Reliability Centred Maintenance) programs, as both are focused on understanding failure modes, addressing the modes, and therefore improving the reliability of equipment and process facilities [
13]. Standards such as API 581, DNV G-101 [
14], and EN 16991:2018 [
22] developed an on-stream inspection philosophy that led to a series of benefits, such as the ranking and prioritization of inspection and maintenance activities, substantial cost savings, and contributing to reducing operational risks while providing a database of past inspections and future inspection scheduling, updating and controlling risk over time [
23]. In accordance with those standards, the Petroleum Safety Authority (PSA) constantly updates the regulations for onshore and offshore facilities, suggesting the use of a risk-based methodology on process safety systems and functions [
24], evidencing the importance of RBI methodology not only on process equipment but shifting the point of view to safety-barrier management.
Risk-Based Inspection Planning
DNV-GL provides a tool for RBI planning, named Synergi Plant RBI. The software’s main aim is plant integrity management, and it is designed to offer a detailed plan–do–check–adjust approach for managing risk quantitatively for operating upstream and downstream process plants and offshore platforms [
25].
Synergi Plant RBI follows the mentioned industry standards and recommended practices (API 581 [
12] and DNV GL RP-G101 [
14]) for RBI. The software is designed using the definition of risk given by API 581 [
12]:
where the risk (
R) is a function of time (
t) and is the result of the probability of failures (
PoF) in function of time (
t) multiplied by the consequence of such failures (
CoF) expressed in terms of consequence area (CA).
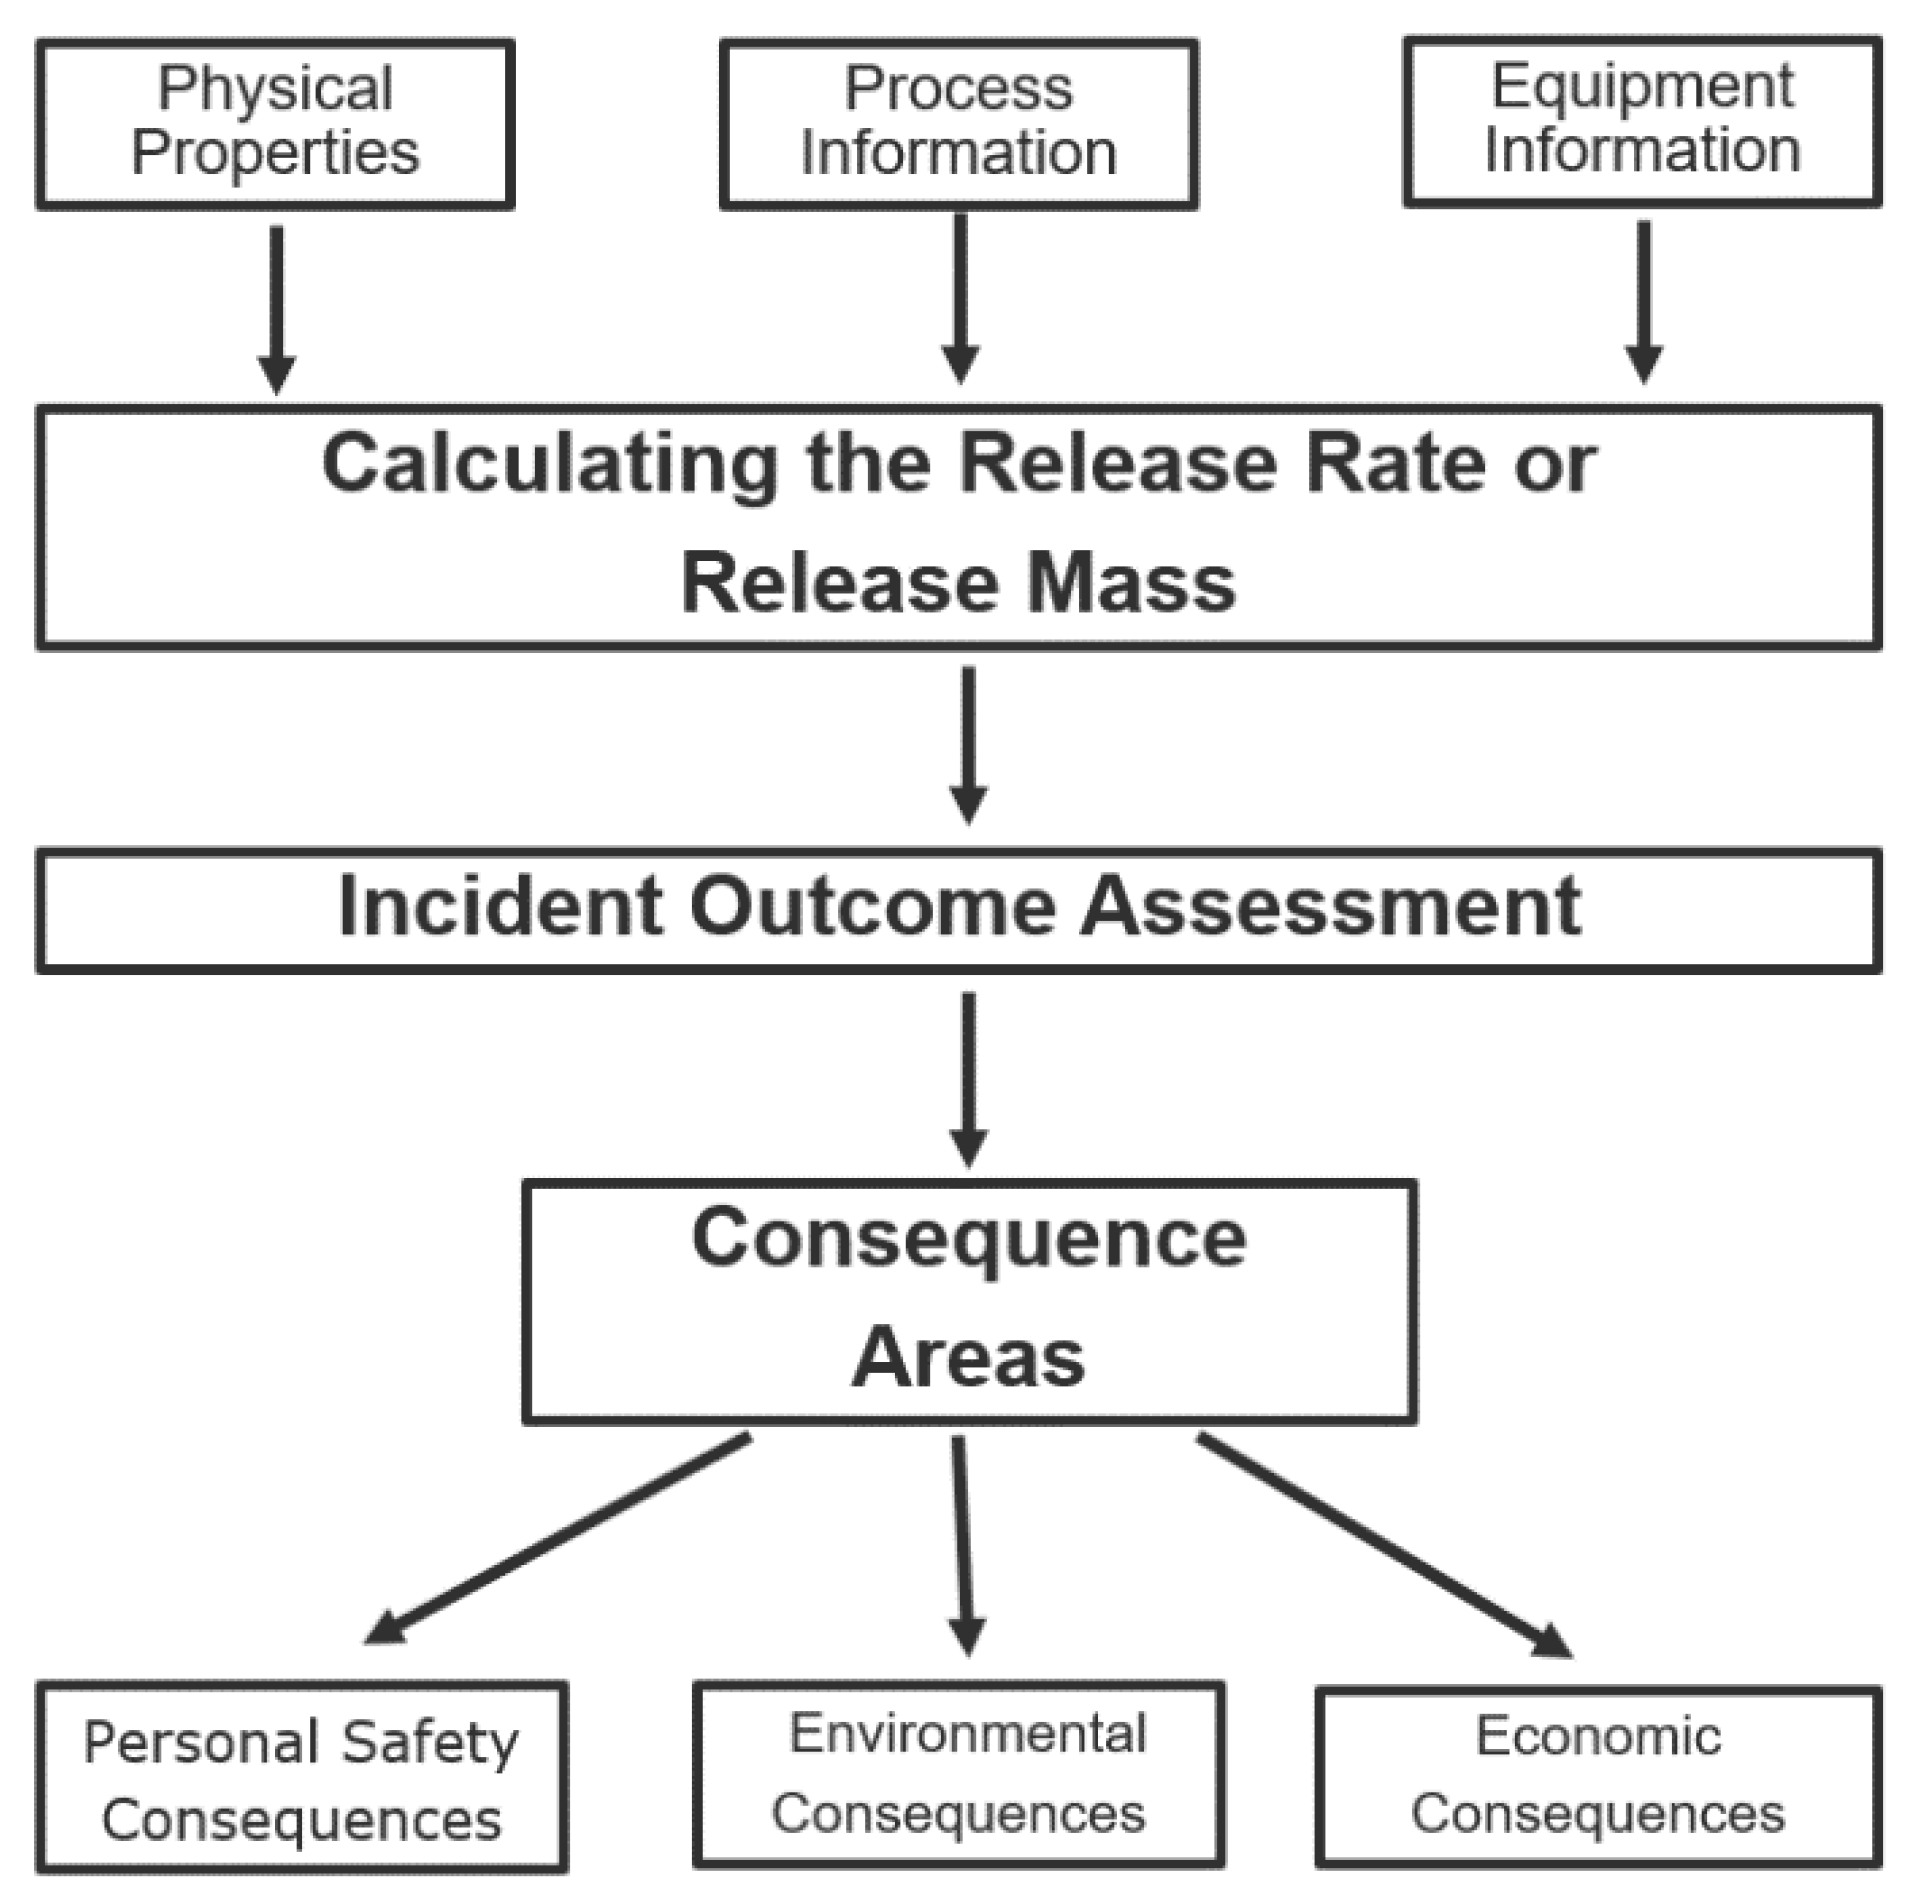
Figure 1 provides a brief overview of how
CoF is analyzed based on API 581. The details of calculations and formulas are explained in part 3 of the standard [
12].
The probability of failure (
PoF) is determined as the product of a generic failure frequency (
gff), a damage factor (
Df) in function of time (
t), and a management systems factor (
FMS).
The generic failure frequencies are defined as failures per year and tabulated in API 581 [
12], as a function of statistical analysis of historical data on failures in the equipment, the component type, and the hole size (small, medium, large, rupture) based on its operating condition, material, and fluid properties, and wall thickness.
The management factor affects all plant equipment evenly and does not alter the inspection priority order, while it can increase the absolute risk if management systems are below average.
Synergi Plant RBI allows considering inspection target values at the production unit level, based on production cost data such as equipment cost per unit area, population density, injury cost per person, outage cost per day, and worst case scenarios such as fatalities. The software suggests inspection plans based on risk analysis of a series of damage mechanisms of the plant equipment. The software results include a summary sheet with input data, active damage mechanisms, inspection history, and the proposed inspection program for every piece of equipment.
3. Performance Assessment of Safety Barriers
Safety barriers may include a range of single technical units and human action to complex socio-technical systems [
26]. Furthermore, a combination of safety barriers may define a safety function performing a specific action. The terms
avoid,
prevent,
control and,
protect suggested in the ARAMIS (Accidental Risk Assessment Methodology for Industries in the Context of the Seveso II Directive) Project [
1,
27] to describe generic functions (
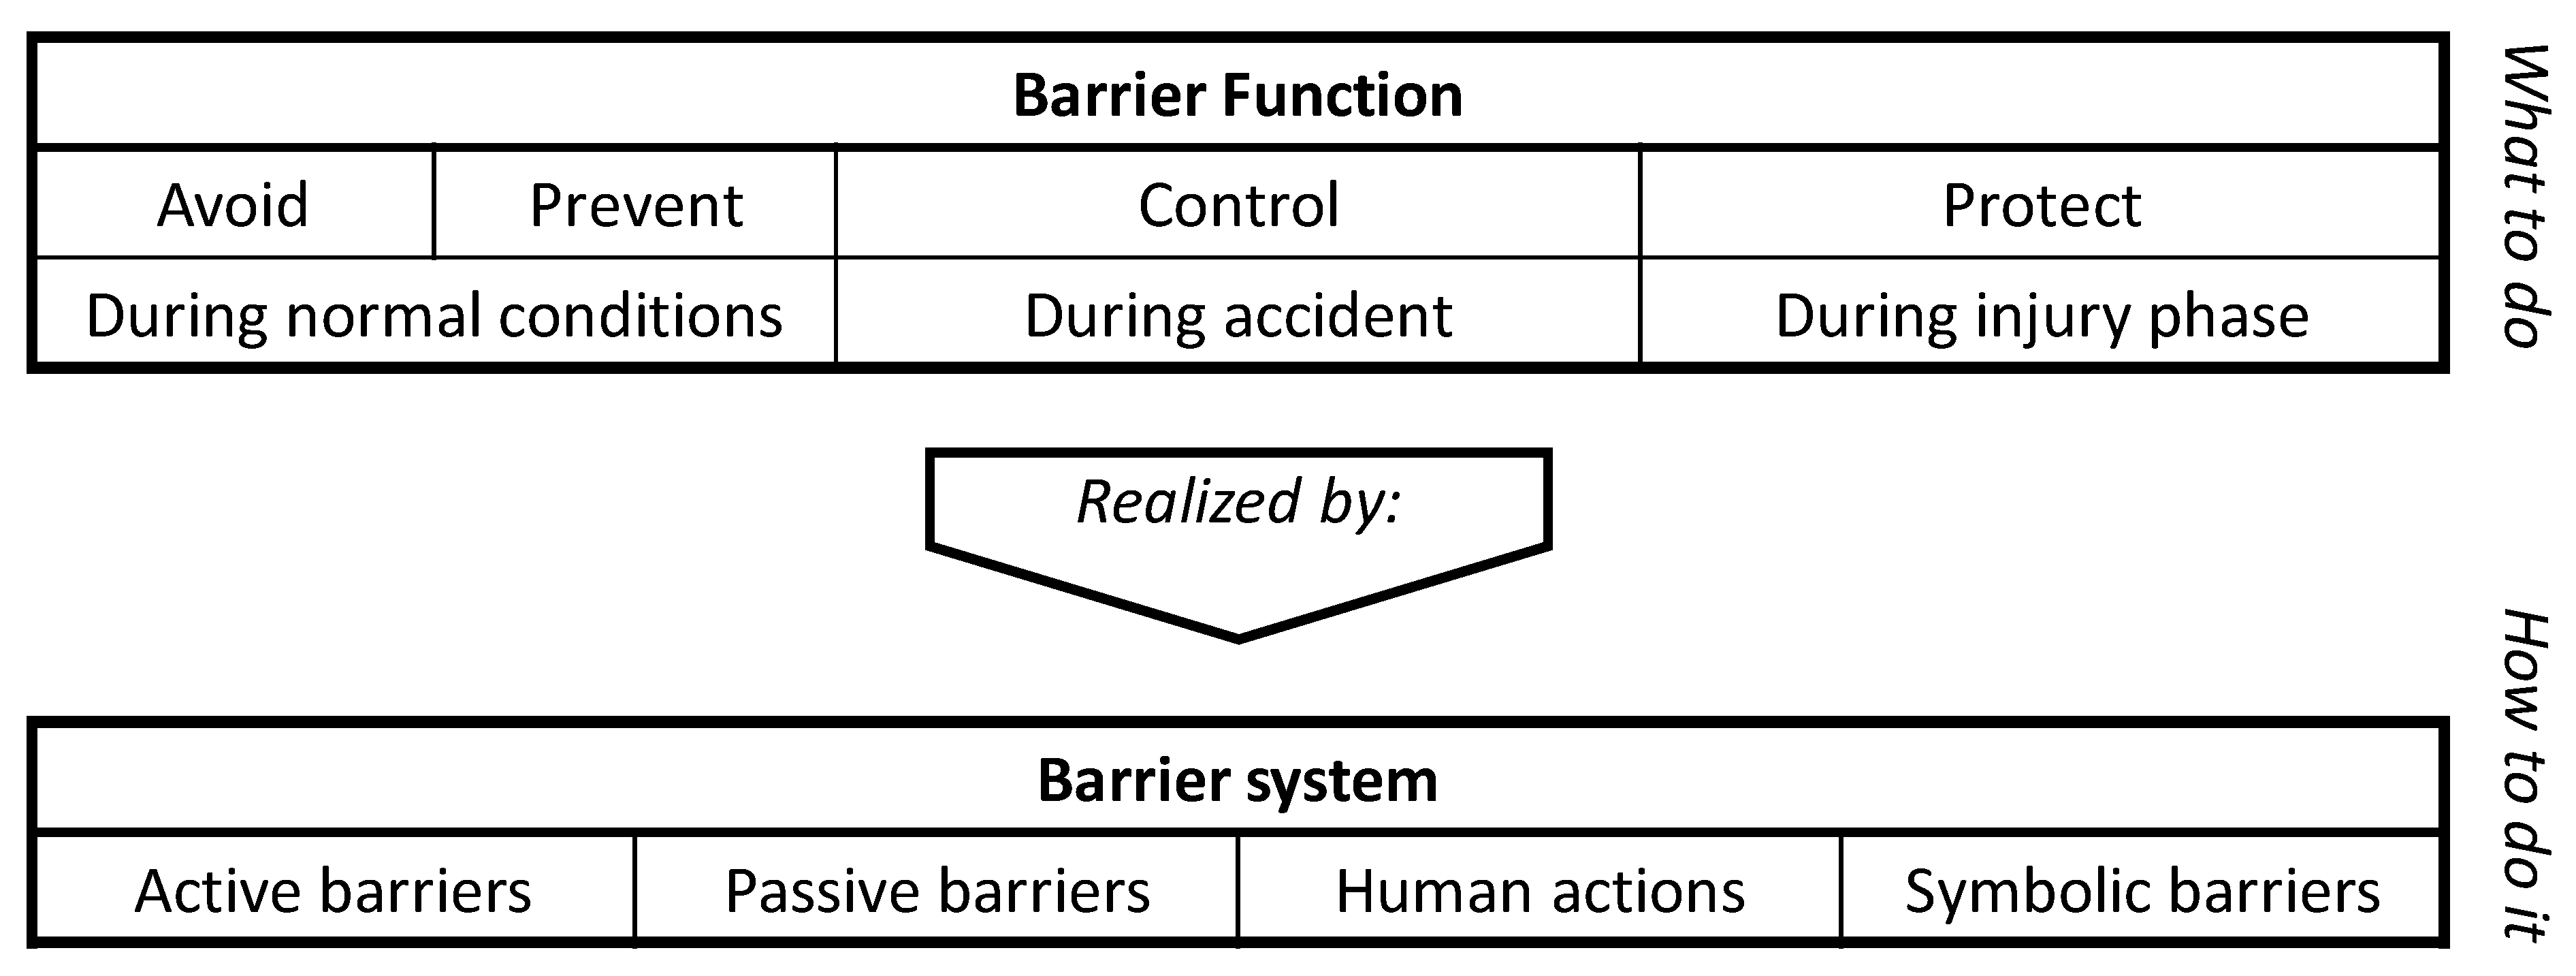
Figure 2). A safety function is a technical or organizational action to avoid or prevent an event, or to control or to limit the occurrence of the event. This action will be performed by one or more safety barriers. Safety functions may decrease the frequency of an event or reduce the frequencies and the consequences of dangerous phenomena [
1].
ARAMIS describes four main categories of safety barriers: active barriers, passive barriers, human actions, and symbolic barriers (
Figure 2). However, the performance of the symbolic barriers cannot be assessed, as they depend on personnel interpretation and are not evaluated in the ARAMIS methodology [
1].
The performance of a safety barrier is defined by ARAMIS according to its Level of Confidence (LC), which is associated with the Probability of Failure on Demand (PFD) to perform a required safety function properly, according to a given effectiveness and response time. The notion is similar to the notion of SIL (Safety Integrity Level) defined in IEC 61511 [
28] for Safety Instrumented Systems, but in this case, it applies to all types of safety barriers. The response time is the duration between the straining of the safety barrier and the complete achievement of the safety function performed by the safety barrier. This study assumes a constant response time, despite the fact that its definition requires data from suppliers, experience from the industrial sector, testing, and datasheets.
An overall LC is estimated for the safety function by considering the LCs of the involved barrier systems. A safety function LC is equal to the smallest LC among the involved safety barriers [
1]. If the safety barrier is further composed of subsystems, the barrier LC is, in turn, given by the smallest LC among the subsystems.
Such aggregation of LCs depends on the complexity of the safety function and the type of safety barriers. In fact, safety barriers are classified as follows [
29]:
- (a)
Type A: the failure modes of all components are thoroughly defined, failure data from field experience exist, and the behaviour under fault conditions can be determined (example: mechanical devices);
- (b)
Type B: the failure modes are not thoroughly defined for each component, the behaviour under fault conditions cannot be determined a priori, and failure data exist, but not for all the sub-components (complex systems such as processors).
LC can be associated with a PFD range based on the ARAMIS guidelines [
29] (
Table 1). Therefore, in order to obtain a PFD discrete value, the mean value of a negatively skewed (i.e., conservative) distribution within the indicated range was considered.
3.1. Bow-Tie Analysis
The bow-tie analysis is a risk analysis technique ideally suited for the initial evaluation of an existing process or application during the intermediate stages of process design [
30]. The bow-tie technique in its visual form makes the analysis easy to understand and shows the safety barriers or safety functions (depending on the level of detail of the diagram) protecting against particular causes and consequences of an accident scenario [
30]. The analysis combines fault tree and event tree analyses, which are merged to share a common element called Critical Event (CE,
Table 2).
Table 2 recalls the general definitions of the basic bow-tie elements [
1]. The development of bow-ties can be performed following conventional guidelines, such as those outlined by the Centre for Chemical Process Safety [
30]. As an alternative, the ARAMIS guidelines can be applied [
1].
3.2. Technical, Operational, and Organizational Factors
As the purpose of this work is to develop a method to assess the performance of safety functions over time, a relevant technique for the tailorization of leak frequency values was considered as a starting point. This method, named TEC2O (Frequency modification methodology based on TEChnical Operational and Organizational factors) is based on periodic revision and updates of indicators whose contribution can modify the expected leak frequency [
9]. Indicators are quantitative parameters that can be monitored, modified, and updated over time [
31]. The authors developed the method to assess risk in a dynamic way and validated it by means of a benchmark with similar approaches, such as API 581 [
13], ARAMIS Project [
1], and CCPS [
32]. To support periodic QRA (Quantitative Risk Assessment) updates, dynamic frequency evaluation is conducted for equipment failures and leaks.
The methodology designed in this work is specific for safety systems and their management. The LC of the safety functions designed by ARAMIS is adjusted by a Level of Confidence Modification Factor (
LCMF) defined as follows:
is the Technical Modification Factor, associated with safety function complexity, aging, construction, and process. is the Management Modification Factor linked with the evaluation of safety management systems addressing both operational and organizational aspects.
TEC2O [
11] is the starting point, but the indicators used to assess the modification factors are adapted to the ARAMIS definition of technical factors [
1] and the Resilience-based Early Warning Indicator (REWI) definition of management factors [
19]. Technical indicators are integrated with information from API 581 [
13] and the ARAMIS Project [
1], taking in account the lifecycle of safety functions, their complexity, response time and external factors. Operational and organizational indicators are redesigned based on the REWI method [
19].
3.2.1. Technical Modification Factor
The technical modification factor (TMF) is divided into four subfactors, each of them considering different technical aspects related to safety barriers:
- (a)
Aging subfactor (A): aging of the safety barriers related to the safety function, due to corrosion phenomena and inspection quality;
- (b)
Environmental subfactor (U): whether conditions and features of the plant in which the safety barriers work;
- (c)
Construction subfactor (M): design complexity, total response time, and lifecycle of the safety barriers considered; and
- (d)
Process subfactor (P): process stability factor and mode of operation of safety barriers, considering the possible deterioration.
Each subfactor is associated with indicators based on a defined scale. Indicators are mathematically combined (potential penalties are also considered) and converted into a subfactor value, which is converted into a score, from 1 to 6, where 1 is the best performance condition and 6 the worst. The combination of the scores of each subfactor leads to the technical modification factor
TMF score. Once the evaluation of the four subfactors (A, U, M, P) and their associated score (score of aging subfactor
SA, score of environmental subfactor
SU, score of construction subfactor
SM, score of process subfactor
SP) is completed, the next step is to carry out a weighted sum to obtain the score for the technical modification factor (
STMF):
Weights are to be adapted based on the expert judgment of the technical subfactors. However, this study considers equally distributed weights for the subfactors, assuming that each subfactor has the same importance.
3.2.2. Management Modification Factor
Management aspects are related to safety procedures, training and competencies of the operator, safety culture, frequency of maintenance operations, and communication at different levels of an organization. All these elements are linked to the likelihood of an accident, but their quantification is challenging [
11]. The REWI methodology [
19] proposes the use of indicators to convert these aspects into quantitative parameters based on the concept of resilience (“the capability of recognizing, adapting to and coping with the unexpected” [
33]). The TEC2O method [
11] provides already a selection of relevant REWI indicators, grouped into two subfactors:
- (a)
Operational subfactor (OPE), about personnel training, skills and experience; and
- (b)
Organizational subfactor (ORG), which concerns safety culture and procedures.
The indicators defined in this method are to be monitored for all the lifecycle of a plant, leading to quantitative parameters that change over time. These indicators come from the managerial sections of an organization; thus, it is important to collect data from the interested sections of the organization, considering the reliability and accuracy of the surveys to reduce the uncertainty related to the use and collection of management indicators. Indicators have a score ranging from 1 to 6. In the absence of quantitative data for an indicator, the following scores are applied:
- (a)
High performance = 2
- (b)
Medium performance = 4
- (c)
Low performance = 6
An intrinsic penalty given to the highest performance assures conservatism and highlights the uncertainty of a qualitative indicator.
The operational subfactor (
OPE) is designed to highlight wrong operational procedures. The qualitative score of the operational subfactor (
SOPE) is evaluated as follows:
The organizational subfactor refers to wrong communication, company safety culture and formation, and information of personnel. The qualitative score of the organizational subfactor (
SORG) is defined as follows:
SOPE,i and SORG,i in Equations (6) and (7), are the scores for each of the indicators adopted for the specific analysis.
In the design version of this method, the weight for each operational and organizational indicator is the same. It is now possible to evaluate the score of the management modification factor (
SMMF) as a combination of operational and organizational scores:
Weights are to be adapted based on the expert judgment of the operational and organizational subfactors. However, this study considers equally distributed weights for the subfactors, assuming that each subfactor has the same importance.
3.3. Level of Confidence Modification Factor Evaluation and Use
After the evaluation of
STMF and
SMMF, it is possible to calculate
LCMF for the safety function considered:
In this case, the weights for the technical score and the management score do not have the same value. Zipf’s law [
34] was used to assess the weights (
w) based on a ranking (
j) of the modification factors.
The technical factor was ranked first and given a weight of 0.75, as its indicators may be characterized by relatively higher objectivity. The management factor was ranked second and given a weight of 0.25, as its indicators may be characterized by a relatively higher uncertainty and subjectivity. Equation (8) is modified as follows:
The
LCMF is a number ranging from 1 to 6 and can modify the design level of confidence of a safety function as indicated in
Table 3. The design LC is the level of confidence evaluated based on design conditions and ARAMIS indications. If
LCMF is between 3 and 4, LC will not change. If
LCMF is between 1 and 3, LC will increase by one unit. If
LCMF is between 4 and 6, LC will decrease by one unit.
4. Goliat Floating, Production, Storage, and Offloading Unit
The oil and gas (O&G) industry is constantly exploring new regions. These explorations have also focused on arctic and subarctic regions driven by promising resources [
35,
36,
37,
38,
39]. However, many challenges are to be faced. Climate and ocean-wave loads have an obvious influence on the choice of design, operations, and maintenance [
35,
40]. Operations may be delayed by harsh weather, and maintenance has to focus on components that are quickly deteriorating [
35,
37,
41]. In addition, rich and important ecosystems can be found in these regions [
35,
37], which, in some cases, such as the Barents Sea, are considered World Wildlife Fund (WWF) marine ecoregions for global conservation [
42] and high-priority areas for biodiversity maintenance [
43].
Within this context, the platform on the Goliat field in the Barents Sea started production in 2016. The production license is owned by ENI Norge, with 65%, and by Statoil, with 35%. The platform is a circular floating production, storage, and offloading unit (FPSO), specifically designed by the offshore oil and gas sector to ensure safe and reliable production of hydrocarbons in extreme conditions in the Barents Sea. In fact, in such a sensitive area, monitoring technical and operational performance of safety barriers on Oil and Gas facilities acquires further importance [
44,
45,
46,
47,
48]. For this reason, the Goliat platform was considered for the study.
The diameter of the Goliat FPSO is approximately 100 m, with a spread mooring to avoid rotation and a winterization wall in its perimeter to protect personnel and equipment from weather and allow natural ventilation to the area [
49]. Goliat arrived in Hammerfest (Norway) in April 2015 from South Korea, after a 63-day voyage. Goliat covers two separate main reservoirs: the Kobbe and the Realgrunnen. The Goliat FPSO has a complete onboard processing plant. The stabilized crude oil stored in the loading tanks is unloaded directly from the FPSO to the tankers via an unloading system. This work focuses on the process area, which consists of two areas equipped with fire protection: the main process area and the offloading process area. These two fire protection areas are separated from each other by a firewall and a blast wall.
4.1. Process Description
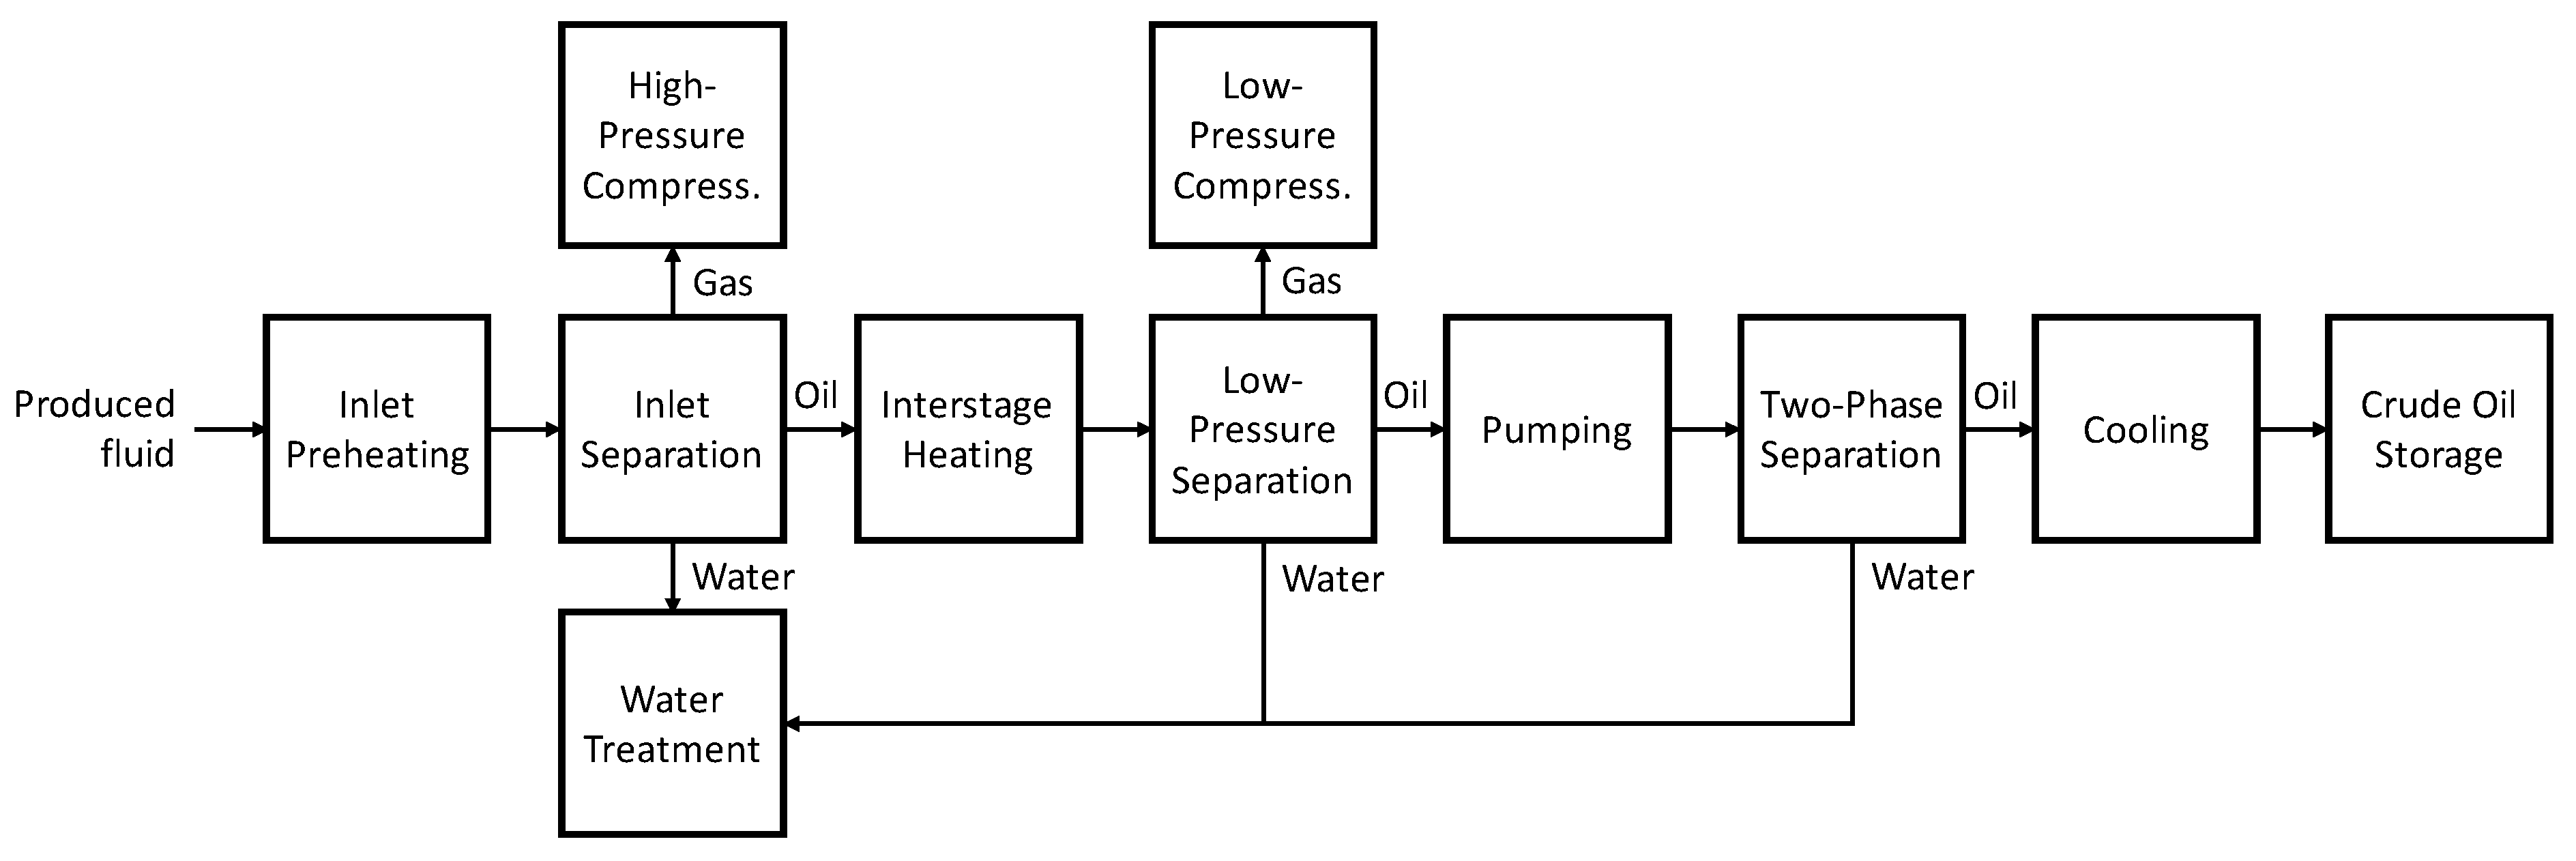
The fluid from the wells is routed to the FPSO for separation, oil stabilization, and gas compression. Stabilized crude oil is stored on the FPSO for subsequent offloading to shuttle tankers. The fluid is preheated in an inlet heater to facilitate free water removal in the downstream inlet separator. The inlet separator is a three-phase separator, separating gas, oil, and water. The gas is sent to high-pressure compression, while the water is sent to water treatment. The oil is heated by the inter-stage heater to achieve the specifications in the downstream low-pressure separator. This latter separator is also a three-phase separator for gas, oil, and water. The gas is sent to low-pressure compression, the water to water treatment, and the oil is pumped to an electrostatic coalescer. The electrostatic coalescer operates as a two-phase separator splitting the feed stream into oil and water phases under the influence of an electrostatic field. Water is sent to treatment while the oil is cooled down and sent to storage tanks in the hull. The FPSO process is illustrated by a block diagram in
Figure 3.
4.2. Safety Barriers
Goliat safety barriers were identified, and their Level of Confidence (LC) was obtained according to the platform records and was classified following the ARAMIS guidelines [
50] (
Table 4).
The combination of the safety barriers in
Table 4allows defining a series of related safety functions (
Table 5).
Two safety function management scenarios are arbitrarily assumed for testing the defined methodology to analyze the case study and described by the following Management Modification Factor (MMF) scores:
- (a)
Management Modification Factor Score: High = 1.5
- (b)
Management Modification Factor Score: Low = 5.5
The two scores respectively refer to high and low management performance of safety functions.
6. Discussion
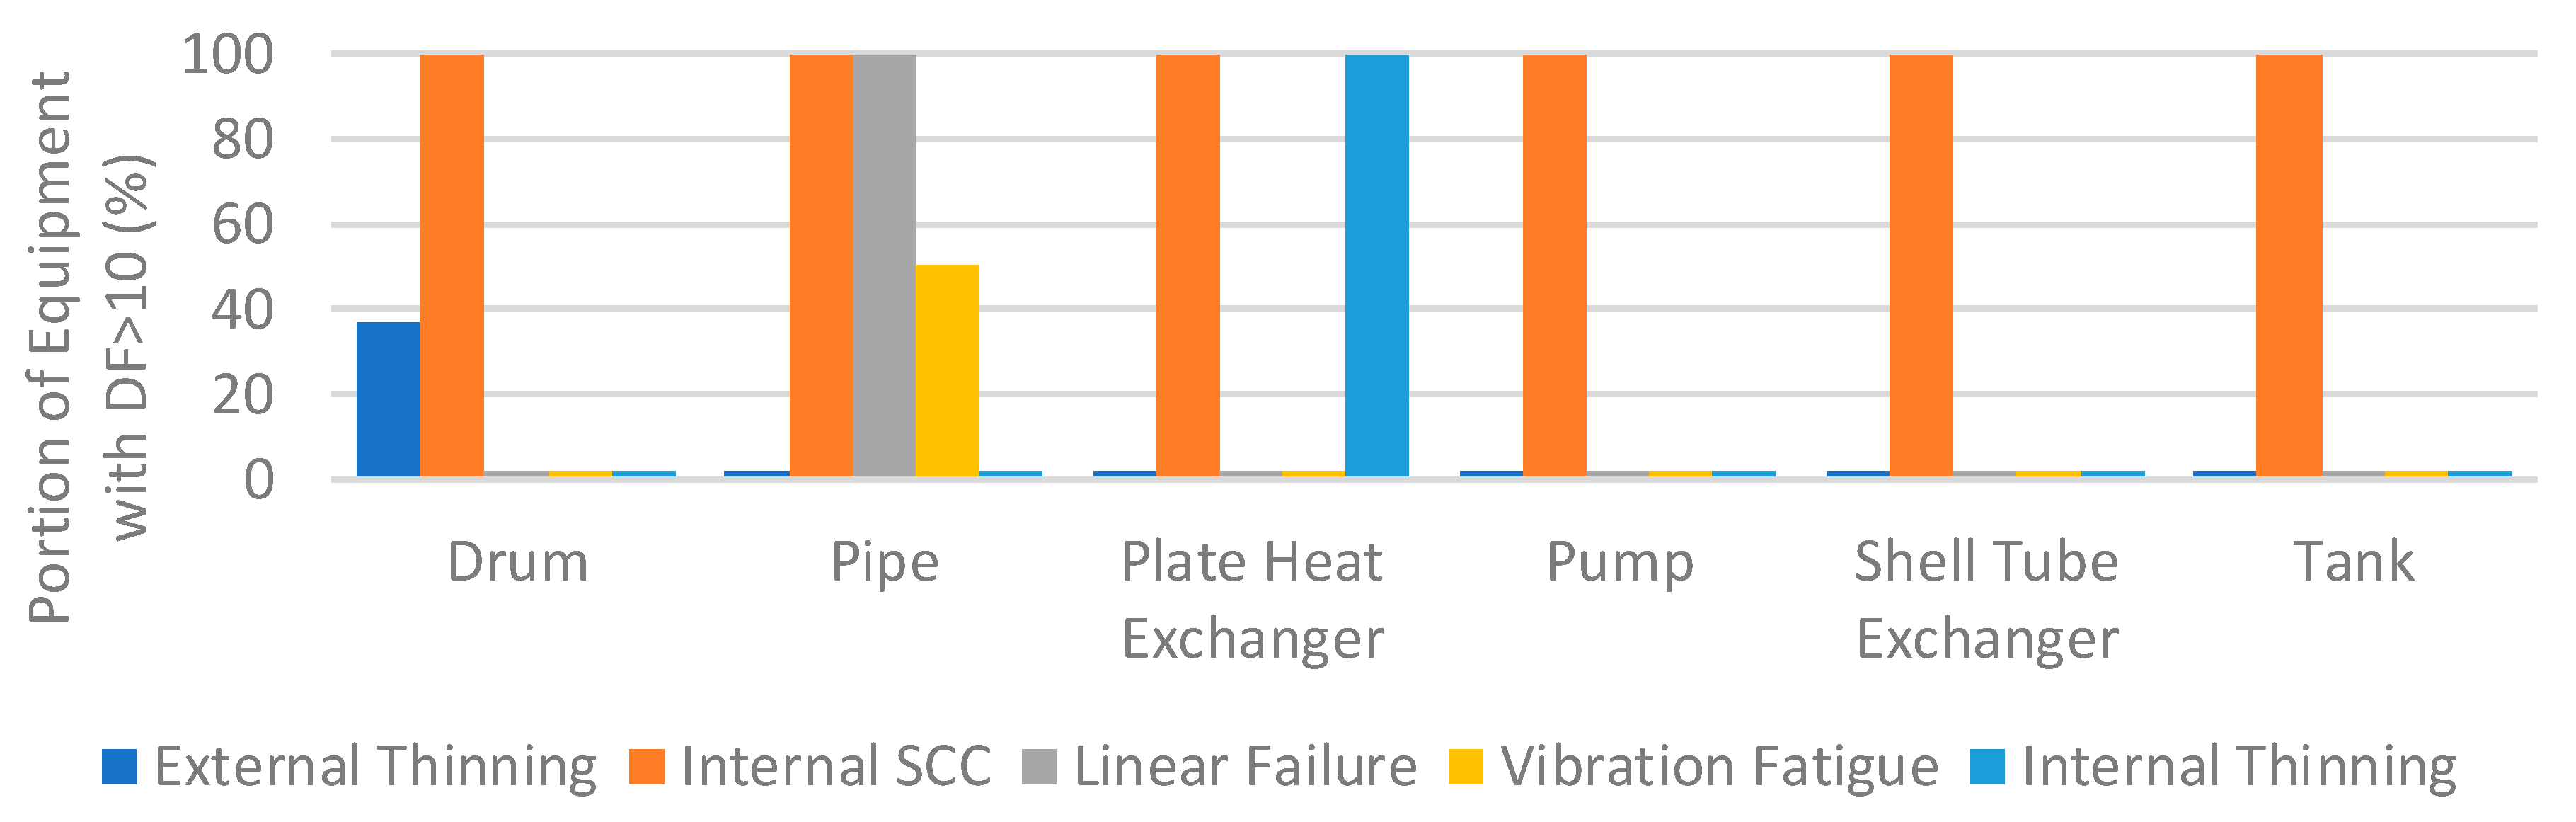
The application of Synergi Plant RBI to the piping system of Goliat FPSO identified the driving damage mechanism of Stress Corrosion Cracking (SCC) [
60]. However, the inspection plan resulting from Synergi Plant RBI is realized without considering the management modification factor because it is not mandatory for the API 581 recommended practice [
13]. This factor may affect all the plant pieces of equipment as it can either improve or worsen their performance. The management factor may be instead considered while assessing the performance of the safety functions and safety barriers. This is an important topic in the Oil and Gas sector since the current regulations [
7] focus their attention not only on the integrity of the equipment but also on the performance of all the safety barriers in a system.
Current safety practices rely on engineered barriers. Passive systems, such as firewalls or blast walls, do not require external activation but need to be maintained effectively to avoid deterioration. Active systems, such as emergency shutdown and water deluge systems, may support the management and control of escalation scenarios by their integration with passive measures. Since safety barriers have a significant mitigation potential in controlling the risk induced by domino scenarios, the specific assessment of their quantitative performance in risk mitigation and control is necessary [
58].
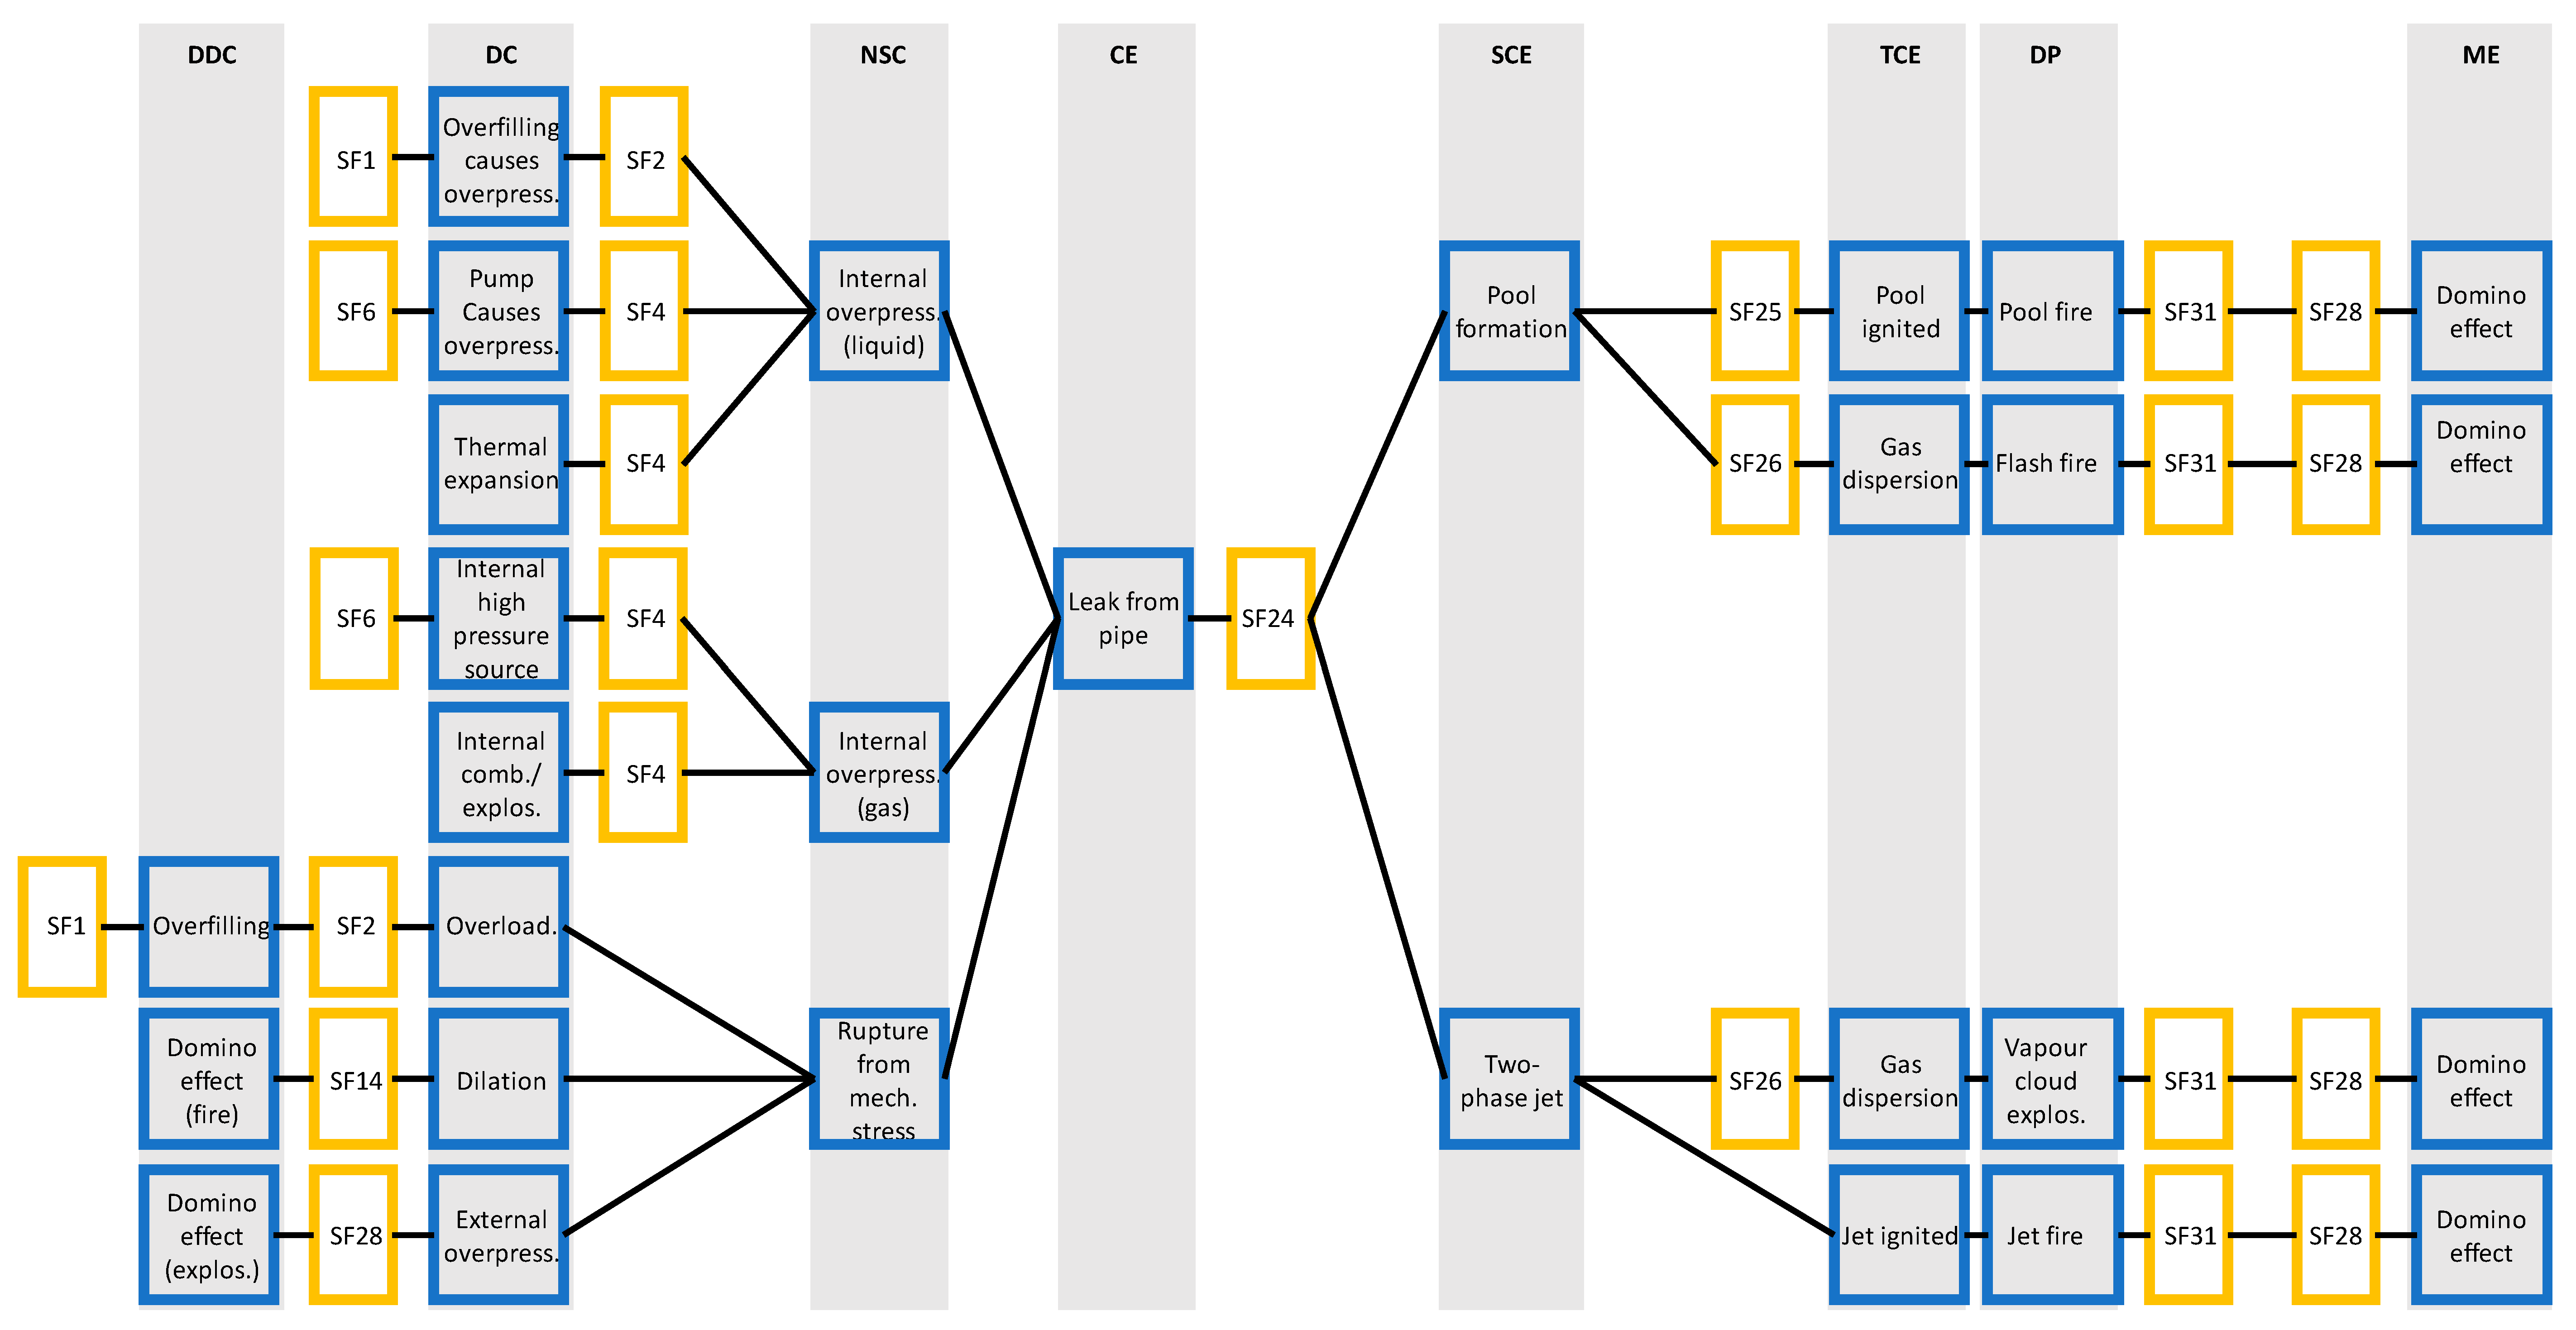
The bow-tie analysis carried out in this work following the ARAMIS Project instructions [
1] is set as the baseline for the study. However, it does not consider technical and management factors that can modify the probability of failure of safety functions. On the one hand, its results show negligible and medium effects of the accident scenarios identified (
Figure 7). On the other hand, the dangerous phenomena identified are critical for any FPSO, due to their potential of escalation [
61]. An ignited leak in the top-side process area considered in the case study could lead to a domino effect, impacting the cargo tank and leading to an explosion due to the flammable gas volume. Fires in the process area and escalating tank explosions could lead to the impairment of evacuation means for the personnel and a loss of the main load-bearing [
62].
Several safety barriers are considered by the bow-tie analysis to avoid escalation scenarios. Their probability of failure on demand may not be constant in time, as it is susceptible to potential degradation associated with technical factors. The method suggested in this work is inspired by concepts of dynamicity of risk analysis [
63], evaluating changes in the failure probability of safety barriers based on indicators of technical and managerial factors.
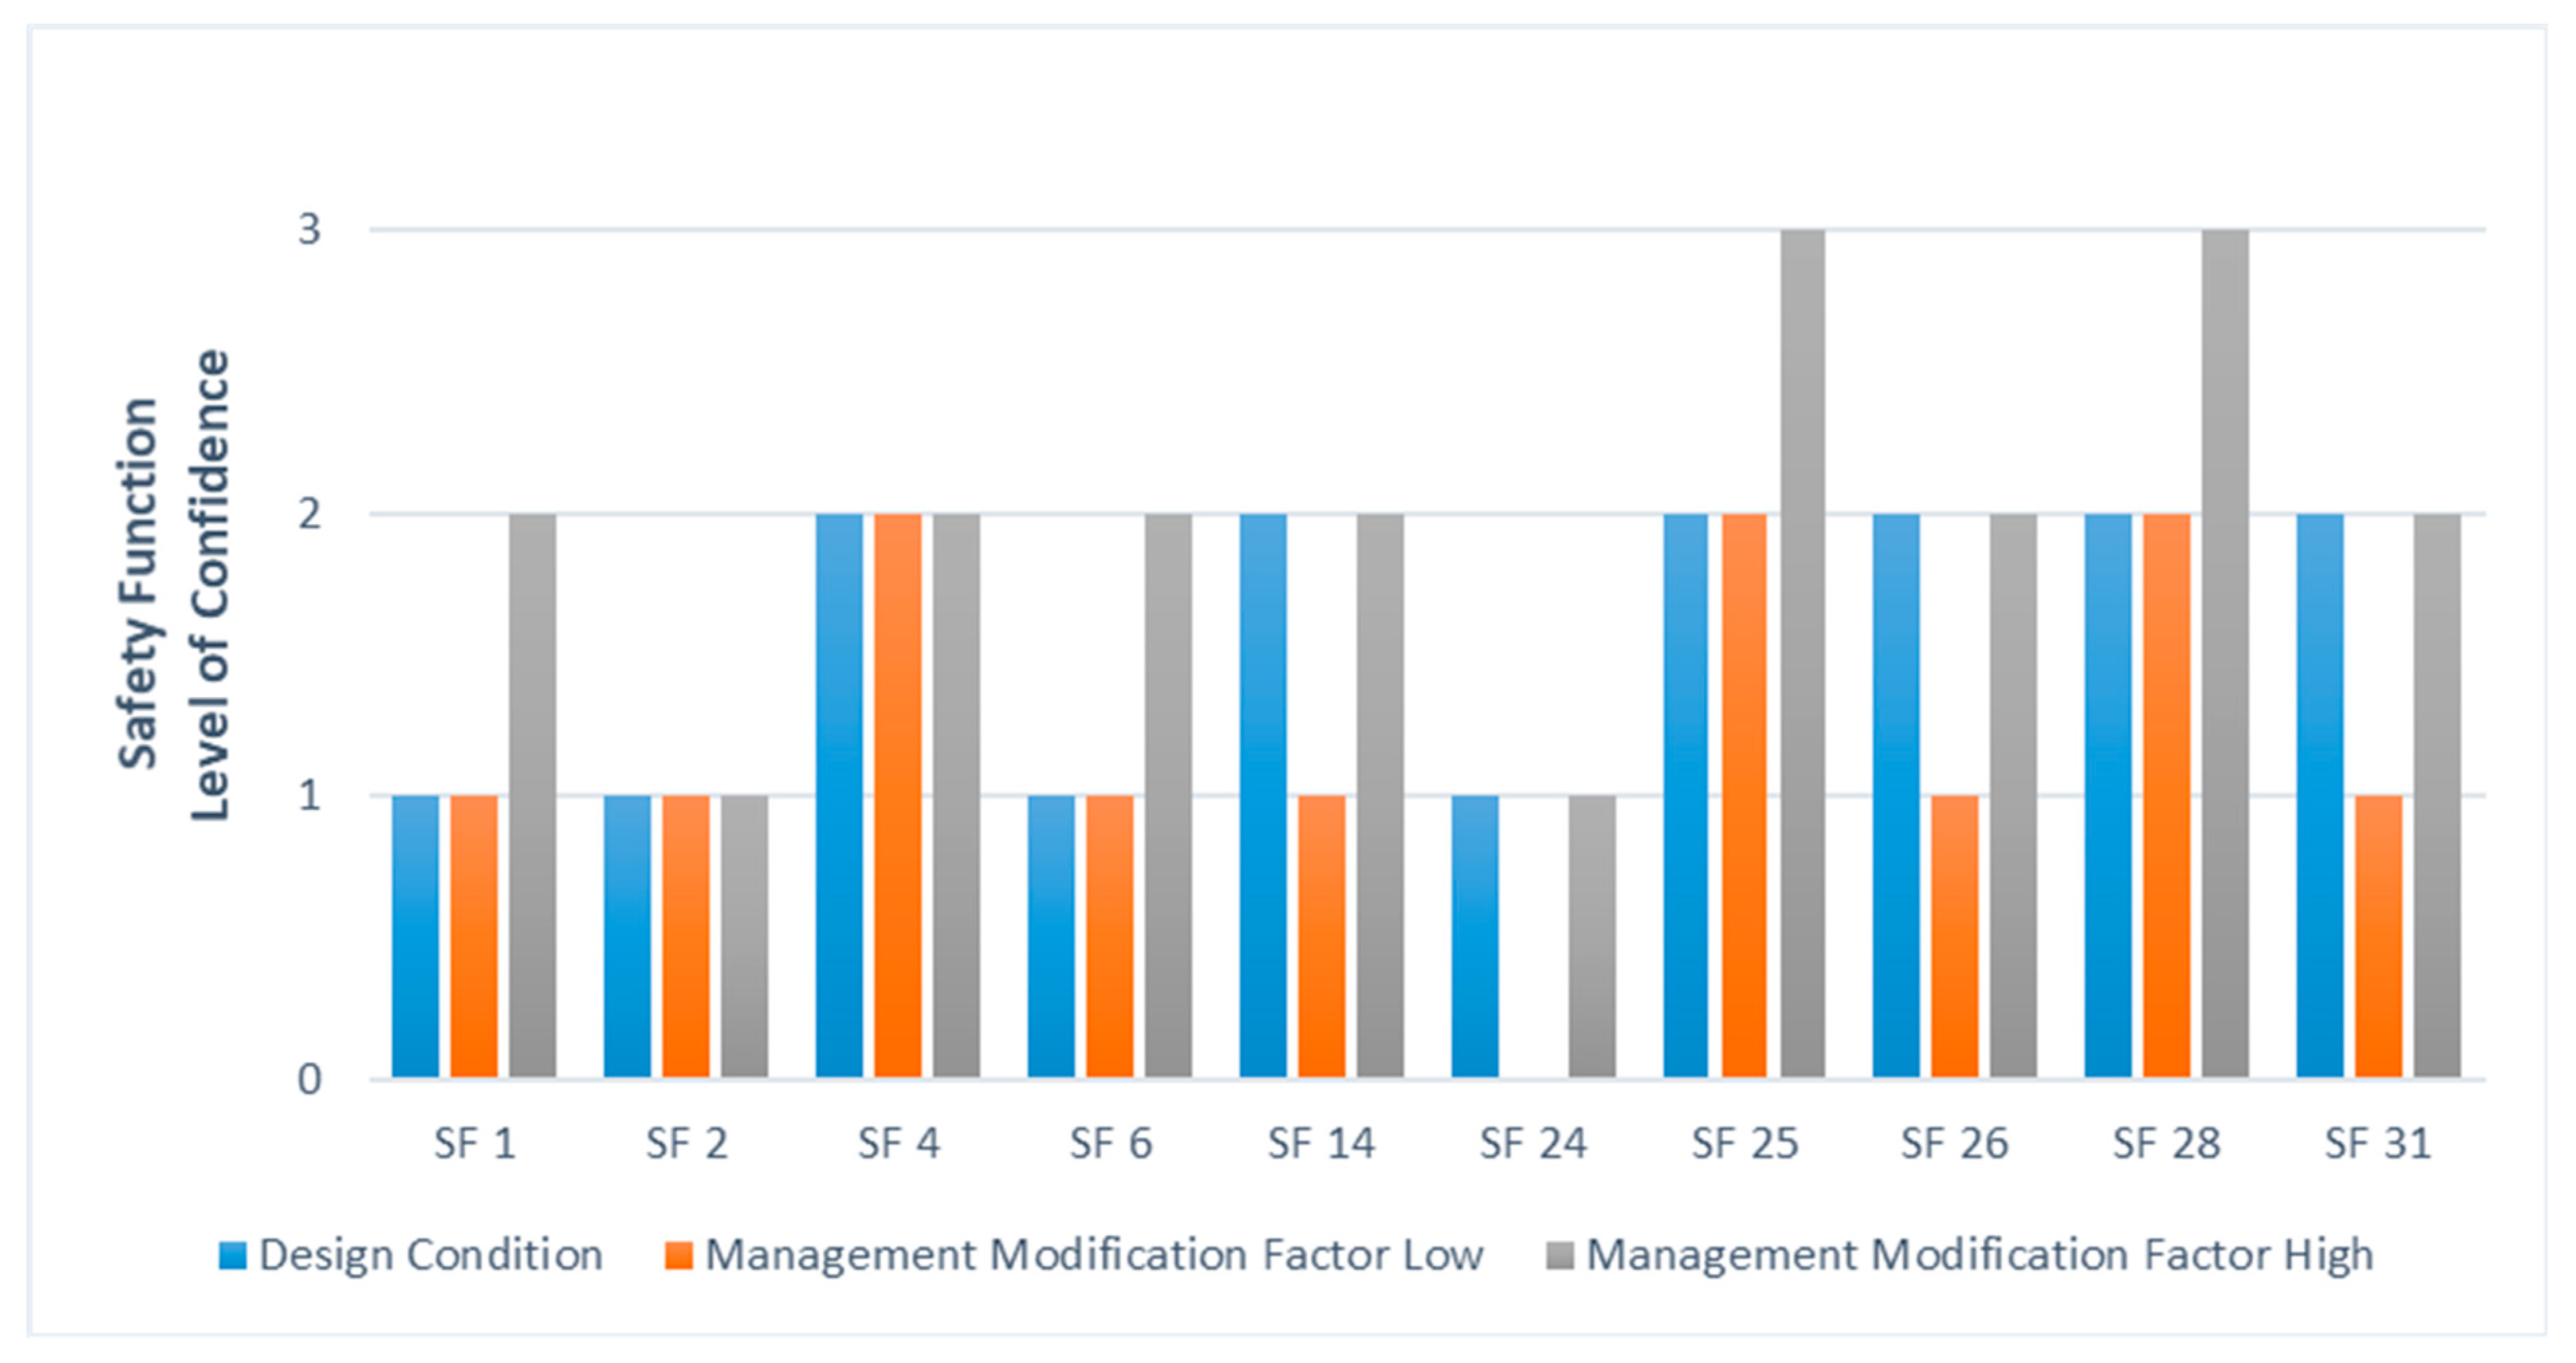
Management factors are, instead, characterized by a relative uncertainty, as they can be defined through surveys and qualitative approaches. For this reason, this work associates a lower weight to these factors. However, the analysis showed that they are crucial, and they can sensibly modify the level of confidence of some safety functions, as shown by
Figure 8.
This result shows that a safety function, even if it is mainly composed of technical safety barriers, is likely to improve its performance with appropriate management. The safety functions 1, 6, and 25 (respectively, prevent overfilling, prevent internal overpressure, limit pool formation and prevent escalation to other areas) are examples of such behavior. Instead, relatively more complex safety functions, composed of active and passive barriers and characterized by human interactions, are tendentially sensitive to poor management. Despite the exception of safety function 28 (prevent escalation to other areas), examples of the latter behavior are the safety functions 14, 24, 26, and 31 (respectively, prevent escalation to other equipment, limit hydrocarbon leak, limit gas dispersion, and limit fire in process area). Furthermore, some safety functions show a negligible influence from management performance changes.
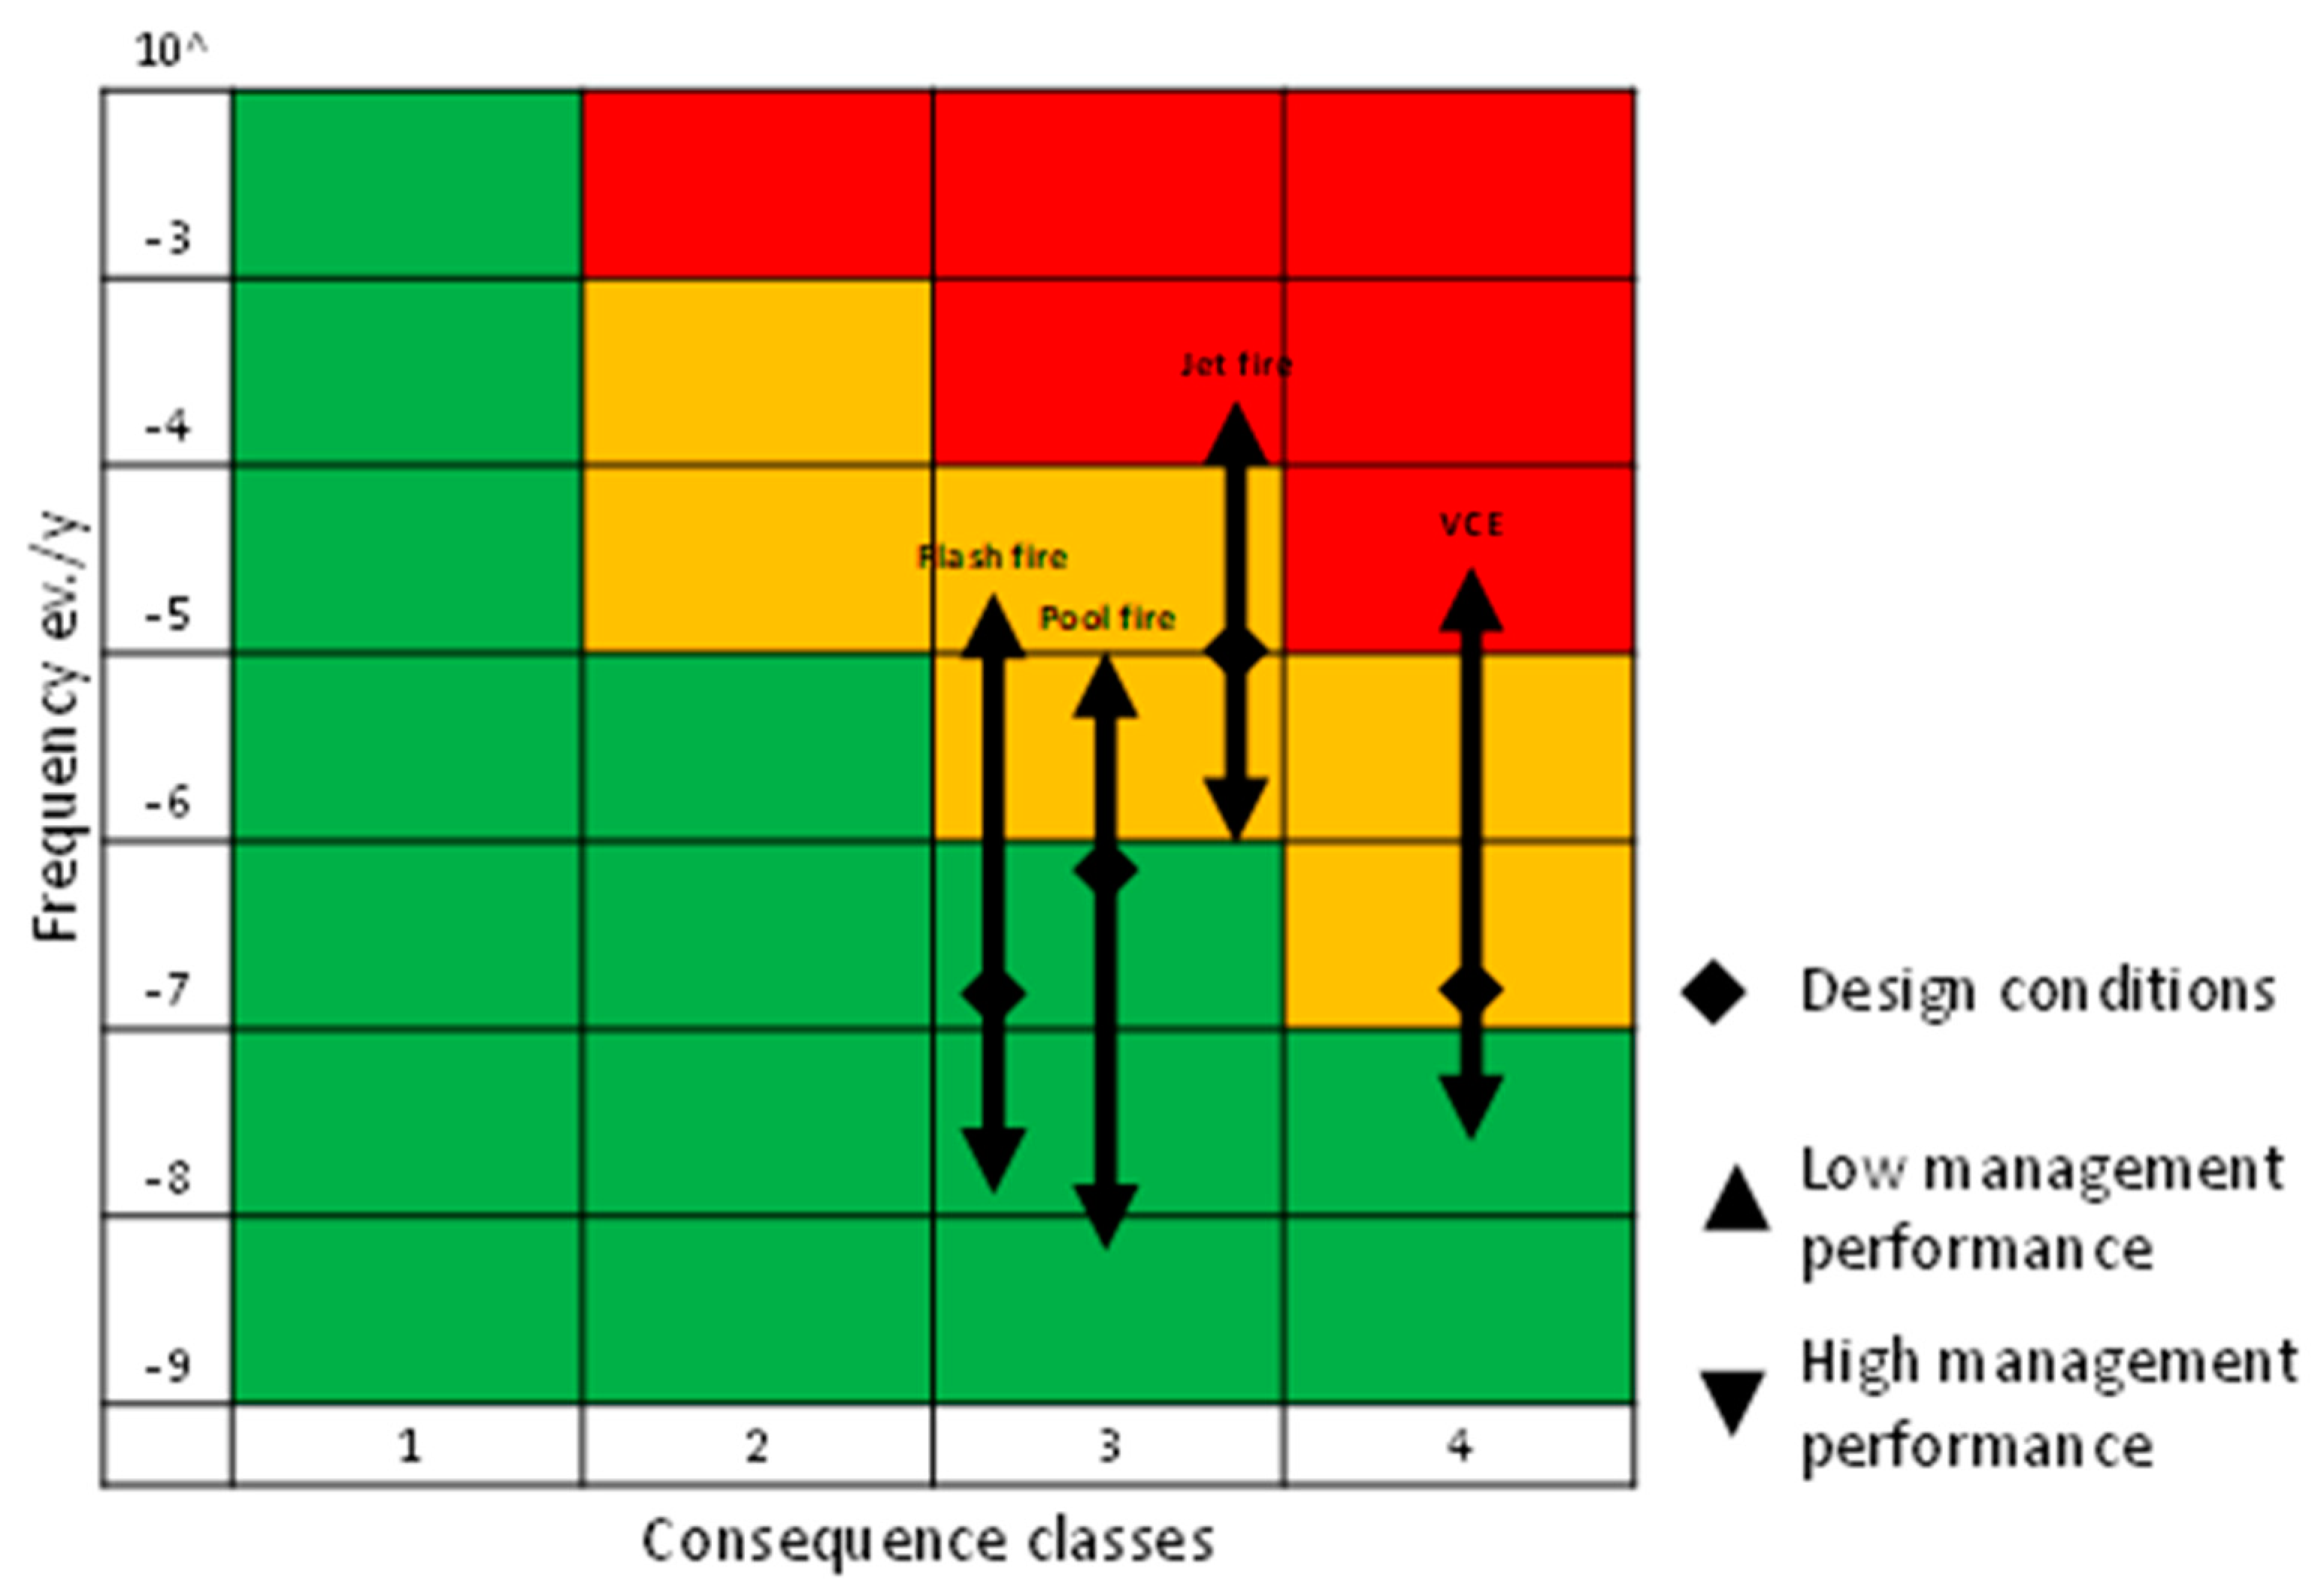
The study demonstrates that improving general management performance leads to a decrease in the frequency of dangerous phenomena (
Figure 7). This change allows obtaining an overall acceptable risk level, as all the phenomena, except the jet fire, result in the risk matrix area of negligible effects. The occurrence frequency of the jet-fire scenario lowers sensibly but remains in the yellow zone of medium effects, highlighting the criticality of this phenomenon in a FPSO.
As shown by Bubbico et al. [
20], the jet fire may lead to potential accident escalation. In offshore-platform installations, protection against escalation is usually achieved by adopting multiple safety levels that may include: a basic process control system, instrumented safety systems, passive and active systems, safety shutdown systems, protection systems (post-release actions), and emergency response plans [
64]. Attention should be given to safety functions that prevent domino effects and to the indicators to describe the resilience of the safety barriers.
7. Conclusions
The study shows that the Risk-Based Inspection approach may be feasible also for the management of safety barriers, giving credible results to estimate their performance, focusing attention not only on technical aspects but showing the importance of management aspects, which may be disregarded by industrial practices. Furthermore, this method provides a preliminary assessment for an inspection and maintenance plan for safety barriers that could be implemented in a RBI program.
The application of this method to the Goliat FPSO demonstrates the importance of management performance with respect to safety and safety functions. The results show that with a high management performance, the frequency of major accidents is significantly reduced. On the contrary, low management performance may be critical in terms of expected consequences.
Management factors should be considered along with technical ones. The proposed method allows this, keeping in mind that all the indicators can be calibrated based on the characteristics of a plant. In fact, the method can be treated as an open toolbox, which can be customized for a wide range of requirements for projects in the Oil and Gas industry, and it should also be included in risked-based decision making for similar industries such as offshore wind. Clearly, the management factor may be affected by uncertainty and requires detailed and in-depth knowledge of the entire plant, with the need of financial means to accomplish a well-developed and reliable safety system.


