
Long-Term Evolution and Monitoring at High Temporal Resolution of a Rapidly Retreating Cliff in a Cold Temperate Climate Affected by Cryogenic Processes, North Shore of the St. Lawrence Gulf, Quebec (Canada)

 ,
,
Abstract
:1. Introduction
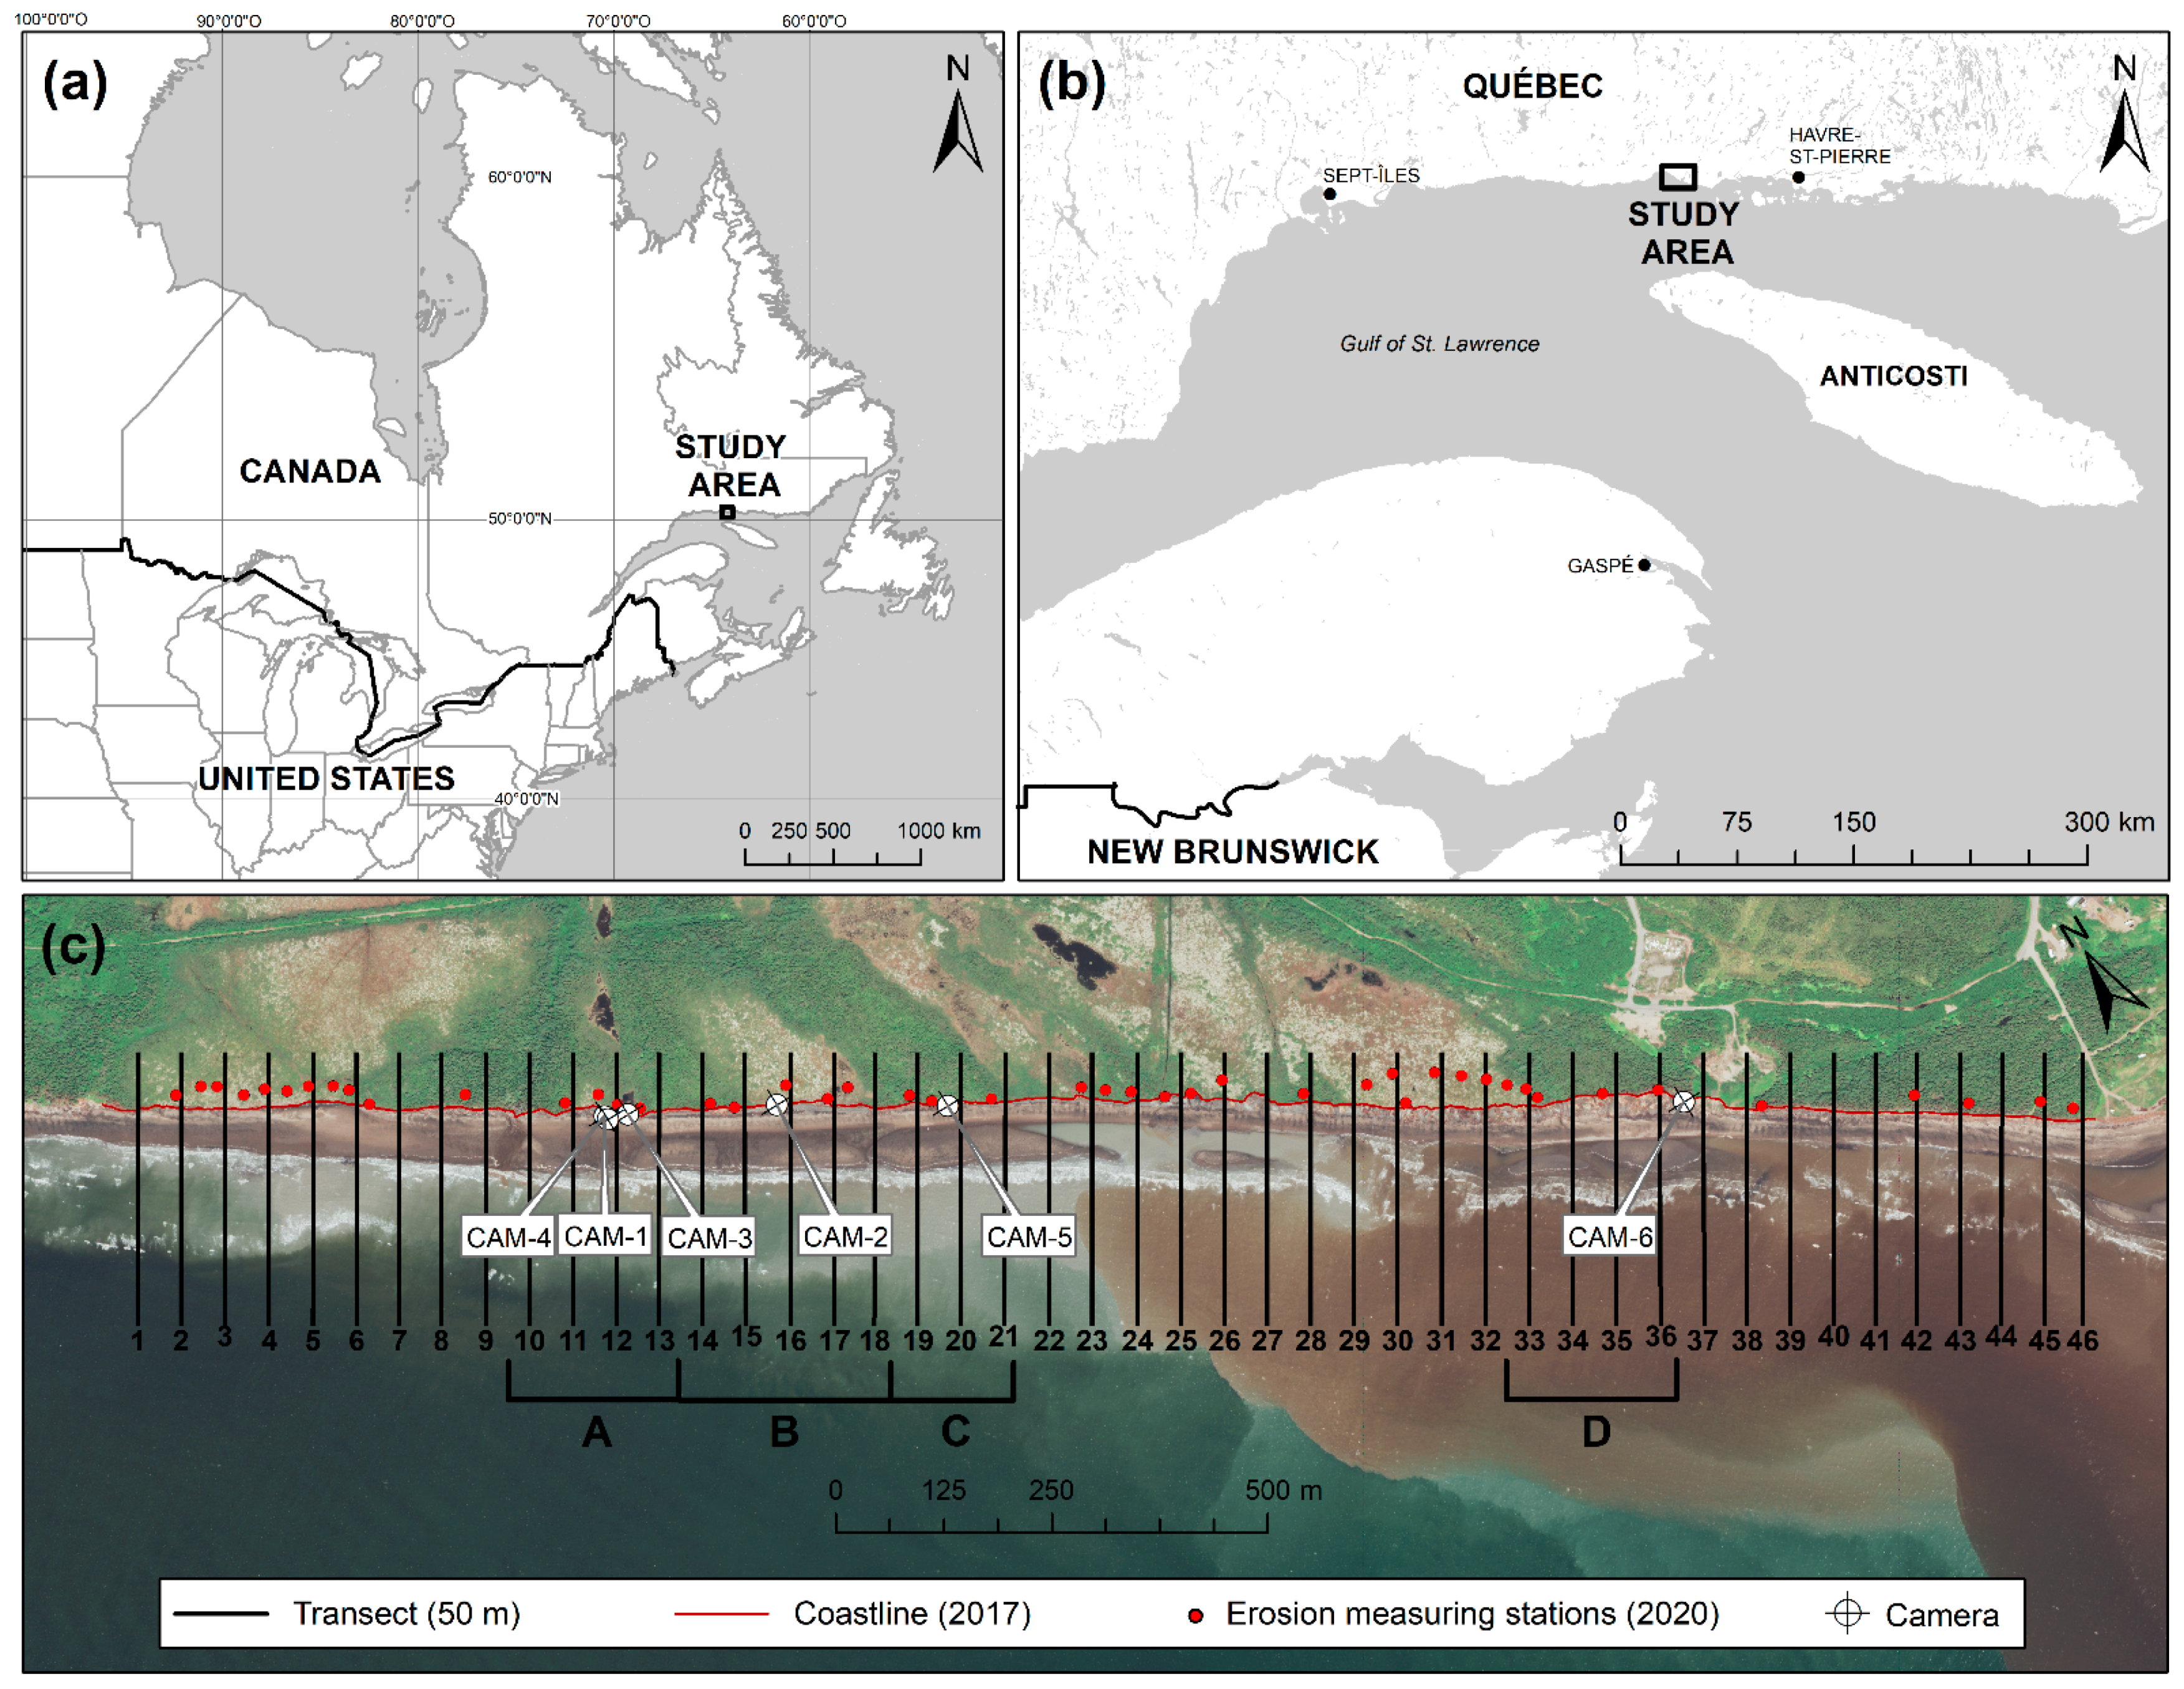
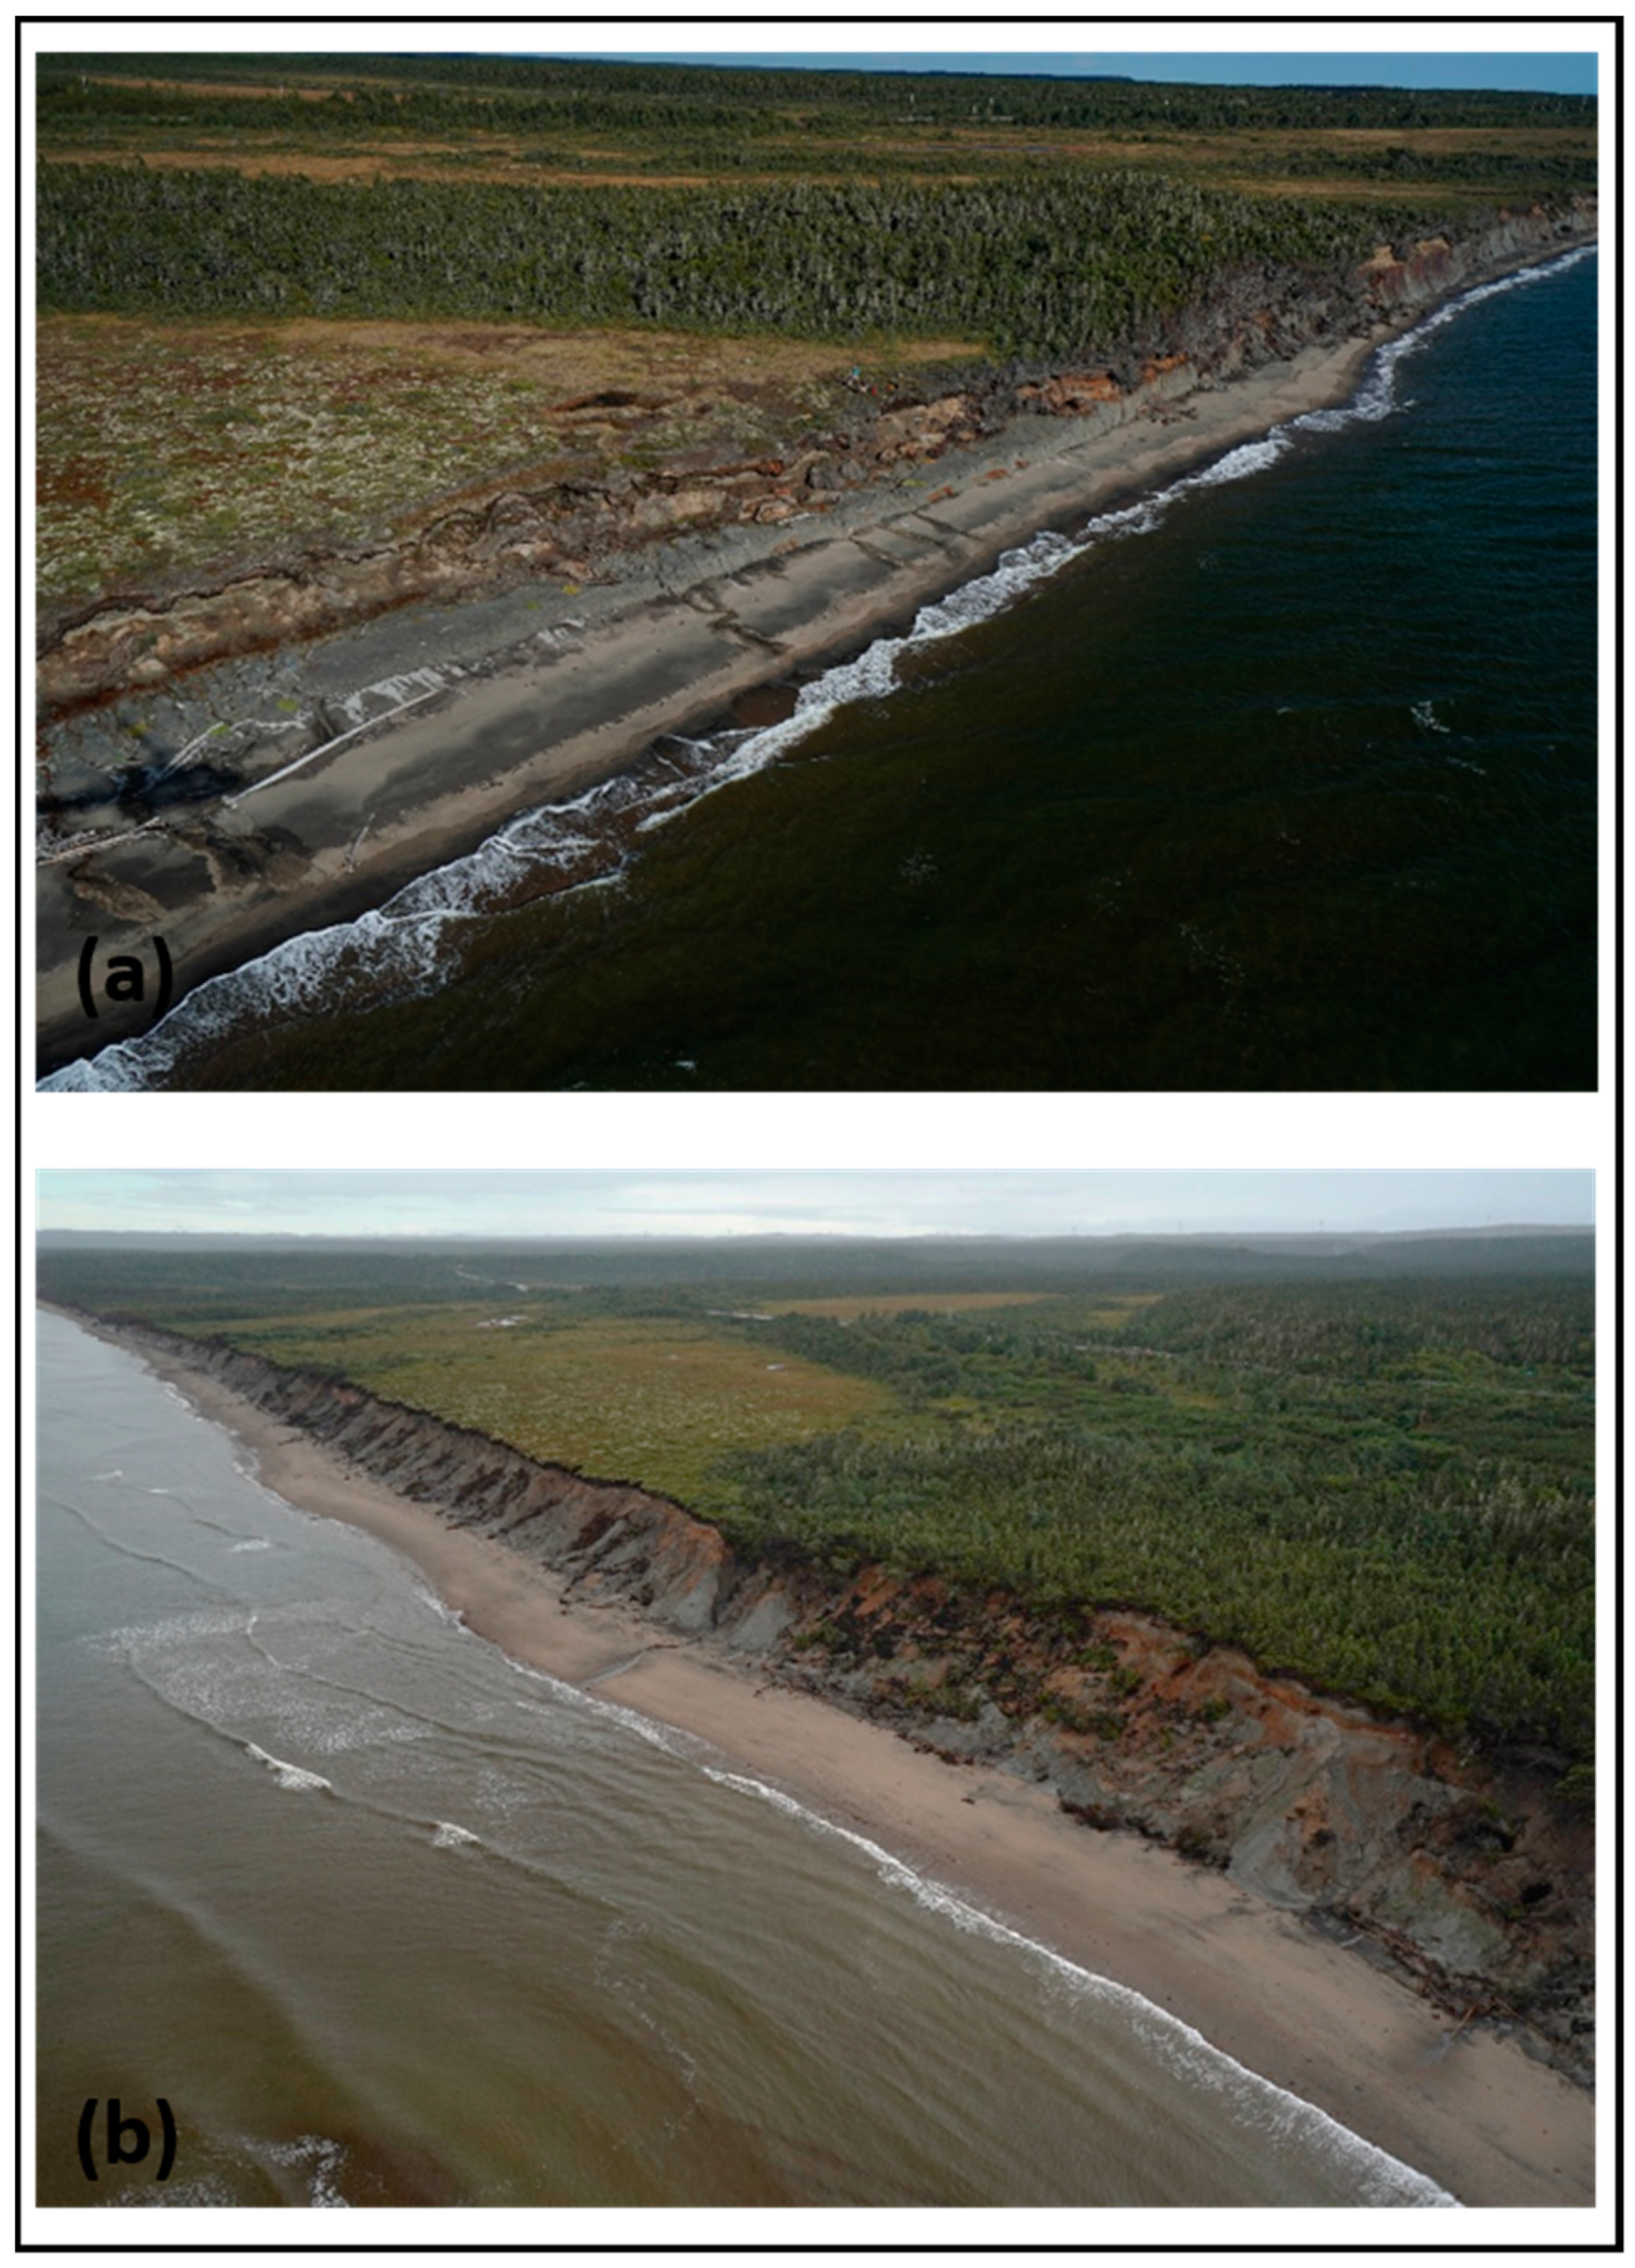
2. Regional Setting
3. Materials and Methods
3.1. Historical Cliff Retreat Rates
3.2. Annual Cliff Retreat
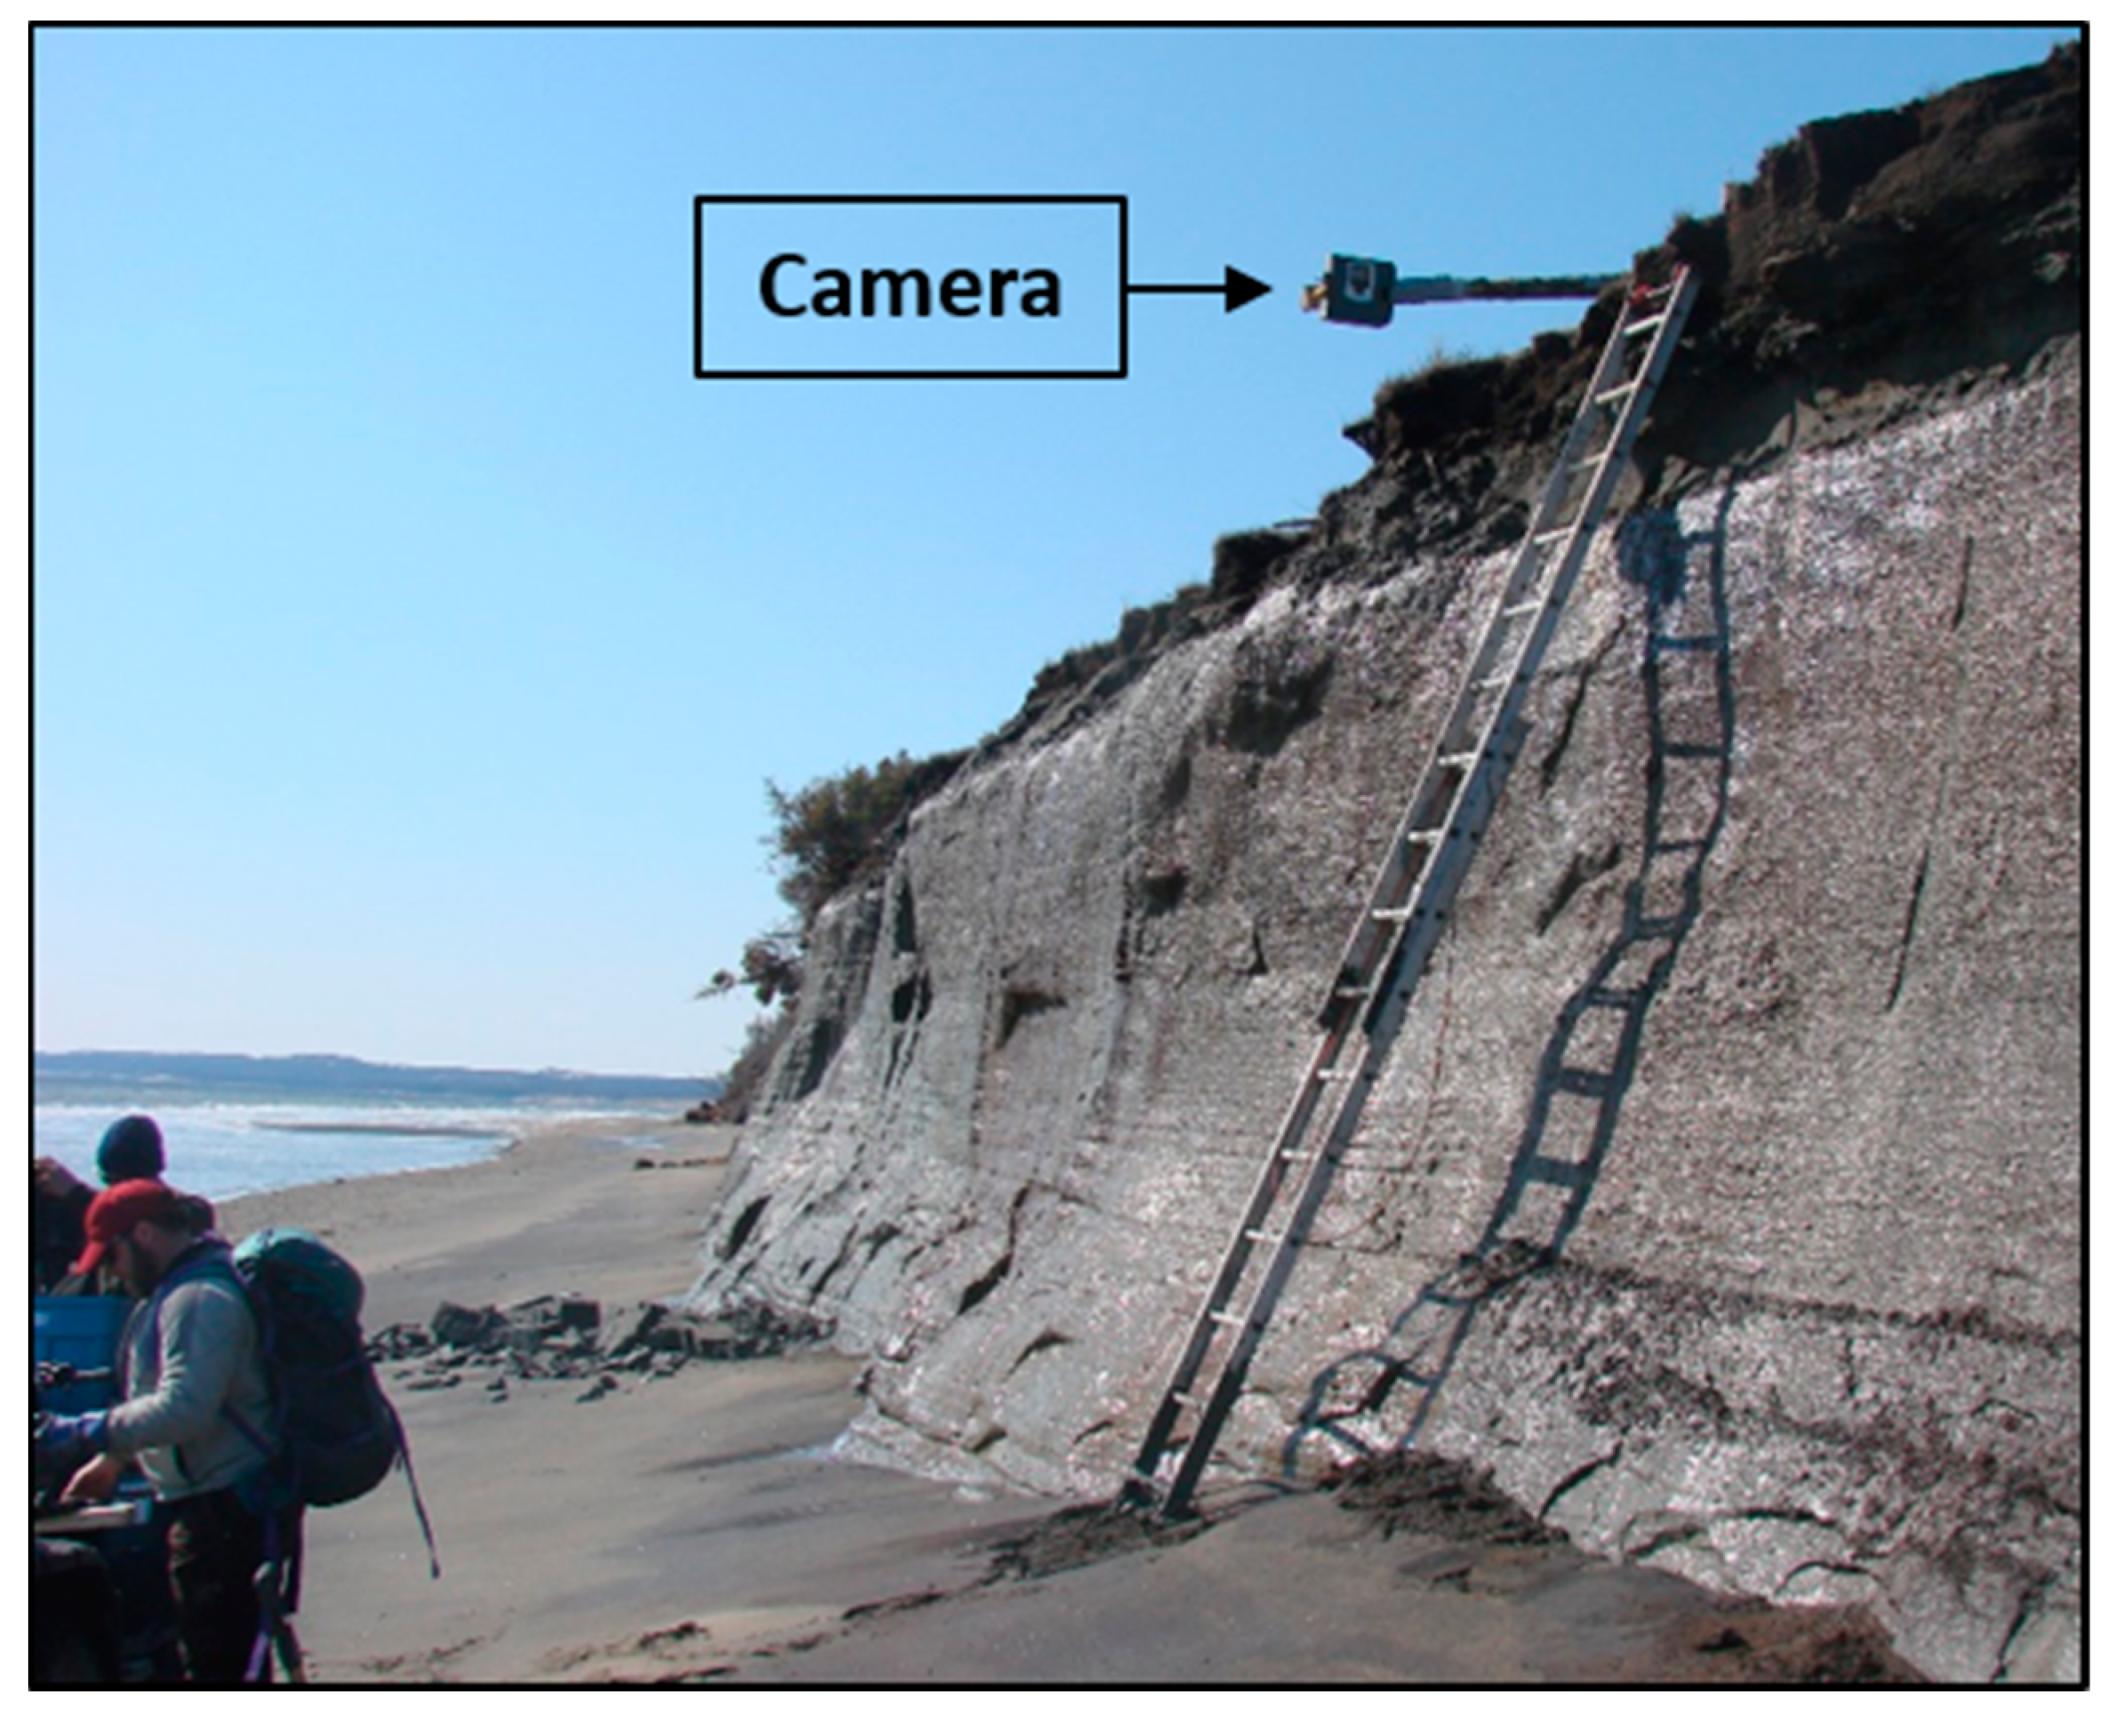
3.3. Continuous Monitoring System for Erosion Events Detection
3.4. Wave Climate and Storm Analysis
3.5. Definition of Seasons
4. Results
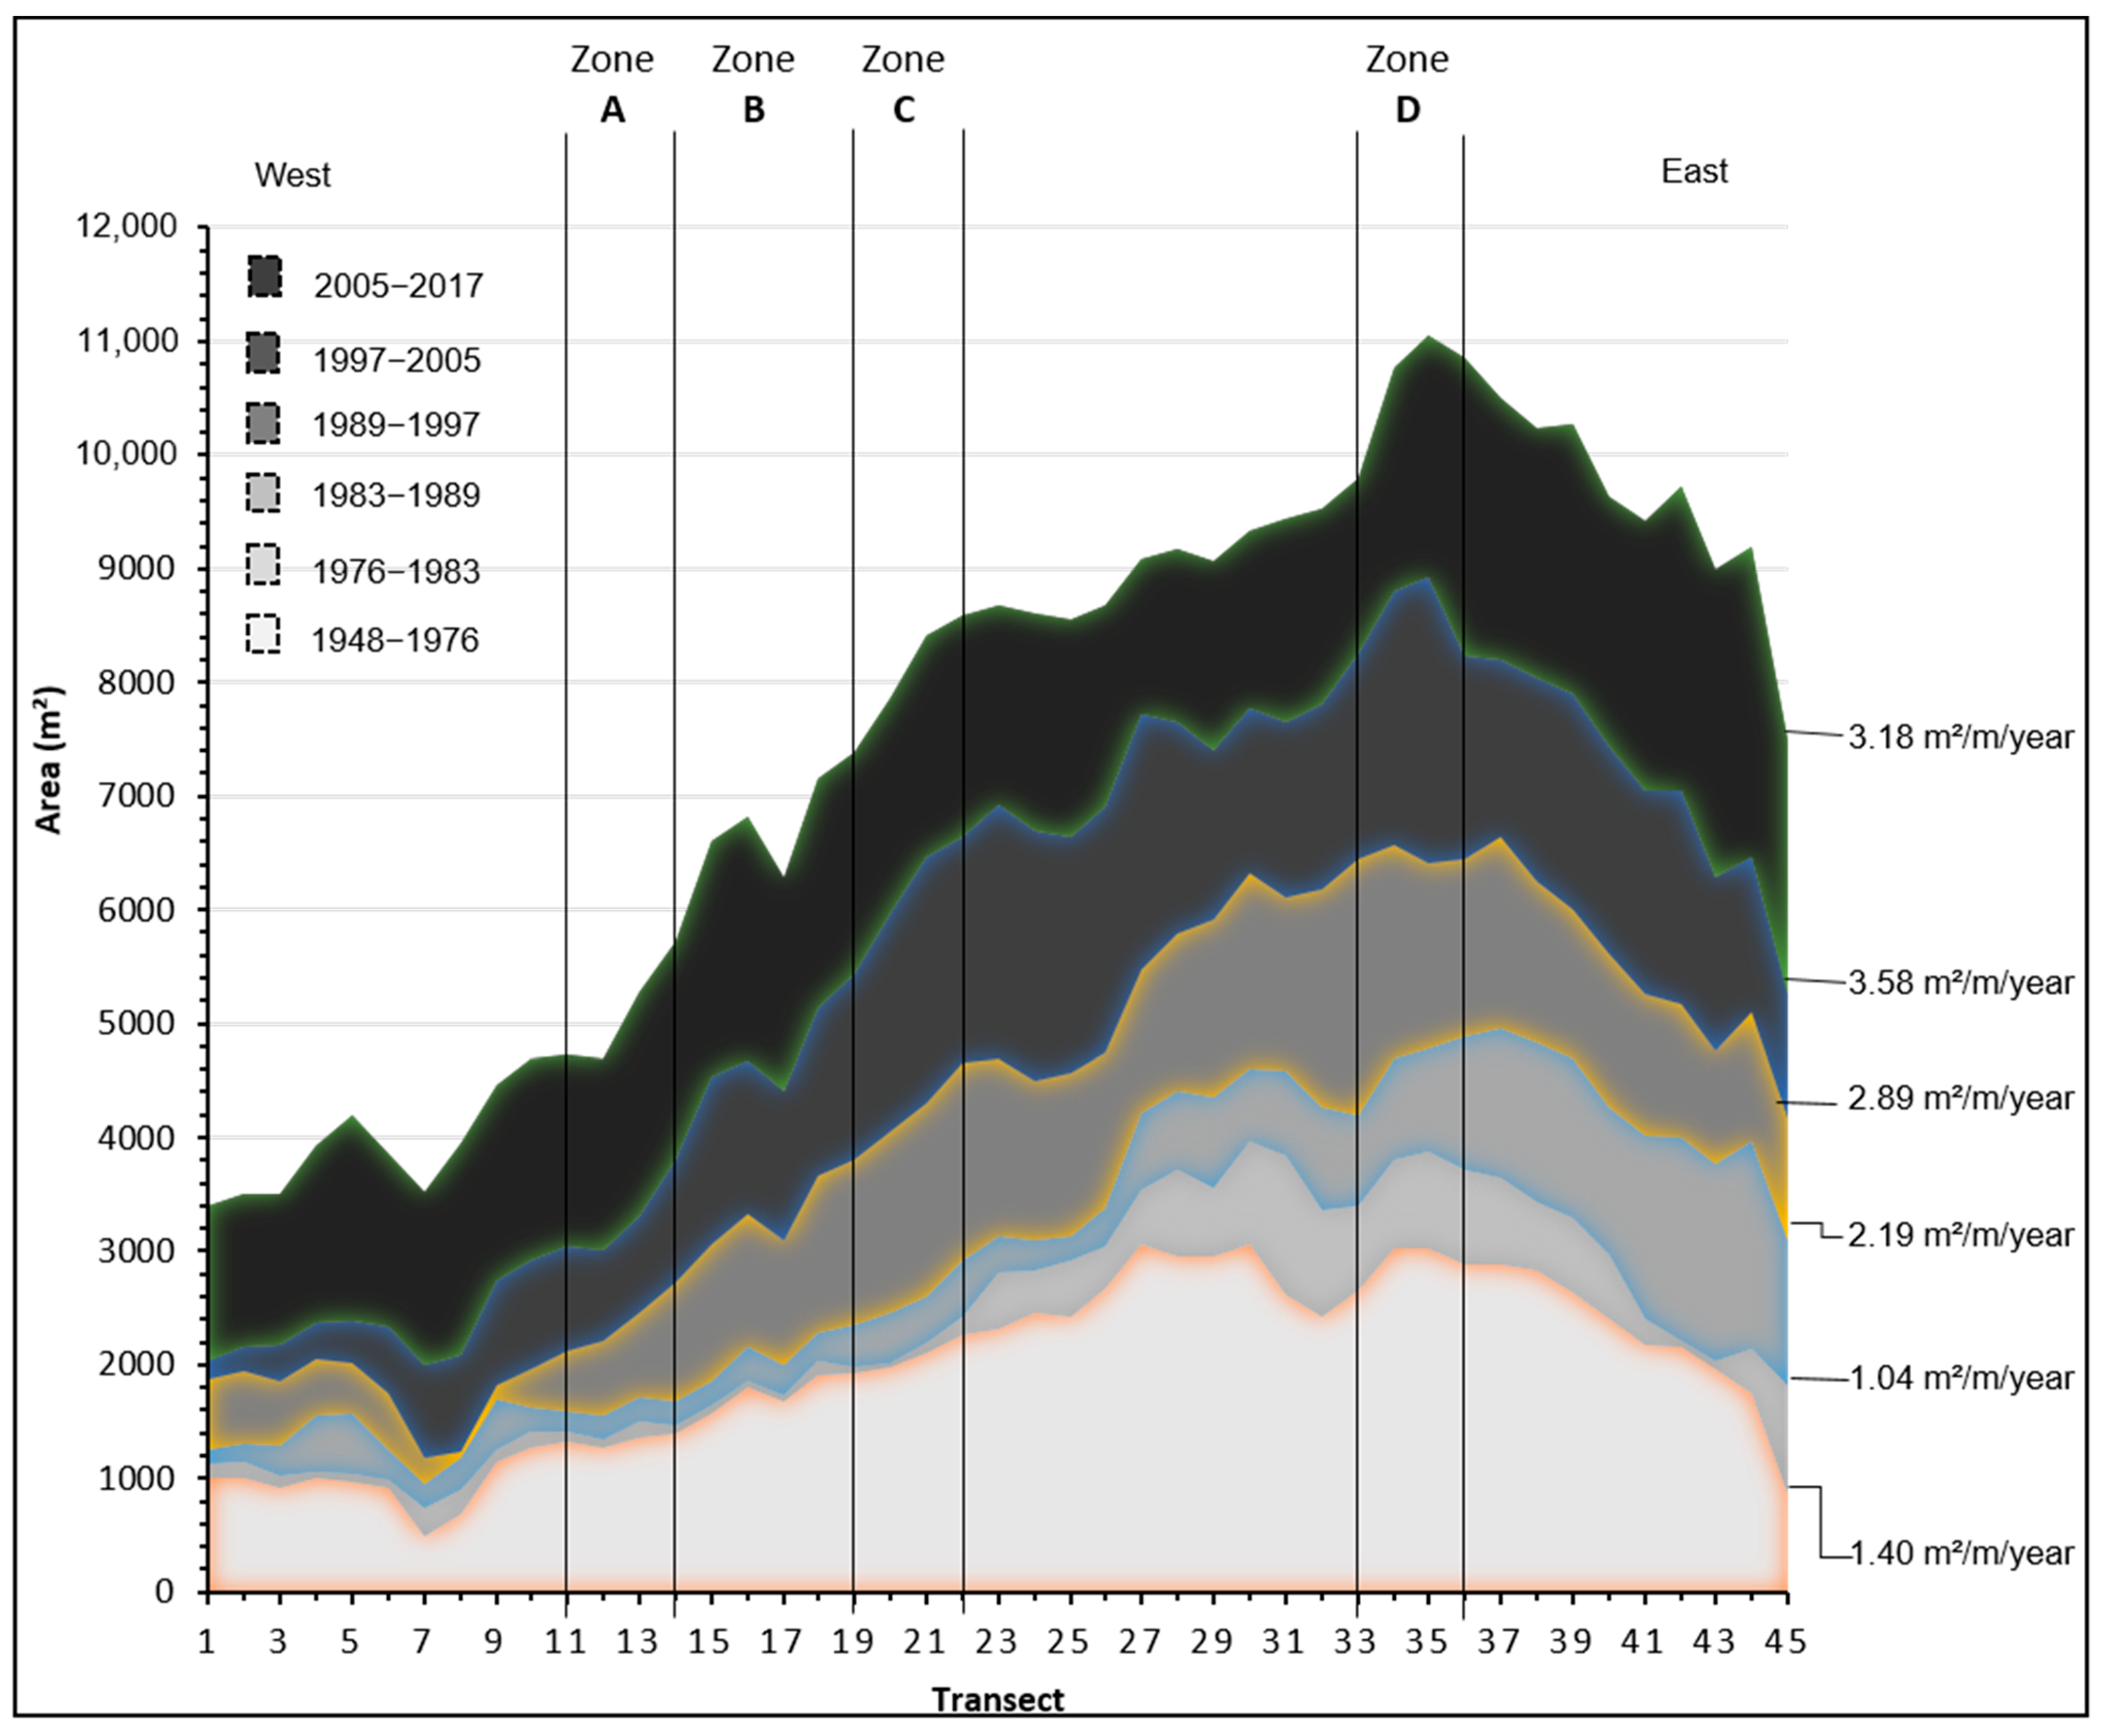
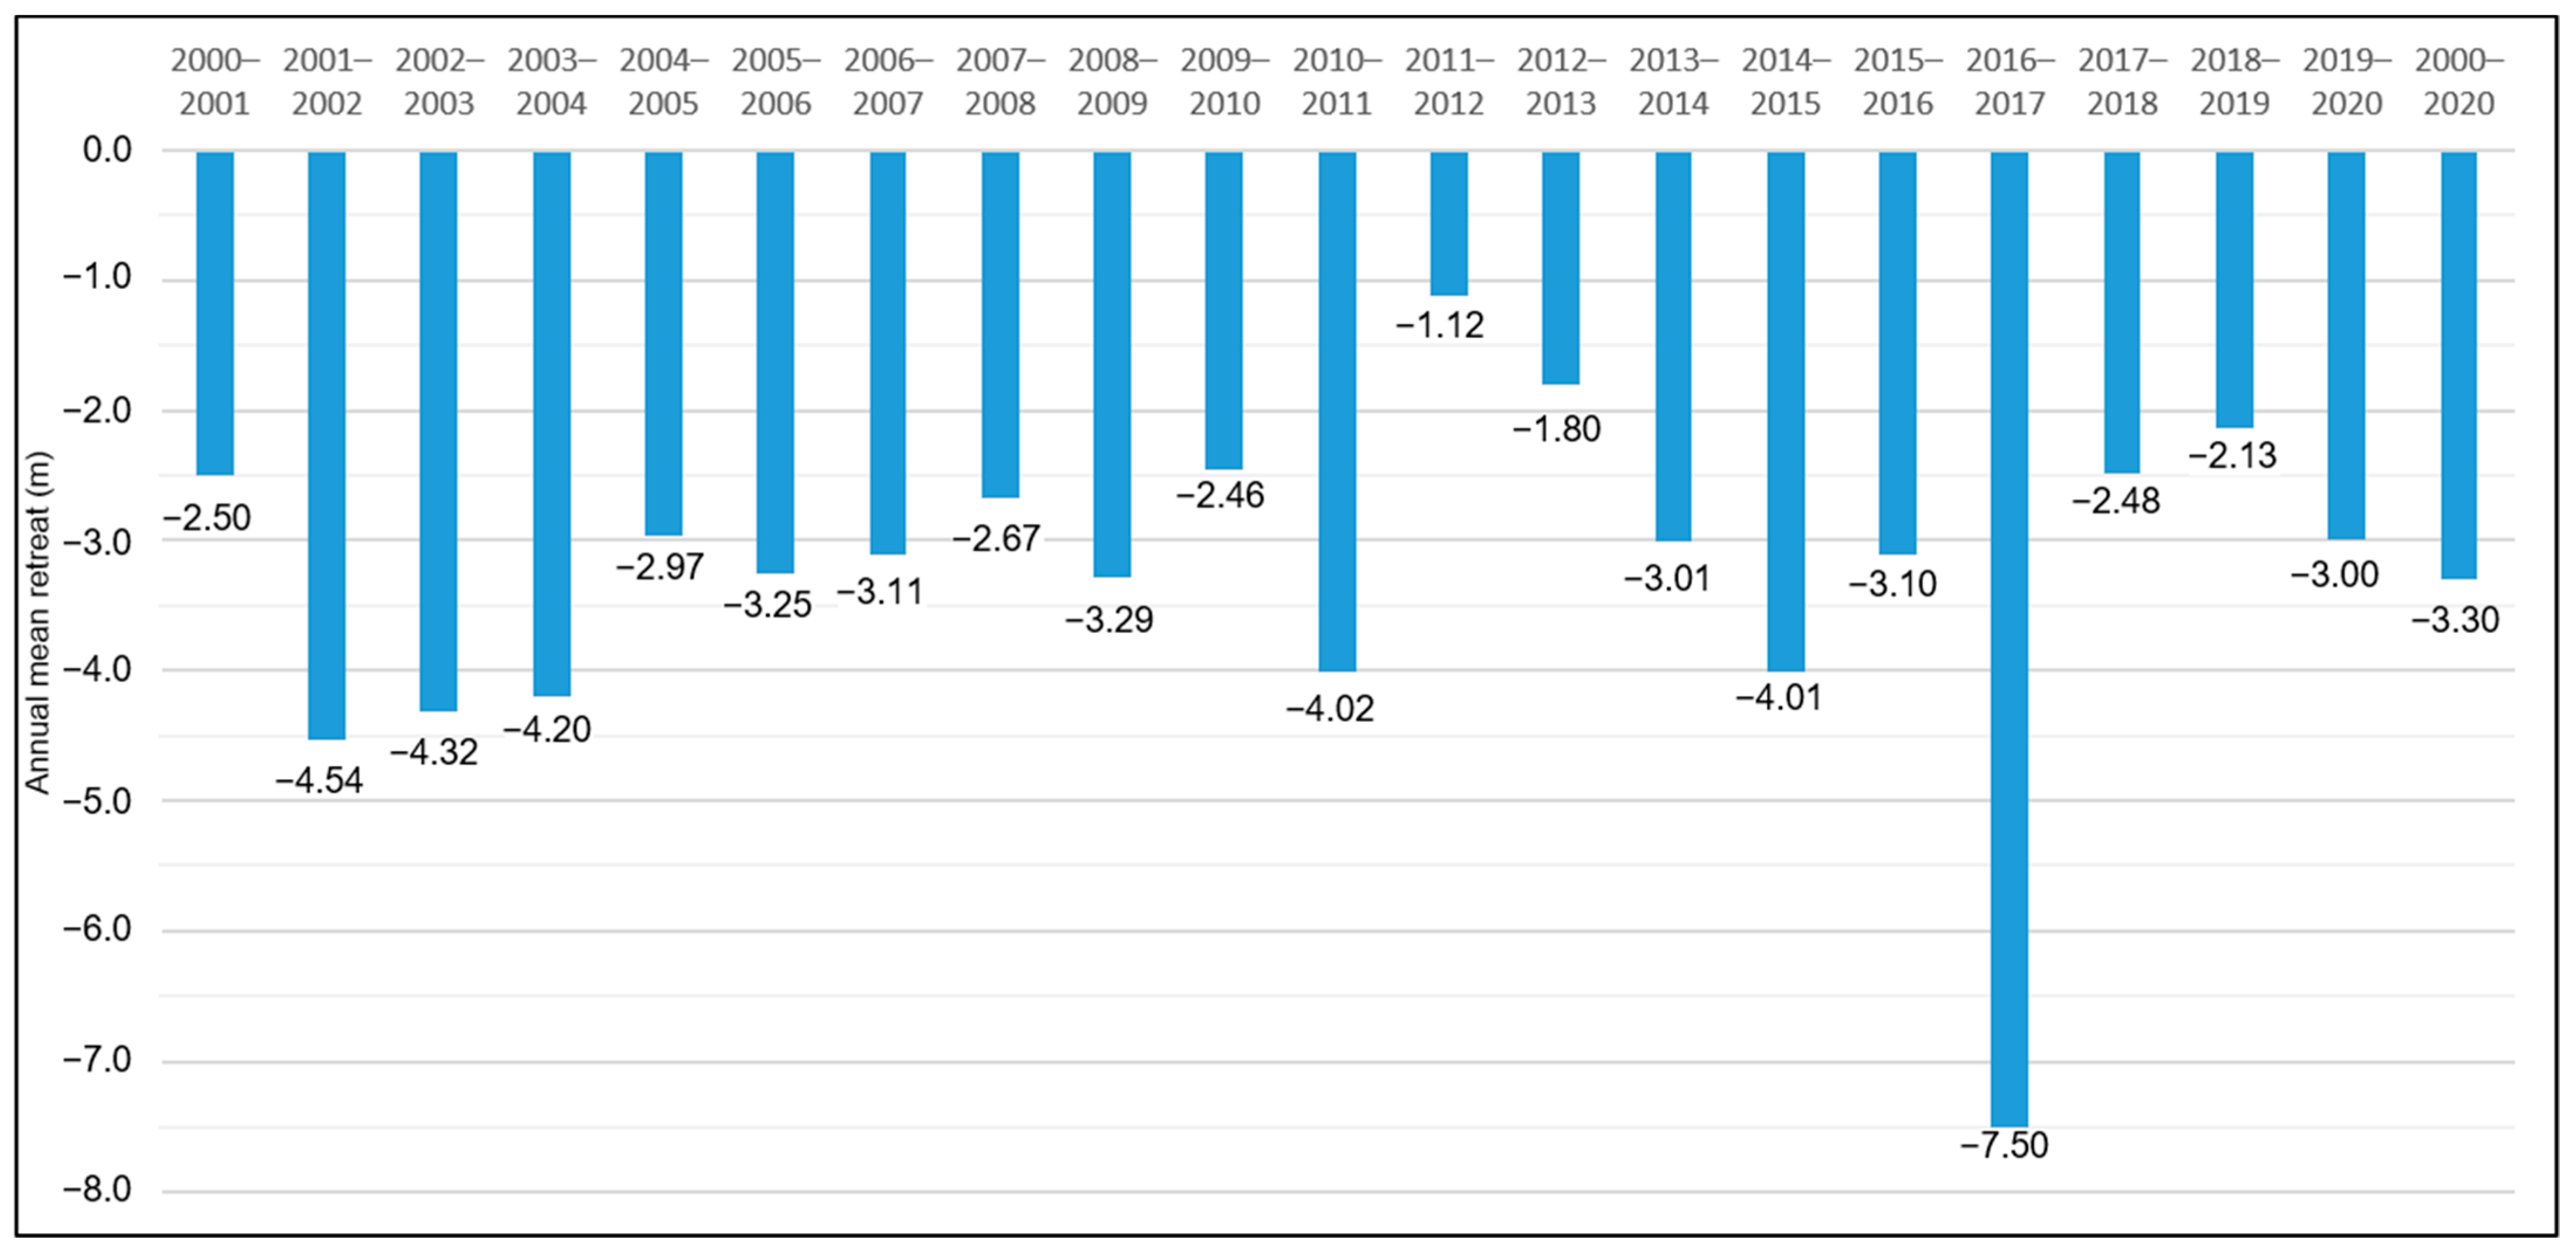
4.1. Multidecadal to Annual Erosion Rates
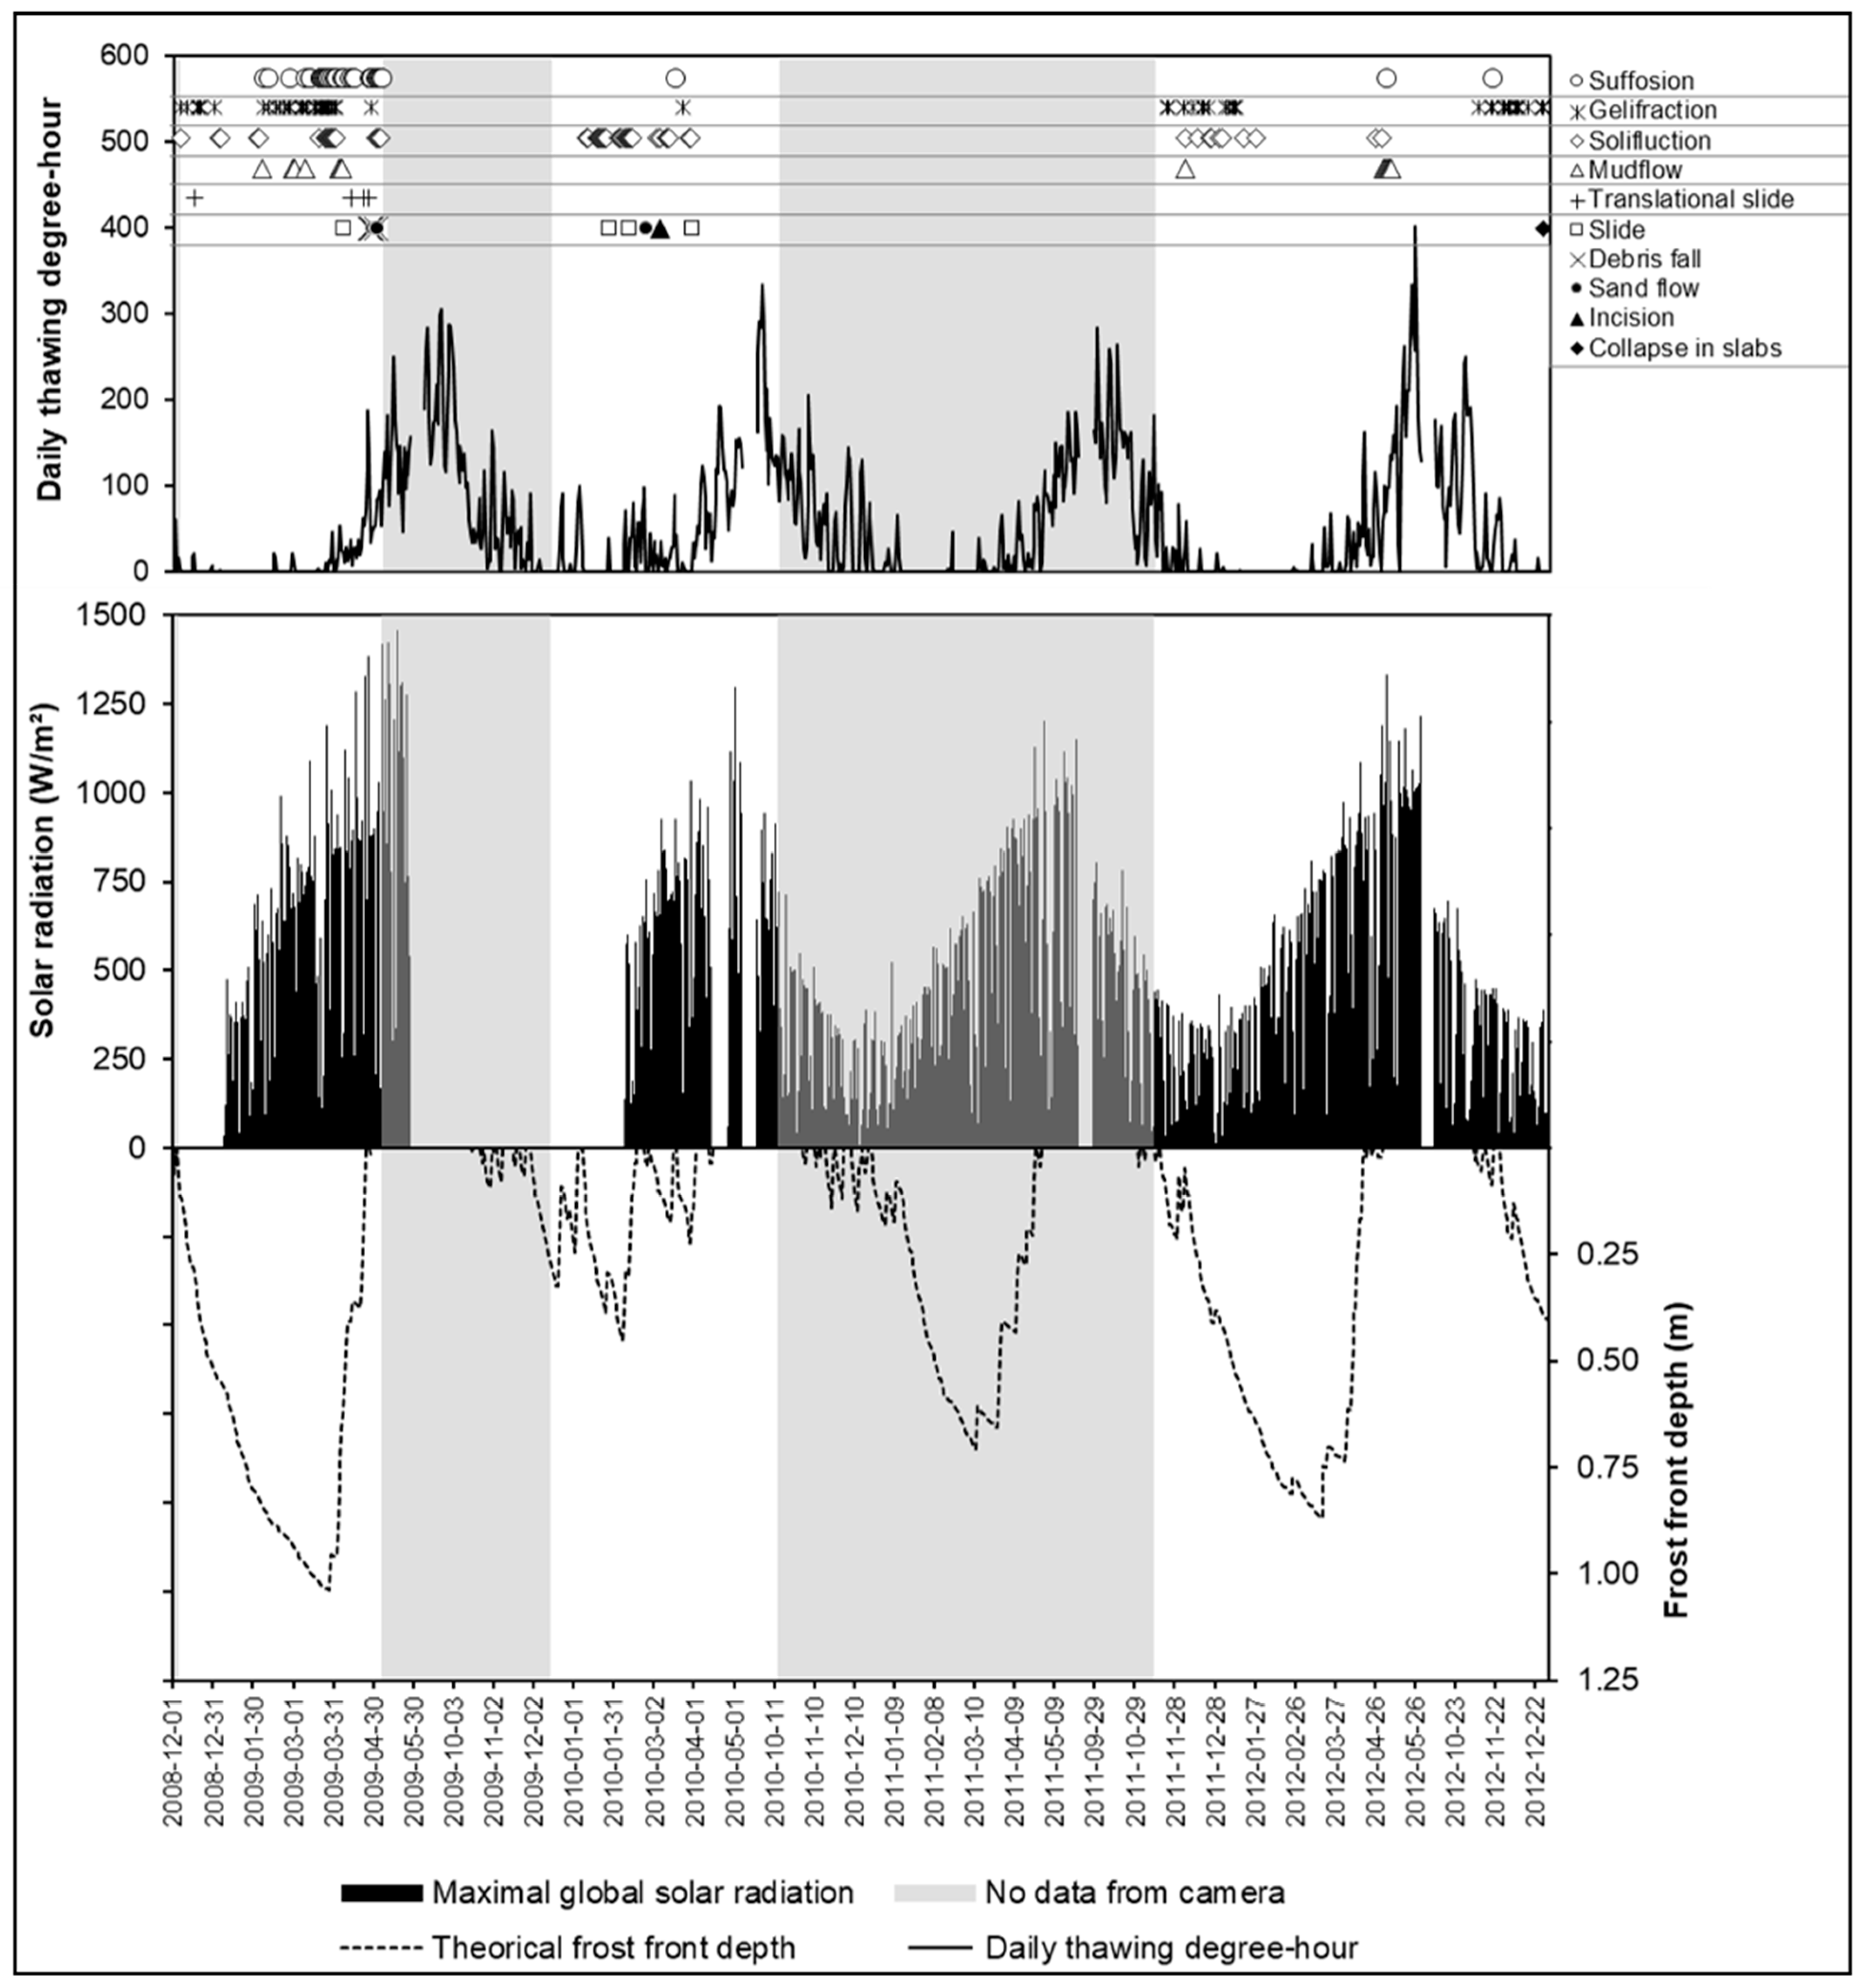
4.2. Processes Involved in Daily and Seasonal Erosion
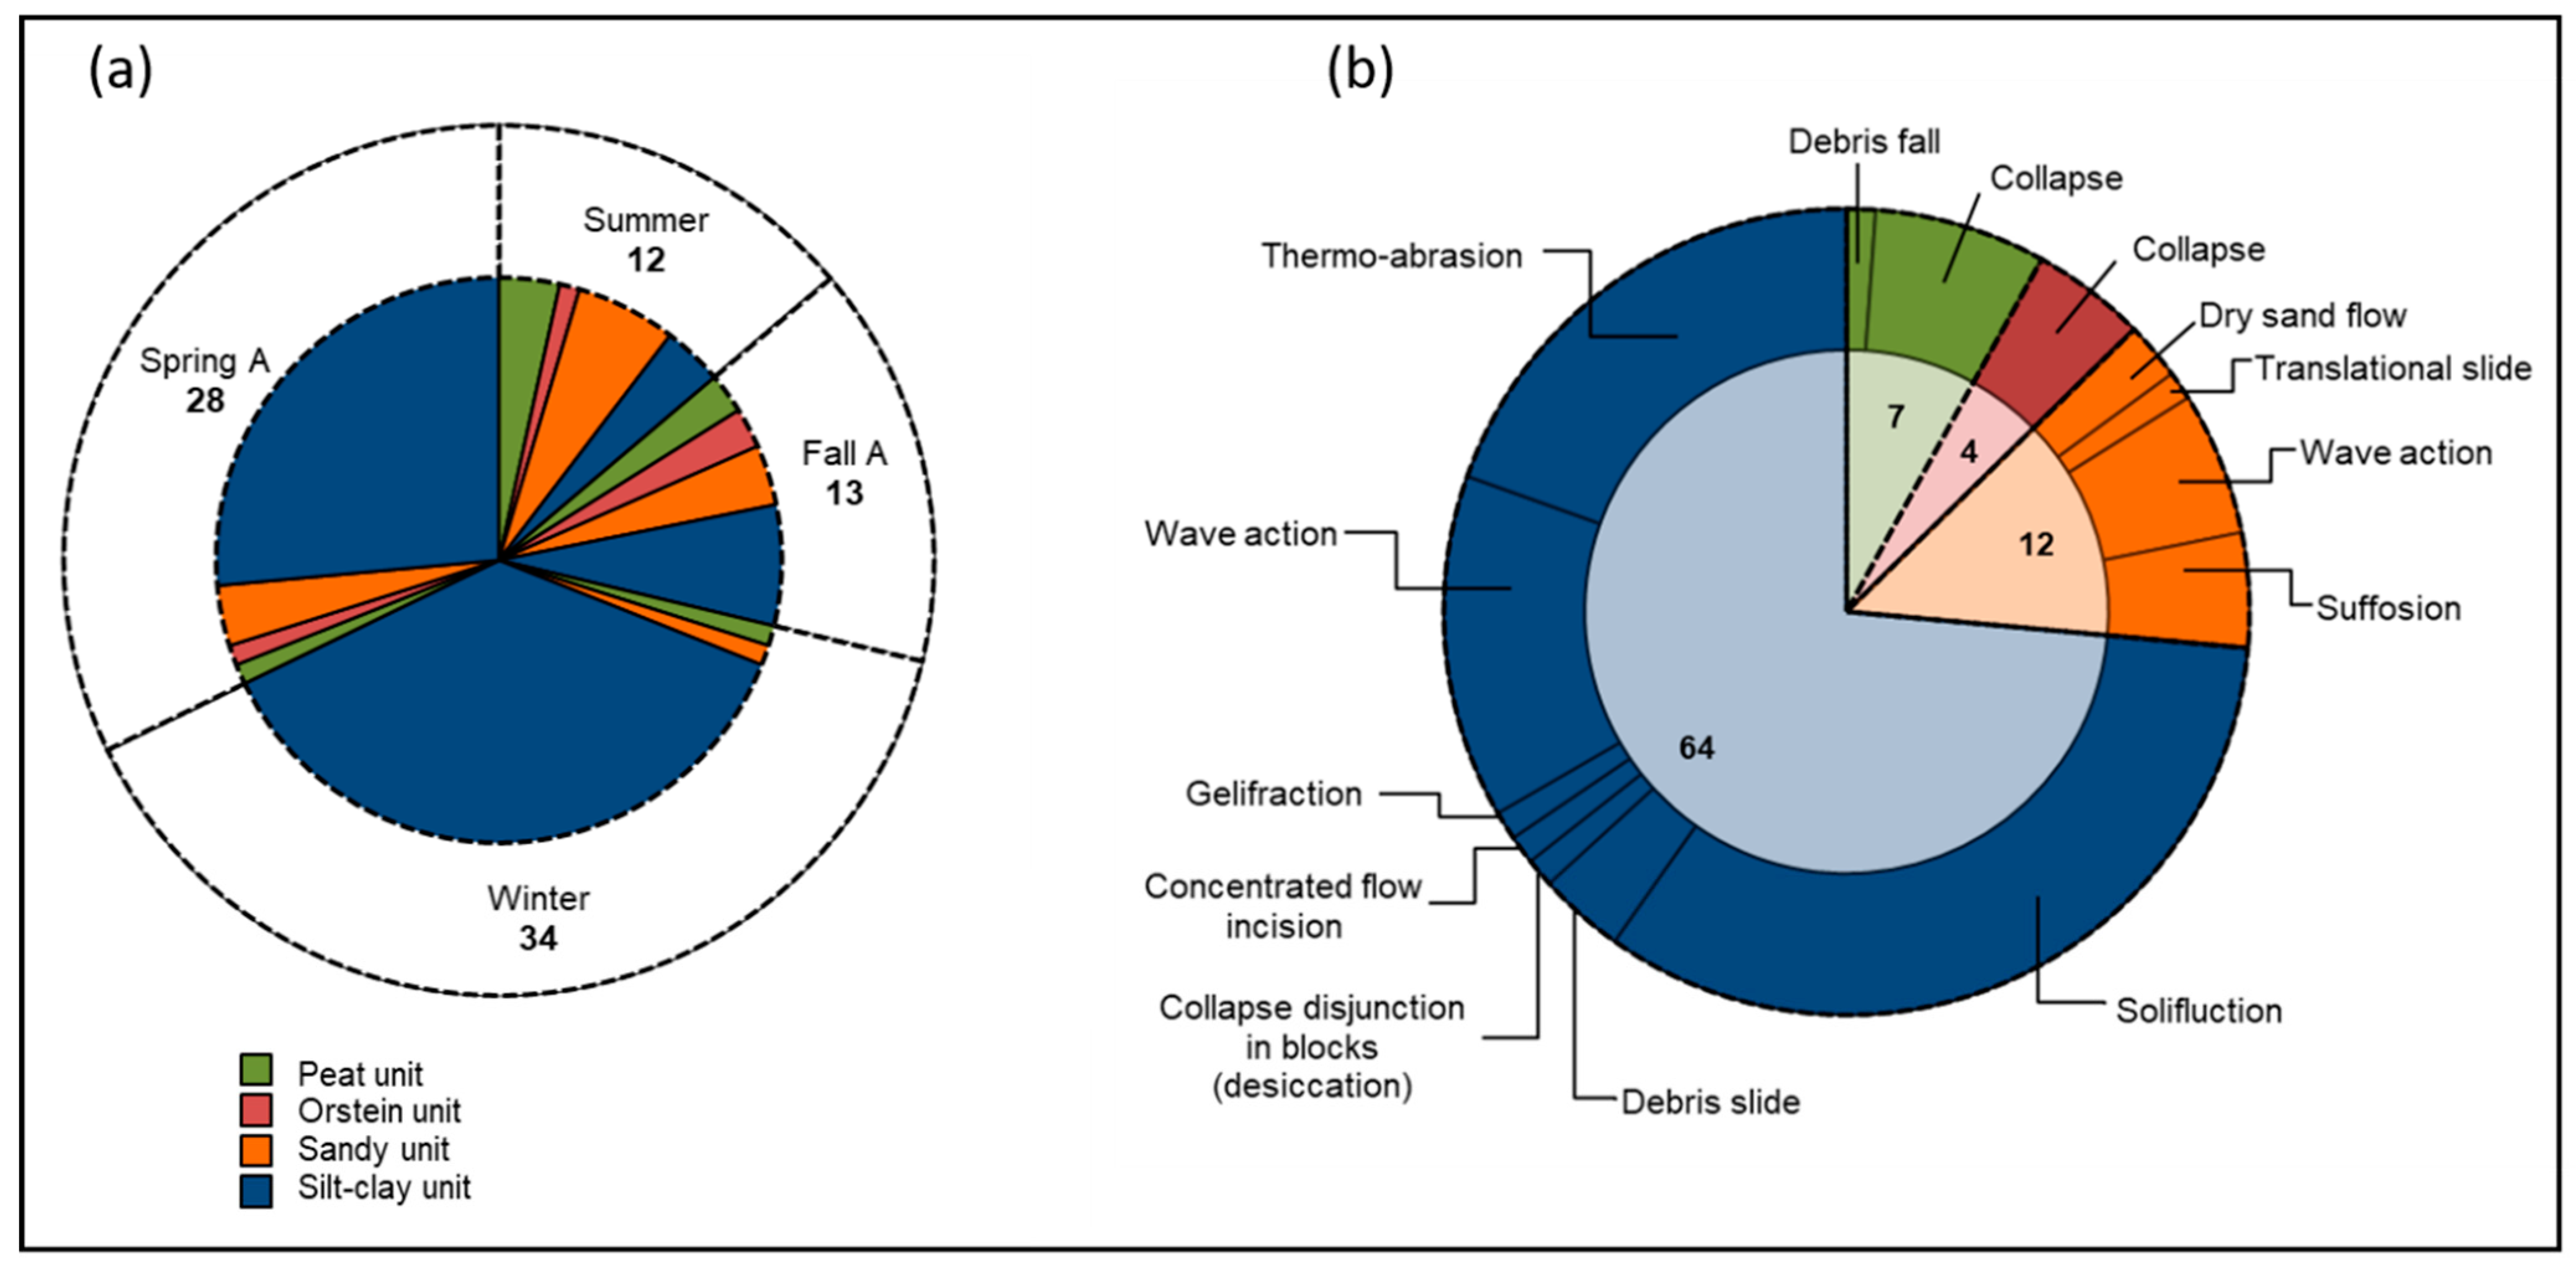
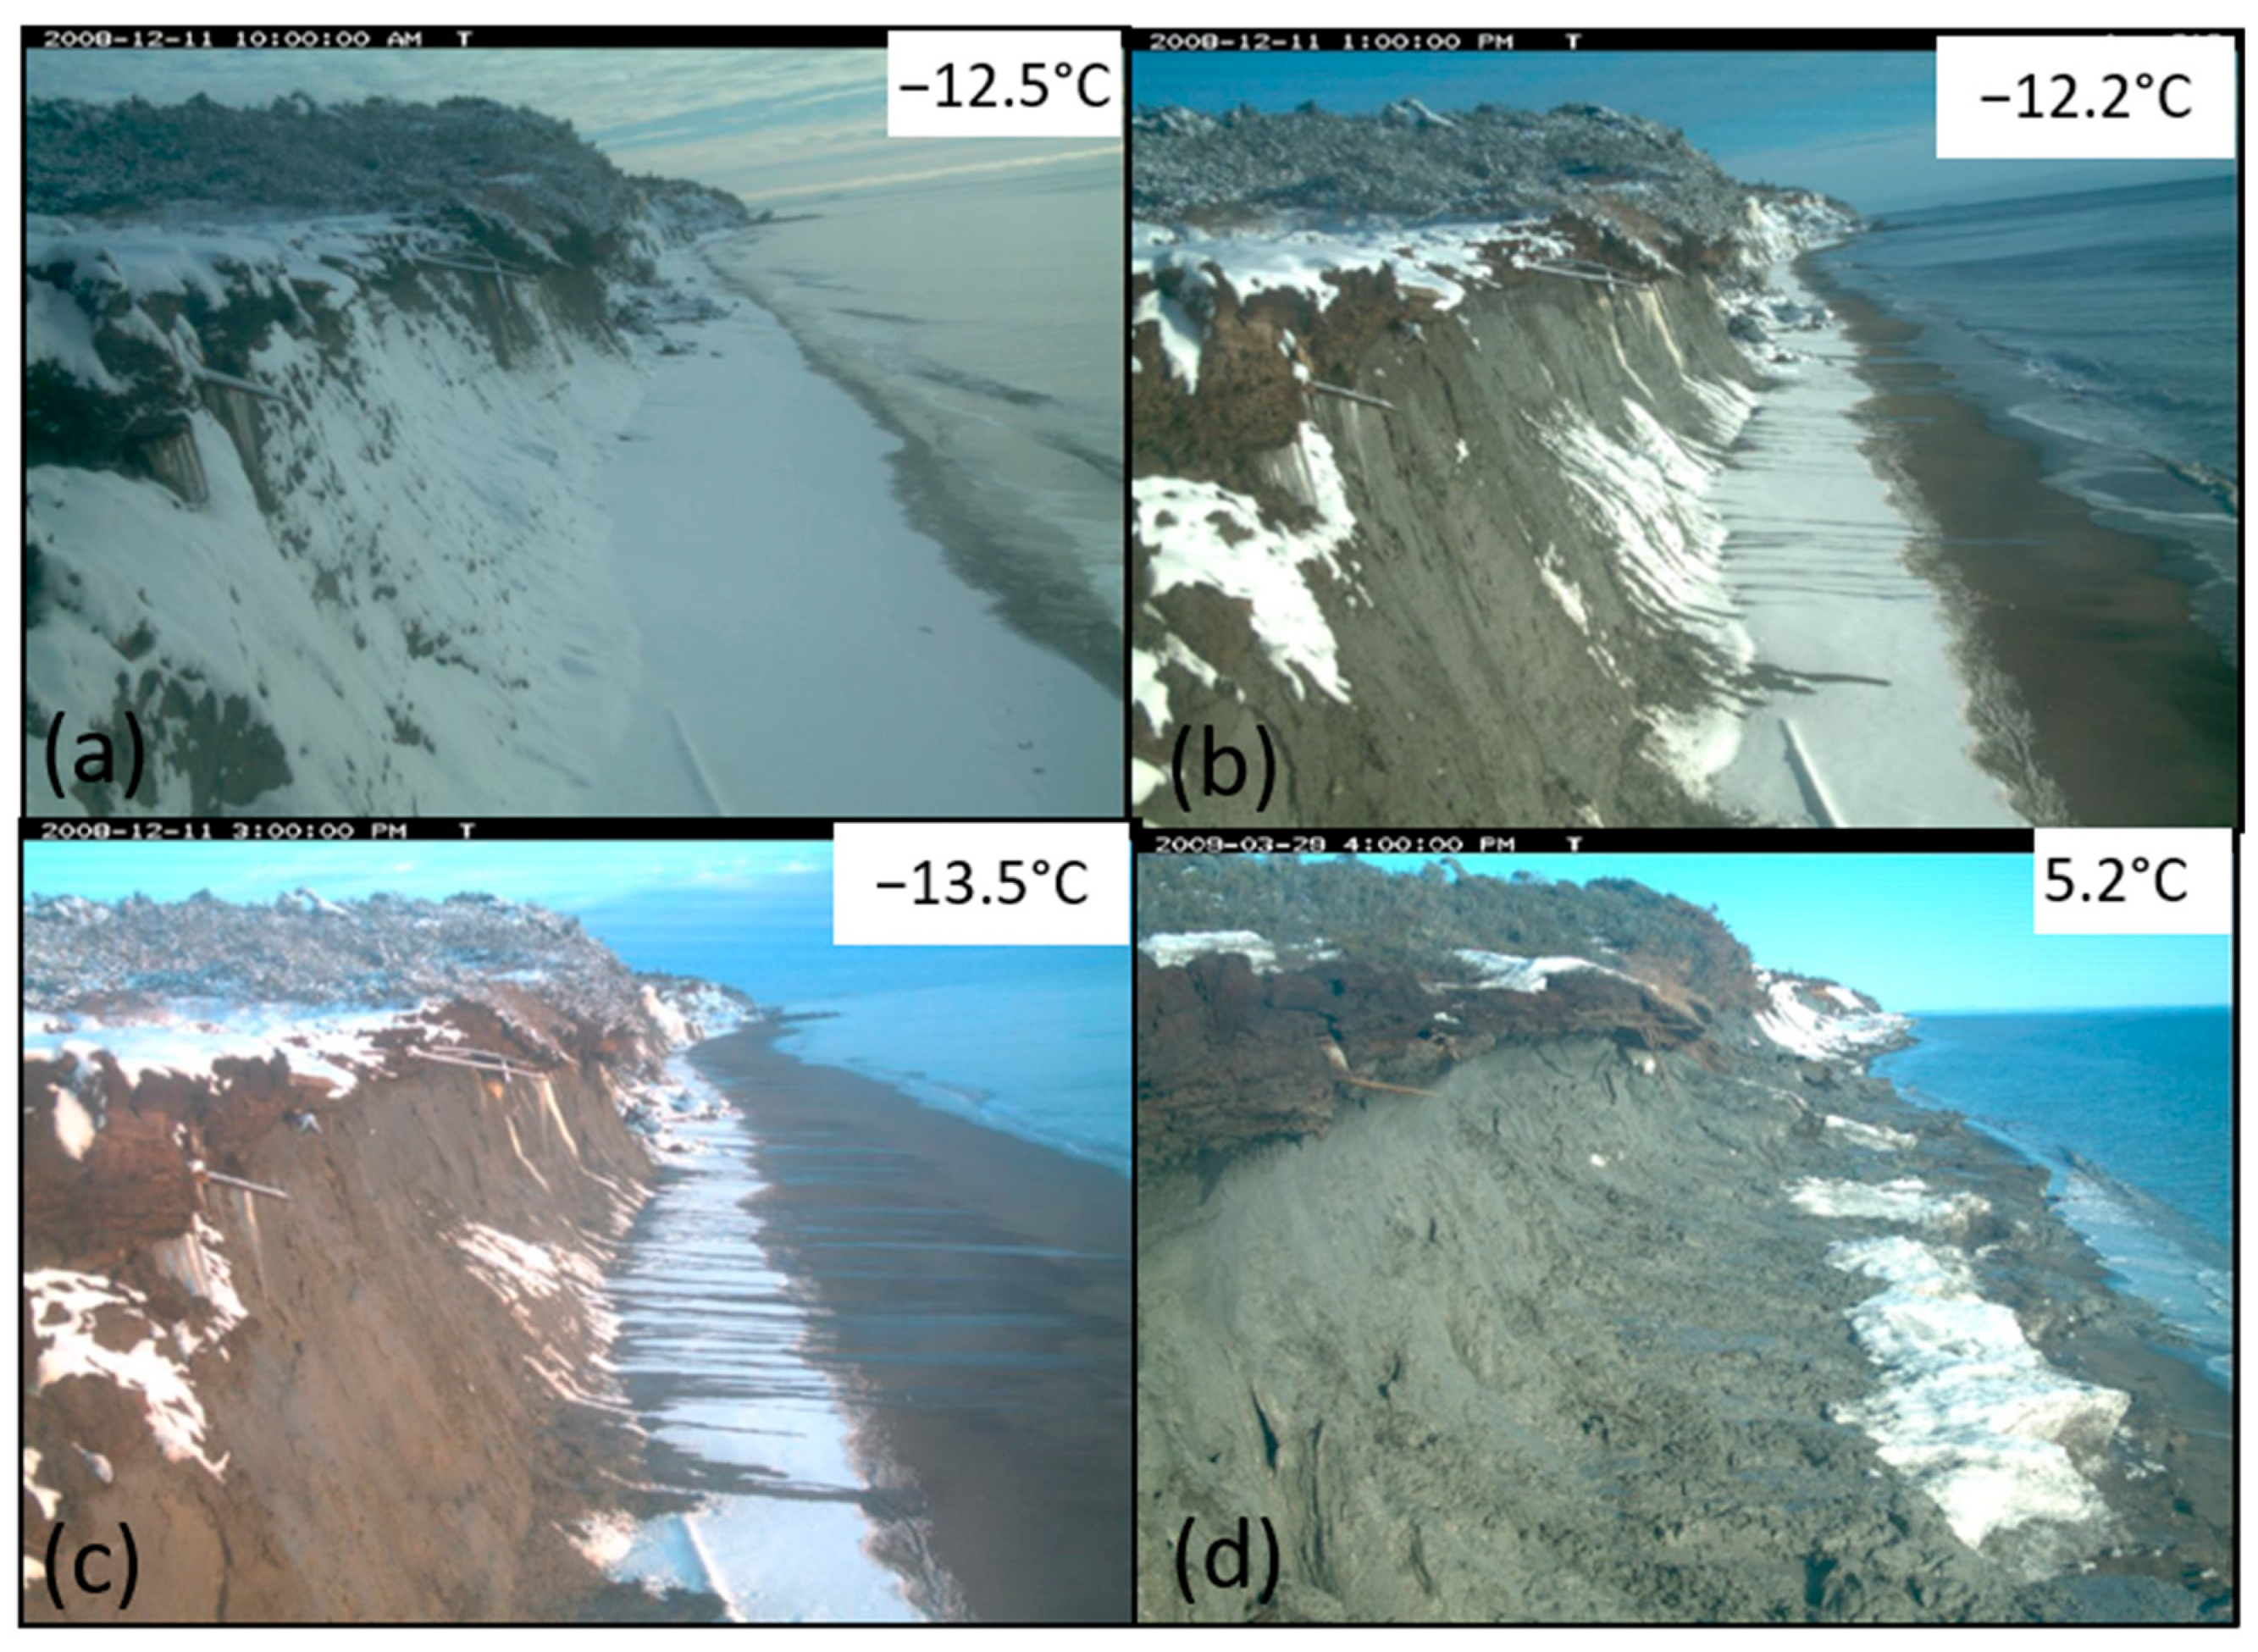
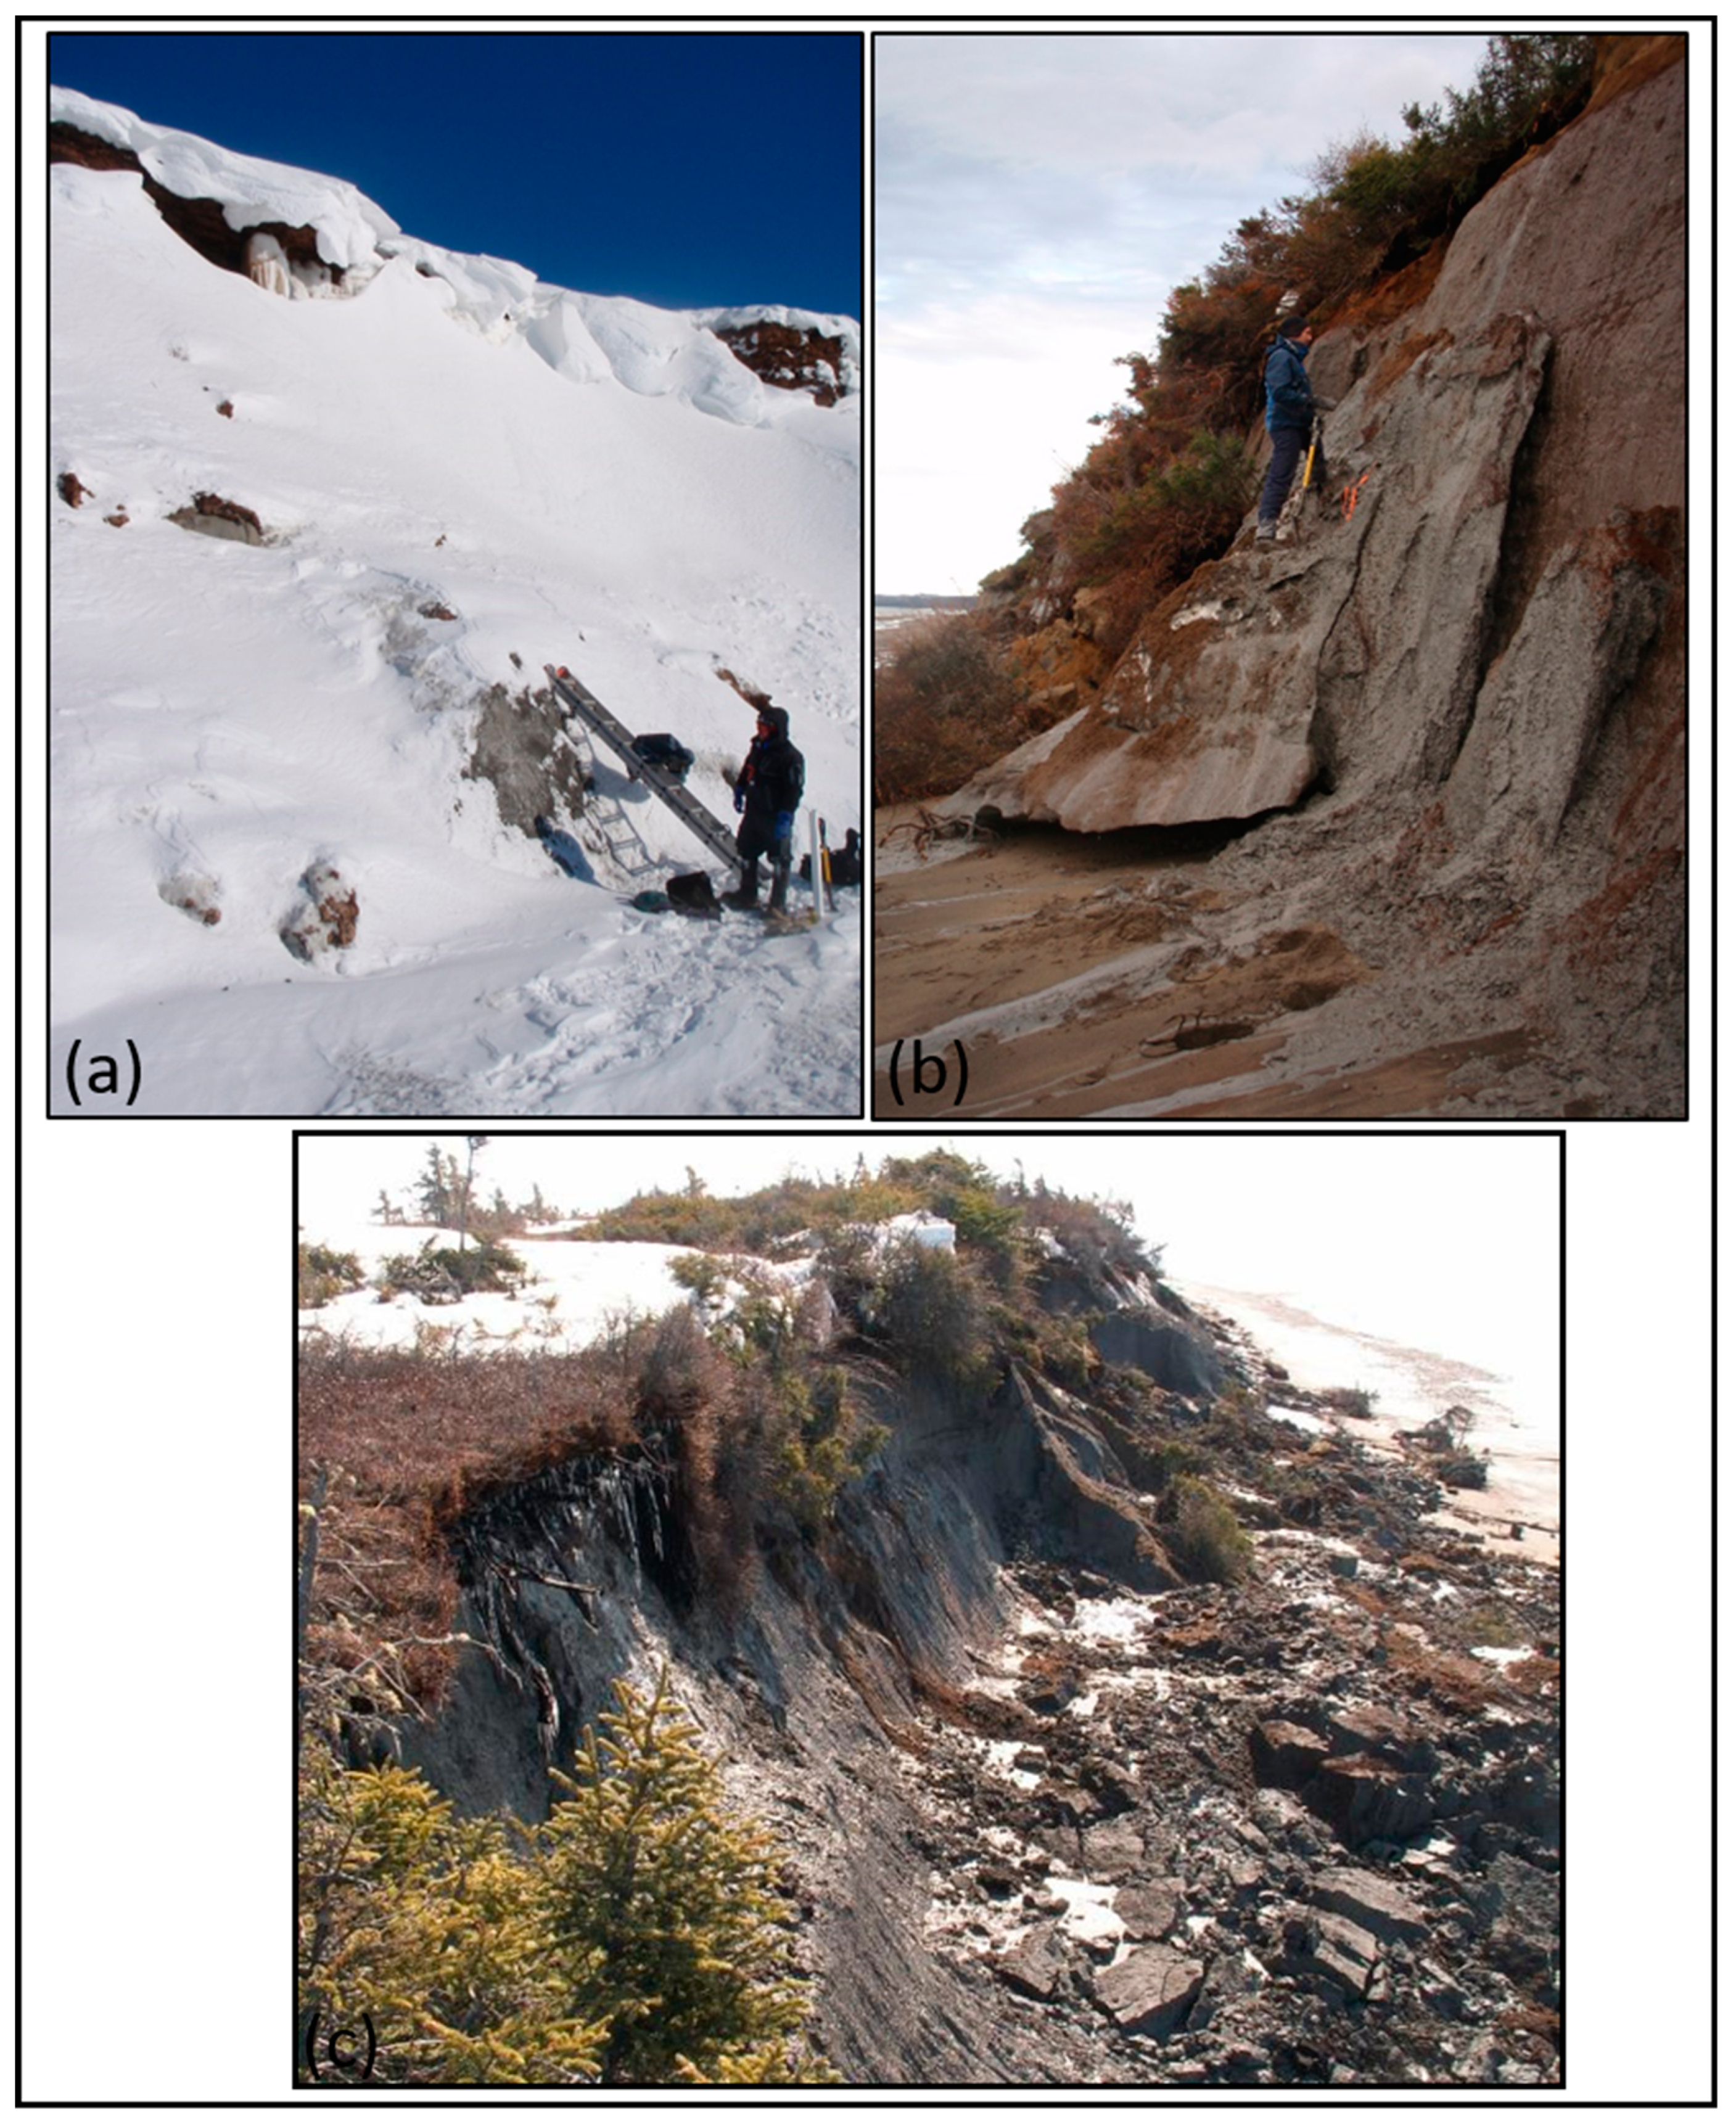
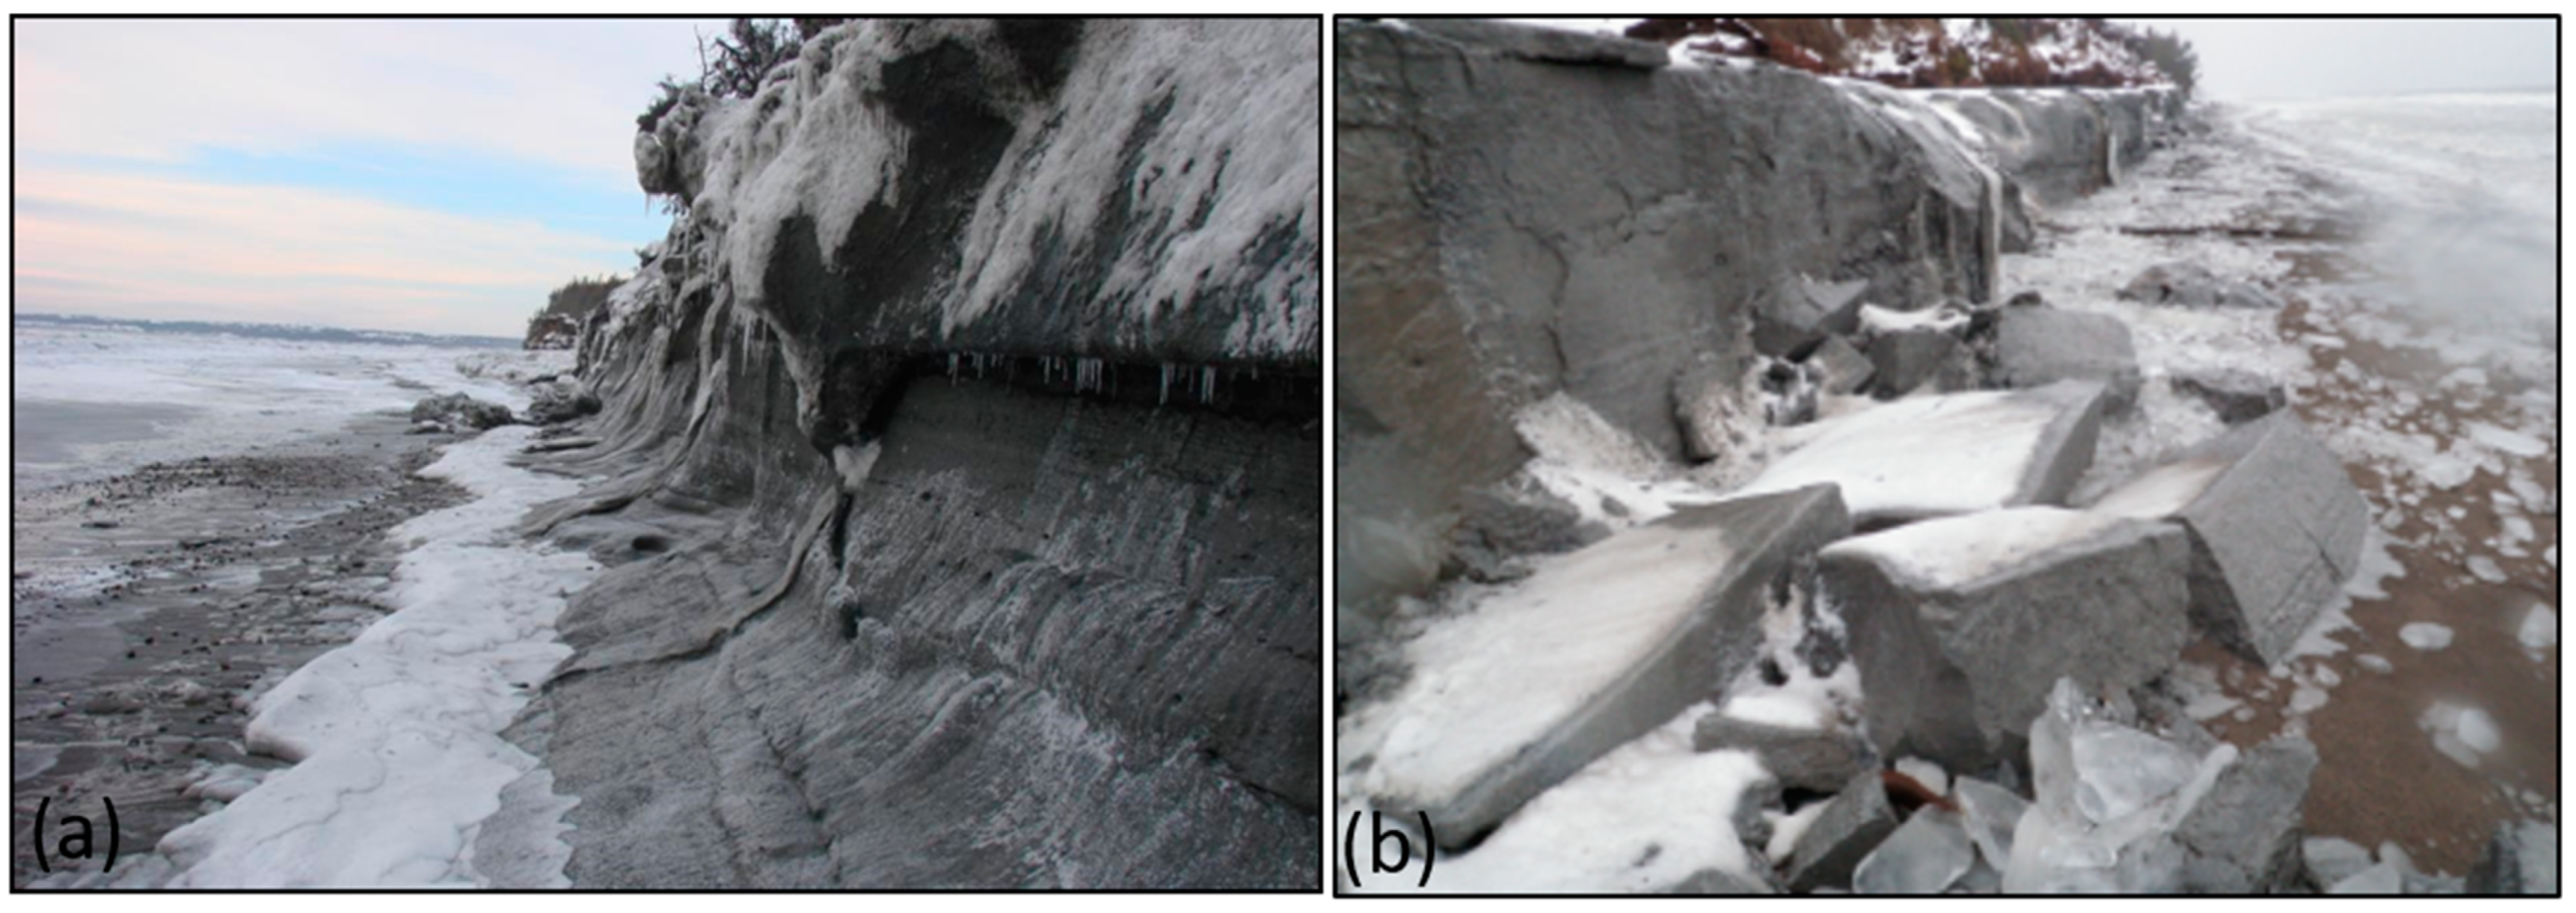
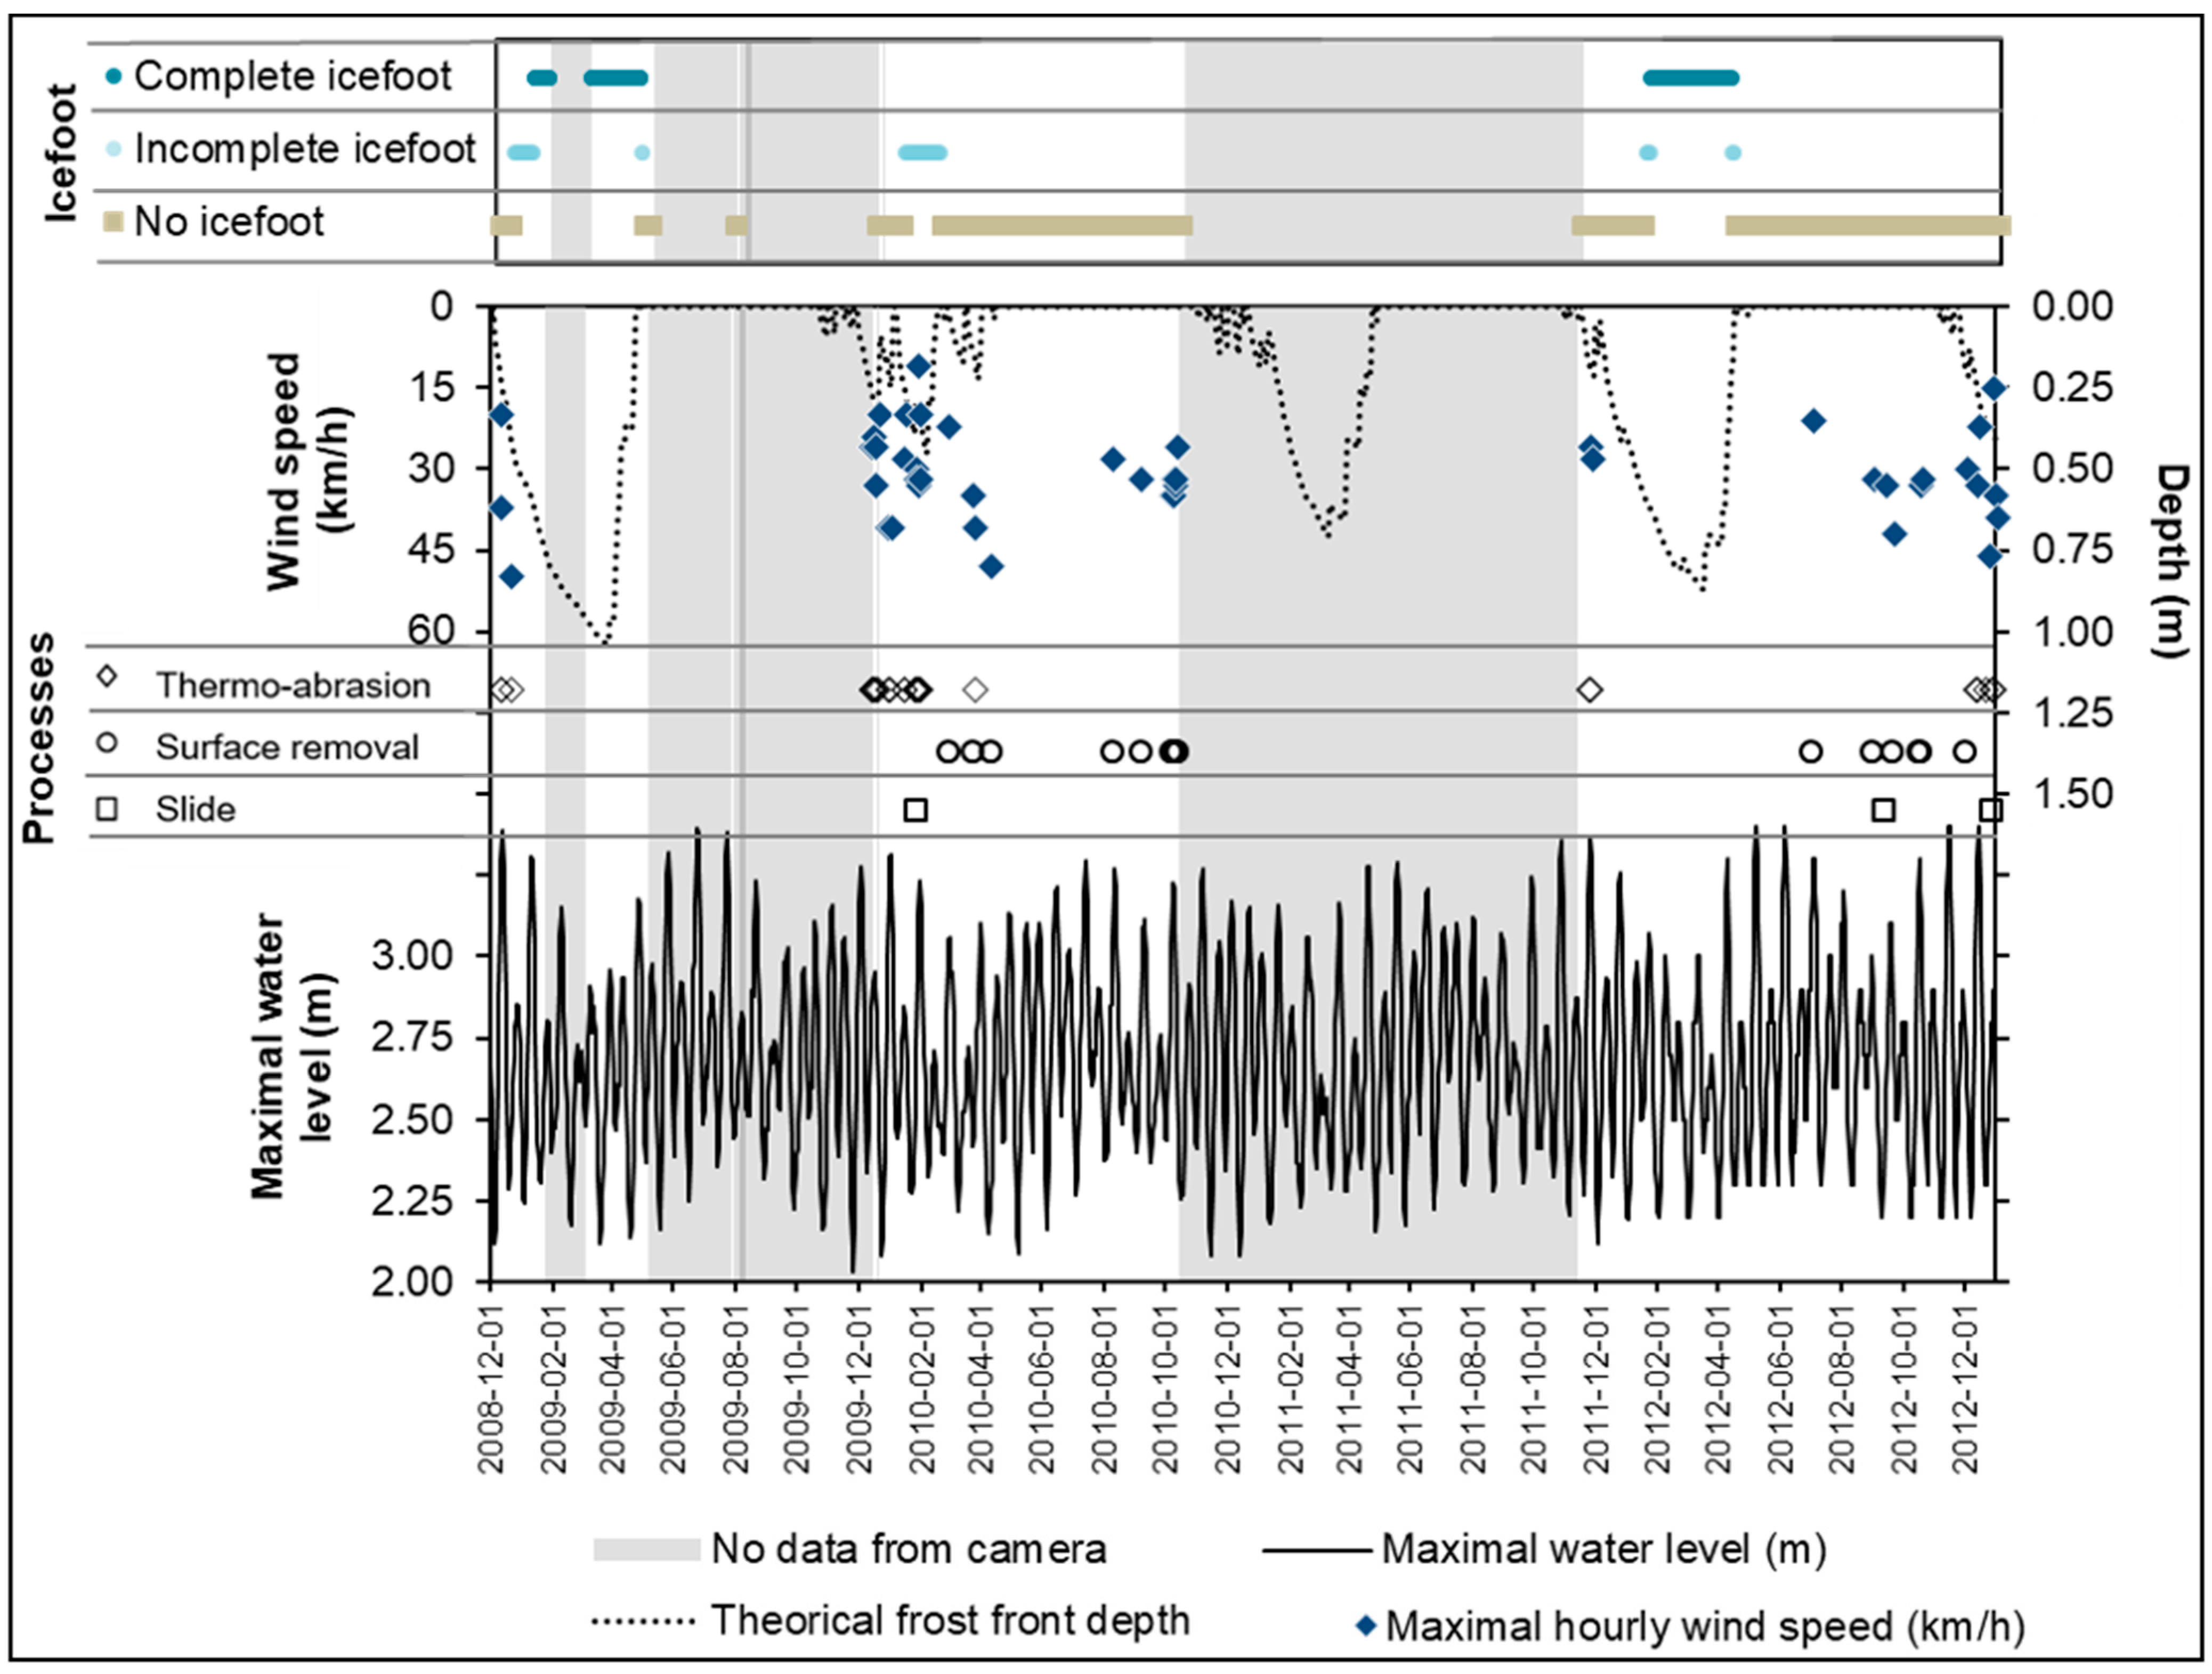
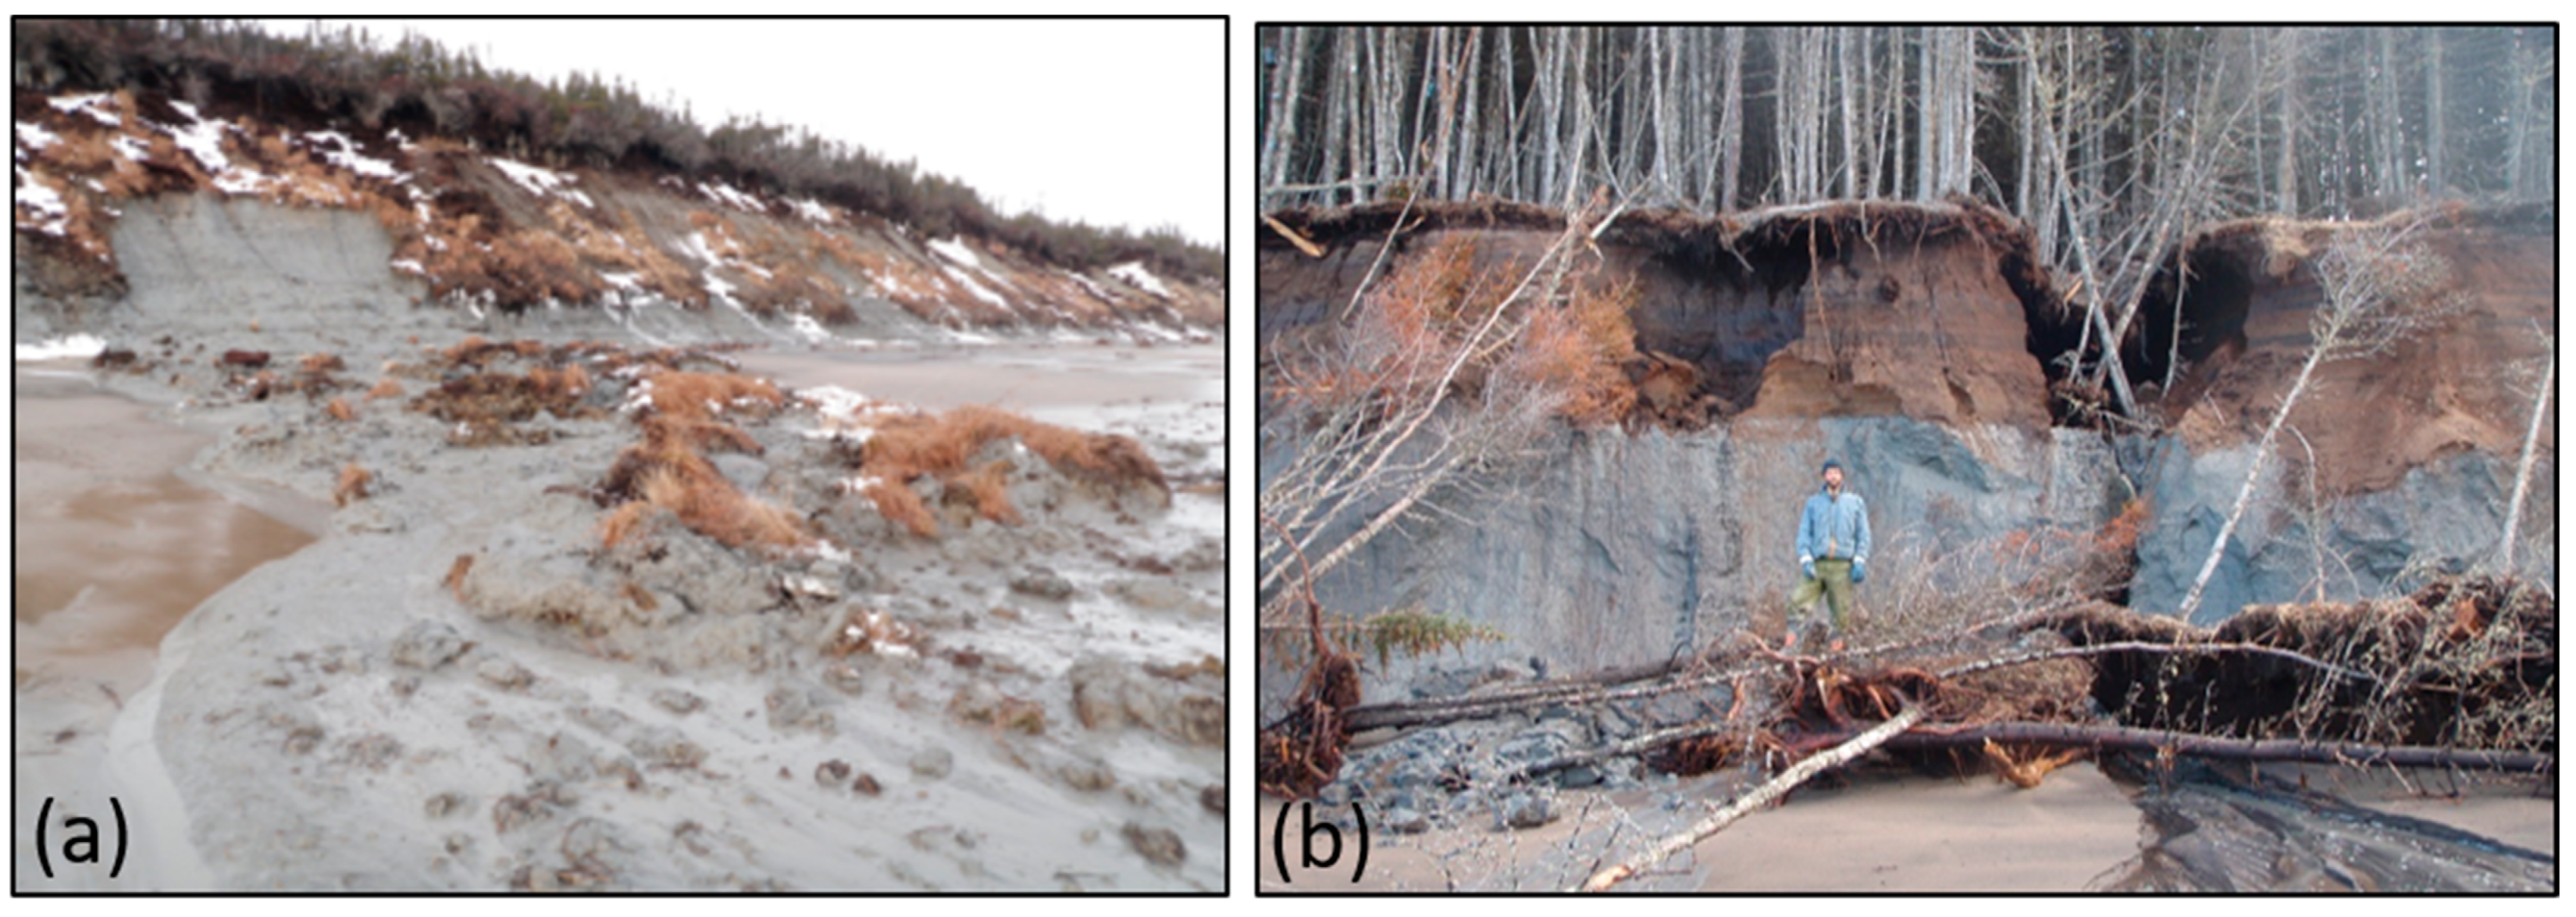
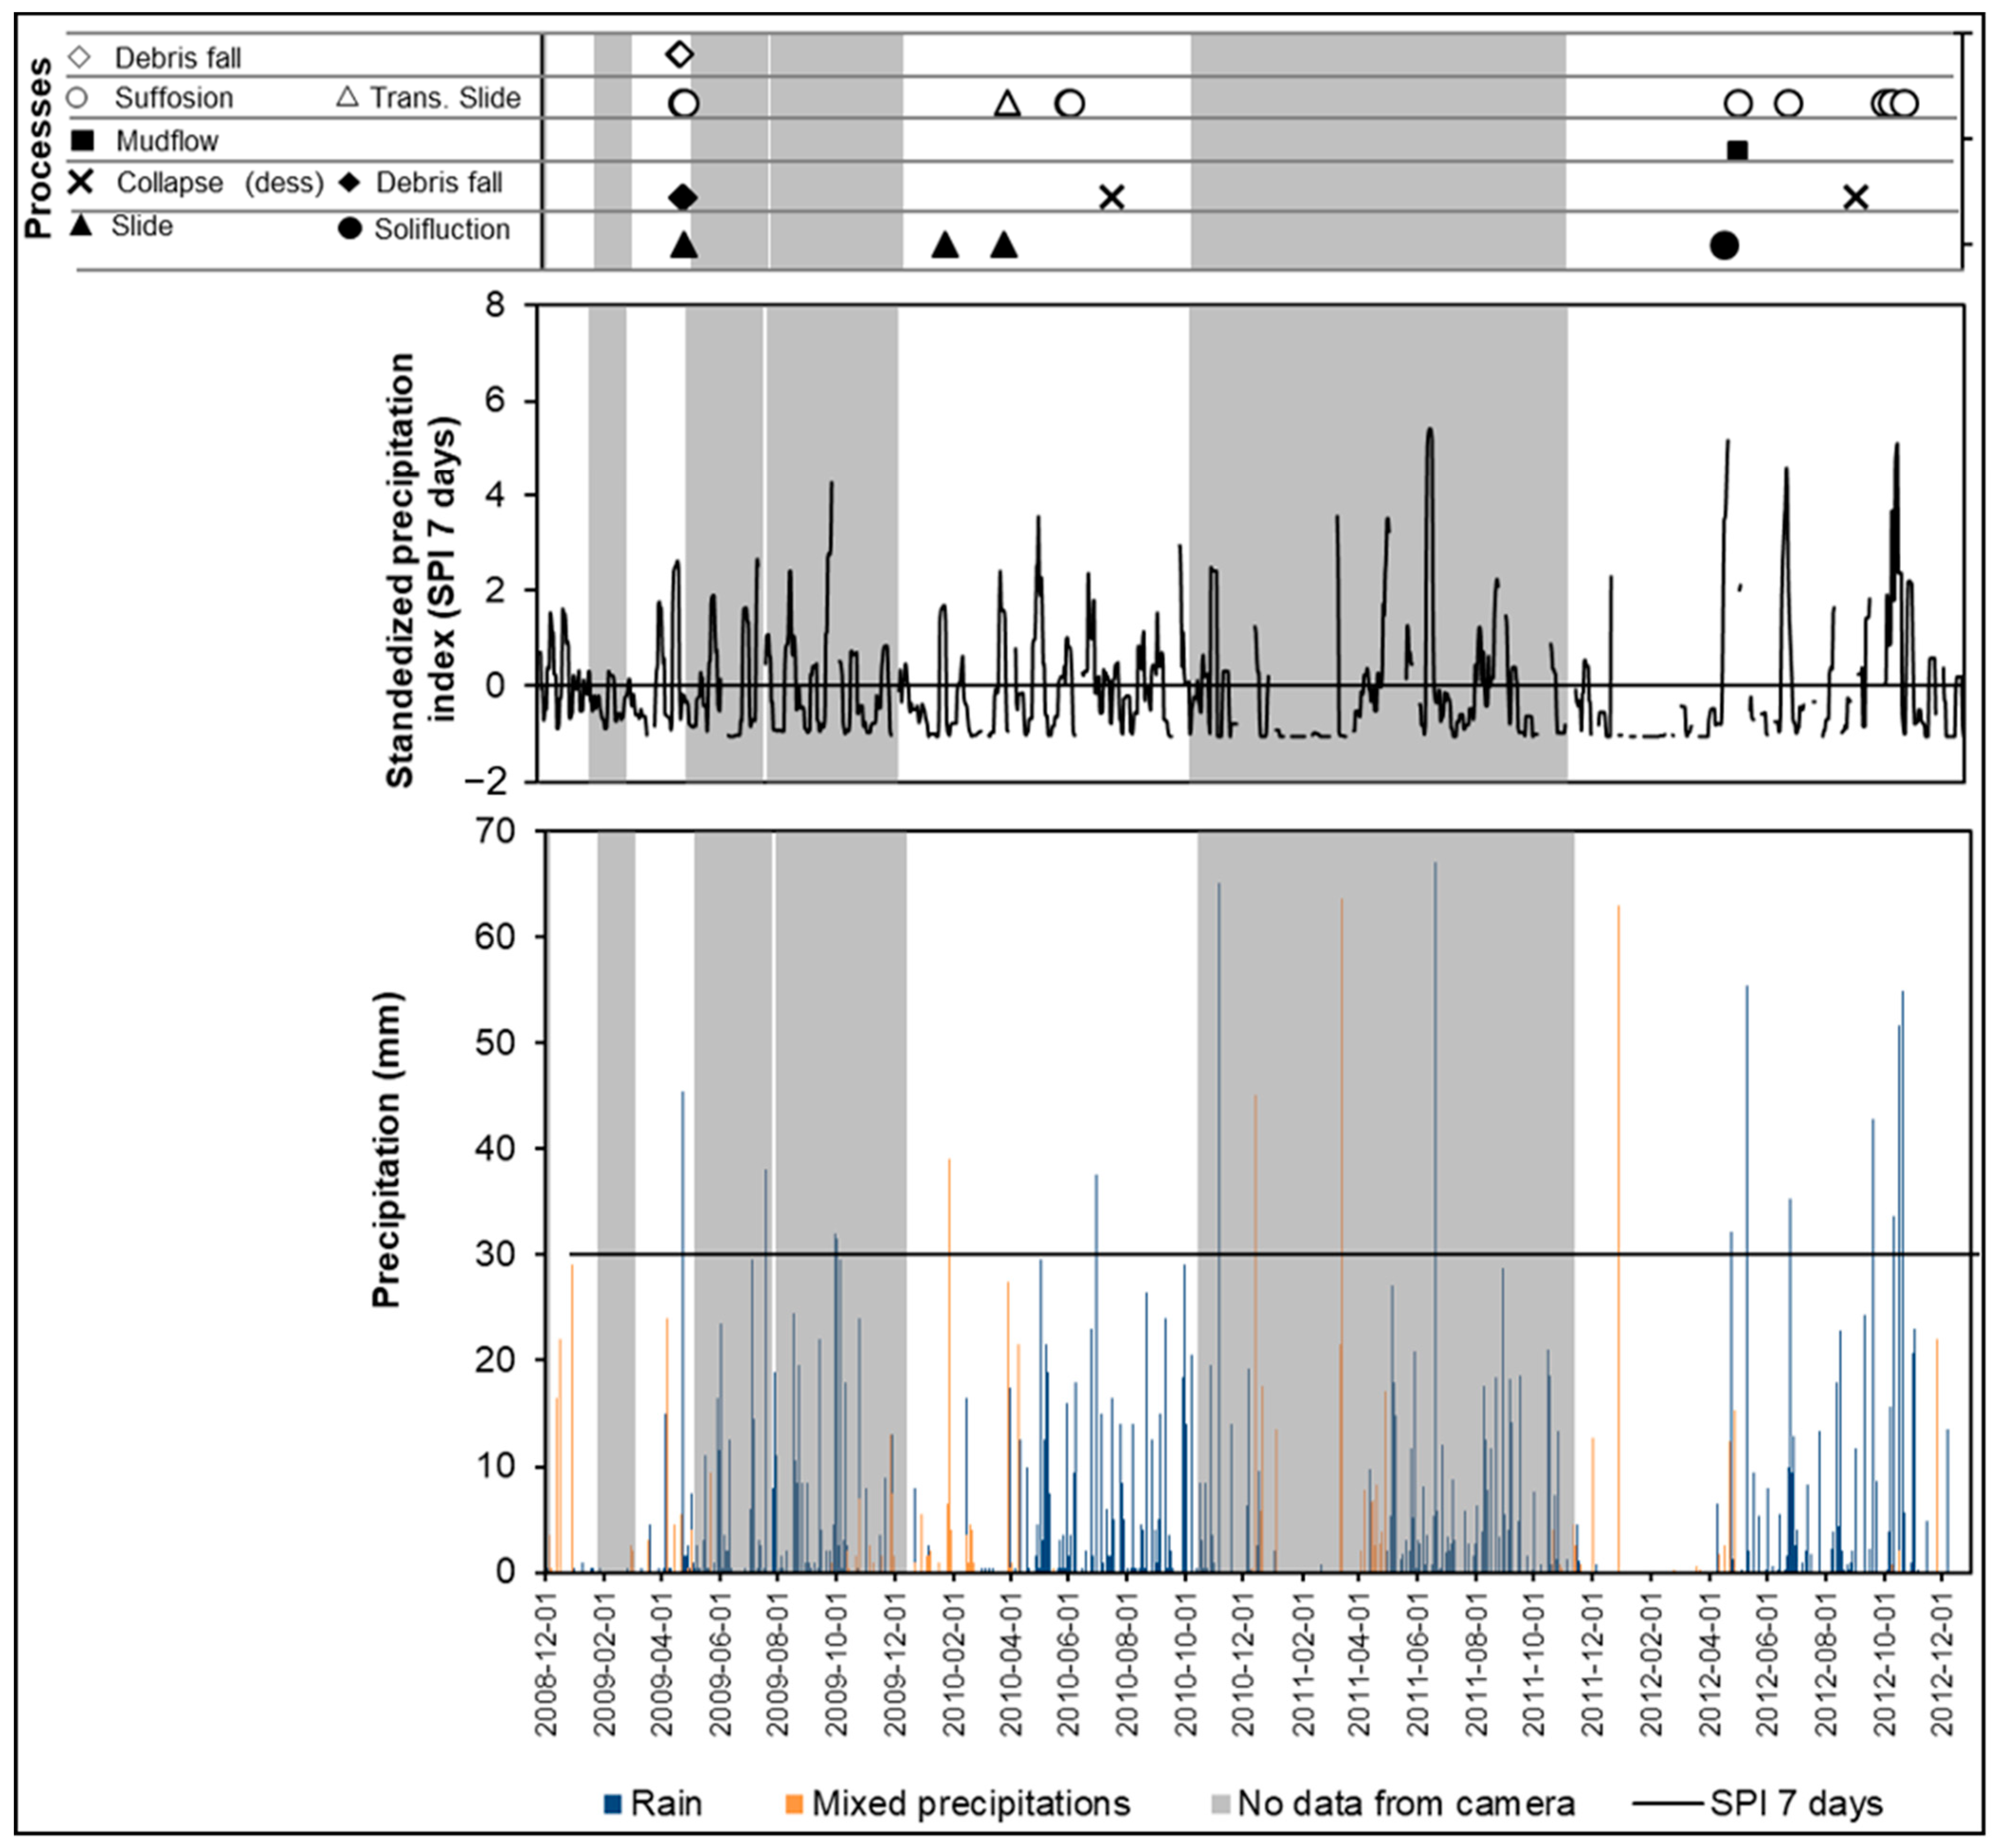
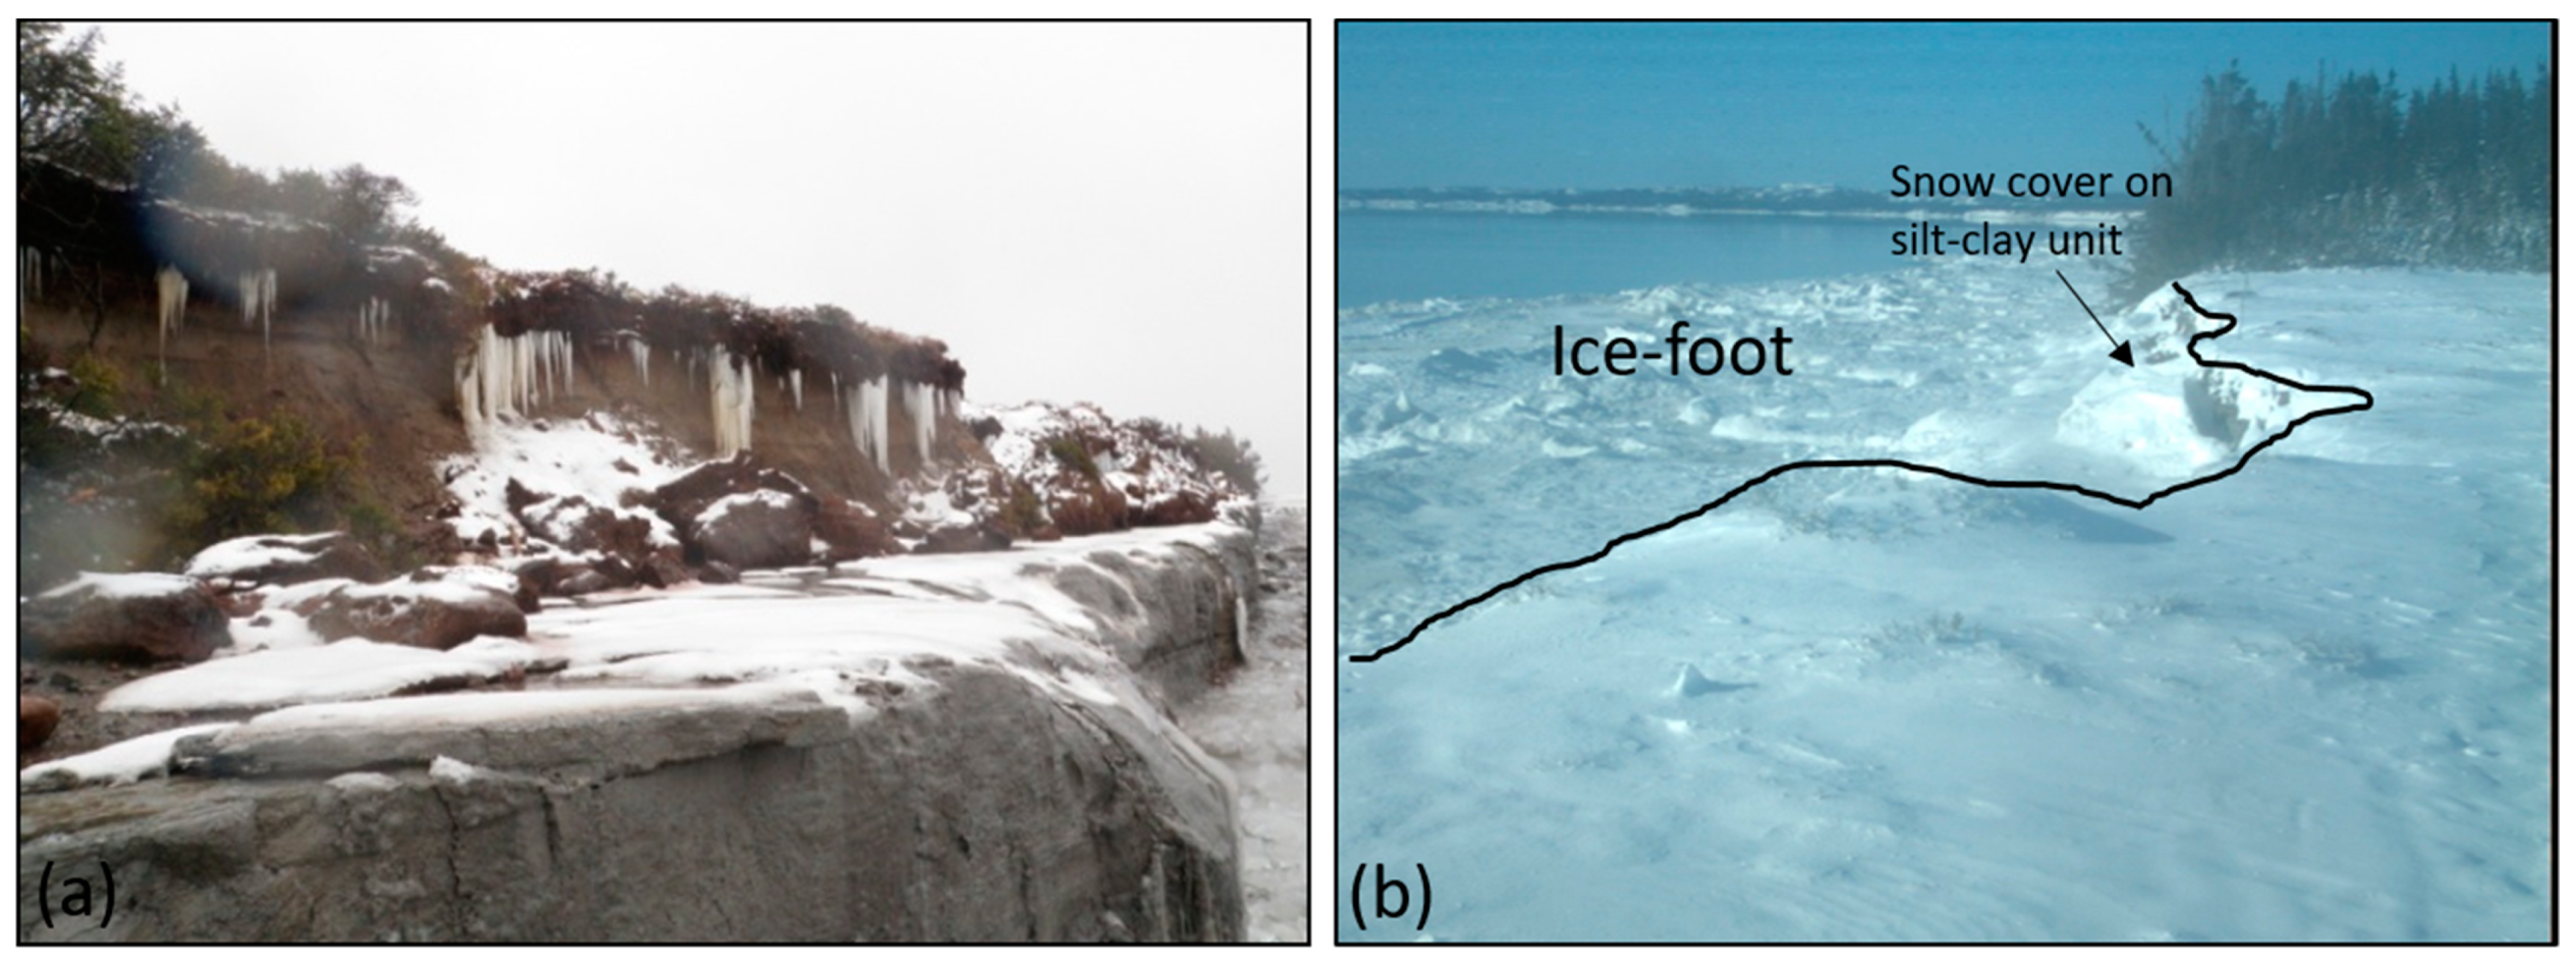
4.2.1. Zone A
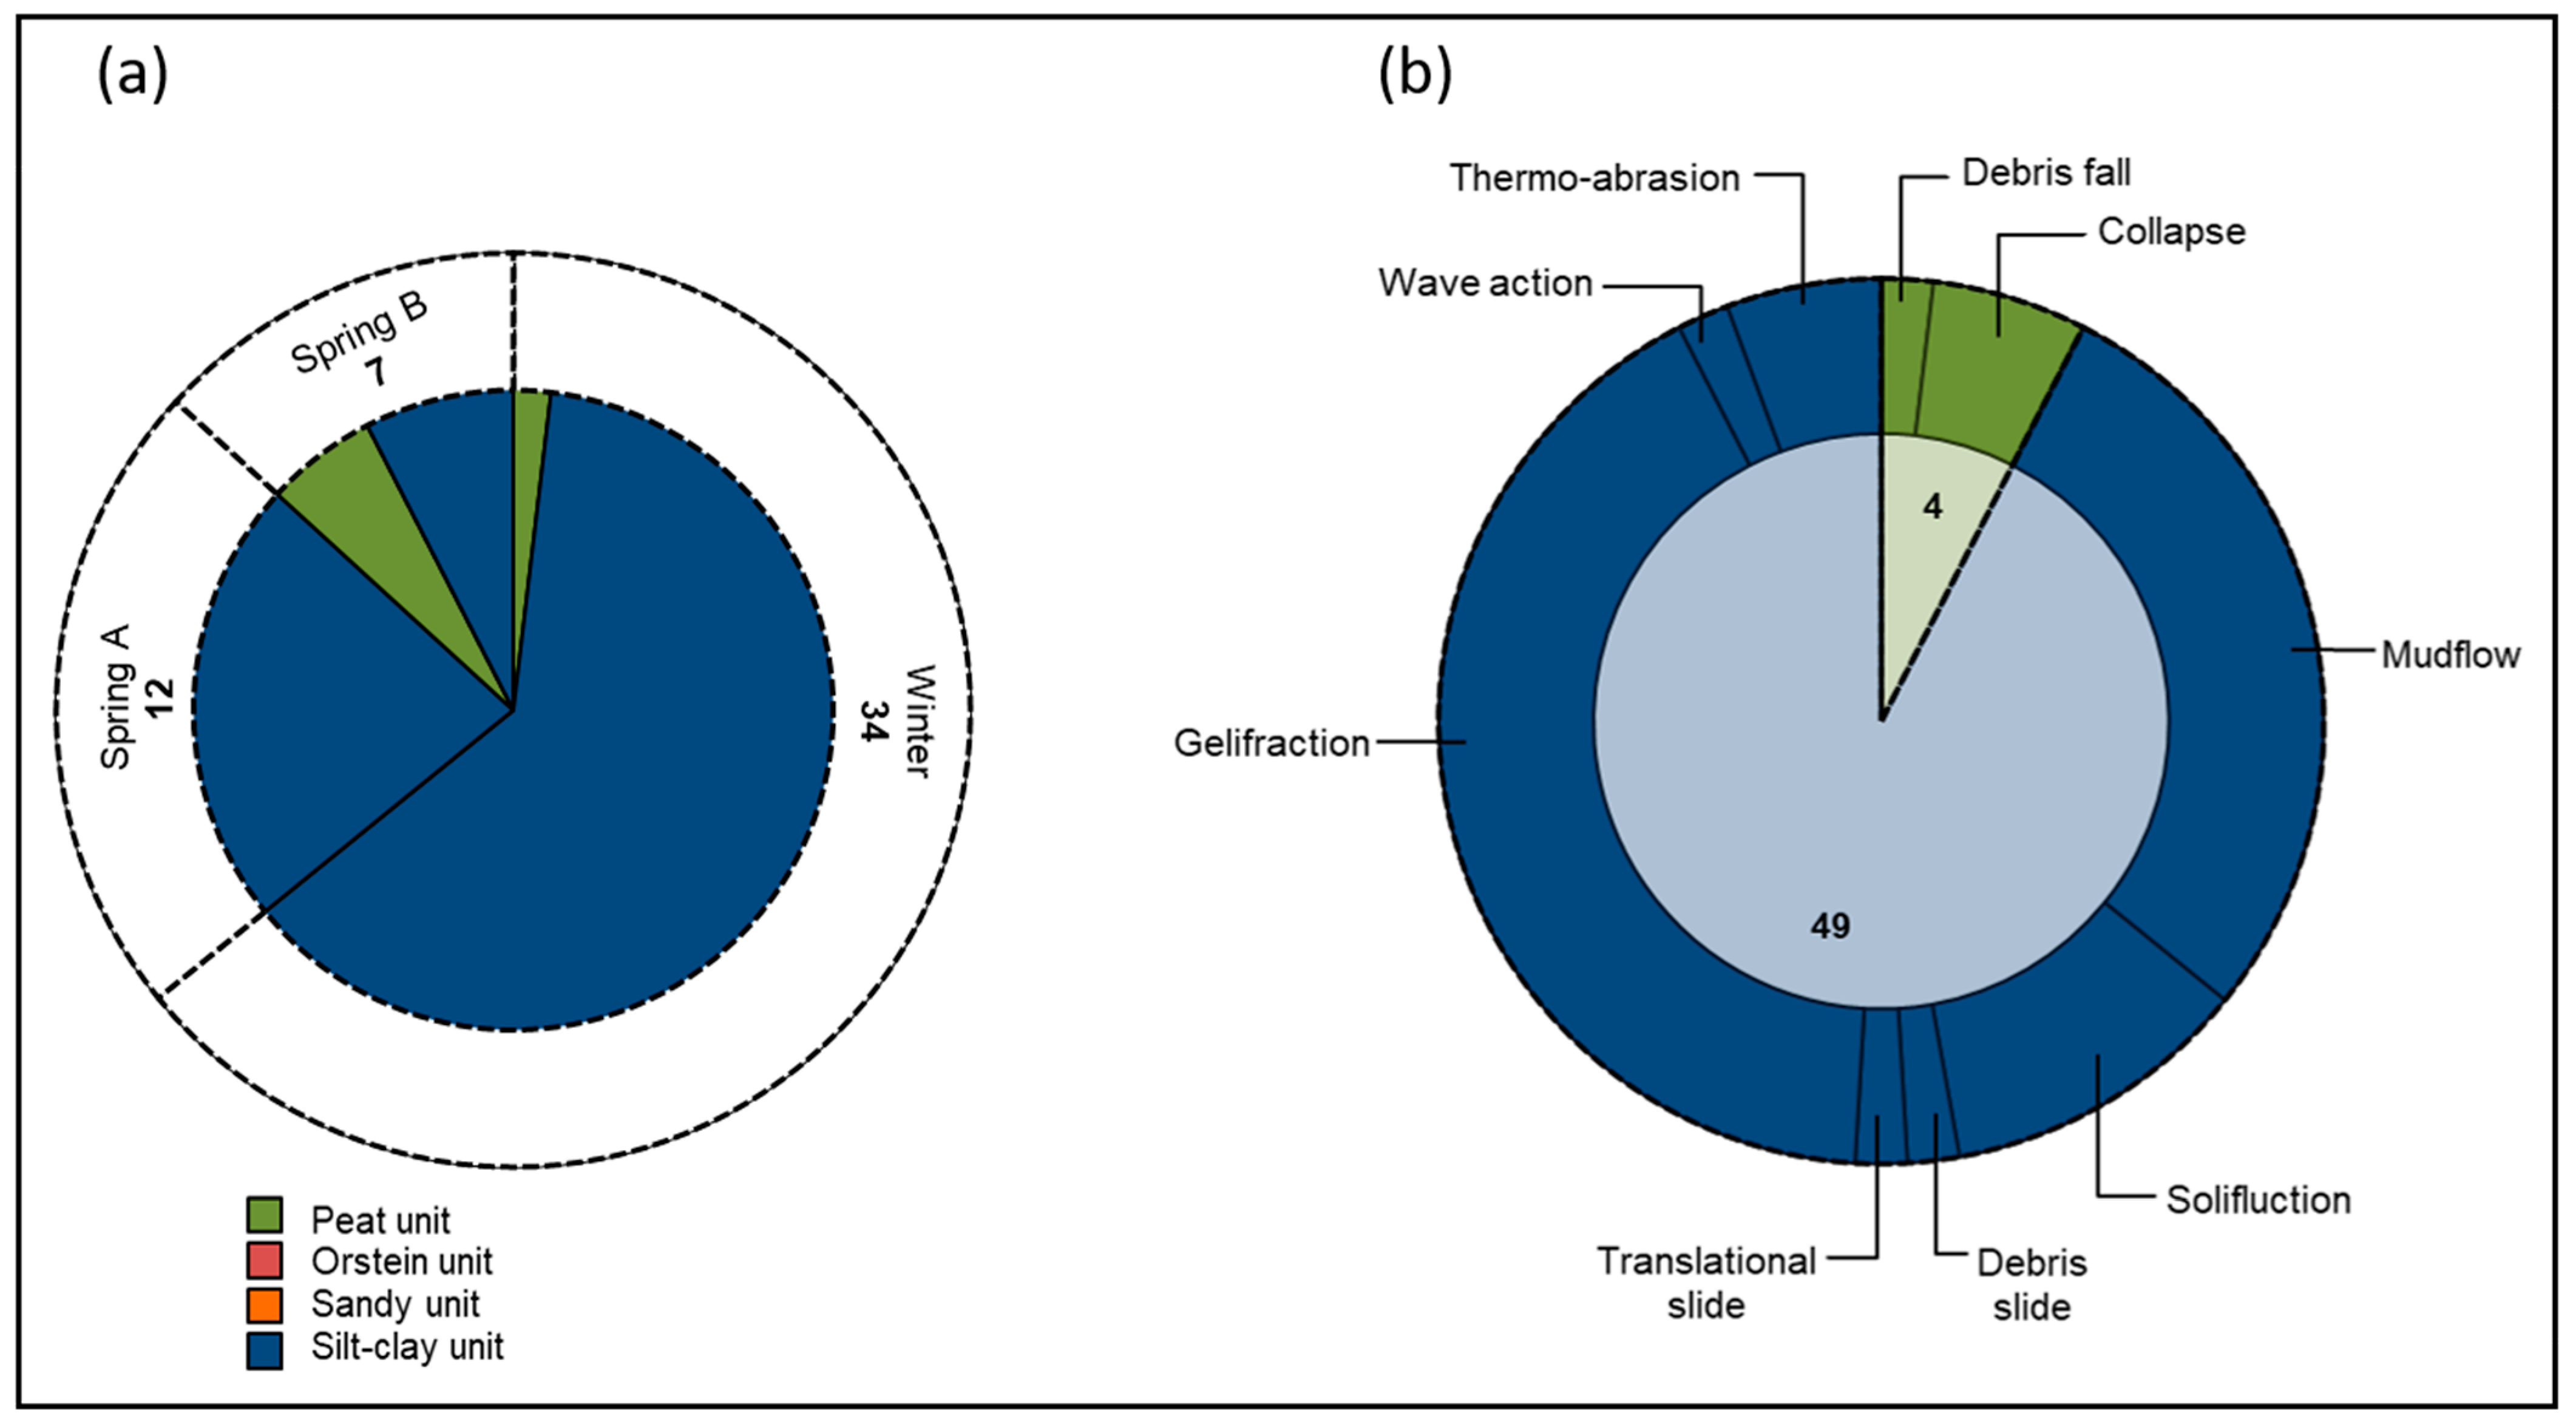
4.2.2. Zone B
4.2.3. Zone C
4.2.4. Zone D
4.2.5. Synthesis of the Seasonal Distribution of Geomorphological Processes
5. Discussion
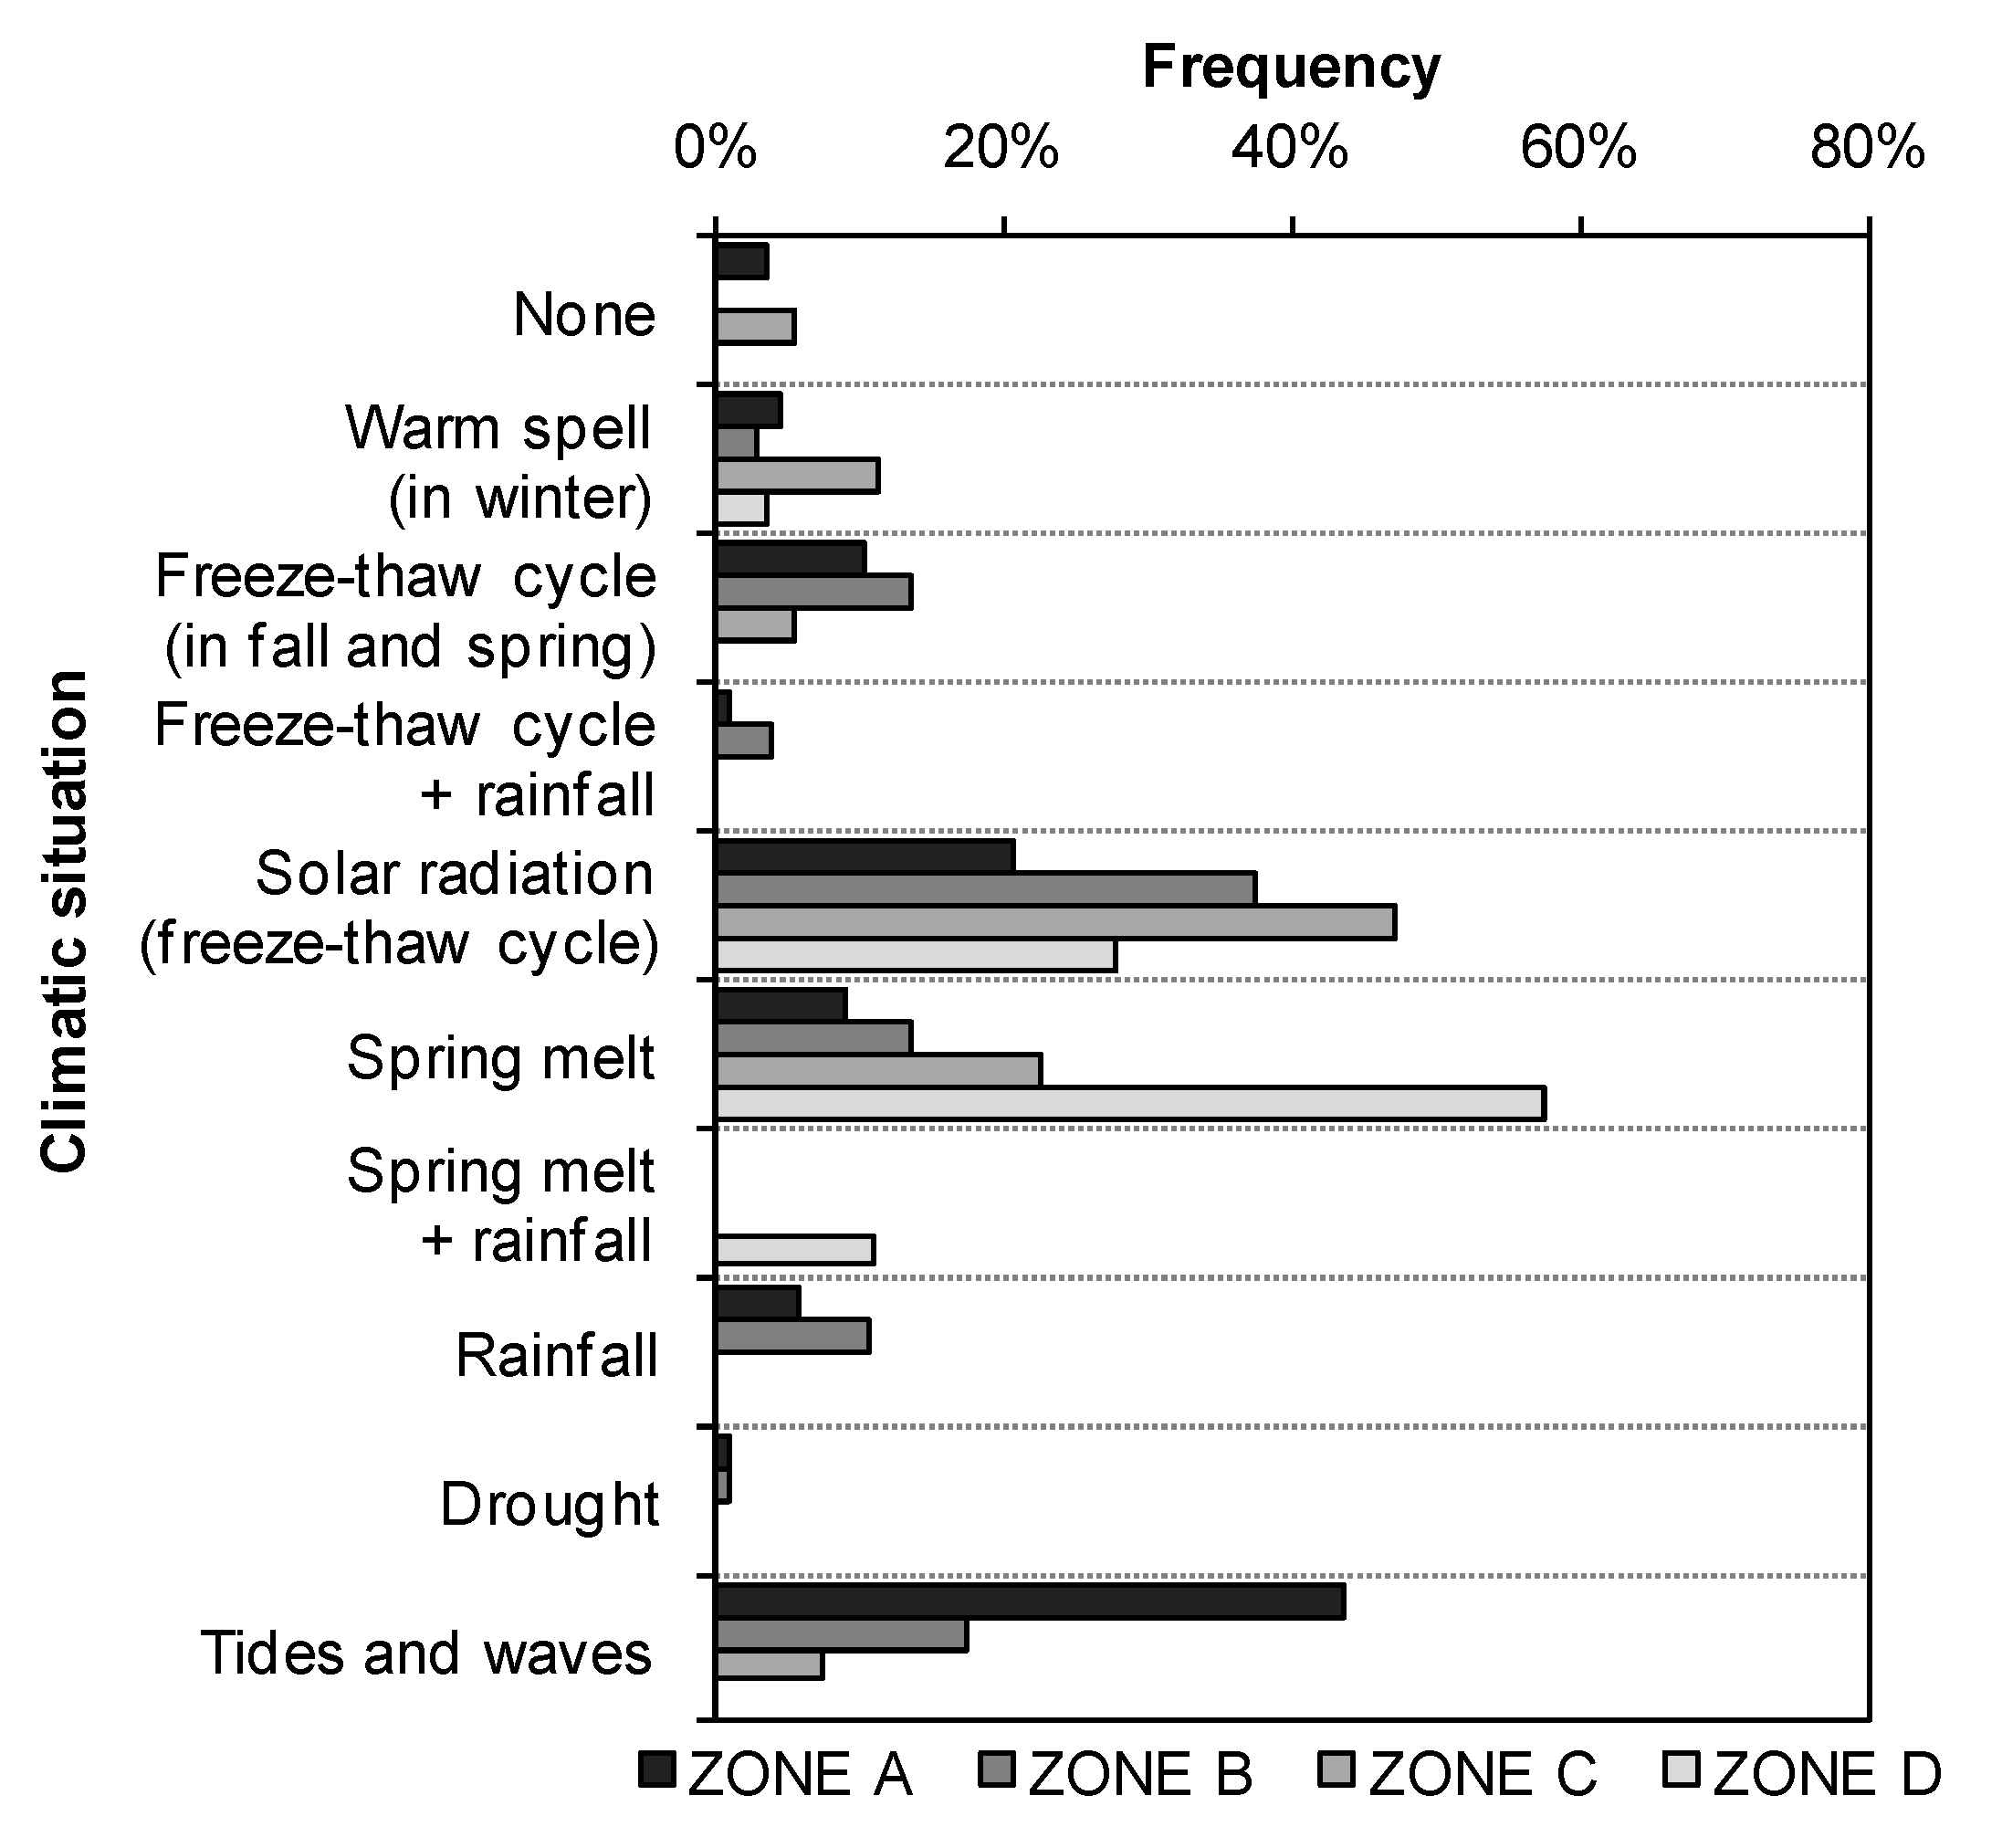
5.1. Driving Factors for Seasonal and Daily Erosion Events
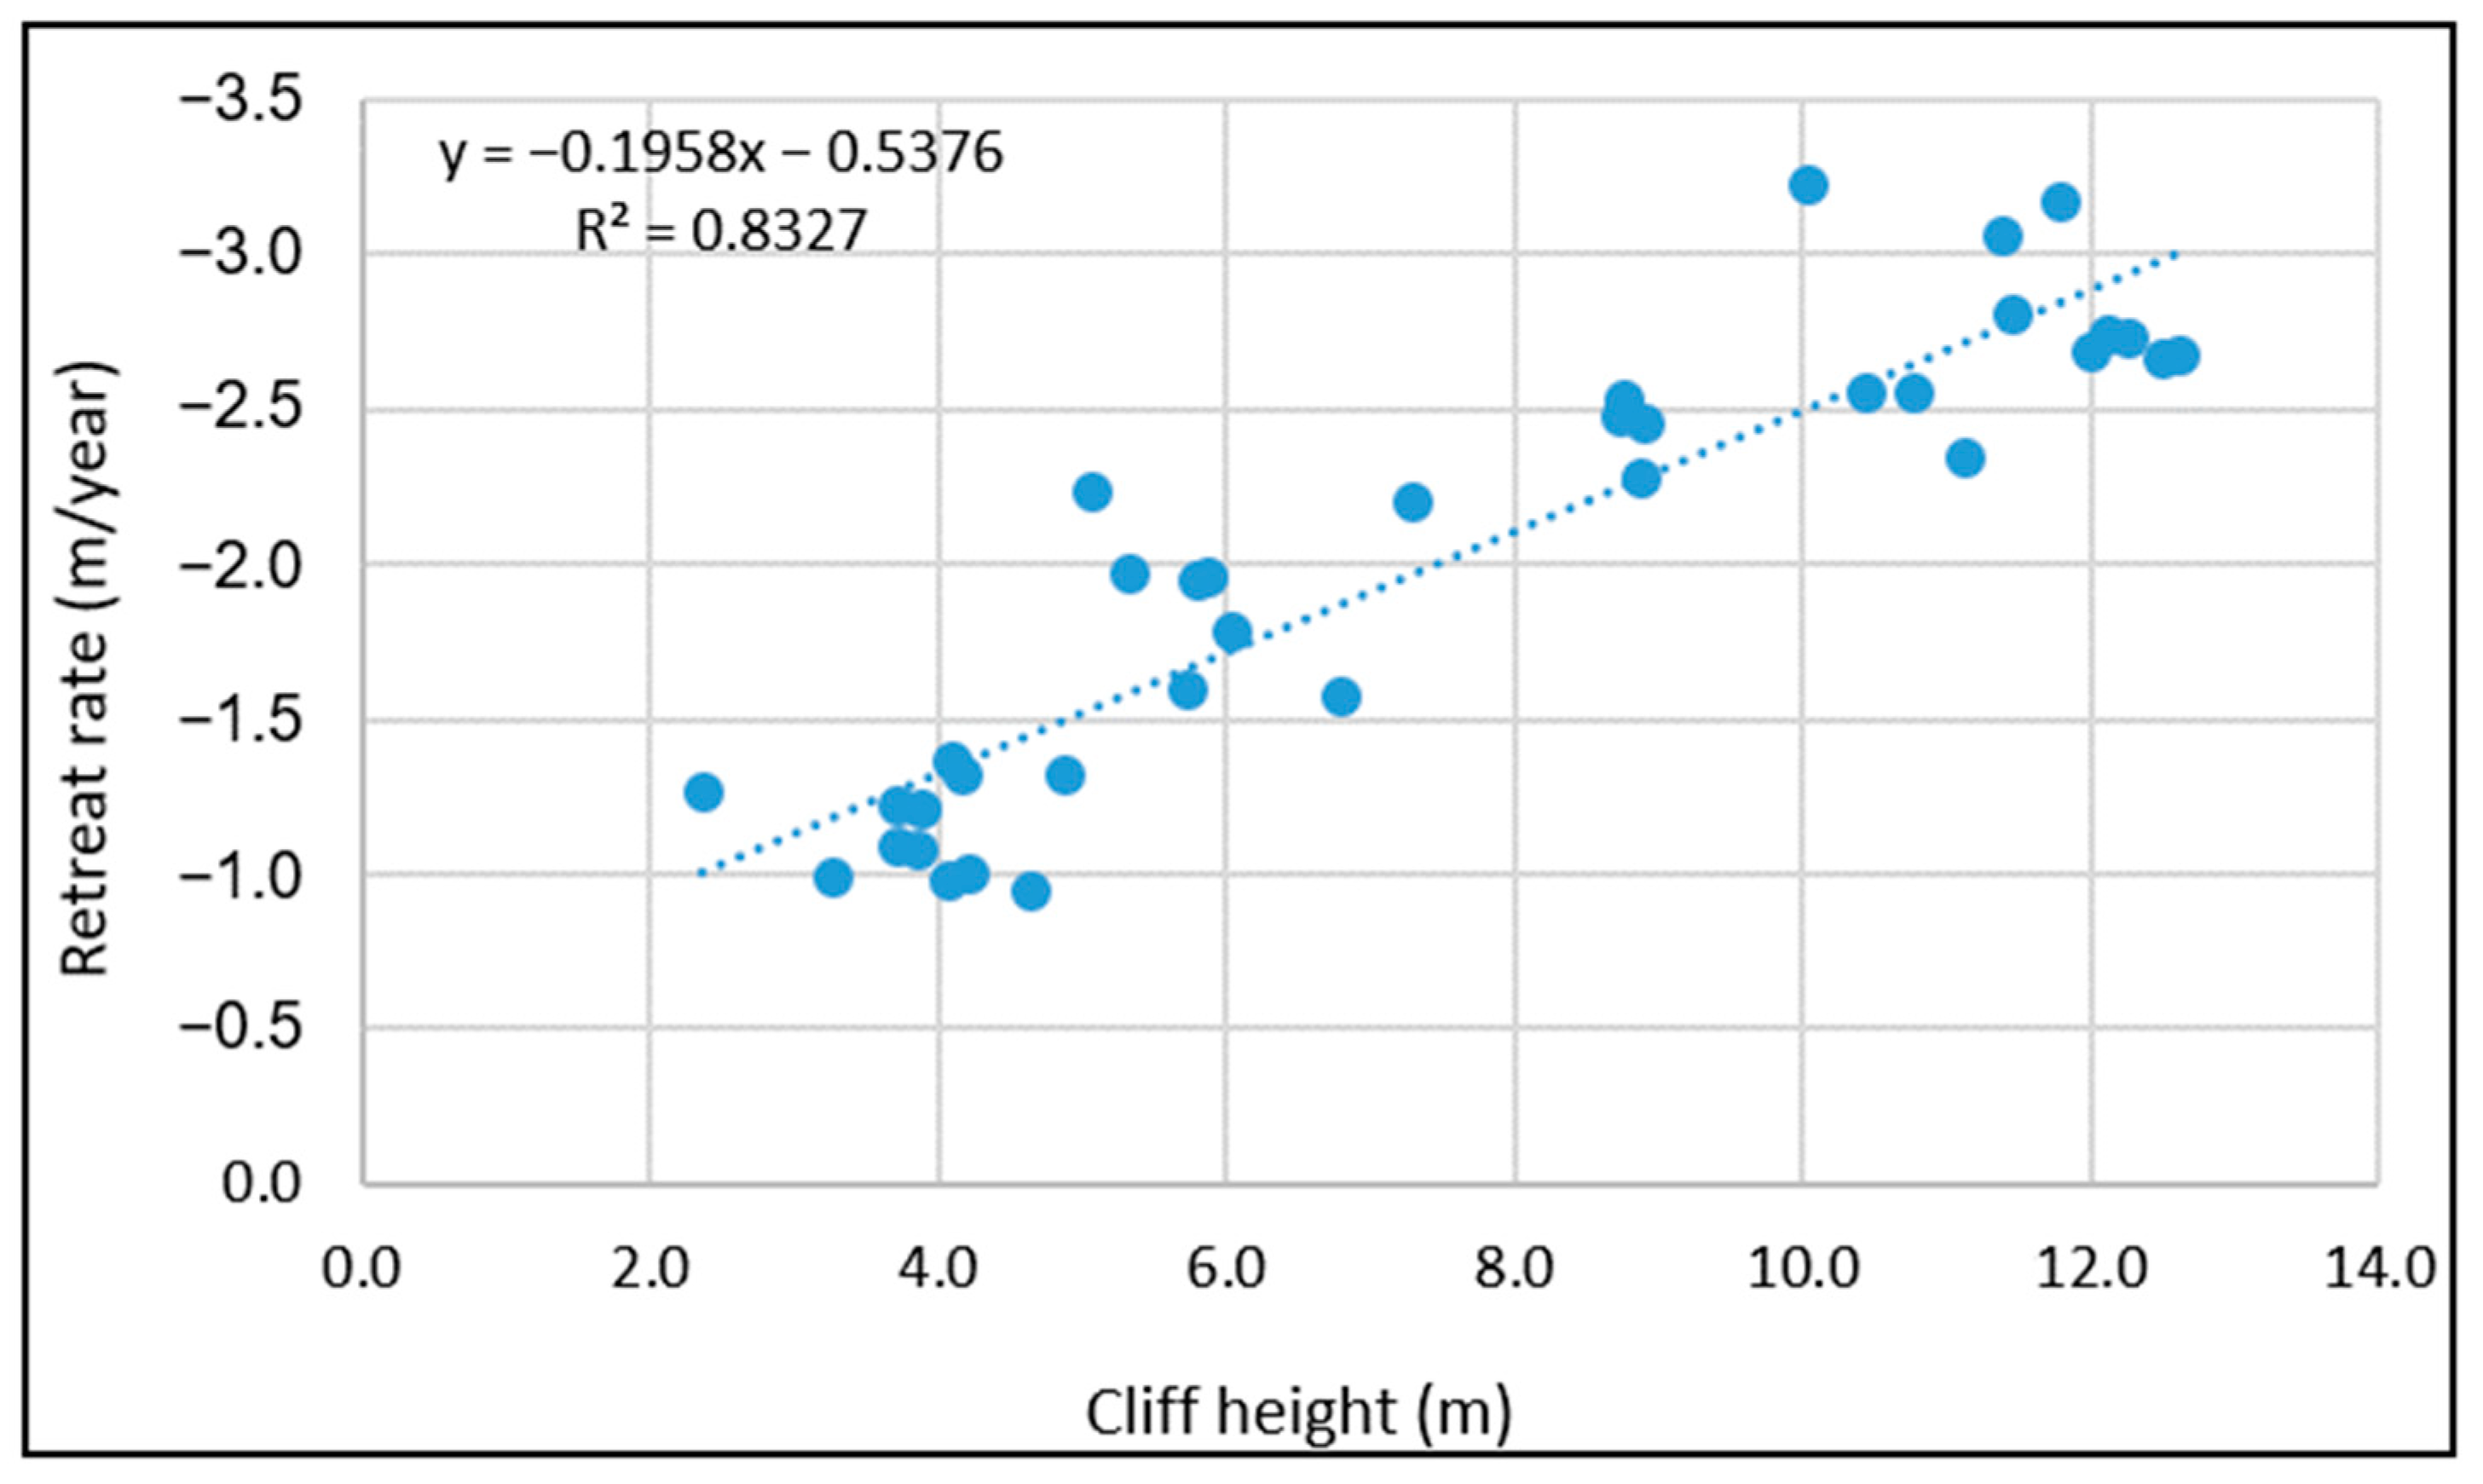
5.2. Causes of Spatial and Temporal Variability in Cliff Retreat Rates
5.2.1. Causes of Spatial Variability
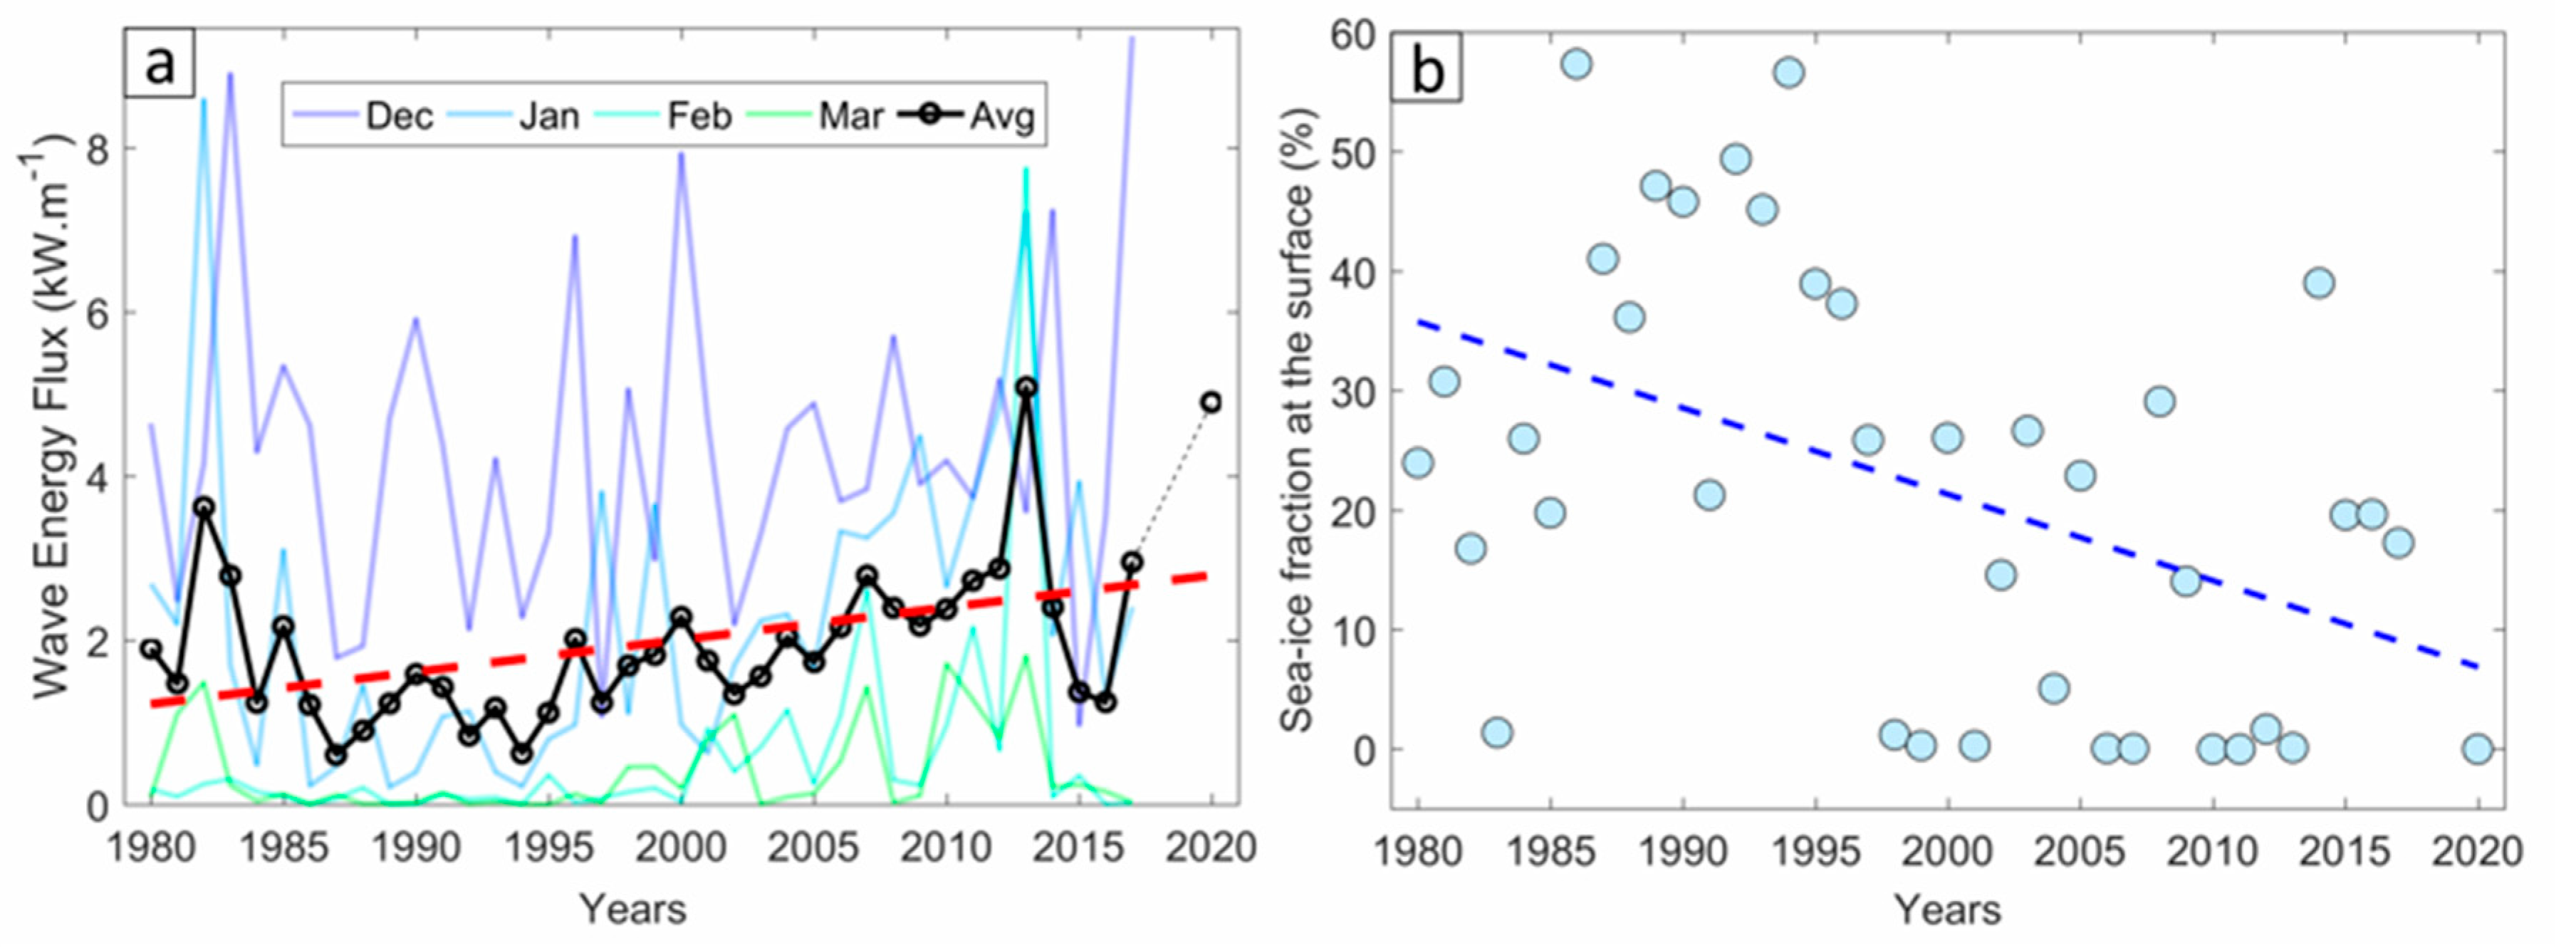
5.2.2. Causes of Temporal Variability
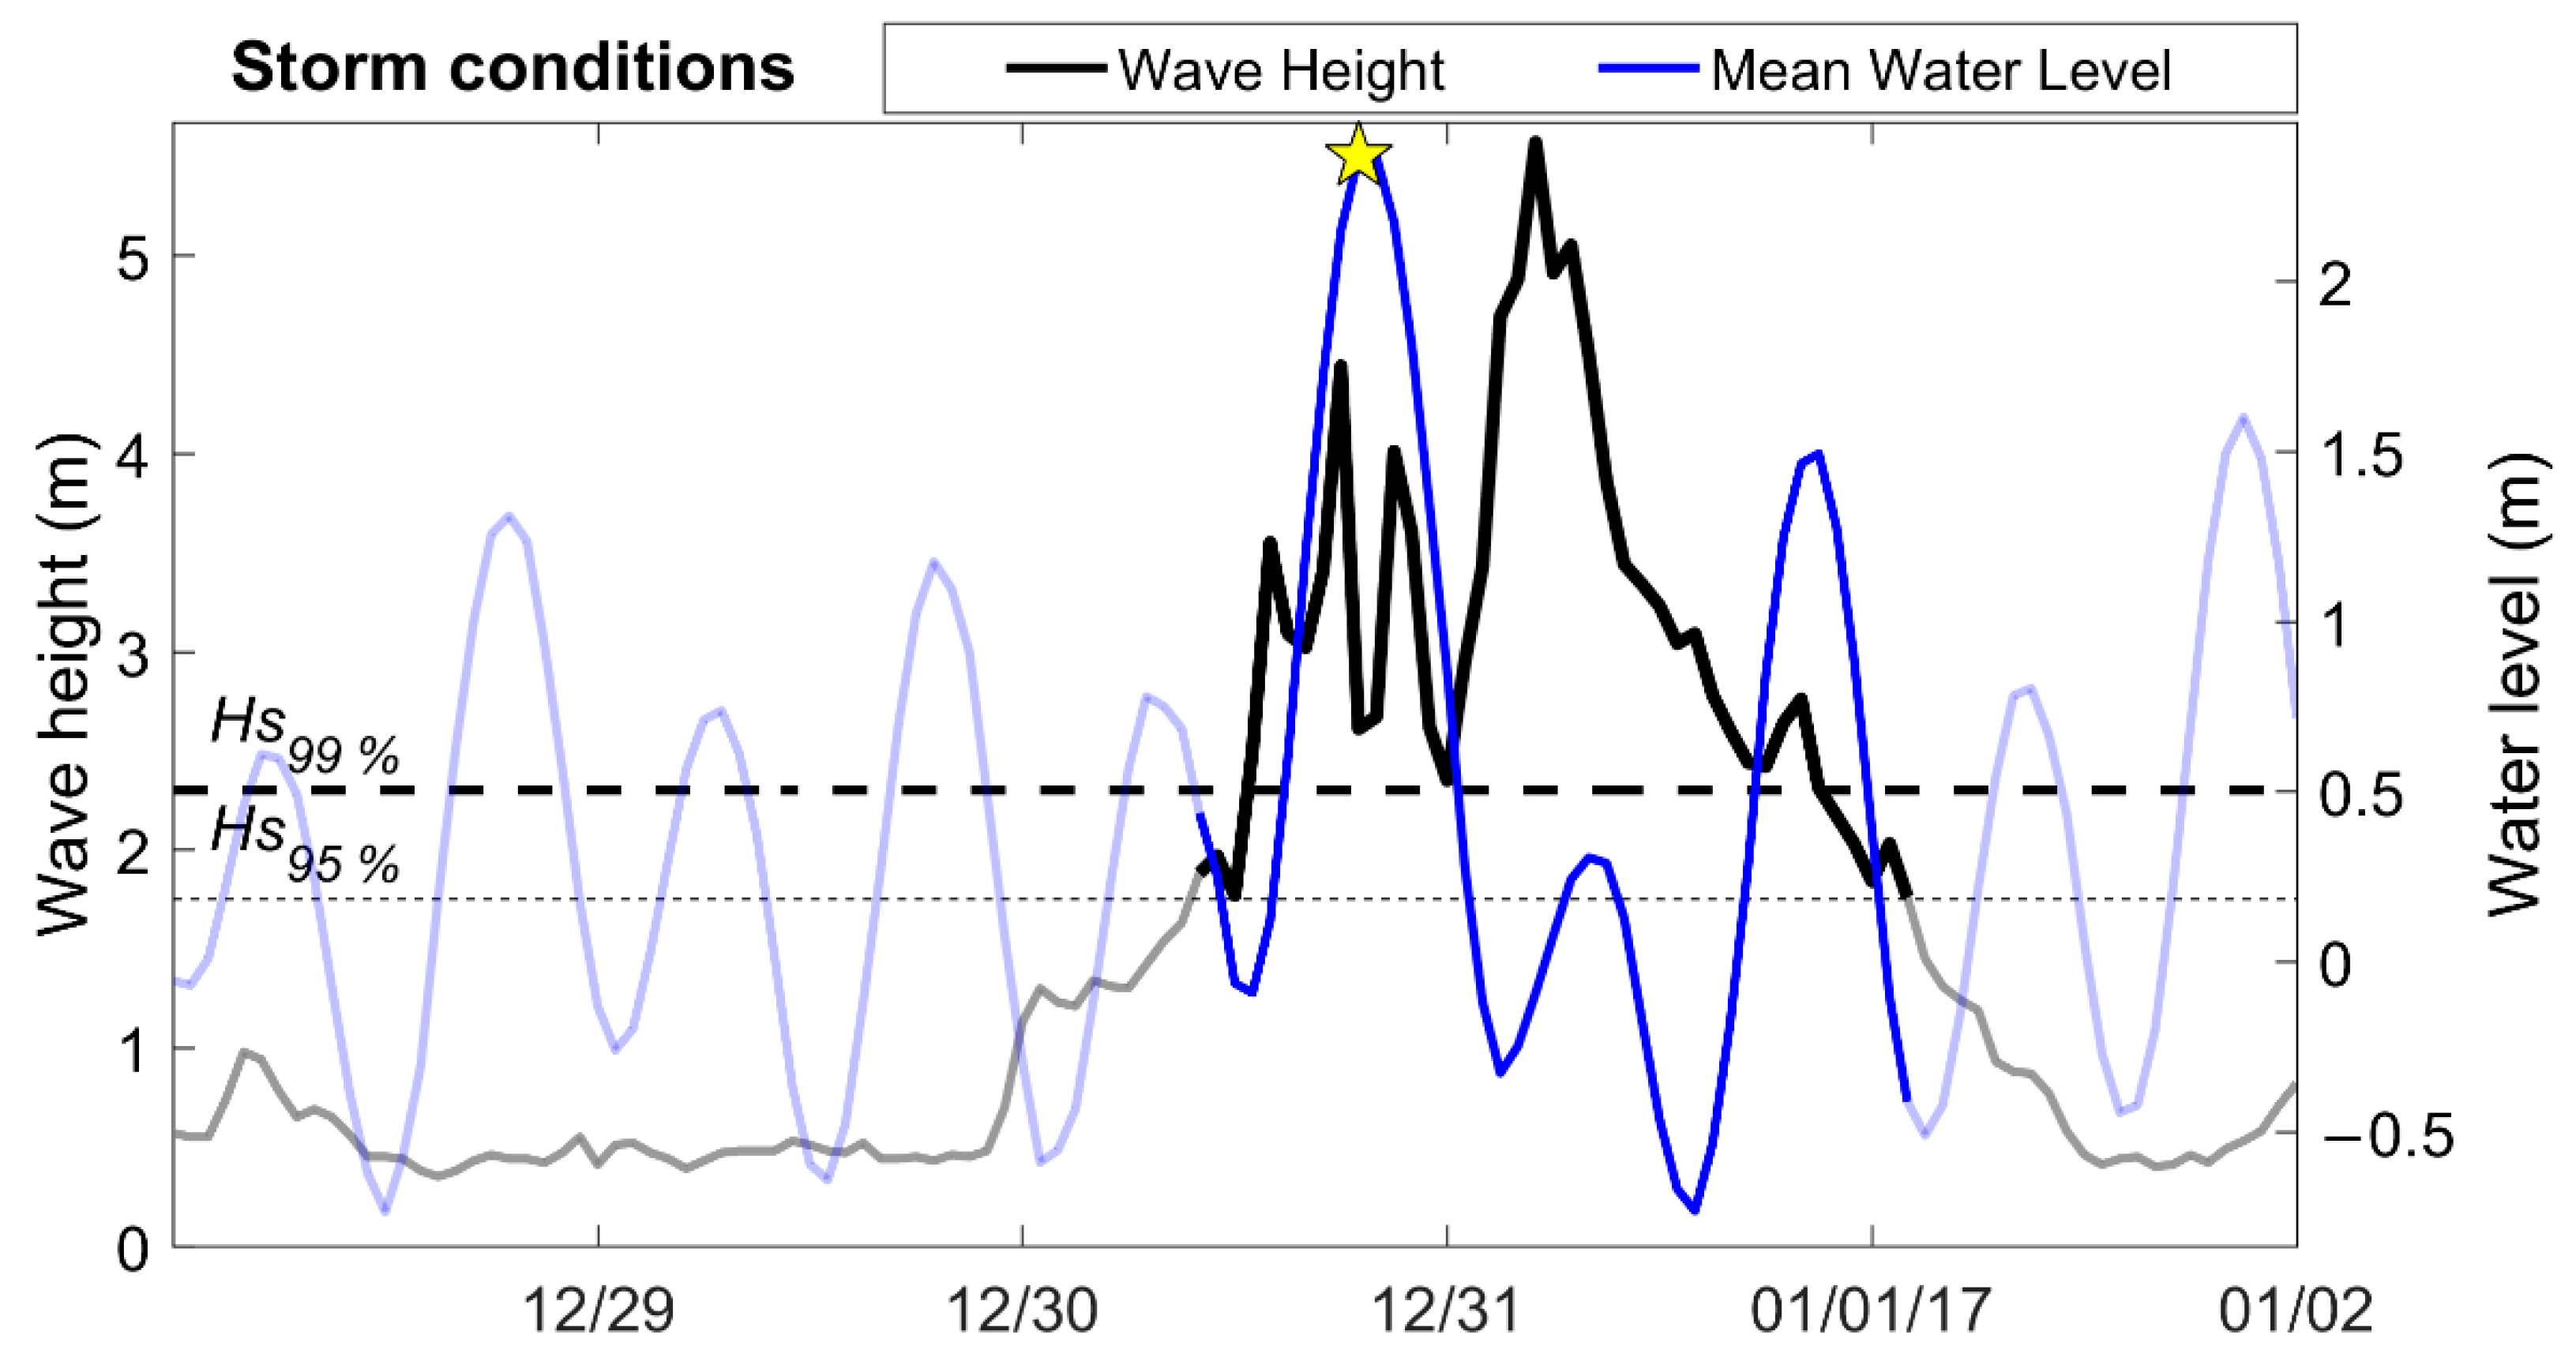
Influence of Marine Forcing on Retreat Speed
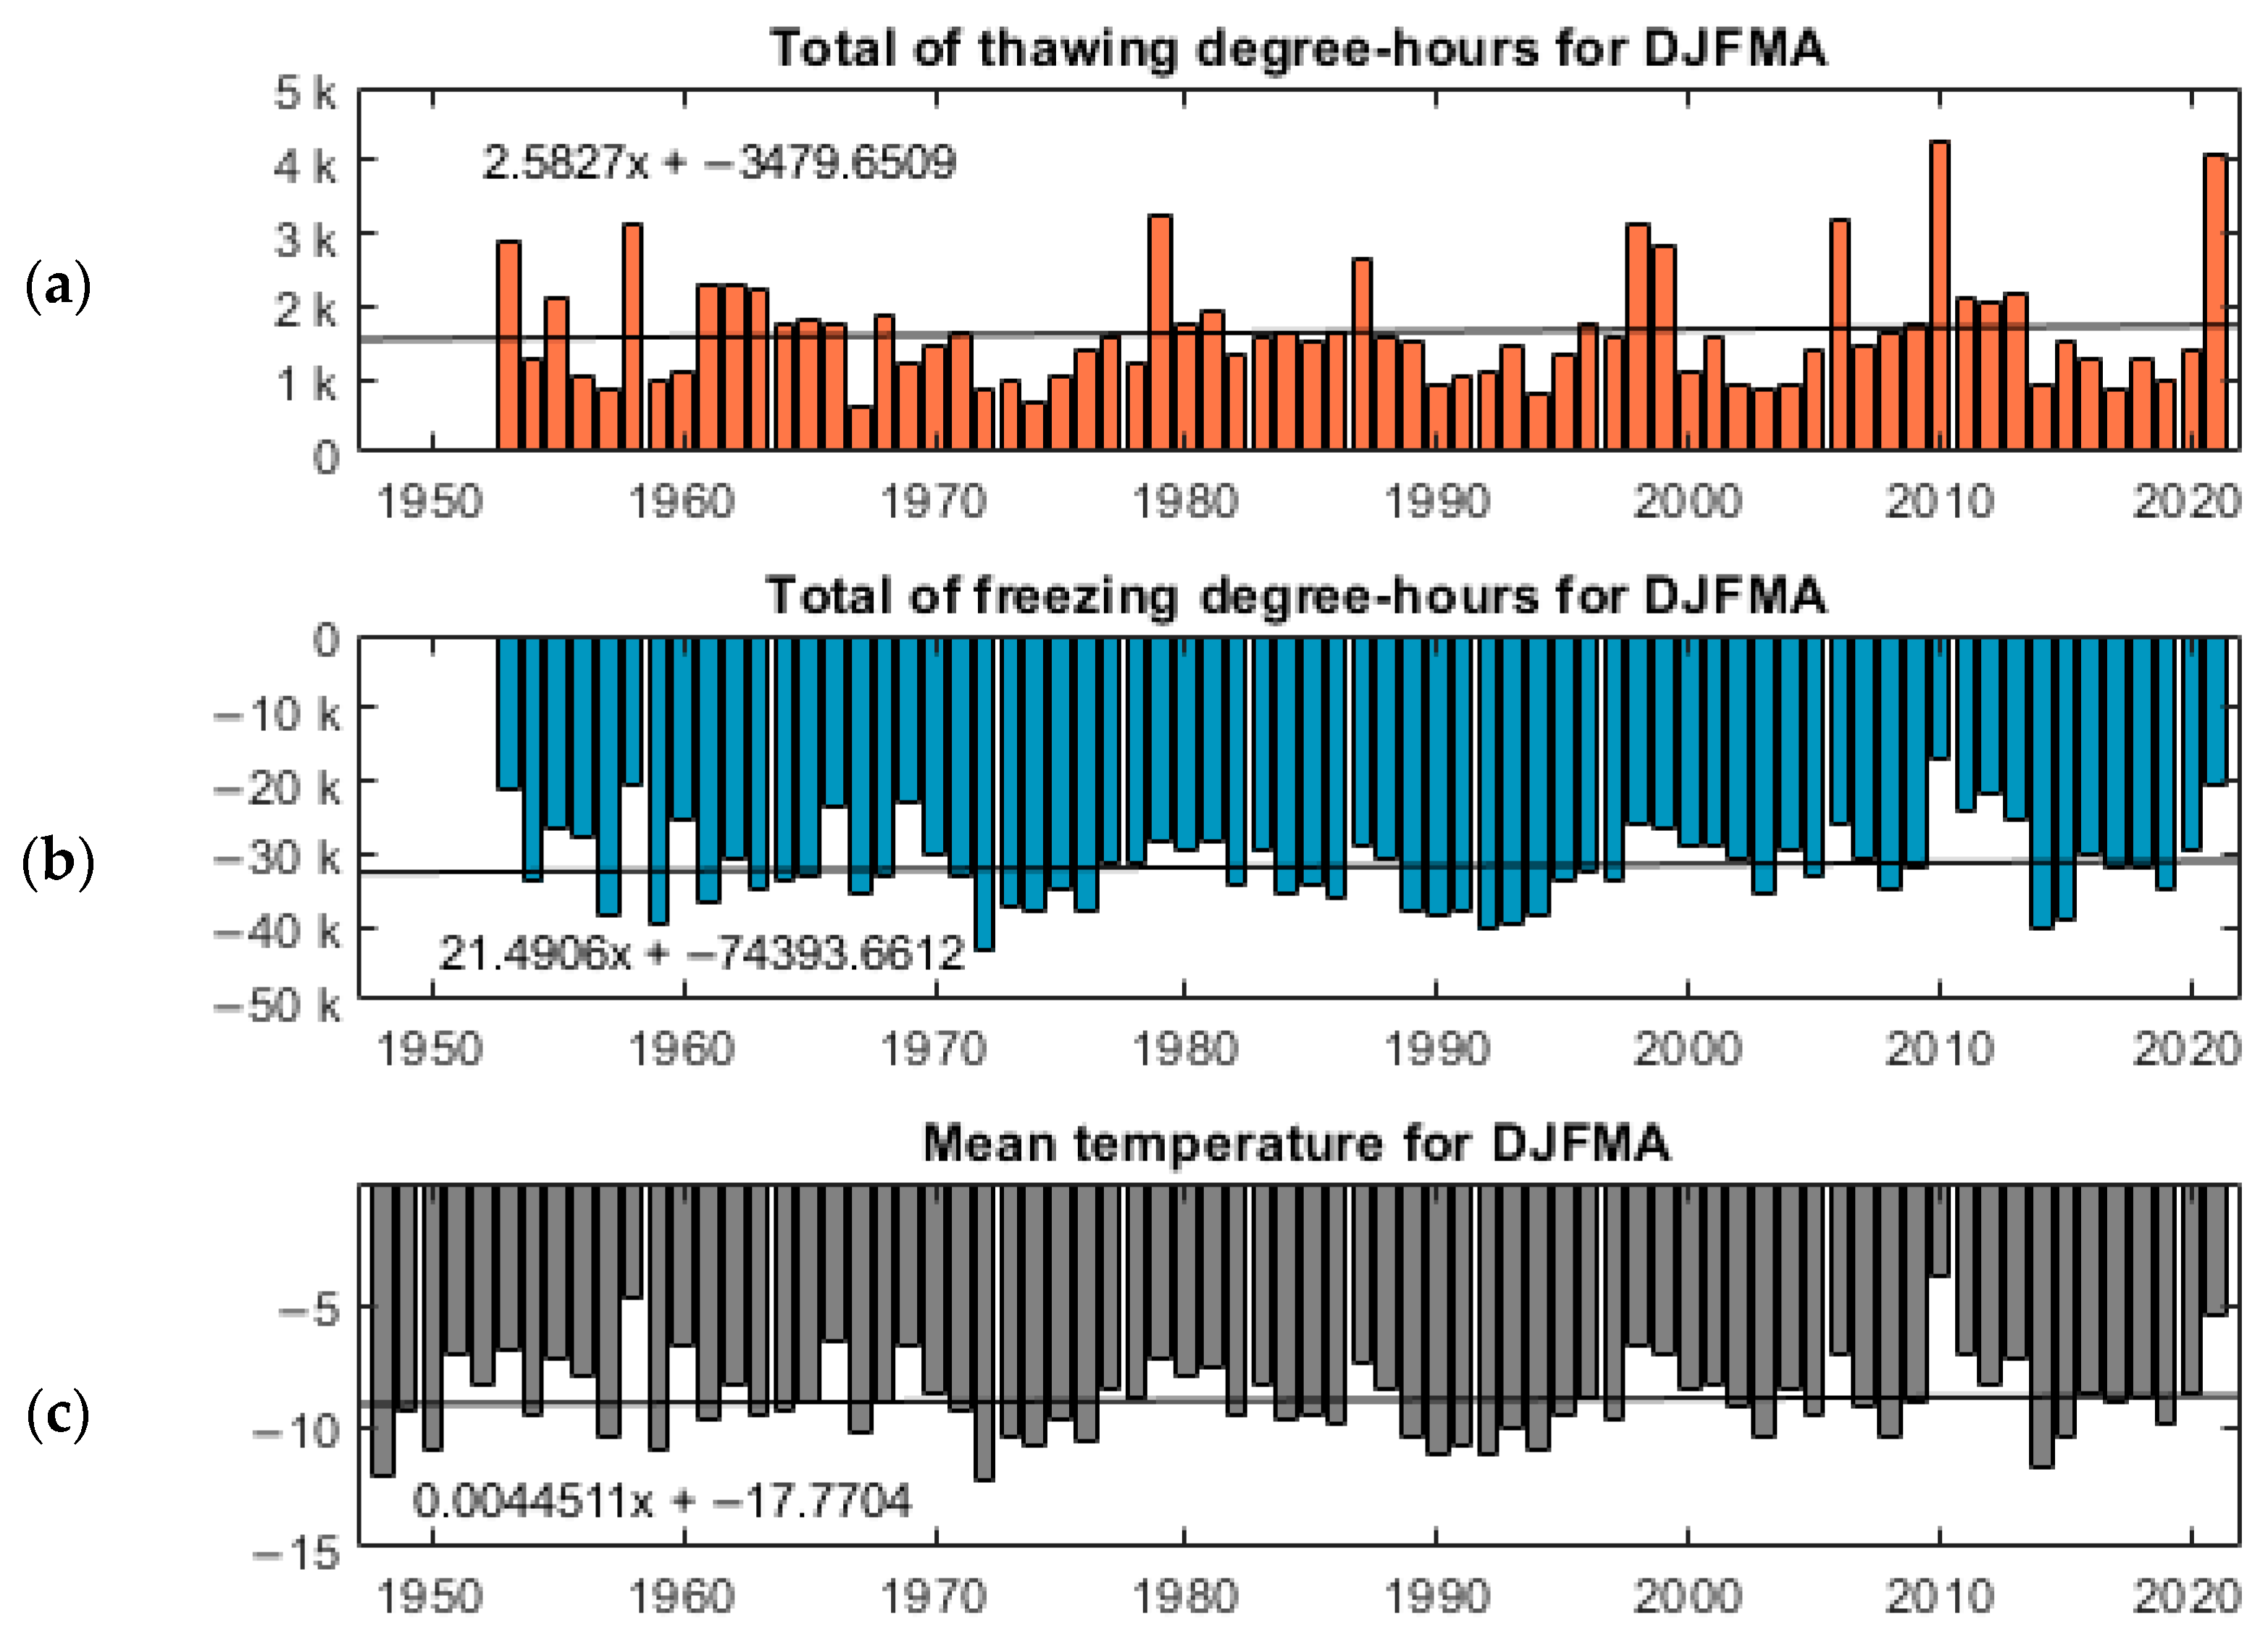
Influence of Temperatures
5.2.3. Conjuncture of Meteorological–Marine Conditions vs. High Temporal Resolution Monitoring
6. Conclusions
Author Contributions
Funding
Institutional Review Board Statement
Informed Consent Statement
Data Availability Statement
Acknowledgments
Conflicts of Interest
References
- Bezerra, M.M.; Moura, D.; Ferreira, O.; Taborda, R. Influence of Wave Action and Lithology on Sea Cliff Mass Movements in Central Algarve Coast, Portugal. J. Coast. Res. 2011, 27, 162–171. [Google Scholar] [CrossRef]
- Hackney, C.; Darby, S.E.; Leyland, J. Modelling the response of soft cliffs to climate change: A statistical, process-response model using accumulated excess energy. Geomorphology 2013, 187, 108–121. [Google Scholar] [CrossRef]
- Young, A.P.; Guza, R.T.; Flick, R.E.; O’Reilly, W.C.; Gutierrez, R. Rain, waves, and short-term evolution of composite seacliffs in southern California. Mar. Geol. 2009, 267, 1–7. [Google Scholar] [CrossRef] [Green Version]
- Pierre, G.; Lahousse, P. The role of groundwater in cliff instability: An example at Cape Blanc-Nez (Pas-de-Calais, France). Earth Surf. Process. Landf. 2006, 31, 31–45. [Google Scholar] [CrossRef]
- Lantuit, H.; Overduin, P.P.; Wetterich, S. Recent progress regarding permafrost coasts. Permafr. Periglac. Process. 2013, 24, 120–130. [Google Scholar] [CrossRef]
- Emery, K.O.; Kuhn, G.G. Sea cliffs: Their processes, profiles, and classification. Geol. Soc. Am. Bull. 1982, 93, 644–654. [Google Scholar] [CrossRef]
- Bernatchez, P.; Dubois, J.-M.M. Bilan des connaissances de la dynamique de l’érosion des côtes du Québec maritime laurentien. Geogr. Phys. Quat. 2004, 58, 45–71. [Google Scholar] [CrossRef] [Green Version]
- Hapke, C.J.; Reid, D.; Richmond, B. Rates and trends of coastal change in california and the regional behavior of the beach and cliff system. J. Coast. Res. 2009, 25, 603–615. [Google Scholar] [CrossRef]
- Costa, S.; Maquaire, O.; Letortu, P.; Thirard, G.; Compain, V.; Roulland, T.; Medjkane, M.; Davidson, R.; Graff, K.; Lissak, C.; et al. Sedimentary Coastal Cliffs of Normandy: Modalities and Quantification of Retreat. J. Coast. Res. 2019, 88, 46–60. [Google Scholar] [CrossRef]
- Kline, S.W.; Adams, P.N.; Limber, P.W. The unsteady nature of sea cliff retreat due to mechanical abrasion, failure and comminution feedbacks. Geomorphology 2014, 219, 53–67. [Google Scholar] [CrossRef]
- Walkden, M.J.A.; Hall, J.W. A predictive Mesoscale model of the erosion and profile development of soft rock shores. Coast. Eng. 2005, 52, 535–563. [Google Scholar] [CrossRef]
- Barnhart, K.R.; Anderson, R.S.; Overeem, I.; Wobus, C.; Clow, G.D.; Urban, F.E. Modeling erosion of ice-rich permafrost bluffs along the Alaskan Beaufort Sea coast. J. Geophys. Res. Earth Surf. 2014, 119, 1155–1179. [Google Scholar] [CrossRef]
- Sinitsyn, A.O.; Guegan, E.; Shabanova, N.; Kokin, O.; Ogorodov, S. Fifty four years of coastal erosion and hydrometeorological parameters in the Varandey region, Barents Sea. Coast. Eng. 2020, 157, 103610. [Google Scholar] [CrossRef]
- Belova, N.G.; Novikova, A.V.; Günther, F.; Shabanova, N.N. Spatiotemporal variability of coastal retreat rates at western Yamal Peninsula, Russia, based on remotely sensed data. J. Coast. Res. 2020, 95, 367–371. [Google Scholar] [CrossRef]
- Castedo, R.; Murphy, W.; Lawrence, J.; Paredes, C. A new process-response coastal recession model of soft rock cliffs. Geomorphology 2012, 177–178, 128–143. [Google Scholar] [CrossRef]
- Walkden, M.J.; Hall, J.W. A Mesoscale Predictive Model of the Evolution and Management of a Soft-Rock Coast. J. Coast. Res. 2011, 27, 529–543. [Google Scholar] [CrossRef]
- Lantuit, H.; Atkinson, D.; Paul Overduin, P.; Grigoriev, M.; Rachold, V.; Grosse, G.; Hubberten, H.-W. Coastal erosion dynamics on the permafrost-dominated Bykovsky Peninsula, north Siberia, 1951–2006. Polar Res. 2011, 30, 7341. [Google Scholar] [CrossRef]
- Moses, C.; Robinson, D. Chalk coast dynamics: Implications for understanding rock coast evolution. Earth Sci. Rev. 2011, 109, 63–73. [Google Scholar] [CrossRef]
- Young, A.P.; Guza, R.T.; Matsumoto, H.; Merrifield, M.A.; O’Reilly, W.C.; Swirad, Z.M. Three years of weekly observations of coastal cliff erosion by waves and rainfall. Geomorphology 2021, 375, 107545. [Google Scholar] [CrossRef]
- Manson, G.K.; Solomon, S.M. Past and future forcing of Beaufort Sea coastal change. Atmos. Ocean 2007, 45, 107–122. [Google Scholar] [CrossRef]
- Lantuit, H.; Pollard, W.H. Fifty years of coastal erosion and retrogressive thaw slump activity on Herschel Island, southern Beaufort Sea, Yukon Territory, Canada. Geomorphology 2008, 95, 84–102. [Google Scholar] [CrossRef]
- Ramage, J.L.; Irrgang, A.M.; Herzschuh, U.; Morgenstern, A.; Couture, N.; Lantuit, H. Terrain controls on the occurrence of coastal retrogressive thaw slumps along the Yukon Coast, Canada. J. Geophys. Res. Earth Surf. 2017, 122, 1619–1634. [Google Scholar] [CrossRef]
- Berry, H.B.; Whalen, D.; Lim, M. Long-term ice-rich permafrost coast sensitivity to air temperatures and storm influence: Lessons from Pullen Island, Northwest Territories, Canada. Arct. Sci. 2021, 7, 723–745. [Google Scholar] [CrossRef]
- Barnhart, K.R.; Overeem, I.; Anderson, R.S. The effect of changing sea ice on the physical vulnerability of Arctic coasts. Cryosphere 2014, 8, 1777–1799. [Google Scholar] [CrossRef] [Green Version]
- Ogorodov, S.; Aleksyutina, D.; Baranskaya, A.; Shabanova, N.; Shilova, O. Coastal erosion of the Russian Arctic: An overview. J. Coast. Res. 2020, 95, 599–604. [Google Scholar] [CrossRef]
- Hoque, M.A.; Pollard, W.H. Arctic coastal retreat through block failure. Can. Geotech. J. 2009, 46, 1103–1115. [Google Scholar] [CrossRef]
- Günther, F.; Overduin, P.P.; Yakshina, I.A.; Opel, T.; Baranskaya, A.V.; Grigoriev, M.N. Observing Muostakh disappear: Permafrost thaw subsidence and erosion of a ground-ice-rich island in response to arctic summer warming and sea ice reduction. Cryosphere 2015, 9, 151–178. [Google Scholar] [CrossRef] [Green Version]
- Günther, F.; Overduin, P.P.; Sandakov, A.V.; Grosse, G.; Grigoriev, M.N. Short- and long-term thermo-erosion of ice-rich permafrost coasts in the Laptev Sea region. Biogeosciences 2013, 10, 4297–4318. [Google Scholar] [CrossRef] [Green Version]
- Jones, B.M.; Arp, C.D.; Jorgenson, M.T.; Hinkel, K.M.; Schmutz, J.A. Increase in the rate and uniformity of coastline erosion in Arctic Alaska. Geophys. Res. Lett. 2009, 36. [Google Scholar] [CrossRef]
- Jones, B.M.; Farquharson, L.M.; Baughman, C.A.; Buzard, R.M.; Arp, C.D.; Grosse, G.; Bull, D.L.; Gunther, F.; Nitze, I.; Urban, F.; et al. A decade of remotely sensed observations highlight complex processes linked to coastal permafrost bluff erosion in the Arctic. Environ. Res. Lett. 2018, 13, 115001. [Google Scholar] [CrossRef]
- Overeem, I.; Anderson, R.S.; Wobus, C.W.; Clow, G.D.; Urban, F.E.; Matell, N. Sea ice loss enhances wave action at the Arctic coast. Geophys. Res. Lett. 2011, 38. [Google Scholar] [CrossRef]
- Aleksyutina, D.; Novikova, A.; Baranskaya, A.; Shilova, O.; Ogorodov, S. Using multi-temporal aerial and space imagery for coastal dynamics investigations at Kara and Pechora Seas, Russian Arctic. In Proceedings of the 18th International Multidisciplinary Scientific GeoConference (SGEM 2018), Albena, Bulgaria, 2–8 July 2018; Volume 18, pp. 265–272. [Google Scholar] [CrossRef]
- Irrgang, A.M.; Lantuit, H.; Manson, G.K.; Günther, F.; Grosse, G.; Overduin, P.P. Variability in rates of coastal change along the Yukon coast, 1951 to 2015. J. Geophys. Res. Earth Surf. 2018, 123, 779–800. [Google Scholar] [CrossRef] [Green Version]
- Cunliffe, A.M.; Tanski, G.; Radosavljevic, B.; Palmer, W.F.; Sachs, T.; Lantuit, H.; Kirby, J.T.; Myers-Smith, I.H. Rapid retreat of permafrost coastline observed with aerial drone photogrammetry. Cryosphere 2019, 13, 1513–1528. [Google Scholar] [CrossRef] [Green Version]
- Roland, C.J.; Zoet, L.K.; Rawling III, J.E.; Cardiff, M. Seasonality in cold coast bluff erosion processes. Geomorphology 2021, 374, 107520. [Google Scholar] [CrossRef]
- Bernatchez, P.; Dubois, J.-M.M. Seasonal Quantification of Coastal Processes and Cliff Erosion on Fine Sediment Shorelines in a Cold Temperate Climate, North Shore of the St. Lawrence Maritime Estuary, Québec. J. Coast. Res. 2008, 24, 169–180. [Google Scholar] [CrossRef]
- Obu, J.; Lantuit, H.; Grosse, G.; Günther, F.; Sachs, T.; Helm, V.; Fritz, M. Coastal erosion and mass wasting along the Canadian Beaufort Sea based on annual airborne LiDAR elevation data. Geomorphology 2017, 293, 331–346. [Google Scholar] [CrossRef] [Green Version]
- Gibbs, A.E.; Nolan, M.; Richmond, B.M.; Snyder, A.G.; Erikson, L.H. Assessing patterns of annual change to permafrost bluffs along the North Slope coast of Alaska using high-resolution imagery and elevation models. Geomorphology 2019, 336, 152–164. [Google Scholar] [CrossRef]
- Lim, M.; Whalen, D.; Mann, P.; Fraser, P.; Berry, H.B.; Irish, C.; Cockney, K.; Woodward, J. Effective monitoring of permafrost coast erosion: Wide-scale storm impacts on outer islands in the Mackenzie Delta area. Front. Earth Sci. 2020, 8. [Google Scholar] [CrossRef]
- Joyal, G.; Lajeunesse, P.; Morissette, A.; Bernatchez, P. Influence of lithostratigraphy on the retreat of an unconsolidated sedimentary coastal cliff (St. Lawrence estuary, eastern Canada). Earth Surf. Process. Landf. 2016, 41, 1055–1072. [Google Scholar] [CrossRef]
- Lantuit, H.; Overduin, P.P.; Couture, N.; Wetterich, S.; Aré, F.; Atkinson, D.; Brown, J.; Cherkashov, G.; Drozdov, D.; Forbes, D.L.; et al. The Arctic coastal dynamics database: A new classification scheme and statistics on Arctic permafrost coastlines. Estuaries Coasts 2012, 35, 383–400. [Google Scholar] [CrossRef] [Green Version]
- Hoque, M.A.; Pollard, W.H. Stability of permafrost dominated coastal cliffs in the Arctic. Polar Sci. 2016, 10, 79–88. [Google Scholar] [CrossRef]
- Quinn, J.D.; Rosser, N.J.; Murphy, W.; Lawrence, J.A. Identifying the behavioural characteristics of clay cliffs using intensive monitoring and geotechnical numerical modelling. Geomorphology 2010, 120, 107–122. [Google Scholar] [CrossRef]
- Vasiliev, A.; Kanevskiy, M.; Cherkashov, G.; Vanshtein, B. Coastal dynamics at the Barents and Kara Sea key sites. Geo-Mar. Lett. 2005, 25, 110–120. [Google Scholar] [CrossRef] [Green Version]
- Zwissler, B.; Oommen, T.; Vitton, S. A study of the impacts of freeze–thaw on cliff recession at the Calvert Cliffs in Calvert County, Maryland. Geotech. Geol. Eng. 2014, 32, 1133–1148. [Google Scholar] [CrossRef] [Green Version]
- Kaczmarek, H.; Tyszkowski, S.; Bartczak, A.; Kramkowski, M.; Wasak, K. The role of freeze-thaw action in dam reservoir cliff degradation assessed by terrestrial laser scanning: A case study of Jeziorsko Reservoir (central Poland). Sci. Total Environ. 2019, 690, 1140–1150. [Google Scholar] [CrossRef]
- Bogatova, D.; Buldovich, S.; Khilimonyuk, V. Snow Patches and Their Influence on Coastal Erosion at Baydaratskaya Bay Coast, Kara Sea, Russian Arctic. Water 2021, 13, 1432. [Google Scholar] [CrossRef]
- Baranskaya, A.; Novikova, A.; Shabanova, N.; Belova, N.; Maznev, S.; Ogorodov, S.; Jones, B.M. The role of thermal denudation in erosion of ice-rich permafrost coasts in an enclosed bay (Gulf of Kruzenstern, western Yamal, Russia). Front. Earth Sci. 2021, 8, 659. [Google Scholar] [CrossRef]
- Korte, S.; Gieschen, R.; Stolle, J.; Goseberg, N. Physical Modelling of Arctic Coastlines—Progress and Limitations. Water 2020, 12, 2254. [Google Scholar] [CrossRef]
- Kobayashi, N.; Vidrine, J.C.; Nairn, R.B.; Soloman, S.M. Erosion of frozen cliffs due to storm surge on Beaufort Sea Coast. J. Coast. Res. 1999, 15, 332–344. [Google Scholar]
- Islam, M.A.; Lubbad, R.; Afzal, M.S. A Probabilistic Model of Coastal Bluff-Top Erosion in High Latitudes Due to Thermoabrasion: A Case Study from Baydaratskaya Bay in the Kara Sea. J. Mar. Sci. Eng. 2020, 8, 169. [Google Scholar] [CrossRef] [Green Version]
- Boucher-Brossard, G.; Bernatchez, P.; Corriveau, M.; Jolivet, Y. Calculating lateral frost front penetration in a rapidly retreating cliff of fine sediments. Permafr. Periglac. Process. 2017, 28, 32–41. [Google Scholar] [CrossRef]
- Boucher-Brossard, G. Rythme et Modes de Recul des Falaises à Sommet Tourbeux de la Côte-Nord de l’estuaire Maritime et du Golfe du Saint-Laurent. Master’s Thesis, Université du Québec à Rimouski, Rimouski, QC, Canada, 2012. [Google Scholar]
- Dubois, J.-M.M. Environnements Quaternaires et Évolution Post-Glaciaire d’une Zone Côtière en Émersion en Bordure Sud du Bouclier Canadien: La Moyenne Côte-Nord du Saint-Laurent, Québec. Ph.D. Thesis, University of Ottawa, Ottawa, ON, Canada, 1979. [Google Scholar]
- Dubois, J.-M.M.; Martel, Y.A.; Côté, D.; Nadeau, L. Les ortsteins du Québec: Répartition géographique, relations géomorphologiques et essai de datation. Géographe Can. 1990, 34, 303–317. [Google Scholar] [CrossRef]
- Dubois, J.-M.M.; et St-Pierre, L. Cartes des Matériaux D’emprunt et des Zones de Risques sur la Moyenne-Côte-Nord du Saint-Laurent; Université de Sherbrooke: Sherbrooke, QC, Canada, 1986. [Google Scholar]
- Ross, N.; Long, B. Évolution morphosédimentaire de la barre de déferlement: Un exemple dans le golfe du Saint-Laurent, Québec. Geogr. Phys. Quat. 1989, 43, 377–388. [Google Scholar] [CrossRef] [Green Version]
- Fisheries and Oceans Canada Tides, Currents and Water Levels. Available online: http://www.niveauxdeau.gc.ca/fra/accueil (accessed on 14 November 2021).
- Han, G.; Ma, Z.; Chen, N.; Thomson, R.; Slangen, A. Changes in mean relative sea level around Canada in the twentieth and twenty-first centuries. Atmos. Ocean 2015, 53, 452–463. [Google Scholar] [CrossRef]
- Peel, M.C.; Finlayson, B.L.; McMahon, T.A. Updated world map of the Köppen-Geiger climate classification. Hydrol. Earth Syst. Sci. 2007, 11, 1633–1644. [Google Scholar] [CrossRef] [Green Version]
- Environment Canada Climate. Available online: http://www.climat.meteo.gc.ca/index_f.html (accessed on 12 May 2013).
- Thieler, E.R.; Martin, D.; Ergul, A. Digital Shoreline Analysis System (DSAS) version 2.0: An ArcView Extension for Calculating Shoreline Change; USGS Open-File Report 2003-76; U.S. Geological Survey: Reston, VA, USA, 2003.
- Fletcher, C.; Rooney, J.; Limt, M.B.S.; Richmond, B. Mapping Shoreline Change Using Digital Orthophotogrammetry on Maui, Hawaii. J. Coast. Res. 2003, 38, 106–124. [Google Scholar]
- Gorokhovich, Y.; Leiserowiz, A. Historical and Future Coastal Changes in Northwest Alaska. J. Coast. Res. 2012, 28, 174–186. [Google Scholar] [CrossRef]
- Morton, R.A.; Miller, T.L. National Assessment Of Shoreline Change: Part 2, Historical Shoreline Changes and Associated Coastal Land Loss along The U.S. Southeast Atlantic Coast; Open-File Report 2005-1401; US Geological Survey: Reston, VA, USA, 2005. [CrossRef]
- Mckee, T.B.; Doesken, N.J.; Kleist, J. The relationship of drought frequency and duration to time scales. In Proceedings of the Eight Conference on Applied Climatology, Anaheim, CA, USA, 17–22 January 1993; pp. 179–184. [Google Scholar]
- Berggren, W.P. Prediction of temperature distribution in frozen soils. Eos Trans. AGU 1943, 24, 71–77. [Google Scholar] [CrossRef]
- Aldrich, H.P.; Paynter, H.M. Analytical Studies of Freezing and Thawing of Soils; Technical Report No. 42; Arctic Construction and Frost Effects Laboratory: Boston, MA, USA, 1953. [Google Scholar]
- Tolman, H.L.; WAVEWATCH III Development Group. User Manual and System Documentation of WAVEWATCH III Version 4.18; Technical Note; Environmental Modeling Center, National Centers for Environmental Prediction, National Weather Service, National Oceanic and Atmospheric Administration, U.S. Department of Commerce: College Park, MD, USA, 2014. [Google Scholar]
- Bernatchez, P.; Lambert, A.; Bismuth, E.; Didier, D.; Senneville, S.; Dumont, D.; Caveen, J.; Sévigny, C.; Beaudry, J.; Bandet, M. Programme de Mesure et de Modélisation de la Morphodynamique de l’Erosion et de la Submersion Côtière dans l’Estuaire et Le Golfe du Saint-Laurent (MoDESCo), Phase II: Rapport Final; Rapport Remis au Ministère de la Sécurité Publique du Québec; Chaire de Recherche en Géoscience Côtière, Laboratoire de Dynamique et de Gestion Intégrée des Zones Côtières, Université du Québec à Rimouski: Rimouski, QC, Canada, 2017; 172p. [Google Scholar]
- Bandet, M.; Caulet, C.; Baudry, J.; Didier, D.; Dubuc, D.; Marion, N.; McKinnon, R.; Paul-Hus, C.; Caveen, J.; Sévigny, C.; et al. Programme de Mesure et de Modélisation de la Morphodynamique de l’Érosion et de la Submersion Côtière dans l’Estuaire et le Golfe du SaintLaurent (MoDESCo), Phase III: Rapport Final; Rapport Remis au Ministère de la Sécurité Publique du Québec; Chaire de Recherche en Géoscience Côtière, Laboratoire de Dynamique et de Gestion Intégrée des Zones Côtières, Université du Québec à Rimouski: Rimouski, QC, Canada, 2020; 259p. [Google Scholar]
- Masselink, G.; Scott, T.; Poate, T.; Russell, P.; Davidson, M.; Conley, D. The extreme 2013/2014 winter storms: Hydrodynamic forcing and coastal response along the southwest coast of England. Earth Surf. Process. Landf. 2016, 41, 378–391. [Google Scholar] [CrossRef] [Green Version]
- Bernatchez, P.; Boucher-Brossard, G.; Corriveau, M.; Jolivet, Y. Impacts des Changements Climatiques sur l’Erosion des Falaises de l’Estuaire Maritime et du Golfe du Saint-Laurent; Rapport de Recherche Remis au Ministère de la Sécurité Publique du Québec et au Consortium Ouranos; Chaire de Recherche en Géoscience Côtière, Laboratoire de Dynamique et de Gestion Intégrée des Zones Côtières, Université du Québec à Rimouski: Rimouski, QC, Canada, 2014; 166p. [Google Scholar]
- Bernatchez, P.; Jolivet, Y.; Corriveau, M. Development of an automated method for continuous detection and quantification of cliff erosion events. Earth Surf. Process. Landf. 2011, 36, 347–362. [Google Scholar] [CrossRef]
- Matsuoka, N.; Hirakawa, K.; Watanabe, T.; Haeberli, W.; Keller, F. The role of diurnal, annual and millenial freeze-thaw cycles in controlling alpine slope instability. In Proceedings of the Permafrost Seventh International Conference, Yellowknife, NWT, Canada, 23–27 June 1998; Volume 55, pp. 711–717. [Google Scholar]
- Andersland, O.B.; Ladanyi, B. Frozen Ground Engineering, 2nd ed.; Wiley: Hoboken, NJ, USA, 2003; ISBN 978-0-471-61549-1. [Google Scholar]
- Couper, P. Effects of silt–clay content on the susceptibility of river banks to subaerial erosion. Geomorphology 2003, 56, 95–108. [Google Scholar] [CrossRef]
- Harris, C.; Gallop, M.; Coutard, J.-P. Physical modelling of gelifluction and frost creep: Some results of a large-scale laboratory experiment. Earth Surf. Process. Landf. 1993, 18, 383–398. [Google Scholar] [CrossRef]
- Gunzburger, Y.; Merrien-Soukatchoff, V. Near-surface temperatures and heat balance of bare outcrops exposed to solar radiation. Earth Surf. Process. Landf. 2011, 36, 1577–1589. [Google Scholar] [CrossRef]
- Zhu, L.; Wang, J.; Li, B. The impact of solar radiation upon rock weathering at low temperature: A laboratory study. Permafr. Periglac. Process. 2003, 14, 61–67. [Google Scholar] [CrossRef]
- Hall, K. Evidence for freeze-thaw events and their implications for rock weathering in northern Canada. Earth Surf. Process. Landf. 2004, 29, 43–57. [Google Scholar] [CrossRef]
- Ødegård, R.S.; Sollid, J.L. Coastal cliff temperatures related to the potential for cryogenic weathering processes, western Spitsbergen, Svalbard. Polar Res. 1993, 12, 95–106. [Google Scholar] [CrossRef]
- Matsuoka, N. Diurnal freeze–thaw depth in rockwalls: Field measurements and theoretical considerations. Earth Surf. Process. Landf. 1994, 19, 423–435. [Google Scholar] [CrossRef]
- Matsumoto, H.; Yamada, S.; Hirakawa, K. Relationship between ground ice and solifluction: Field measurements in the Daisetsu Mountains, northern Japan. Permafr. Periglac. Process. 2010, 21, 78–89. [Google Scholar] [CrossRef]
- Lewkowicz, A.G. Rate of short-term ablation of exposed ground ice, Banks Island, Northwest Territories, Canada. J. Glaciol. 1986, 32, 511–519. [Google Scholar] [CrossRef] [Green Version]
- Matsuoka, N.; Sakai, H. Rockfall activity from an alpine cliff during thawing periods. Geomorphology 1999, 28, 309–328. [Google Scholar] [CrossRef]
- Harris, C.; Kern-Luetschg, M.; Murton, J.; Font, M.; Davies, M.; Smith, F. Solifluction processes on permafrost and non-permafrost slopes: Results of a large-scale laboratory simulation. Permafr. Periglac. Process. 2008, 19, 359–378. [Google Scholar] [CrossRef]
- Wilcock, P.R.; Miller, D.S.; Shea, R.H.; Kerkin, R.T. Frequency of effective wave activity and the recession of coastal bluffs: Calvert Cliffs, Maryland. J. Coast. Res. 1998, 14, 256–268. [Google Scholar]
- Thomas, J.T.; Iverson, N.R.; Burkart, M.R. Bank-collapse processes in a valley-bottom gully, western Iowa. Earth Surf. Process. Landf. 2009, 34, 109–122. [Google Scholar] [CrossRef]
- Are, F.E. Thermal abrasion of sea coasts. Polar Geogr. Geol. 1988, 12, 157. [Google Scholar] [CrossRef]
- Greenwood, R.O.; Orford, J.D. Temporal patterns and processes of retreat of drumlin coastal cliffs—Strangford Lough, Northern Ireland. Geomorphology 2008, 94, 153–169. [Google Scholar] [CrossRef]
- Crosta, G.; Di Prisco, C. On slope instability induced by seepage erosion. Can. Geotech. J. 1999, 36, 1056–1073. [Google Scholar] [CrossRef]
- Brooks, S.M.; Spencer, T.; Boreham, S. Deriving mechanisms and thresholds for cliff retreat in soft-rock cliffs under changing climates: Rapidly retreating cliffs of the Suffolk coast, UK. Geomorphology 2012, 153-154, 48–60. [Google Scholar] [CrossRef]
- Collins, B.D.; Sitar, N. Processes of coastal bluff erosion in weakly lithified sands, Pacifica, California, USA. Geomorphology 2008, 97, 483–501. [Google Scholar] [CrossRef]
- Jaiswal, P.; van Westen, C.J. Estimating temporal probability for landslide initiation along transportation routes based on rainfall thresholds. Geomorphology 2009, 112, 96–105. [Google Scholar] [CrossRef]
- Gaskin, S.J.; Pieterse, J.; Shafie, A.A.; Lepage, S. Erosion of undisturbed clay samples from the banks of the St. Lawrence River. Can. J. Civ. Eng. 2003, 30, 585–595. [Google Scholar] [CrossRef] [Green Version]
- Dawson, S.A.; Evans, J.E. Geological Causes of Local Variation in Coastal Bluff Recession Rates, Northeast Ohio Shoreline of Lake Erie. Environ. Geosci. 2001, 8, 1–10. [Google Scholar] [CrossRef]
- Jones, J.R.; Cameron, B.; Fisher, J.J.; Island, T.; Cameront, B.; Fishert, J.J. Analysis of Cliff Retreat and Shoreline Erosion: Thompson Island, Massachusetts, U.S.A. J. Coast. Res. 1993, 9, 87–96. [Google Scholar]
- Manson, G.K. Subannual erosion and retreat of cohesive till bluff’s, McNab’s Island, Nova Scotia. J. Coast. Res. 2002, 18, 421–432. [Google Scholar]
- Carpenter, N.E.; Dickson, M.E.; Walkden, M.J.A.; Nicholls, R.J.; Powrie, W. Effects of varied lithology on soft-cliff recession rates. Mar. Geol. 2014, 354, 40–52. [Google Scholar] [CrossRef]
- Greenwood, R.O.; Orford, J.D. Factors controlling the retreat of drumlin coastal cliffs in a low energy marine environment—Strangford Lough, Northern Ireland. J. Coast. Res. 2007, 23, 285–297. [Google Scholar] [CrossRef]
- Gubar’Kov, A.A.; Leibman, M.O.; Mel’Nikov, V.P.; Khomutov, A.V. Contribution of lateral thermoerosion and thermal denudation to coastal retreat of the Yugorskii Peninsula. In Doklady Earth Sciences; Springer Nature AG: Switzerland, 2008; Volume 423, p. 1452. Available online: https://www.proquest.com/openview/4bb0d8f33567b96e548251c3faf4f893/1?pq-origsite=gscholar&cbl=54876 (accessed on 15 July 2021). [CrossRef]
- Oliva, M.; Ortiz, A.G.; Franch, F.S.; Catarineu, M.S. Present-day solifluction processes in the semi-arid range of Sierra Nevada (Spain). Arct. Antarct. Alp. Res. 2014, 46, 365–370. [Google Scholar] [CrossRef] [Green Version]
- Quinn, J.D.; Philip, L.K.; Murphy, W. Understanding the recession of the Holderness Coast, east Yorkshire, UK: A new presentation of temporal and spatial patterns. Q. J. Eng. Geol. Hydrogeol. 2009, 42, 165–178. [Google Scholar] [CrossRef]
- Lee, E.M.; Meadowcroft, I.C.; Hall, J.W.; Walkden, M.J. Coastal landslide activity: A probabilistic simulation model. Bull. Eng. Geol. Environ. 2002, 61, 347–355. [Google Scholar] [CrossRef]
- Are, F.; Reimnitz, E.; Grigoriev, M.; Hubberten, H.W.; Rachold, V. The influence of cryogenic processes on the erosional Arctic shoreface. J. Coast. Res. 2008, 24, 110–121. [Google Scholar] [CrossRef]
- Sessford, E.G.; Bæverford, M.G.; Hormes, A. Terrestrial processes affecting unlithified coastal erosion disparities in central fjords of Svalbard. Polar Res. 2015, 34, 24122. [Google Scholar] [CrossRef] [Green Version]
- Ping, C.L.; Michaelson, G.J.; Guo, L.; Jorgenson, M.T.; Kanevskiy, M.; Shur, Y.; Dou, F.; Liang, J. Soil carbon and material fluxes across the eroding Alaska Beaufort Sea coastline. J. Geophys. Res. 2011, 116. [Google Scholar] [CrossRef]
- Obu, J.; Lantuit, H.; Fritz, M.; Pollard, W.H.; Sachs, T.; Günther, F. Relation between planimetric and volumetric measurements of permafrost coast erosion: A case study from Herschel Island, western Canadian Arctic. Polar Res. 2016, 35, 30313. [Google Scholar] [CrossRef] [Green Version]
- Farquharson, L.M.; Mann, D.H.; Swanson, D.K.; Jones, B.M.; Buzard, R.M.; Jordan, J.W. Temporal and spatial variability in coastline response to declining sea-ice in northwest Alaska. Mar. Geol. 2018, 404, 71–83. [Google Scholar] [CrossRef]
- Brown, J.; Jorgenson, M.T.; Smith, O.P.; Lee, W. Long-term rates of coastal erosion and carbon input, Elson Lagoon, Barrow, Alaska. In Proceedings of the Eighth International Conference on Permafrost, Zurich, Switzerland, 21–25 July 2003; Volume 21, p. 25, ISBN 90 5809 582 7. [Google Scholar]
- Belova, N.G.; Shabanova, N.N.; Ogorodov, S.A.; Kamalov, A.M.; Kuznetsov, D.E.; Baranskaya, A.V.; Novikova, A.V. Erosion of permafrost coasts of Kara Sea near Kharasavey Cape, Western Yamal. Earth’s Cryosphere 2017, 21, 73–83. [Google Scholar] [CrossRef] [Green Version]
- Grigoriev, M.N.; Razumov, S.O.; Kunitzkiy, V.V.; Spektor, V.B. Dynamics of the Russian East Arctic Sea coast: Major factors, regularities and tendencies. Earth’s Cryosphere 2006, 10, 74–94. [Google Scholar]
- Corriveau, M.; Bernatchez, P.; Dugas, S. Mise à Jour de la Cartographie des Marges de Sécurité en Erosion Côtière pour le Secteur de Gallix, Municipalité de Sept-Îles: Analyse de l’Evolution Côtière et de la Dynamique; Rapport Remis au Ministère de la Sécurité Publique du Québec; Chaire de Recherche en Géoscience Côtière, Laboratoire de Dynamique et de Gestion Intégrée des Zones Côtières, Université du Québec à Rimouski: Rimouski, QC, Canada, 2019; 108p. [Google Scholar]


| Camera | Latitude | Longitude | Direction View | Recording Start | Recording End | Recording Interval | Zone |
|---|---|---|---|---|---|---|---|
| CAM1 | 50.292749 | −64.362216 | East | 13 December 2009 | 13 October 2010 | 30 or 60 min | A |
| CAM2 | 50.291934 | −64.360167 | West | 12 November 2011 | 14 February 2013 | 15 min | B |
| CAM3 | 50.292672 | −64.362304 | East | 5 December 2008 | 5 May 2009 | 60 min | A |
| CAM4 | 50.292749 | −64.362216 | West | 5 December 2008 | 5 May 2009 | 60 min | A |
| CAM5 | 50.290992 | −64.357863 | East | 5 December 2008 | 5 May 2009 | 60 min | C |
| CAM6 | 50.286975 | −64.347768 | West | 5 December 2008 | 5 May 2009 | 60 min | D |
| Zone | Mean Height (m) | Mean Beach Width (m) | Unit Thickness and Relative Percentage Occupied in the Cliff | |||
|---|---|---|---|---|---|---|
| Silt–Clay Unit | Sandy Unit | Orstein Unit | Peat Unit | |||
| A | 4.4 | 25 | 1.54 (35%) | 1.7 (40%) | 0.2 (5%) | 0.9 (20%) |
| B | 6.0 | 10 | 2.4 (40%) | 2.4 (40%) | 0.6 (10%) | 0.6 (10%) |
| C | 6.2 | 10 | 5.3 (85%) | 0.6 (10%) | 0 (0%) | 0.3 (5%) |
| D | 11.2 | 15 | 7.3 (65%) | 2.2 (20%) | 0.6 (5%) | 1.1 (10%) |
| A. Identification | B. Winter Conditions | C. Hydrogeologic Conditions |
| 1. Camera number | 1. Cliff snow cover (%) | 1. Surface runoff (Y/N) |
| 2. Disponibility (Y/N) | 2. Ice-foot presence (Ordinal) | 2. Number of resurgences (Quantitative) |
| 3. Date | 3. Ice at peat–orstein junction (Y/N) | 3. Resurgences intensity (Ordinal) |
| 4. Hour (if erosion) | 4. Ice at sand–silt junction (Y/N) | 4. Snow melting (Y/N) |
| 5. General comments | 5. Ice on cliff sediment surface (Y/N) | 5. Visible desiccation signs (Y/N) |
| 6. Visible melting signs (Y/N) | ||
| D. Erosion | E. Processes by unit | F. Environmental factors |
| 1. Cliff-top retreat (Y/N) | 1. Silt–clay (Qualitative, nominal) | 1. Storm waves (Y/N) |
| 2. Cliff-face retreat (Y/N) | 2. Sand (Qualitative, nominal) | 2. Spring tides (Y/N) |
| 3. Beach erosion (Y/N) | 3. Orstein (Qualitative, nominal) | 3. Heavy rainfall (Y/N) |
| 4. Beach accretion (Y/N) | 4. Peat (Qualitative, nominal) | 4. Rainfall (Y/N) |
| 5. Beach recovery by sea (%) | 5. Solar radiation (Y/N) | |
| 6. Water level relative to cliff height (%) | 6. Rainfall–sunshine alternation (Y/N) | |
| 7. Observed (Y/N → night) | 7. Inland snow melting (Y/N) | |
| 8. Gravity (Y/N) |
| A. Temperature (T°) | B. Precipitations | C. Other |
|---|---|---|
| 1. Thawing degree days | 1. Rainy precipitation | 1. Speed of maximal gust |
| 2. Sum of thawing degree days (the four prior days + the current day) | 2. Sum of rainy precipitation (the four prior days + the current day) | 2. Direction of maximal gust |
| 3. Freezing degree days | 3. Maximal rainy precipitation in 24 h (in the four prior days + the current day) | 3. Theoretical frost front depth 2 |
| 4. Sum of freezing degree days (the four prior days + the current day) | 4. Mixed precipitation (must contain liquid precipitations) | 4. Maximal global solar radiation |
| 5. Cumulated freezing degree days since 1 October | 5. Sum of mixed precipitation (the four prior days + the current day) | |
| 6. T° min | 6. Maximal mixed precipitation in 24 h (the four prior days + the current day) | |
| 7. T° moy | 7. Standardized precipitation index 1 (7 days) | |
| 8. T° max | 8. Standardized precipitation index 1 (14 days) | |
| 9. Daily amplitude of T° | 9. Standardized precipitation index 1 (1 month) | |
| 10. Direction (warming or cooling) | ||
| 11. Positive–negative T° passage (Y/N) | ||
| 12. Sum of positive–negative T° passage (4 last days + current day) |
Publisher’s Note: MDPI stays neutral with regard to jurisdictional claims in published maps and institutional affiliations. |
© 2021 by the authors. Licensee MDPI, Basel, Switzerland. This article is an open access article distributed under the terms and conditions of the Creative Commons Attribution (CC BY) license (https://creativecommons.org/licenses/by/4.0/).
Share and Cite
Bernatchez, P.; Boucher-Brossard, G.; Corriveau, M.; Caulet, C.; Barnett, R.L. Long-Term Evolution and Monitoring at High Temporal Resolution of a Rapidly Retreating Cliff in a Cold Temperate Climate Affected by Cryogenic Processes, North Shore of the St. Lawrence Gulf, Quebec (Canada). J. Mar. Sci. Eng. 2021, 9, 1418. https://doi.org/10.3390/jmse9121418
Bernatchez P, Boucher-Brossard G, Corriveau M, Caulet C, Barnett RL. Long-Term Evolution and Monitoring at High Temporal Resolution of a Rapidly Retreating Cliff in a Cold Temperate Climate Affected by Cryogenic Processes, North Shore of the St. Lawrence Gulf, Quebec (Canada). Journal of Marine Science and Engineering. 2021; 9(12):1418. https://doi.org/10.3390/jmse9121418
Chicago/Turabian StyleBernatchez, Pascal, Geneviève Boucher-Brossard, Maude Corriveau, Charles Caulet, and Robert L. Barnett. 2021. "Long-Term Evolution and Monitoring at High Temporal Resolution of a Rapidly Retreating Cliff in a Cold Temperate Climate Affected by Cryogenic Processes, North Shore of the St. Lawrence Gulf, Quebec (Canada)" Journal of Marine Science and Engineering 9, no. 12: 1418. https://doi.org/10.3390/jmse9121418