Article

Bathymetric Data Requirements for Operational Coastal Erosion Forecasting Using XBeach

Water Research Laboratory, School of Civil and Environmental Engineering, UNSW Sydney, Sydney, NSW 2093, Australia
*
Author to whom correspondence should be addressed.
J. Mar. Sci. Eng. 2021, 9(10), 1053; https://doi.org/10.3390/jmse9101053
Submission received: 25 August 2021 / Revised: 18 September 2021 / Accepted: 20 September 2021 / Published: 24 September 2021
(This article belongs to the Special Issue Monitoring and Modelling of Coastal Environment)

Abstract

:
There is an increasing interest in the broad-scale implementation of coastal erosion early warning systems (EWS) with the goal of enhancing community preparedness to extreme coastal storm wave events. These emerging systems typically rely on process-based models to predict the storm-induced morphological change. A key challenge with incorporating these models in EWSs is the need for up-to-date nearshore and surf zone bathymetry data, which is difficult to measure routinely, but potentially important for accurate erosion forecasting. This study evaluates the degree to which up-to-date bathymetry is required for accurate coastal erosion predictions using the morphodynamic model XBeach and, subsequently, whether a range of “representative” and/or “synthetic” bathymetries can be used for the bottom boundary, when a survey of the immediate pre-storm bathymetry is not available. Twelve storm events at two contrasting sites were modelled using six different bathymetry scenarios, including the expected “best case” bathymetry surveyed immediately pre-storm. These results indicate that alternative bathymetries can be used to obtain sub-aerial erosion predictions that are similar (and in some cases better) than those resulting from the use of an immediately pre-storm surveyed bathymetry, provided that rigorous model calibration is undertaken prior. This generalized finding is attributed to specific parametrizations in the XBeach model structure that are optimized during the calibration process to match the particular bottom boundary condition used. This study provides practical guidance for the selection of suitable nearshore bathymetry for use in operational coastal erosion EWSs.

1. Introduction

Coastal hazard early warning systems (EWS) are an evolving disaster risk reduction tool that can provide information several days in advance of an impending storm, potentially providing a “window of opportunity” to implement a range of emergency responses. These systems typically incorporate coastal numerical models within their workflow to simulate nearshore hydrodynamic and morphodynamic processes, with the goal of predicting the location and magnitude of coastal flooding and erosion along coastlines [1,2,3,4,5]. The resulting coastal hazard predictions are subsequently applied in a decision support module, triggering emergency managers to undertake an escalating series of actions depending on the level of coastal risk that is forecasted [6].
Prototype and operational EWSs have to date focused primarily on the coastal flooding component of coastal hazards (e.g., [7]), which is typically determined by the landward extent of the time-varying “total water level” (comprising wave run-up, storm surge and tides). Forecasting coastal erosion, where the hazard is caused by rapid morphological change induced by the storm (most notably on the sub-aerial beach and dune), is an emerging area of disaster risk-reduction research. Coastal erosion hazards are particularly relevant along wave-dominated, sandy coastlines [8], and the dynamic nature of these nearshore systems may result in additional forecasting challenges.
Nearshore and surf zone bathymetry is a key bottom boundary condition required by many coastal process-based numerical models. Previous work by Splinter and Palmsten [9] using XBeach [10] showed that model performance is sensitive to the choice of initial bathymetry when modelling storm impacts. Consequently, immediately pre-storm surveyed bathymetry is considered as the ideal dataset to use, providing the most up-to-date, accurate representation of the nearshore and surf zone at the time of storm impact. However, within the context of an operational coastal erosion EWS, repeatedly surveying the initial bathymetry at short notice when a storm is approaching is a logistically impractical task that is simply not feasible at most sites. Consequently, a range of more pragmatic approaches can be implemented. These include: (1) using a prior “one-off” beach survey, often collected several months or years prior; (2) incorporating real-time data assimilation using remote-sensing techniques such as video or satellites (e.g., [11,12]); or (3) adopting a time-invariant “representative” or “synthetic” bathymetry that is specific to the site of interest. In the context of operational early warning, the use of this third time-invariant approach is an appealing concept, as it requires neither updating the bathymetry provided to the model (i.e., removing the need for ongoing and/or rapid-response surveying) nor the installation of dedicated remote-sensing infrastructure.
The aim of this study is to evaluate the degree to which reliable predictions of the eroded sub-aerial beach and dune can be obtained using a range of possible time-invariant synthetic and/or representative nearshore and surf zone bathymetries. This is evaluated using the process-based coastal numerical model XBeach [10] to simulate a range of observed storm wave events at two contrasting sites in Australia and the USA, where detailed bathymetry data (including immediately pre-storm surveys) are available. The results of this analysis provide practical guidance on the selection of initial bottom boundary conditions for XBeach erosion forecasting when immediately pre-storm surveyed bathymetry is unavailable. This is particularly pertinent for coastal erosion early warning systems where the timely but skillful prediction of coastal erosion is of the utmost importance.

2. Materials and Methods

2.1. Study Sites

Two contrasting sites (Narrabeen-Collaroy Beach, Australia and Duck, USA) were selected for this study, where high-resolution immediate pre- and post-storm topography and bathymetry surveys are available through on-going long-term beach monitoring programs. The first study site, Narrabeen-Collaroy Beach (hereafter referred to as Narrabeen), is a 3.6 km embayed beach located in Sydney, southeast Australia (Figure 1a). The site experiences a moderate to high energy wave climate (Hsig ≅ 1.6 m, Tp ≅ 10 s) that is dominated by south to south-easterly swell waves and semidiurnal tides with a mean spring tidal range of 1.3 m. Storms at this site are locally characterized as events with a deep-water significant wave height greater than 3 m. The storm wave direction varies from northeast through to south depending on the source: tropical cyclones; east-coast lows; or intensified mid-latitude cyclones.
In this study, the XBeach numerical model was used in phase-averaged (surfbeat), profile (1DH) mode at the cross-shore transect (PF4) shown in Figure 1a, located at the center of the Narrabeen embayment. This regularly surveyed transect has a relatively steep beach face slope (~0.1 between the 0 m and 1.2 m elevation contours) and upper shoreface (~0.04 between the −10 m depth and 0 m contours), and the morphological beach state is typically intermediate, as defined by Wright and Short [13]. As the location of this profile is the pivot point of beach rotation between the embayment extremities at Narrabeen [14], it is well established that cross-shore processes dominate on the timescale of individual storm events at this location. Storm-induced profile changes in the sub-aerial beach (i.e., beach face, berm, and dune) at PF4 are generally a result of berm erosion below the 3 m elevation contour, which can result in a reduction in beach width by up to 60 m. In contrast, the vegetated dune (above ~3 m) has remained relatively unchanged over the past 15 years. A detailed description of this study site and its extensive monitoring program is described in Turner et al. [15].
The second study site, located at the US Army Corp’s of Engineers Field Research Facility in Duck, North Carolina, is shown in Figure 1b. This site (hereafter referred to as Duck) is situated along a 100 km long section of barrier island on the east coast of the USA. Duck experiences a more moderate wave climate compared to Narrabeen (Hsig ≅ 0.95 m, Tp ≅ 8.7 s) with offshore waves predominately from the east. The tides are microtidal and semidiurnal with a mean spring tidal range of approximately 1.1 m. Storm wave conditions are locally defined by a smaller deep-water Hsig threshold of 2 m. Storm waves at Duck can originate from tropical cyclones (hurricanes) and mid-latitude cyclones (Nor’easters). The dominance of hurricanes as well as the wide continental shelf at Duck (compared to Narrabeen) typically results in higher storm surges at this site compared to Narrabeen.
XBeach numerical modelling at Duck was carried out at a representative cross-shore transect, coinciding with the location of ongoing high-resolution topographic data collection by a continuously scanning fixed LiDAR [16] as well as regular surf zone and nearshore bathymetric surveying. This location is typically characterized by an intermediate beach state with an offshore sand bar. Both the beach face and upper shoreface slope of this location have a gentler gradient (~0.06 and ~0.009, respectively) compared to Narrabeen, with a less well-defined berm. The sub-aerial beach width is also less variable, with the mean high high water level (MHHWL) contour (0.6 m elevation contour) varying by ~40 m spanning the 10 year survey period 2009–2019. Much of the profile variability at Duck is observed in the surf zone and is associated with the cross-shore migration of sand bars [17].

2.2. Representative and Synthetic Pre-Storm Bathymetries

A total of six different approaches to represent the initial surf zone and nearshore bottom boundary conditions were explored at both Narrabeen and Duck. As described below, these comprise three “representative” bathymetries based on the availability of extensive historical survey data at both sites, two “synthetic” bathymetries based on equilibrium beach profile theory, and one immediately pre-storm surveyed bathymetry.

2.2.1. Pre-Storm Surveyed Bathymetry

This bathymetry represents what can be anticipated to be the “best case”, whereby an in situ survey completed shortly prior to each individual storm is used as the initial bottom boundary condition for XBeach modelling. At Narrabeen, these pre-storm surf zone and nearshore surveys were carried out using a single-beam echo sounder mounted on a jet-ski (refer [15]). At Duck, the pre-storm bathymetry was extracted from a surface created by combining the approximate monthly surf zone and nearshore surveys with an available regional dataset [18] to create a seamless bathymetry that extends out to the offshore model boundary.

2.2.2. Average Bathymetry

This representative bathymetry comprises the average of all available surveys of the surf zone and nearshore bathymetry at each site. This equated to a total of 10 surveys at Narrabeen (between 2011 and 2016) and 123 surveys at Duck (between 2009 and 2019).

2.2.3. Dean5 Bathymetry

This synthetic bathymetry is based on the equilibrium shoreface profile concept detailed in Dean [19], where the depth h at a cross-shore distance x from the mean sea level contour is given by the equation h = Ax2/3. The parameter “A” is determined based on the best fit to the cross-shore position of the 5 m depth contour, as determined from the average of all bathymetry surveys at each site. This depth contour is chosen, as this is a location that is often available from hydrographic survey charts and, hence, can be estimated along coastlines where beach surveys are not available.

2.2.4. Dean10 Bathymetry

This synthetic bathymetry is similarly defined by the Dean equilibrium shoreface profile, but with the parameter “A” this time determined by the cross-shore position of the 10 m depth contour. Similar to above, this depth contour is chosen as this is a location that is typically found on hydrographic survey charts.

2.2.5. Upper Bathymetry

This bathymetry represents the upper envelope of all available surveys of the surf zone and nearshore bathymetry, obtained at each site. The upper level was defined by the highest 5% of all elevation data for a given cross-shore position in the surf zone and nearshore.

2.2.6. Lower Bathymetry
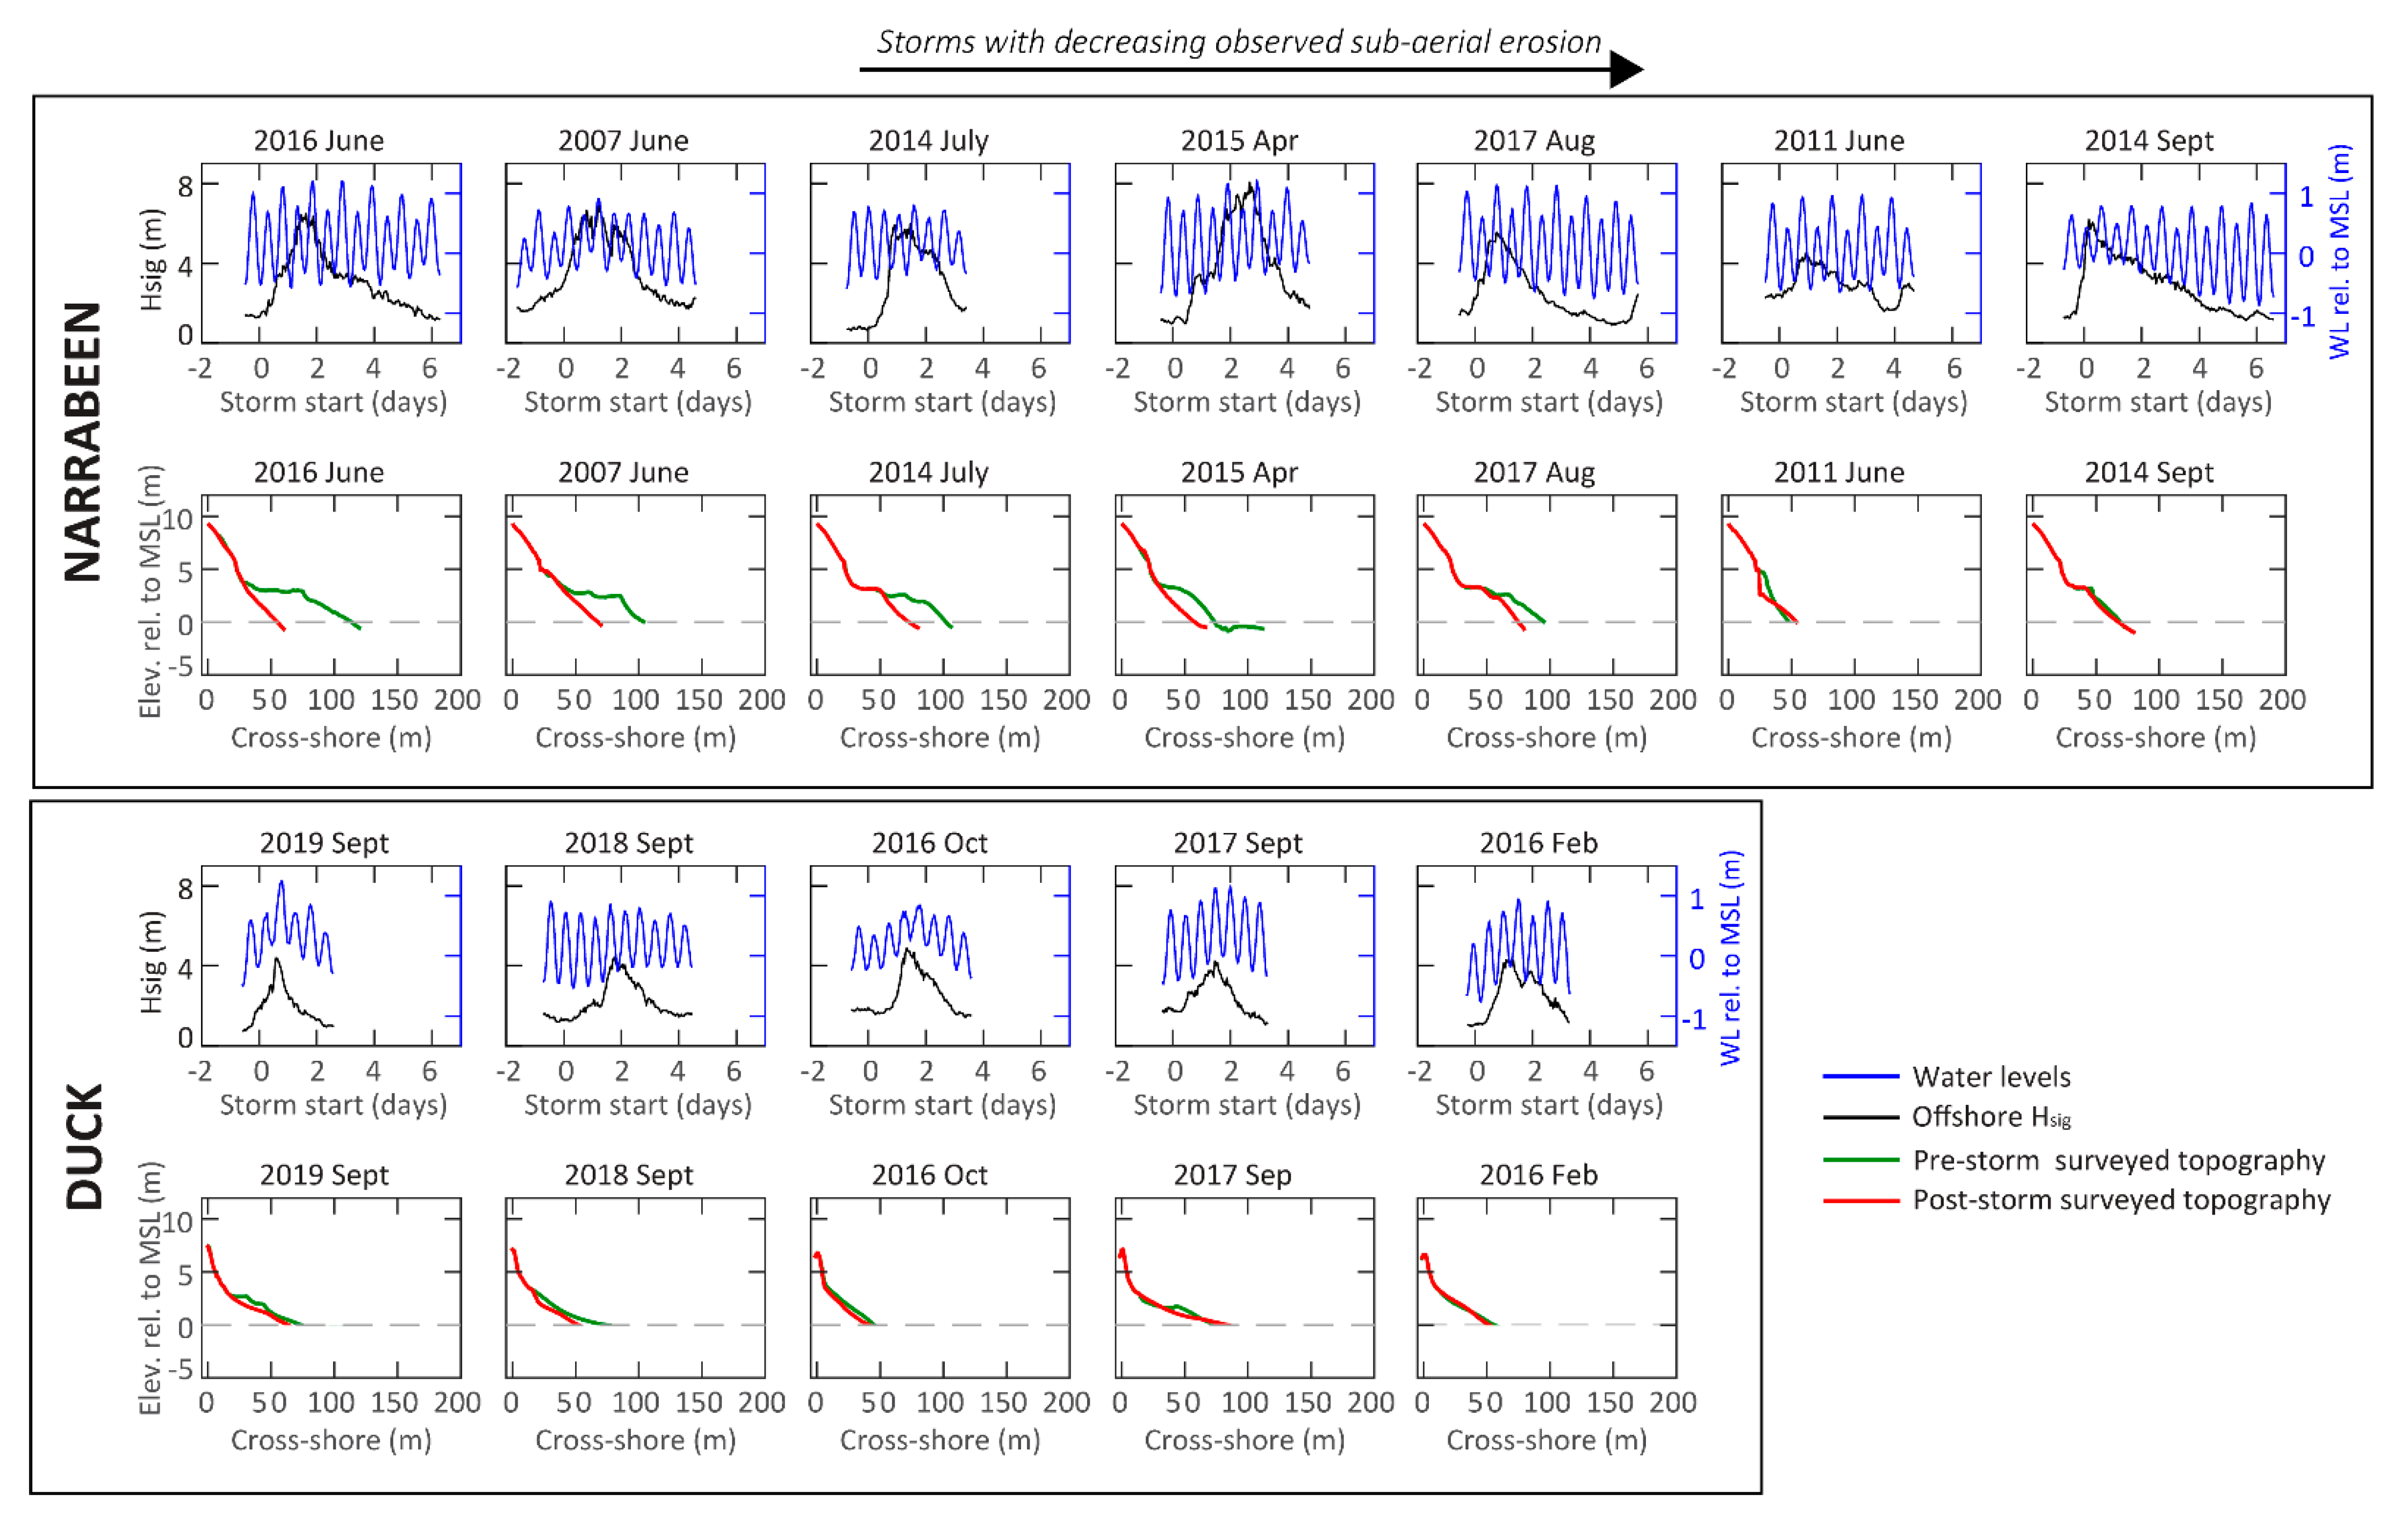
This bathymetry represents the lower envelope of all available surveys of the surf zone and nearshore bathymetry, obtained at each site. The lower level was defined by the lowest 5% of all elevation data for a given cross-shore position in the surf zone and nearshore.
While neither of these final two “envelope” bathymetries were anticipated to be the optimum choice for practical erosion prediction, they are included in this study to assist the evaluation of alternative approaches.
For each of the twelve storms that are available in this study (see next Section 2.3), a complete bottom boundary was obtained by combining the immediate pre-storm in situ survey of the sub-aerial beach with each of the six different surf zone and nearshore bathymetries outlined above. At the shoreline, the two profile segments were joined using a piecewise cubic interpolation. Using this approach, a seamless pre-storm cross-shore profile extending from the dune crest to the seaward model boundary was obtained (Figure 2). Importantly, the pre-storm sub-aerial profile matched the observed beach and is identical for each individual storm, while seawards of this the pre-storm bathymetry was varied.

2.3. Storm Events

A total of twelve unique storm events were modelled using XBeach, only limited by the availability of suitable pre- and post-storm survey data at each site. This comprised seven storms at Narrabeen and five storms at Duck, spanning a range of storm wave conditions and water levels (Figure 3). The bulk statistics for each of these storms and the timings of their associated pre- and post-storm surveys are summarized in Table 1. The measured sub-aerial beach erosion volumes that were observed during each of these twelve storm events are shown in Figure 4, indicating the range of erosion responses to be predicted.
To encompass both the range of erosion response and the pre-storm bathymetry observed at each study site, three unique events (highlighted in grey in Table 1 and distinguished with dark green in Figure 4) were chosen to calibrate the XBeach model specific to each site. The remaining four storms at Narrabeen and two storms at Duck were used to assess the accuracy and reliability of sub-aerial beach erosion predictions based on the optimum parameters for each bathymetry derived from the calibration process.
At both study sites, observed wave and water level measurements obtained from nearby gauges (Figure 1) were used in XBeach to define the offshore hydrodynamic boundary conditions for each storm. At Duck, the offshore boundary of the XBeach domain was extended out to the −17 m contour where hourly directional wave data are recorded at an offshore wave buoy. At Narrabeen, hourly directional wave data were obtained from a wave buoy located 11 km offshore of the study site in 90 m water depth. An established and validated SWAN look-up table [15] was used to subsequently transform the deep-water waves to the −15 m contour where the offshore domain of XBeach was located. At both study sites, the XBeach model was forced with a JONSWAP spectrum created from the time series of measured bulk wave parameters and assuming constant values for the peak enhancement factor (γr = 3.3) and directional spreading of waves (24.43°). Measured ocean water levels were obtained from the nearby tide gauges. Further details of the XBeach modelling workflow are presented below.

2.4. XBeach Modelling

Each of the 12 storm events were modelled at the location of the two cross-shore transects shown in Figure 1 using 1DH XBeach (version: v1.23.5527_XbeachX) in surfbeat mode with default parameters unless otherwise stated below. Figure 5 summarizes the modelling workflow used to separately calibrate XBeach for each of the six bathymetries and, then, evaluate the predictive skill when these calibrated models and their associated bathymetries were used to simulate storm events.

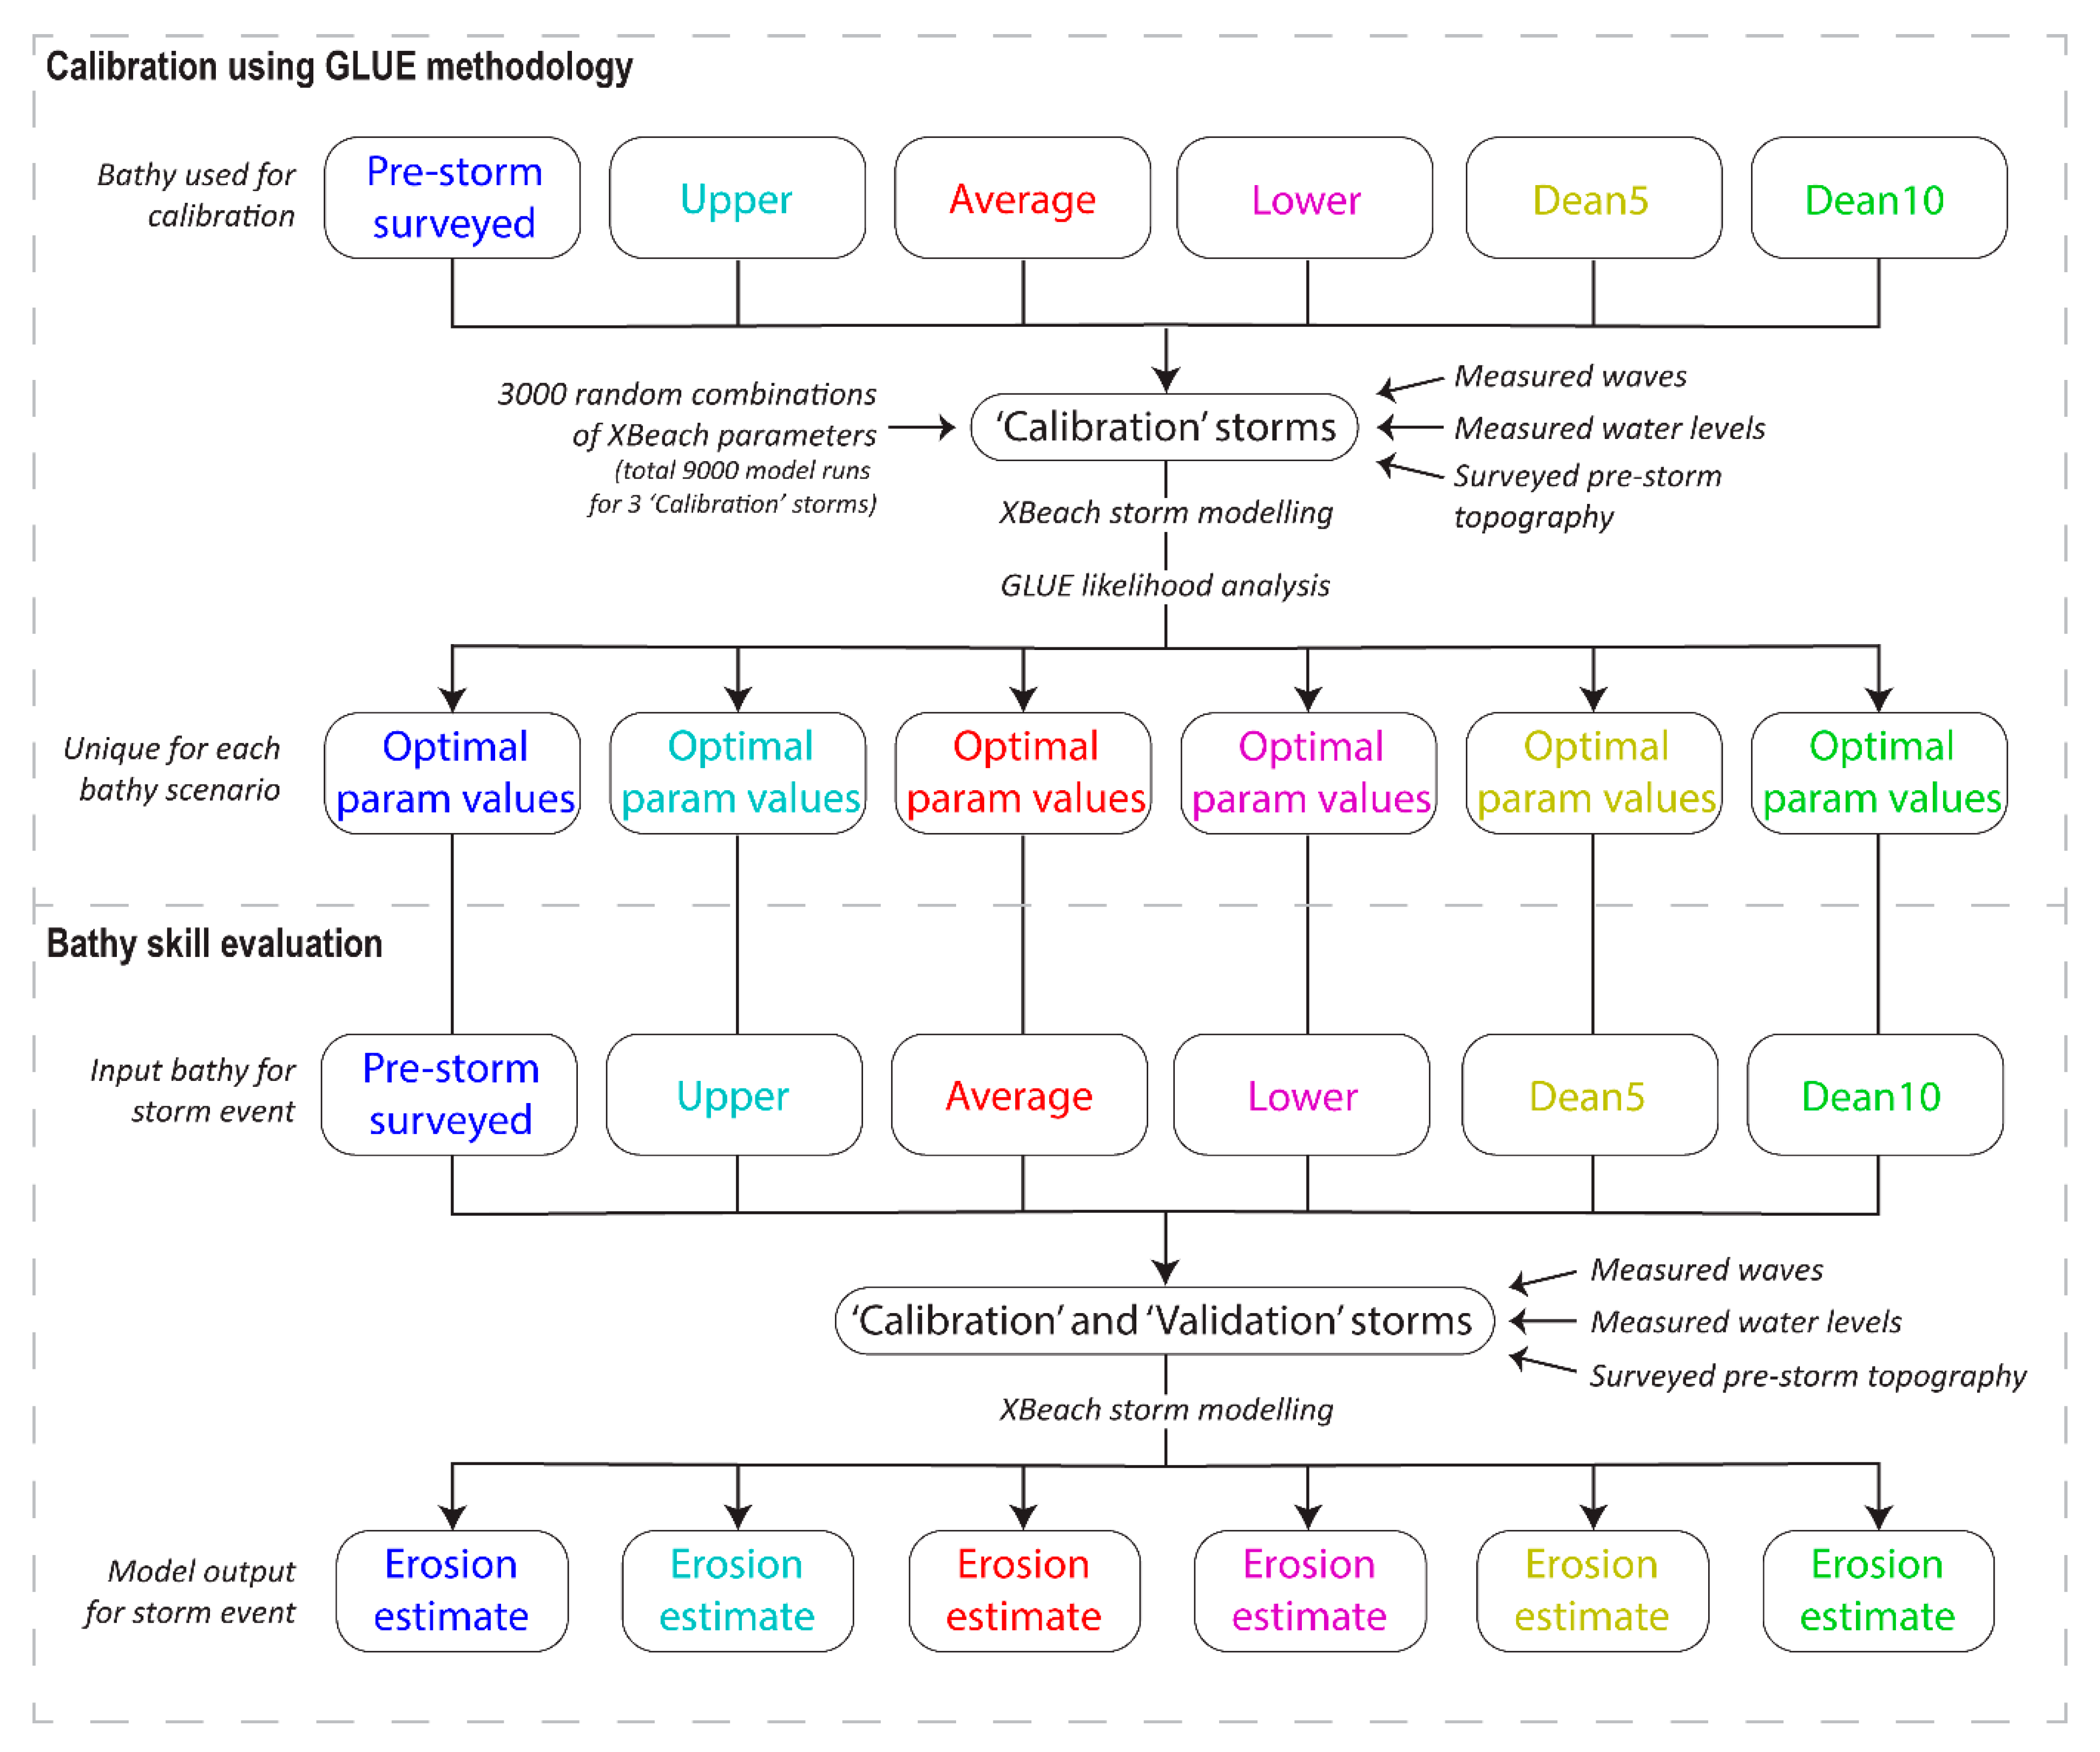
2.4.1. Model Calibration

Initially, a subset of XBeach parameters to be used in the model calibration were identified using a general sensitivity analysis following the methodology described by Simmons et al. [20]. Table 2 summarizes the four key parameters that were identified through this process as having the greatest influence on model output at these two sites and, therefore, were used in the subsequent model calibration.
The generalized likelihood uncertainty estimation (GLUE) methodology [20,23,24] was used to rigorously calibrate XBeach and determine the optimal and site-specific parameters to best predict sub-aerial erosion corresponding to each of the six bathymetries. To maximize prediction accuracy across multiple storms [25,26], all three calibration storm events at each site (see Figure 4) were utilized in the GLUE calibration. This resulted in a set of site-specific optimal parameter values that are not biased towards a single event. A total of 9000 model runs (i.e., 3000 model runs per storm) were used to determine the optimal parameter values. By repeating this GLUE calibration process for each of the six bathymetries, six different combinations of optimal parameter values were obtained per site.

2.4.2. Evaluation of Model Predictive Skill

Following model calibration, predictive skill at the two study sites was evaluated by applying the calibrated model (for each of the six bathymetries) to each of the calibration storms, as well as the “unseen” validation storms (refer Table 1 and Figure 4). These storm events were modelled using their respective measured waves, measured water levels, and surveyed pre-storm sub-aerial beach morphology. As illustrated in Figure 5, for a given bathymetry, the parameter values that were identified through the calibration process as optimizing performance for that particular bathymetry were used to evaluate the subsequent predictive skill. Thus, a total of six erosion estimates (one for each bathymetry) were obtained for every storm event. This allows for a direct comparison of model skill where only the surveyed versus assumed surf zone and nearshore bathymetry is varied. Following Simmons et al. [20], the predictive skill of modelled post-storm profiles is quantified using the Brier skill score (BSS) [27]:
B S S = 1 M S E ( m , o ) M S E ( b , o ) = 1 ( | z o z m | ) 2 ( | z o z b | ) 2
measured above the MHHWL, corresponding to an elevation of 0.7 m at Narrabeen and 0.6 m at Duck. Here, zb and zo are the observed bed elevations of the pre- and post-storm profile, respectively, and zm refers to the bed elevations of the XBeach modelled profile. Erosion volumes (m3/m) above MHHWL are also calculated and compared.

3. Results and Discussion

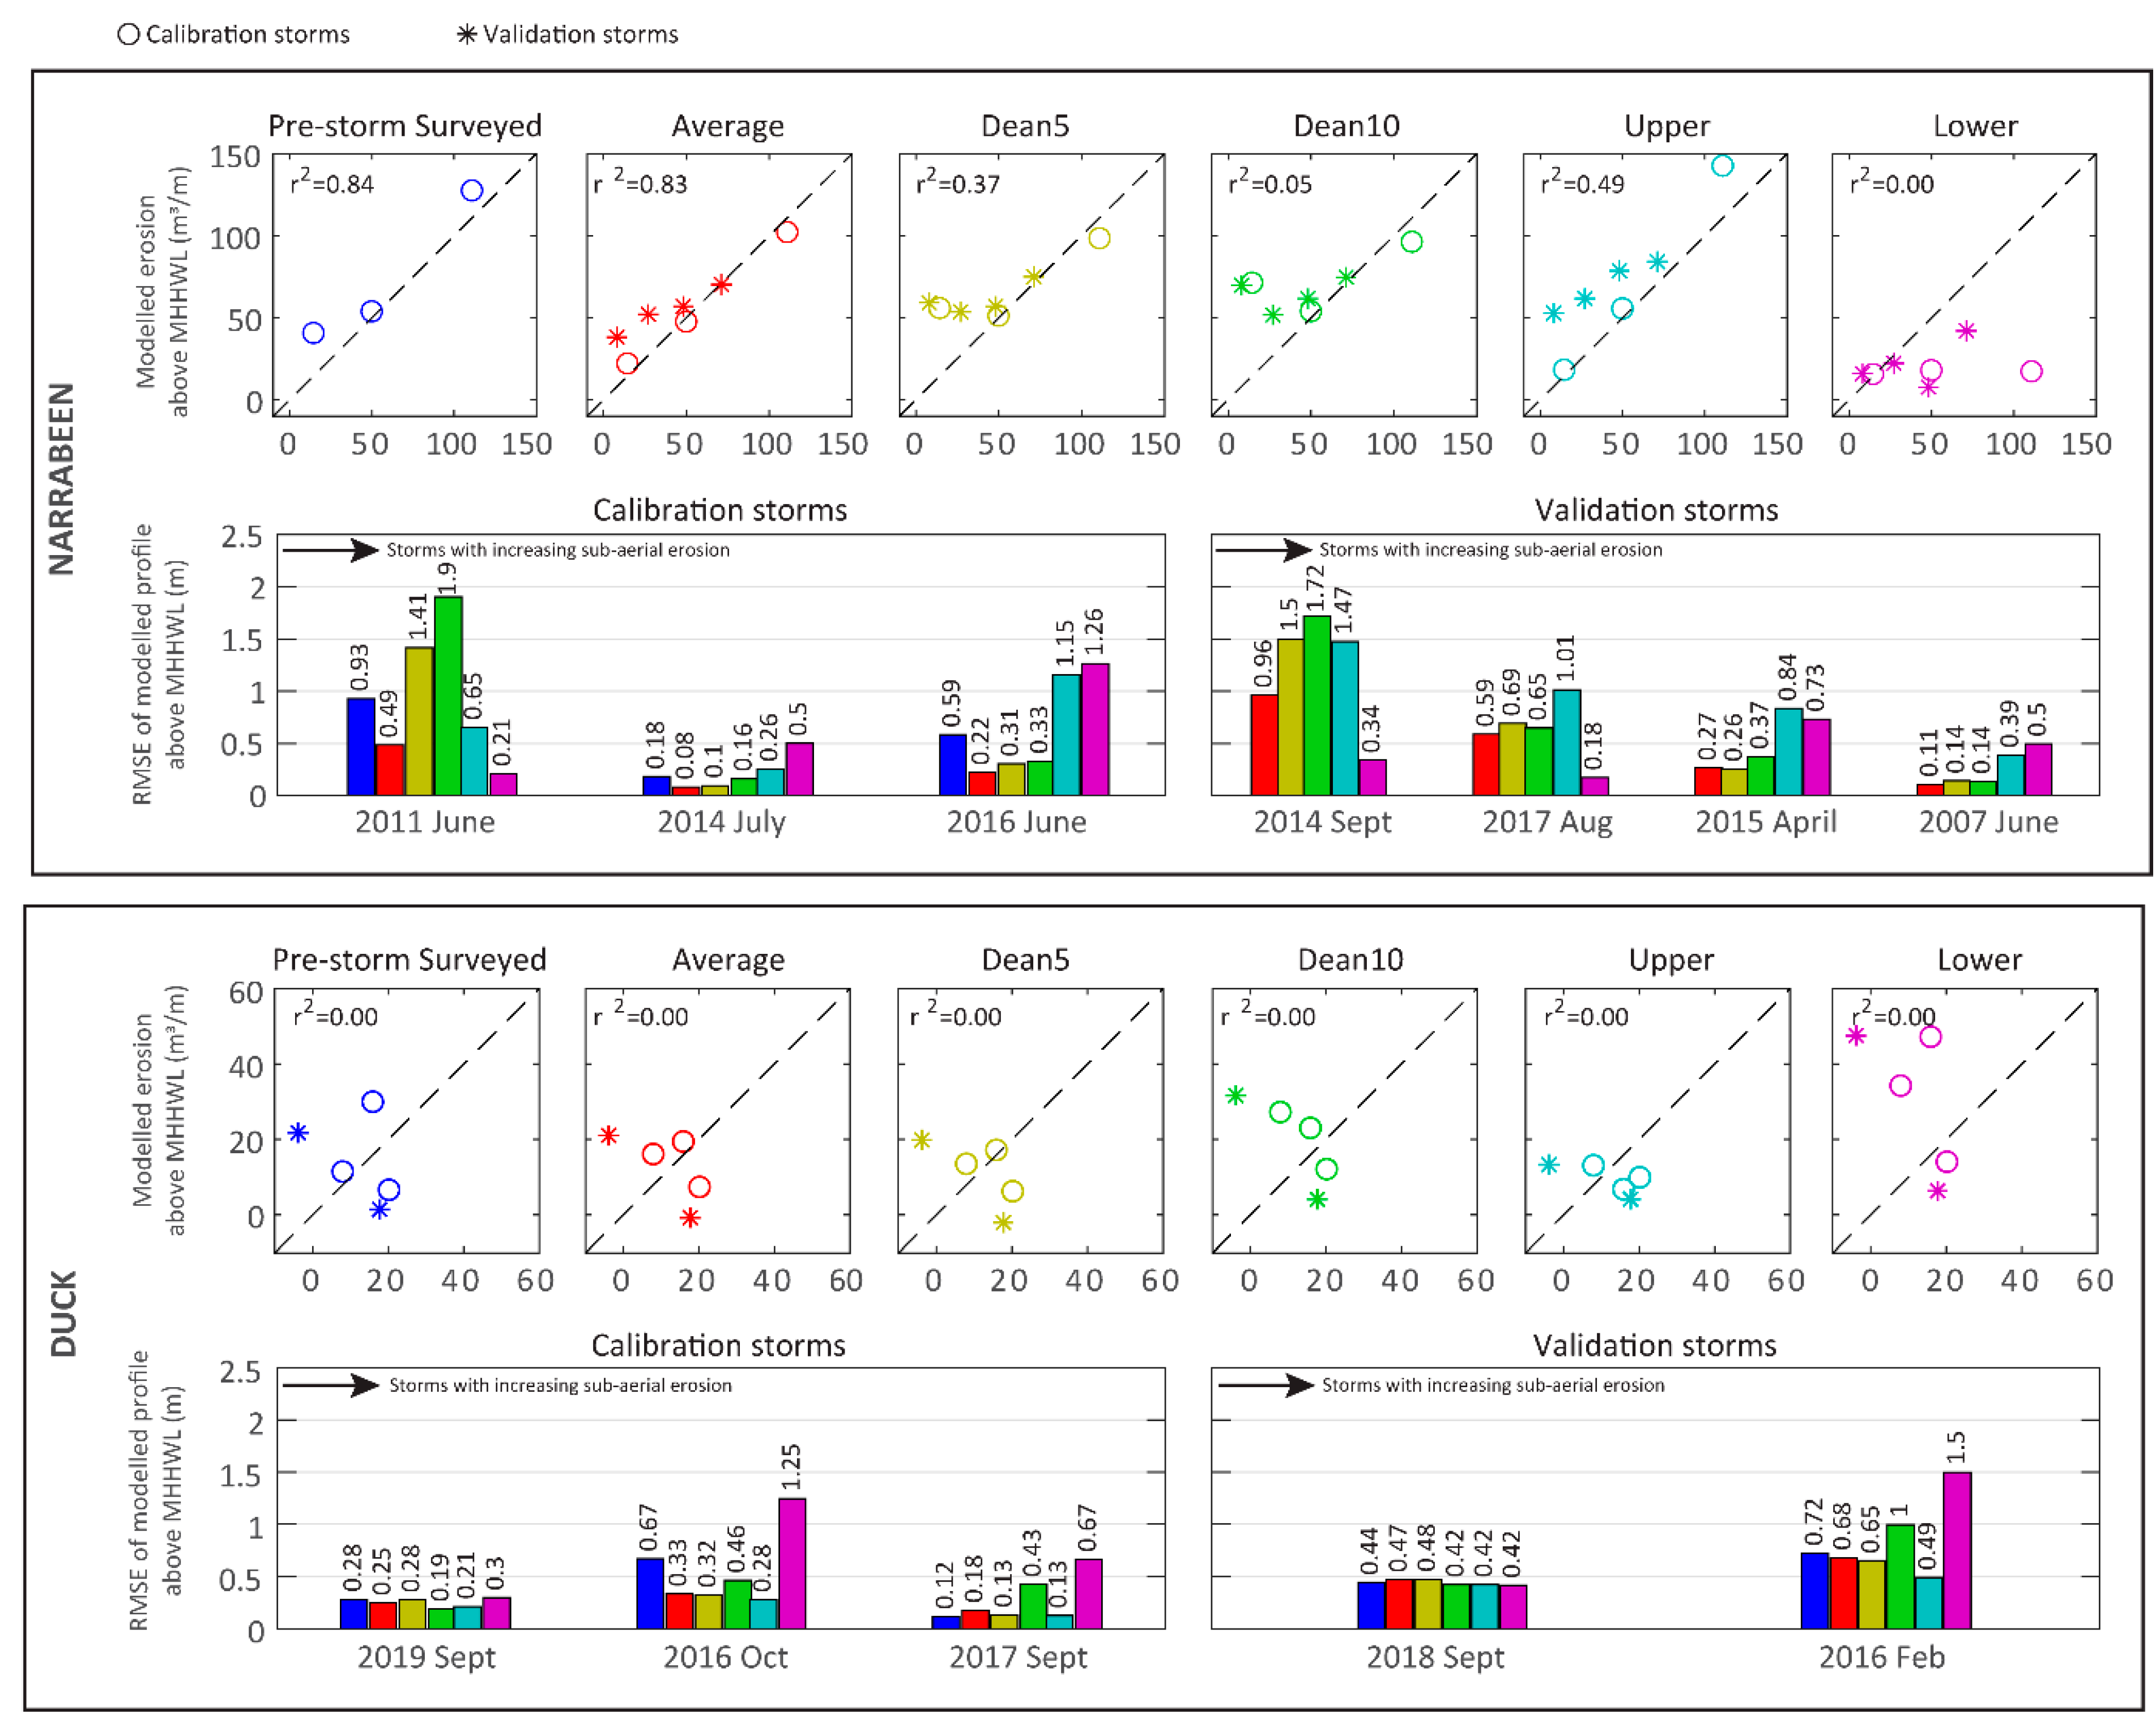
3.1. Influence of Initial Bathymetry on Sub-Aerial Beach Erosion Predictions

Figure 6 shows the influence of the initial assumed pre-storm surf zone and nearshore bathymetry on model performance for the storms used to calibrate the XBeach model. Skillful (BSS > 0) estimates of the sub-aerial profile change were obtained for 12 of the 18 modelling permutations at Narrabeen, of which 11 of the 12 were considered “good” model skill (BSS > 0.6). At Duck, 13 of the 18 modelling permutations resulted in skillful estimates of sub-aerial profile change, all of which were considered good skill. Surprisingly, using the Pre-Storm Surveyed bathymetry did not necessarily ensure consistent skillful model output at either study site, instead resulting in a BSS > 0 for only four of the six calibration storms and only one storm (the 2017 September storm at Duck) indicating the highest skill out of the six bathymetric cases (BSS = 0.88). This is in contrast to the Average bathymetry, which, though remaining unchanged between storm events, resulted in a BSS > 0 for all six calibration storms across both sites, with five of these six events having a BSS > 0.6. The model output from using the Average bathymetry was better in skill than the model output obtained from using the Pre-Storm Surveyed for all but the 2017 September event at Duck.
Model performance varied significantly for the two bathymetries Upper and Lower, that together represent the upper and lower envelope of all available surveys of the surf zone and nearshore bathymetry at each site. Despite being an end member in the envelope of observed bathymetric variability, the Upper bathymetry still resulted in BSS > 0 for five of the six calibration storms (BSS > 0.6 for three of these storms). This is comparable to the model performance achieved when using the Dean5 bathymetry. However, the Lower bathymetry was the least skillful of all six initial bottom boundary conditions considered here, resulting in a BSS > 0 for only two of the six calibration storms, and only one of these events had a BSS > 0.6.
To further explore the influence of the initial bottom boundary on the ability of XBeach to predict sub-aerial erosion, Figure 7 presents a comparison of the measured and modelled sub-aerial erosion (m3/m) above MHHWL for both the calibration as well as the unseen validation storms. This figure highlights that despite showing skillful model results for the calibration storms in the previous analysis, sub-aerial erosion is overall poorly predicted at Duck across all bathymetries (r2 = 0.00) once the skill of the model in predicting the volumetric erosion from the “unseen” validation storms is also considered. At Narrabeen, where the overall range of sub-aerial erosion for the calibration and validation storms are much larger, sub-aerial erosion can be predicted skillfully (r2 > 0.8) depending on the bathymetry used. A summary of the RMSE of these predicted versus observed erosion volumes is given in Table 3 for each of the six bathymetries. This table indicates that despite the overall poor predictions of sub-aerial erosion at Duck, the bed-level change error in terms of RMSE values is comparable at both sites and ranges from 0.44m to 0.96 m.
Focusing on the model predictive skill for each bathymetry and noting the overall poor predictive performance at Duck in terms of volumetric erosion, the Average bathymetry again indicates similar model performance at Narrabeen when compared to the Pre-Storm Surveyed bathymetry (r2 = 0.92 and 0.93 for the Average and Pre-Storm Surveyed bathymetry, respectively). In fact, other than for two storm events (the 2017 September and 2019 September storms at Duck), using the Average bathymetry resulted in an overall smaller RMSE than using the Pre-Storm Surveyed bathymetry. This suggests that using a time-invariant Average bathymetry may be a practical solution for applications such as early warning when rapid erosion predictions are required.
While the r-squared value at Narrabeen for the synthetic Dean5 (r2 = 0.37) and Dean10 (r2 = 0.05) model output suggests a lower predictive skill compared to using the Pre-Storm Surveyed and Average bathymetries, it is evident from the figure that this statistic is skewed due to overestimation of erosion for storm events that resulted in minimal sub-aerial erosion. For larger erosion events (storm events other than the 2011 June calibration storm and the 2014 September validation storm at Narrabeen), the comparison of the RMSE values in Figure 7 shows that the Dean5 and Dean10 bathymetries, which only require information about the location of a single contour at a site, results in similar model output to the Pre-Storm Surveyed and Average bathymetries. For this reason, and if the primary application is to predict the impact of major storm erosion events and no survey data are available, the results suggest that the use of one of these synthetic alternatives may also be a suitable approach.

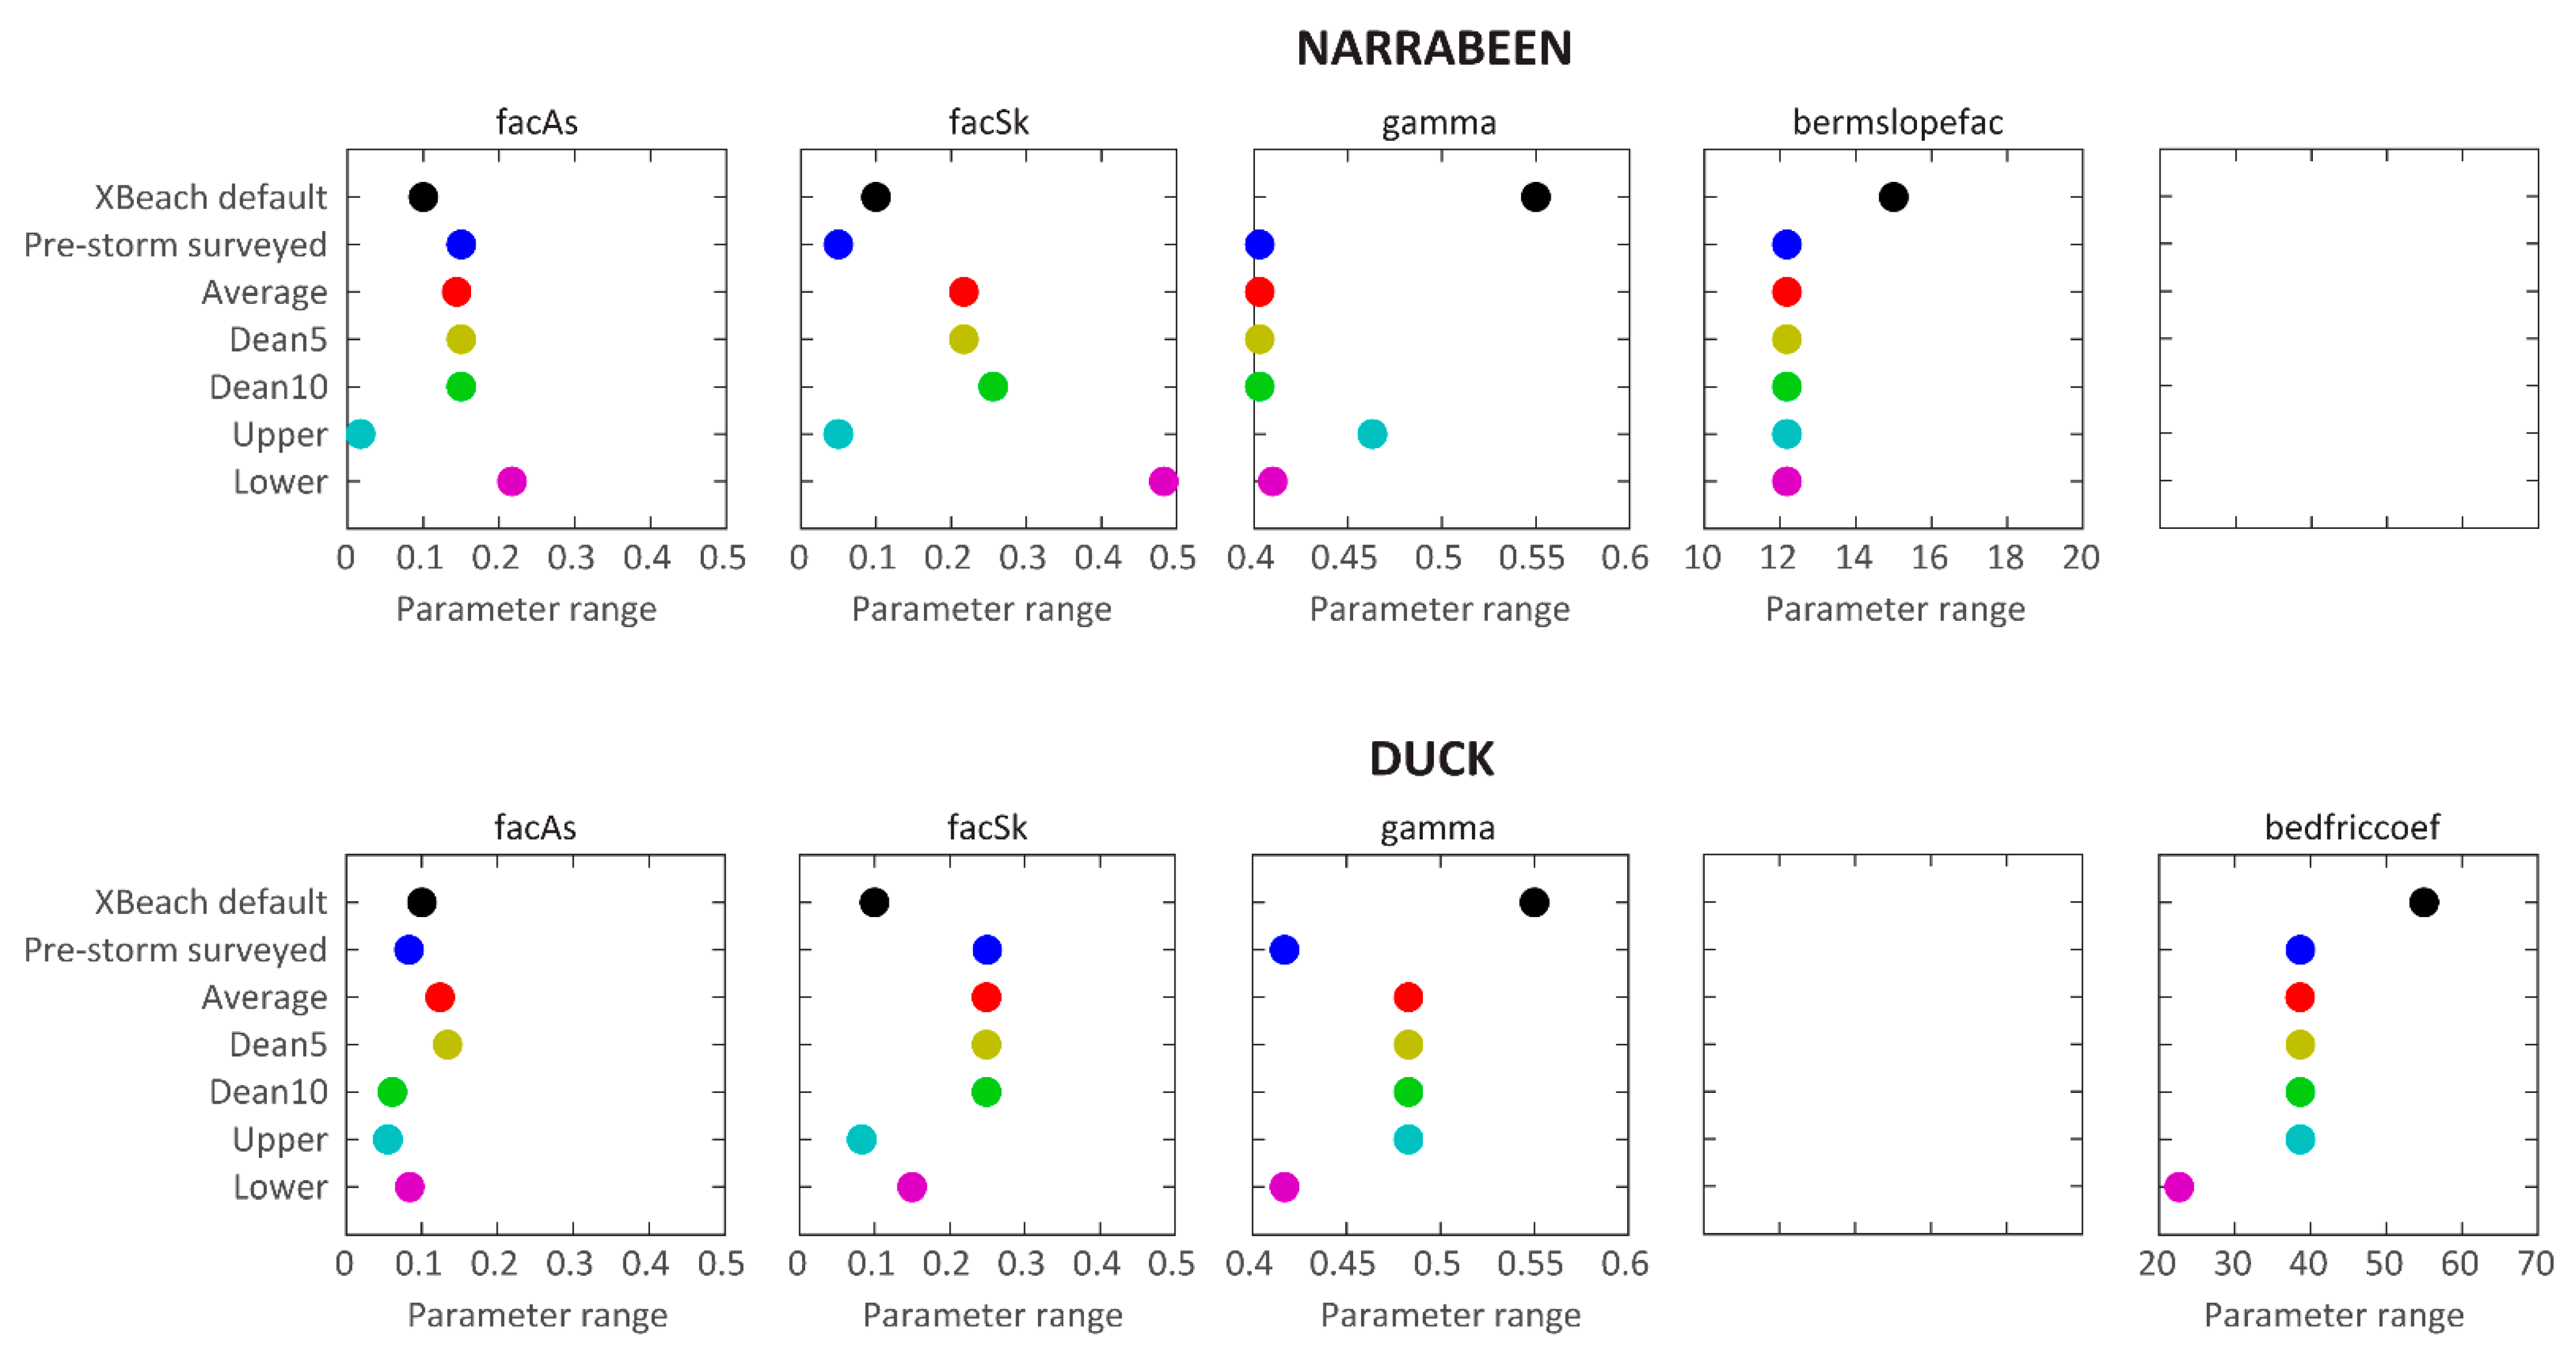
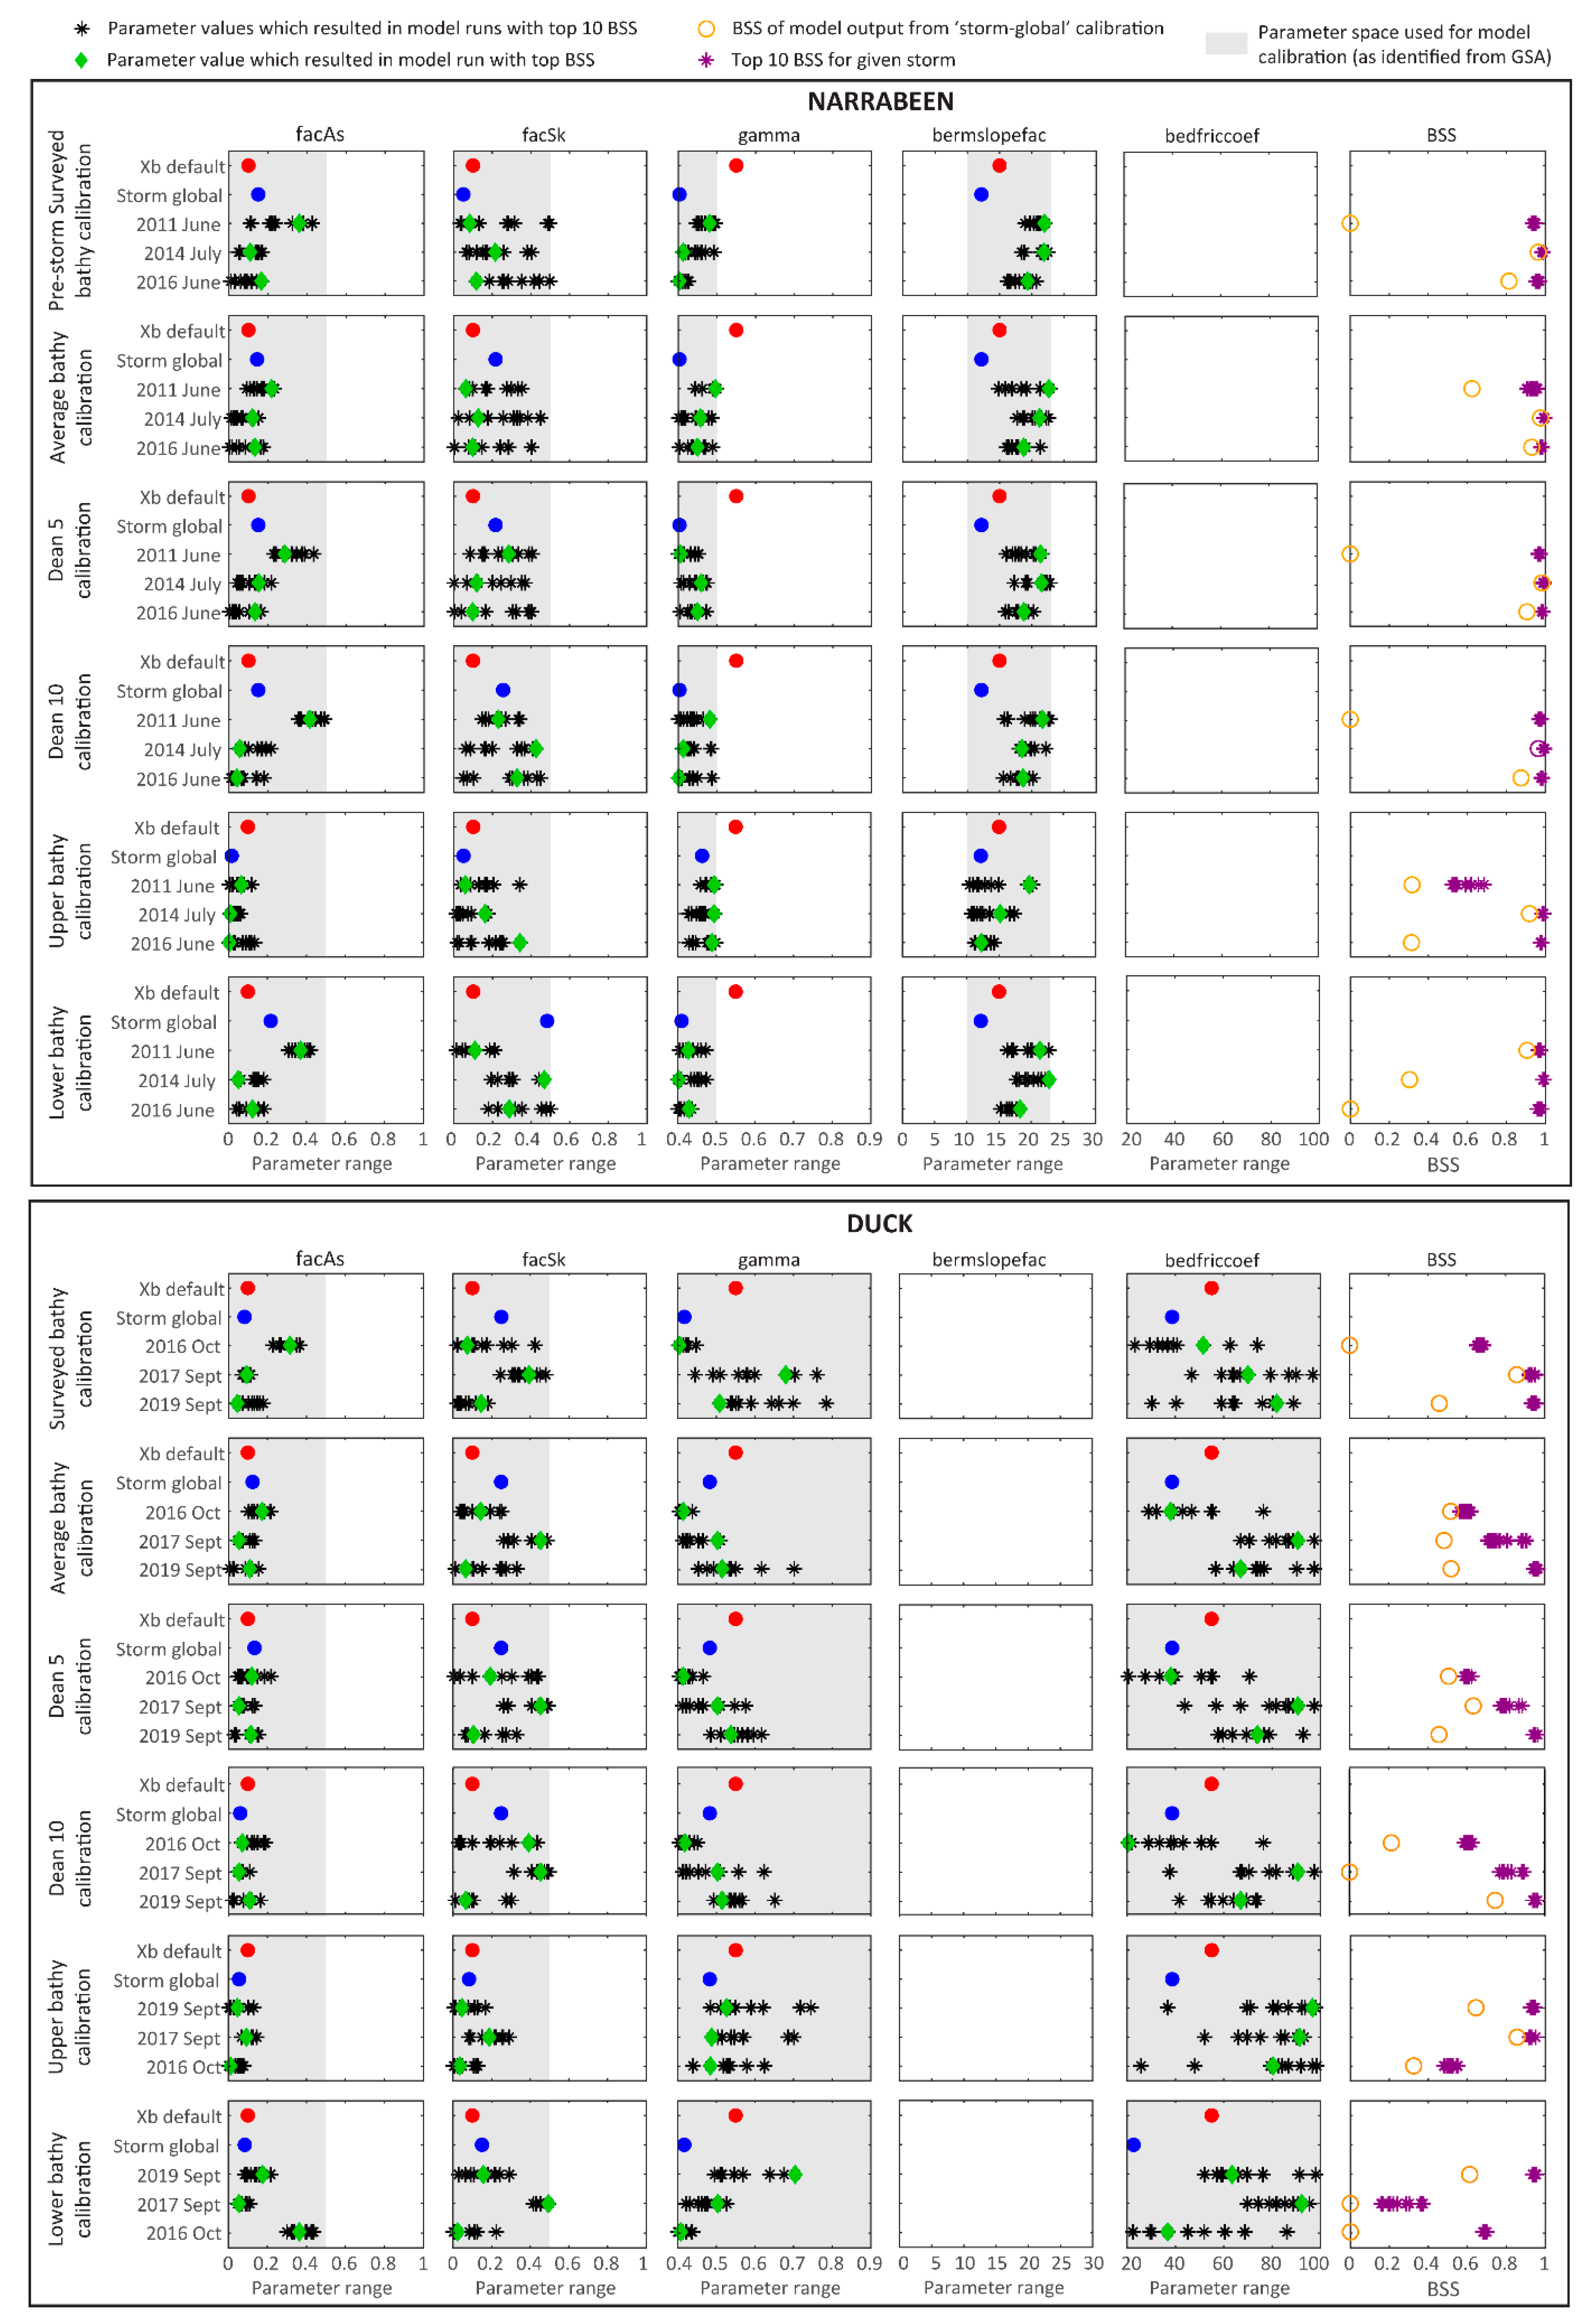
3.2. Adjustment of Optimal Model Parameters to Pre-Storm Bathymetry

The above results suggest that time-invariant bathymetries such as a temporally averaged bathymetry or synthetic bathymetry based on simple equilibrium formulae may be a practical solution to use with XBeach in applications such as early warning, when pre-storm surveys of the surf zone and nearshore are unlikely to be immediately available. Indeed, at these two contrasting study sites, similar predictive skill and accuracy are achieved with the Average bathymetry relative to the use of immediately pre-storm bathymetric surveys, when the model is rigorously calibrated to the assumed bottom boundary condition. In the absence of any survey data at a site, the results also suggest that either of the Dean5 or Dean10 synthetic bathymetries can also be suitable alternatives.
Since it is widely observed that antecedent surf zone conditions are important in determining the magnitude of sub-aerial beach response during extreme events (e.g., a pronounced storm bar helps dissipate wave energy prior to eroding the sub-aerial beach; [28]), the lack of improved skill when using measured pre-storm data is likely due to inherent model structural errors in XBeach under the standard 1DH and surfbeat mode. While identifying the exact causes of these model structural errors is beyond the scope of this present work (refer [29] for further discussion), model behavior is explored by examining the adjustment in optimal model parameters obtained through the extensive GLUE calibration process. Figure 8 presents the optimal model parameters for each of the six bathymetries at Narrabeen and Duck, considering best performance across all three calibration storms at each site. This figure identifies an adjustment in optimal parameters to the pre-storm bathymetry used, which is particularly noticeable for the end-member Upper and Lower bathymetries. In these cases, it is clear that the model parameters are “tuned” to the particular bathymetry, likely to compensate for errors in both the assigned bathymetry as well as model structure. For example, for the Lower bathymetry, where the surf zone is by definition much deeper than average (thereby enhancing wave attack of the sub-aerial beach), the calibration process is shown to favor model parameters that temper sub-aerial beach erosion (e.g., higher onshore transport by the parameter facAs and increased wave dissipation by gamma). This is the opposite for the Upper bathymetry, where the GLUE calibration process is shown to favour model parameters that enhance sub-aerial beach erosion and compensate for the shallower surf zone (and, hence, less wave attack on the sub-aerial beach) artificially caused by this bathymetry.
To further explore model behavior in the calibration process, Figure 9 illustrates the distribution in optimum model parameter for each individual storm, in comparison to the optimal parameters across all storms shown previously (referred to here as “storm global”). This figure highlights that optimal model parameters identified in the GLUE process (comprising 3000 model runs for each storm event) are also sensitive to the particular storm. In a similar manner to the variability in optimum model parameters for each bathymetry, at the individual storm level, the model parameters are observed to adjust depending on the magnitude of erosion caused by the individual storm. This is particularly evident for the 2011 July storm at Narrabeen, which was the least erosive of the three calibration storms at this site (refer to Figure 4). In this case, the calibration process identifies optimal model parameters that temper modelled erosion. These parameters are significantly different from the “storm-global” optimal parameters, which were identified for all three storms, and highlight the careful consideration required in the calibration process to ensure that the model calibration spans a sufficient range of storm conditions. This is particularly important in the context of coastal erosion early warning systems, where model predictions of coastal erosion are typically required across a range of forecast storm conditions, from moderate (e.g., 1 in 1 year) to extreme (e.g., 1 in 100 year) events.

4. Conclusions

The extent to which a representative and/or synthetic bathymetry can be used to obtain reliable predictions of storm-induced sub-aerial erosion using the XBeach coastal numerical model has been evaluated in this study. Six different bathymetries were tested for XBeach sensitivity, ranging from the benchmark “best case” scenario of the bathymetry having been surveyed immediately pre-storm, to time-invariant scenarios based on temporal averages of available historic survey measurements, or simple beach equilibrium profile formulae. Following extensive calibration of each bathymetry using a rigorous generalized likelihood uncertainty estimation (GLUE) methodology, model performance was assessed both against storm events used in the model calibration, as well as a number of “unseen” storm events. The analyses revealed that for two contrasting sites in southeast Australia (Narrabeen Beach) and eastern USA (Duck), there is no obvious improvement in model performance in predicting sub-aerial beach erosion using pre-storm surveyed data and that the use of a time-invariant representative or synthetic bathymetry is an appropriate alternative, as long as the representative/synthetic bathymetry that is used as the initial bottom boundary condition to calibrate the model is also used as the initial bottom boundary condition to model storm events. These approaches are appealing as they negate the need for intensive bathymetric surveys to be undertaken pre-storm for accurate erosion prediction and instead rely on only: (1) a database of historical bathymetric data at the site of interest to construct a temporally averaged bathymetric profile; or (2) a simple application of the Dean equilibrium shoreface profile based on the location of the 5 m or 10 m depth contour.
While field measurements highlight the important role of pre-storm bathymetry in determining the magnitude of sub-aerial beach response (e.g., [28]), the results here are attributed to present XBeach model limitations under the standard 1DH and surfbeat configuration. Evaluation of the model parameters indicate a distinct shift in optimized parameters depending on the bathymetry tested, revealing that approximations of the actual bathymetry can be compensated for to a large degree through the model calibration process. This emphasizes the need for careful model calibration to be undertaken prior to applying representative and/or synthetic bathymetry in the XBeach modelling to ensure that model parameters are optimized for that particular bathymetry. Model calibration also shows that these optimized parameters can vary depending on the magnitude of the storm, highlighting the additional importance of the type of storm(s) used in the model calibration.
This study provides guidance for the rapidly growing establishment of operational coastal erosion early warning systems worldwide, where XBeach in the standard 1DH and surfbeat configuration is often proposed in the numerical modelling forecast chain (e.g., [3,4]). As a practical step in implementing such systems, the results suggest that there is little advantage in terms of improved forecast accuracy (not considering future XBeach model developments) in regularly surveying and updating the pre-storm bathymetry, or in installing specialist remote-sensing infrastructure capable of estimating surf zone and nearshore bathymetry in near real time (e.g., [11]). Instead, the results highlight the critical importance of rigorous XBeach model calibration to identify optimal model parameters based on the representative or synthetic bathymetry adopted. These steps are likely to result in improved erosion predictions for the range of storm conditions at the site, ultimately leading to greater coastal preparedness.

Author Contributions

Conceptualization, I.L.T., M.D.H., K.D.S. and N.M.; methodology, I.L.T., M.D.H., K.D.S., N.M., J.A.S. and M.C.T.; software, N.M. and J.A.S.; validation, N.M.; formal analysis, N.M.; investigation, N.M.; resources, I.L.T., M.D.H. and K.D.S.; data curation, I.L.T. and M.D.H.; writing—original draft preparation, N.M.; writing—review and editing, N.M., M.D.H., I.L.T., K.D.S. and M.C.T.; visualization, N.M.; supervision, I.L.T., M.D.H., K.D.S. and J.A.S.; project administration, I.L.T.; funding acquisition, I.L.T. All authors have read and agreed to the published version of the manuscript.

Funding

This research was funded by the Australian Research Council (LP170100161) with collaboration and additional funding from our Project Partners: Australian Bureau of Meteorology; NSW Department of Planning, Industry and Environment; WA Department of Transport; Northern Beaches Council and City of Mandurah. The first author is funded by a UNSW International Postgraduate Award.

Institutional Review Board Statement

Not applicable.

Informed Consent Statement

Not applicable.

Data Availability Statement

All data used for the modelling at Duck were obtained from the FRF THREDDS server https://chlthredds.erdc.dren.mil/thredds/catalog/frf/catalog.html (Accessed on: 22 October 2019). Some of the Narrabeen topographic data presented in this study are openly available at http://narrabeen.wrl.unsw.edu.au/ (Accessed on: 6 May 2019). Topographic LiDAR data, wave buoy data, and water level data for Narrabeen were obtained from UNSW Aviation, Manly Hydraulics Lab (MHL), and the NSW Department of Planning, Industry, and Environment (DPIE), respectively, and are available from the corresponding author with permission from the respective parties.

Acknowledgments

Pre-storm and post-storm topographic surveys at Narrabeen were carried out by members of the UNSW Water Research Laboratory. Topographic data collected using LiDAR were kindly provided by UNSW Aviation. Bathymetry surveys at Narrabeen were undertaken by the NSW Department of Planning, Industry, and Environment (DPIE). The wave and tide data at Narrabeen were provided by MHL on behalf of DPIE. The SWAN lookup table used to carry out the nearshore wave transformations at Narrabeen was initially created by Edward Kearney. The authors would like to acknowledge Spicer Bak and Kate Brodie from the FRF for their initial discussion regarding the selection of storm events to model at Duck as well as their assistance in identifying the data available for modelling at Duck. We would also like to thank Annika O’Dea for providing the fixed LiDAR dataset at Duck and Nicholas Cohen for his input on XBeach modelling at the site.

Conflicts of Interest

The authors declare no conflict of interest.

References

  1. Baart, F.; van Ormondt, M.; van Thiel de Vries, J.S.M.; van Koningsveld, M. Morphological impact of a storm can be predicted three days ahead. Comput. Geosci. 2016, 90, 17–23. [Google Scholar] [CrossRef] [Green Version]
  2. Barnard, P.L.; van Ormondt, M.; Erikson, L.H.; Eshleman, J.; Hapke, C.; Ruggiero, P.; Adams, P.N.; Foxgrover, A.C. Development of the Coastal Storm Modeling System (CoSMoS) for predicting the impact of storms on high-energy, active-margin coasts. Nat. Hazards 2014, 74, 1095–1125. [Google Scholar] [CrossRef]
  3. Harley, M.D.; Valentini, A.; Armaroli, C.; Perini, L.; Calabrese, L.; Ciavola, P. Can an early-warning system help minimize the impacts of coastal storms? A case study of the 2012 Halloween storm, northern Italy. Nat. Hazards Earth Syst. Sci. 2016, 16, 209–222. [Google Scholar] [CrossRef] [Green Version]
  4. Plomaritis, T.A.; Benavente, J.; del Rio, L.; Reyes, E.; Dastis, C.; Gomez, M.; Bruno, M. Storm Early Warning System as a Last Plug-in of a Regional Operational Oceanography System: The Case of the Gulf of Cadiz. Coast. Eng. Proc. 2012, 1, 54. [Google Scholar] [CrossRef] [Green Version]
  5. van Dongeren, A.; Ciavola, P.; Martinez, G.; Viavattene, C.; Bogaard, T.; Ferreira, O.; Higgins, R.; McCall, R. Introduction to RISC-KIT: Resilience-increasing strategies for coasts. Coast. Eng. 2018, 134, 2–9. [Google Scholar] [CrossRef] [Green Version]
  6. Jiménez, J.A.; Sanuy, M.; Ballesteros, C.; Valdemoro, H.I. The Tordera Delta, a hotspot to storm impacts in the coast northwards of Barcelona (NW Mediterranean). Coast. Eng. 2018, 134, 148–158. [Google Scholar] [CrossRef]
  7. Stockdon, H.F.; Doran, K.J.; Thompson, D.M.; Sopkin, K.L.; Plant, N.G.; Sallenger, A.H. National assessment of Hurricane-Induced Coastal Erosion Hazards: Gulf of Mexico. 2012; p. 51. Available online: https://pubs.er.usgs.gov/publication/ofr20121084 (accessed on 2 September 2021). [CrossRef] [Green Version]
  8. Leaman, C.K.; Harley, M.D.; Splinter, K.D.; Thran, M.C.; Kinsela, M.A.; Turner, I.L. A Storm Hazard Matrix combining coastal flooding and beach erosion. Coast. Eng. 2021, 104001. [Google Scholar] [CrossRef]
  9. Splinter, K.D.; Palmsten, M.L. Modeling dune response to an East Coast Low. Mar. Geol. 2012, 329, 46–57. [Google Scholar] [CrossRef]
  10. Roelvink, D.; Reniers, A.; Van Dongeren, A.P.; de Vries, J.v.T.; McCall, R.; Lescinski, J. Modelling storm impacts on beaches, dunes and barrier islands. Coast. Eng. 2009, 56, 1133–1152. [Google Scholar] [CrossRef]
  11. Holman, R.; Plant, N.; Holland, T. CBathy: A robust algorithm for estimating nearshore bathymetry. J. Geophys. Res. Oceans 2013, 118, 2595–2609. [Google Scholar] [CrossRef]
  12. Turner, I.L.; Harley, M.D.; Almar, R.; Bergsma, E.W.J. Satellite optical imagery in Coastal Engineering. Coast. Eng. 2021, 167, 103919. [Google Scholar] [CrossRef]
  13. Wright, L.D.; Short, A.D. Morphodynamic variability of surf zones and beaches: A synthesis. Mar. Geol. 1984, 56, 93–118. [Google Scholar] [CrossRef]
  14. Harley, M.D.; Turner, I.L.; Short, A.D.; Ranasinghe, R. A reevaluation of coastal embayment rotation: The dominance of cross-shore versus alongshore sediment transport processes, Collaroy-Narrabeen Beach, southeast Australia. J. Geophys. Res. Earth Surf. 2011, 116. [Google Scholar] [CrossRef]
  15. Turner, I.L.; Harley, M.D.; Short, A.D.; Simmons, J.A.; Bracs, M.A.; Phillips, M.S.; Splinter, K.D. A multi-decade dataset of monthly beach profile surveys and inshore wave forcing at Narrabeen, Australia. Sci. Data 2016, 3, 1–13. [Google Scholar] [CrossRef] [Green Version]
  16. O’Dea, A.; Brodie, K.L.; Hartzell, P. Continuous coastal monitoring with an automated terrestrial lidar scanner. J. Mar. Sci. Eng. 2019, 7, 37. [Google Scholar] [CrossRef] [Green Version]
  17. Ruessink, B.G.; Pape, L.; Turner, I.L. Daily to interannual cross-shore sandbar migration: Observations from a multiple sandbar system. Cont. Shelf Res. 2009, 29, 1663–1677. [Google Scholar] [CrossRef]
  18. Young, D.L.; Bak, A.S.; Forte, M.F. Initialization and Setup of the Coastal Model Test Bed: Integrated Bathymetry; US Army Engineer Research and Development Center: Vicksburg, MI, USA, 2018. [Google Scholar]
  19. Dean, R.G. Equilibrium Beach Profiles: Characteristics and Applications. J. Coast. Res. 1991, 7, 53–84. [Google Scholar]
  20. Simmons, J.A.; Harley, M.D.; Marshall, L.A.; Turner, I.L.; Splinter, K.D.; Cox, R.J. Calibrating and assessing uncertainty in coastal numerical models. Coast. Eng. 2017, 125, 28–41. [Google Scholar] [CrossRef]
  21. Roelvink, D.; van Dongeren, A.; McCall, R.; Hoonhout, B.; van Rooijen, A.; van Geer, P.; de Vet, L.; Nederhoff, K.; Quataert, E. XBeach Documentation: Release XBeach v1.23.5527 XBeachX FINAL; Deltares: Delft, The Netherlands, 2018. [Google Scholar]
  22. Roelvink, D.; Costas, S. Beach berms as an essential link between subaqueous and subaerial beach/dune profiles. Geotemas 2017, 17, 79–82. [Google Scholar]
  23. Ruessink, B.G. A Bayesian estimation of parameter-induced uncertainty in a nearshore alongshore current model. J. Hydroinformatics 2006, 8, 37–49. [Google Scholar] [CrossRef] [Green Version]
  24. Ruessink, B.G. Calibration of nearshore process models—Application of a hybrid genetic algorithm. J. Hydroinformatics 2005, 7, 135–149. [Google Scholar] [CrossRef] [Green Version]
  25. Simmons, J.A.; Harley, M.D.; Turner, I.L.; Splinter, K.D. Quantifying calibration data requirements for coastal erosion models: How many storms is enough? In Proceedings of the Coasts & Ports 2017 Conference–Cairns, Cairns, QLD, Australia, 21–23 June 2017. [Google Scholar]
  26. Callaghan, D.P.; Ranasinghe, R.; Roelvink, D. Probabilistic estimation of storm erosion using analytical, semi-empirical, and process based storm erosion models. Coast. Eng. 2013, 82, 64–75. [Google Scholar] [CrossRef]
  27. Sutherland, J.; Peet, A.H.; Soulsby, R.L. Evaluating the performance of morphological models. Coast. Eng. 2004, 51, 917–939. [Google Scholar] [CrossRef]
  28. Vousdoukas, M.I.; Almeida, L.P.M.; Ferreira, Ó. Beach erosion and recovery during consecutive storms at a steep-sloping, meso-tidal beach. Earth Surf. Process. Landf. 2012, 37, 583–593. [Google Scholar] [CrossRef]
  29. Sherwood, C.R.; Dongeren, A.V.; Doyle, J.; Hegermiller, C.A.; Hsu, T.-J.; Kalra, T.S.; Olabarrieta, M.; Penko, A.M.; Rafati, Y.; Roelvink, D. Modeling the Morphodynamics of Coastal Responses to Extreme Events: What Shape Are We In? Ann. Rev. Mar. Sci. 2021, 14, 5.1–5.36. [Google Scholar] [CrossRef]
Figure 1. (a) Narrabeen and (b) Duck study sites used in this study. The cross-shore profiles used for the XBeach modelling as well as the location of the wave buoys and tide gauges from which hydrodynamic data were obtained are shown at each site.
Jmse 09 01053 g001
Figure 2. Examples of the six alternative nearshore and surf zone bathymetries used to explore the sensitivity of XBeach sub-aerial erosion predictions to pre-storm bottom boundary conditions. The pre-storm surveyed sub-aerial beach (black) and Pre-Storm Surveyed bathymetry (blue) are shown for the June 2016 storm event at Narrabeen (left) and September 2017 storm event at Duck (right).
Jmse 09 01053 g002
Figure 3. Storm events used for XBeach modelling at Narrabeen (top 2 panels) and Duck (bottom 2 panels). Storms are ordered from left to right in order of increasing observed erosion above the MHHWL for each event. The top panels show the water level (blue) and the significant wave height (black) during that event. The pre- (green) and post-storm (red) topography for the event are shown in the bottom panel for each site.
Jmse 09 01053 g003
Figure 4. Storm events used for XBeach modelling at Narrabeen (left) and Duck (right) distinguished in terms of storms used to calibrate the model and storms used to validate the skill of the fully calibrated XBeach model. The storm events are sorted from left-to-right by the observed sub-aerial erosion above MHHWL.
Jmse 09 01053 g004
Figure 5. Flowchart visualizing the modelling workflow used to obtain erosion estimates for the six bathymetries used in this study. Six different calibrations of the XBeach model were carried out using each of the six bathymetries as the initial bottom boundary condition. This resulted in a set of XBeach parameter values that optimize model performance for each bathymetry. Erosion forecasts were then carried out using the six unique XBeach calibrations together with their associated bathymetry as the initial bottom boundary condition to evaluate predictive skill.
Jmse 09 01053 g005
Figure 6. Modelled post-storm profiles and the associated skill for the calibration storms, corresponding to each of the six bathymetries: Pre-Storm Surveyed (blue); Average (red); Dean5 (yellow); Dean10 (green), Upper (cyan); Lower (purple). Briar skill scores (BSS) are calculated for the sub-aerial section of the profile above MHHWL, corresponding to the elevation 0.7 m at Narrabeen and 0.6 m at Duck.
Jmse 09 01053 g006
Figure 7. Comparisons of predicted and observed sub-aerial beach erosion volumes and RMSE of modelled profiles, for each of the six assumed nearshore and surf bathymetries. Note that XBeach model calibration was undertaken specific to each of these six bathymetries. In this figure, the RMSE results are arranged from left to right by increasing sub-aerial erosion. The r-squared value for sub-aerial erosion was calculated by adopting the line of best fit without the requirement of a y = 0 intercept. Additionally, note that there are no validation storms for the Pre-Storm Surveyed bathymetry at Narrabeen due to the more limited availability of immediately pre-storm data at this site (refer Table 1).
Jmse 09 01053 g007
Figure 8. Optimal parameter values for Narrabeen (top) and Duck (bottom) as a function of the bathymetry used in the calibration process. Note that the bermslopefac and bedfriccoef are only used for calibration at Narrabeen and Duck, respectively, and, hence, left blank where not applied.
Jmse 09 01053 g008
Figure 9. The distribution of model parameter values for individual storms and bathymetry scenarios used in the calibration of XBeach. The four parameters that were optimized at each site are shown in the figure. Note that bedfriccoef (bermslopefac) was not used in the calibration of Narrabeen (Duck) and has been left blank. The black points show the spread of the parameters for the top 10 BSS values of a given storm. The associated BSSs are shown on the far-right subplot. The green point for each storm shows the parameter value that resulted in the top BSS for that storm. The hollow orange circle on the BSS subplot is the BSS when the “storm-global” parameter values are used to simulate the given storm event. For these “storm-global” outputs, if the BSSs are less than 0, the value has been shown as 0 in the figure for clarity.
Jmse 09 01053 g009
Table 1. Summary of all storm events modelled in this study and the surveyed datasets available for these events. Pre-Storm Surveyed bathymetry is available only for a limited number of storms at Narrabeen. Storm events where these data are not available have been left blank. The three storms used for model calibration at each site are highlighted in grey.
StormStorm StartStorm EndPre-Storm Surveys (Days before Storm Start)Post-Storm Surveys (Days after Storm End)Storm Duration (Days)Hsig at Storm Peak (m)Tp at Storm Peak (s)Wdir at Storm Peak (deg TN)
TopoBathyTopo
Narrabeen2007 June7-Jun-0712-Jun-0724 156.910.8135
2011 June14-Jun-1118-Jun-11157144.59.3159
2014 July18-Jul-1421-Jul-14151136.012.9183
2014 Sept3-Sep-149-Sep-142 166.213.8172
2015 April19-Apr-1523-Apr-155 148.114.9147
2016 June4-Jun-1610-Jun-1612366.513.0103
2017 Aug18-Aug-1723-Aug-173 155.612.9166
Duck2016 Feb7-Feb-169-Feb-16123124.39.165
2016 Oct8-Oct-1610-Oct-1615124.910.292
2017 Sept18-Sep-1720-Sep-17112124.212.780
2018 Sept12-Sep-1815-Sep-18129134.413.4115
2019 Sept6-Sep-197-Sep-1912114.47.610
Table 2. XBeach parameters used for model calibration at each study site.
Parameter NameDescriptionAssociated Study Site
facAsParameterizes the effect of wave asymmetry on cross-shore sediment transport, with larger facAs values simulating more onshore sediment transport [21].Narrabeen and Duck
facSkParameterizes the effect of wave skewness on cross-shore sediment transport, with larger values of facSk also encouraging more onshore sediment transport [21].Narrabeen and Duck
gammaBreaker index that affects energy dissipation due to wave breaking. A larger (smaller) gamma value results in increased (decreased) dissipation of wave energy due to wave breaking in the surf zone, so that less (more) wave energy reaches the shoreline [21].Narrabeen and Duck
bermslopefacA parameter newly introduced into the version of XBeach utilized in this study in order to better simulate erosion at coarser-grained, less dissipative beaches [22].Narrabeen only
bedfriccoefDefines the bed friction. When using the Chezy bed friction formulation in XBeach, a larger (lower) bedfriccoef value results in less (more) bed shear stress from waves and currents.Duck only
Table 3. Average RMSE for the six assumed initial surf zone and nearshore bathymetries used for storm modelling. The calibration and validation storms (refer to Table 1) are shown separately.
NarrabeenDuck
Calibration StormsValidation StormsCalibration StormsValidation Storms
Pre-Storm Surveyed0.57 0.360.58
Average0.260.480.250.58
Dean50.610.650.240.57
Dean100.800.720.360.71
Upper0.690.930.210.46
Lower0.660.440.740.96
Publisher’s Note: MDPI stays neutral with regard to jurisdictional claims in published maps and institutional affiliations.

