Article

Design and Application of Buoy Single Point Mooring System with Electro-Optical-Mechanical (EOM) Cable

1
Institute of Deep-Sea Science and Engineering Chinese Academy of Sciences, Hainan 572000, China
2
College of Materials Science and Opto-Electronic Technology, University of Chinese Academy of Sciences, Beijing 100049, China
*
Authors to whom correspondence should be addressed.
J. Mar. Sci. Eng. 2020, 8(9), 672; https://doi.org/10.3390/jmse8090672
Submission received: 17 July 2020 / Revised: 25 August 2020 / Accepted: 27 August 2020 / Published: 1 September 2020
(This article belongs to the Section Ocean Engineering)

Abstract

:
This paper presents the design of a hybrid system named the Mooring Buoys Observation System for Benthic with Electro Optical Mechanical Cable (MBOSBC) for long-term mooring buoy observation in deep oceans. MBOSBC is comprised of three main modules: a surface buoy, a benthic node, and an Electro-Optical-Mechanical (EOM) cable. The Surface buoy provides energy for the entire system, the Benthic node is used to observe scientific phenomena on the seabed, and the Electro-Optical-Mechanical (EOM) cable connects the sea surface buoy and the benthic observation node, serving as the information and power transmission link. This paper provides design criteria for a single point mooring buoy using an EOM cable. The environmental load of the buoy under varying wind, wave, and current conditions is analyzed and the mooring hydrodynamic force of EOM is calculated. After calculating the load of the EOM cable under extreme marine conditions, the hydrodynamic force needed for the system is analyzed. After physically testing the strength of the designed EOM cable, a near-shore test of MBOSBC was carried out, in order to verify that the system has the expected function.

1. Introduction

It is indisputable that the ocean is rich in oil, natural gas, minerals, and marine living resources. It was reported in the 2018 Blue mining Public Report that the global demand for materials, such as cobalt, nickel, lithium, and copper, will increase ten- to hundred-fold in the foreseeable future. However, the prerequisite for the development of these resources is the ability to grasp the marine data of relevant sea areas. At the same time, observing various ocean phenomena is also a prerequisite for us to be able to forecast the ocean climate. Observations of seafloor crustal movement, seafloor earthquakes, warmness and salinity of ocean water, dissolved oxygen, carbon cycle, and the resulting ocean circulation can help us to take corresponding countermeasures early in the face of natural disasters, and may help us to avoid or reduce economic losses. In the interior of the ocean, due to the inconsistency of the salinity and temperature in various places, the density of seawater in different water areas or depths is also inconsistent. It is very important to understand the physical information of the ocean for the navigation of warships, especially submarines. If a submarine inadvertently drives into less dense waters from denser waters without taking corresponding measures, the submarine will dive violently, resulting in a sudden increase of the pressure on it, which is likely to cause the submarine to collapse, taking the lives of its crew members. Therefore, observing and mastering marine information is of great significance to the marine economy, marine climate forecast, and marine military.
In addition to having abundant resources, the ocean also contains tremendous energy. Human beings have been working hard to develop and utilize this energy and have done a lot of work on it. Simeon Doyle et al. discussed the potential of M-OWC (multi-oscillating water columns) and the improvements they can bring to the OWC (oscillating water column) principle, in order to increase capture efficiency. Thus, M-OWC has the potential to provide encouraging results and support the further development of wave energy development [1].
Buoy-based observation systems can continuously observe a specific sea area over a long time. With a set of corresponding deployment and recovery equipment, the observation platform can migrate flexibly to obtain long-term, wide-range, and high-precision marine scientific data. Therefore, at present, in the field of marine meteorological forecast and marine military, buoys and submarine observation networks are mainly used to obtain marine data.
Buoy-based ocean observation platforms are mainly composed of buoys, seafloor nodes, mooring cables, and deployment recovery devices. They are equipped with different observation instruments, from sea surface to seafloor. Therefore, the power supply and communication systems should be redesigned, according to the observation needs of the system. The mooring technology of the buoy is directly related to the survival of the entire observation platform.
There are three typical mooring methods for buoys: chain-catenary mooring, semi-taut mooring, and inverse-catenary mooring [2]. The factors that determine the type of mooring include the depth of deployed waters, cost factors, the deployment strategy, and so on.
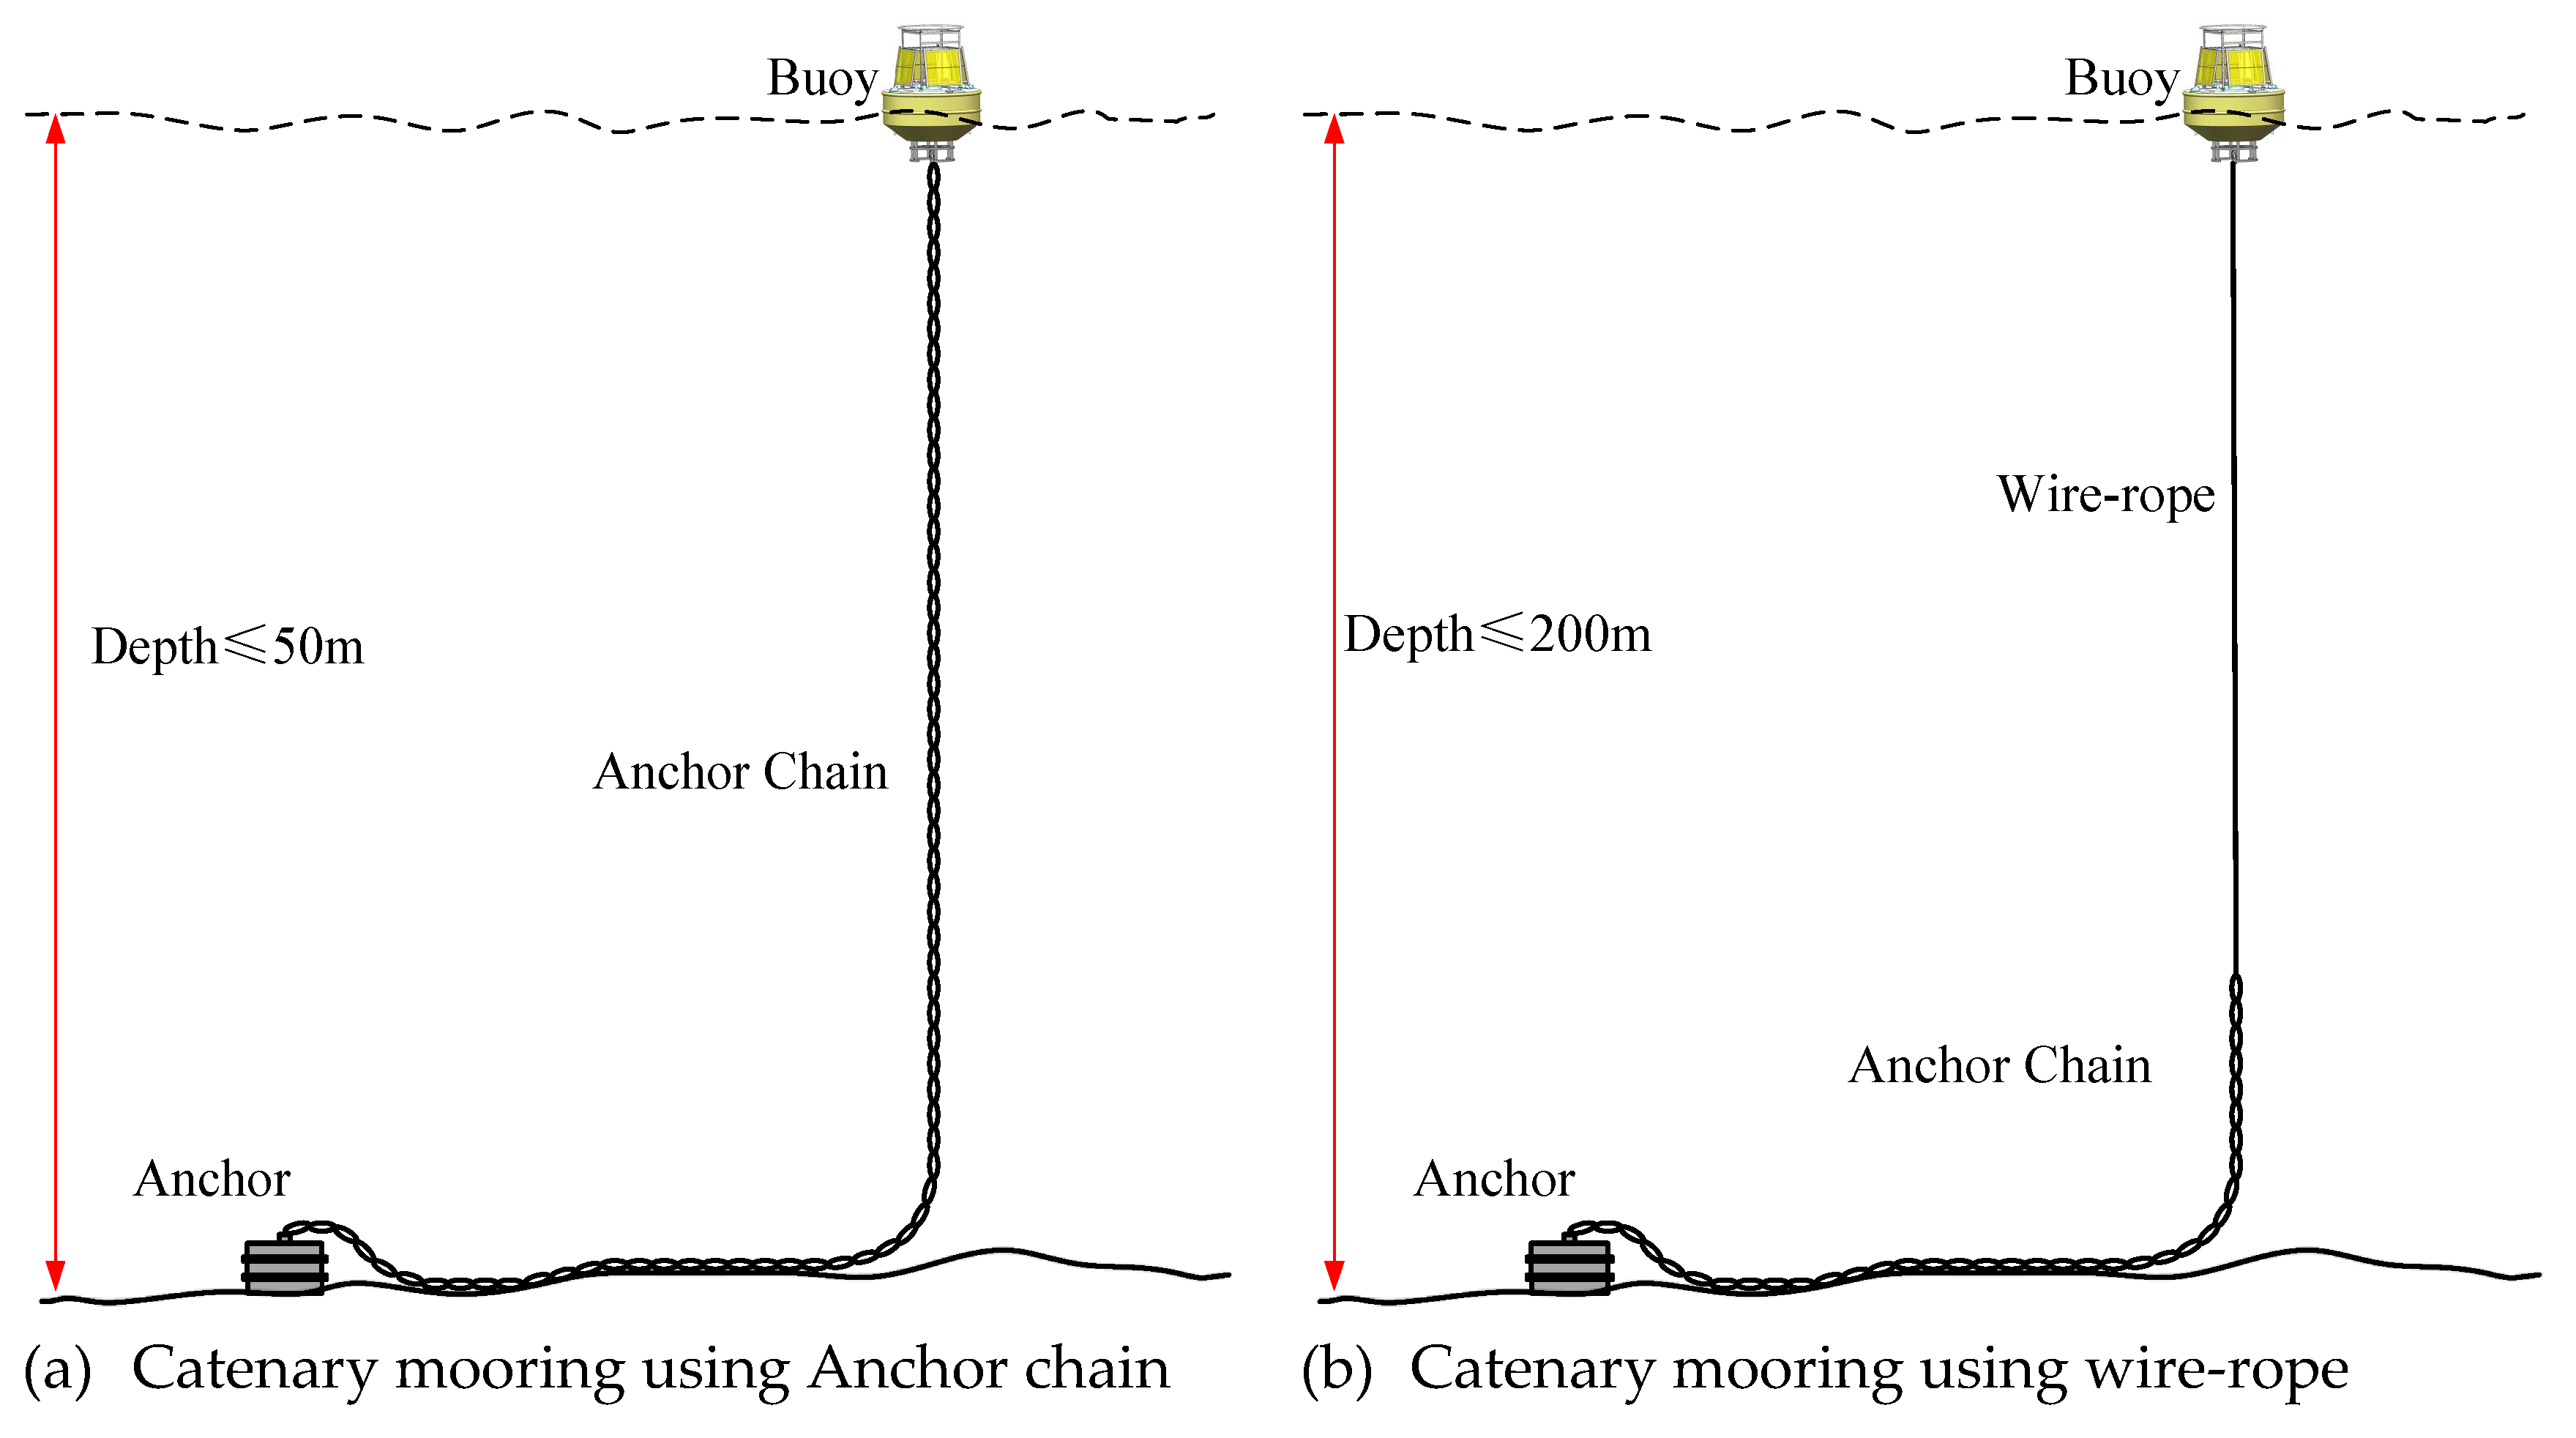
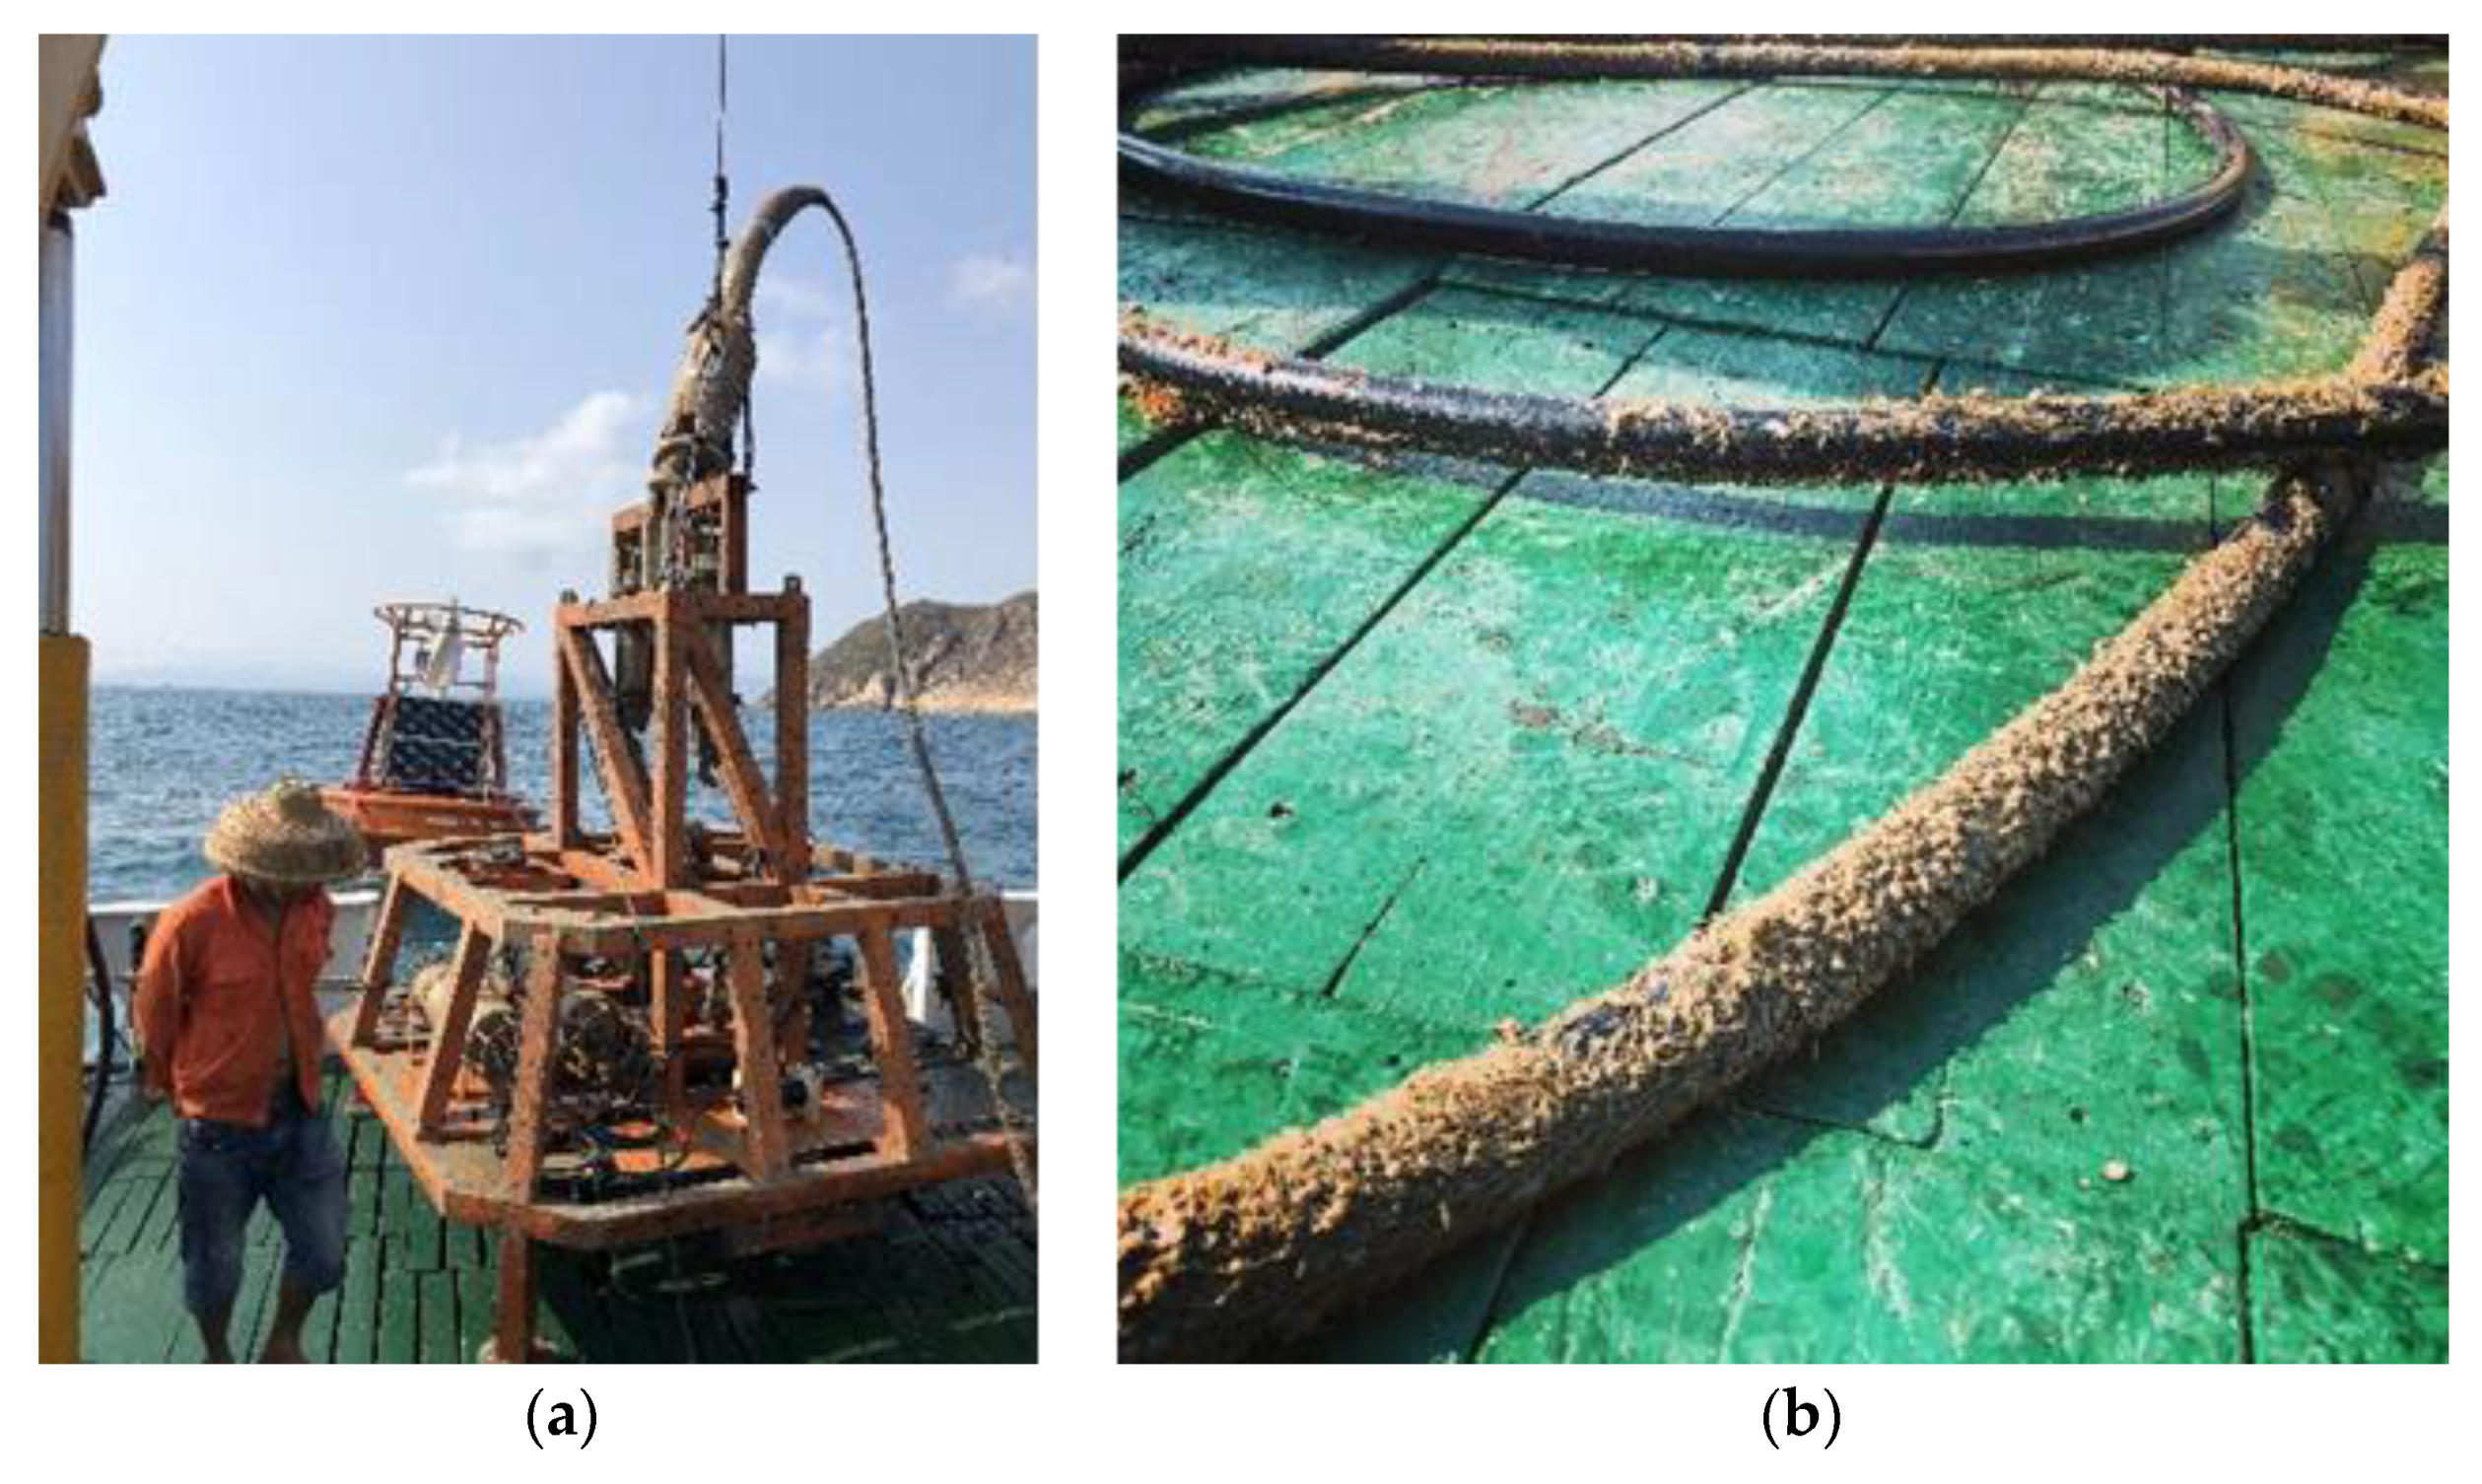
Catenary mooring is mainly used in shallow water, and its configuration is also the simplest. As shown in Figure 1a, a mooring chain is usually used as the mooring string when the water depth is lower than 50 m; when the water is deeper, the upper part of the mooring chain is usually replaced by a cable to reduce its weight, as shown in Figure 1b. The cost of this kind of mooring configuration is low, but it can only be placed in shallow water and it is difficult for this mooring configuration to resist strong wind and waves; it is also harmful to the ecosystem of the seabed, as the mooring chain is in contact with the seabed.
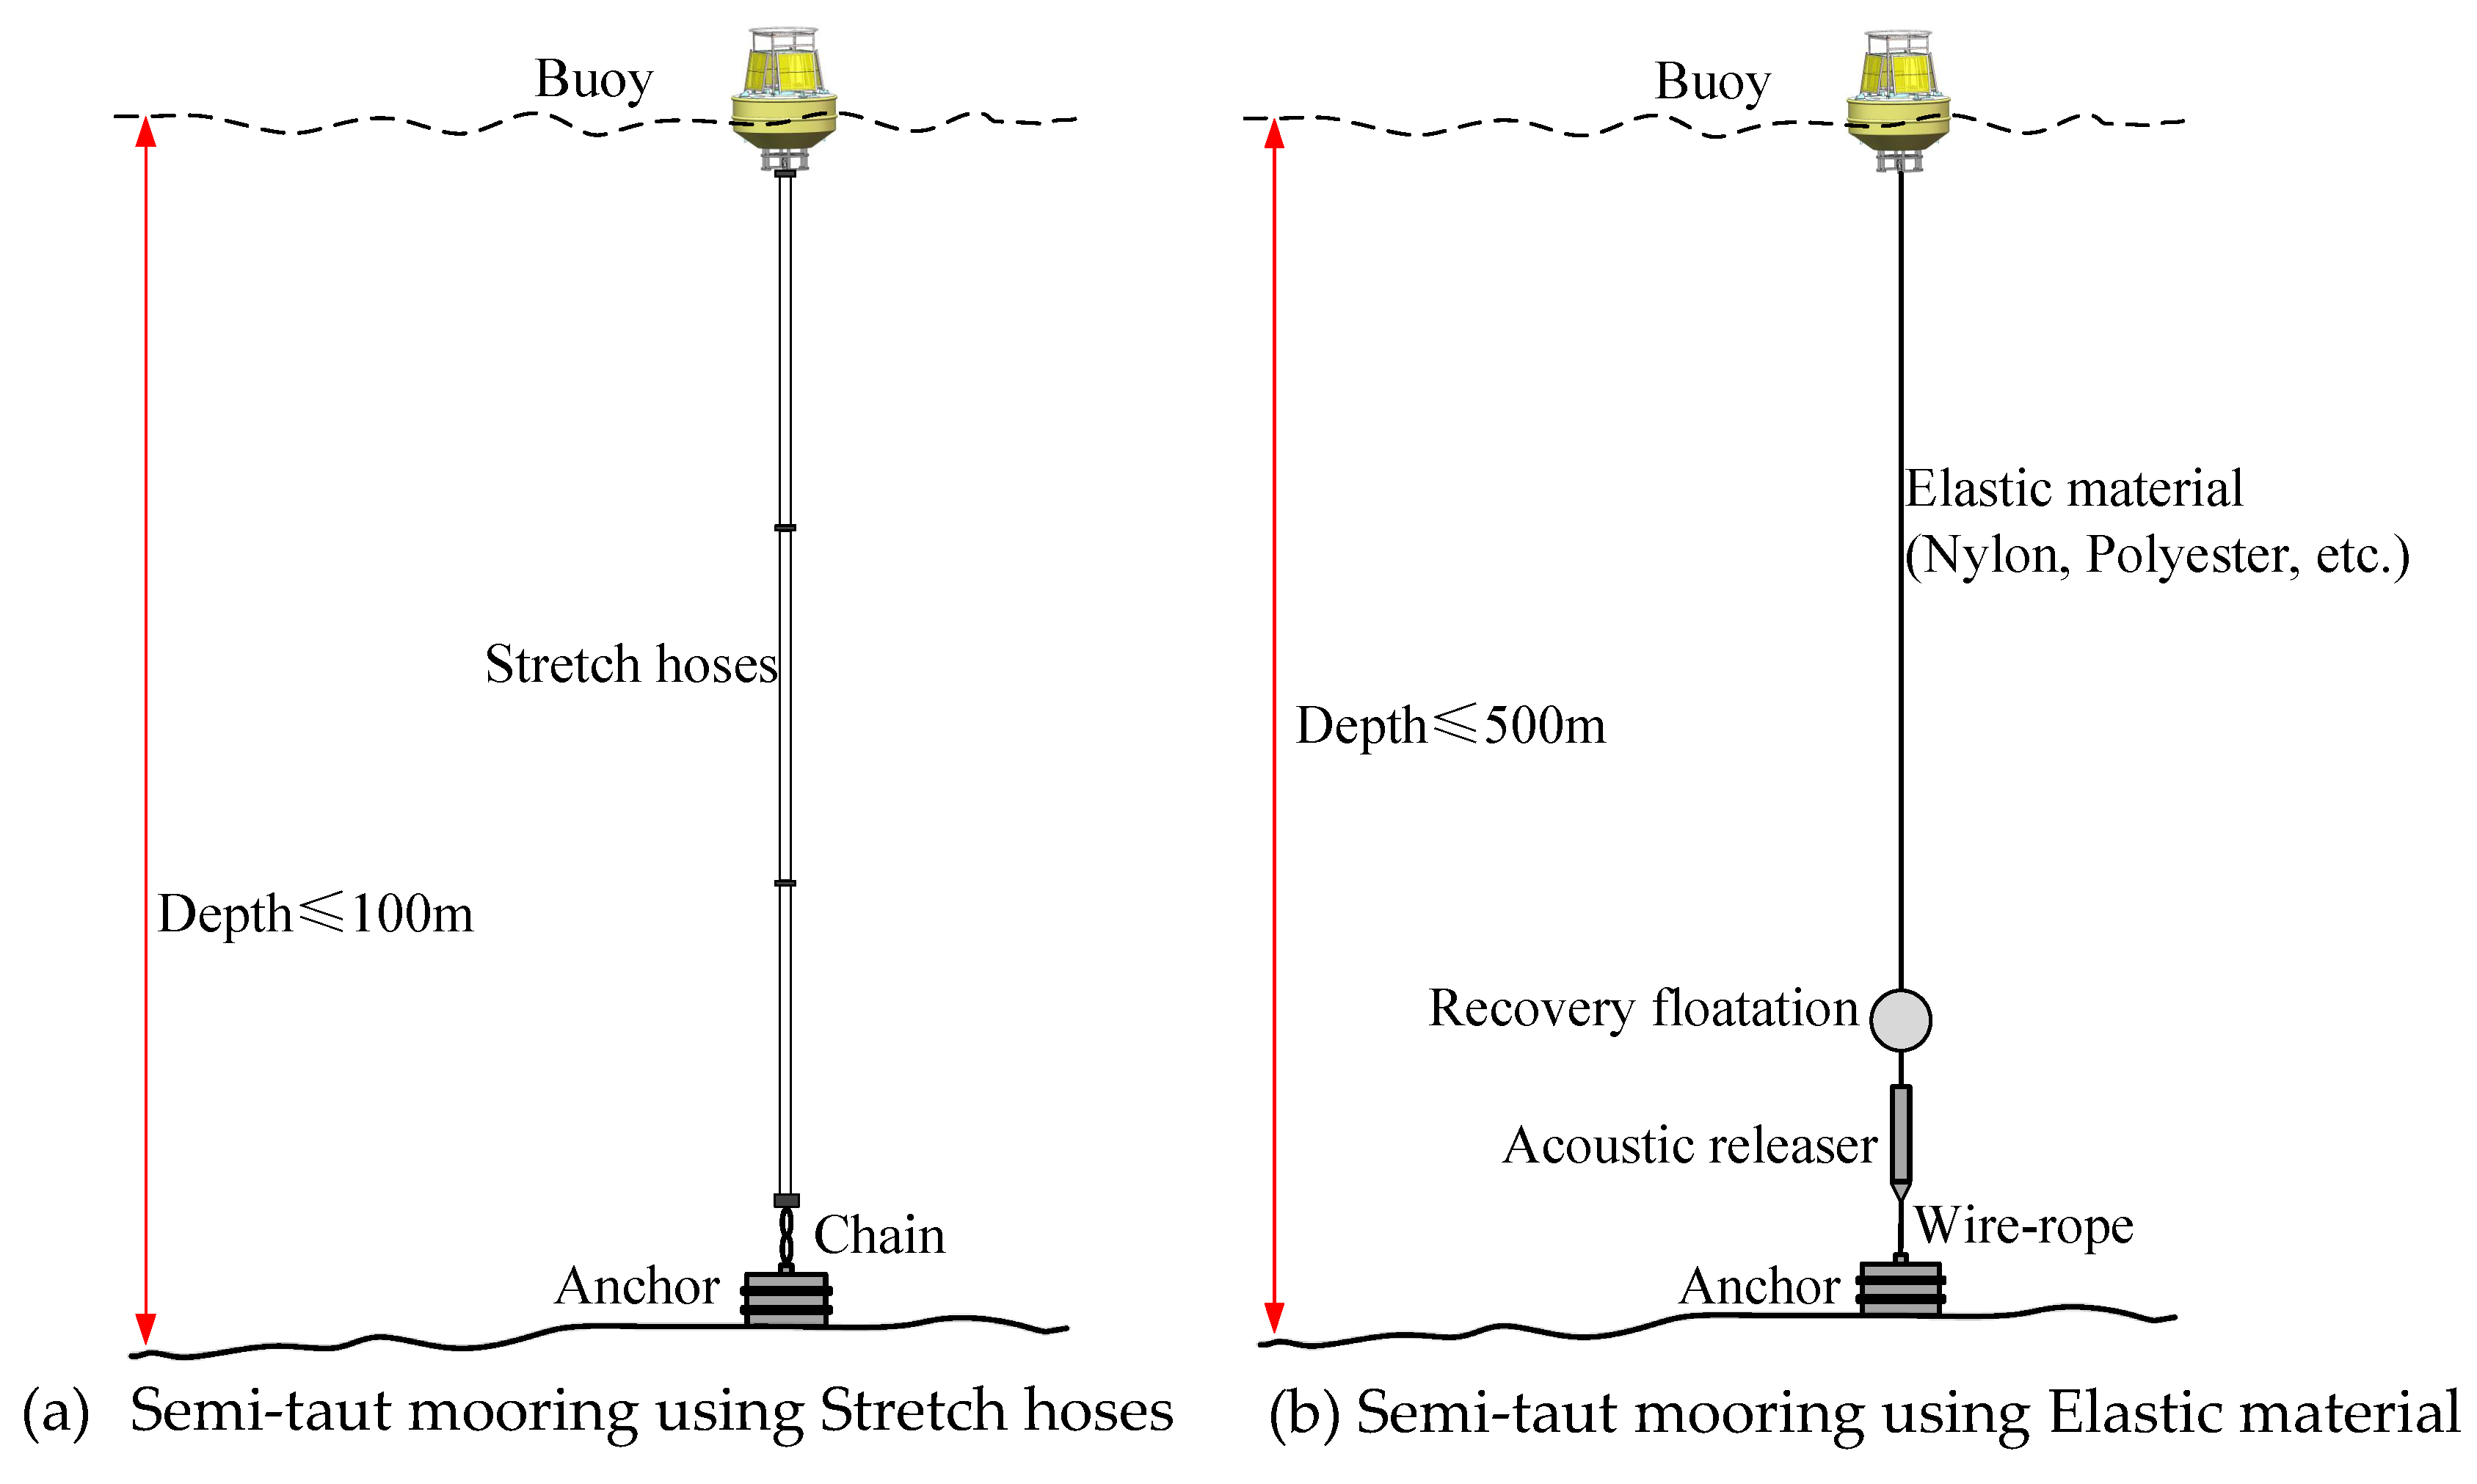
A semi-taut mooring system moors the buoy on the sea surface using an elastic mooring string, as shown in Figure 2. The mooring string is usually made of nylon, polyester, and polypropylene. The bottom of the semi-taut mooring system is not contact with the seabed, thus having little impact on the marine ecological environment. However, it is necessary to know the water depth before laying a semi-taut mooring system, as the length of the mooring chain needs to be determined according to the water depth, such that the mooring string always maintains a certain tension. According to the requirements of the whole system, some sensors (e.g., CTD (conductivity temperature depth), ADCP (acoustic doppler current profilers), and so on) may be installed in the middle of the mooring string. A float and acoustic releaser are usually installed at the lower part of the mooring string, to facilitate the recovery of mooring string and the observation instruments.
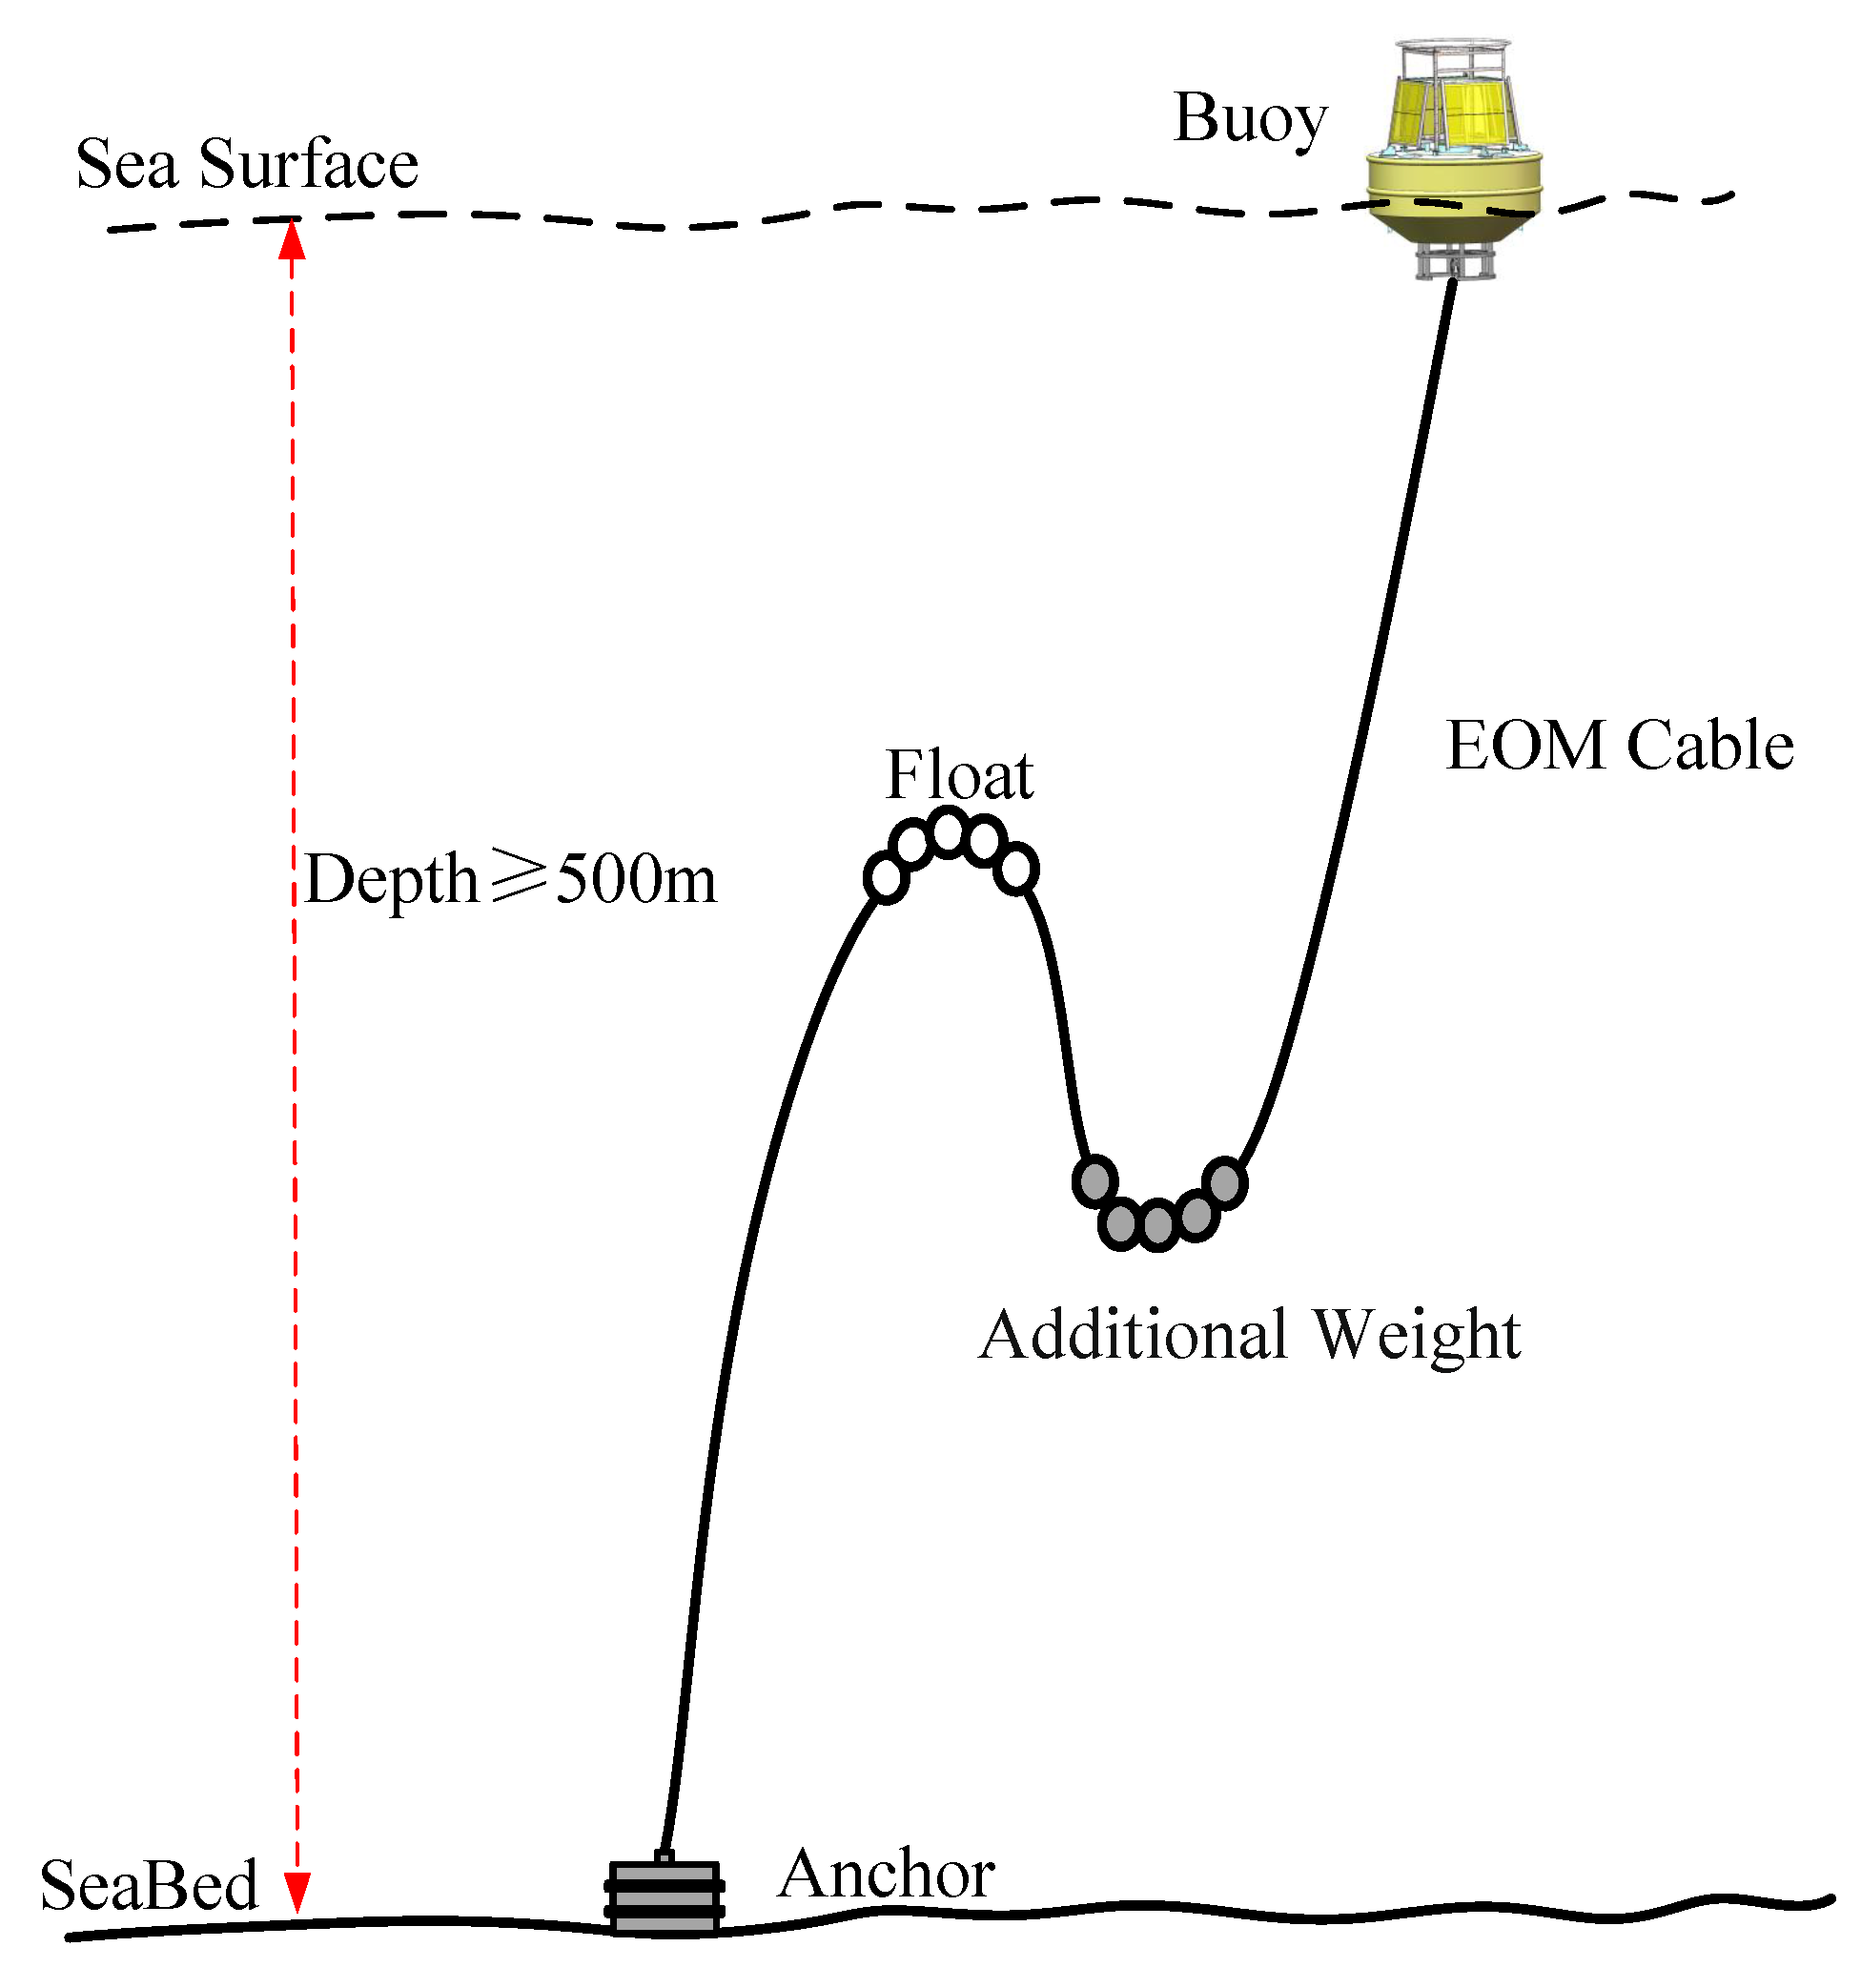
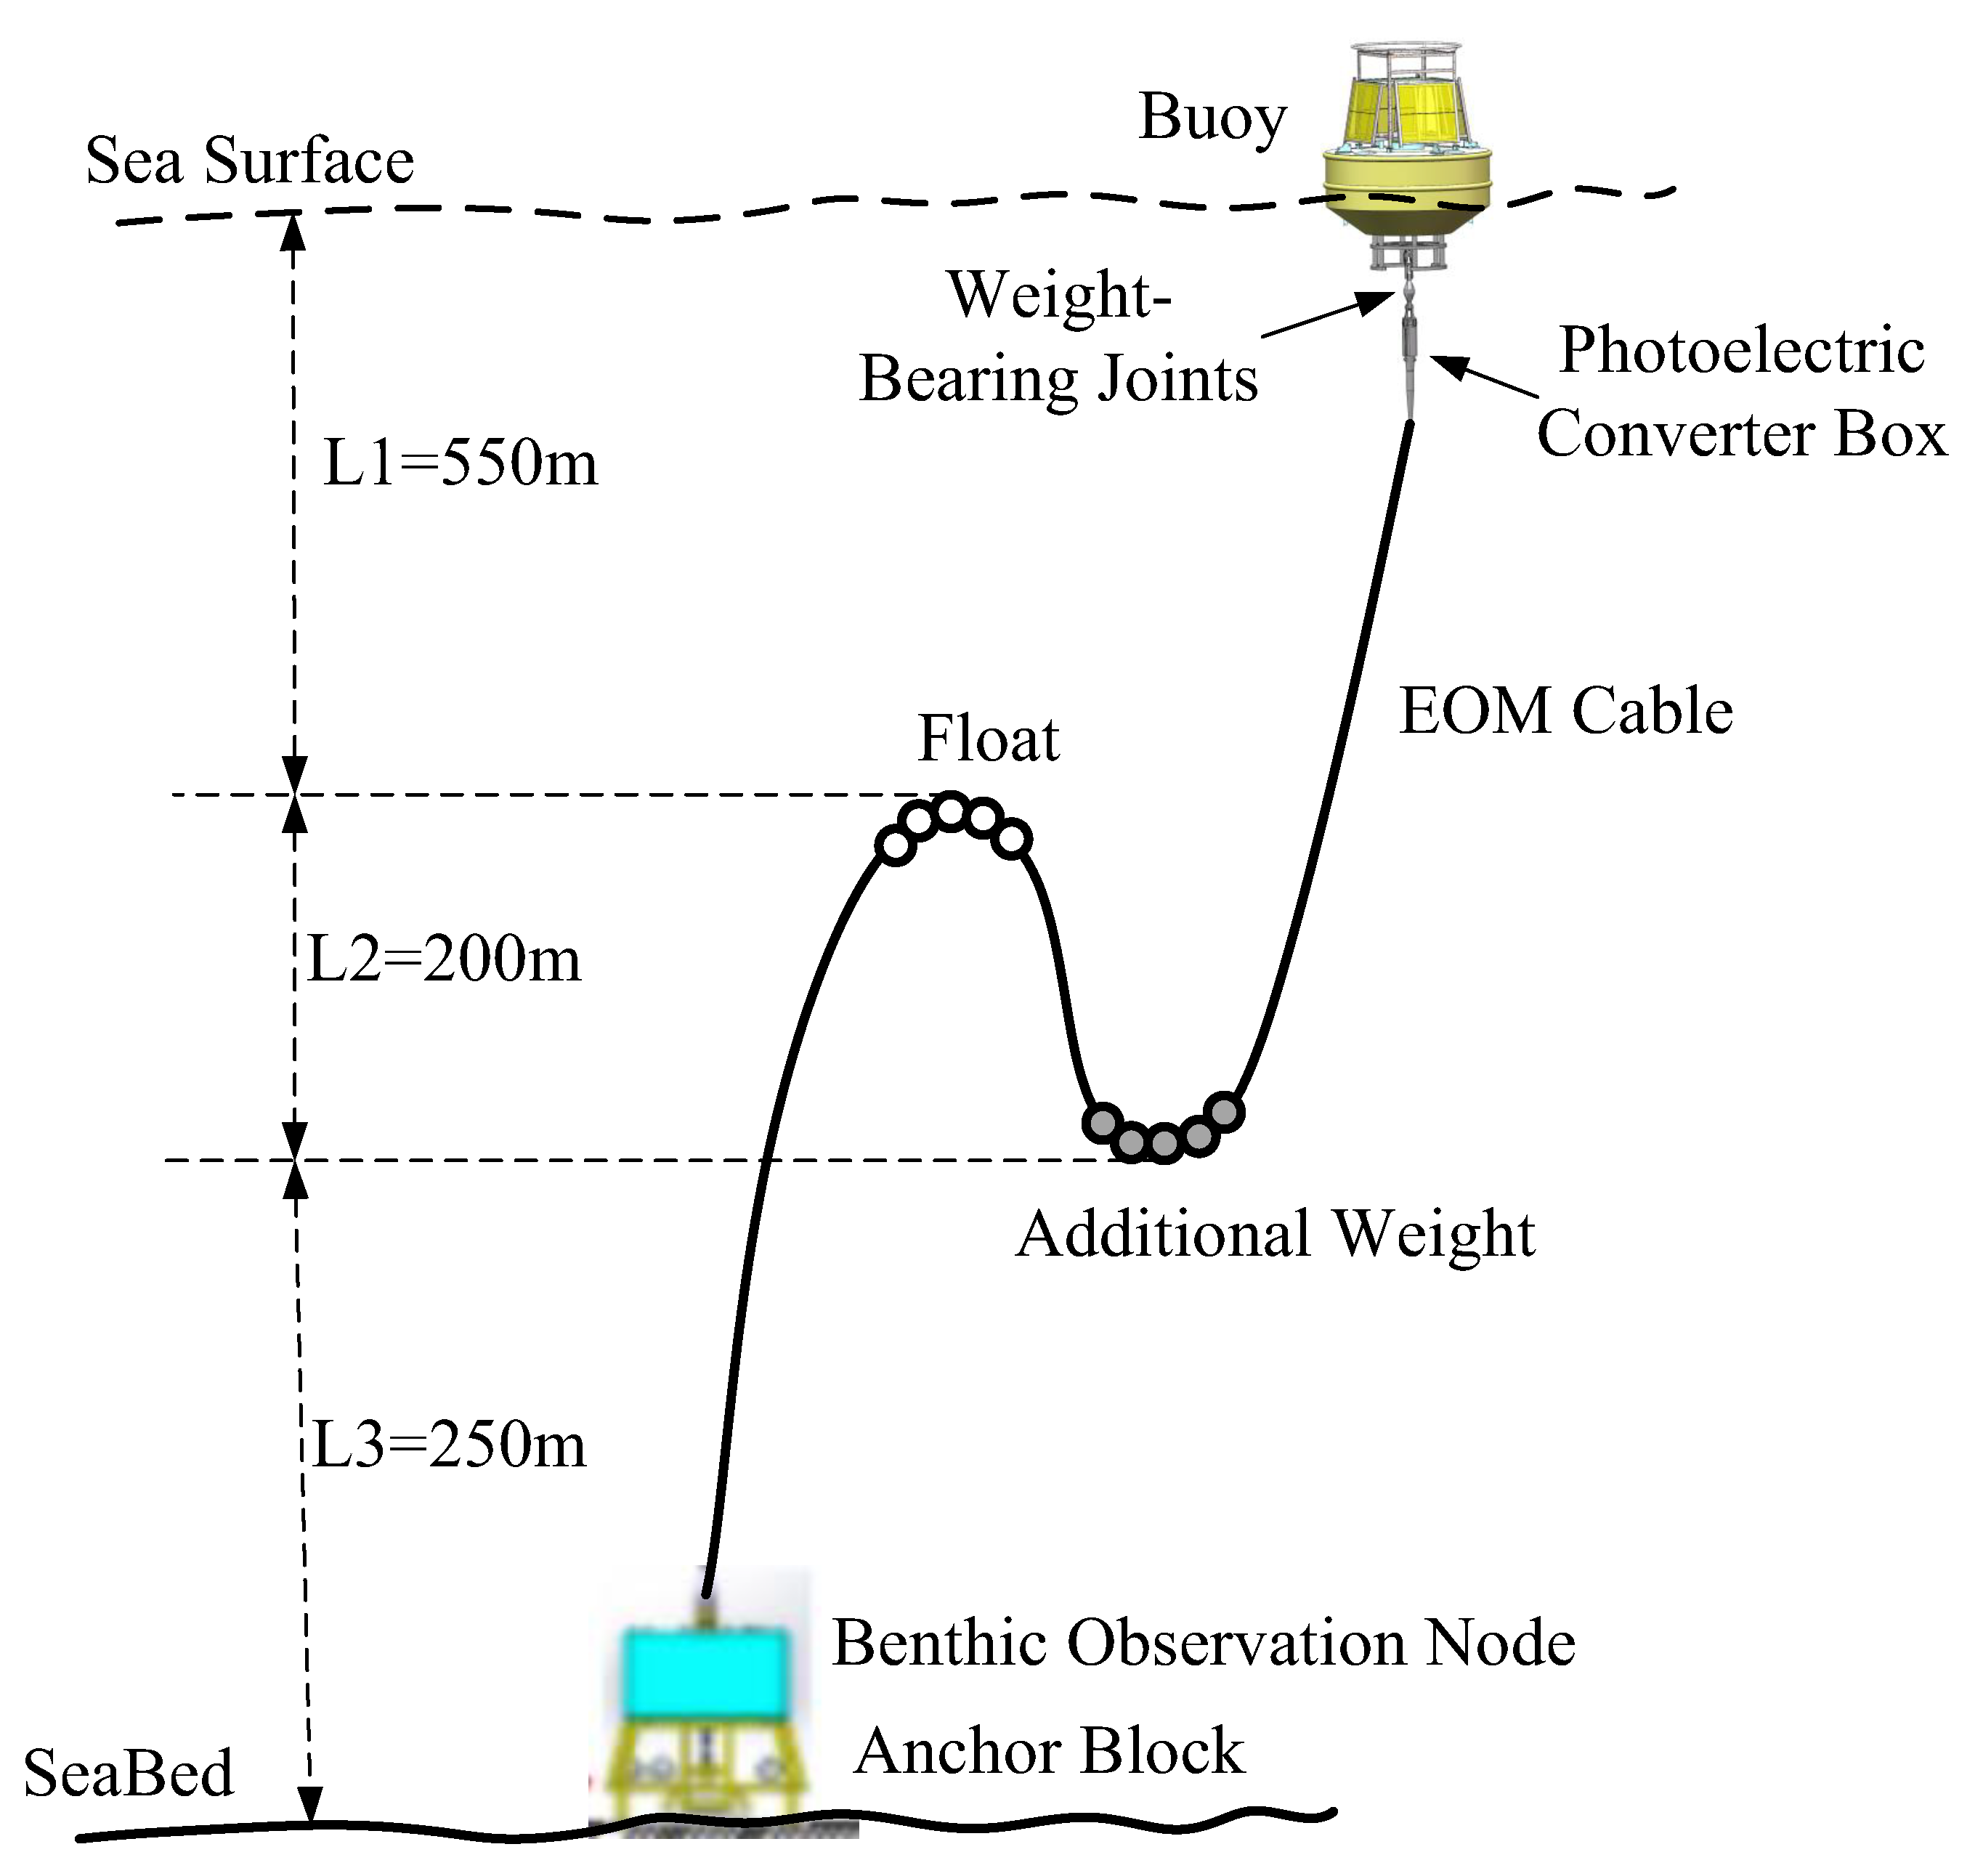
The most significant feature of inverse-catenary moorings is that the middle section of the mooring string has the shape of an ‘S’, as shown in Figure 3. There is not much difference of the mooring design for differing sea water densities. Common materials are polyolefin, polyester, and nylon. This type of mooring system is usually deployed in waters with a depth greater than 500 m. It can resist the impact of high-velocity currents and has high survivability in extreme marine environments. It is suitable for deployment in deep seas, but requires a longer mooring chain, its assembly is more difficult, and this type of mooring system is more costly.
Many scholars have studied the mooring technology of floating structures. Imanol Touzon et al. analyzed the numerical results of applying three different well-known mooring design methods to floating wave energy converters moored by four catenaries. The simulation was carried out under extreme environmental conditions. After analyzing the simulation results, it was found that the wire tension is greatly affected by resistance and inertial force. The author believed that this effect comes from the sudden load caused by the fluctuation of the float [3]. Sergej Antonello Sirigu et al. experimentally studied the mooring system of a wave energy converter, where the influence of the mooring layout on loads in extreme wave conditions was the focus of the research. The peak load of the mooring system was reduced by changing the configuration of the mooring system [4]. Magnus Thorsen Bach-Gansmo et al. presented the dynamic behavior and line loads of a FOWT (Floating offshore wind turbines). They used physical experiments and numerical codes to investigate the mooring and floater response when moored with elastic mooring lines. The influence of the mooring line angles and the pretension in the mooring line of the mooring system was studied experimentally [5].
Many scholars have studied the mooring technology of floating structures. Imanol Touzon et al. analyzed the numerical results of applying three different well-known mooring design methods to floating wave energy converters moored by four catenaries. The simulation was carried out under extreme environmental conditions. After analyzing the simulation results, it was found that the wire tension is greatly affected by resistance and inertial force. The author believed that this effect comes from the sudden load caused by the fluctuation of the float [3]. Sergej Antonello Sirigu et al. experimentally studied the mooring system of a wave energy converter, where the influence of the mooring layout on loads in extreme wave conditions was the focus of the research. The peak load of the mooring system was reduced by changing the configuration of the mooring system [4]. Magnus Thorsen Bach-Gansmo et al. presented the dynamic behavior and line loads of a FOWT (Floating offshore wind turbines) They used physical experiments and numerical codes to investigate the mooring and floater response when moored with elastic mooring lines. The influence of the mooring line angles and the pretension in the mooring line of the mooring system was studied experimentally [5].
CUMAS (Cabled Underwater Module for Acquisition of Seismological data) was designed to extend the land surveillance network towards the wide marine sector of calderas, as shown in [6,7]. The system was deployed within 100 m of depth. The system is located at the Campi Flegrei caldera (southern Italy), one of the most hazardous and populated volcanic areas in the world. The scientific sensors include a seismometer, hydrophone, ocean current meter, and water thermometer. The MBARI Ocean Observatory System (MOOS) prototype, which is shown in [8,9,10], utilizes an EOM cable to deliver power from the buoy to the seafloor instruments, realize communication between the instruments and the buoy, and which can be deployed in the deep ocean (up to 4000 m depth). The surface buoy collects solar and wind energy, where horizontal axis wind turbines and solar panels are utilized for power collection. The wind turbine has a rotor diameter of 1.2 m with 300 W output in 12.5 m/s wind. The actual power is 60 W, which depends on the wind speed. The wind turbine and solar provide 48 V DC power bus for the battery. Through a DC–DC Converter, the system provides 12 V DC for the buoy equipment and 375 V DC for the ocean benthic instruments.
Satellite communication offers a low-bandwidth path for buoys, while optical fiber communication provides a high-bandwidth path from the seafloor to sea surface; for example, through an EOM cable. The cable utilized in the MOOS system is different from that in the seafloor observation network. The traditional EOM cables utilized in seafloor networks are armored EOM cable, which lie on the sea bottom statically. An armored EOM cable is not suitable for deep sea buoy mooring, however. The EOM cable has to be designed to have net buoyancy, in order for it to hang in the water for a long time. This kind of EOM cable requires high strength, excellent bending property, watertight performance, and wear resistance. Vectran fibers, nylon, and polyester are generally selected as the strength material. The properties of EOM cables with different strength materials have been compared in [11,12,13,14], especially the properties of the static and dynamic responses of mooring EOM cables.
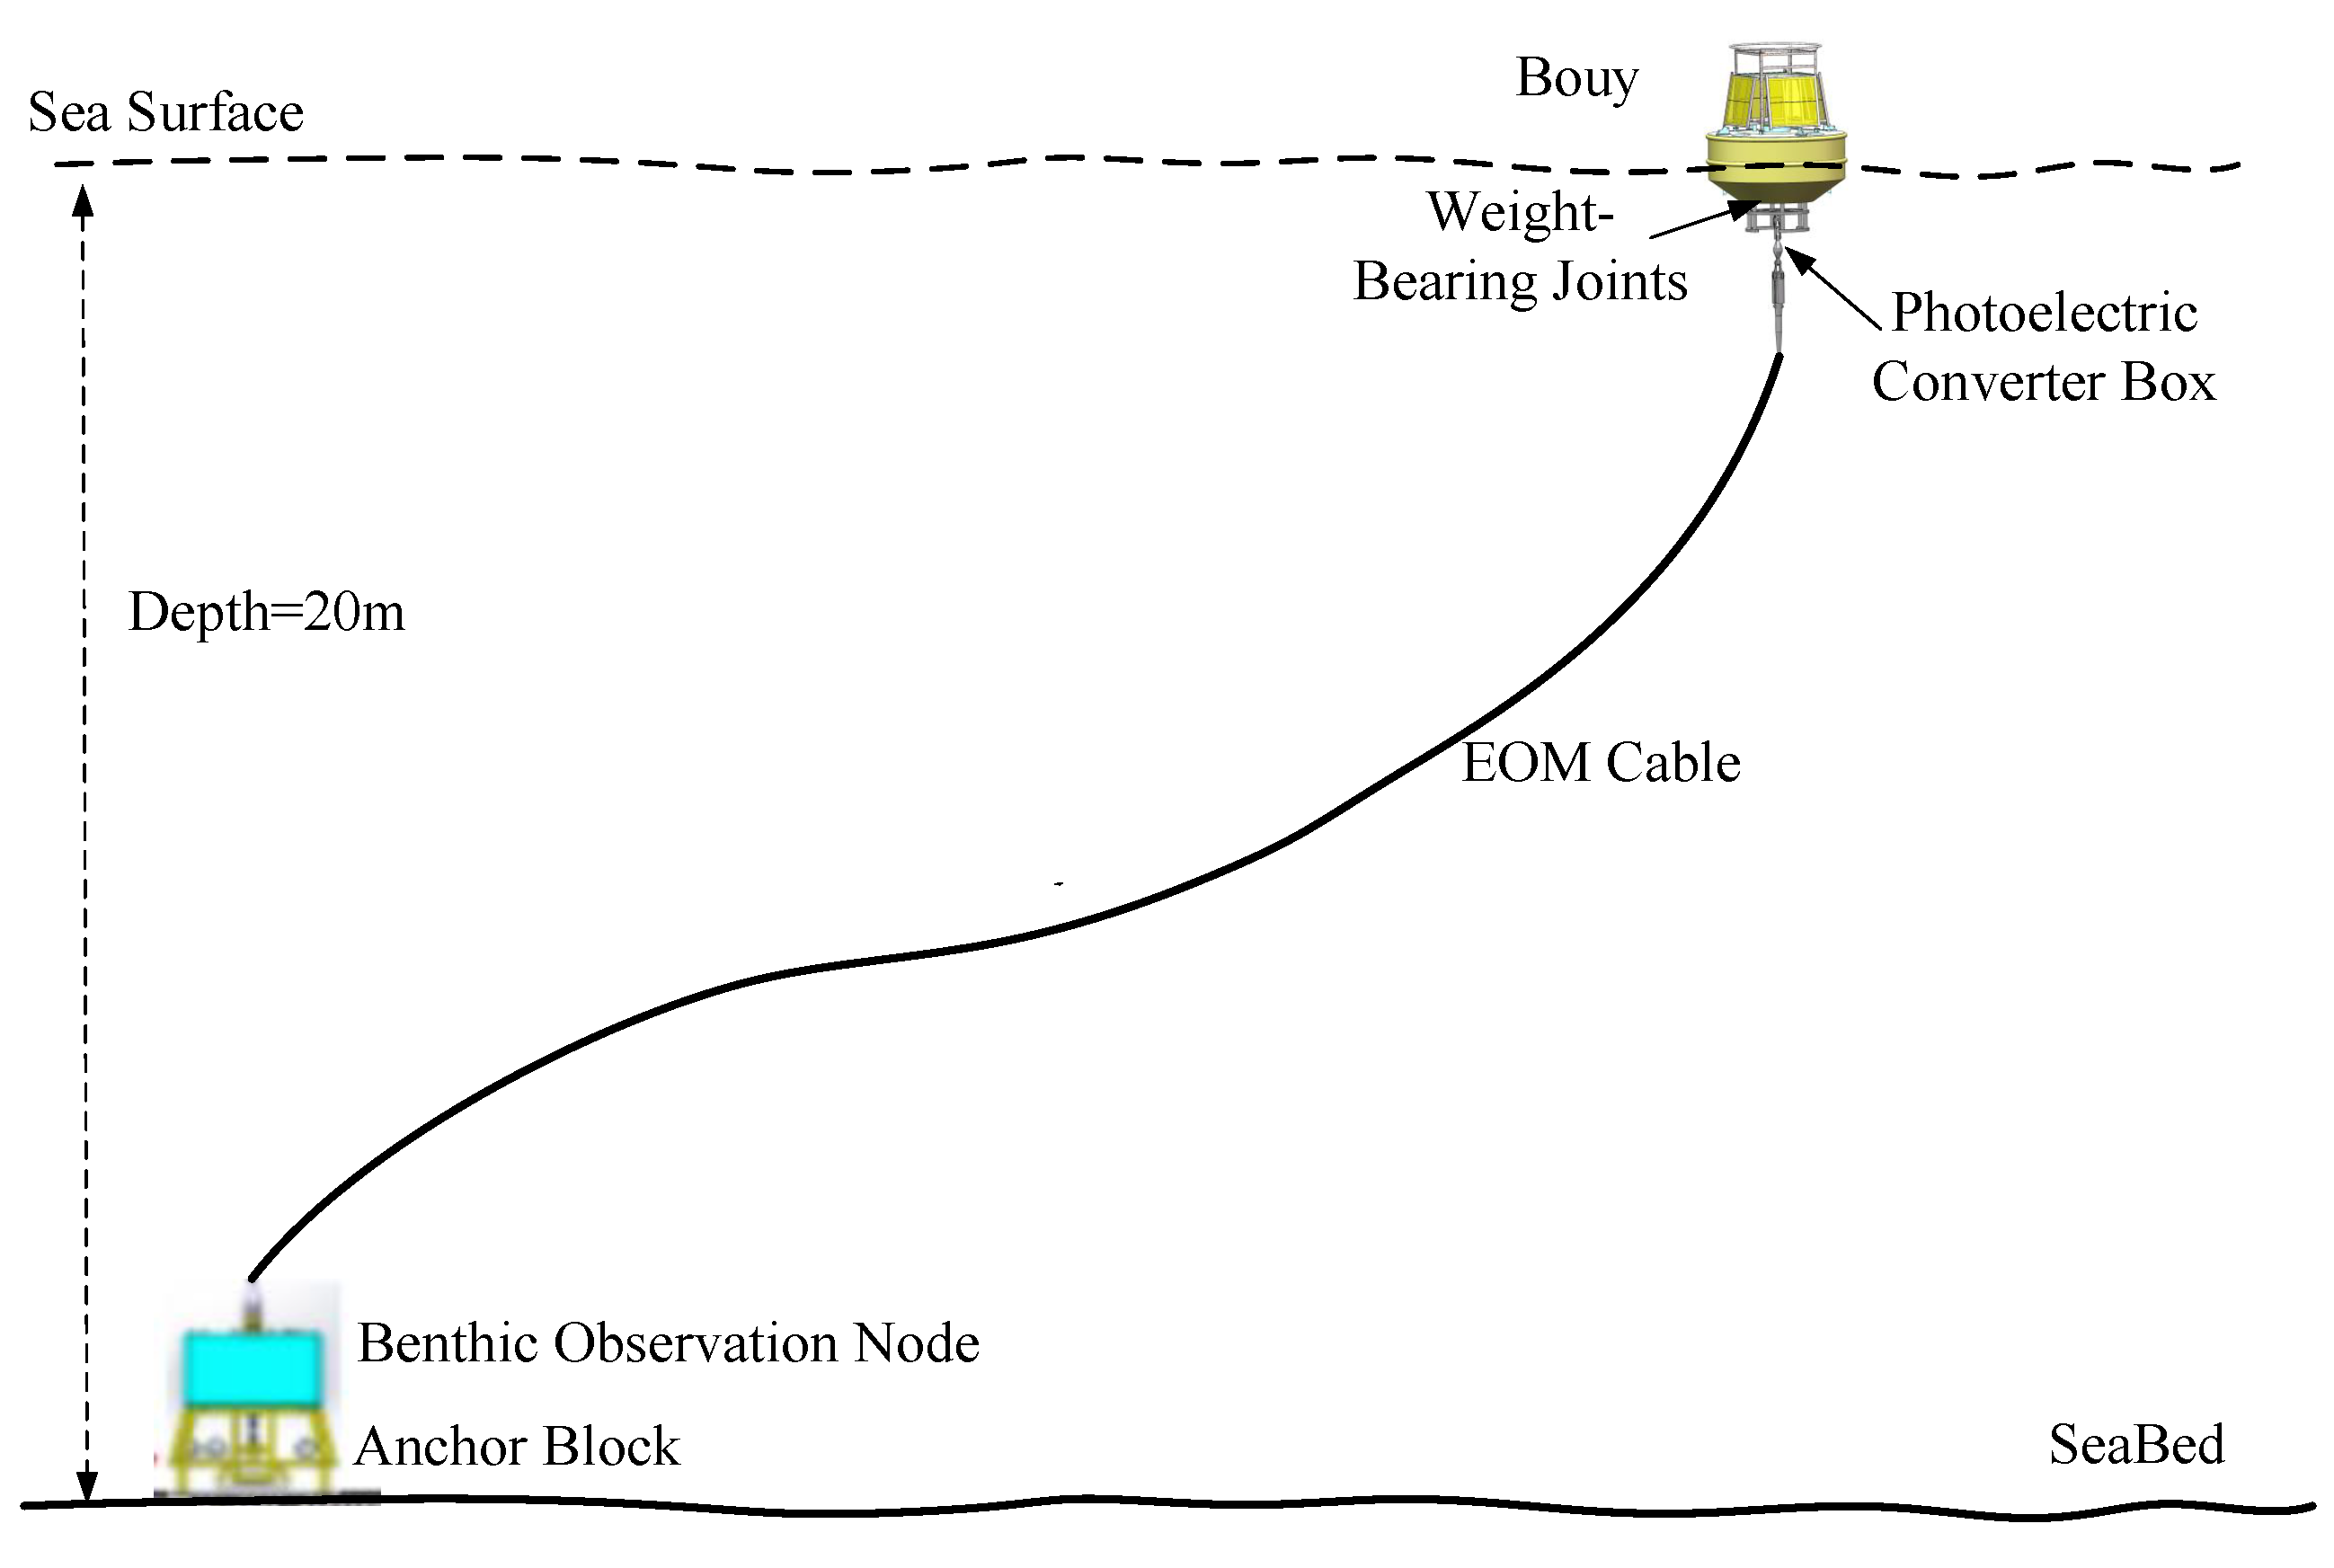
The tether technology is generally implemented in shallow ocean areas, as shown in [6,7], where the anchoring rope and coaxial copper conductors are roped together as the mooring component [13,15], such that the coaxial cable does not have to be pulled. The analog signals are transmitted by the coaxial cable and transferred to digital signals by the A/D converter at the buoy and seafloor. This kind of mooring method is difficult to utilize in deep sea, however, as it is hard to launch and recover the system in such conditions, while the anchor chain and cable are entangled together.
DEOS (Dynamics of Earth and Ocean Systems) [16] provides the design concept of the moored buoy observatory, which is comprised of a cable link and a high-bandwidth observatory employing a discus buoy, where the buoy uses an electro-optic cable to connect the seafloor and moored instruments to the surface. The C-Band satellite telemetry system is utilized in DEOS with continuous high-bandwidth communication (64–128 kbps or higher). The buoy is equipped with a diesel generator to supply enough power (up to 1000 W) for the benthic node. Acoustic communication was selected to construct the link between the surface and seafloor. A solar-powered, low-power satellite telemetry system delivers ~5 Mbyte data to shore. The prototype system of Cyprus-TWERC (Tsunami Warning and Early Response system of Cyprus) and CSnet’s Offshore Communications Backbone (OCB), for up to 3000 m depth, were designed to support a modular architecture which may be linked together with several buoys, as shown in [17,18,19]. The OCB consists of a buoy, a buoy riser cable (mooring/power and communications), an anchor, a seafloor cable, and four seafloor nodes. Cyprus-TWERC serves as the prototype Tsunami Warning and Early Response system. The surface buoy is equipped with a C-Band satellite antenna and can offer data bandwidth in excess of 2 Mbps. The buoy is powered by a diesel electrical generator which offers 1000 W power to the seafloor. The seafloor junction box is equipped with wet-mateable “plug-in” ports. Cyprus-TWERC can quickly transmit tsunami information to coastal residents and local government departments, such that they can take corresponding preventive measures.
GEOSTAR (GEOSTAR is a single-frame autonomous seafloor observatory) was developed as a single-frame seafloor observatory for geophysical and environmental monitoring, which is shown in [20]. This system is able to operate from shallow waters to deep-sea (down to 4000 m). GEOSTAR includes a Bottom Monitoring System, a communication buoy, and a MODUS vehicle (MODUS, a simplified ROV, is the special vehicle for the deployment/recovery procedures.) The MODUS vehicle and hydraulic winch are utilized for the launch and recovery of the Bottom Monitoring System. The communication buoy is equipped with an acoustic hydrophone and a satellite antenna, in order to establish the data transition link from the Bottom Monitoring System to a shore station. A ship controls the MODUS remotely, through the EOM cable. The hydraulic winch launches and recovers the Bottom Monitoring System. GEOSTAR does not utilize wet-mateable “plug-in” for seafloor installation. The MODUS separates from the Bottom Monitoring System after deploying it on the seafloor.
Dimitris Konovessis et al. studied the development of relevant laws and regulations for offshore floating structures in recent years, summarizing some representative cases of sexual maritime safety accidents. After analyzing the destabilization evaluation rules of related organizations (e.g., classification societies), the key issues of stability requirements were pointed out and, finally, some reasonable safety methods were proposed for the future development of stability requirements of floating offshore structures [21]. K.P. Thiagarajan and H.J. Dagher reviewed some key studies involving the floating infrastructure of offshore wind turbine systems. These floating foundation structures can be divided into three categories, according to their stability sources; namely, (1) ballast stabilized (low center of gravity; e.g., spar), (2) mooring stabilized (e.g., tension leg platform), and (3) buoyancy or water-plane stabilized (e.g., semi-submersible). Through the demonstration of key research on three types of floating infrastructure, the authors finally showed that floating offshore wind turbine systems require an intelligent combination of land-based systems and offshore engineering expertise, in order to develop sustainable solutions for the future [22]. Agbomerie Charles Odijie et al. (2017) gave a detailed review of the origin and background of semi-submersible hulls, summarized the major advances in the application of semi-submersible hulls in marine engineering, and compared the technical differences of different semisubmersible hulls and their respective advantages and disadvantages. The authors found that the deep-water semisubmersible hull has better motion characteristics and can offer favorable payloads [23].
Haicheng Zhang et al. established a generalized non-linear network dynamics model of floating airports of arbitrary topological form. Then, the dynamic response was analyzed and the numerical results showed that the non-linearity of connectors plays an important role in the dynamic behavior of the system. In addition, a new concept of stability design for floating airports based on the amplitude death mechanism was proposed for the weak oscillation state of the floating airfield module, which provided theoretical guidance for the safety design of floating airports [24]. Chiemela Victor Amaechia et al. studied the load generated by waves and currents on the hose of the CALM (Catenary Anchor Leg Mooring) buoy, and discussed the influence of flow angle and hose hydrodynamic load on the hose structure response. The bending moment and tensile force distributed along the arc length of the hose were analyzed, and the influence of the increase in bending stiffness at the top connection and the bottom contact point were discussed [25]. Chiemela Victor Amaechia et al. also performed numerical stress analysis for offshore composite risers at a depth of 2000 m. The kind of composite pipe was made of carbon fiber, PEEK (Poly ether ether ketone), and so on. The authors used six different lining materials and designed different composite riser configurations—each configuration having 18 floors—and used the ANSYS ACP 19.0 software to develop a finite element model of the stand pipe, according to the strength of the composites used for composite stress distribution in the riser. The Factor of Safety for The Composite Risers for different Load cases was presented, in order to guide Offshore designers of composite Risers [26].
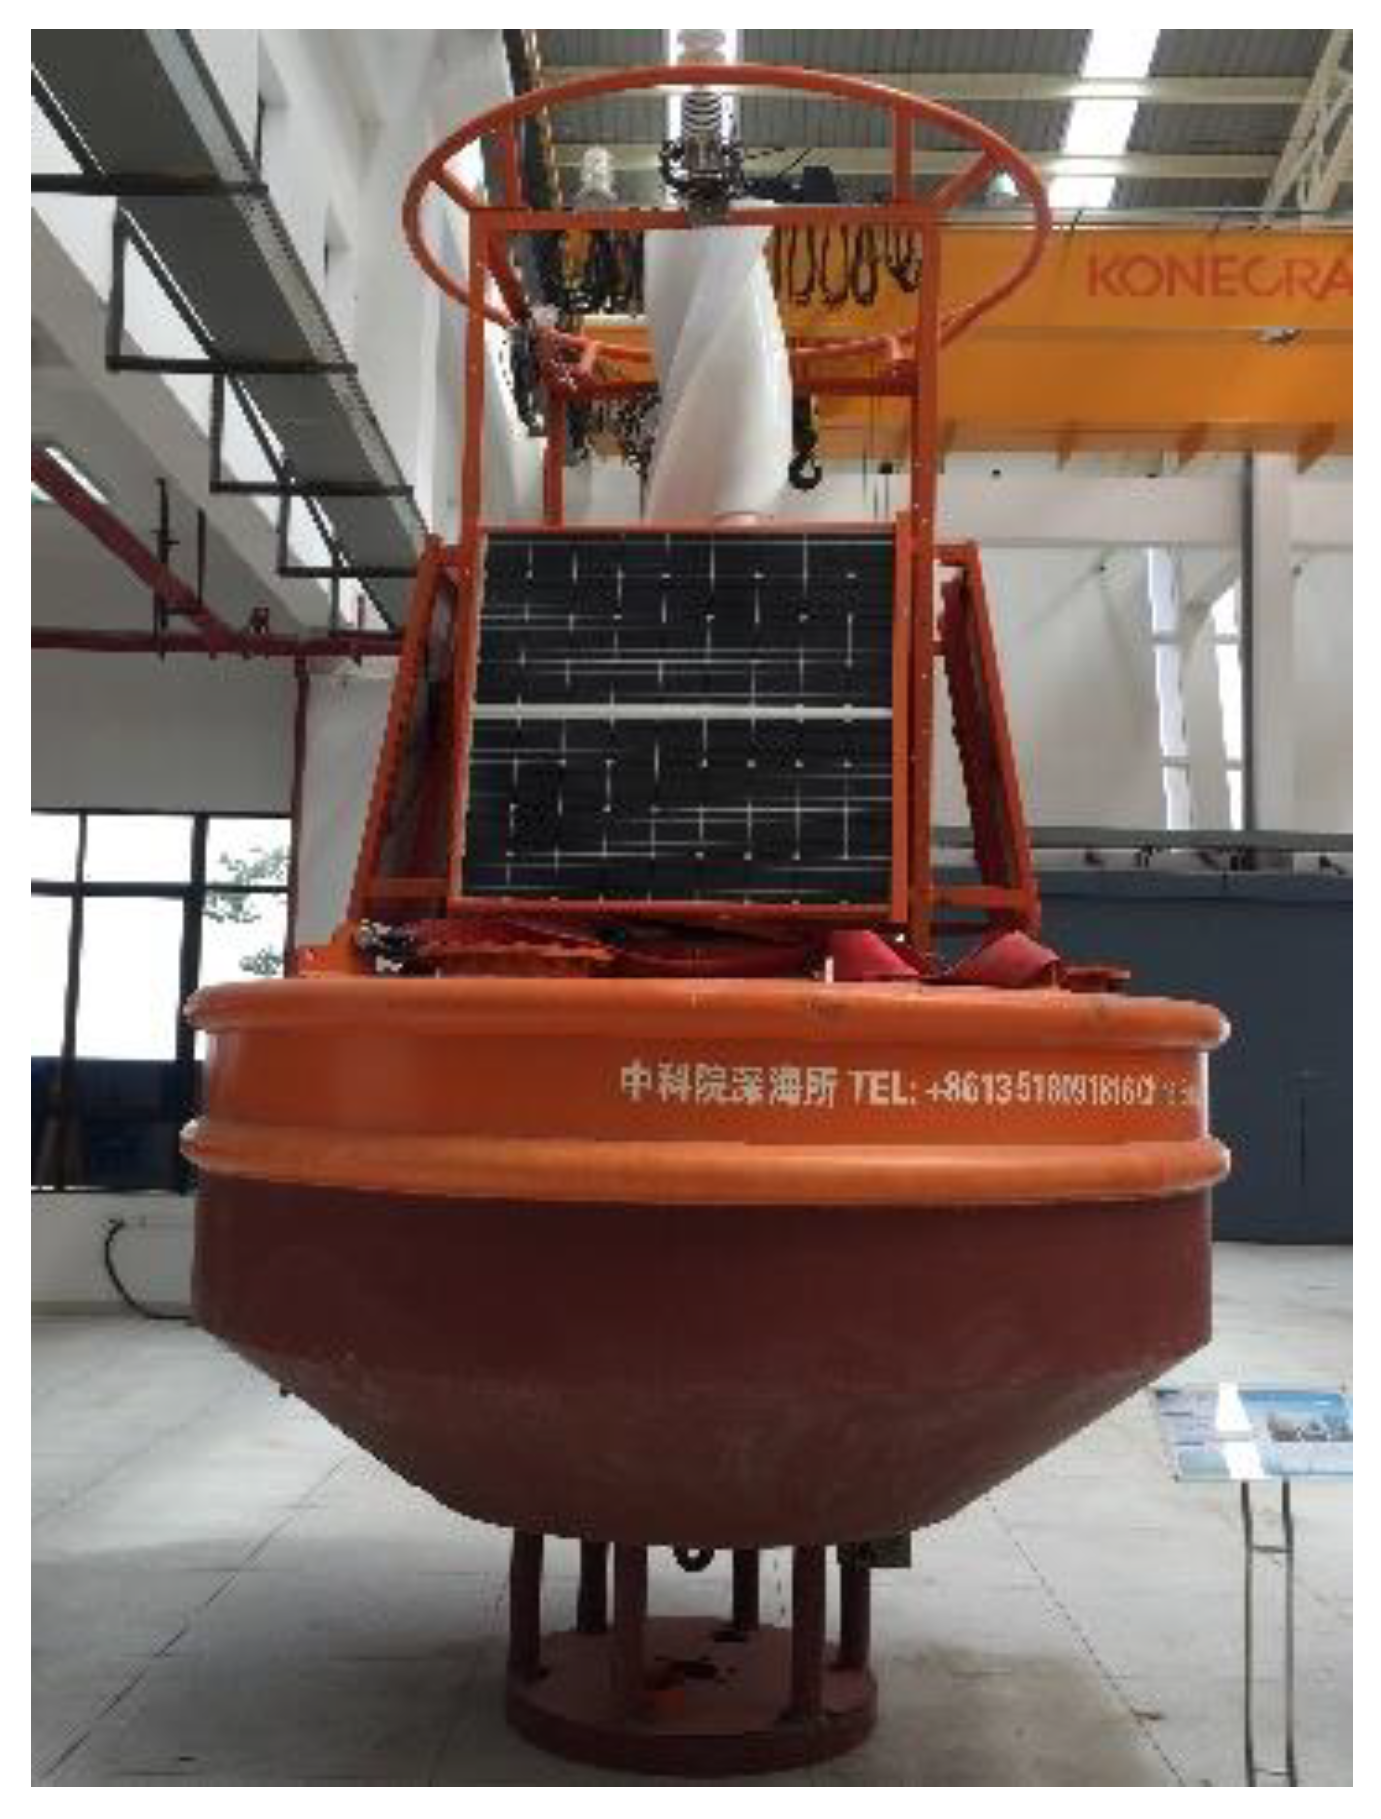
In this paper, the MBOSBC is designed for the seafloor and surface observation of the South China Sea, including (but not limited to) observations of ocean meteorology, ocean physical processes, and water quality of sea surface and seafloor. As the mooring of the buoy is directly related to the survival of MBOSBC, it is extremely important to study the mechanical characteristics of the buoy and the hydrodynamic characteristics of the EOM cable. This is a prerequisite for designing a reasonable mooring scheme.
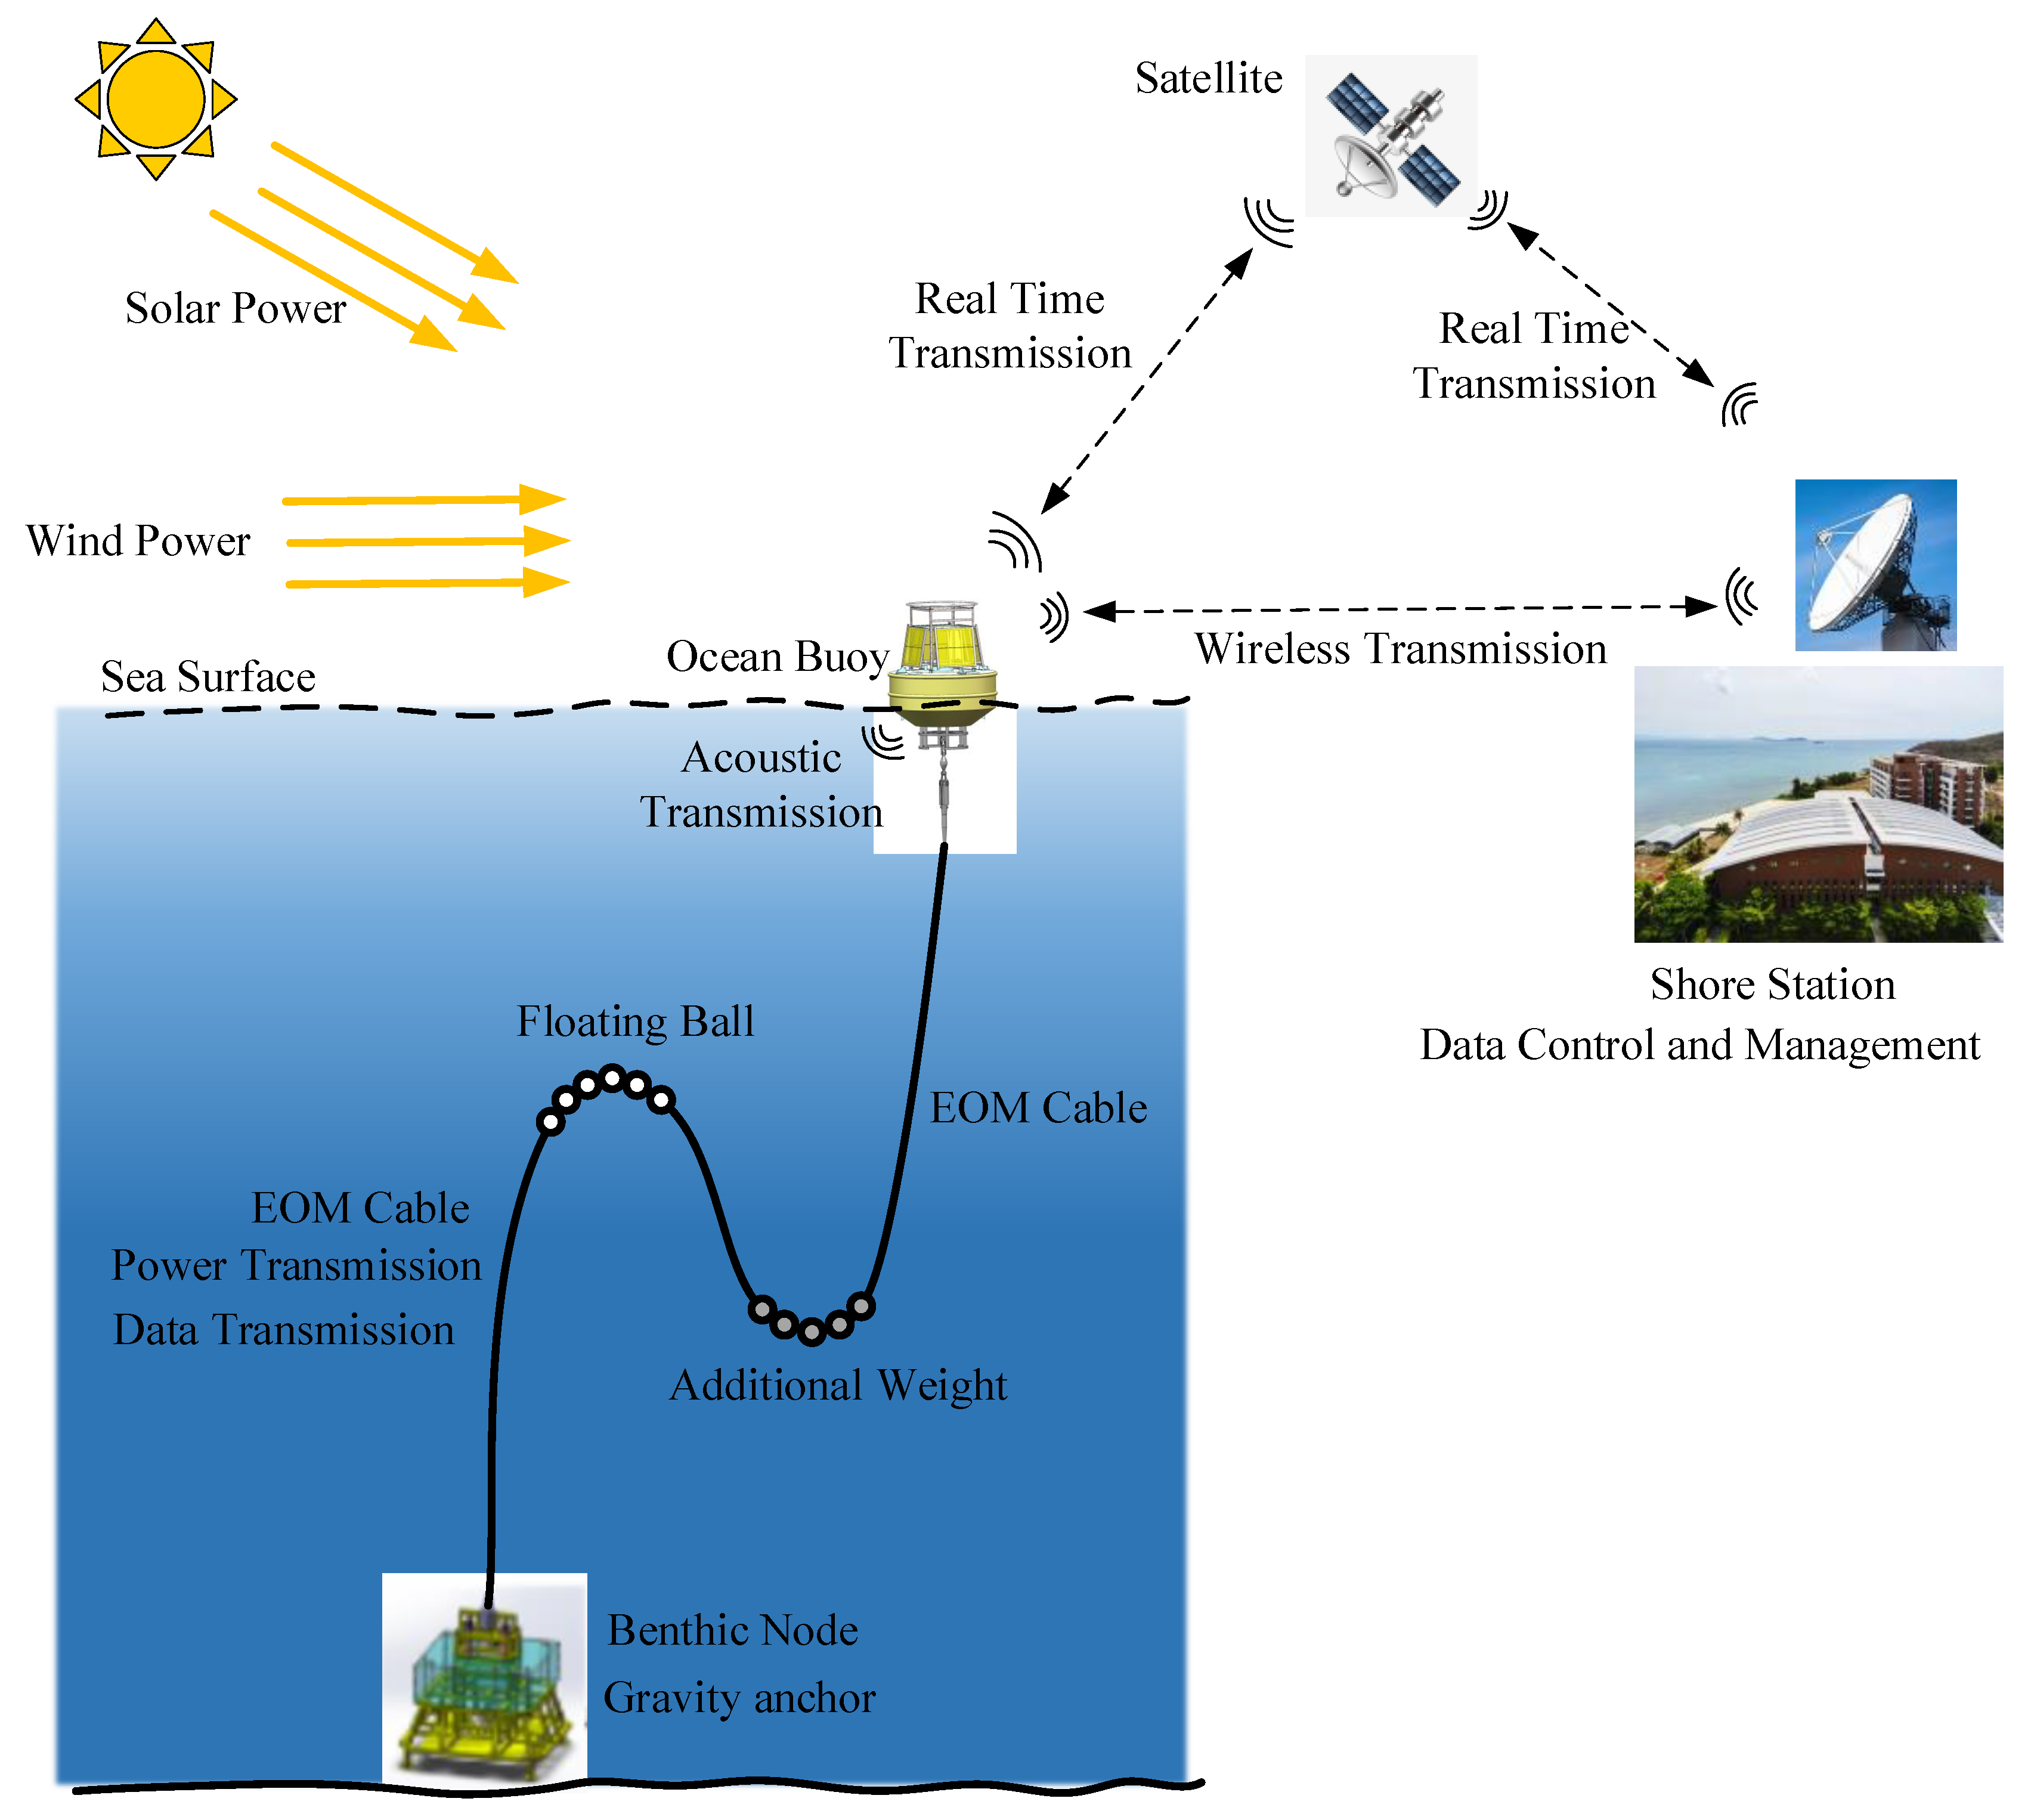
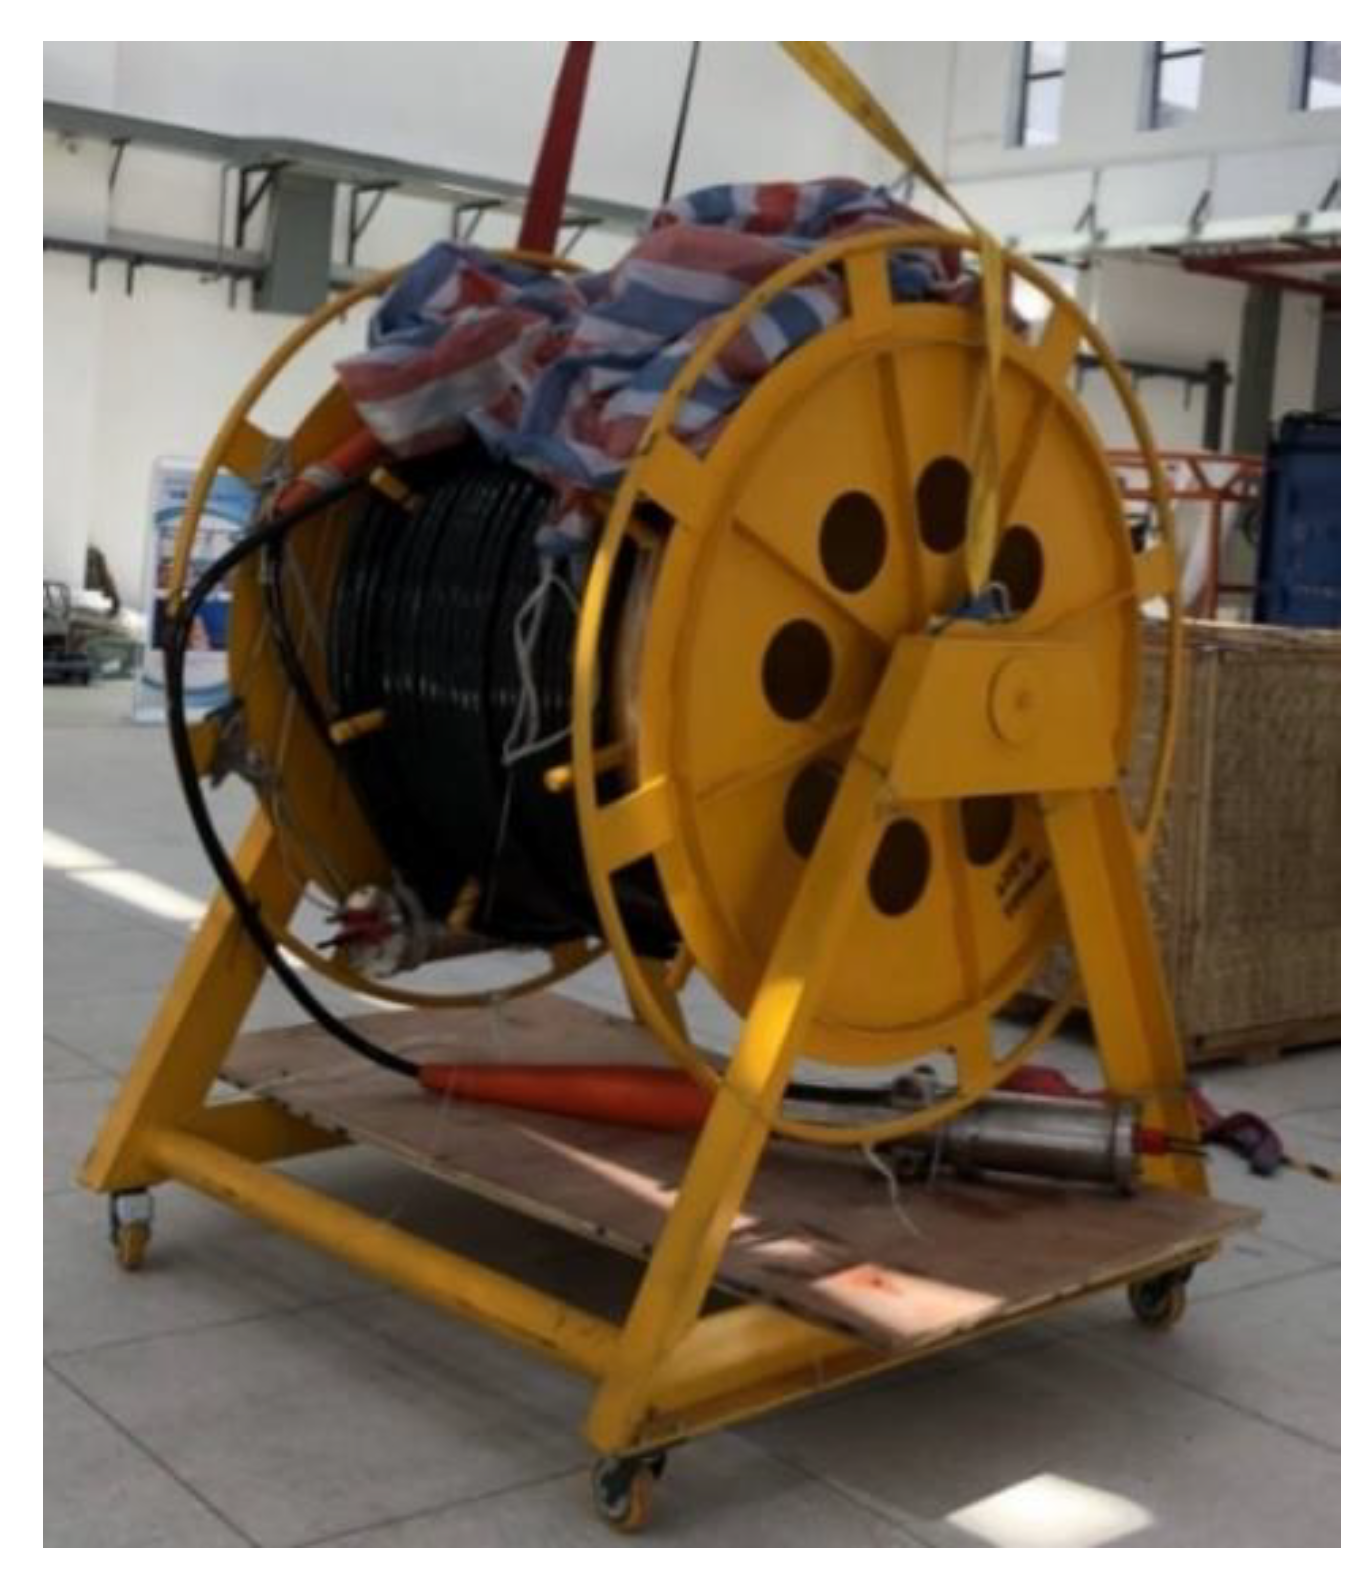
MBOSBC includes a Mooring Buoy and a Benthic Node, these two components being connected by an EOM cable. The Mooring Buoy plays the roles of observation, power generation, and data transmission. The Benthic Node is designed for the requirements of ocean physical processes and seafloor video imaging. On the other hand, the Benthic Node plays the role of anchoring the Mooring Buoy. A cable- and acoustic-linked observatory for mooring buoy-based ocean observation was established. The winch system was designed to launch and recover the MBOSBC. MBOSBC is designed for the seafloor observatories off islands, as well as Ocean regions far from the coast. MBOSBC can be relocated or deployed rapidly for transient or long-term observations, with different combinations of cable link and acoustic link. In particular, the sea surface buoy, as the power generator and data transmitter, has several capabilities for long-term observation and real-time data transmission for deep-sea observations.
This report is organized as follows: Firstly, the MBOSBC is briefly introduced and, then, the parameters of buoy and benthic nodes are given. Secondly, the preliminary mooring method of the system is designed. Thirdly, the force of the buoy under wind and waves is calculated. The resultant force of the buoy under wind and wave action is used as the boundary condition of the mooring EOM cable at the upper node. The fourth step is to divide the mooring rope into several micro-sections and analyze the stress of the micro-sections. The hydrodynamic relationship between two adjacent segments is derived. Fifth, an iterative calculation program based on the mechanical relationship between micro-segments is developed, in order to calculate the tension value of each micro-segment. Sixth, according to the calculation results in the fifth step, the technical indices of the EOM cable are determined and the strength of the EOM cable required in the system is derived. Next, an experiment with the mooring system is introduced, in order to verify the reliability of the system. Finally, the work of this paper is summarized and the emphasis of future work is discussed.

2. Description of Mooring Buoys Observation System

2.1. System Introduction

MBOSBC is designed for the regional observation of the coast of the South China Sea. It integrates seafloor and sea surface instruments for a broad spectrum of environmental, meteorological, and hydrological observations. The types of instruments include water temperature, pressure, salinity, current, wind speed/direction, air temperature, relative humidity, barometric pressure, and chemistry sensors. The seafloor module includes light, camera, CTD, and ADCP sensors, to verify the power capacity of MBOSBC. The overall system architecture is shown in Figure 4, including three modules: the mooring buoy, the benthic node, and the EOM cable. The Mooring buoy plays the roles of sea surface observation, data communication, and energy supply. The benthic node contains the junction box, the oceanographic instruments, the seafloor video module, and the buoy anchor block. The benthic node contains power management, control and data acquisition, and seafloor junction box status monitor modules. The EOM cable moors the sea surface buoy by the benthic node.

2.2. Design of Mooring Buoys and Benthic Observation Node

2.2.1. Mooring Buoy

The Mooring Buoy is a rigid structure made of 304 steel, as shown in Figure 5. The main diameter of the buoy is 3 m, while the bottom diameter of the buoy is 1.5 m. The weight of the buoy is 4.2 tons. The buoy body is divided into two parts: a watertight tank in the center, with four buoyancy cabins arranged around it. The electronic instruments are equipped within the watertight tank. The buoy is equipped with 24 rechargeable batteries (2 V 500 Ah each), which are connected to eight solar panels and the wind turbine. Each solar panel is nominal 100 W with dimensions of 1200 mm × 540 mm. The buoy is designed to endure such extreme ocean conditions as:
work depth: ≤1000 m;
wind speed: <70 m/s;
wave height: <15 m; and
ocean current velocity: <6 knot.

2.2.2. Benthic Observation Node

The design working depth of the benthic observation node is 1000 m. The junction box includes a titanium cylinder for power supply and a titanium cylinder for data communication and control. The weight of the junction box is less than 300 kg, and it is surrounded by a cage. The junction box hosts several instruments, including a seafloor video imaging module, CTD, and ADCP, as shown in Figure 6.
The cage has dimensions of 2.25 m × 2.25 m, with a height of 2.53 m. The seafloor junction box and the video module are fixed on the grid of the cage. The diameter of the titanium cylinder of the junction box is 320 mm, with a length of 1060 mm. The DC–DC converter and data sample and transmission module are fixed in the two titanium cylinders separately.
The Benthic Observation Node plays the role of the seafloor anchor. The cage is 1 ton, which holds the scientific instruments inside it. The anchor block at the bottom center of the cage is 3 tons, in order to offer enough weight to moor the buoy. The anchor block can be released by the acoustic releaser while recovering MBOSBC.

2.3. Analysis of Buoy Load in Wind, Waves, and Current

The buoy is subjected to the external force load of the wind, waves, and current at sea surface, as shown in Figure 7. where the resultant force acts on the mooring point of the optical cable. In this section, the wind and wave load of the buoy are calculated. The buoy is affected by gravity and buoyancy, where the buoy body provides reserve buoyancy. Environmental hydrodynamic forces include the wave force F w a v e , wind force F w i n d , and current force F c u r r e n t . These forces, under certain boundary conditions, were analyzed and it was found that the buoy can endurance the max wind speed F w i n d = 70   m / s , max wave height h = 20   m , and max current velocity F c u r r e n t = 6   kont .
The net force F B u o y generated by the weight and buoyancy of the buoy is
F B u o y = [ F B u o y H F B u o y V ] = [ 0 W B ]
where F B u o y H is the horizontal force of buoy and F B u o y V is the vertical force of the buoy. As the weight is equal to the buoyancy, F B u o y V = 0 .
The wind force F w i n d of the buoy platform is:
F W i n d = [ F w i n d H F w i n d V ] = [ F w i n d H 0 ] = [ 1 2 C ρ A 1 V w i n d 2 0 ]
where F w i n d H is the horizontal force of the wind, F w i n d V is the vertical force of the wind, A 1 = 4.55   m 2 is the frontal area acreage of the buoy above the buoy waterline, C = 0.5 0.8 is the air resistance coefficient; and ρ = 0.1228   kg · s 2 / m 4 is the air mass density. So F w i n d H = 821.3   kg .
The current force F c u r r e n t of the buoy platform is:
F C u r r e n t = [ F c u r r t e n t H F c u r r e n t V ] = [ F c u r r t e n t H 0 ] = [ 1 2 ρ C A 2 V c u r r e n t 2 0 ]
where C = 0.2 0.4 is the water resistance coefficient, A 2 = 2.2   m 2 is the frontal area acreage of the buoy below the buoy waterline; and ρ = 104.49   kg · s 2 / m 4 is the water mass density. So, F c u r r e n t H = 328.5   kg .
The wave force F w a v e of the buoy platform is:
F W a v e = [ F w a v e H F w a v e V ] = [ ρ C iH AV 01 4 π 2 T 2 exp ( 4 π 2 D t h T 2 g ) 0.5 ρ C DV A 2 S V 4 π 2 T 2 exp ( 8 π 2 D t h T 2 g ) ]
where ρ = 104.49   kg · s 2 / m 4 is the water mass density, g is the acceleration of gravity, C i H = 2 is the inertial force coefficient with respect to the horizontal plane, A = 10   m is the max wave amplitude, V 01 = 4.6   m 3 is the buoy wet volume, T is the wave period, D t h = 0.81   m is the draught depth, C D V = 0.3 is the drag coefficient with respect to the vertical plane, and S V = 4.55   m 2 is the acreage of the head wave with respect to the vertical plane. When the wave height is 15 m and the wavelength is 300 m, the wave period is:
T = 2 π λ g = 2 π × 300 9.81 = 13.86   s
where λ is the length of the wave ( λ = 300   m ).
So,
F W a v e = [ F w a v e H F w a v e V ] = [ 1772.2   kg 1463.4   kg ]
The total force on the mooring EOM cable is the sum of F B u o y , F W a v e , F W i n d , and F C u r r e n t , as:
T m o o r = F B u o y + F W i n d + F W a v e + F C u r r e n t
Therefore, the total mooring force in scalar form is expressed as:
T moor = T m o o r = [ T m o o r H T m o o r V ] = [ 2922.1   kg 1463.4   kg ] = ( T m o o r V ) 2 + ( T m o o r H ) 2 = 3268.0   kg

2.4. Design of Mooring System

2.4.1. Mooring Design of System for 1000 m Water Depth

The buoy mooring system is mainly composed of the buoy, the mooring cable, and the anchor blocks. The anchor block is installed under the benthic node, supported through the acoustic release device. In the buoy-based Seabed Observation System, oceanographic instruments are used to obtain scientific data from the depths of the ocean. Hydrologic, meteorological, and water quality information are obtained from the seabed and surface nodes. If the system is mooring by a traditional anchor chain, using nylon or polyethylene material for the mooring, energy supply from the buoy to the benthic node cannot be achieved, nor can data be transmitted from the benthic node to the buoy. If an electro-optic-mechanical (EOM) cable is used for mooring, the collected seabed information can be transmitted to the sea surface by using the optical fiber, as well as realizing energy transmission from the buoy to seabed node.
Our goal was to moor the system at 1000 m depth with the EOM cable. Firstly, tests and experiments were carried out near the coast, in order to verify the stability of the whole system. Moreover, a 1000 m depth mooring scheme was designed, as shown in Figure 8.
The top of the “S tether” does not interfere with ship activities, while the bottom of the “S tether” cannot connect with the seabed. The system was launched at 1000 m depth, so we have
l 1 + l 2 + l 3 = l d e p t h
where l d e p t h = 1000   m is the water depth, l 1 is the distance from sea surface to the top of the “S tether” shape, l 2 is the height of the “S tether” shape, and l 3 is the distance from the bottom of “S tether” shape to the seabed.
The total length of the EOM cable l t o t a l = 1400   m , with:
l d e p t h + 2 l 2 = l t o t a l
By Equations (9) and (10), the length of l 2 can be calculated:
l 2 = 200   m
We selected l 1 = 500   m and l 2 = 250   m , to make the top of “S-tether” far from the sea surface. Considering the net weight of the EOM cable, the floats were used to balance the weight generated from the seabed to the top of the “S-tether”.

2.4.2. Mooring Scheme for Nearshore

In order to test the data collection and communication ability of the entire system, as well as the power supply of MBOSBC, the system first needed to be tested inshore. Therefore, a mooring scheme with a depth of 20 m near the shore was also designed, as shown in Figure 9.
For the convenience of sending divers to salvage the equipment in case of system failure, the near-shore laying depth was set at 20 m. The EOM cable was directly used to connect the Surface Buoy and the Benthic Observation Node, in the form of a catenary. The length of the EOM cable was about 3 times of the water depth. Figure 10 shows the cable and cable reel used for the inshore test.

3. Calculation Method of Mooring Force of the Cable

The buoy was moored by the EOM cable, while the EOM cable was moored the buoy by the benthic node. At the same time, the cable was affected by the ocean current force in the water. The buoy and the benthic node were connected together by the cable, such that the force added to the buoy and the benthic node by the ocean environment was used as the boundary conditions for the cable force analysis.
In this section, the hydrodynamic force of the cable caused by the ocean current is analyzed. For analysis of the hydrodynamic force, the mooring cable was divided into several micro-element segments. First, the force formulae of two adjacent micro-segments were obtained. Then, considering the current hydrodynamic force received by each micro-segment, the force relationship between adjacent micro-segments was derived and the iterative calculation algorithm of the hydrodynamic force on the EOM cable was deduced. Therefore, the tension of the EOM cable can be solved using the iterative calculation algorithm, selecting the two boundary conditions as the initial conditions at sea surface and seafloor.
To facilitate calculation, the following assumptions were made before the EOM cable hydrodynamic force analysis:
I.
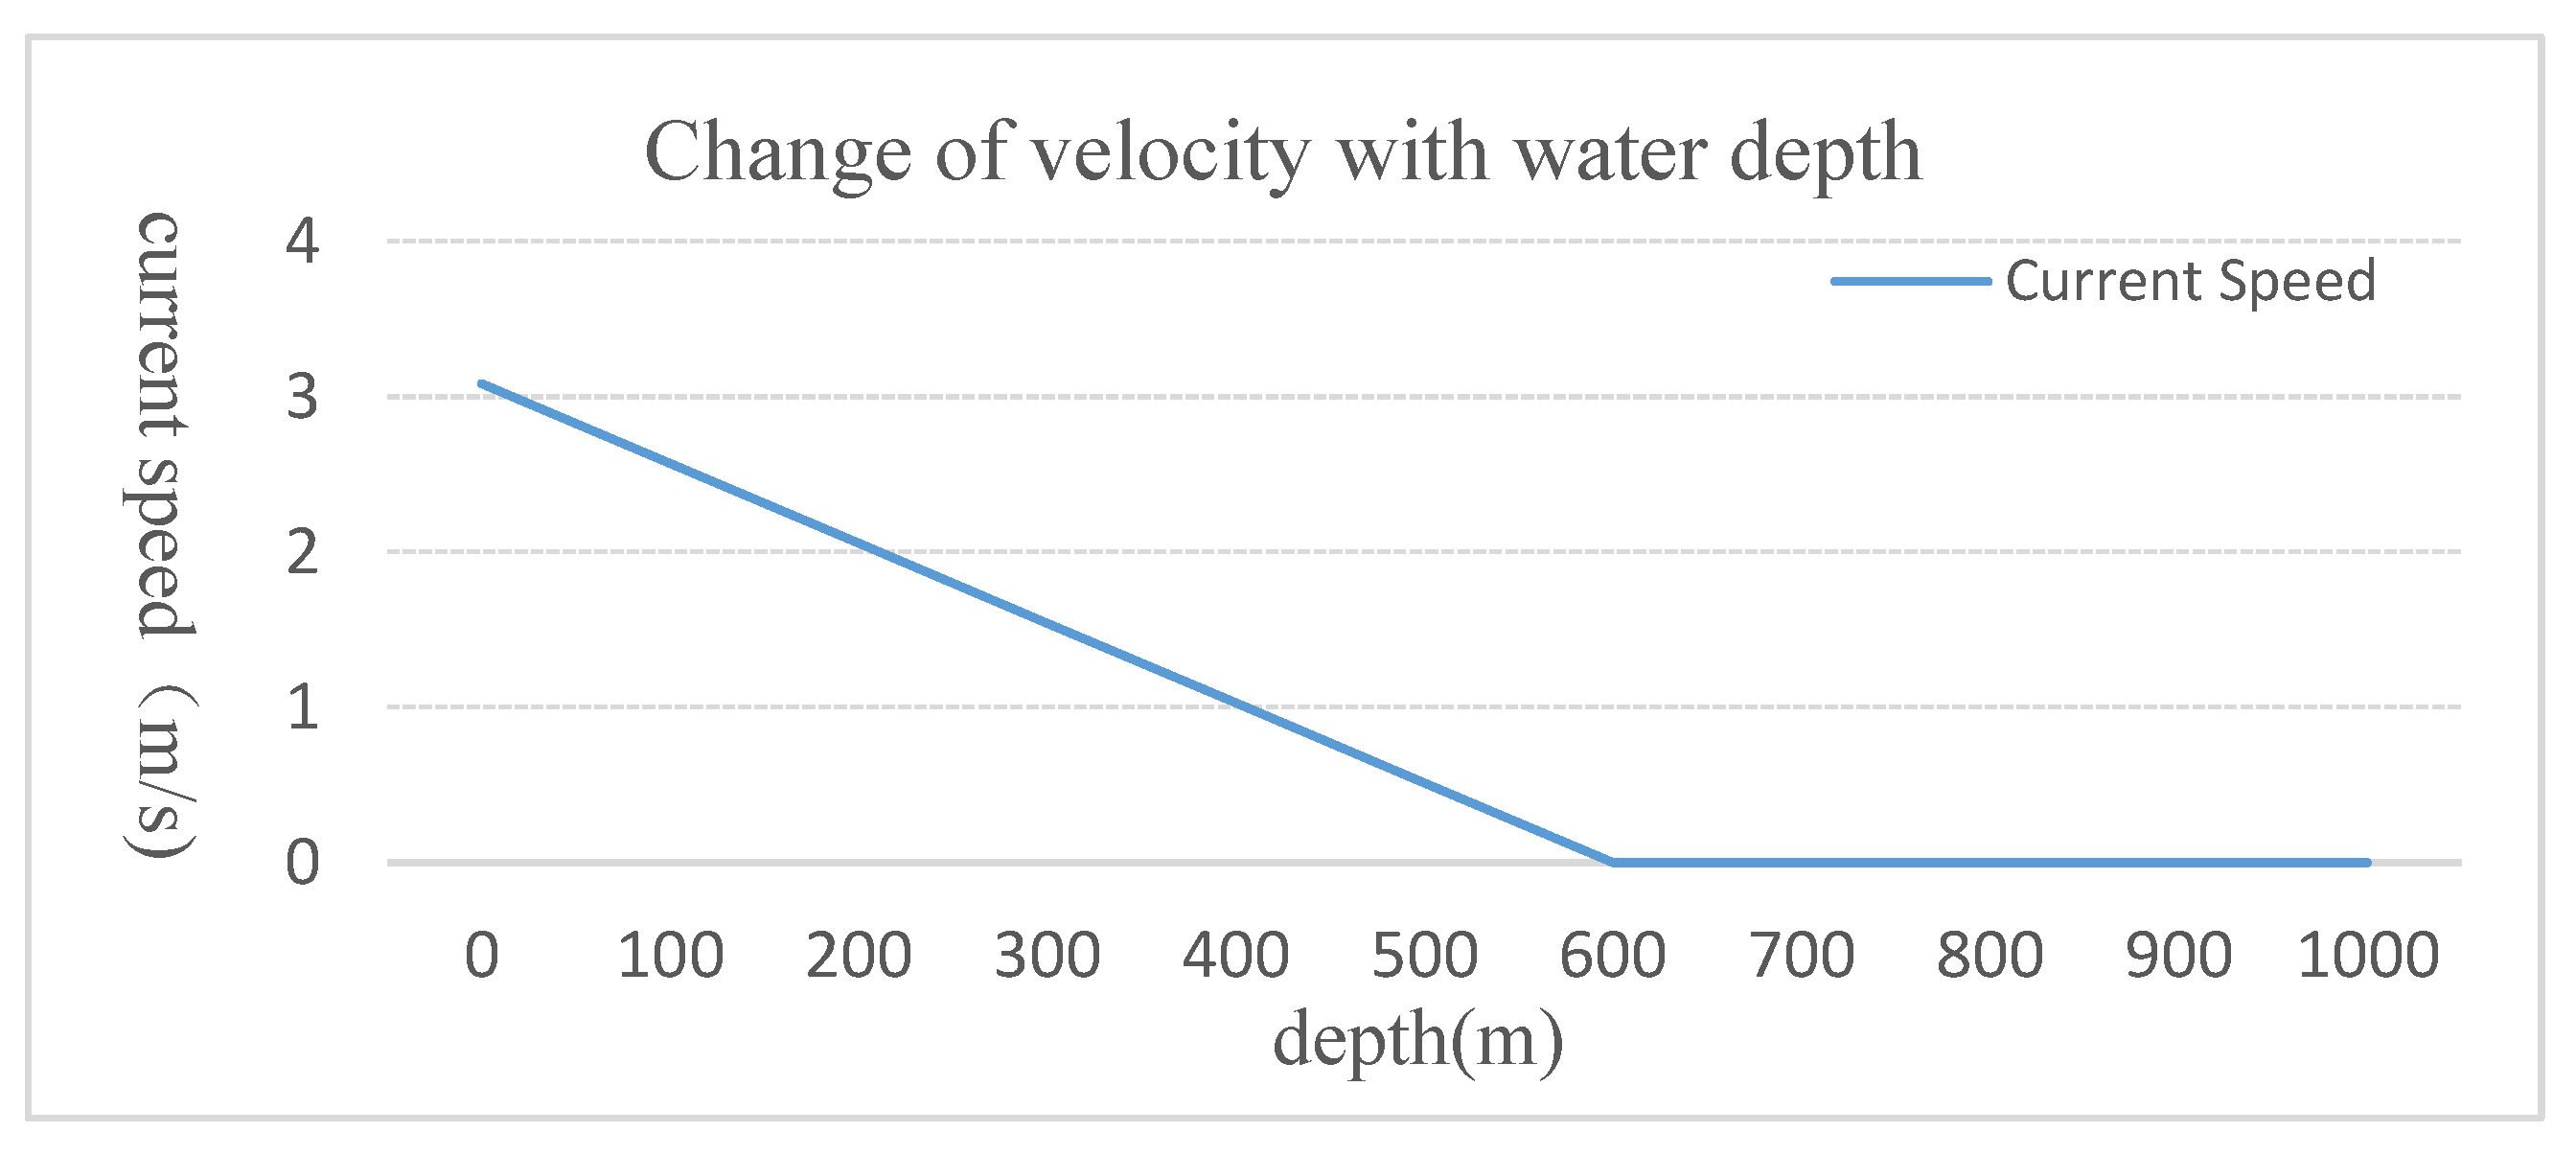
The effect of the ocean current on the cable in the vertical direction is negligible; this means that the current was assumed to be a planar flow field, and the system was simplified to a two-dimensional problem;
II.
The current velocity gradually decreased from 6 knots at the surface to 0 at a depth of 600 m, as shown in Figure 11. We assumed the velocity was 0 from the water depth of 600 m to 1000 m.
III.
The mooring cable does not transmit bending moment and torque.
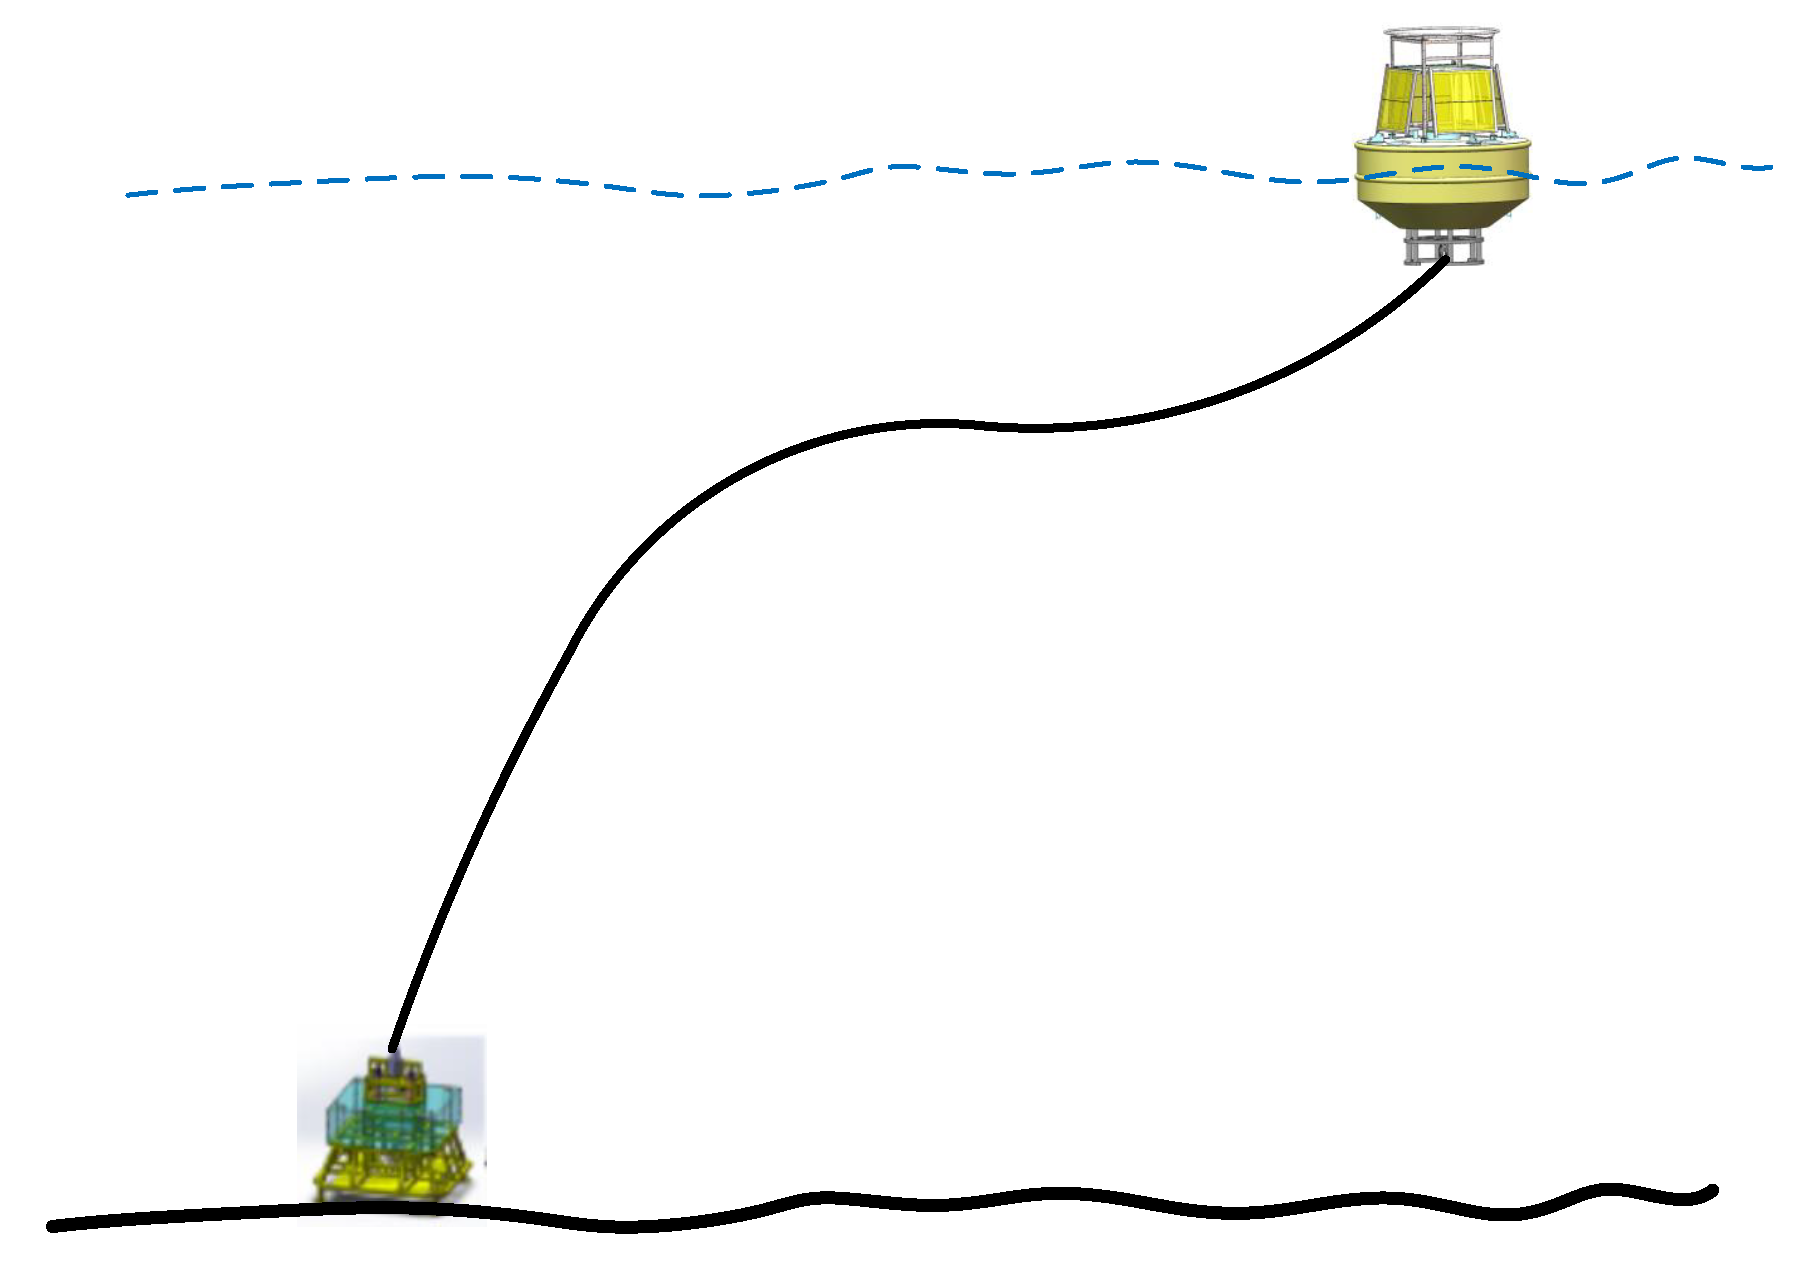
Under extreme sea conditions, the mooring system adopts the shape of an “S” mooring system, which is shown in 
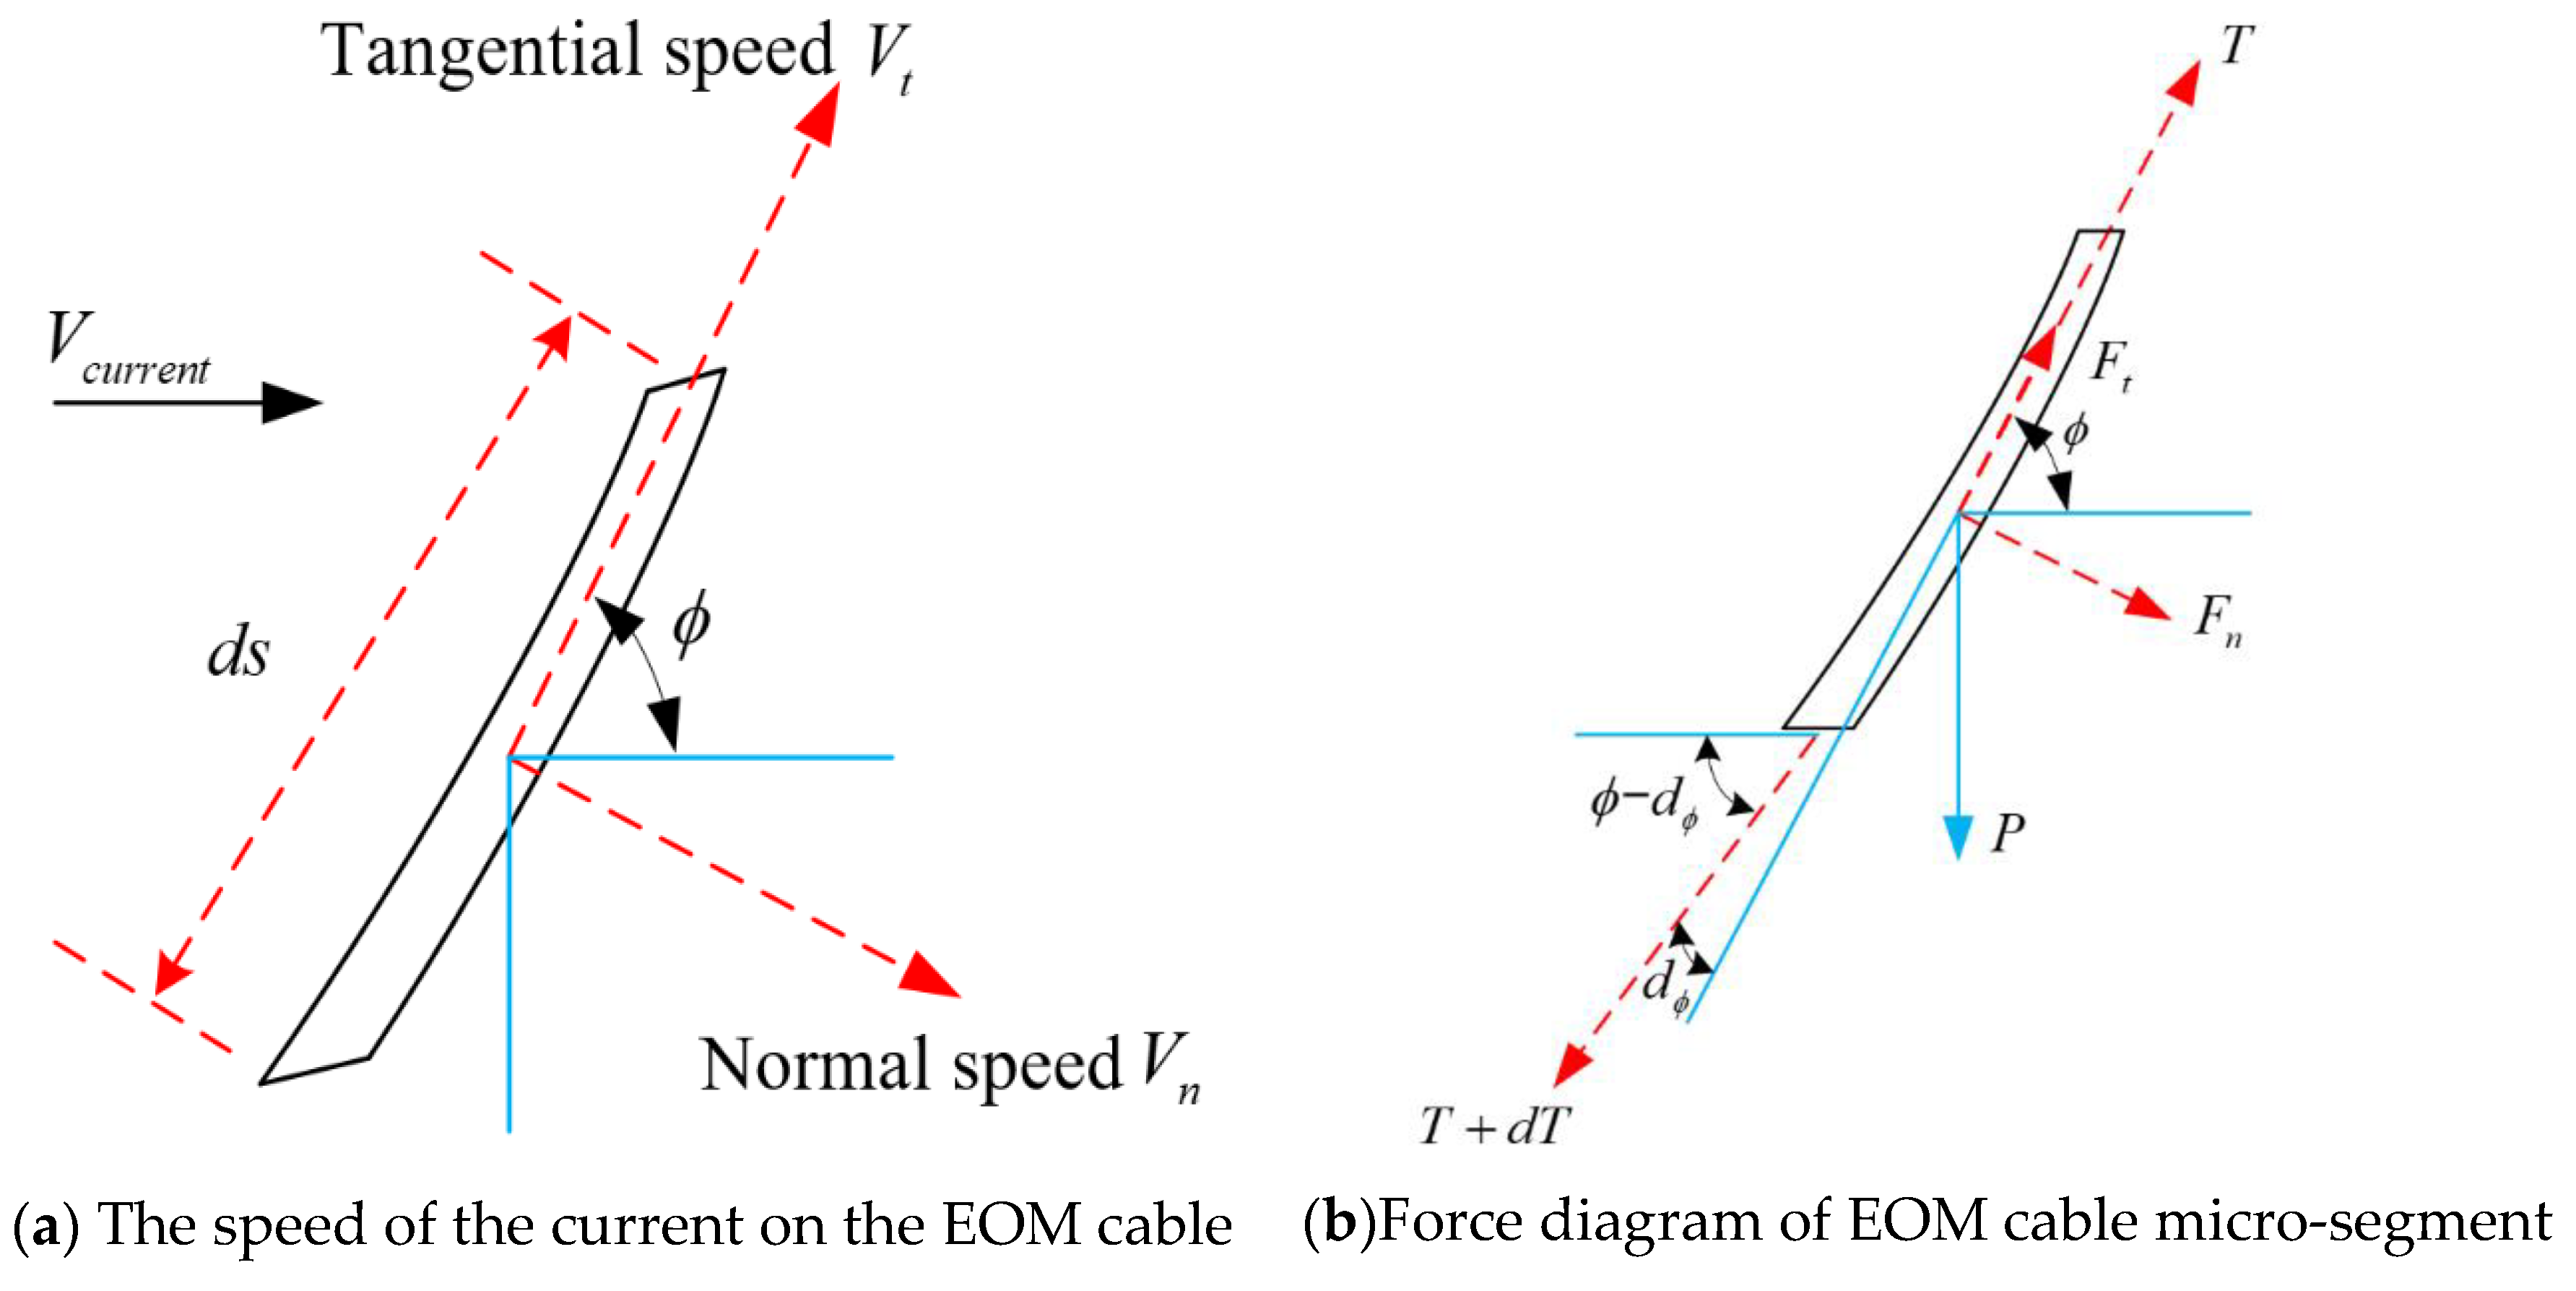
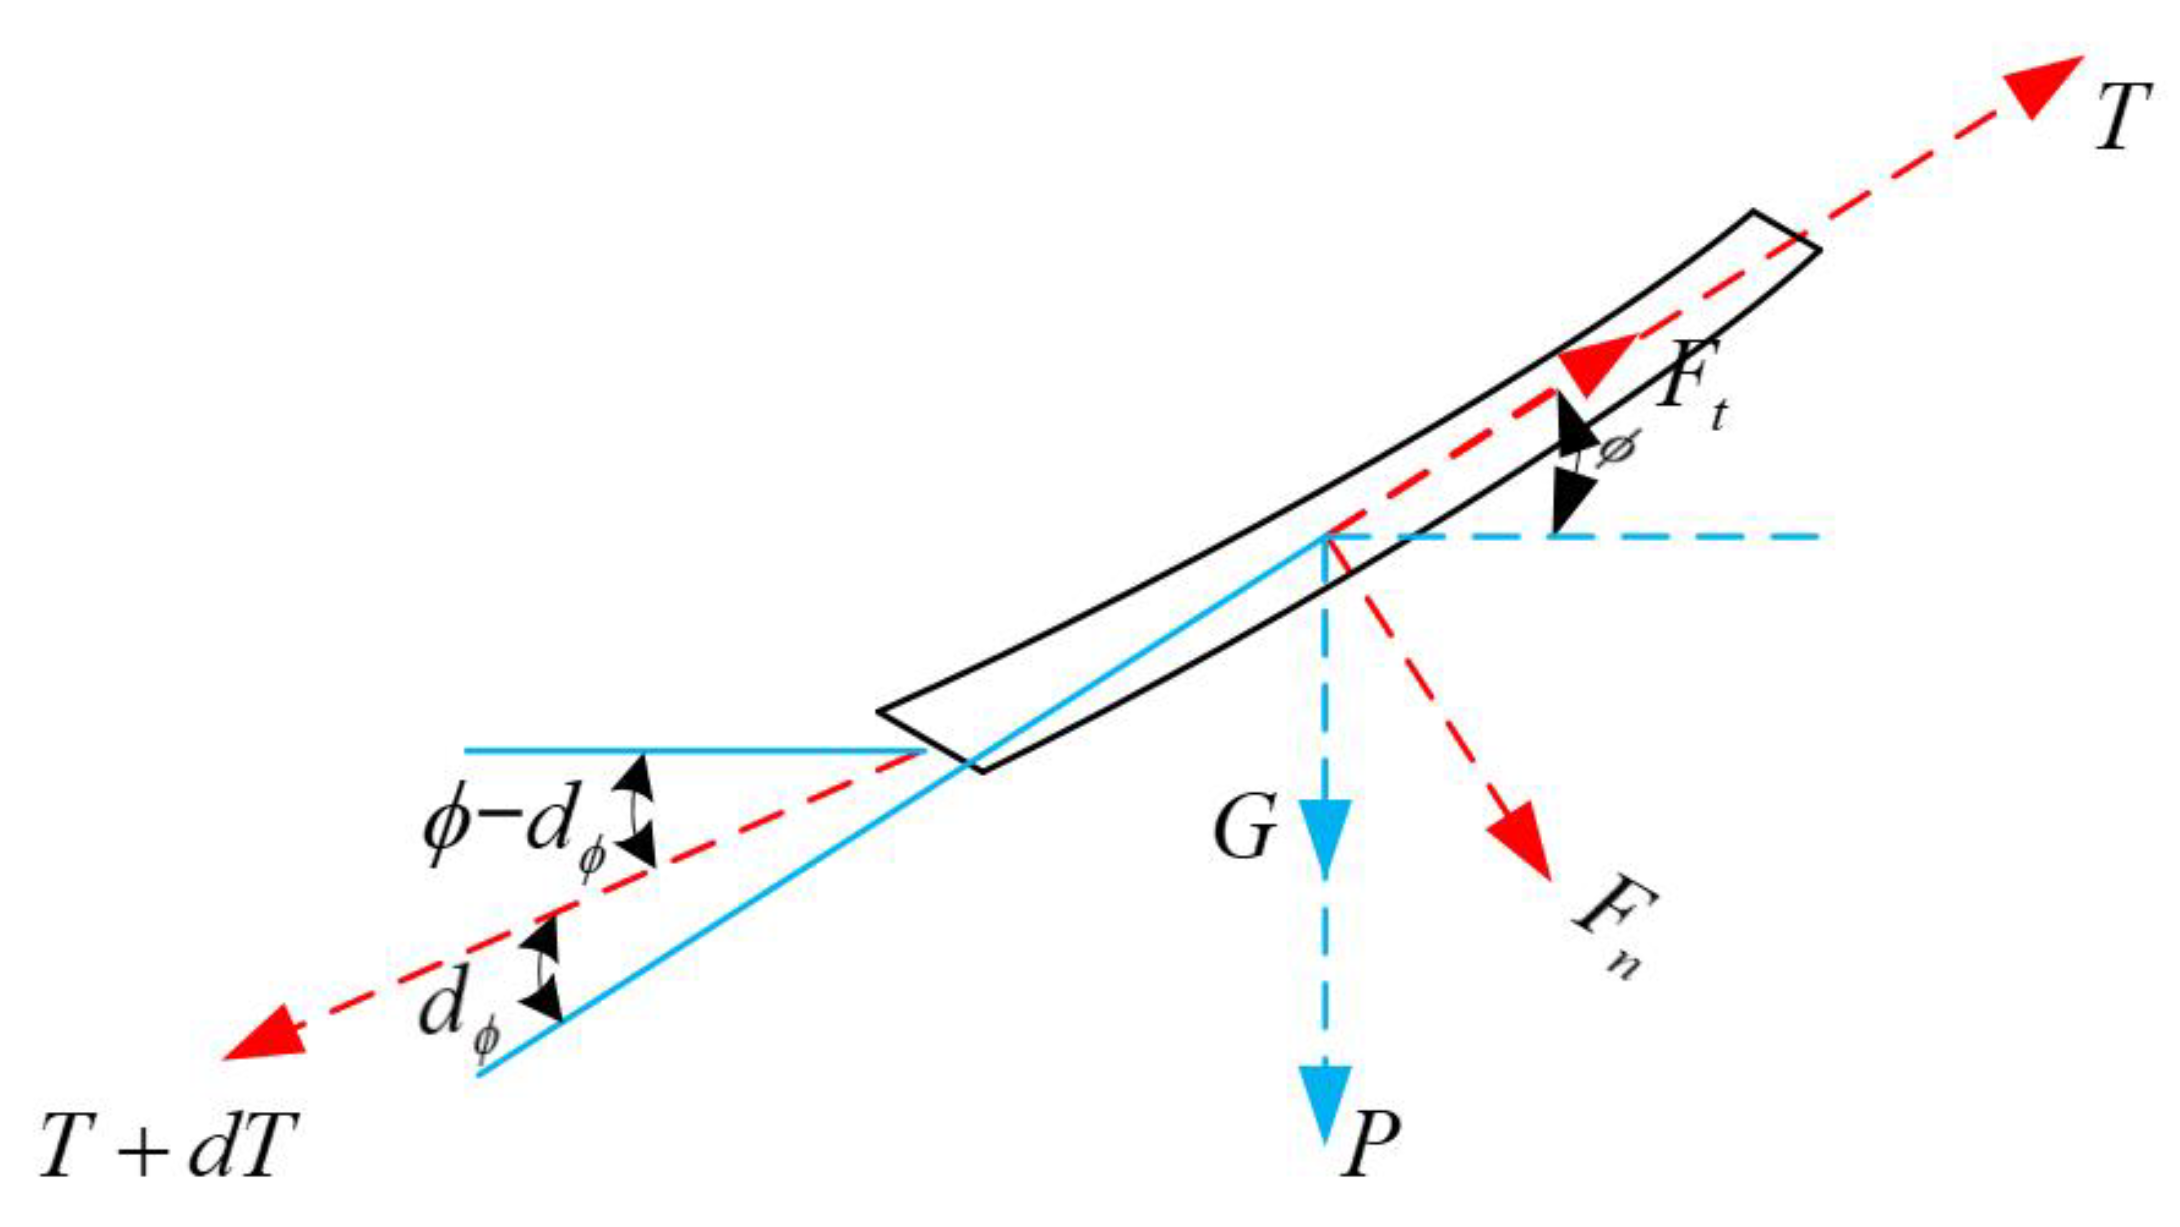
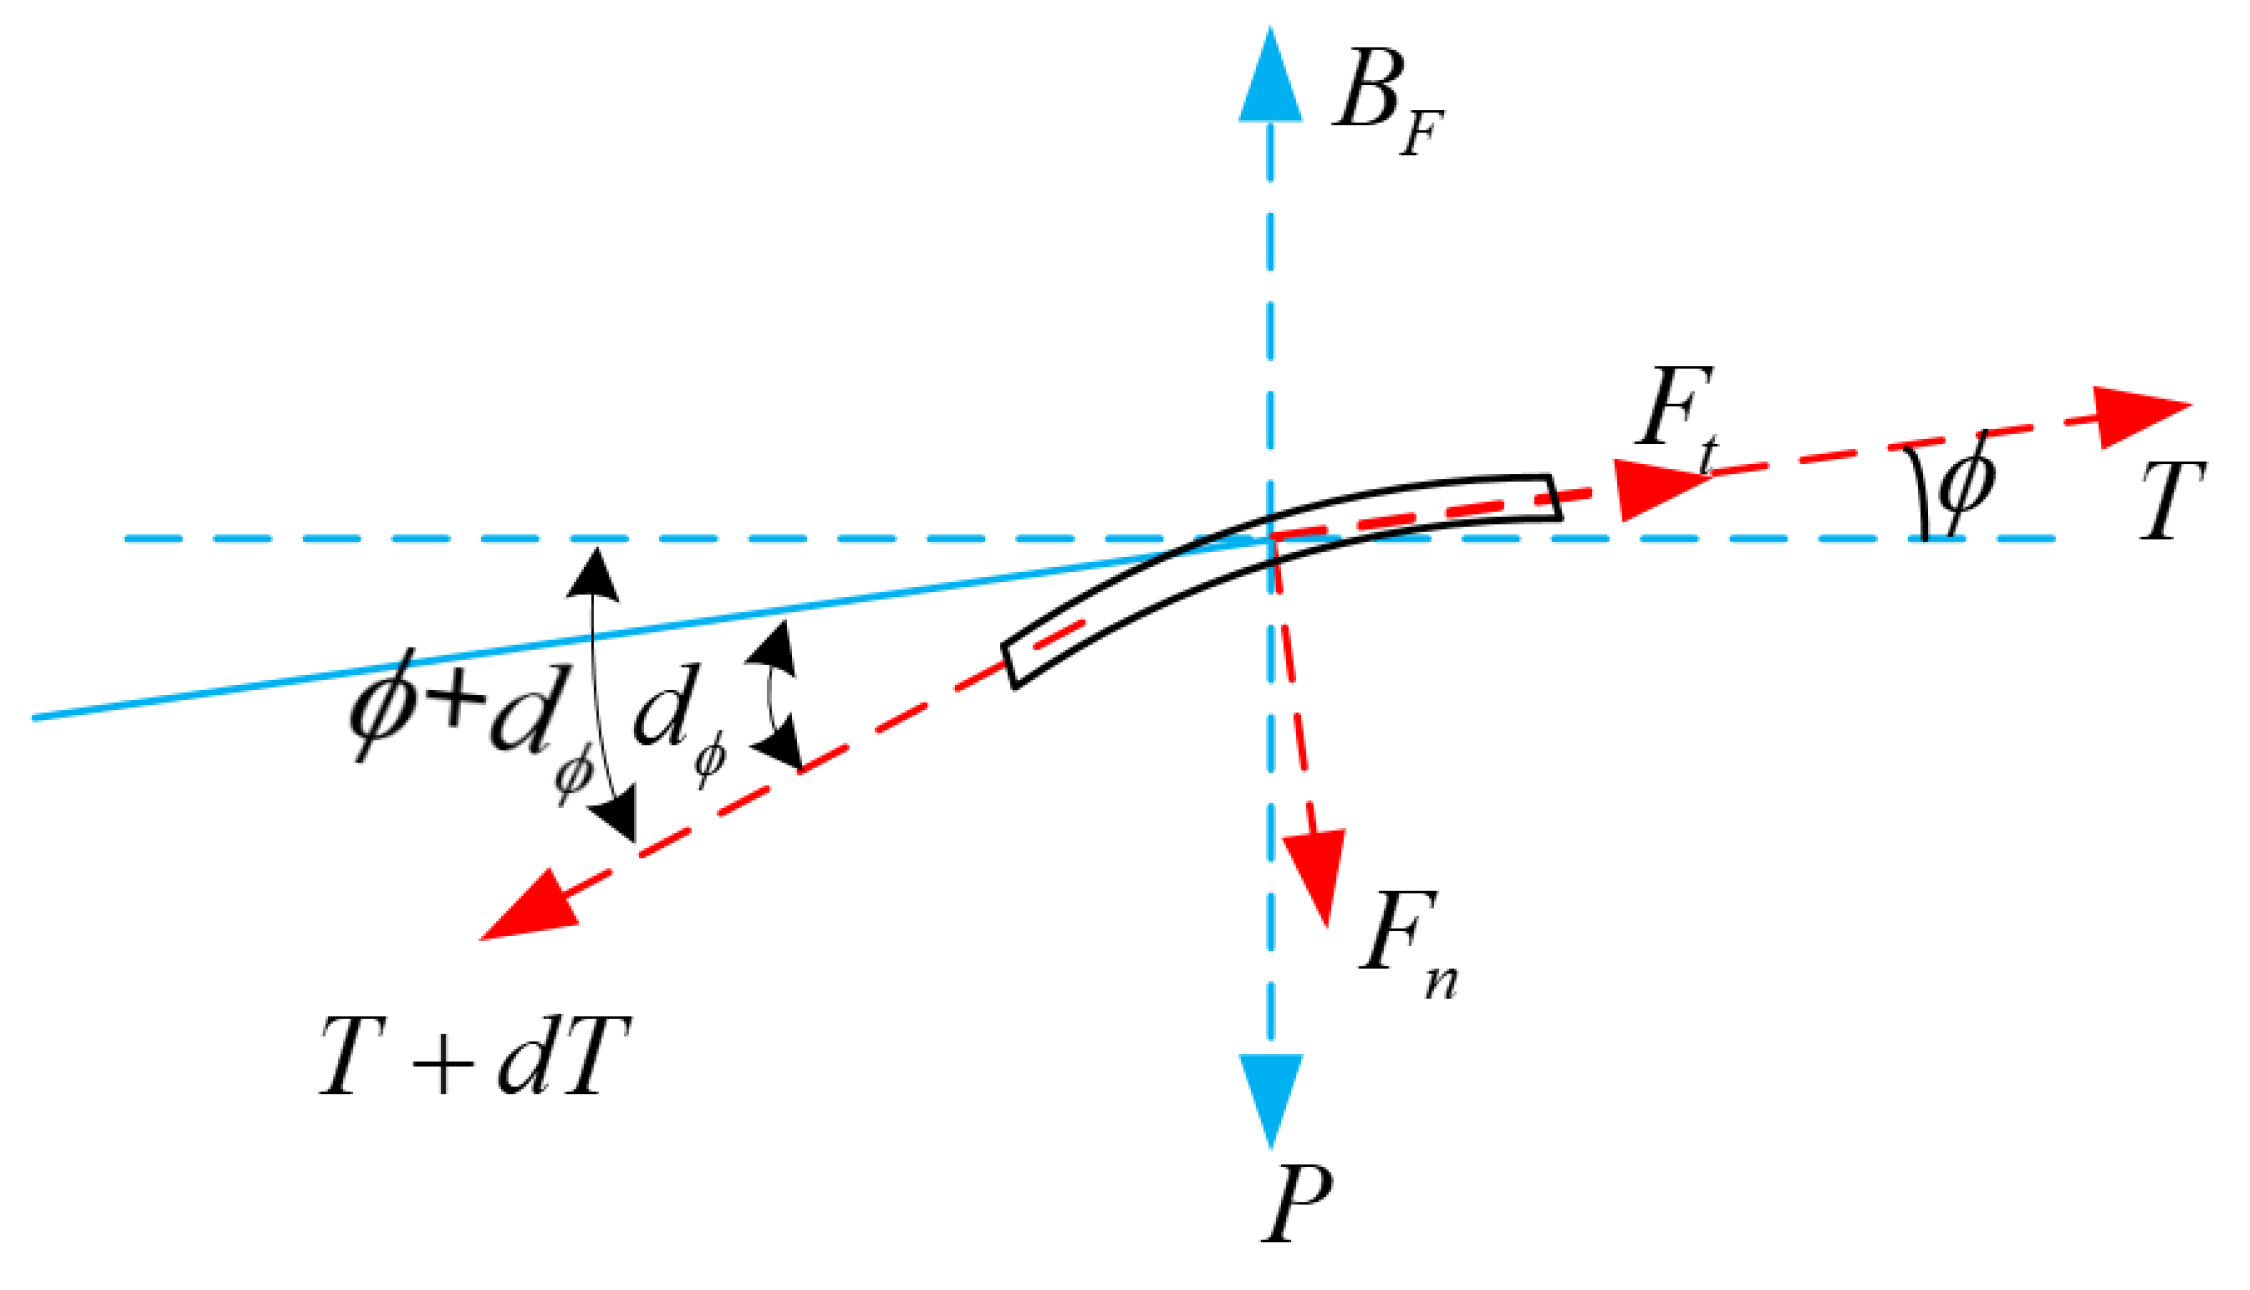
Figure 12. We selected a micro-segment on the mooring cable to analyze its tension. The force analysis of the micro-segment subjected to the ocean current is shown in Figure 13.
Decomposing the force of the current on the micro-segment into tangential and normal directions, according to the hydrodynamic formula, we have:
F t = 1 2 ρ C t ( π D d s ) ( V c u r r e n t cos ϕ ) 2 = 1 2 ρ C t π D V c u r r e n t 2 cos 2 ϕ d s ,
F n = 1 2 ρ C n ( D d s ) ( V c u r r e n t sin ϕ ) 2 = 1 2 ρ C n D V c u r r e n t 2 sin 2 ϕ d s .
The meanings of the variables in the Equations (12) and (13) and Figure 13 are as follows:
  • F t —Tangential flow force,
  • F n —Normal flow force,
  • ρ —Density of seawater,
  • C t —Tangential flow resistance coefficient C t = (0.01–0.03) C n ,
  • C n —Normal flow resistance coefficient,
  • D —Diameter of EOM cable,
  • d s —micro-segment length,
  • V c u r r e n t —Current speed,
  • —Micro-section inclination,
  • P —Net weight of micro-section in water ( P = W M B M ),
  • W M —Weight of Micro-section, and
  • B M —Buoyancy of Micro-section.
Suppose the tensions at both ends of the micro-segment ds are T and T + d T , and the respective inclination angles are ϕ and ϕ d ϕ . Then, the static balance equations at both ends of the micro-segment can be expressed as:
( T + d T ) c o s d ϕ + P sin ϕ T F t = 0 ,
d ϕ = ( F n + P cos ϕ ) / T .
As d ϕ is a quantity approaching 0, we have sin d ϕ d ϕ and cos d ϕ = 1 , where we have ignored the second-order infinitesimal quantity and, so Equations (14) and (15) can be simplified to:
T + d T = T + ( F P sin ϕ ) ,
d ϕ = ( F n + P cos ϕ ) / T .
From this, the iterative relationship of the force of each micro-section on the mooring cable can be obtained:
T i + 1 = T i + ( F t i P sin ϕ i ) ,
ϕ i + 1 = ϕ i ( F n i + P cos ϕ i ) / T i ,
P M i = W M i B M i ,
where i is the number of each microsegment, from top to bottom.
The inclination of the first micro-section of the cable can be derived from the force of the cable at the buoy end:
ϕ 1 = cos 1 F H T 0 .
By subsequent iterative algorithm, the tension of each section of the mooring cable can be computed, in order to obtain the requirements of the EOM cable in the system.
The cable has buoyant floats and counterweight ballasts attached to some micro-sections. The force analysis of these micro-segments should take into account the influence of the float and counterweight. The hydrodynamic force analysis of the EOM cable of the micro-segment with respect to the ballasts and floats are shown in Figure 14 and Figure 15, respectively:
The force analysis idea of the micro-segments with floats and counterweights was the same as other micro-segments.
Additionally, considering the influence of the buoyancy of the float, the micro-segment force iteration formula with counterweight becomes:
{ T i + 1 = T i + ( F t i ( P + G ) sin ϕ i ) ϕ i + 1 = ϕ i ( F n i + ( P + G ) cos ϕ i ) / T i P M i = W M i B M i } ,
where G is the net weight in water of the counter weight.
The iteration formula of micro-segment force with respect to a buoyant float is changed into:
{ T i + 1 = T i + ( F t i ( P B F ) sin ϕ i ) ϕ i + 1 = ϕ i ( F n i + ( P B F ) cos ϕ i ) / T i P M i = W M i B M i }
where B F is the net buoyancy of the float in water.

4. Numerical Simulation of Single-Point Mooring Cable

According to the above calculation method, a Matlab program was written to iteratively analyze the mooring force in 1000 m water depth.
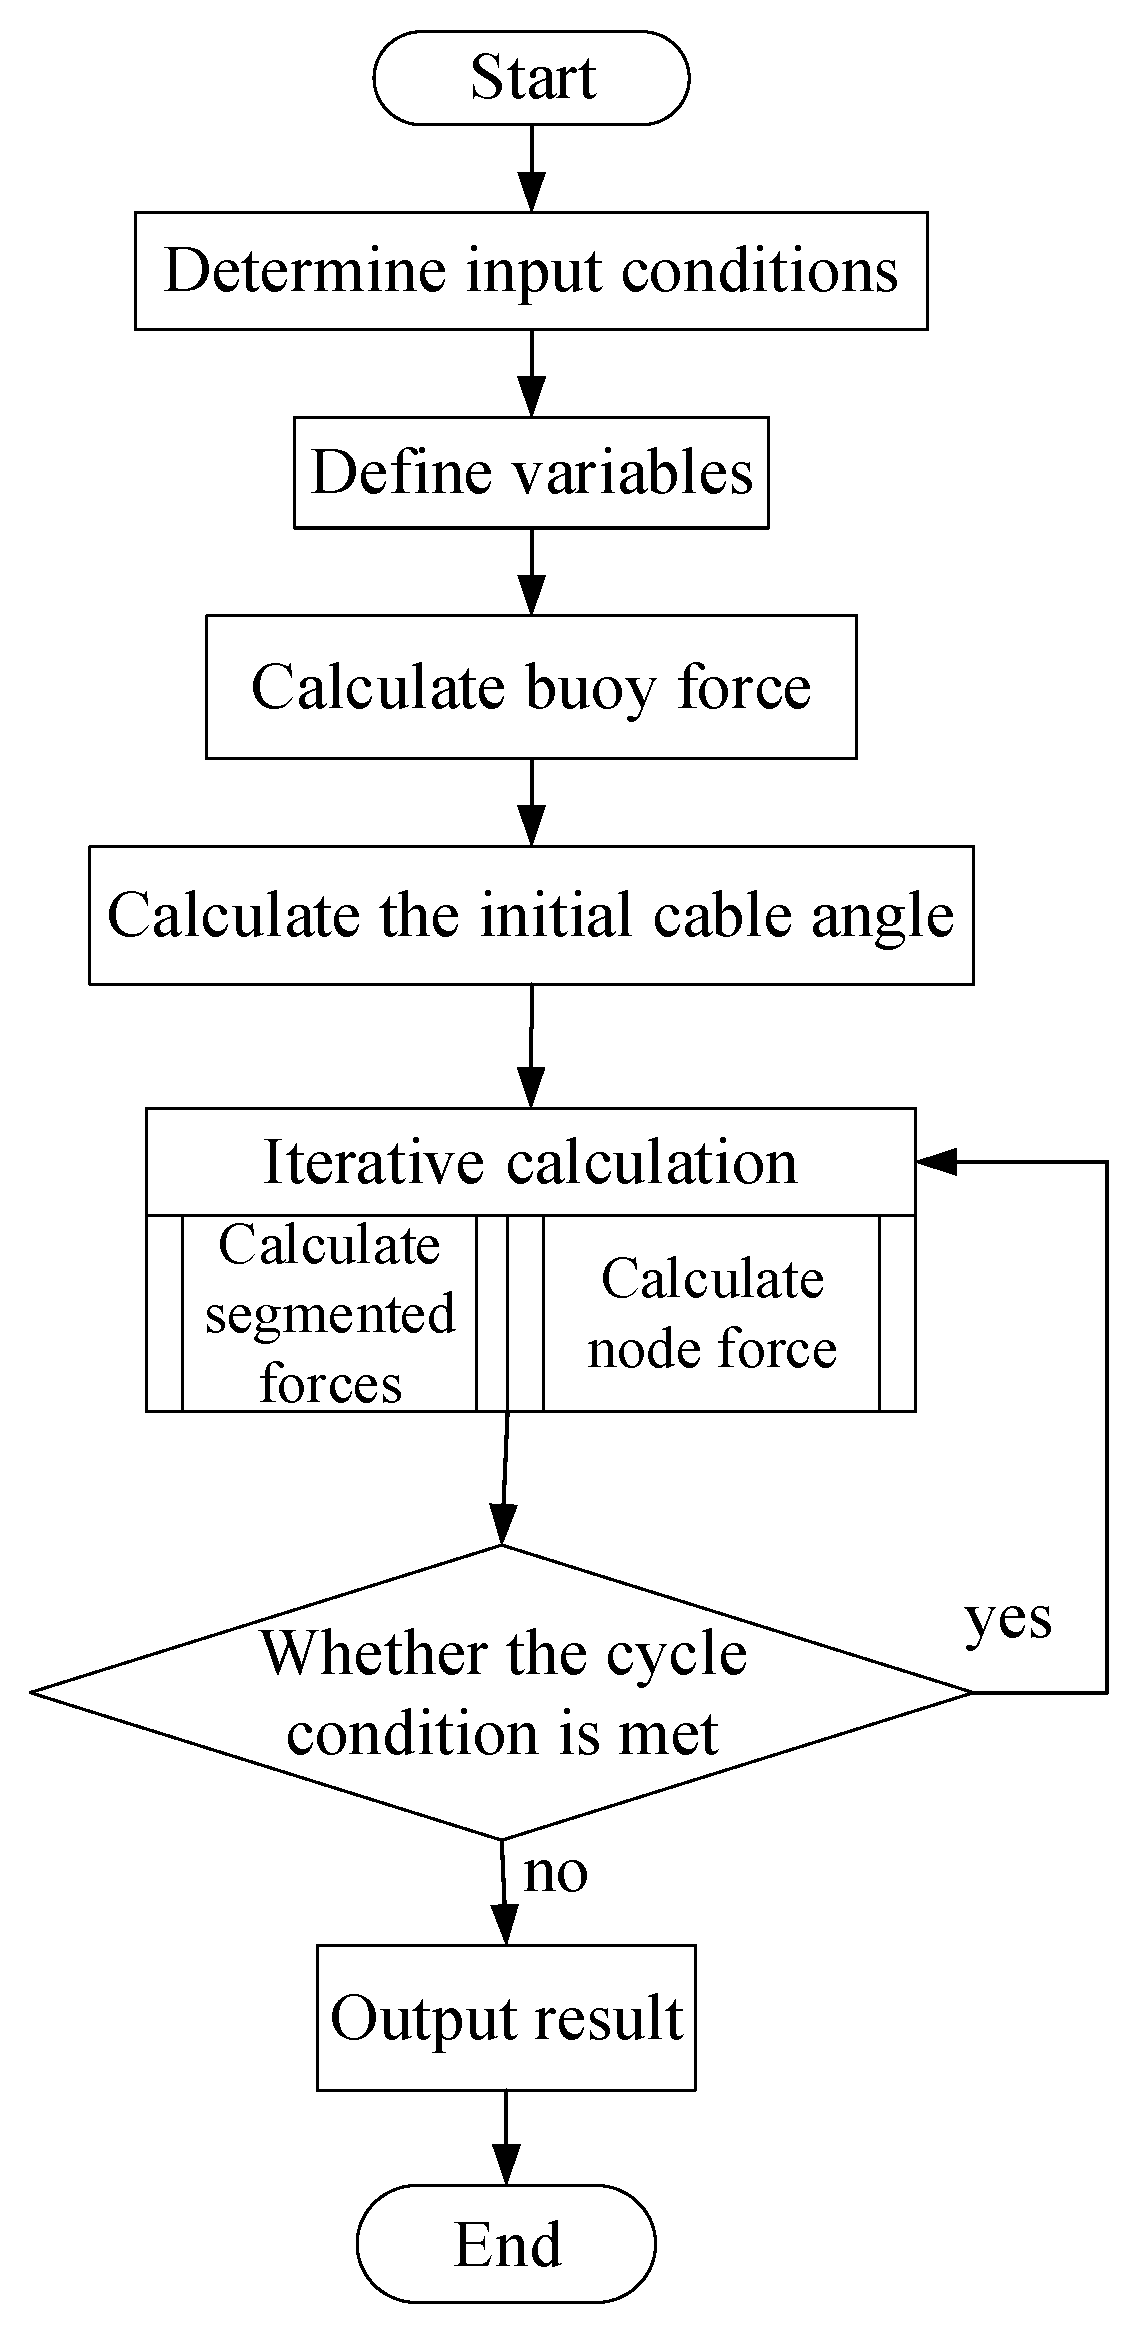
The calculation process is shown in Figure 16. First, we set the initial environmental conditions. Then, we defined the required variables, according to the calculation process. Next, we calculated the horizontal load, vertical load, and comprehensive load of the buoy, according to the wind, wave, and current conditions. Finally, we re-calculated the initial angle of the mooring cable, based on the buoy load. With this iterative algorithm, the initial angle of the cable and the load of the buoy are updated as the initial conditions of the cable force calculation program into the iterative formula, and the force of each section of the cable is iteratively calculated in turn, until the calculation achieves the precision we need, with the mooring force returned as the output of the iterative algorithm.
The calculated results of the buoy and cable under varying wind and current speeds are shown in Table 1:
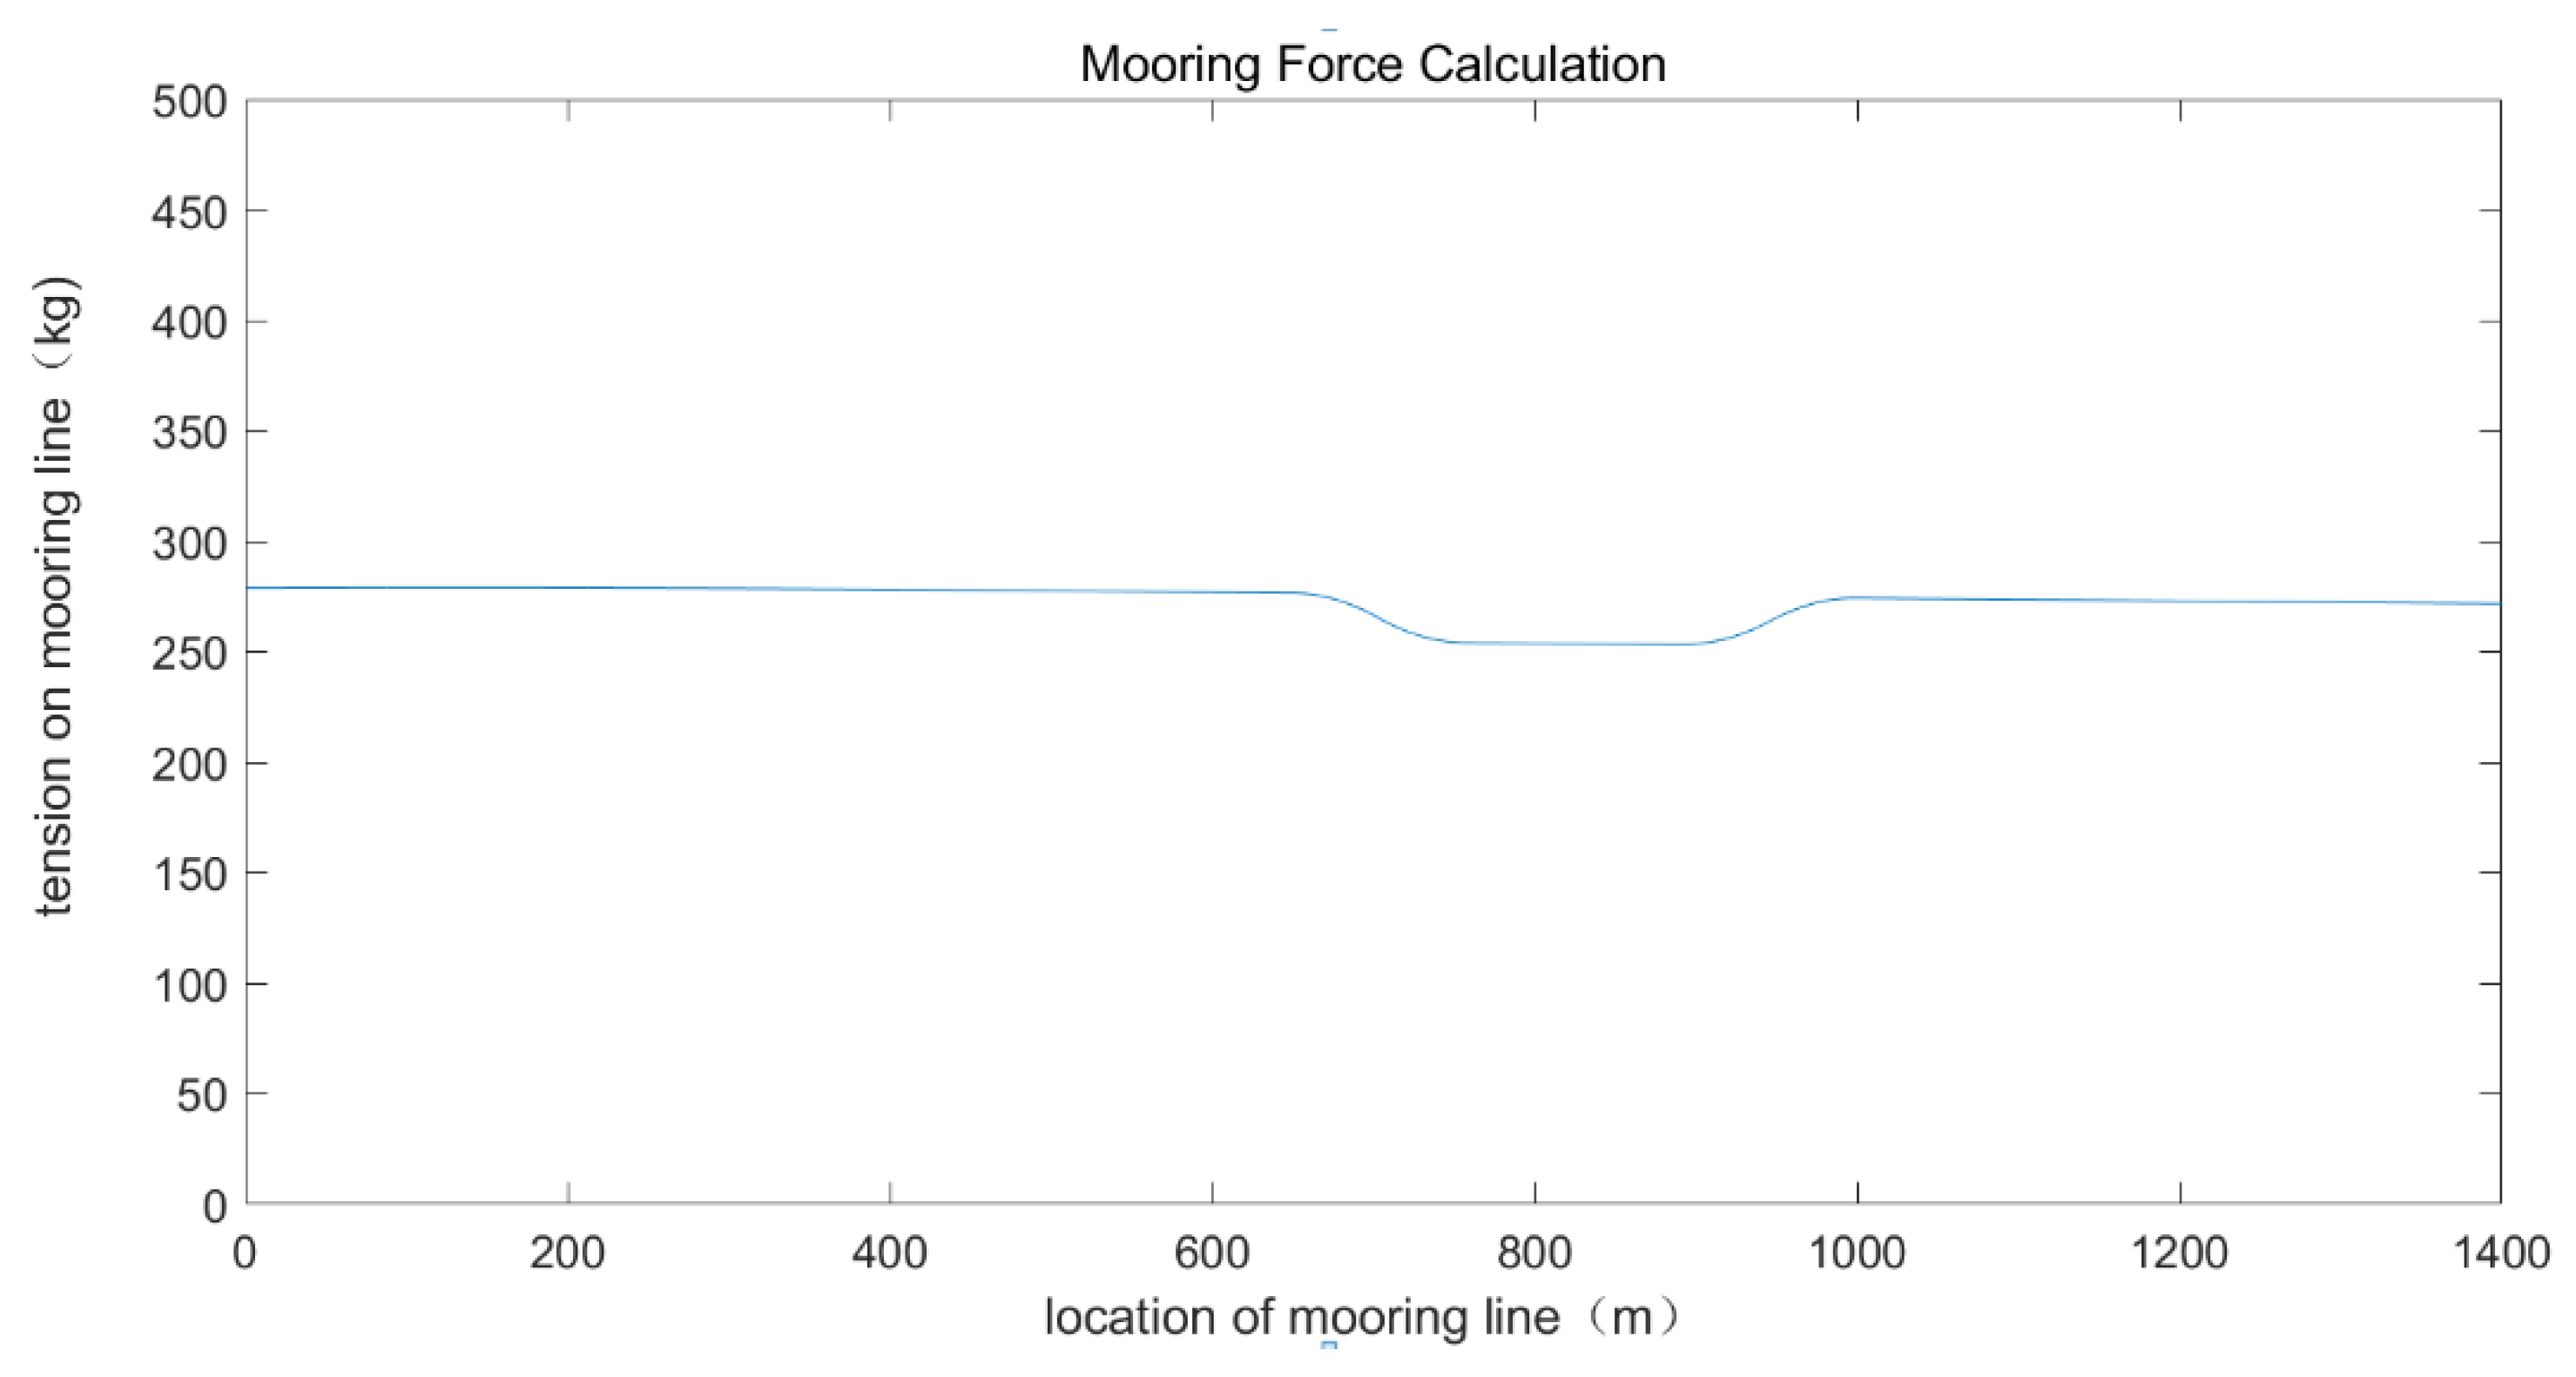
The mooring force property of the buoy under the wind speed of 10 m/s and the current velocity of 0.6 m/s was selected, as shown in 
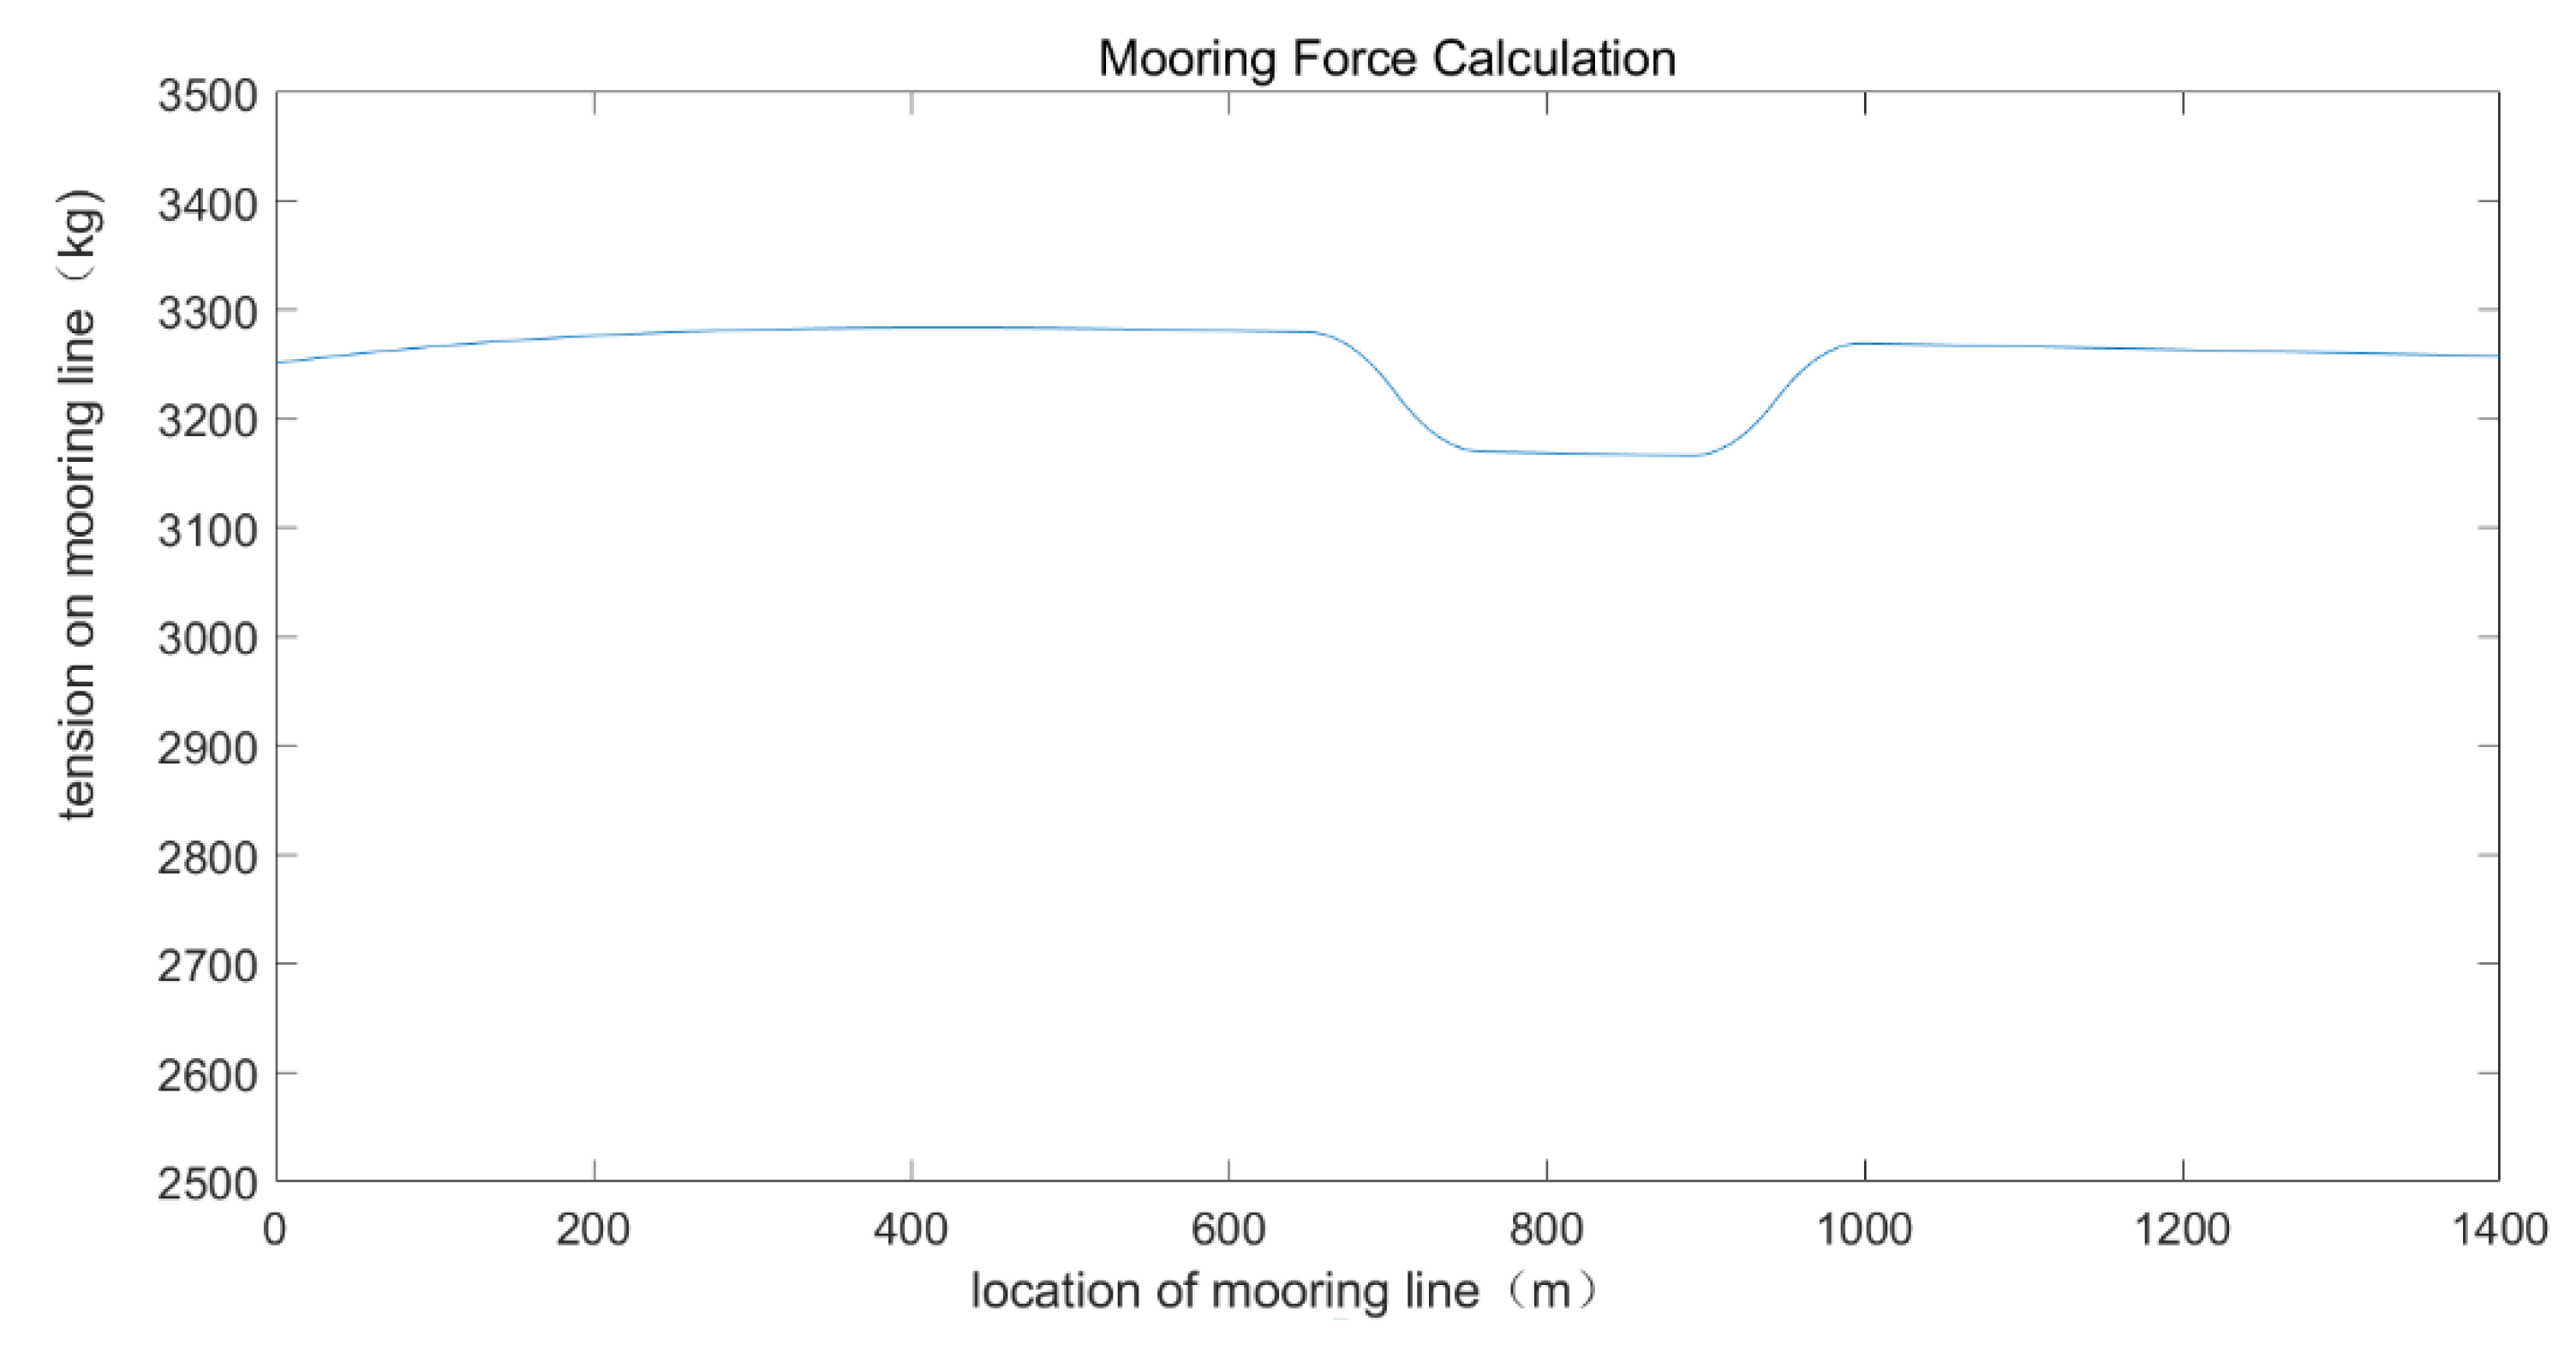
Figure 16. Further, the mooring force property of the buoy under the wind speed of 70 m/s and the current velocity of 3.0 m/s was also selected, as shown in Figure 17.
Figure 17 shows the variation of tension value of the EOM cable, from top to bottom, at low velocity. The tension on the EOM cable gradually decreases from top to bottom. The tension value changes greatly in the ‘S’ type segment: In the micro-segment with counterweight, the tension value decreases faster. In the middle of the ‘S’ type segment, the tension value retains the trend of decreasing, but its change range is small. In the micro-segment with float, the tension value in the EOM cable increases, where the change range depends on the buoyancy provided by the float for the EOM cable. The tension at the end of the EOM cable retains a small trend of decreasing. Figure 18 shows the variation of tension value of the EOM cable, from top to bottom, at high current velocity. The tension value on EOM cable increases gradually, at first. Below the position of about 400 m, the tension value gradually decreases. In the ‘S’ section of the EOM cable, the change trend of tension value is the same as that under the conditions of low velocity. The reasons for this change are as follows:
Due to the action of the sea-current, the buoy is in the downstream direction of the benthic node, such that the cable forms an angle of inclination. As shown in the right of Figure 12, the offset buoy produces a diagonal upward force on the cable, which is called T , and the flowing seawater also produces a diagonal upward force on the cable, which is called F t . However, the net weight of the cable in the water causes the cable to bear a downward force, which is called P . As T is far greater than the other forces, the cable mainly bears an upward pulling force.
In the case of low sea-current velocity, the effect of F t is not as obvious as that of P , so the tension in the cable gradually decreases. In the case of high flow velocity, the effect of F t is greater than that of P , so the tension in the cable gradually increases. However, the velocity of the sea-current becomes smaller as the depth of seawater increases, and the effect of F t becomes smaller than P . Therefore, the tension in the cable gradually decreases. In the ‘S’ section of the cable, the variation of P is greater than the effect of F t , caused by the influence of the counterweight. So, the tension T in the cable decreases quickly, where the degree of the decrease depends on the weight of the counterweight.
In the micro-segment with floats, the buoyancy of the float causes P to act in the opposite direction, such that the tension T quickly increases, where the increase depends on the buoyancy provided by the float.
If the EOM cable is heavier, the pulling force of the cable from the top to the bottom can be reduced greatly. However, considering that the buoy must have some reserve buoyancy, the EOM cable utilized in the system should not be too heavy. For example, if the cable is 1 kg per meter, then the cable with 1000 m length needs the surface buoy to provide 1 ton of buoyancy and, so, the buoy needs a larger reserve buoyancy. Considering the aim of convenience of buoy deployment and recovery, the weight of the cable should limited within a suitable range.

5. EOM Cable Design

The difference between an anchor chain and an EOM cable is that when the optical fiber fails, the EOM cable will not work even if the load-bearing aramid fiber is not broken. The difference between an EOM cable and a mooring nylon anchor chain is that the EOM cable has the capacity of transmitting power and data. Therefore, the minimum breaking strength of the EOM cable should be selected to be as large as the maximum breaking load of the mooring nylon chain.
It can be found, from the above mooring force calculation, that the maximum tension on the mooring line does not exceed 3500 kg, even under the extreme conditions of wind speed of 70 m/s and water current speed of 3.0 m/s. Therefore, the safety factor was selected as 5 and the breaking strength required for the mooring line was:
T b r e a k = n · T c a b l e 17500   kg
Thus, the EOM cable required by the mooring system must be able to withstand the pull of kg.
The EOM cable is composed of four optical fibers and eight 18# AWG copper wires (18 AWG). The two optical fibers are utilized for data transmission and the eight copper wires are utilized for power transmission. The diameter of the EOM cable is 30 mm, while the breaking strength is 200 kN and its weight in the water is 0 ± 2.0 N/m.
The EOM cable was designed with vectran fibers as the strength member. The conductors and optical fibers were in the core and the vectran fibers were wrapped outside them. There were four layers of vectran fiber, which were reverse spiral braided doubly around the core to reduce the torque of the cable. Polyester was selected as the outer sheath layer, to protect the vectran fibers from water. The cable is shown in Figure 19 and detailed information is given in Table 2.
The EOM cable had sufficient strength and was verified by tensile test, in order to make sure that it could moor the buoy well. Figure 20 shows the tensile test experiments. The EOM cable was first tested with a rated safe working load of 7 tons and kept for about an hour, after which the EOM cable was tested with a breaking load of 20 tons and kept for about 10 min. The test results showed that the EOM cable could withstand the working load and Minimum breaking strength.

6. Experiments in the Shallow Coast

6.1. Launch of MBOSBC

In this section, the deployment process of the system is discussed. The process of the inshore test is as follows: First, we installed the system at the wharf and tested the system to ensure it works properly, as shown in Figure 21. Second, we put the buoy into the water with a crane from the wharf and towed the buoy to the launch position, as shown in Figure 22. Finally, we utilized the winch to lift the benthic node to the seafloor. After deploying the benthic node to the seafloor, we released the lifting point to separate the lift wire rope from the system, as shown in Figure 23, and put the EOM cable into the water.

6.2. Recovery of MBOSBC

The system was recovered in the opposite order. First, a diver dove down to the seafloor, in order to hook the lift point of the benthic node and haul the wire rope to the ship winch of the mother ship. Then, the benthic node was lifted with the ship winch. Lastly, the buoy and EOM cable were recovered with an “A” frame and winch.
After recovery, it was found that there was no damage or fracture of the EOM cable, and there were few crops attached to the seabed support. The appearance of the EOM cable was intact, without scratches, abrasion, folding, or other problems. After recovery, there was less silt on the frame of the benthic node, indicating that the seabed was dominated by sandy bottom. Figure 24 shows the appearance of the Benthic Node and EOM cables, after they were recovered, on the ship.

7. Conclusions and Future Works

In this paper, an ocean observation system, MBOSBC, which uses an EOM cable to tether a buoy to a benthic node, was designed. First, the load of the buoy under wind, wave, and current forces was analyzed. The calculation results showed that, under the extreme conditions of wind speed at 70 m/s and current velocity of 3 m/s, about 3.2 T were needed to moor the buoy. Then, the mooring method for 1000 m water depth based on the EOM cable was designed and the tension of the EOM cable was calculated. The calculation results showed that EOM cables need to withstand a maximum force of 3284.3 kg under the extreme conditions of 70 m/s wind speed and 3 m/s current velocity. Under the condition that the safety factor was selected as 5, the strength of EOM cable was higher than kg. After carrying out a 20 ton tensile test on the EOM cable, it was confirmed that the EOM cable had enough strength to tether the buoy. The performance of the EOM cable was verified in a nearshore experiment at a water depth of 20 m. In future work, its performance will be verified in deep water and deployed in waters with a depth of more than 1000 m.

Author Contributions

Conceptualization, S.Z. and J.Y.; methodology, J.Y. and S.Z.; software, J.Y. and Y.X.; validation, W.Y., H.G. and Y.X. and S.Z.; formal analysis, W.Y. And J.Y.; investigation, W.Y., H.G. and Y.X. and S.Z.; resources, S.Z.; data curation, J.Y.; writing—original draft preparation, J.Y.; writing—review and editing, J.Y. and S.Z.; visualization, J.Y., Y.X.; supervision, S.Z. and W.Y.; project administration, S.Z. and H.G.; funding acquisition, S.Z. All authors have read and agreed to the published version of the manuscript.

Funding

This research was funded by “Natural Science Foundation of China (NSFC), grant number NO.51809255”; and “National Key Research and Development Plan of China NO.2018YFC0307906”; and “China Strategic Priority Research Program of the Chinese Academy of Sciences, Grant No. XDA13030301”; Institute of Deep-sea Science and Engineering, Chinese Academy of Sciences (CAS). And the authors would like to thank reviewers, for their careful work.

Conflicts of Interest

The authors declare no conflict of interest.

Abbreviations

EOMElectro-Optical-Mechanical
MBOSBCMooring Buoys Observation System for Benthic with Electro-Optical-Mechanical Cable
CUMASCabled Underwater Module for Acquisition of Seismological data
MOOSMBARI Ocean Observatory System
DEOSDynamics of Earth and Ocean Systems
OCBOffshore Communications Backbone
F B u o y Net force of buoy weight and buoyancy
F w i n d The force of wind on the buoy
F w a v e The force of waves on the buoy
F C u r r e n t The force of current on the buoy
ρ Density of seawater
g Acceleration of gravity
C i H Inertial force coefficient with respected to the horizontal plane
C D V Drag coefficient with respected to the vertical plane
A Max wave amplitude
V 01 Buoy wet volume
S V Acreage of head wave with respect to the vertical plane
T Wave period
D t h Draught depth
T m o o r Total mooring force
l d e p t h Water depth
l 1 Distance from sea surface to the top of “S tether” shape
l 2 Height of “S tether” shape
l 3 Distance from the bottom of “S tether” shape to the seabed
l t o t a l The total length of net buoyancy EOM cable
F t Tangential flow force
F n Normal flow force
C t Tangential flow resistance coefficient
C n Normal flow resistance coefficient
D Diameter of EOM cable
d s Micro-segment length
V c u r r e n t Current speed
Micro-section inclination
P M Net weight of micro-section in water
W M Weight of Micro-section
B M Buoyancy of Micro-section
d T Tension change of a micro-segment
d The angle change of a micro-segment
T The tensions at end of the micro-segment
G Net weight in water of the counterweight
B F Net buoyancy of the float in water

References

  1. Doyle, S.; Aggidis, G.A. Development of multi-oscillating water columns as wave energy converters. Renew. Sustain. Energy Rev. 2019, 107, 75–86. [Google Scholar] [CrossRef] [Green Version]
  2. Hamilton, A. Buoy Technology. In Springer Handbook of Ocean Engineering; Springer International Publishing: New York, NY, USA, 2016; pp. 937–962. [Google Scholar]
  3. Touzon, I.; Nava, V.; De Miguel, B.; Petuya, V. A Comparison of Numerical Approaches for the Design of Mooring Systems for Wave Energy Converters. J. Mar. Sci. Eng. 2020, 8, 523. [Google Scholar] [CrossRef]
  4. Sirigu, S.A.; Bonfanti, M.; Begovic, E.; Bertorello, C.; Dafnakis, P.; Giorgi, G.; Bracco, G.; Mattiazzo, G. Experimental Investigation of the Mooring System of a Wave Energy Converter in Operating and Extreme Wave Conditions. J. Mar. Sci. Eng. 2020, 8, 180. [Google Scholar] [CrossRef] [Green Version]
  5. Bach-Gansmo, M.T.; Garvik, S.K.; Thomsen, J.B.; Andersen, M.T. Parametric Study of a Taut Compliant Mooring System for a FOWT Compared to a Catenary Mooring. J. Mar. Sci. Eng. 2020, 8, 431. [Google Scholar] [CrossRef]
  6. Iannaccone, G.; Guardato, S.; Vassallo, M.; Elia, L.; Beranzoli, L. A New Multidisciplinary Marine Monitoring System for the Surveillance of Volcanic and Seismic Areas. Seismol. Res. Lett. 2009, 80, 203–213. [Google Scholar] [CrossRef]
  7. De Martino, P.; Guardato, S.; Tammaro, U.; Vassallo, M.; Iannaccone, G. A first GPS measurement of vertical seafloor displacement in the Campi Flegrei caldera (Italy). J. Volcanol. Geotherm. Res. 2014, 276, 145–151. [Google Scholar] [CrossRef] [Green Version]
  8. Chaffey, M.; Bird, L.; Erickson, J.; Graybeal, J.; Hamilton, A.; Headley, K.; Kelley, M.; McBride, L.; Mellinger, E.; Meese, T.; et al. MBARI’s buoy based seafloor observatory design. In Proceedings of the Oceans 04 MTS/IEEE Techno-Ocean ’04, Kobe, Japan, 9–12 November 2004; Volume 4, pp. 1975–1984. [Google Scholar] [CrossRef]
  9. Chaffey, M.; Mellinger, E.; Paul, W. Communications and power to the seafloor: MBARI’s Ocean Observing System mooring concept. In Proceedings of the MTS/IEEE Oceans 2001. An Ocean Odyssey. Conference Proceedings, Honolulu, HI, USA, 5–8 November 2002; Volume 4, pp. 2473–2481. [Google Scholar] [CrossRef]
  10. Hamilton, A.; Chaffey, M. Use of an Electro-Optical-Mechanical Mooring Cable for Oceanographic Buoys: Modeling and Validation. In Proceedings of the 24th International Conference on Offshore Mechanics and Arctic Engineering, Halkidiki, Greece, 12–17 June 2005; Volume 2, pp. 897–903. [Google Scholar] [CrossRef]
  11. Han, S.M.; Grosenbaugh, M.A. On the Design of Single-Point Cable-Linked Moorings for Ocean Observatories. IEEE J. Ocean. Eng. 2006, 31, 585–598. [Google Scholar] [CrossRef]
  12. Grosenbaugh, M.A.; Paul, W.; Frye, D.; Farr, N. Development of Synthetic Fiber-Reinforced Electro-Optical-Mechanical Cables for Use With Moored Buoy Observatories. IEEE J. Ocean. Eng. 2006, 31, 574–584. [Google Scholar] [CrossRef]
  13. Hamilton, A.; Chaffey, M.; Mellinger, E.; Erickson, J.; McBride, L. Dynamic modeling and actual performance of the MOOS test mooring. In Proceedings of the Oceans 2003. Celebrating the Past… Teaming Toward the Future, San Diego, CA, USA, 22–26 September 2003; Volume 5, pp. 2574–2581. [Google Scholar] [CrossRef]
  14. Paul, W.; Bentley, D.; Chaffey, M.; Frye, D. Electrical and electro-optical mooring links for buoy based ocean observatories. In Proceedings of the 2003 International Conference Physics and Control, Saint Petersburg, Russia, 20–22 August 2003; pp. 201–206. [Google Scholar]
  15. Makris, J.; Papoulia, J.; Tsambas, A. A real-time seismic and tsunami network in the Kyparissiakos Gulf, Greece. Boll. Geofis. Teor. Appl. 2014, 55, 561–587. [Google Scholar]
  16. Detrick, R.; Frye, D.; Collins, J.; Gobat, J.; Grosenbaugh, M.; Petit, R.; Plueddeman, A.; von der Heydt, K.; Wooding, B.; Orcutt, J.; et al. DEOS Moored Buoy Observatory Design Study; National Science Foundation/Ocean Sciences Division: Arlington, VA, USA, 2000.
  17. Clark, A.M.; Kocak, D.M. Installing undersea networks and ocean observatories: The CSnet Offshore Communications Backbone (OCB). In Proceedings of the OCEANS’11 MTS/IEEE KONA, Kona, HI, USA, 19–22 September 2011; pp. 1–9. [Google Scholar] [CrossRef]
  18. Clark, A.M.; Kocak, D.M.; Martindale, K.; Woodroofe, A. Numerica Modeling and Hardware-in-the-Loop Simulation of Undersea Networks, Ocean Observatories and Offshore Communications Backbones. In Proceedings of the MTS/IEEE OCEANS 2009 Conference, Biloxi, MS, USA, 26–29 October 2009; pp. 1–11. [Google Scholar]
  19. Georgiou, G.; Clark, A.M.; Zodiatis, G.; Hayes, D.; Glekas, D. Design of a prototype Tsunami Warning and Early Response system for Cyprus-TWERC. In Proceedings of the OCEANS’10 IEEE Sydney Conference and Exhibition, Sydney, Australia, 24–27 May 2010; pp. 1–5. [Google Scholar] [CrossRef]
  20. Favali, P.; Beranzoli, L.; D’Anna, G. A fleet of multi parameter observatories for geophysical and environmental monitoring at seafloor. Ann. Geophys. 2006, 49, 659–680. [Google Scholar]
  21. Konovessis, D.; Chua, K.H.; Vassalos, D. Stability of floating offshore structures. Ships Offshore Struct. 2013, 9, 125–133. [Google Scholar] [CrossRef]
  22. Thiagarajan, K.P.; Dagher, H.J. A Review of Floating Platform Concepts for Offshore Wind Energy Generation. J. Offshore Mech. Arct. Eng. 2014, 136, 020903. [Google Scholar] [CrossRef]
  23. Odijie, A.C.; Wang, F.-C.; Ye, J.-Q. A review of floating semisubmersible hull systems: Column stabilized unit. Ocean Eng. 2017, 144, 191–202. [Google Scholar] [CrossRef] [Green Version]
  24. Zhang, H.; Xu, D.; Xia, S.; Wu, Y. A New Concept for the Stability Design of Floating Airport with Multiple Modules. Procedia IUTAM 2017, 22, 221–228. [Google Scholar] [CrossRef]
  25. Amaechi, C.V.; Wang, F.-C.; Hou, X.; Ye, J.-Q. Strength of submarine hoses in Chinese-lantern configuration from hydrodynamic loads on CALM buoy. Ocean Eng. 2019, 171, 429–442. [Google Scholar] [CrossRef] [Green Version]
  26. Amaechi, C.V.; Gillett, N.; Odijie, A.C.; Hou, X.; Ye, J.-Q.; Nathaniel, G.; Agbomerie, C.O. Composite risers for deep waters using a numerical modelling approach. Compos. Struct. 2019, 210, 486–499. [Google Scholar] [CrossRef] [Green Version]
Figure 1. Catenary mooring.
Jmse 08 00672 g001
Figure 2. Semi-taut mooring.
Jmse 08 00672 g002
Figure 3. Inverse-catenary mooring.
Jmse 08 00672 g003
Figure 4. Concept design of Mooring Buoys Observation System for Benthic with Electro-Optical-Mechanical Cable (MBOSBC).
Jmse 08 00672 g004
Figure 5. Mechanical Design of the Mooring Buoy.
Jmse 08 00672 g005
Figure 6. Mechanical design of the Benthic Observation Node.
Jmse 08 00672 g006
Figure 7. External loads on buoys other than buoyancy and gravity.
Jmse 08 00672 g007
Figure 8. S-type mooring in 1000 m depth with 1400 m Electro-Optical-Mechanical (EOM) cable.
Jmse 08 00672 g008
Figure 9. Mooring design of system in 20 m depth with 60 m EOM cable.
Jmse 08 00672 g009
Figure 10. Cable and cable tray for inshore test.
Jmse 08 00672 g010
Figure 11. The relationship between velocity and water depth.
Jmse 08 00672 g011
Figure 12. The approximate shape of the mooring line under extreme sea conditions.
Jmse 08 00672 g012
Figure 13. The hydrodynamic force on an EOM cable micro-segment.
Jmse 08 00672 g013
Figure 14. Hydrodynamic force analysis of the EOM cable with attached ballast.
Jmse 08 00672 g014
Figure 15. Hydrodynamic force analysis of the EOM cable with attached float.
Jmse 08 00672 g015
Figure 16. The iterative algorithm of mooring force calculation.
Jmse 08 00672 g016
Figure 17. Mooring force property of the buoy under the wind speed of 10 m/s and current velocity of 0.6 m/s.
Jmse 08 00672 g017
Figure 18. Mooring force property of the buoy under the wind speed of 70 m/s and current velocity of 3.0 m/s.
Jmse 08 00672 g018
Figure 19. Appearance of the EOM cable.
Jmse 08 00672 g019
Figure 20. EOM cable tension experiments.
Jmse 08 00672 g020
Figure 21. System testing and installation at the wharf.
Jmse 08 00672 g021
Figure 22. Towing the buoy to the area of deployment.
Jmse 08 00672 g022
Figure 23. Launching the benthic node on the seabed.
Jmse 08 00672 g023
Figure 24. Recovery of the Benthic Node and EOM cable: (a) Benthic Node recovered on the ship deck; and (b) appearance of recovered EOM cable.
Jmse 08 00672 g024
Table 1. Mooring forces of buoys and cables with respect to different wind, waves, and currents.
Wind speed (m/s)0.510203040506070
Current speed (m/s)0.10.61.21.82.12.52.83.0
Wave height (m)0.11.42.94.35.77.18.610
Buoy horizontal load (kg)18.1277.3630.61024.61430.41892.82397.92903.8
Buoy vertical load (kg)0.1428.7123.1270.6475.5737.71082.31463.3
Buoy comprehensive load (kg)18.1278.8642.51059.71507.42031.52630.83251.7
Cable initial angle (°)0.55.911.014.818.421.324.326.8
Maximum cable load (kg)49.6279.0646.01070.91522.62054.52659.73284.3
Table 2. Properties of the EOM cable.
Cable PropertiesUnitNominal Value
Diametermm30
Air weightkg/m0.9 ± 0.1
Weight in sea waterN/m0 ± 2.0
Minimum breaking strengthkN200
Maximum working loadkN100
Safe working loadkN50
Working voltageVDC, 1000
Current of each copper conductorA≤5

