Article

Risk Assessment of Work Accident in Container Terminals Using the Fault Tree Analysis Method

by
Muhammad Arif Budiyanto
* and
Haris Fernanda
Department of Mechanical Engineering, Universitas Indonesia, Kampus Baru UI Depok, Jawa Barat 16424, Indonesia
*
Author to whom correspondence should be addressed.
J. Mar. Sci. Eng. 2020, 8(6), 466; https://doi.org/10.3390/jmse8060466
Submission received: 10 May 2020 / Revised: 21 June 2020 / Accepted: 22 June 2020 / Published: 24 June 2020
(This article belongs to the Section Ocean Engineering)

Abstract

:
The use of containers in the world is increasing every year in line with international trade flows. In very complex container terminal operations, the risk of work accidents is inevitable and can happen at any time. Therefore, this paper aimed to identify accidents and potential risks occurring in the container terminals. For the case study, the analysis was used the data of accidents during five years in one of the major container terminals in Indonesia. Risk assessment is carried out using the risk matrix method to get the level of risk. The risk that has the highest level is analyzed by using the Fault Tree Analysis method. From the results of the risk assessment shows the container fell to the berth when loading and unloading have the highest risk value. While the results of the Fault Tree Analysis show that traffic accidents are the biggest potential risk, which is 41.8% compared to other accidents. Moreover, human factors especially due to the negligence in operating vehicles or equipment as well as the damage of equipment were the highest common causes of accidents in the container terminal. Based on these results the contribution offered is the risk control options for terminal operators to reduce the possibility of safety failure in the container terminal.

1. Introduction

The container terminal plays an important role in both the transportation and trade sectors and also serves as visible indications of a country’s economic growth [1]. This has, however, led to the domination of this sector in the world by Asian countries [2]. Some of the largest container terminals in the world are competing to improve terminal productivity, some of the approaches conducted are with integrating their quay cranes with an internal truck [3] and integrating collaborative of outsourcing strategies for yard truck assignment [4]. Even in the modern container terminal, several measures have been performed to increase energy efficiency [5,6] and reduce emissions at the port [7,8]. There are complex work processes on a container terminal and they include stevedoring, delivery, and receiving, each of which is contributing to the unexpectedly high risk experienced by people or actors [9], the environment, or properties and facilities at the port [10]. Based on data released by the Hong Kong Maritime Department in 2016, there were 76 cases of work accidents at the loading and unloading section of the port. Those related to work consisted of 60 minor, 15 serious, and 1 fatal accident [11]. Another data from the United Kingdom Health Safety Executive in 2010–2011 also recorded 392 cases due to container loading and unloading [12] while Petros L. Palli’s study on port risk management in container terminals reported a total of 1498 victims due to work accidents at container terminals [13] and 45 incidents of environmental pollution due to oil spills which were equivalent to 3.5 tons from 2008 to 2011 at Piraeus and Thessalonica Ports, Greece [14].
In Indonesia, accident statistics data issued in 2016 recorded 4 accident cases with 23 fatalities in 2012 and 6 cases with 75 fatalities in 2013. The data from 2014 to 2016 recorded 7, 11, and 15 accidents with 26, 87, and 69 fatalities respectively [15]. According to Darbra Casal’s study, the majority of accidents represented by 56.5% on the ports were due to cargo transportation, 14.9% by loading and unloading operations, and 15.9% because of human error [16]. These data showed the potential risk at the container terminal is also high, therefore, there is a need for effective risk management with the ability to prevent and handle these potential risks.
Safety and security have been a concern in container shipments over the past few decades [17] and this has led to the use of risk management in the decision-making process of health care, environment [18], and physical infrastructure systems [19]. Also, several scientific materials have also been implemented in decision-making to develop theories, methodologies, and equipment required to assess these risks [20]. Moreover, there is a need to apply these efforts in handling safety at the port, especially at the dock, [21] to reduce or eliminate the effects of certain environmental, weather, human, social, and economic factors [22] such as compensation for damage or death, prevention of pollution, and other medical expenses [23,24]. The port provides information, costs [25], and facilities required by consumers to use container loading and unloading services and also considers the accident rate and material damage [26,27].
A lot of studies have been conducted on risk management using different approaches. For example, the assessment of the multi-criteria risk of Analytical Hierarchy Process requires the use of an opinion approach to defining a list of key risks [28,29] while a fuzzy reasoning method was used to measure the risk and cost-benefit analysis of the control measures [30,31]. Moreover, the risk factors related to port operations and management have been described and evaluated in Iran [32] while other studies have used the average value approach and stochastic dominance method to determine the level of risk factors at the port of Taiwan based on questionnaire survey data [33,34]. The event tree analysis approach was also reported to have presented a multi-agent model to solve the problems of port management and logistics chains at the ports of San Antonio and Valparaíso [32,35]. Also, the formal safety assessment (FSA) approach assessed the possibility of port risks with due consideration for several factors and their mutual effects as well as the evaluation of risk management by considering the economic effects of the Risk Control Option (RCO) [36]. This approach was implemented in the ports of Piraeus and Thessalonica. Regardless of the risk approach used, several advantages are depending on the type of analysis—quantitative, qualitative, or hybrid which could be through the combination of quantitative-qualitative or semi-quantitative [37]. From the existing literature review, there is much research on risk assessment in container terminals. From the existing research, most of the study focuses on risk analysis to assess the safety performance of the terminals. The risk identification is carried out within the limits of qualitative assessment, without investigating the root cause of the problem. In its application in the field, terminal operators need to know the root cause of the risk. Identification of the root causes and its control options will be a novel contribution to the terminal operator. Thus, there is still a research gap that focuses on the root cause of the risk analysis in the container terminal, the method that can be used is to investigate using Fault Tree Analysis.
The purpose of this study was to identify accidents and potential risks at the one of the major container terminals in Indonesia by assessing the causes using the Fault Tree Analysis (FTA). This approach provides a combination of causes underlying the main causes of risk. This research grouped the accidents occurring at the container into categories commonly used by port operators to ensure it is easily understood while the classification of the risk causes into taxonomies was to make the determination of the appropriate mitigation process easy to achieve more effective and efficient implementation.

2. Risk Analysis Methodology

The risk analysis method performed in risk management will depend highly on data availability, information sources and the purpose of the risk analysis carried out. This study uses the Formal Safety Assessment (FSA) method with a Fault Tree Analysis (FTA) risk assessment. The FSA is a structured, systematic methodology designed to enhance safety at sea through risk analysis and cost assessments, including the protection of life, the environment and property. The FSA method was introduced by International Maritime Organization (IMO) as a rational and systematic process for accessing risks related to maritime safety and port environmental protection and for evaluating costs and verifying options to reduce risk. Based on the recommendations from IMO, the FSA process consists of five phases: identification of hazard, risk-assessment, risk-control options, cost-benefit evaluation, and decision-making recommendations. The explanation of each stage in detail is explained in the following sections.

2.1. Data Collection

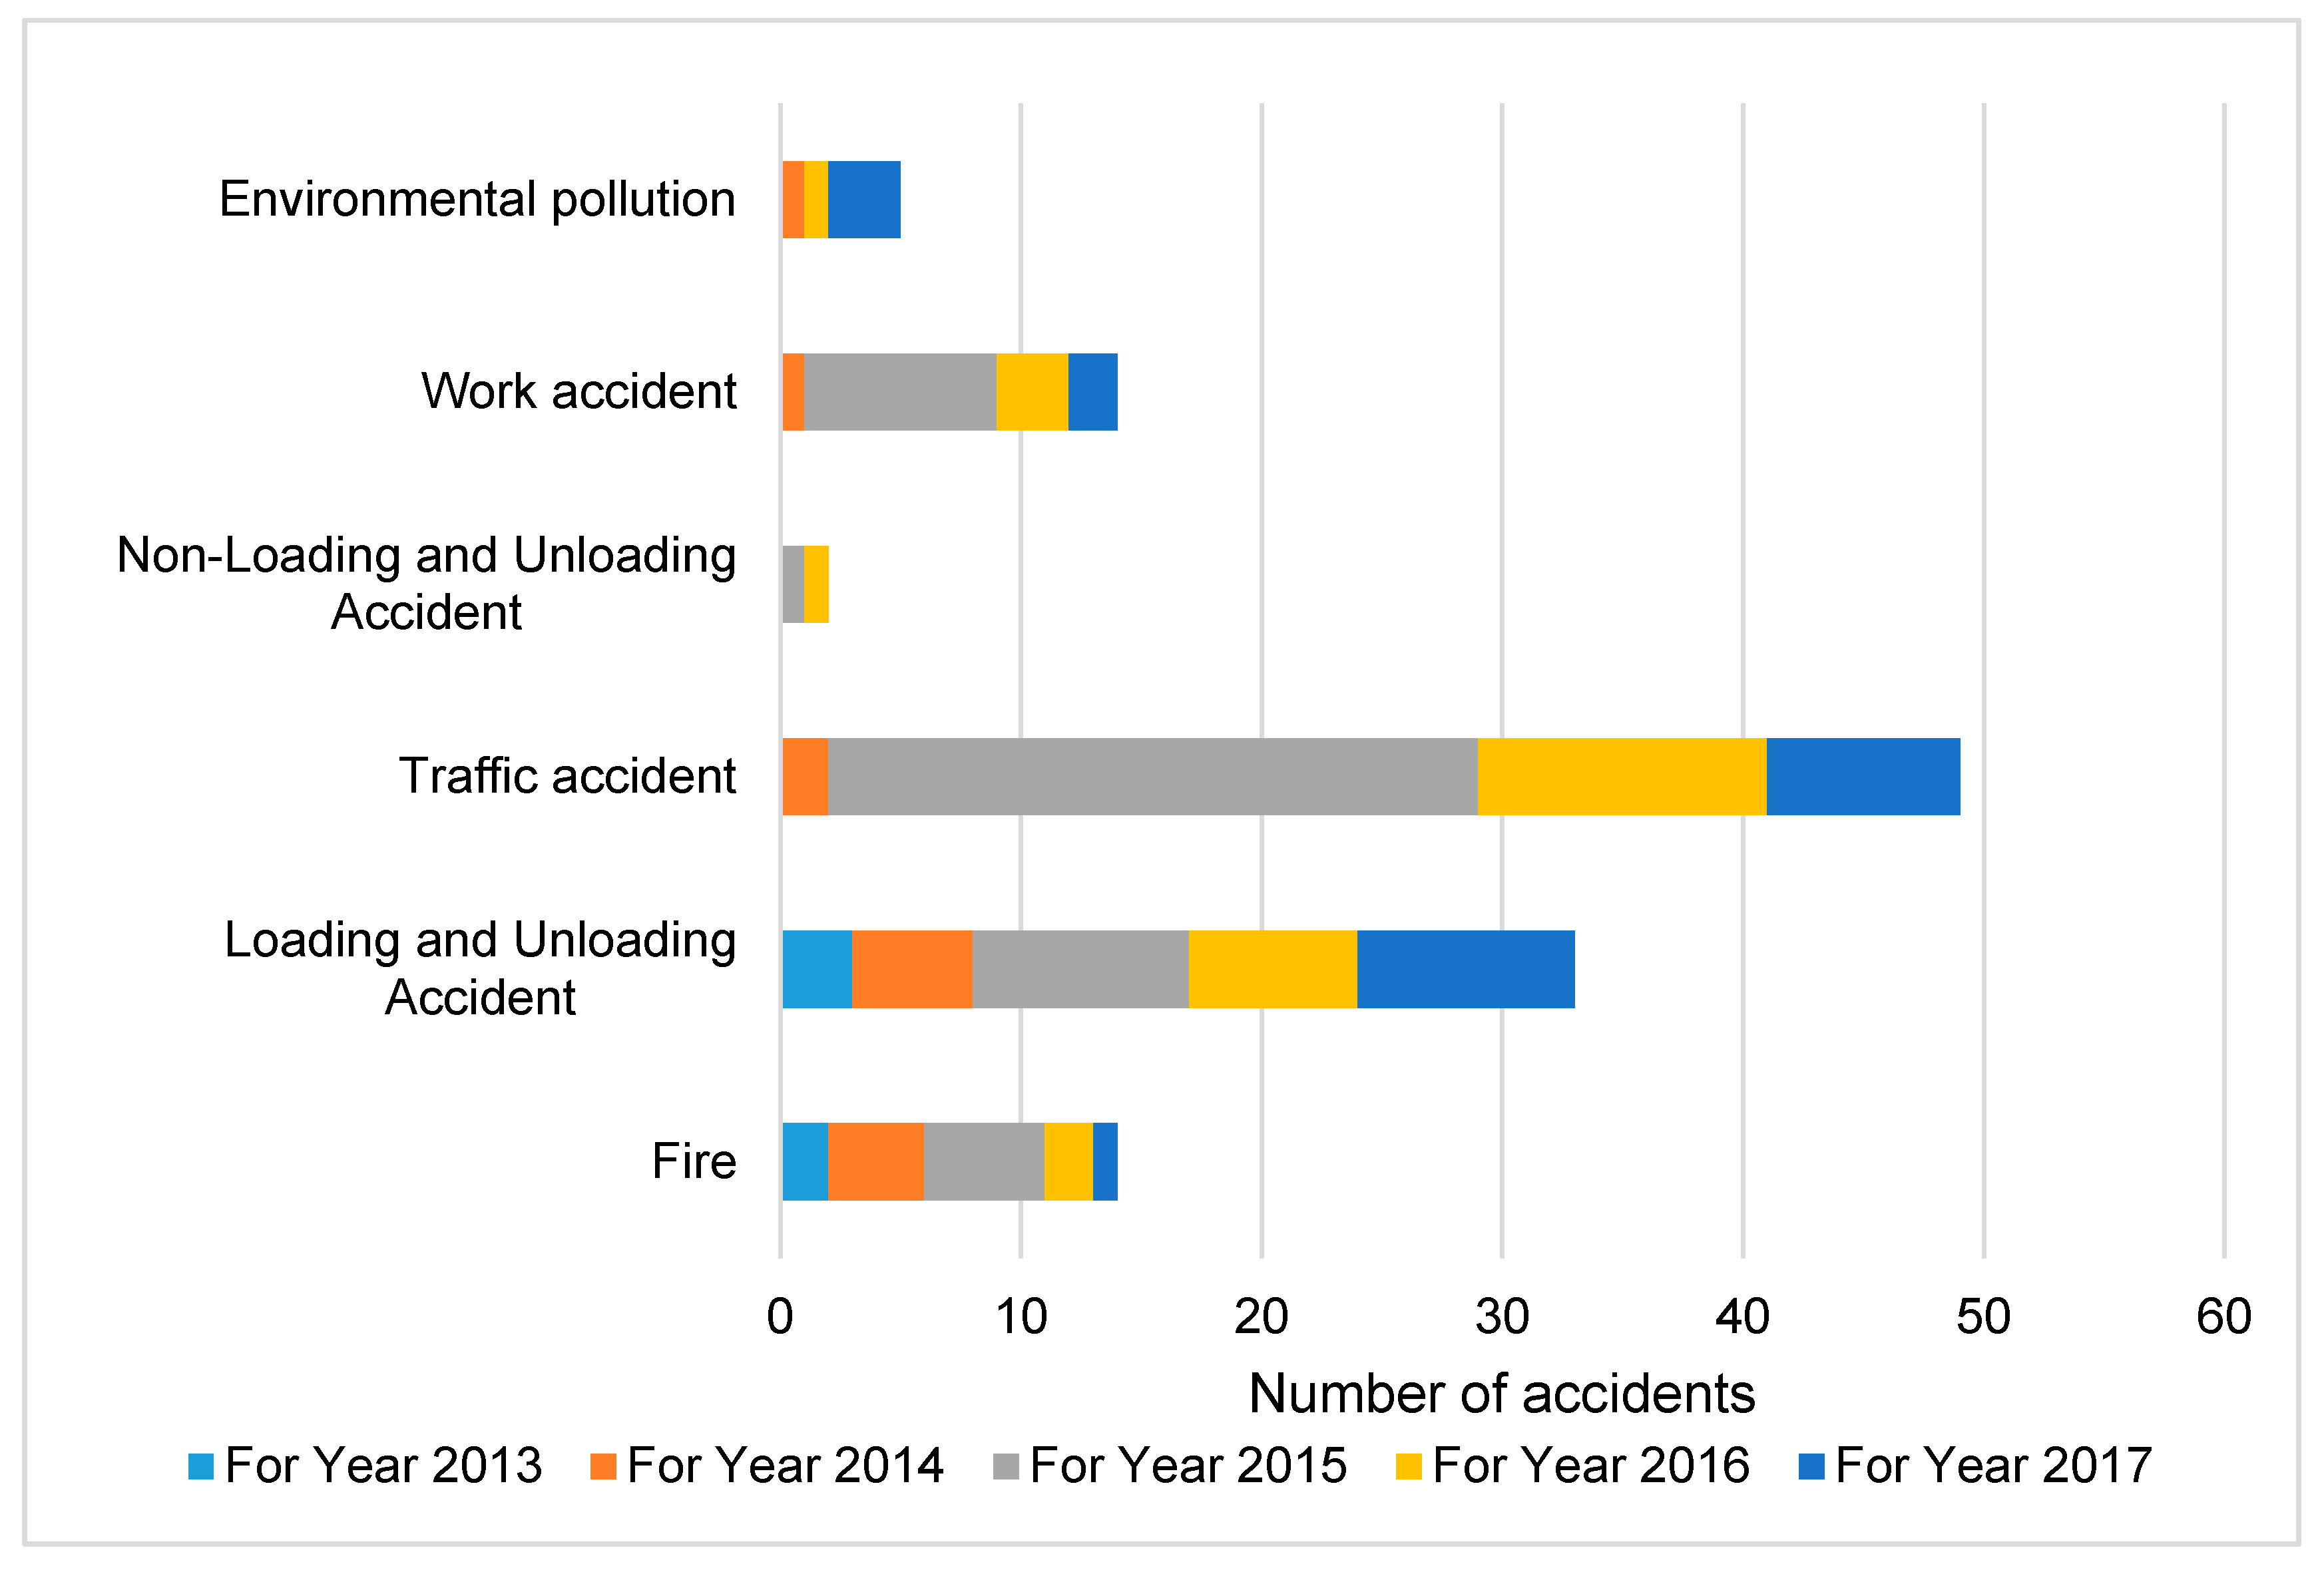
The Formal Safety Assessment (FSA) method was combined with the Fault Tree Analysis approach to assessing the risks at the operation terminals 2 and 3 of Port of Tanjung Priok (PTP), Jakarta, Indonesia. The focus was on the cargo activities including gate and yard operations in the container yards to the delivery/receiving section. The data obtained consisted of primary data and secondary data. Primary data is data obtained by observing and research directions in the field. Data obtained from interviews and direct observations in the field. Secondary data is data that cannot be collected directly by researchers. This data can consist of company documents or other supporting data needed to complete the research. This data is an accident data that occurred at the container terminal for the last 5 years (2013–2017).
The interview process is conducted by two interviewers who have an engineering background and the interviewees are terminal operator employees. The duration of the interviews is about one month on the weekdays. The number of interviewees is about three to five employees depend on the container handling locations. There are at least four profiles of interviewees namely administrative officers, container yard operators, cranes operators, and truck operators. The interview process is carried out as follows, before conducting the interview the interviewer has collected the historical accident data in the terminal. The data is then grouped into several question segments that lead to the causes of accidents, there are six categories of causes of accidents which will be discussed in the next section. The questions given are in the form of open questions, where the interviewee is free to express anything related to the cause of the accident. From the result during the interview, the interviewer then groping the answer into the data presented in this paper.
The results of data collection in the field in the form of hazard identification contained in the container terminal as many as 23 data. There are 6 primary data, namely construction project fires, damaged bridge scales, dug-up trucks, docks damaged when the ship rests, containers received are damaged, workers are electrocuted. For secondary data, the results of hazard identification are included in the category of fire, loading, and unloading accidents, traffic accidents, non-loading accidents, work accidents, the environment. From the whole data is processed and presented in the next section.

2.2. Risk Identification

This stage involves the identification and classification of all relevant hazards and risks using work accident data at the container terminals between 2013–2017 as the basic guideline. The categories are as follows:
  • Fire
  • Loading and unloading accidents
  • Non-loading and unloading accidents
  • Traffic accident
  • Work accident
  • Environmental accident
Categorizing the hazards identified into several general categories by considering who and what is losing. Also, the percentage of accidents causes was calculated based on the consideration that if 1 accident is caused by 1 cause, then the value of the cause is 1 but if 1 accident is due to n causes of an accident, then the value of each cause is 1/n. This calculation method is a percentage of the causes of accidents using the basic concepts of fractions and frequency distribution.

2.3. Severity

Severity is the result of an incident usually stated as a loss of risk and assessed using a numerical table. This study only considered severity concerning safety and environment while the other variables were ignored, therefore, a simple method was applied, and the parameters used are as shown in Table 1.

2.4. Likelihood

Likelihood describes the frequency level of risk that might occur for 5 years or reaching 10,000 incidents depending on the number of workers and assets as well as the breadth of the area, and others. Table 2 shows the parameters to assess the frequency level of risk.

2.5. Risk Matrix

Analytically, the 5 × 5 Risk Matrix reflects potential variations in frequency greater than the consequences. However, the facilitation of the ranking and validation of the ratings requires the consequences and frequency index are defined on a logarithmic scale. Moreover. the “risk index” is formed by combining the Frequency index and the Severity Index using the following equation:
Risk Index = Frequency Index × Severity Index

2.6. Risk Assessment

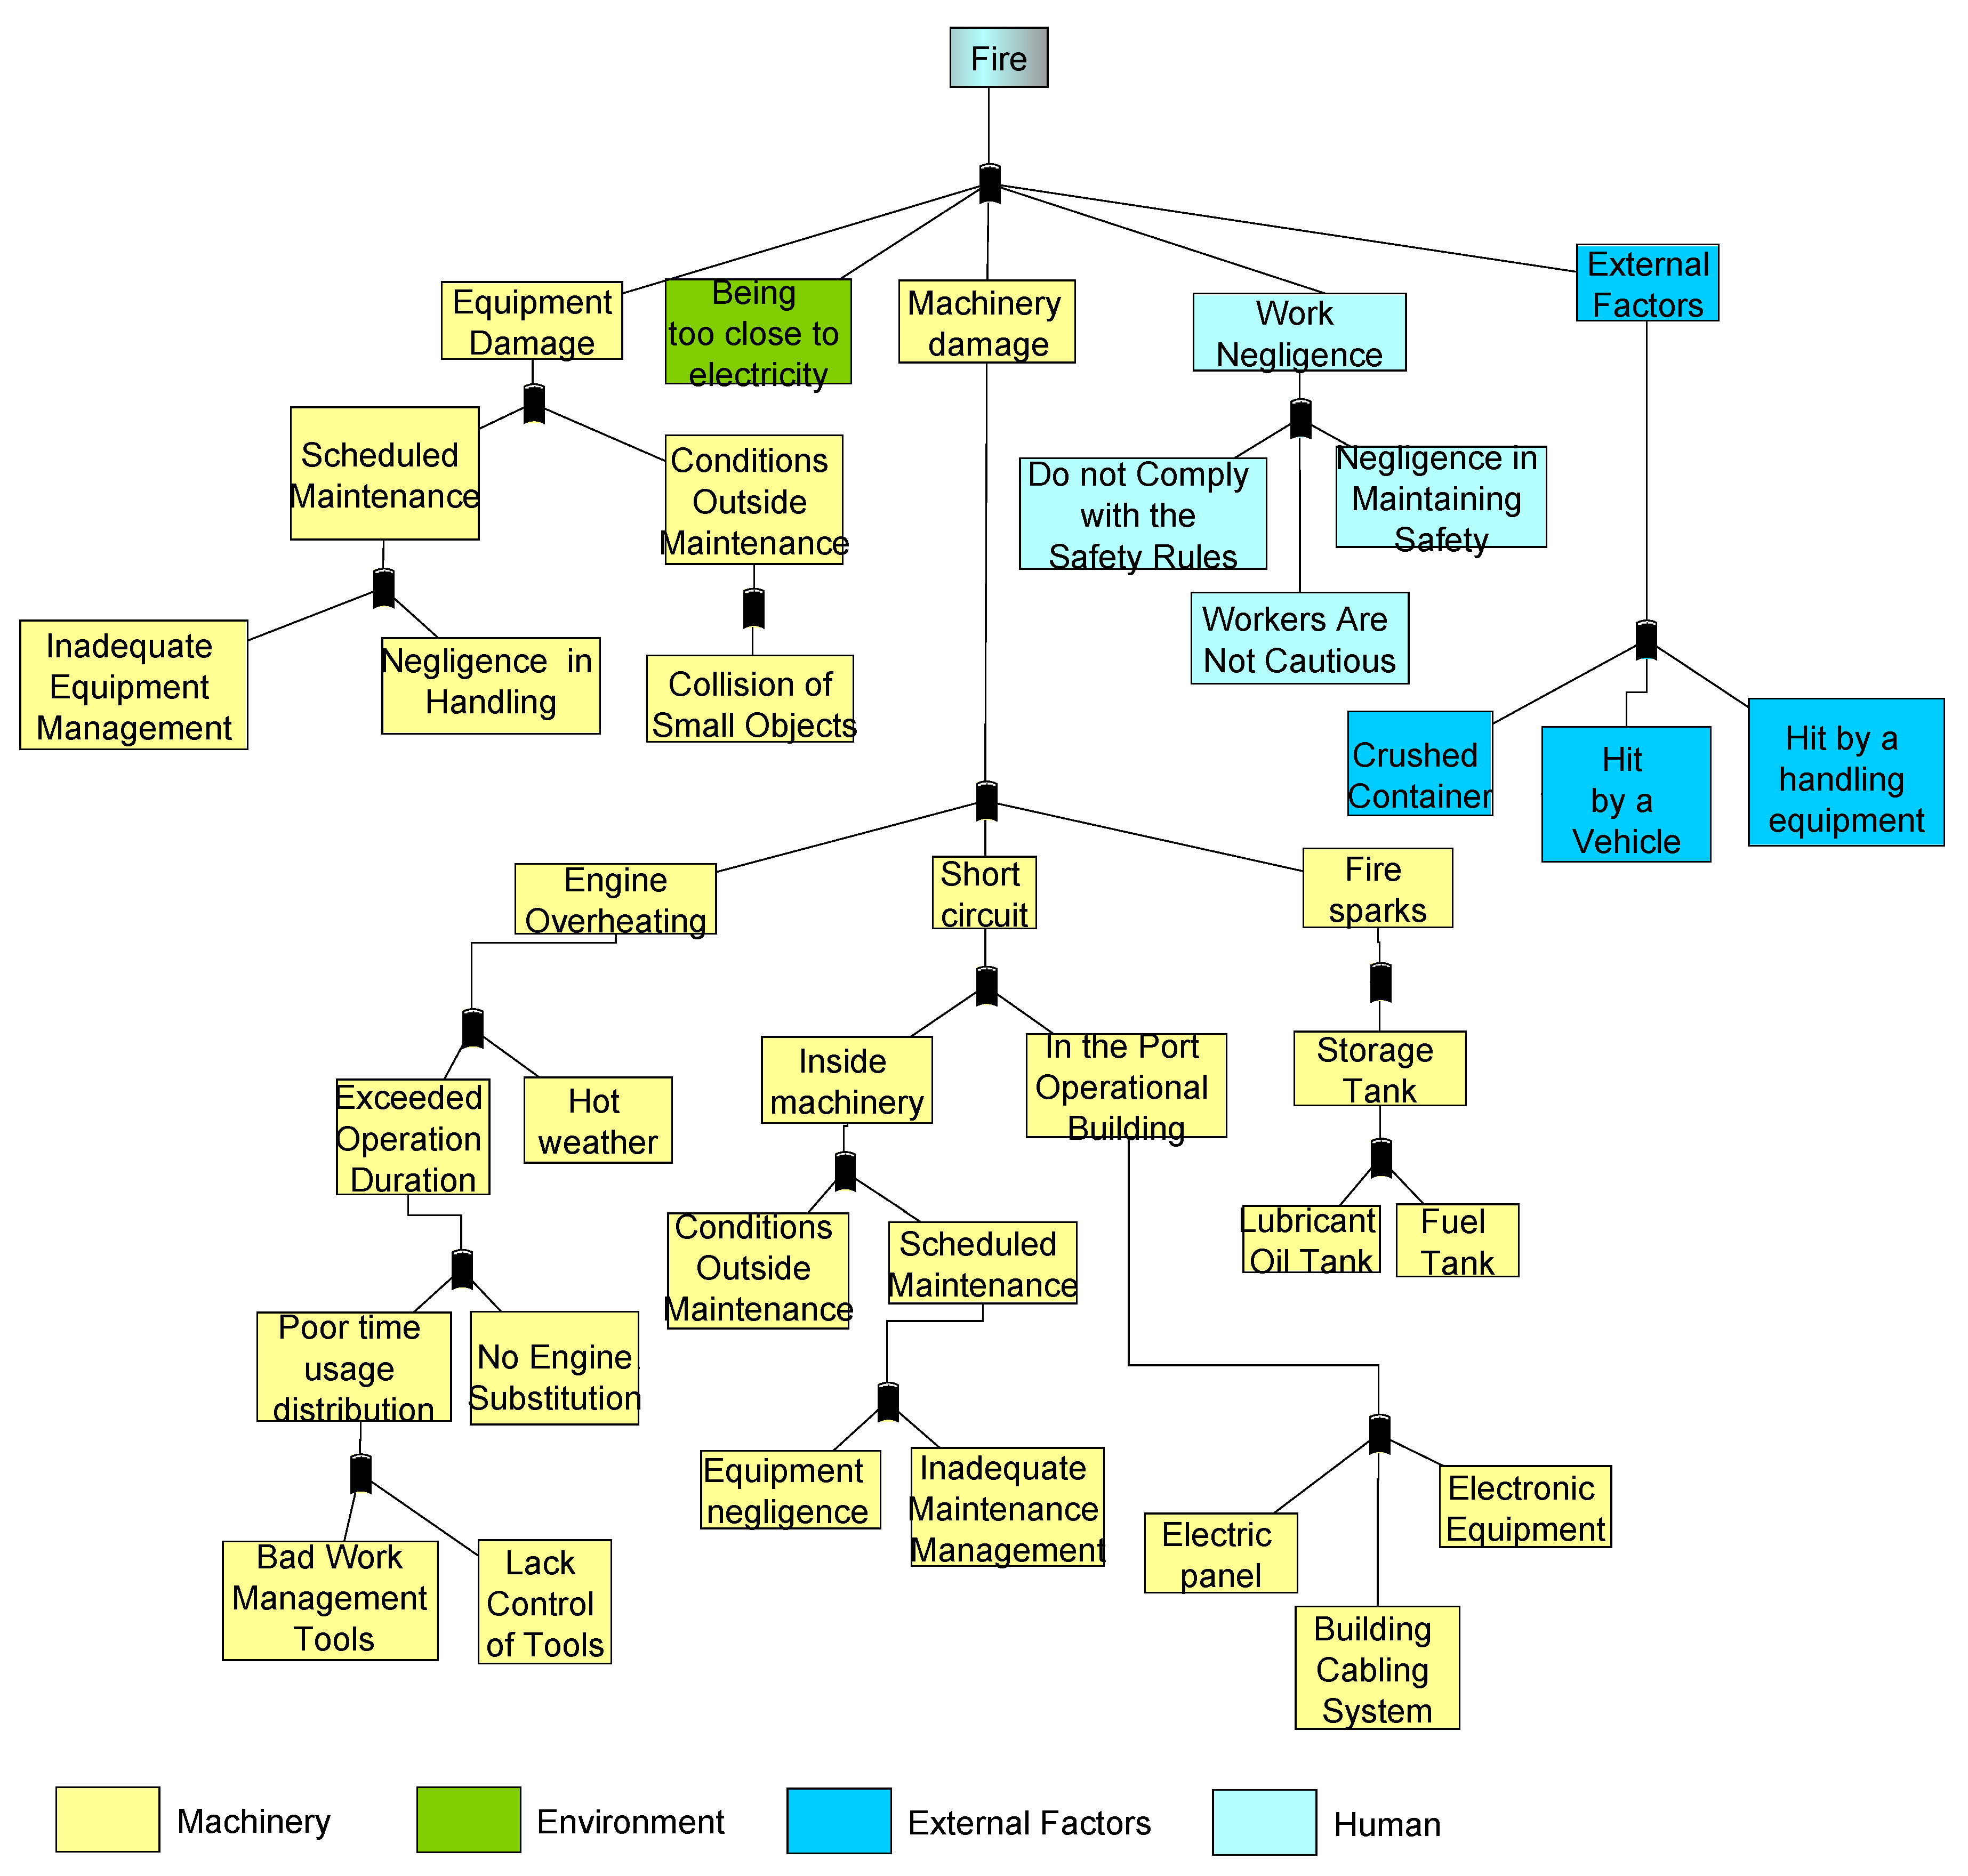
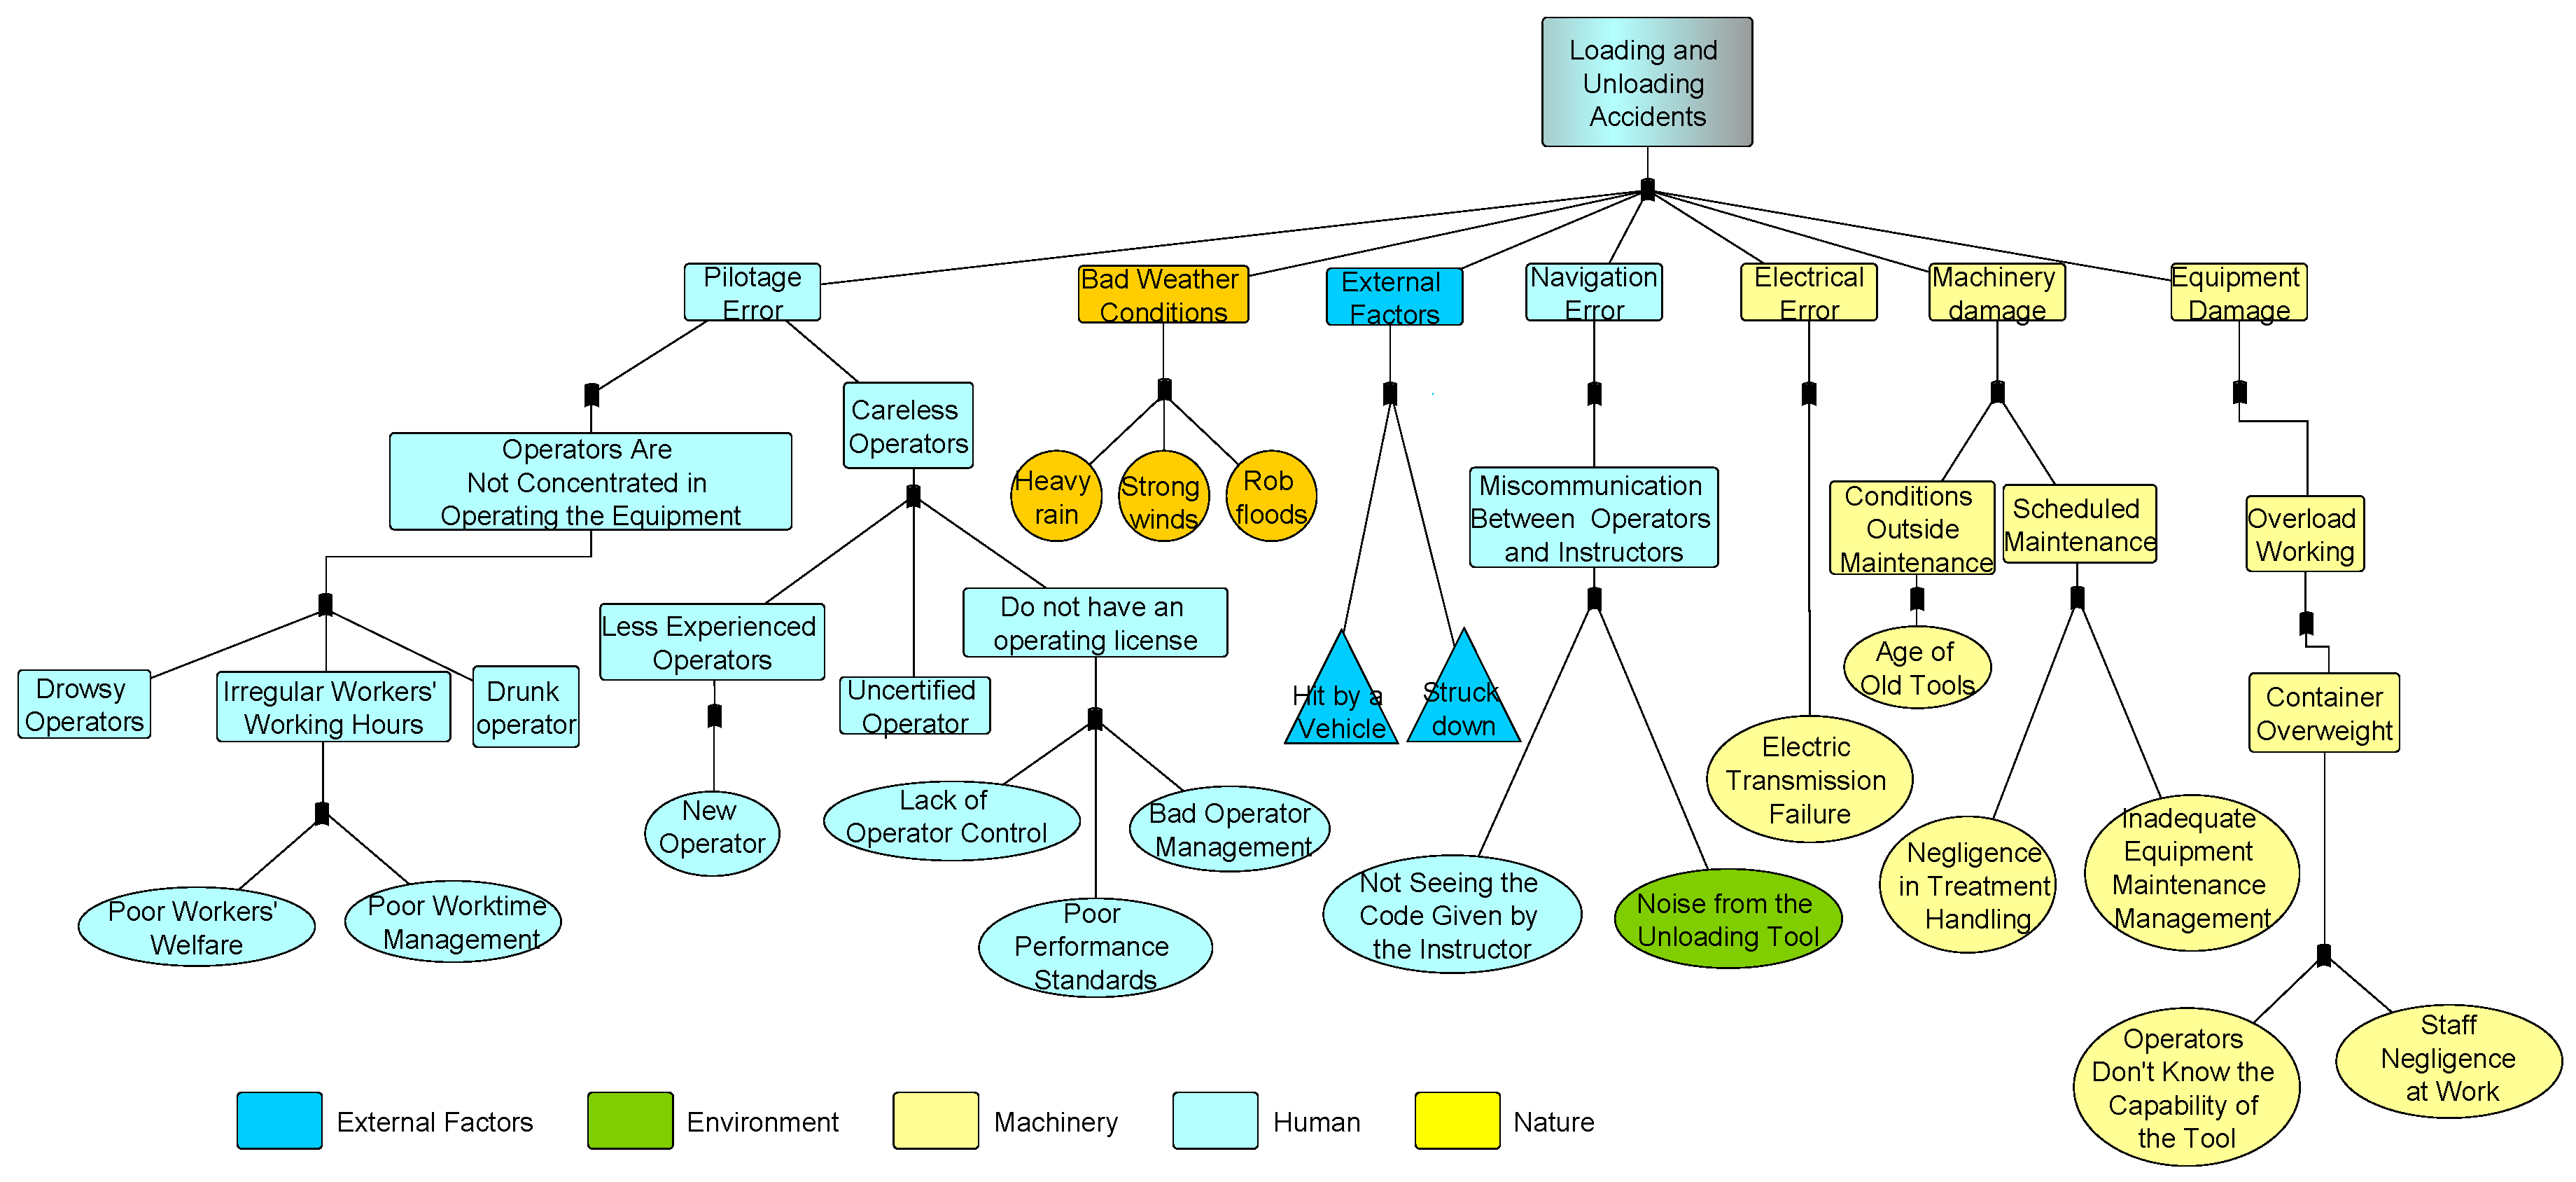
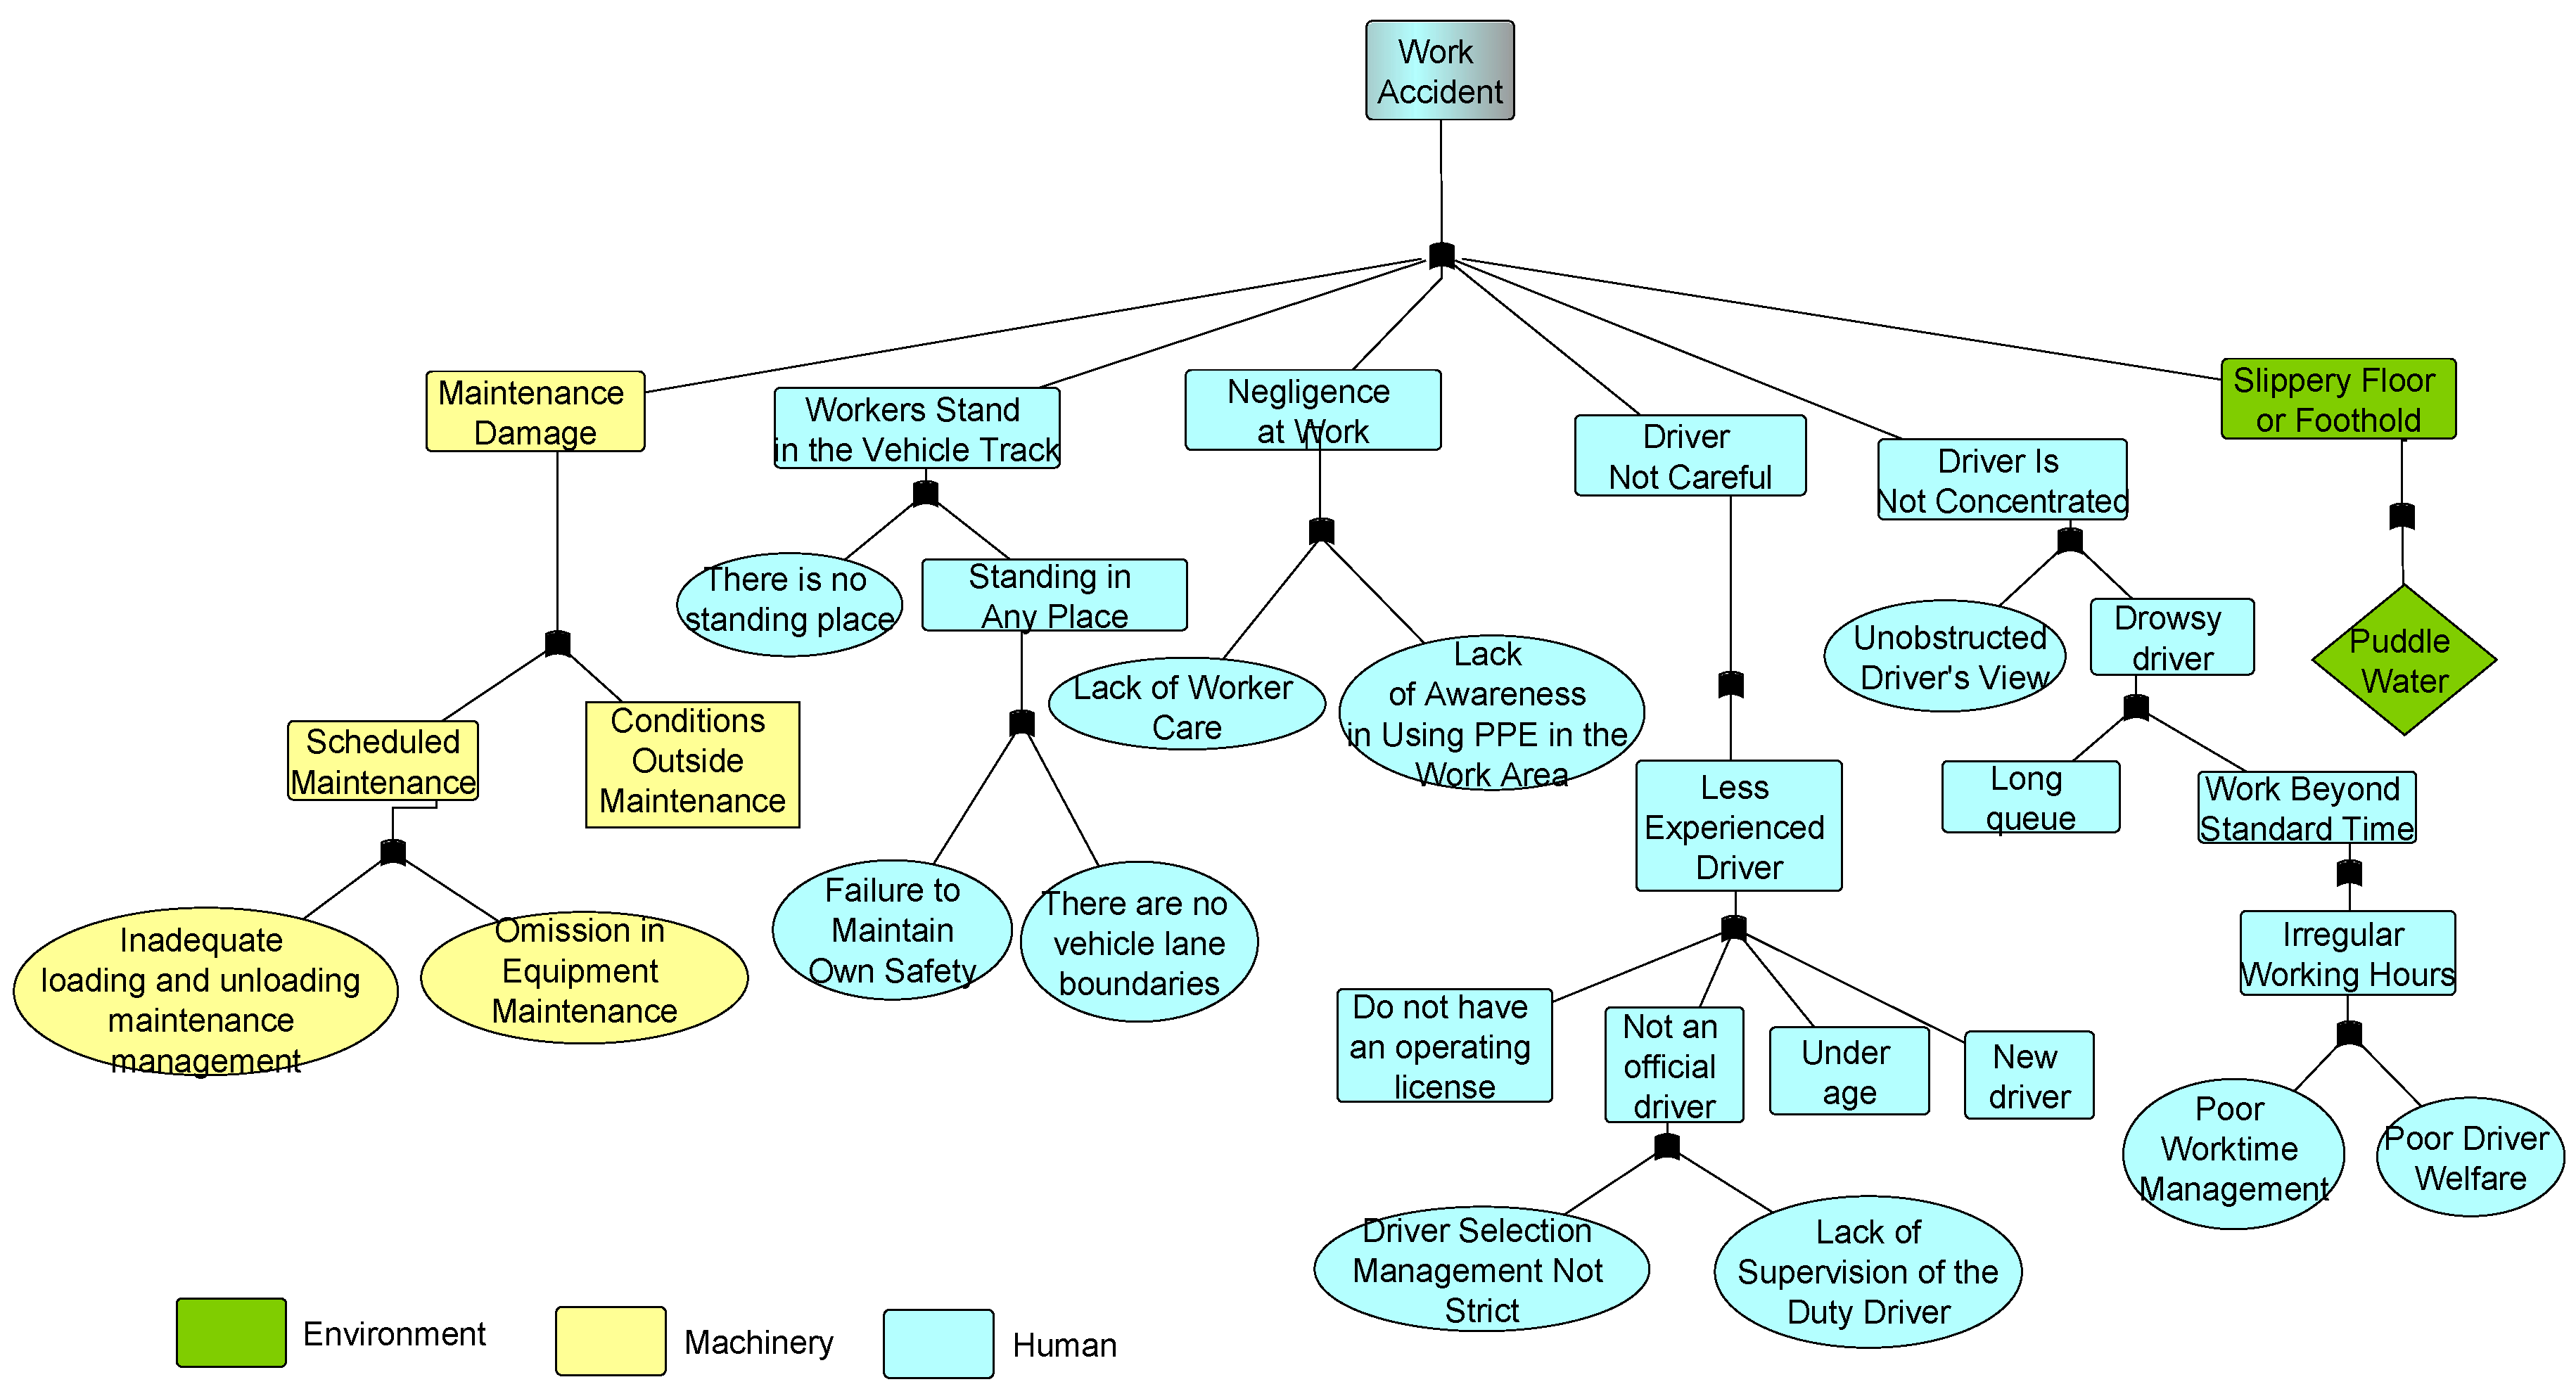
The risk assessment aimed to comprehensively investigate the causes and consequences of the identified scenarios. The FTA method used describes and analyzes the cause of risk up to the root and this is the reason it is mostly applied as a tool for analysis, system evaluation, and decision making. It consists of several diagrams to show the information contained therein.

2.7. Risk Control Options

The risk control options in this study were to propose effective and practical risk control options (RCO). The first step was identifying and controlling potential risk while the second was evaluating the effectiveness of RCO in reducing the risk.

2.8. Results and Recommendations

The results obtained were used to make relevant recommendations in order to improve safety at the Container Terminal as indicated in the final chapter of this paper.

3. Risk Assessment Analysis

3.1. Risk Identification Results

Over the past five years, there have been 117 accidents at the container terminal were classified into 25 types of accidents. Figure 1 shows the highest accident rate was recorded in 2015 while the most prevalent over the last five years was found with the traffic covering 41.88% of the total accidents. This indicates container mobilization, truck movement as well as loading and unloading equipment are the most vulnerable processes causing accidents. Moreover, it was not only the risks related to container terminal operations that were observed but also their causes and general impacts. Based on the risk taxonomy, the common causes of accidents with the percentage of their contribution are presented in Table 3. The data presented of this table is the result of the calculation of the frequency value of each risk factor in an accident in the past five years.
The table shows human factors are the most common cause of accidents at container terminals by almost 53%, especially the negligence in driving which was termed pilotage error was found to be the highest with 36% of total accidents. Furthermore, other factors such as poor supervision, negligence while working, inadequate equipment maintenance, and miscommunication when working or navigation errors also need to be considered. The machinery factor is also important because it contributed almost 30%, especially engine damage which was discovered to be 25% as well as equipment damage or electrical errors. These are generally related to other factors such as improper training for humans operating the equipment leading to unexpected damage or abnormal operation.
The accidents caused by environmental factors were almost 15% and these may either be controllable or not. The uncontrollable ones include floods or other disasters while the controllable ones are road damage, lack of lighting, cargo spills, or noisy equipment which are closely related to poor supervision and maintenance. The accidents caused by nature were recorded to be 3%.

3.2. Assessment with Risk Matrix

This risk matrix categorized the level of risks into four different colors with low risk represented by blue, medium by yellow, significant by green, and high by red. Moreover, the value limits were low risk at 1–4, medium at 5–9, significant at 10–12, and high at 15–25. This assessment was conducted through the evaluation of the severity and frequency of each risk. Table 4, therefore, shows the level of each risk based on frequency (F) and severity (S) to obtain a more detailed Risk Index (IR) than the risk matrix. The mark given in Table 4 is based on the risk index value entered the risk matrix. The objectivity and reliability of risk assessment are based on the frequency and severity of an event, so it can be said that this depends on the quality of the data used.
The Risk Matrix was used to determine the level of risk and the results are shown in Table 5.

3.3. Assessment with the Fault Tree Analysis Method

These risks were subsequently analyzed using the Fault Tree Analysis (FTA) method to determine the root causes of each risk category. It was conducted through a top-down approach of a Top Event followed by the detailed reasons for its failure [21]. The six risk categories were analyzed into one using this approach due to the insignificant similarities and differences between them.
The use of FTA required grouping the common causes of risk based on the taxonomy and database to determine the root cause of the accident using in-depth analysis. The focus was on controllable root causes, especially the six major categories of accidents and all four considered to have a high level of risk. The risk confidence level was combined with the assessment to have a large category of accidents while the root causes are described further thoroughly.

3.3.1. Risk Analysis of Fire

Every fire accident at the port. from the dock, yard and gate operations were included in this category with the focus on fire incidents on loading and unloading equipment, buildings, vehicles, or other non-human things that were classified risk to the property. Table 6 shows the common causes of fire over the five years studied.
Table 6 shows the fire was caused by four common factors and the highest was found to be machinery with 55% while the risk factors were damage to truck engine with 21% and equipment damage at 34%. This was followed by the human factor majorly dominated by the negligence while working which was recorded to be 21%. The third prevalent factor was nature as observed from the hot weather contributing 14% and was also found to be occurring with the machinery. Furthermore, the external factors contributed 9% including getting run over by 4%, getting sucked under by 2%, and near electrical installations by 4%. The FTA of fire is. therefore. described in Figure 2.
Figure 2 shows the human factor was due to the carelessness of the workers while the equipment damage was usually because of engine overheating. sparks coming from the storage tank, or short circuit of the abandoned building as well as others such as external factors and scheduled maintenance. According to the interview conducted. the root causes of fire include:
  • Negligence during maintenance
  • Inadequate management of loading and unloading equipment
  • Negligence in leaving the room
  • Disobedience to safety rules
  • Negligence in maintaining safety
  • Inadequate management of equipment working time
  • Poor control of tools

3.3.2. Risk Analysis of Loading and Unloading Accidents

The accidents at each stage of the loading and unloading process were divided into two based on the place of occurrence. The first includes those observed while loading and unloading containers to and from ships while the second was in the open storage. The focus of this category was on the losses due to equipment and vehicles known as the risk to the property. The findings of these analyses are shown in Table 7.
Table 7 shows human factors are the highest common cause of loading and unloading accidents with a contribution of 42% mostly due to negligence during an operation known as pilotage error, inadequate worker supervision, poor maintenance of equipment, and miscommunication between operator and instructor known as navigation error. This was followed by the machinery with 38% as observed with equipment damage and system failure through electrical error. The third was the external factors with 17% which included getting run over and struck down. The last was due to environment and weather factors with a very little contribution of 1%. As previously state, these usually work concerning the machinery or human factors. The FTA of the loading and unloading accident is described in Figure 3.
The interviews, therefore, showed the root causes of loading and unloading accidents to be:
  • Inadequate operator supervision management
  • The inability of the operator to make use of a tool
  • Negligence of officers while working
  • Inadequate tool maintenance management
  • Poor welfare and working time management
  • Inadequate work standards
  • Failure of the loading and unloading transmission

3.3.3. Risk Analysis of Non-Loading and Unloading Accidents

This risk analysis focused on accidents without loading and unloading processes and most of these associated with humans, machinery, and the environment as shown in Table 8.
Table 8 shows non-loading and unloading accidents were caused by three factors and the environment due to the submergence of containers in water was found to be the highest with 50% while both humans and machinery contributed 25% each. These results are consistent with Kadir’s research (2020) which has carried out safety evaluation in three major ports in Malaysia where there are risk factors in container ports namely human, machine, and environment [38]. The human factors include negligence while working and the machinery involves equipment damage as shown in Figure 4.
The interviews conducted showed negligence while working was caused by workers’ lack of concentration and non-usage of safety equipment while equipment damage was due to several activities outside the maintenance such as improper installation or overloading. Therefore, the root causes of non-loading and unloading accidents include:
  • Inadequate management of tool supervision and control
  • Poor work time management
  • Negligence during duty
  • Inability to use tools
  • Management and negligence during treatment

3.3.4. Risk Analysis of Work Accidents

Accidents causing losses to workers from loading and unloading to the entry and exit of containers at the port were also analyzed and the results are shown in Table 9.
Table 9 shows the work accidents are caused by three common factors with the highest being human activities such as negligence while working and pilotage error which was found to have contributed 64% while machinery, especially equipment damage was estimated at 32%, and environmental factor in the form of slippery footing was approximately 3%. This result is following Shang’s (2010) research which has carried out risk analysis in the port of Kaohsiung which results stated the top three severity of the damage was to slip the container directly into the trailer and weather factors [25]. These are, therefore, described in Figure 5.
The results of the interview showed the root causes of work accidents are:
  • Inadequate tool maintenance management
  • Negligence during loading and unloading maintenance
  • Poor work time management
  • Lack of caution from workers
  • Lack of awareness in using PPE
  • Absence of special lanes for vehicles. loading and unloading equipment or pedestrians

3.3.5. Risk Analysis of Traffic Accidents

The accidents observed during the mobilization of loading and unloading equipment and vehicles in the container terminal area focused on non-human losses such as equipment or vehicle damages as shown in Table 10.
Table 10 shows traffic accidents were caused by four common causes and the highest with 65% was human activities such as pilotage error contributing approximately 63%, and inadequate worker supervision with an estimated 1%. This was followed by the processes associated with the environment which was found to be 19% and including the absence of signs, limited lighting, and damaged roads. Machinery, especially equipment damage. was also observed to have contributed approximately 14% while weather condition was only 1%. These are further described in Figure 6.
Based on the results of the interview conducted, the root causes of traffic accidents include:
  • Unfavorable working environment conditions such as inadequate port maintenance
  • Lack of supervision to workers on duty
  • Poor work time management
  • Inadequate safety management

3.3.6. Risk Analysis of Environmental Pollution

The major cause of environmental pollution is presented in Table 11.
The table above shows pollution was majorly caused by environmental factors with fuel spills found to have contributed 60% and load spills 40%. These are further described in Figure 7.
The interview conducted showed the root causes of environmental pollution include:
  • Negligence in maintaining cleanliness
  • Another accident
The risk assessment conducted using Fault Tree Analysis (FTA) and the interviews conducted showed the root causes of high-risk accidents are as described in Table 12. This root cause is obtained by conducting an in-depth analysis by the researcher. The root causes that can be undertaken for risk control options are only the underlying causes that can be controlled. The assessment is carried out on the six major categories of accidents and all four accidents with a high level of risk. An assessment of accidents, the level of risk confidence has been combined with an assessment into a large category of accidents.

3.4. Risk Control Option (RCO)

Fault Tree Analysis (FTA) showed the causes of basic risks to understand the preventive or mitigation measures required to reduce the possibility of safety failure. The 16 root causes discovered from this approach were applied to obtain 14 corresponding RCOs which are possible to be implemented to several potential hazards as shown in Table 13. The RCO is carried out by considering the benefits gained within a certain period. Safety of the port is not only about the affairs of the port but there are also other parties such as the stevedoring companies, subcontractors, shipping companies also port authority that are also responsible, this is in accordance with what is recommended by the International Labor Organization [39].

3.5. Benefits of the Risk Control Option

In making decisions. the analysis of the benefits is usually based on the established risk control option (RCO) and this involves emphasizing the benefits of each RCO both in the short and long term as shown in Table 14. Moreover, the following safety measures are recommended concerning the management of hazards related to working safety in PTP Container Terminal based on the FSA’s results and field observations. It is possible to implement these risk control measures in managing the terminals 2 and 3 of PTP Container Terminals known to improve work safety by the terminal and container managers. These recommendations are only applicable to workers and facilities under the auspices of Port of Tanjung Priok. However, the managers also can provide indirect control through the implementation of RCO 2, RCO 3, RCO 7, or RCO 12 on partners working with companies or other interested individuals. Of the four risk control options, based on the results of the FTA in this case study, where traffic accidents are the most potential accidents compared to other accident categories, the main recommendation is to give stern warnings to workers who do not discipline using protective personal equipment and apply the rules of reward and punishment for all workers, this is consistent with the research results suggested by several researchers because it has been proven to improve safety in container terminal operations and its contribution to the development of safety leadership [40,41].
After the risk control has been implemented, related parties intensively monitored its effectiveness in reducing the existing risks to make improvements for future applications. There are 3 possible outcomes from this monitoring and they include [42]:
  • The ability of risk control to reduce potential hazards
  • Non-implementation of risk control because it requires a large cost leading to the application of other measures
  • The inability of risk control to deal with hazards due to the non-emergence of new hazards, therefore, the existing risk management processes were re-updated.
These, however, indicate the control process is continuous and the management needs to be able to conduct regular updates either weekly, monthly, or yearly.

4. Conclusions

Risk assessment at the PTP Container Terminal has been carried out using fault tree analysis, results show the existence of interesting findings for the field of safety at the port. Traffic was the largest potential cause of an accident with a contribution of 41.88% compared to other categories. Moreover, human factors were the highest common cause of accidents at the container terminal, especially due to the negligence in operating vehicles or equipment, followed by equipment damage, Fault Tree Analysis (FTA) in combination with the results of the interview produced 16 root causes of work accidents on the study site. The risk control option (RCO) is was formulated based on the benefits gained in a certain period. It showed the safety of the port is not restricted to the activities being conducted on the site but also affects other parties such as the police, the Ministry of Transportation, and shipping companies. Furthermore, future research to enrich the results of this study is a risk assessment that includes operational risk and security risk to improve the effectiveness of ports in operating with human reliability analysis.

Author Contributions

M.A.B. conceived and designed the research structure, analyzed the data, wrote the paper; H.F. collected the data, draw the figures. All authors have read and agreed to the published version of the manuscript.

Funding

This research received no external funding.

Acknowledgments

The authors would like to express our gratitude to Port of Tanjung Priok for supporting the data as the case study. Authors also would like to thanks to Directorate Research and Development (DRPM) Universitas Indonesia in publication support by PUTI Q2 NKB-1682/UN2.RST/HKP.05.00/2020.

Conflicts of Interest

The authors declare no conflict of interest.

References

  1. Comtois, C. The integration of China’s port system into global container shipping. GeoJournal 1999, 48, 35–42. [Google Scholar] [CrossRef]
  2. Kutin, N.; Nguyen, T.T.; Vallée, T. Relative Efficiencies of ASEAN Container Ports based on Data Envelopment Analysis. Asian J. Shipp. Logist. 2017, 33, 67–77. [Google Scholar] [CrossRef]
  3. Karam, A.; Eltawil, A.B. A Lagrangian relaxation approach for the integrated quay crane and internal truck assignment in container terminals. Int. J. Logist. Syst. Manag. 2016, 24, 113–136. [Google Scholar] [CrossRef]
  4. Karam, A.; Attia, E.A. Integrating collaborative and outsourcing strategies for yard trucks assignment in ports with multiple container terminals. Int. J. Logist. Syst. Manag. 2019, 32, 372–391. [Google Scholar] [CrossRef]
  5. Budiyanto, M.A.; Nasruddin, N.; Zhafari, F. Simulation study using building-design energy analysis to estimate energy consumption of refrigerated container. Energy Procedia 2019, 156, 207–211. [Google Scholar] [CrossRef]
  6. Karam, A.; Eltawil, A.; Reinau, K.H. Energy-efficient and integrated allocation of berths, quay cranes, and internal trucks in container terminals. Sustainability 2020, 12, 3202. [Google Scholar] [CrossRef] [Green Version]
  7. Huzaifi, M.H.; Budiyanto, M.A.; Sirait, S.J. Study on the carbon emission evaluation in a container port based on energy consumption data. Evergreen 2020, 7, 97–103. [Google Scholar] [CrossRef]
  8. Budiyanto, M.A.; Shinoda, T. Energy efficiency on the reefer container storage yard; An analysis of thermal performance of installation roof shade. In Energy Reports; Elsevier Ltd.: Amsterdam, The Netherlands, 2020; Volume 6, pp. 686–692. [Google Scholar]
  9. Kwak, D.-W. Risk Management in International Container Logistics Operations: Risk Analysis and Mitigating Strategies. Ph.D. Thesis, Cardiff Business School Cardiff University, Wales, UK, 2014. [Google Scholar]
  10. Chang, C.-H.; Xu, J.; Song, D.-P. Risk analysis for container shipping: From a logistics perspective. Int. J. Logist. Manag. 2015, 26, 147–171. [Google Scholar] [CrossRef]
  11. Hong Kong Marine Department. Casualties in Cargo Handling Accidents in 2016; Hong Kong Marine Department: Hong Kong, China, 2016. [Google Scholar]
  12. Health and Safety Executive. Transportation and Storage Statistics in Great Britain, 2019; Health and Safety Executive: London, UK, 2019. [Google Scholar]
  13. Health and Safety Executive. Statistics report for the Ports Industry 2012/13p; Health and Safety Executive: London, UK, 2012; 13p. [Google Scholar]
  14. Petros L, P. Port Risk Management in Container Terminals. Transp. Res. Procedia 2017, 25, 4411–4421. [Google Scholar]
  15. National Transportation Safety Committee. Investigation of Shipping Accident Data 2010–2016; National Transportation Safety Committee: Jakarta, Indonesia, 2016. [Google Scholar]
  16. Darbra, R.-M.; Casal, J. Historical analysis of accidents in seaports. Saf. Sci. 2004, 42, 85–98. [Google Scholar] [CrossRef]
  17. Chang, C.-H.; Xu, J.; Dong, J.; Yang, Z. Selection of effective risk mitigation strategies in container shipping operations. Marit. Bus. Rev. 2019, 4, 413–431. [Google Scholar] [CrossRef]
  18. Haimes, Y.Y. On the Definition of Vulnerabilities in Measuring Risks to Infrastructures. Risk Anal. 2006, 26, 293–296. [Google Scholar] [CrossRef] [PubMed]
  19. Haimes, Y.Y. On the Complex Definition of Risk: A Systems-Based Approach. Risk Anal. 2009, 29, 1647–1654. [Google Scholar] [CrossRef] [PubMed]
  20. Chlomoudis, C.I.; Kostagiolas, P.A.; Lampridis, C.D. Quality and safety systems for the port industry: Empirical evidence for the main Greek ports. Eur. Transp. Res. Rev. 2011, 3, 85–93. [Google Scholar] [CrossRef] [Green Version]
  21. Hamka, M.A. Safety Risks Assessment on Container Terminal Using Hazard Identification and Risk Assessment and Fault Tree Analysis Methods. Procedia Eng. 2017, 194, 307–314. [Google Scholar]
  22. Di Vaio, A.; Varriale, L.; Trujillo, L. Management Control Systems in port waste management: Evidence from Italy. Util. Policy 2019, 56, 127–135. [Google Scholar] [CrossRef]
  23. Solari, G.; Repetto, M.P.; Burlando, M.; De Gaetano, P.; Pizzo, M.; Tizzi, M.; Parodi, M. The wind forecast for safety management of port areas. J. Wind Eng. Ind. Aerodyn. 2012, 104, 266–277. [Google Scholar] [CrossRef]
  24. Corrigan, S.; Kay, A.; Ryan, M.; Ward, M.E.; Brazil, B. Human factors and safety culture: Challenges and opportunities for the port environment. Saf. Sci. 2019, 119, 252–265. [Google Scholar] [CrossRef]
  25. Shang, K.-C.; Tseng, W.-J. A Risk Analysis of Stevedoring Operations in Seaport Container Terminals. J. Mar. Sci. Technol. 2010, 18, 201–210. [Google Scholar]
  26. Ding, J.-F.; Tseng, W.-J. Fuzzy risk assessment on safety operations for exclusive container terminals at Kaohsiung port in Taiwan. Proc. Inst. Mech. Eng. Part M J. Eng. Marit. Environ. 2013, 227, 208–220. [Google Scholar] [CrossRef]
  27. Alyami, H.; Lee, P.T.-W.; Yang, Z.; Riahi, R.; Bonsall, S.; Wang, J. An advanced risk analysis approach for container port safety evaluation. Marit. Policy Manag. 2014, 41, 634–650. [Google Scholar] [CrossRef]
  28. Mabrouki, C.; Bentaleb, F.; Mousrij, A. A decision support methodology for risk management within a port terminal. Saf. Sci. 2014, 63, 124–132. [Google Scholar] [CrossRef]
  29. Abdelgawad, M.; Fayek, A.R. Risk Management in the Construction Industry Using Combined Fuzzy FMEA and Fuzzy AHP. J. Constr. Eng. Manag. 2010, 136, 1028–1036. [Google Scholar] [CrossRef]
  30. Yang, Z.; Ng, A.K.Y.; Wang, J. A new risk quantification approach in port facility security assessment. Transp. Res. Part A Policy Pract. 2014, 59, 72–90. [Google Scholar] [CrossRef]
  31. Trbojevic, V.M.; Carr, B.J. Risk based methodology for safety improvements in ports. J. Hazard. Mater. 2000, 71, 467–480. [Google Scholar] [CrossRef]
  32. Bearzotti, L.; Gonzalez, R.; Miranda, P. The Event Management Problem in a Container Terminal. J. Appl. Res. Technol. 2013, 11, 95–102. [Google Scholar] [CrossRef]
  33. Yang, Y.-C. Risk management of Taiwan’s maritime supply chain security. Saf. Sci. 2011, 49, 382–393. [Google Scholar] [CrossRef]
  34. Yang, Y.-C. Impact of the container security initiative on Taiwan’s shipping industry. Marit. Policy Manag. 2010, 37, 699–722. [Google Scholar] [CrossRef]
  35. Bearzotti, L.A.; Salomone, E.; Chiotti, O.J. An autonomous multi-agent approach to supply chain event management. Int. J. Prod. Econ. 2012, 135, 468–478. [Google Scholar] [CrossRef]
  36. Chlomoudis, C.I.; Pallis, P.L.; Tzannatos, E.S. A Risk Assessment Methodology in Container Terminals: The Case Study of the Port Container Terminal of Thessalonica, Greece. J. Traffic Transp. Eng. 2016, 4, 251–258. [Google Scholar]
  37. Marhavilas, P.K.; Koulouriotis, D.; Gemeni, V. Risk analysis and assessment methodologies in the work sites: On a review, classification and comparative study of the scientific literature of the period 2000–2009. J. Loss Prev. Process Ind. 2011, 24, 477–523. [Google Scholar] [CrossRef]
  38. Kadir, Z.A.; Mohammad, R.; Othman, N. An Advanced Risk Matrix Analysis Approach for Safety Evaluation at Major Ports in Malaysia. J. Adv. Res. Bus. Manag. Stud. 2020, 18, 31–41. [Google Scholar]
  39. International Labour Organization. Safety and Health in Ports; International Labour Organization: Geneva, Switzerland, 2018. [Google Scholar]
  40. Lu, C.S.; Yang, C.S. Safety leadership and safety behavior in container terminal operations. Saf. Sci. 2010, 48, 123–134. [Google Scholar] [CrossRef]
  41. Lu, C.S.; Shang, K.C. An empirical investigation of safety climate in container terminal operators. J. Saf. Res. 2005, 36, 297–308. [Google Scholar] [CrossRef] [PubMed]
  42. Berle, Ø.; Asbjørnslett, B.E.; Rice, J.B. Formal Vulnerability Assessment of a maritime transportation system. Reliab. Eng. Syst. Saf. 2011, 96, 696–705. [Google Scholar] [CrossRef] [Green Version]
Figure 1. Accident Data in the Container Terminal During Five Years as Case Study.
Jmse 08 00466 g001
Figure 2. Fault Tree Analysis (FTA) of Fire.
Jmse 08 00466 g002
Figure 3. FTA of Loading and Unloading Accidents.
Jmse 08 00466 g003
Figure 4. FTA of Non-Loading and Unloading Accidents.
Jmse 08 00466 g004
Figure 5. FTA of Work Accident.
Jmse 08 00466 g005
Figure 6. FTA of Traffic Accident.
Jmse 08 00466 g006
Figure 7. FTA of Environmental Pollution.
Jmse 08 00466 g007
Table 1. Severity.
Table 1. Severity.
ScaleDescriptionImpact after Occurrence
1Not significantDoes not cause injury to humans, first aid in accidents
Does not affect the environment
Does Not involve losing workdays
Temporary Tool Function Loss Without Damage
2SmallCause Minor Injuries
Can Still Work on the Same Day/Shift
Equipment Needs Minor Repair
3MediumSevere injuries and being treated in the hospital
Equipment Needs Serious Repair
Missing Work for less than 3 days
4SevereCause Severe Injuries and Disabilities or 1 Death
Missing Work for 3 Days or More
Equipment Damage causing the production to stop
5Disaster/Very severeMultiple Death Victims
Missing Work Forever
Requires the Change of Equipment
Source: Author. AS/NZS 4360.
Table 2. Frequency level (Likelihood).
ScaleDescriptionQualitativeQuantitativeRisk Level
1Rarely occurringWill not occur in ProjectsOccur several times in 4 to 5 yearsNegligible
2Low possibilityHas not occurred but can appear or occurred at 1 timeOccur several times in 3 to 4 yearsAcceptable
3MaybeOccurred and may have occurred at 1 timeOccur several times in 2 to 3 yearsTolerable
4High possibilityProbably appears in the most occurring conditionsOccur several times in 1 to 2 yearsUnacceptable
5Almost certainlyOften occur or expected to appear in the most occurring conditionsOccur several times in 1 yearIntolerable
Source: Adaptation of AS/NZS 4360. OHSAS 18001: 2007. IMO. 2000. Author.
Table 3. Common causes of accidents and the percentage of their contribution.
MajorRisk FactorABCDEFSumPercentage %
HumanPilotage Error05.4030.43.9039.736.42%52.75%
Poor Supervision0100.2001.21.10%
Negligence when Working300.505.108.67.89%
Poor Tool Maintenance060.50006.55.96%
Navigation Error01.500001.51.38%
MachineryEquipment Damage4.7511.05074.5027.325.05%29.63%
Engine Damage30.500003.53.21%
Electrical Error01.500001.51.38%
EnvironmentFlood00.500000.50.46%14.86%
No Warning Signs0005.8005.85.32%
Limited Lighting00010010.92%
Damaged roads0002.4002.42.20%
Fuel Spills00000221.83%
Load Spills00000332.75%
Slippery footing00000.500.50.46%
Equipment Exposed to Water00100010.92%
NatureHot weather20000021.83%2.75%
Rain00.500.50010.92%
Remarks: A = Fire, B = Loading-Unloading Accident, C = Traffic Accident, D = Non-Loading-Unloading Accident, E = Work Accident, F = Environmental Pollution.
Table 4. Risk Assessment Results.
No.CategoryType of AccidentFSIRRisk Level
1FireLoading and Unloading Equipment Fires3412Significant Risk
2Port Operation Supporting Building Fires236Medium Risk
3Construction Project Fires155Medium Risk
4Port Support Equipment Fires212Low Risk
5Port Operating Vehicle Fires133Low Risk
6Garbage Fires224Low Risk
7Loading and Unloading AccidentsContainer Damage when Unloading, Stacking or Transferring to Truck Trailer5525High Risk
8Loading and Unloading Equipment Damage (broken, scratched, crooked, etc.)4416High Risk
9The Loading and Unloading Equipment is Uncontrolled when Lifting the Container236Medium Risk
10the hatch close fell when being moved111Low Risk
11Traffic accidentTruck Crashed into a Guardrail3412Significant Risk
12Loading and Unloading Equipment Crashing into Operational Vehicles and Port Support Facilities224Low Risk
13Operational Car or Truck Falls into the Sea133Low Risk
14Truck Crashes Loading and Unloading Equipment, Other Trucks, Operational Vehicles, Containers or Port Support Facilities4520High Risk
15Truck Crashed the Gate In/Gate Out326Low Risk
16The container is thrown when the truck is running248Medium Risk
17Damaged Scales Bridge 236Medium Risk
18Truck mired in the hole224Low Risk
19The dock is damaged when the ship is leaning144Low Risk
20Non-Loading and Unloading AccidentsContainers Received in a Damaged State144Low Risk
21Maintenance Exposed to Jack When Doing Truck Repair133Low Risk
22Work accidentWorkers are electrocuted122Low Risk
23Workers Fall from the Top of Container or the Scaffold of Ship3412Significant Risk
24Workers get run over/bang down when working4416High Risk
25EnvironmentDirty Dock or Cause Environmental Pollution from Contents of Containers4312Significant Risk
Table 5. Risk Assessment Matrix.
Severity53 147
419, 20161, 11, 238, 24
35, 13, 212, 9, 17 25
2226, 12, 1815
1104
12345
Likelihood
Table 6. Percentage of common causes of fire.
MajorRisk FactorPercentage
HumanNegligence while working21%21%
MachineryEngine Damage21%55%
Equipment Damage34%
NatureHot weather14%14%
External FactorsGet run over4%10%
Get sucked under2%
Near Electrical Installation4%
Table 7. Common causes of loading and unloading accidents.
MajorRisk FactorPercentage
HumanPilotage Error16.36%42.12%
Poor Supervision3.03%
Maintenance of Bad Tools18.18%
Navigation Error4.55%
MachineryEquipment Damage33.48%38.03%
Electrical Error4.55%
EnvironmentFlood1.52%1.52%
NatureRain1.52%1.52%
External FactorsGet run over13.64%16.82%
Struck down3.18%
Table 8. Common causes of non-loading and unloading accidents.
MajorRisk FactorPercentage
HumanNegligence while working25%
MachineryEquipment Damage25%
Environment Equipment Exposed to Water50%
Table 9. Common causes of work accidents.
MajorRisk FactorPercentage
HumanNegligence while working36.43%64.29%
Pilotage Error27.86%
MachineryEquipment Damage32.14%32.14%
EnvironmentSlippery Floor/Footing3.57%3.57%
Table 10. Common causes of traffic accidents.
MajorRisk FactorPercentage
HumanPilotage Error63.33%65.21%
Lack of worker supervision1.88%
EnvironmentNo warning signs12.08%19.17%
Limited Lighting2.08%
Damaged roads5.00%
MachineryEquipment Damage14.58%14.58%
NatureRain1.04%1.04%
Table 11. Common causes of environmental pollution.
MajorRisk FactorPercentage
EnvironmentFuel Spills40%
Load Spills60%
Table 12. Root causes of high-risk accidents.
No.Root Causes
1Negligence in conducting maintenance
2Poor tool maintenance
3Negligence of officers while working
4Poor management of operator control and supervision
5Poor supervision and control during work
6Poor management and field handling of port
7Poor safety management
8Poor work time management
9Unfavorable weather
10Miscommunication while working
11Disobedience to safety rules
12Negligence in leaving the room
13Inadequate work standards
14Failure in device transmission
15Inability to understand the capabilities of the tool
16Negligence in maintaining cleanliness
Table 13. Risk Control Options (RCO).
RCORoot CausesDescription
RCO 11, 2, 15Coordinate with related parties and equipment vendors to perform maintenance of tool and facilities in accordance with the logbook. periodically maintain equipment and require periodic equipment certification
RCO 21, 3, 5, 7, 16Conducting terminal sterilization projects with related parties. filtering of people. and vehicles at the gate and checking/inspection of containers by terminal personnel. Container checking before un-loading by making a Container Damage Report Form and evaluating repairs to container accidents
RCO 33, 5, 7, 11, 13, 16Providing strong notifications and warnings for indiscipline workers while using personal protective equipment. maintaining cleanliness. and notifying workers to be alert and obedient to signs/markers while loading and unloading or in the work environment. Applying Punish and Reward Rules to port workers and companies providing Loading and Unloading Labor Services
RCO 41, 2, 3, 4, 7, 10, 15Operators and instructors ensure the accuracy of loading and unloading installations as well as the maximization of operation assistants during loading and unloading activities. Communicating with the operator while receiving/charging activities to ensure the conduct of buildup according to the order in the vessel monitoring traffic system.
RCO 56, 13Ensure notification or repair from the technical parties to conduct repairs and elevation of the field on port or dock facilities and open storage periodically in accordance with the safety standards of containers/goods from potential damage. placing warning signs/markings. lighting or other supporting equipment needed
RCO 63, 7, 12, 13Providing direction and training for field workers to work in accordance with the provisions of the occupational safety and health principles which is coordinated by the terminal with the port service provider
RCO 73, 7, 8Adjusting the working hour’s pattern agreed by the foremen and partners in improving the welfare of workers
RCO 84, 7, 13, 15Operator training and certification to have sufficient competence such as the Operator License and inspection of the operator by the terminal officer before boarding the equipment
RCO 91, 2, 3, 4, 5, 7 Providing direction and application of the operational standard for operators to work in accordance with the provisions of the health safety principle and checking/ensuring the equipment is in good condition before conducting any activity
RCO 103, 4, 5, 7, 11, 13, 16Double supervision at certain work hours when humans have begun to experience fatigue by increasing the number of people in a post or general monitoring through surveillance cameras
RCO 116, 7, 11, 13Making supporting paths at ports for transfer of gantry cranes between blocks and for pedestrians and vehicles through the creation of separate exit and entry routes and speed limitation in the ports.
RCO 122, 3, 4, 5, 11, 12, 16Clarity of the regulations on the port such as those related to the determination of the maximum speed limit on vehicles as well as safety. maintenance. or other related matters. Complaint Post at the port
RCO 139Optimizing related parties regarding the update of weather condition at the dock or port
RCO 142, 14, 15Installation of load cell devices in loading and unloading equipment to measure container weight
Note: RCO = Risk Control Option.
Table 14. Benefits of the Risk Control Option (RCO).
RCOShort-Term BenefitsLong-Term Benefits
RCO 1Reducing unit downtime to increase unit work effectiveness and targetsAssists the anticipation of greater damage to ensure optimal income due to proper reduction in the expenses on the care and maintenance of this equipment.
RCO 2Improving supervision and inspection of security at terminals as well as the damage of containers, vehicles, and others. Providing a history of damage and avoiding undue compensation from the port or service.Avoiding additional costs such as trucking, lift on, and lift-off (Lo-Lo) fees. Survey and inspection of the container’s feasibility before entering in order to repair and make the terminal safe, peaceful, orderly. and provide security and comfort for users.
RCO 3, RCO 6Workers know the basics of safety at the terminal and at least are more alert in dealing with some emergency conditions at the terminal. Service providers also actively implement safety for their workersThe level of worker’s awareness of safety increases all the time and is conveyed and applied to workers
RCO 4Avoiding work accidents caused by miscommunication and misunderstanding while workingMaintaining a harmonious and synergic relationship between the operator and instructor in order to avoid work negligence, improve performance, and foster a good working atmosphere
RCO 5Increasing the rejuvenation of port facilities to improve safety potential and reduce container damage while on the fieldIncreasing the motion of trust of service providers towards port operators
RCO 7Improving the worker’s performance and welfareGood cooperation and coordination in order to improve the quality, safety, and welfare of several parties
RCO 8Operators are more expert and skilled in conducting their duties as well as in making decisions in case of an emergencyCoupled with a lot of experience. operators act faster and more precisely, work more professionally and provide better service
RCO 9Reducing mistakes or negligence of operators in completing work and understanding the basics of safetyThe awareness level of workers to safety is increasing at any time. and the works are done neatly, orderly, and systematically
RCO 10Monitoring workers to reduce negligence while working and improve the safety of workersContinuous increase in the discipline and professionalism of port management.
RCO 11Reducing the hazard of workers being run over while working thereby increasing safety at the portImproving port performance. especially the safety support facilities
RCO 12Providing clarity for workers to be safer and more comfortable while workingIncreasing the motion of confidence for workers and service providers towards port operators
RCO 13Minimizing the occurrence of hazards associated with natural conditions such as rain, storm, and windGood cooperation and coordination in order to improve the quality, safety, and welfare of several parties
RCO 14Operators can understand the capability of the equipment to lift containers in order to avoid overloadAssists the anticipation of greater damage to ensure optimal income due to proper reduction in the expenses on the care and maintenance of this equipment.

