1. Introduction
Wind energy is one of the most promising renewable sources of the last decade. The ample availability, large market potential, and cost competitiveness of the wind resource have allowed consistent technological development, in order to exploit its energy potential. Together with solar photovoltaics, wind is the protagonist in replacing traditional energy sources such as gas, oil, and coal, in order to reduce polluting and greenhouse gas emissions, based on the provisions of the 2015 Paris Agreement. The European Union has been an early mover on renewable energy and is committed to becoming the global leader in renewables. With almost 417 TWh of energy generated in 2019, wind energy made it possible to meet 15% of European electrical energy needs [
1]. All this is part of the European Union’s ambitious project, called the
Green New Deal, which by supporting the transition to the intensive use of renewable sources, utilizes the process of decarbonization and the elimination of greenhouse gas emissions by 2050 in Europe.
Alongside onshore wind, which has experienced rapid development in recent years, a great interest in offshore wind has been born. It is a technology that allows the installation of turbines directly in the open sea, fixed on the seabed, or floating, which therefore allows exploiting higher wind availability and potential. The offshore wind industry was launched in 1991 with the construction of the first offshore wind farm off the coast of Denmark with 11 turbines of 450 kw. The industry has continued to build on this technology which has naturally led to Europe being the leader in offshore wind power. Offshore wind has a growth rate of over 30%, with a growth rate second only to solar photovoltaics, according to the Offshore Wind Outlook [
2]. In 2019, 3.6 GW of offshore wind power was installed in Europe, confirming a trend of continuous growth and reaching an installed power of over 22 GW [
3]. The countries that have invested most are the United Kingdom, Germany, Denmark, and Belgium.
The European Commission claims that Europe needs between 230 and 450 GW of offshore wind by 2050, making it a crucial pillar in the energy mix together with onshore wind. Four-hundred-and-fifty gigawatts would meet 30% of Europe’s electricity demand in 2050, which would have grown 50% compared to 2015 [
4].
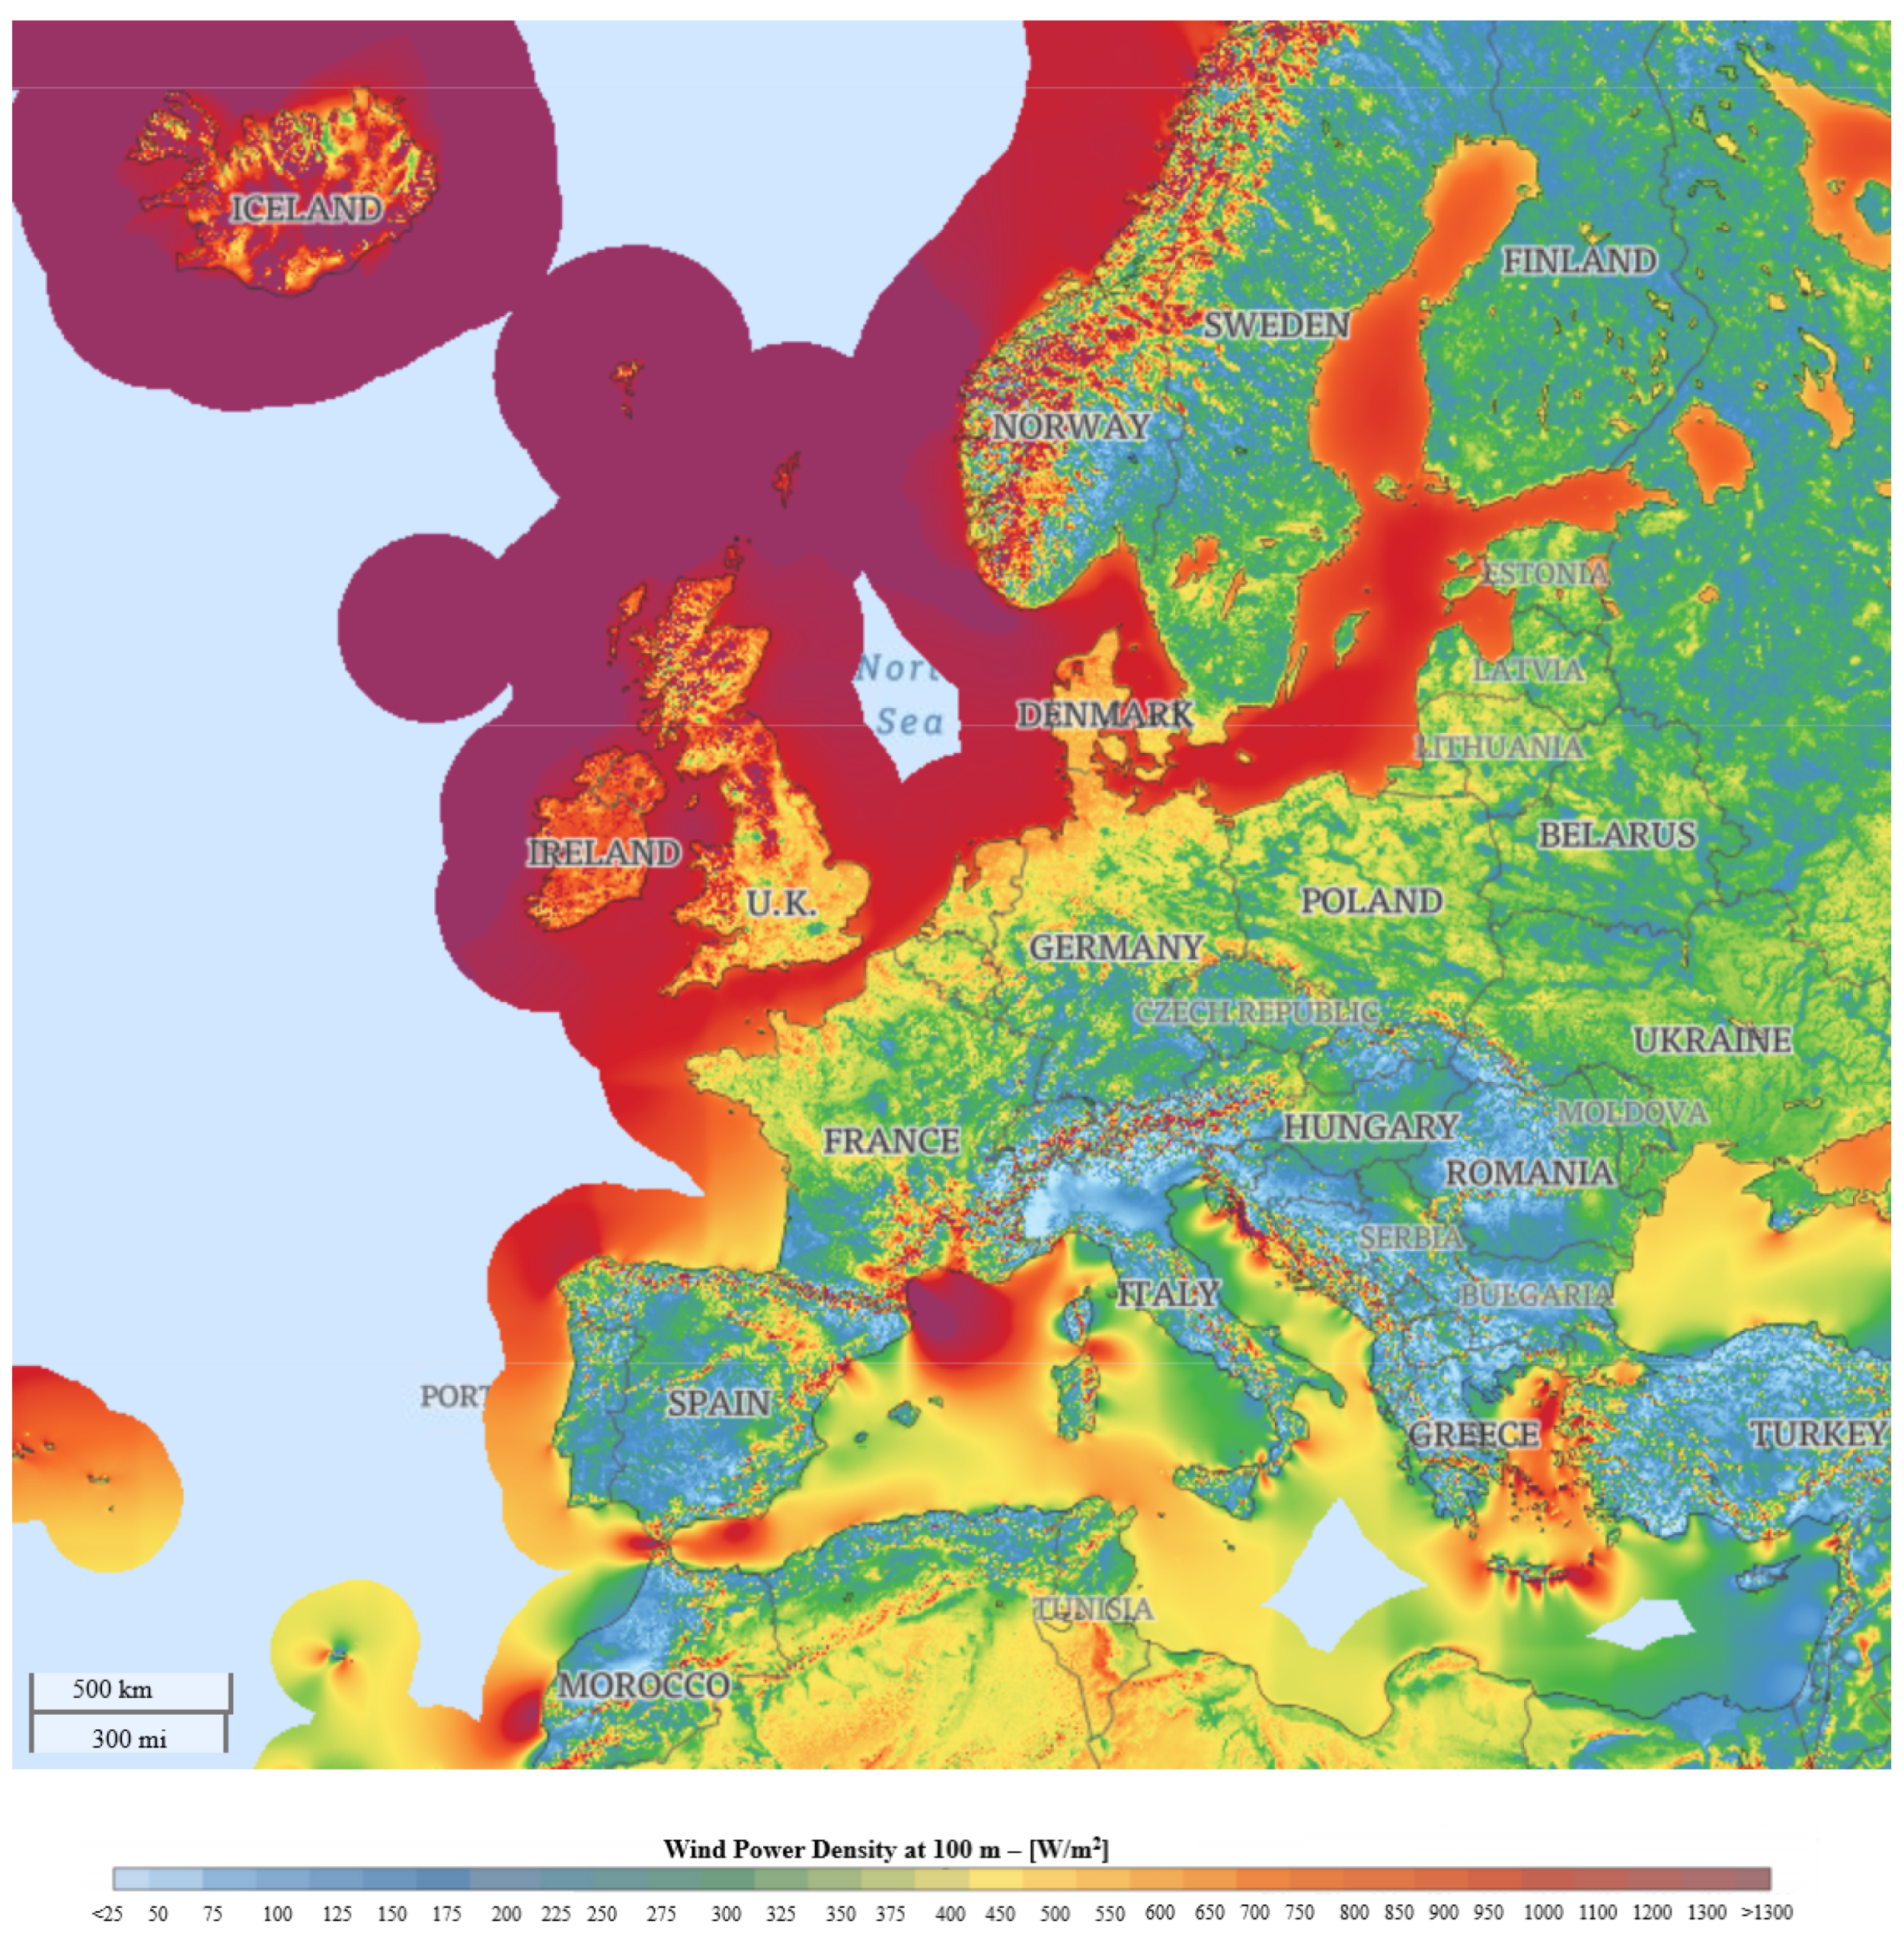
Currently, 90% of global installed offshore wind capacity is commissioned and operated in the North Sea and nearby Atlantic Ocean [
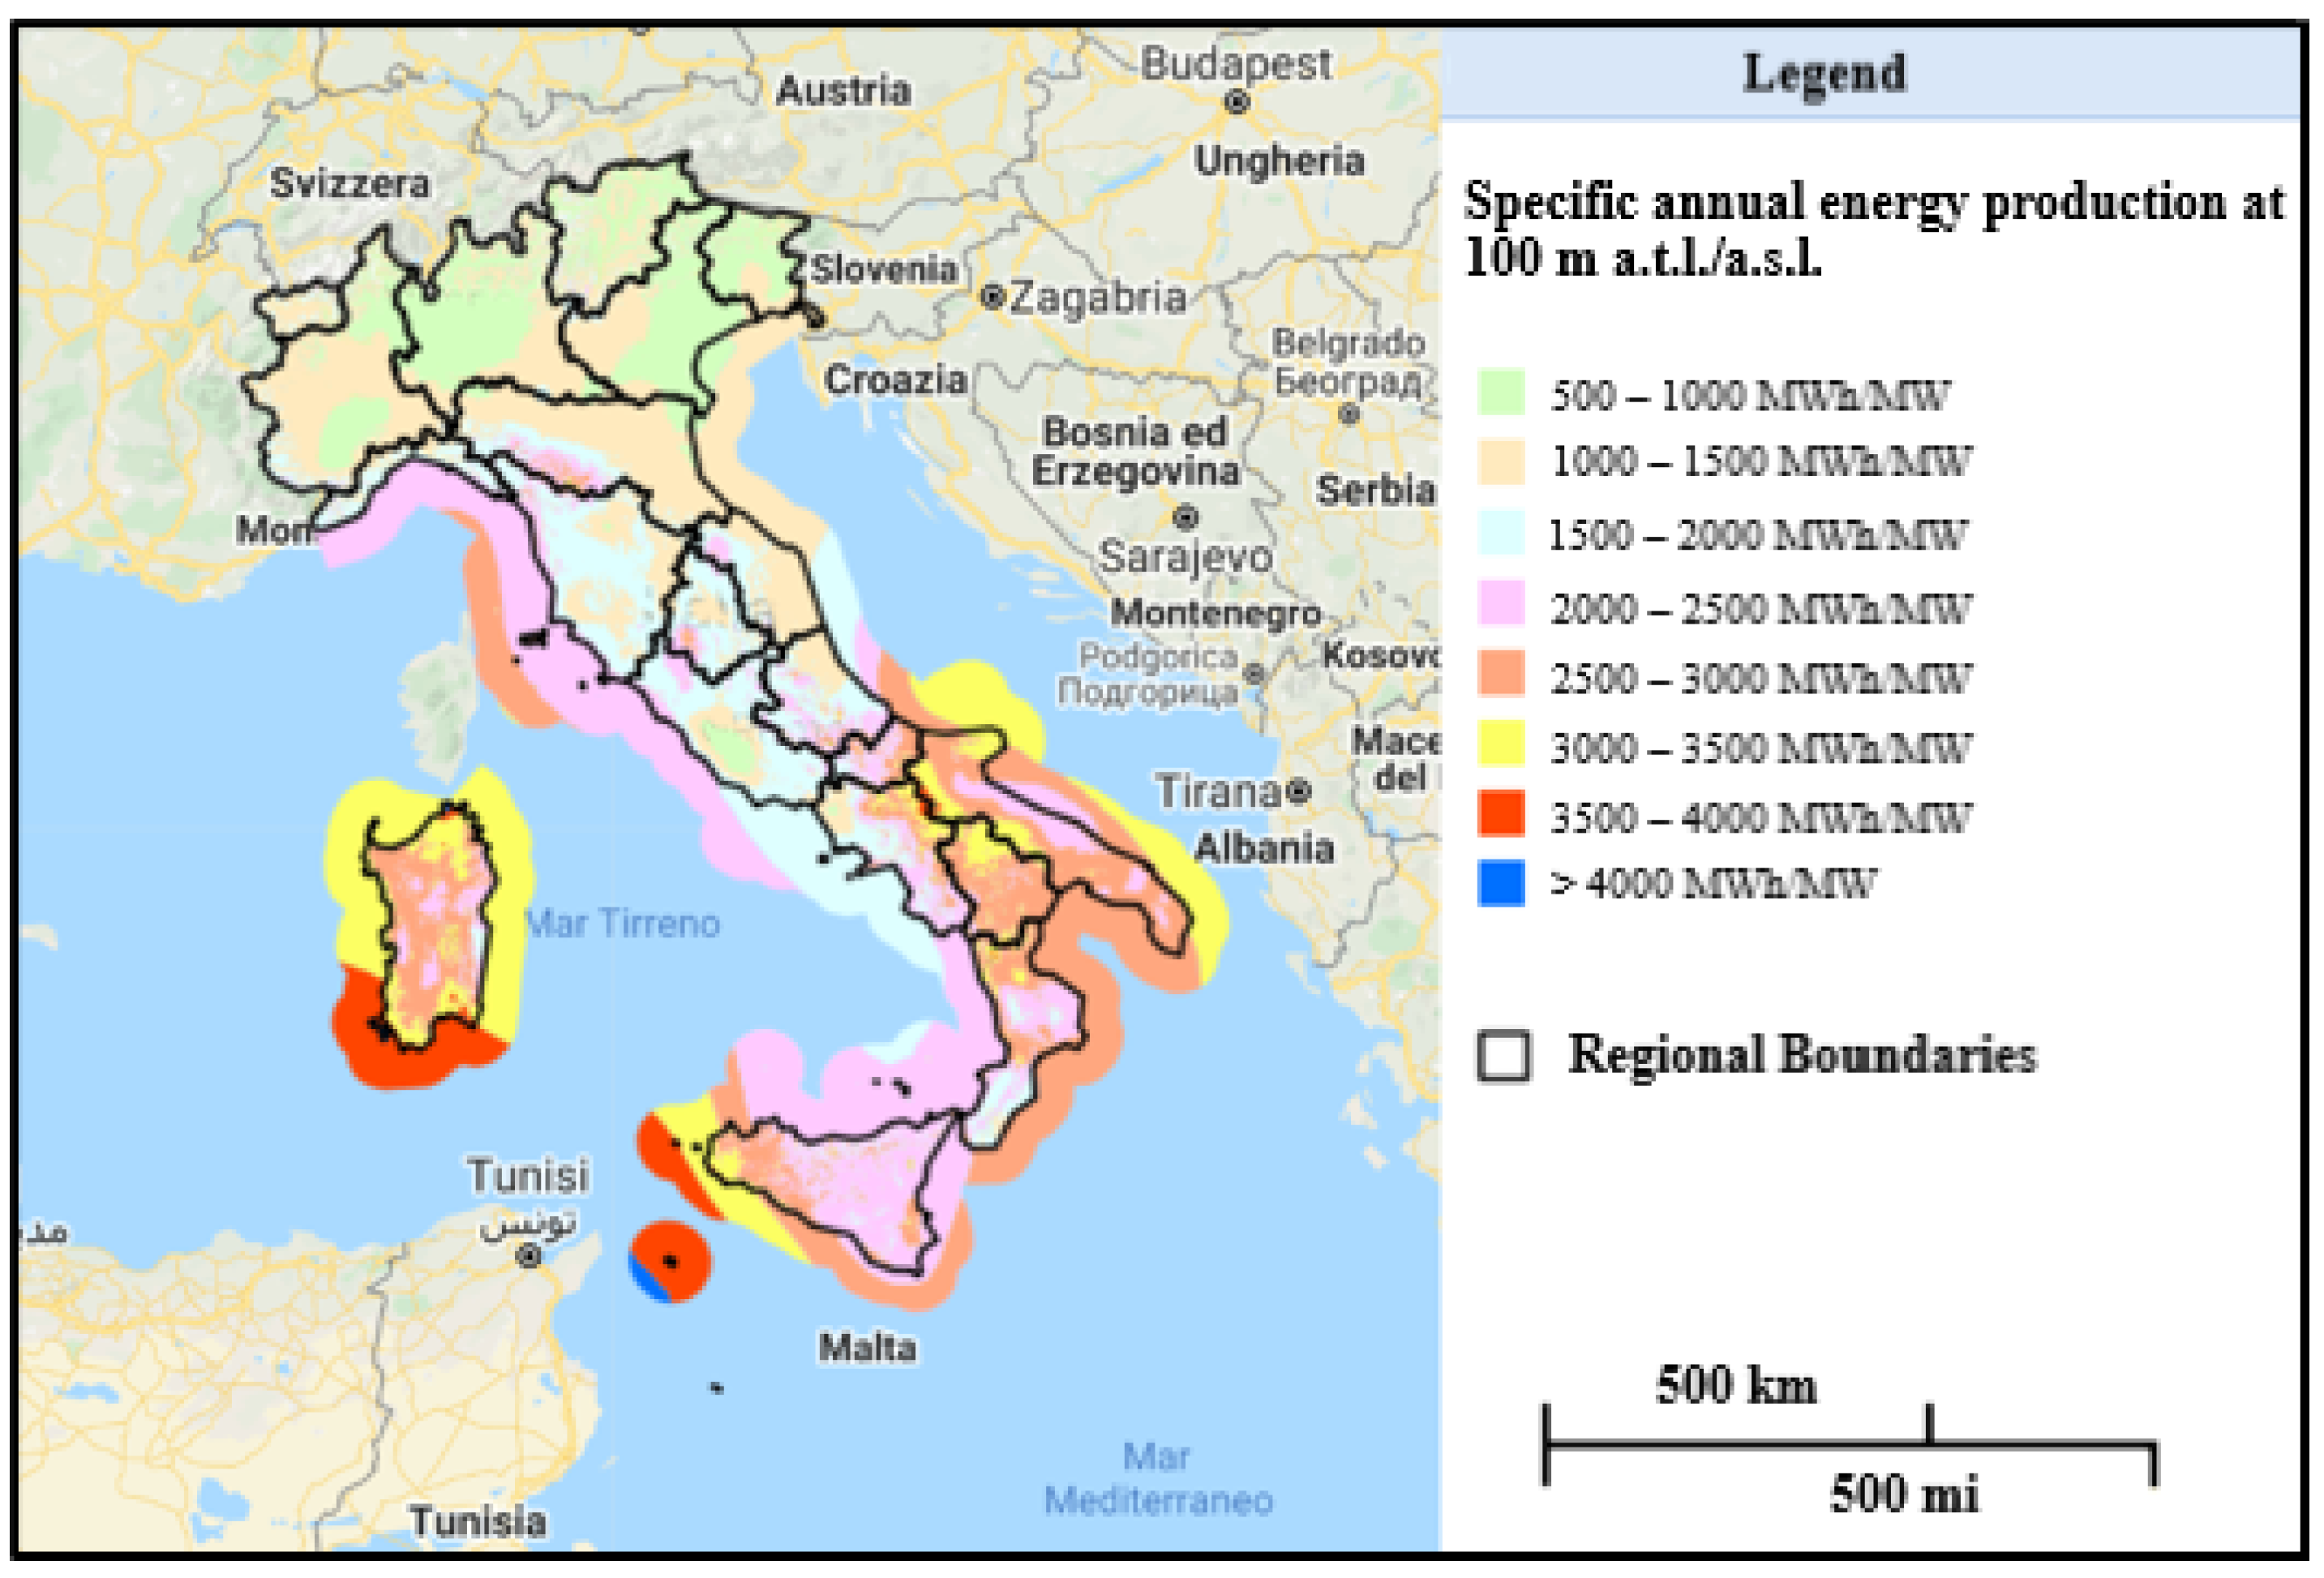
5]. As visible from the wind atlas in
Figure 1, the highest specific producibility is found in northern Europe, near the North Sea and the Baltic Sea. In fact, currently almost all of the wind farms are located there, and they are mostly fixed structures, as there are shallow seas. However, much of this potential is not exploited; moreover, in the Mediterranean Sea there is a good productivity, in particular along the Sicilian Channel and in the south of France [
6]. In this case, however, as the depth of the sea can exceed 100 m, it is necessary to resort to floating structures.
In particular, floating offshore wind platforms are the most encouraging among offshore structures, thanks to the numerous benefits they bring. In the first place they make possible to exploit large stretches of sea that are more than 60 m deep. Second, they ease turbine set-up, even for mid-depth conditions (30–50 m) and may in time offer a lower cost alternative to fixed foundations. In addition, floating foundations generally offer environmental benefits compared with fixed-bottom designs due to less invasive activity on the seabed during installation [
5].
The construction of offshore wind farms requires considerably higher investments than onshore ones: the most significant cost items concern the construction of the platform and the turbine, and the subsequent installation, which often requires the use of large laying vessels, the laying of anchors and moorings, and the laying of electrical cables and electrical substations. Furthermore, even the control and maintenance interventions are more frequent, as it operates in a hostile marine environment. Consequently, offshore wind energy is currently more expensive than other forms of energy.
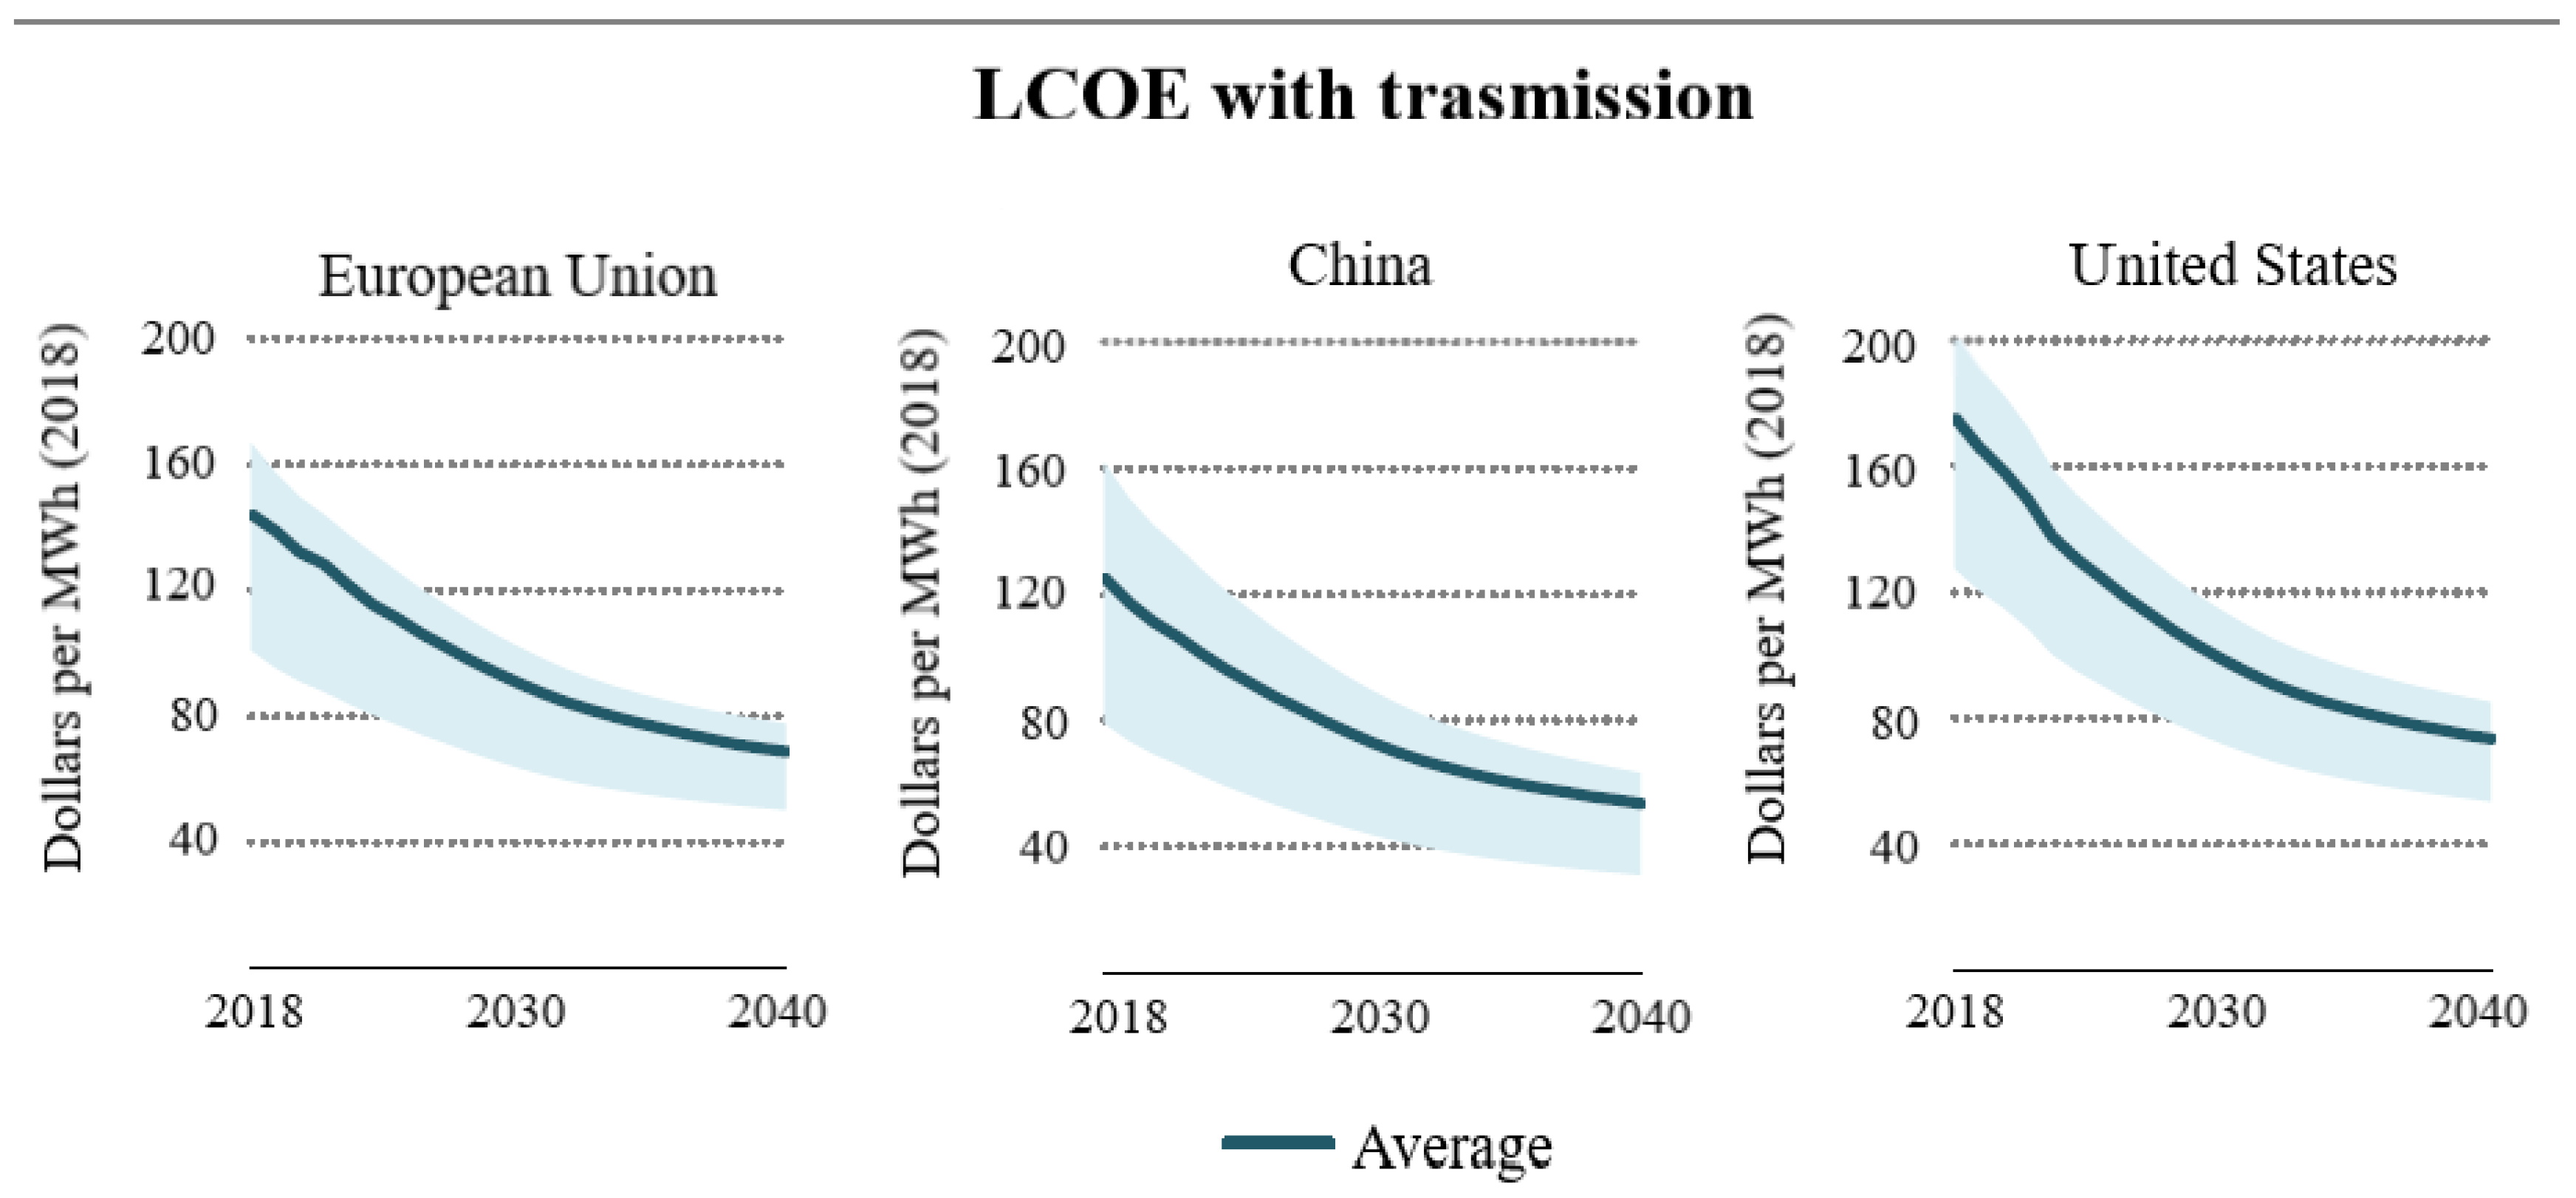
In 2018, the offshore wind outlook estimated a global Levelized Cost Of Energy (LCOE) of
$140/MWh, much higher than that estimated for onshore wind, of about
$60/MWh [
2]. However, the trend foresees a decrease in the coming years, as visible in
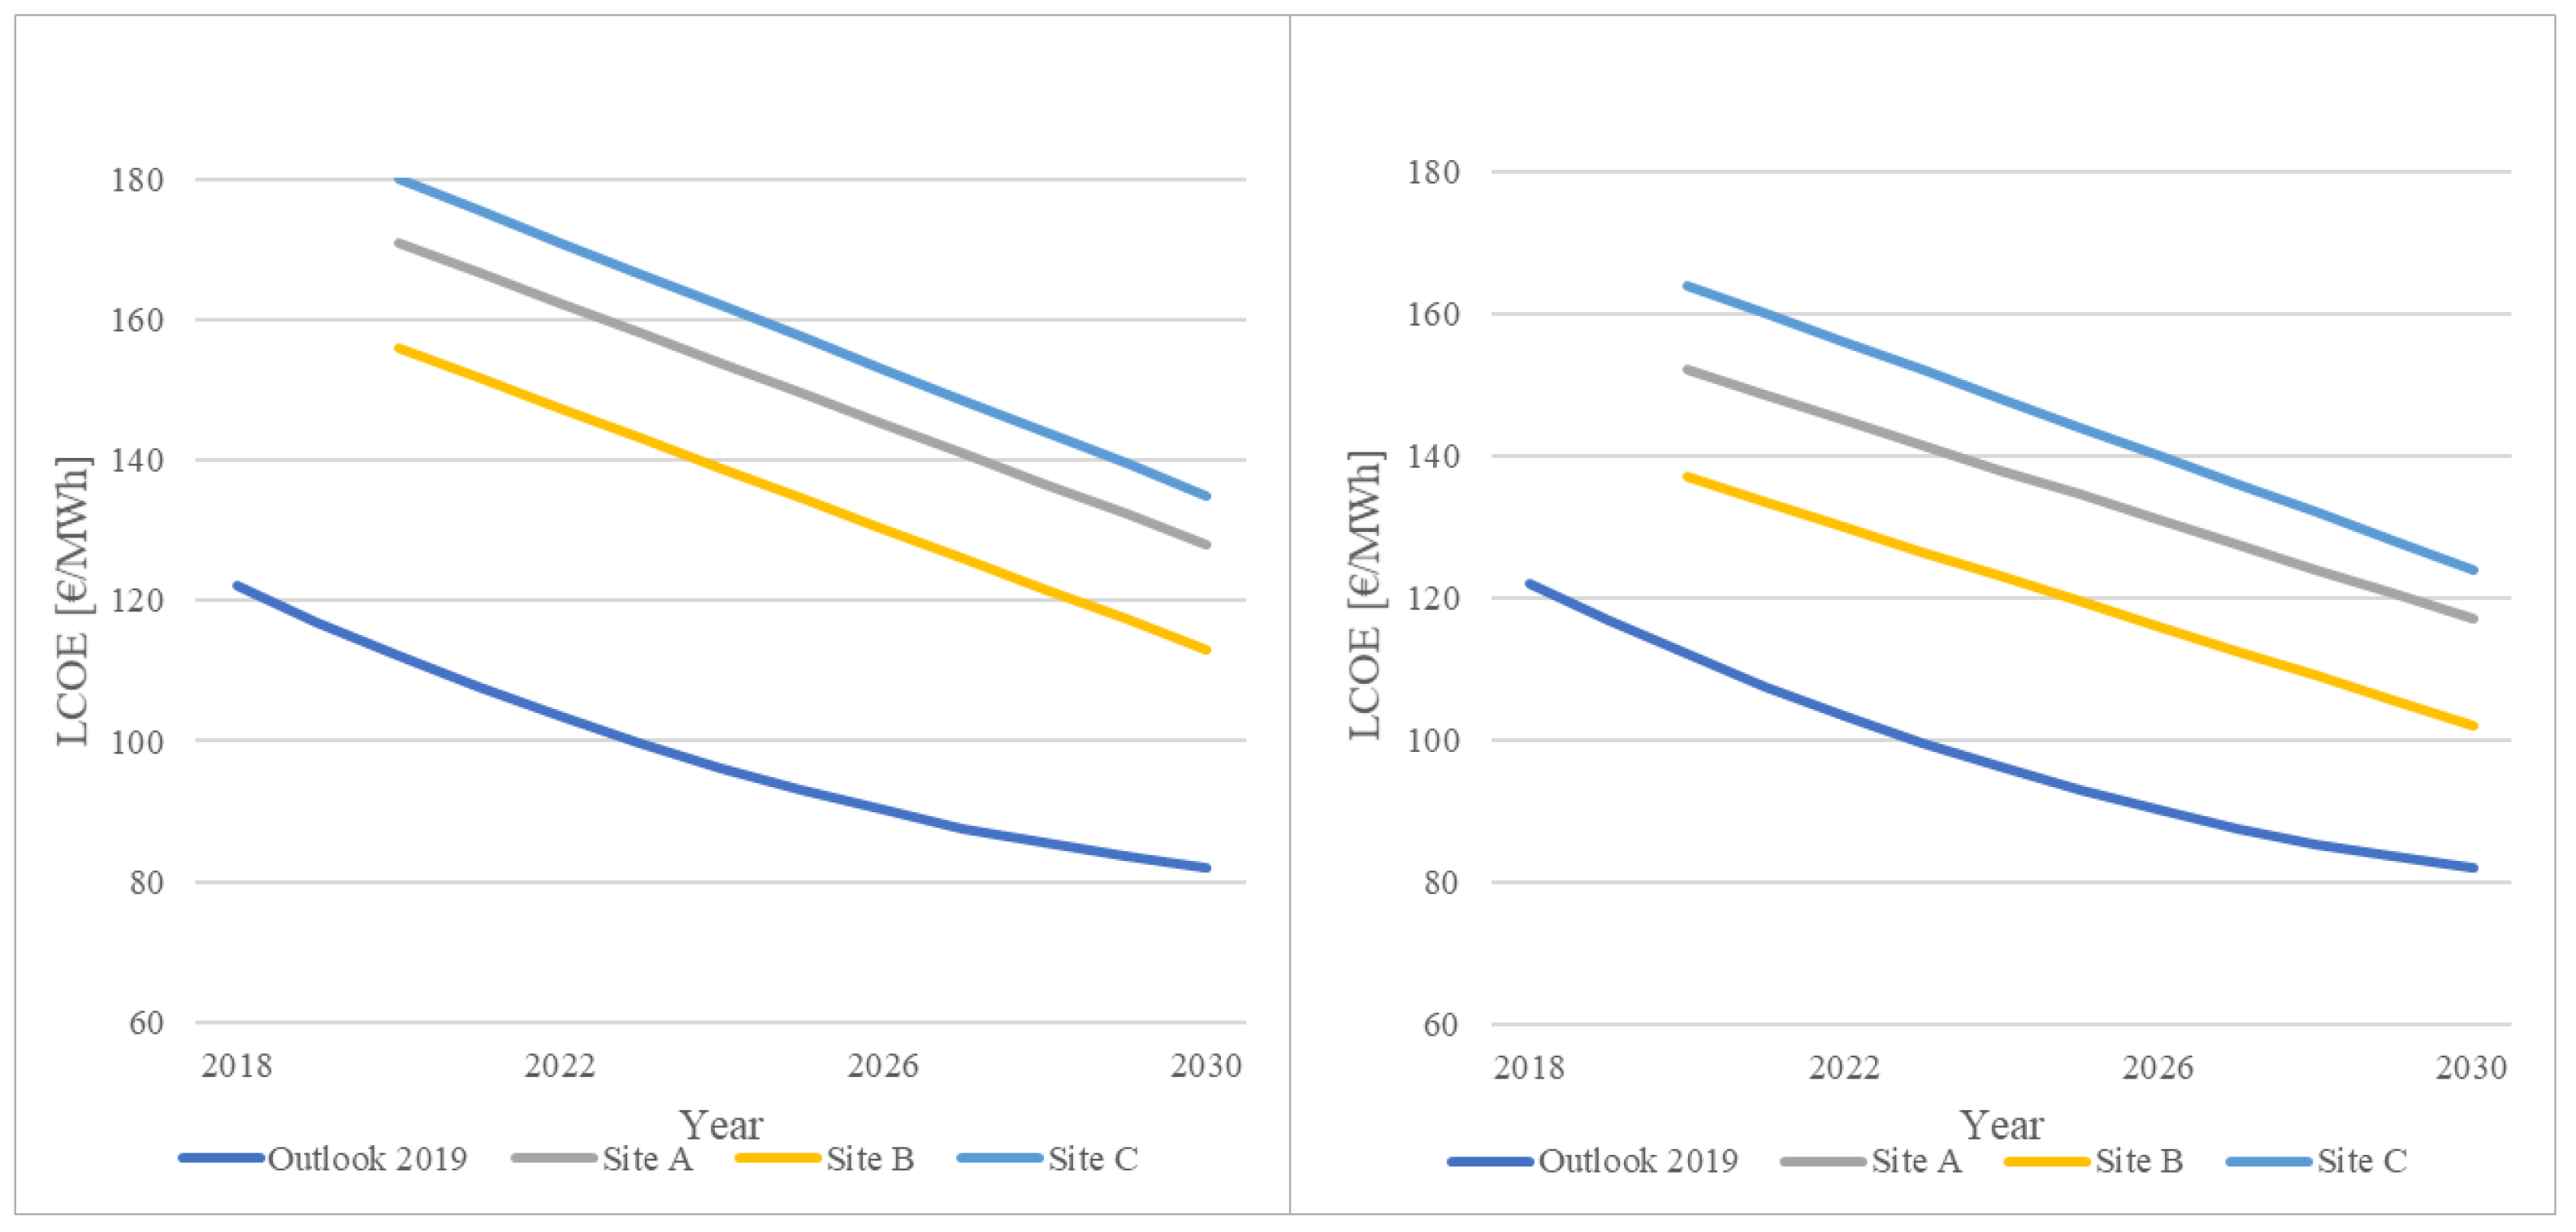
Figure 2: in part this is due to continued improvements in manufacturing and turbine design, as well as improved capacity factors. In fact, the growth in turbine size helps to increase wind farm output: larger turbines with greater swept areas yield higher capacity factors for the same resource quality. Moreover, a decrease in financial costs related to investments, as project risk has declined, as well as in operation and maintenance costs has driven down the costs of wind power to reach a LCOE of around
$60/MWh in 2040 and confirmed offshore wind as a key driver of the clean energy transition [
2]. As regards floating offshore wind, the LCOE is actually greater, as a FOWT is more complex than a fixed system and more components are required. In [
7], LCOE has been estimated for a wind farm on the basis of different concepts: in the case of Hywind’s spar buoy the average LCOE is equal to €164.6/MWh, varying between €243.4/MWh and €109.3/MWh, respectively, for best- and worst-case scenarios, while for Windfloat’s semi-submersible is equal to €189.2/MWh, varying between €287.8/MWh and €120.5/MWh.
In the last decade, some wind farms have been built and many projects are in progress. Hywind Scotland was the first pre-commercial wind farm built in the world: it consists of five spar-buoy structures supporting 6 MW wind turbines, for a total installed power of 30 MW [
8]. Based on this success, Equinor has developed a new project, Hywind Tampen. The floating wind farm will consist of 11 wind turbines, for a total installed power of 88 MW, and will provide electricity for the Snorre and Gullfaks offshore field operations in the Norwegian North Sea. In the Atlantic Ocean, along the coast of Portugal, there is WindFloat Atlantic wind farm: developed by Principle Power, it includes three turbines installed on floating semi-sub foundations, with a total installed capacity of 25 MW [
9]. As for the Mediterranean Sea, France is the country that has invested the most in offshore wind. Based on the results obtained from the Floatgen Demonstrator [
10], France’s first offshore wind turbine installed in October 2018, the pre-commercial Eolmed Project will provide the development and construction of a 30 MW offshore wind farm with three wind turbines, 15 km off the coastal town of Gruissan [
11]. Not far away, in the Gulf of Lyon, a 30 MW wind farm is expected to be installed by 2022, consisting of three semi-submersible platforms supporting 10 MW wind turbines [
12]. The project is led by Engie and EDP Renewables. Furthermore, the Provence Grand Large project is a pilot farm near Marseille, scheduled for 2021: it will consist of three wind turbines supported by semi-submersible structures for a cumulative power of 25 MW [
13].
State of Wind Power in Italy
Today, in Italy, about 10.7 GW of onshore wind power is installed, mainly in the southern regions such as Puglia, Campania, and Basilicata, in addition to the islands such as Sardinia and Sicily, while there is no offshore installation. In 2019 the PNIEC, Integrated National Energy and Climate Plan had defined the ambitious goal of 300 MW of installed offshore wind power by 2025, to then triple in 2030 [
14]. Currently, the state-of-the-art is far from these objectives as there are officially no offshore wind farms. The project, which is in the most advanced state, that is the only one currently under construction, involves the construction of ten 3 MW turbines off the port of Taranto [
15]. The wind farm will be made of bottom-fixed structures, since water depths varies between 3 and 18 m.
The first floating wind farm project involves the construction of a 250 MW wind farm, consisting of 25 turbines of 10 MW each, in the Sicilian channel, off the coast of Marsala, in one of the windiest areas of Italy [
16]. The wind farm will not be visible from the Sicilian coast as it will be installed in the direction of Tunisia 40 km from the coast, in order to reduce the environmental impact and visual pollution. Another project instead involves the construction of a 504 MW wind farm, consisting of 42 turbines of 12 MW each, in the southwestern part of Sardinia, 35 chilometers from Portoscuso, in the province of Carbonia-Iglesias [
17]. The project is currently undergoing administrative verification by the Italian Ministry of the Environment. Finally, a project involves the construction of a wind farm off the coast of Rimini. These are 59 fixed bottom structures, which will support 5.6 MW turbines, for a total of approximately 300 MW of installed power.
Despite the high offshore potential available in Italy, there are several obstacles in the spread of offshore wind: first of all the need for large capital investments, given the high costs of construction and maintenance of the wind farms; second, the time required to obtain the authorizations, which often require a very long time for approval. Furthermore, as the largest specialized companies in the sector are foreign, a major obstacle is the lack of a local supply chain capable of supporting the construction and development of new wind farms.
The scope of this work is to investigate different floating platform concepts, in order to define a new design that satisfy constraints imposed by actual Standards, to optimize main dimensions and to reduce material costs. The aim is to define and study an Italian offshore wind farm, in order to evaluate the feasibility of the project and the main economic parameters, like the LCOE.
2. Approach
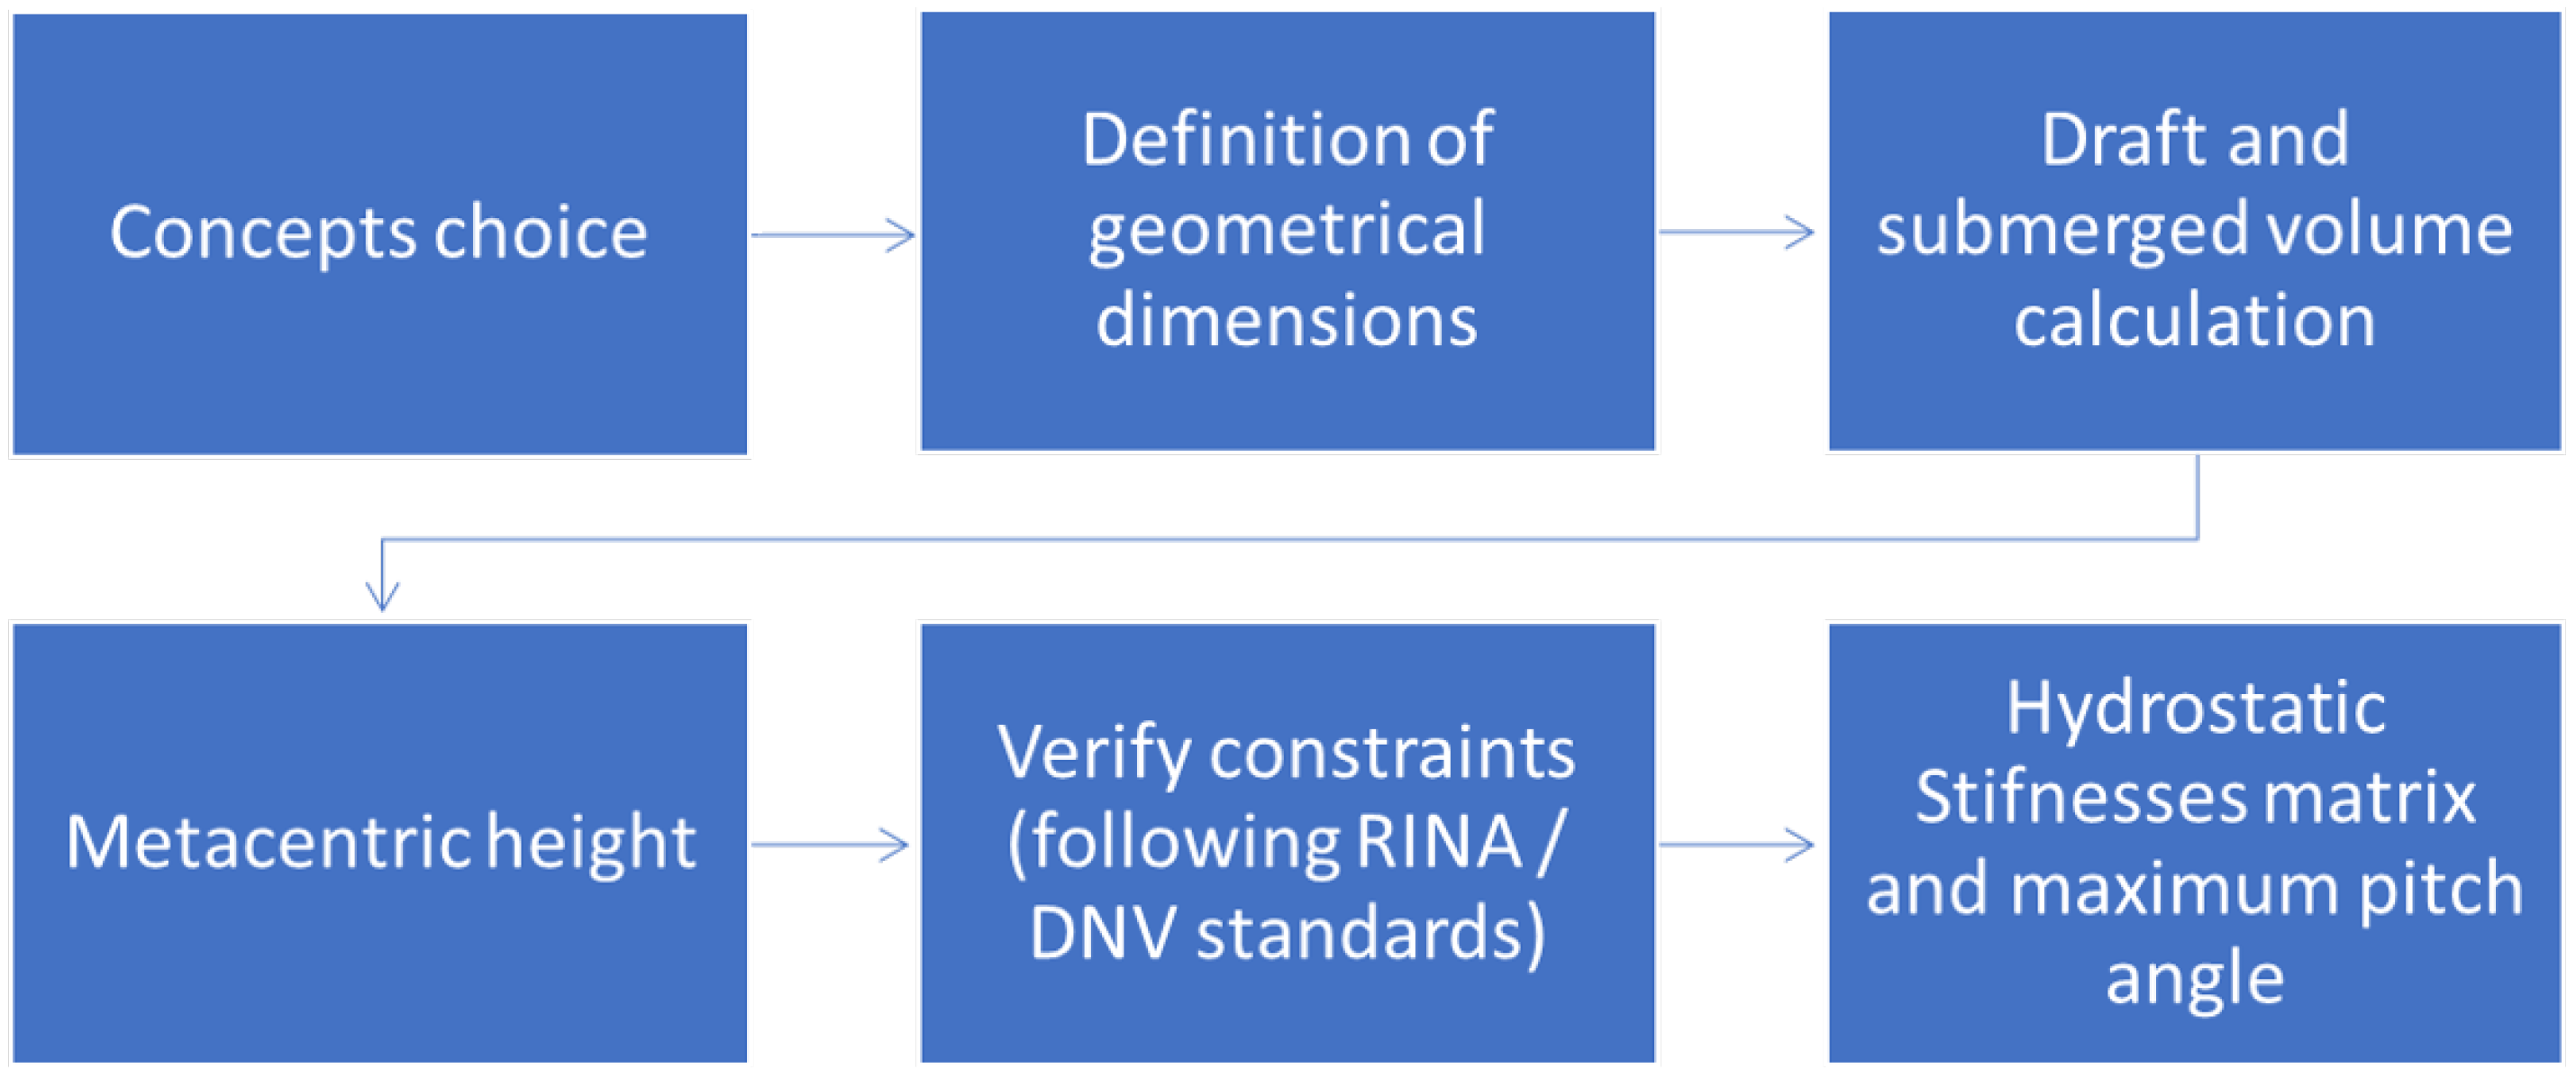
This work is based on the use of an in-house hydrostatic tool that, after the definition of five different floating substructures, permits to calculate main hydrostatic parameters, in order to allow a quick verification of the platform static stability. The working principle is reported in
Figure 3.
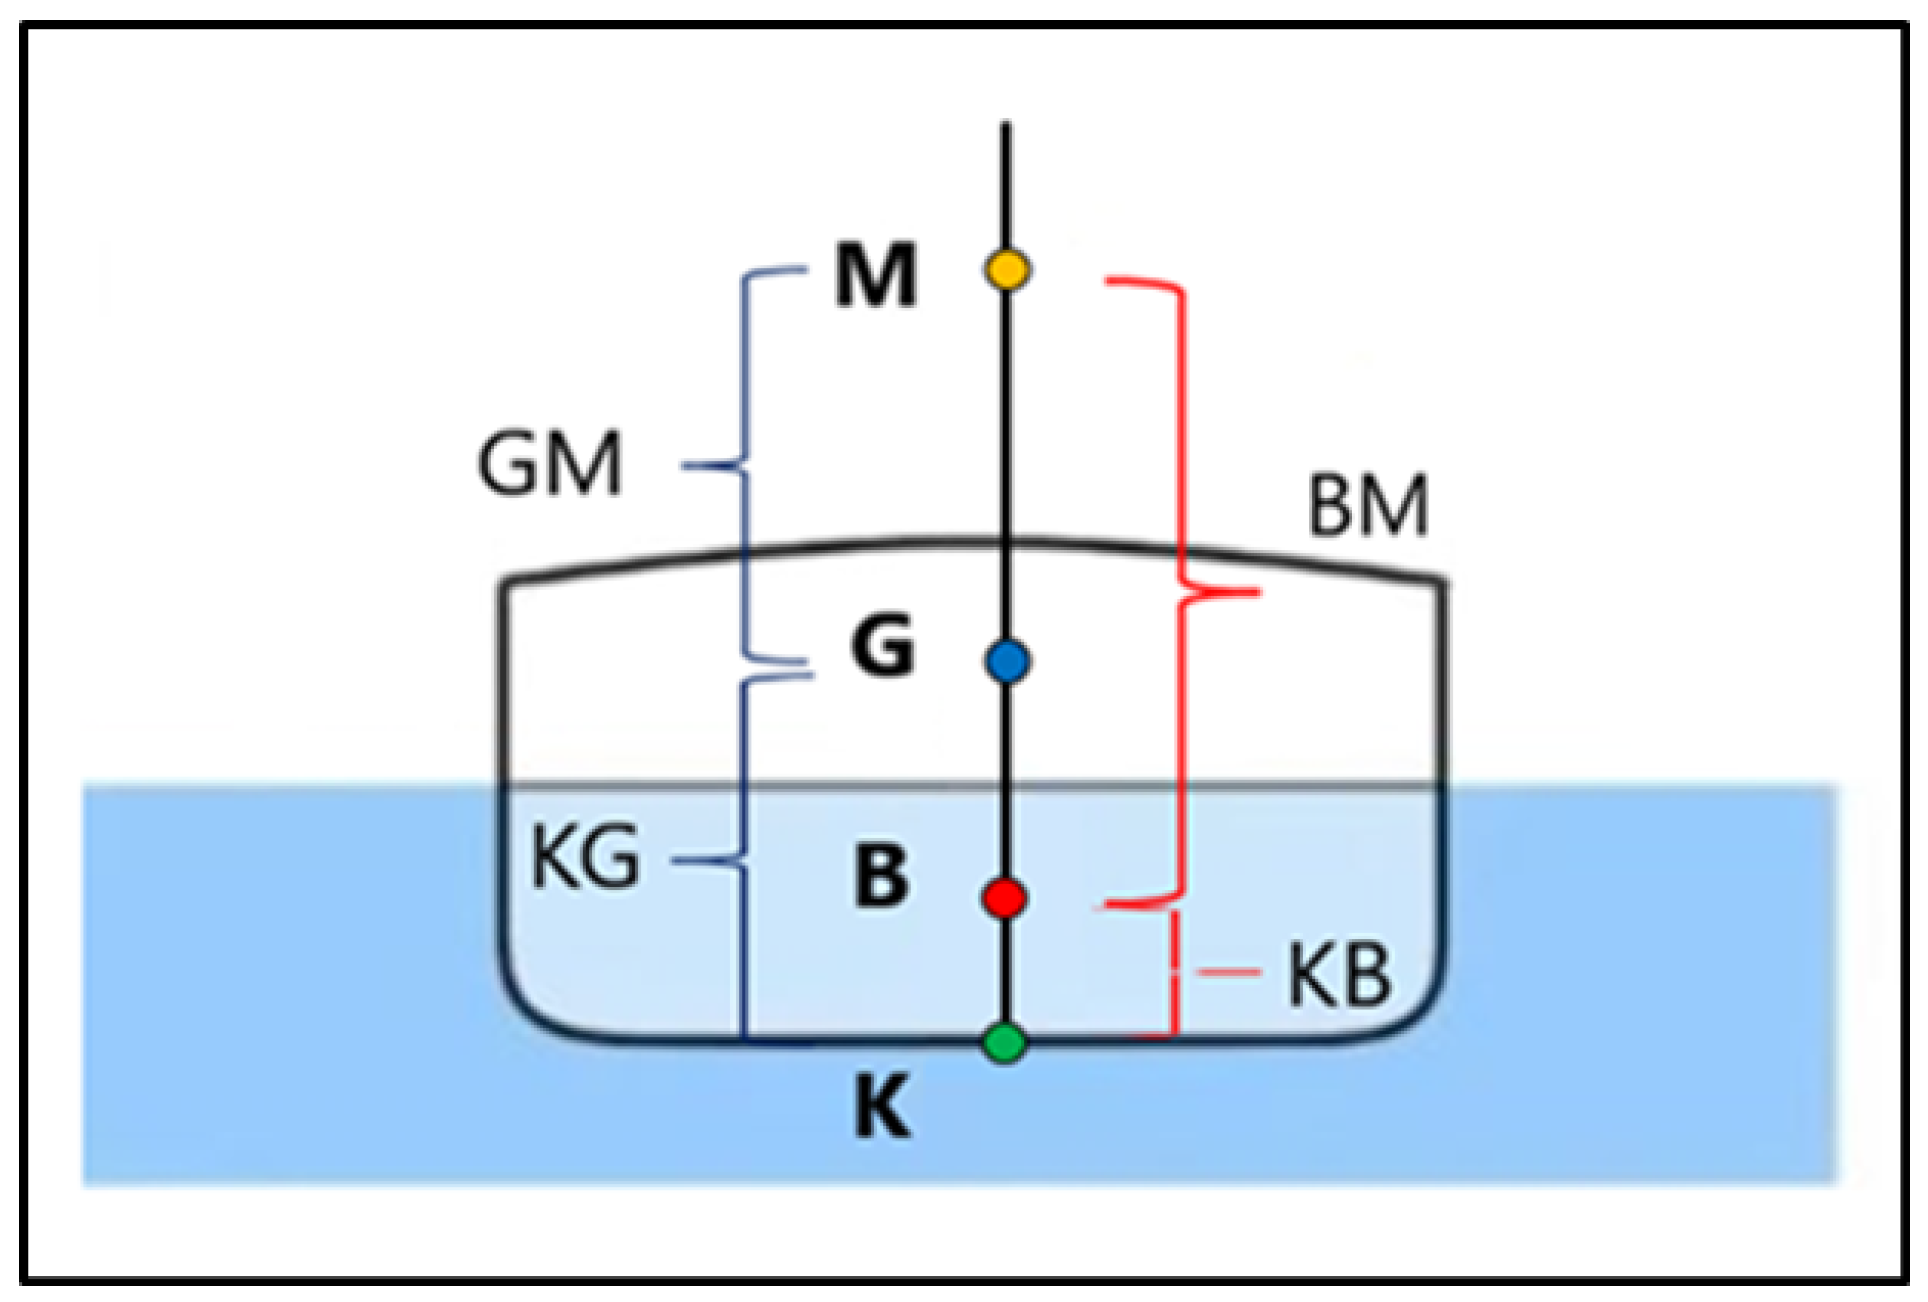
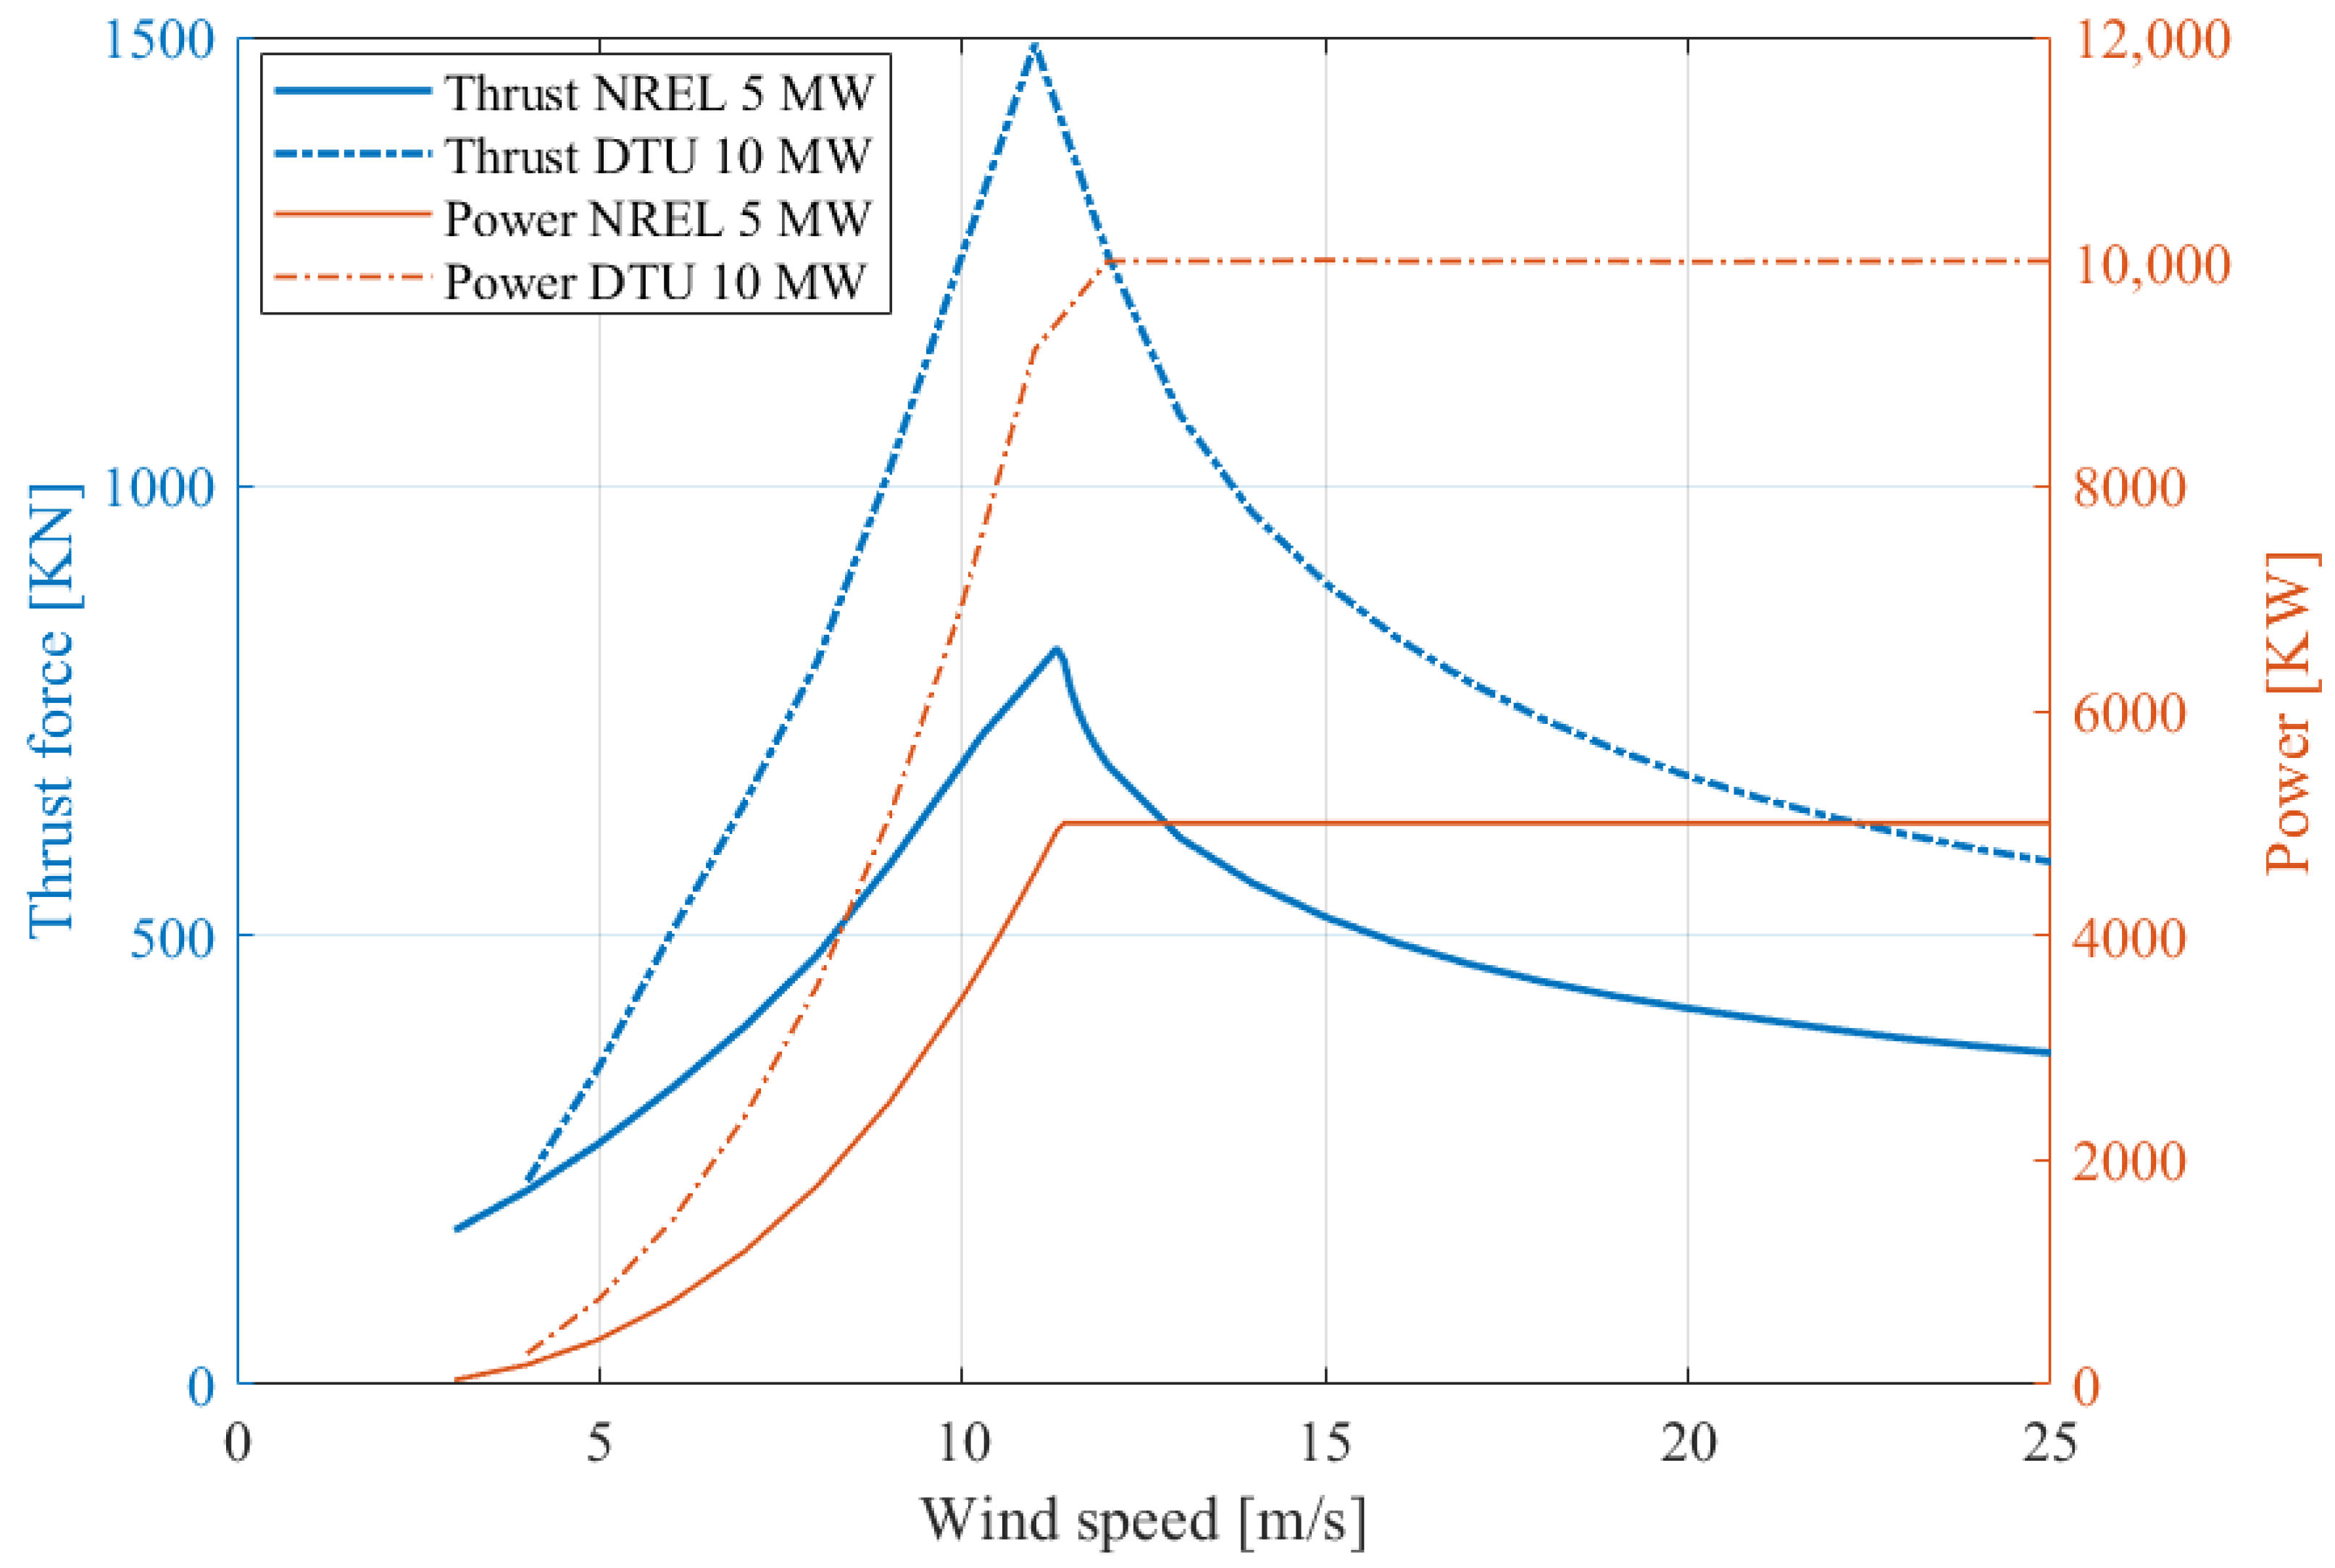
For each platform concept that has been defined by recurring to commercial project data or literature documents, the tool allows calculating weights and volumes. By the application of Archimedes’ principle, it is possible to determine the submerged volume and draught. Then, after choosing the typology of the turbine, NREL 5 MW or DTU 10 MW, the program estimates the coordinates of the center of gravity (COG) and the center of buoyancy (COB).
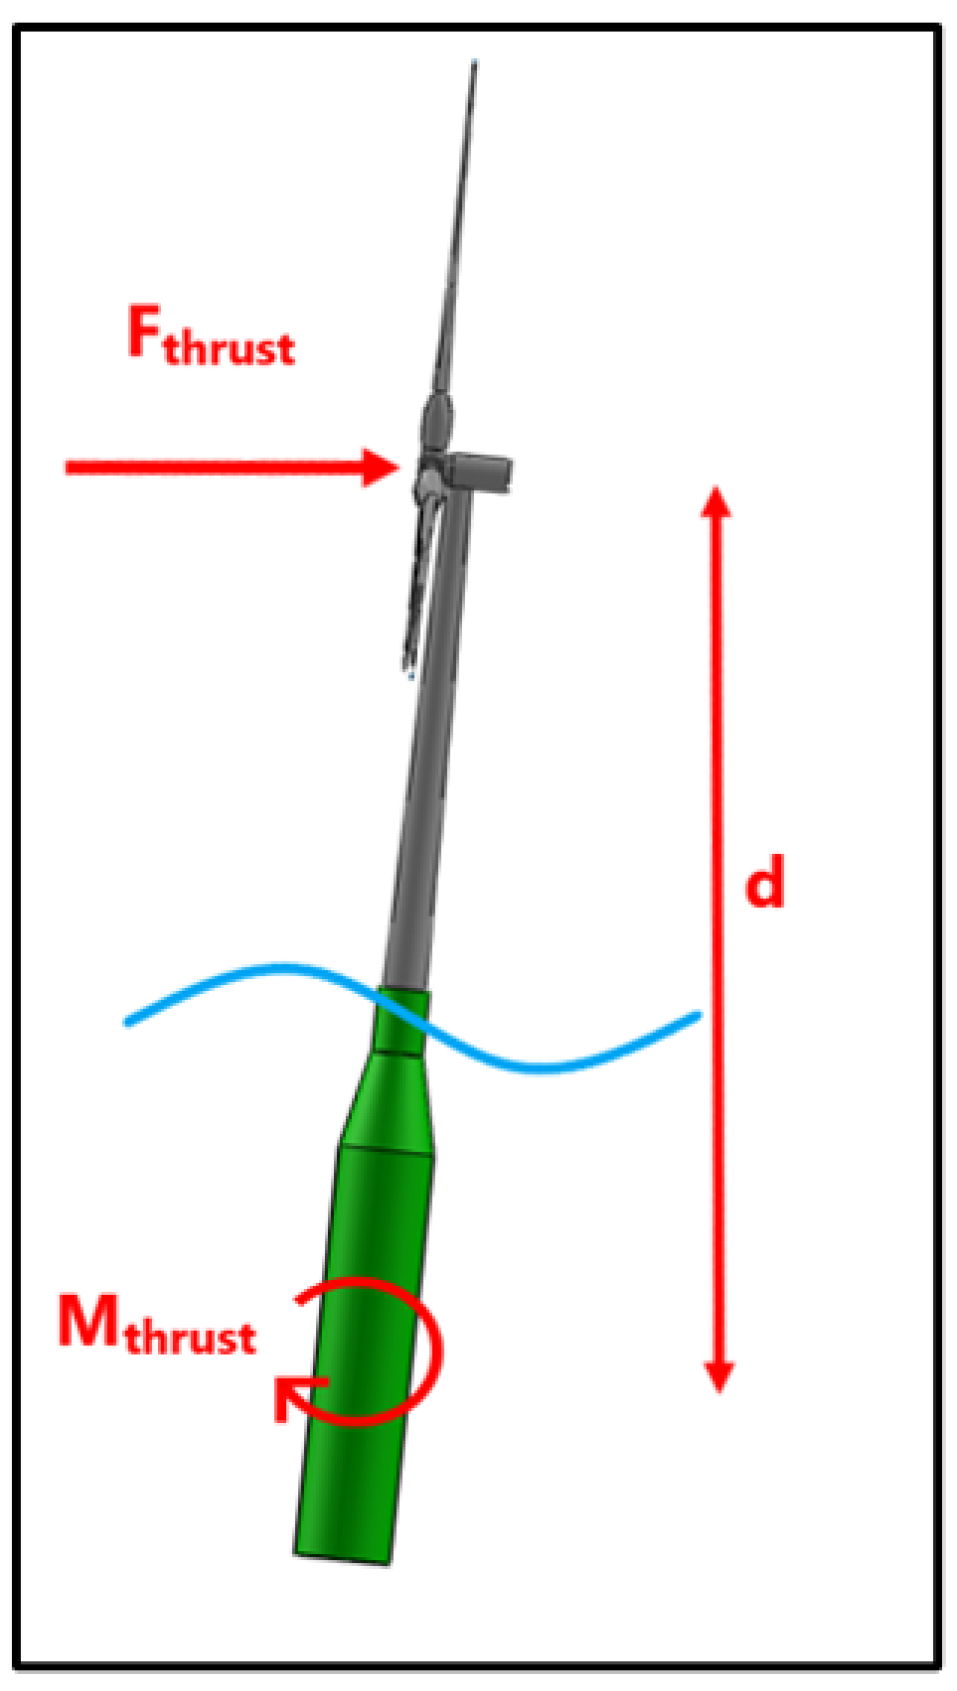
The first hydrostatic parameter of great relevance is the metacentric height: if it is greater than zero the system could be considered stable; otherwise, it is unstable, and the geometry and weight distribution must be modified. Then, the tool allows calculating the hydrostatic stiffness in heave, roll, and pitch, and, by the application of a generic thrust force that acts on the center of the rotor, the maximum inclination angle in pitch. In order to verify the validity of the program, the obtained results were compared with those obtained by Ansys Aqwa.
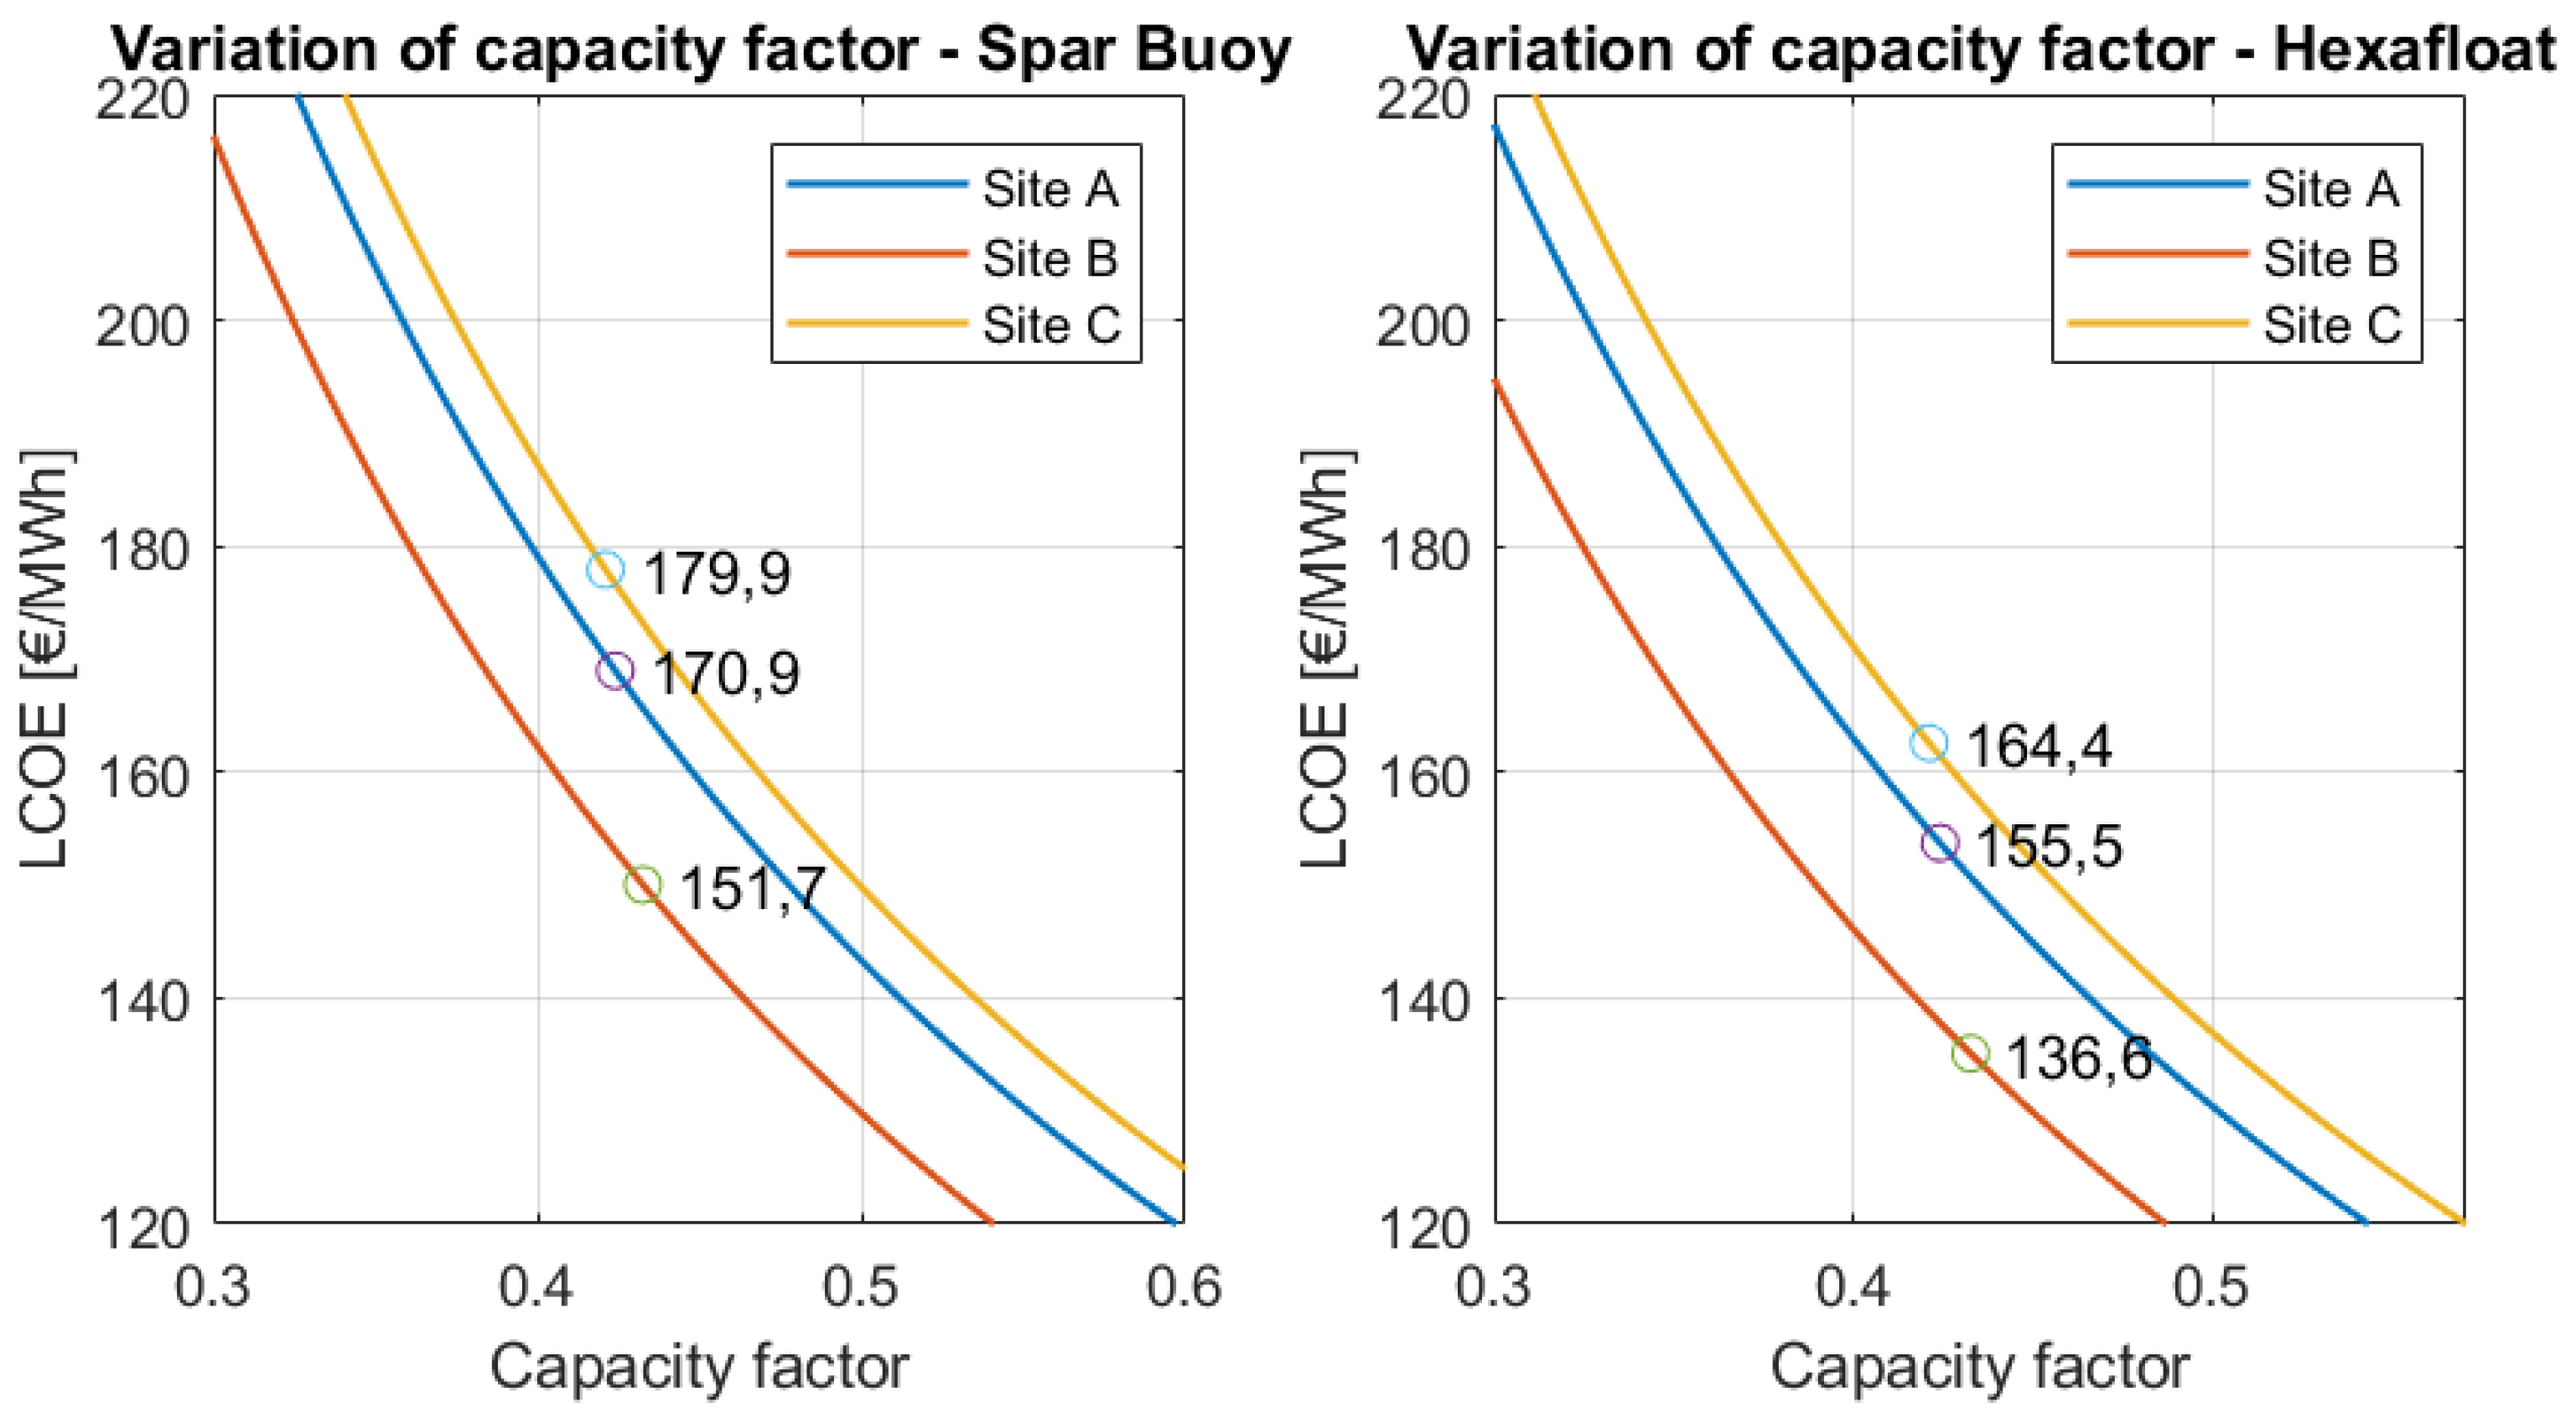
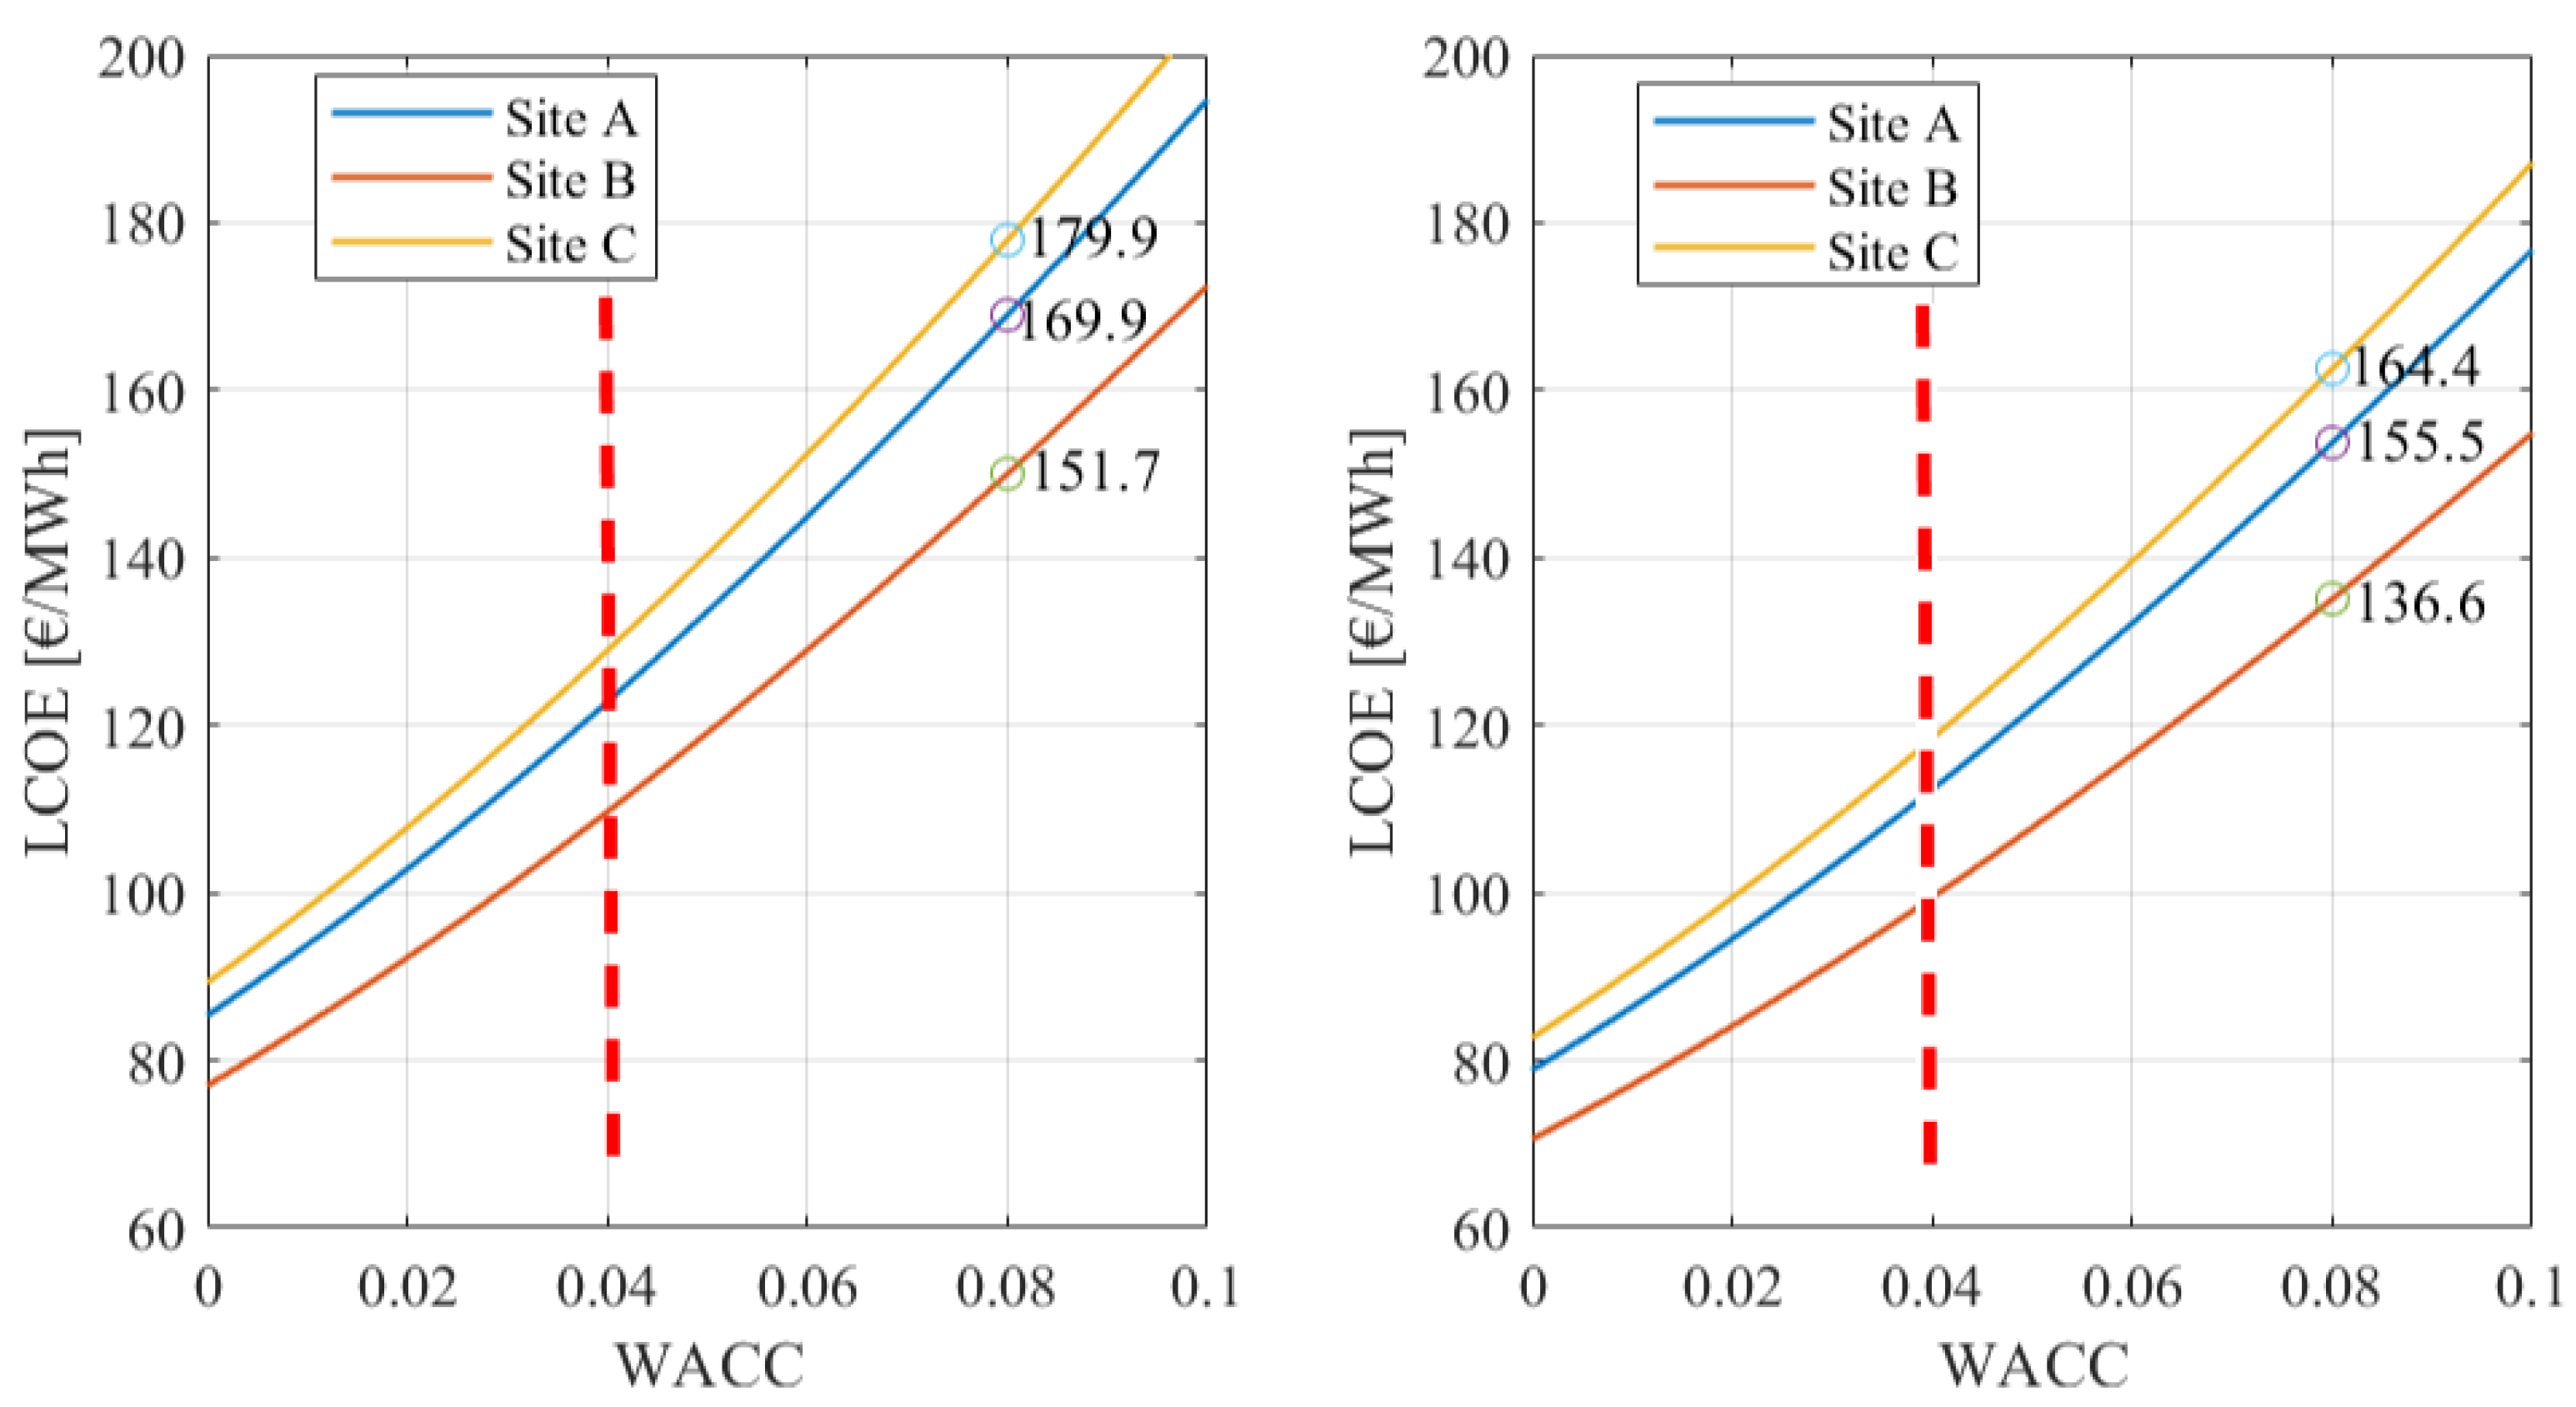
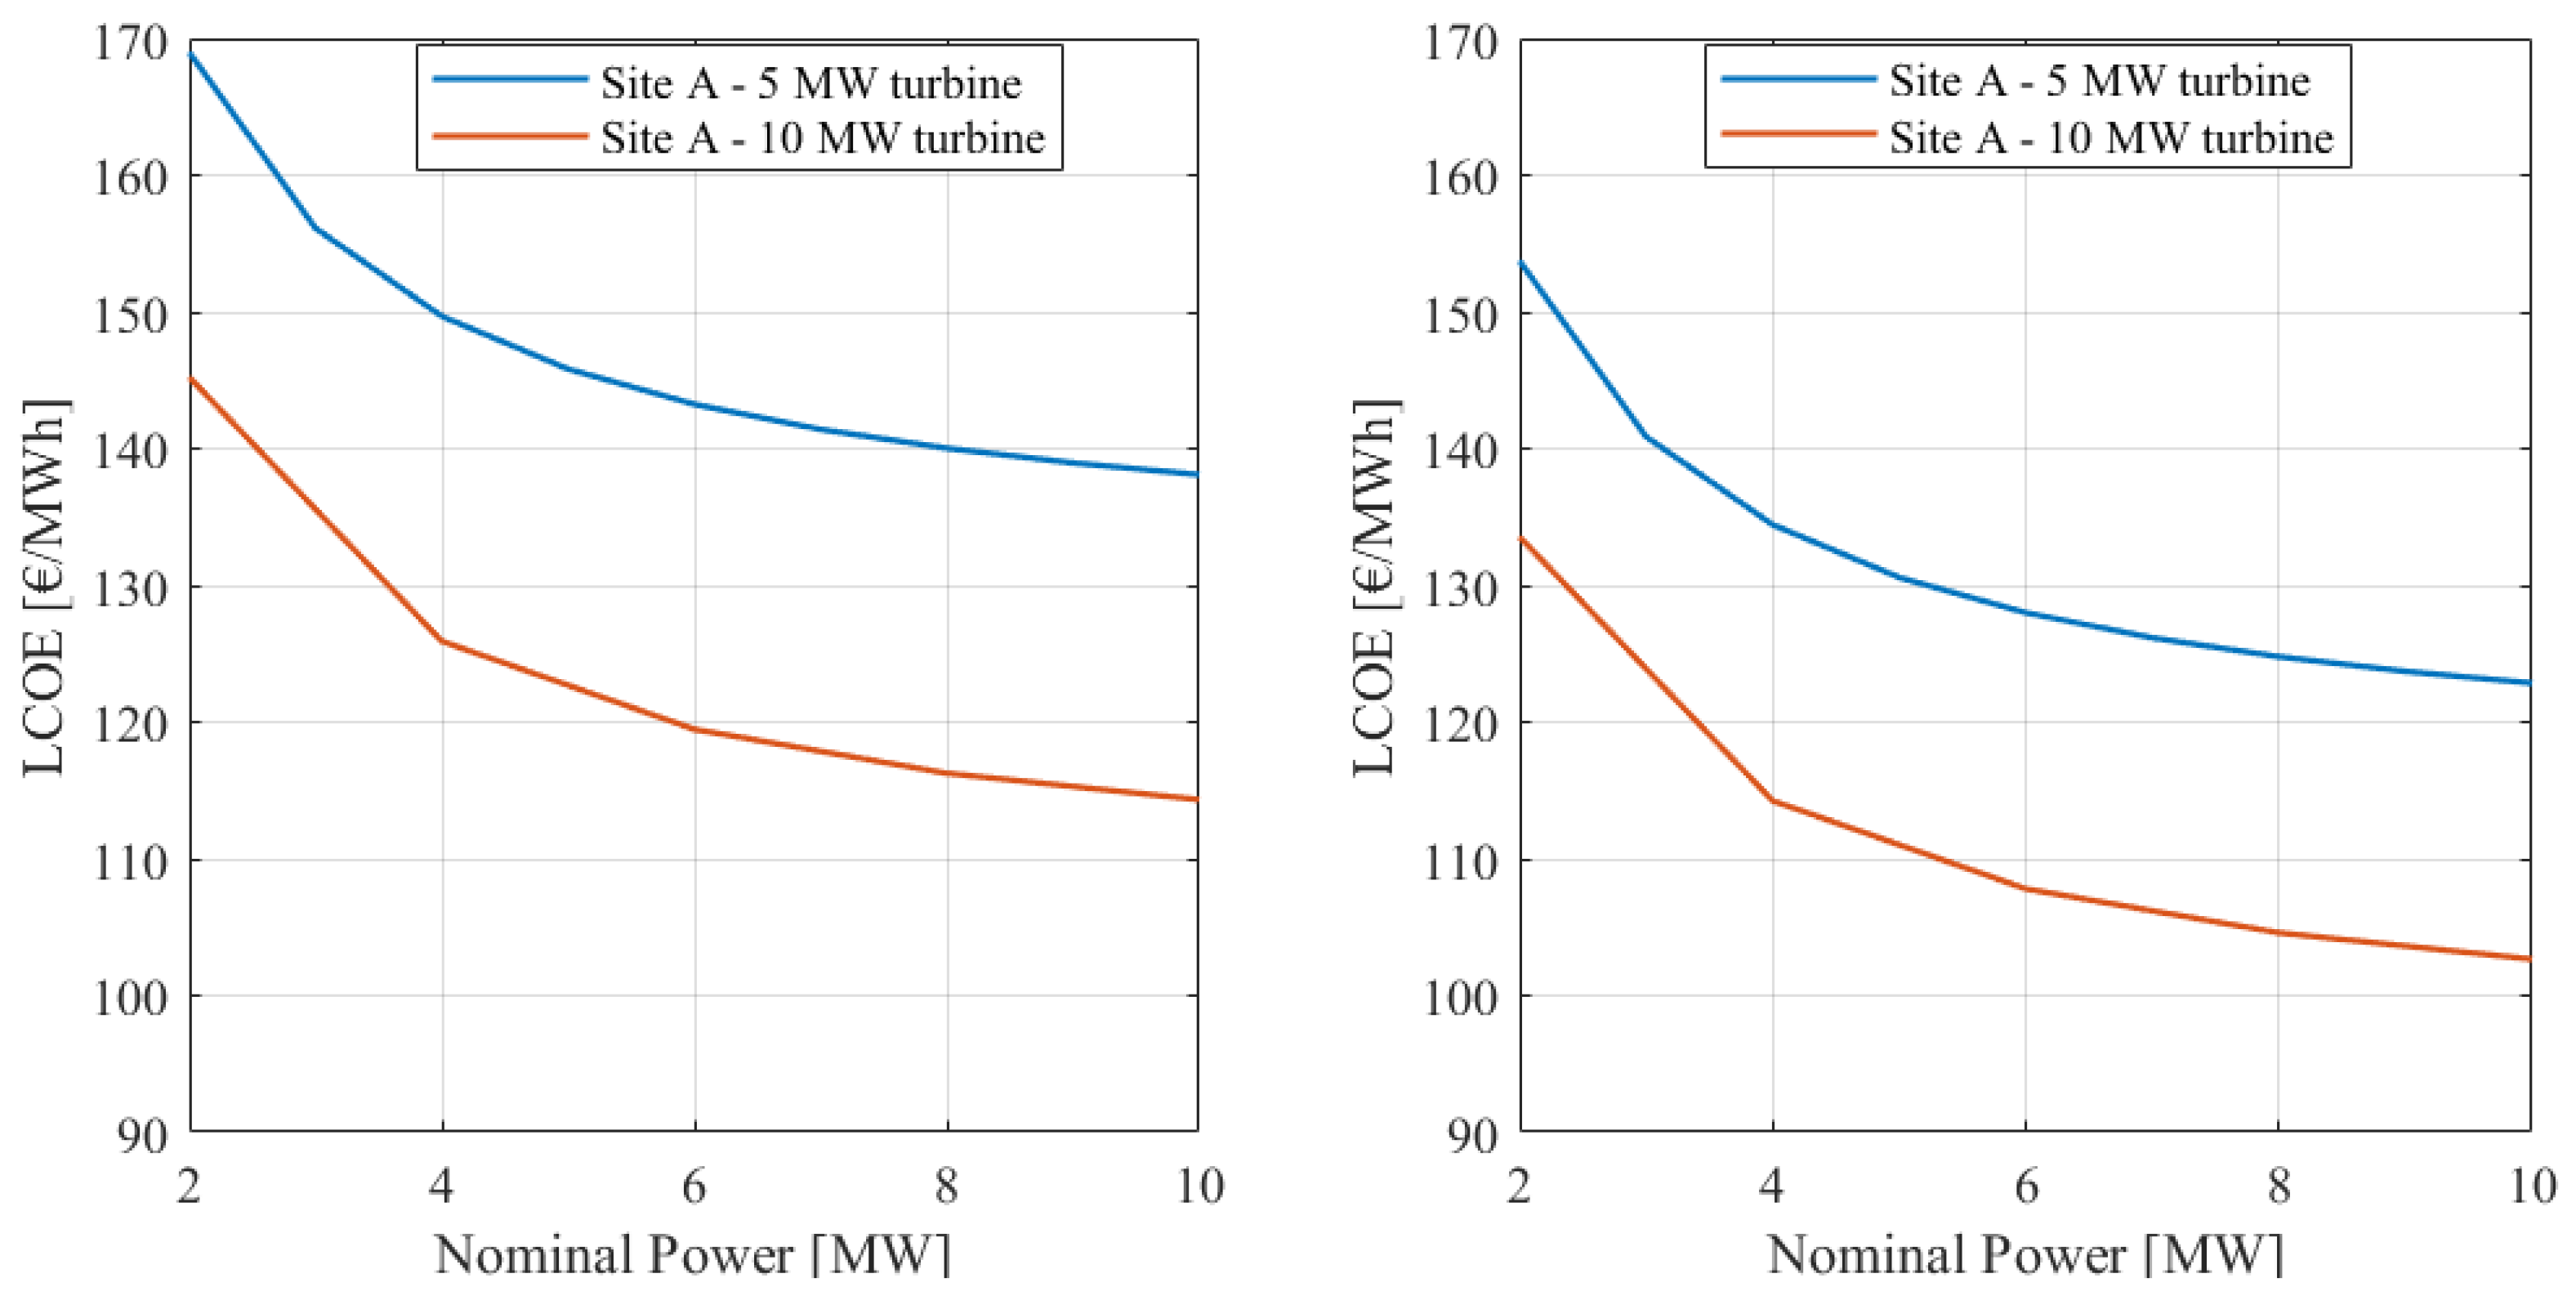
Then, the tool has been implemented to perform an optimization with Matlab genetic algorithm: the purpose is to identify the best concept in terms of weight and material cost among all the platforms, which nevertheless satisfies the constraints imposed by Standards. Once the main material costs have been estimates from literature, for each concept has been defined a material cost function, that is the fitness function to minimize. From the results obtained, it has been possible to identify two most promising concepts—the Spar-buoy and Hexafloat—with whom a preliminary project has been defined for a wind farm near the island of Pantelleria. Finally, a sensitivity analysis identifies possible cost reductions due to an increase in capacity factor, a decrease in Weighted Average Capital Cost (WACC), or by varying the number of turbines and rating.
Concepts Review
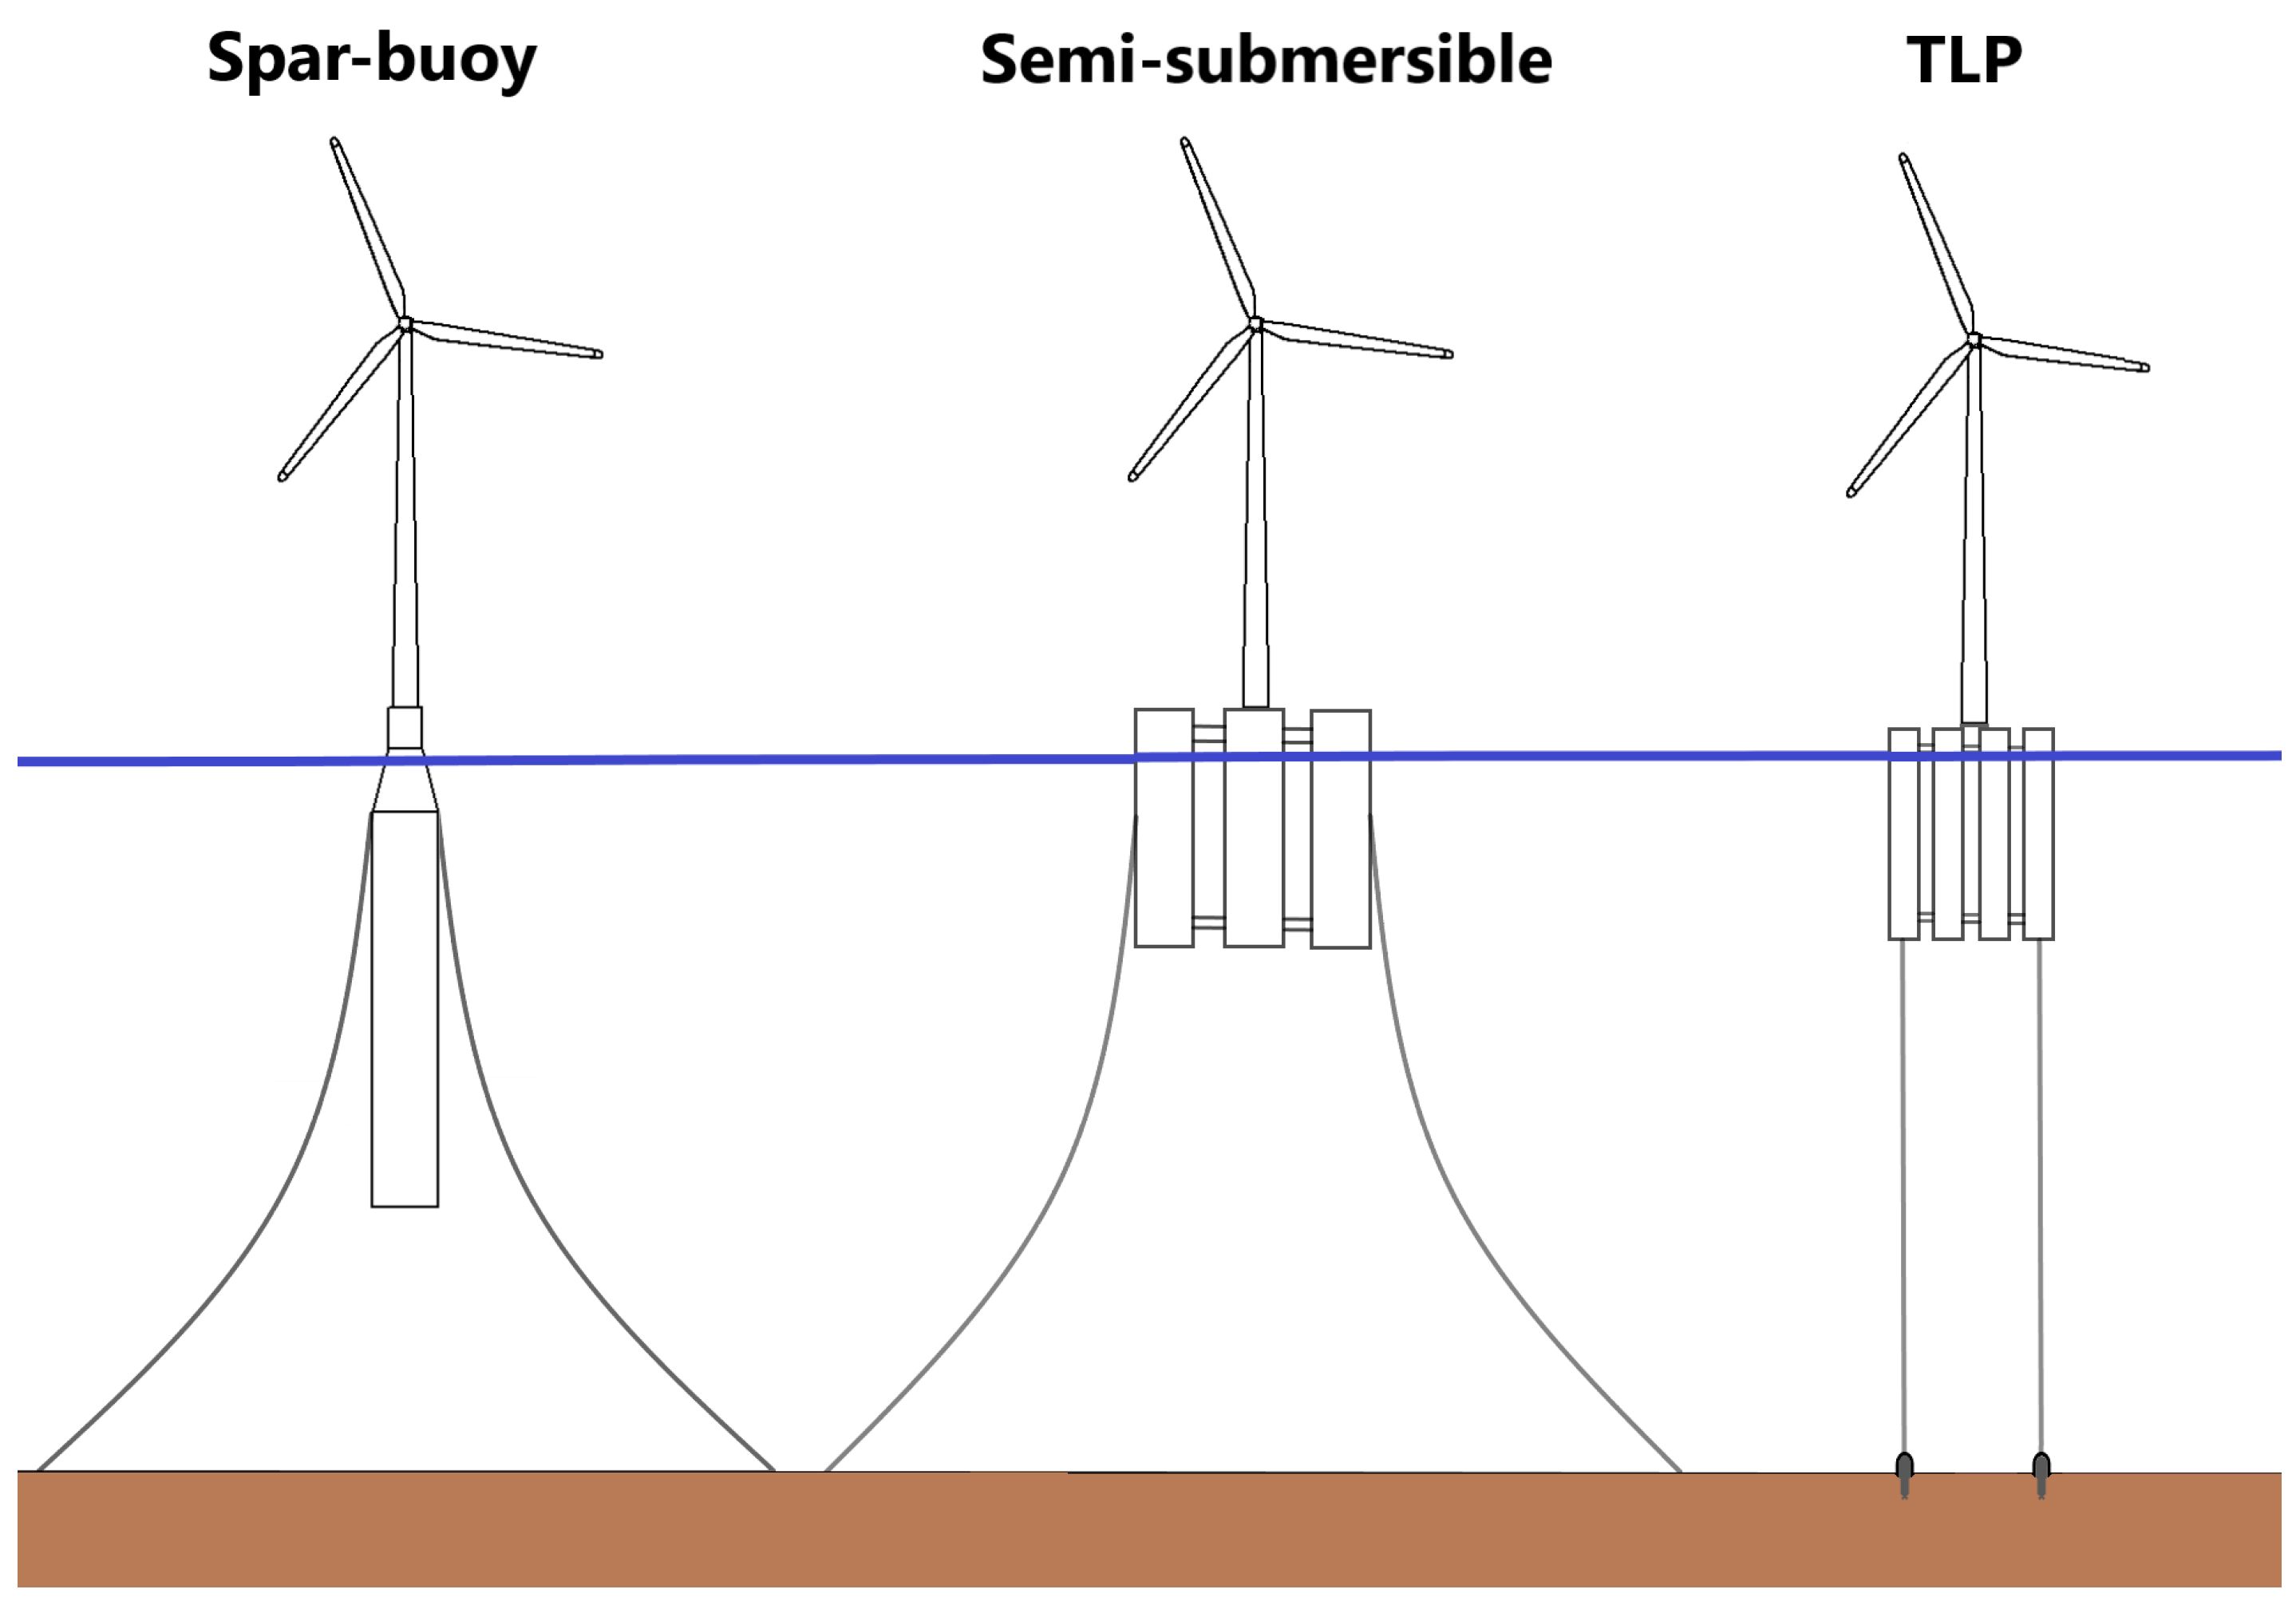
Floating substructures are usually classified according to how they achieve static stability. The wind acting on the turbine generates an aerodynamic thrust that tends to incline the whole platform, and thus the platform must generate a moment which counteracts this effect, also called the restoring moment.
The spar design is characterized by a steel or concrete cylinder with low water plane area, ballasted with water or solid ballast to keep the center of gravity below the center of buoyancy. Spars are stable in general, due to the large draft.
The semi-submersible and barge configuration achieves the necessary static stability mainly by exploiting the buoyancy force: to obtain this effect a large waterplane area is necessary.
The Tension Leg Platform (TLP) is a structure with large buoyancy that is restrained by means of a tension leg mooring system. These legs are usually cables and, when inclined, the higher tension in the windward leg compared with in the leeward leg creates a restoring moment, which counteracts the inclining moment due to the wind [
18].
A graphic representation of the main types of floating platforms is shown in
Figure 4.
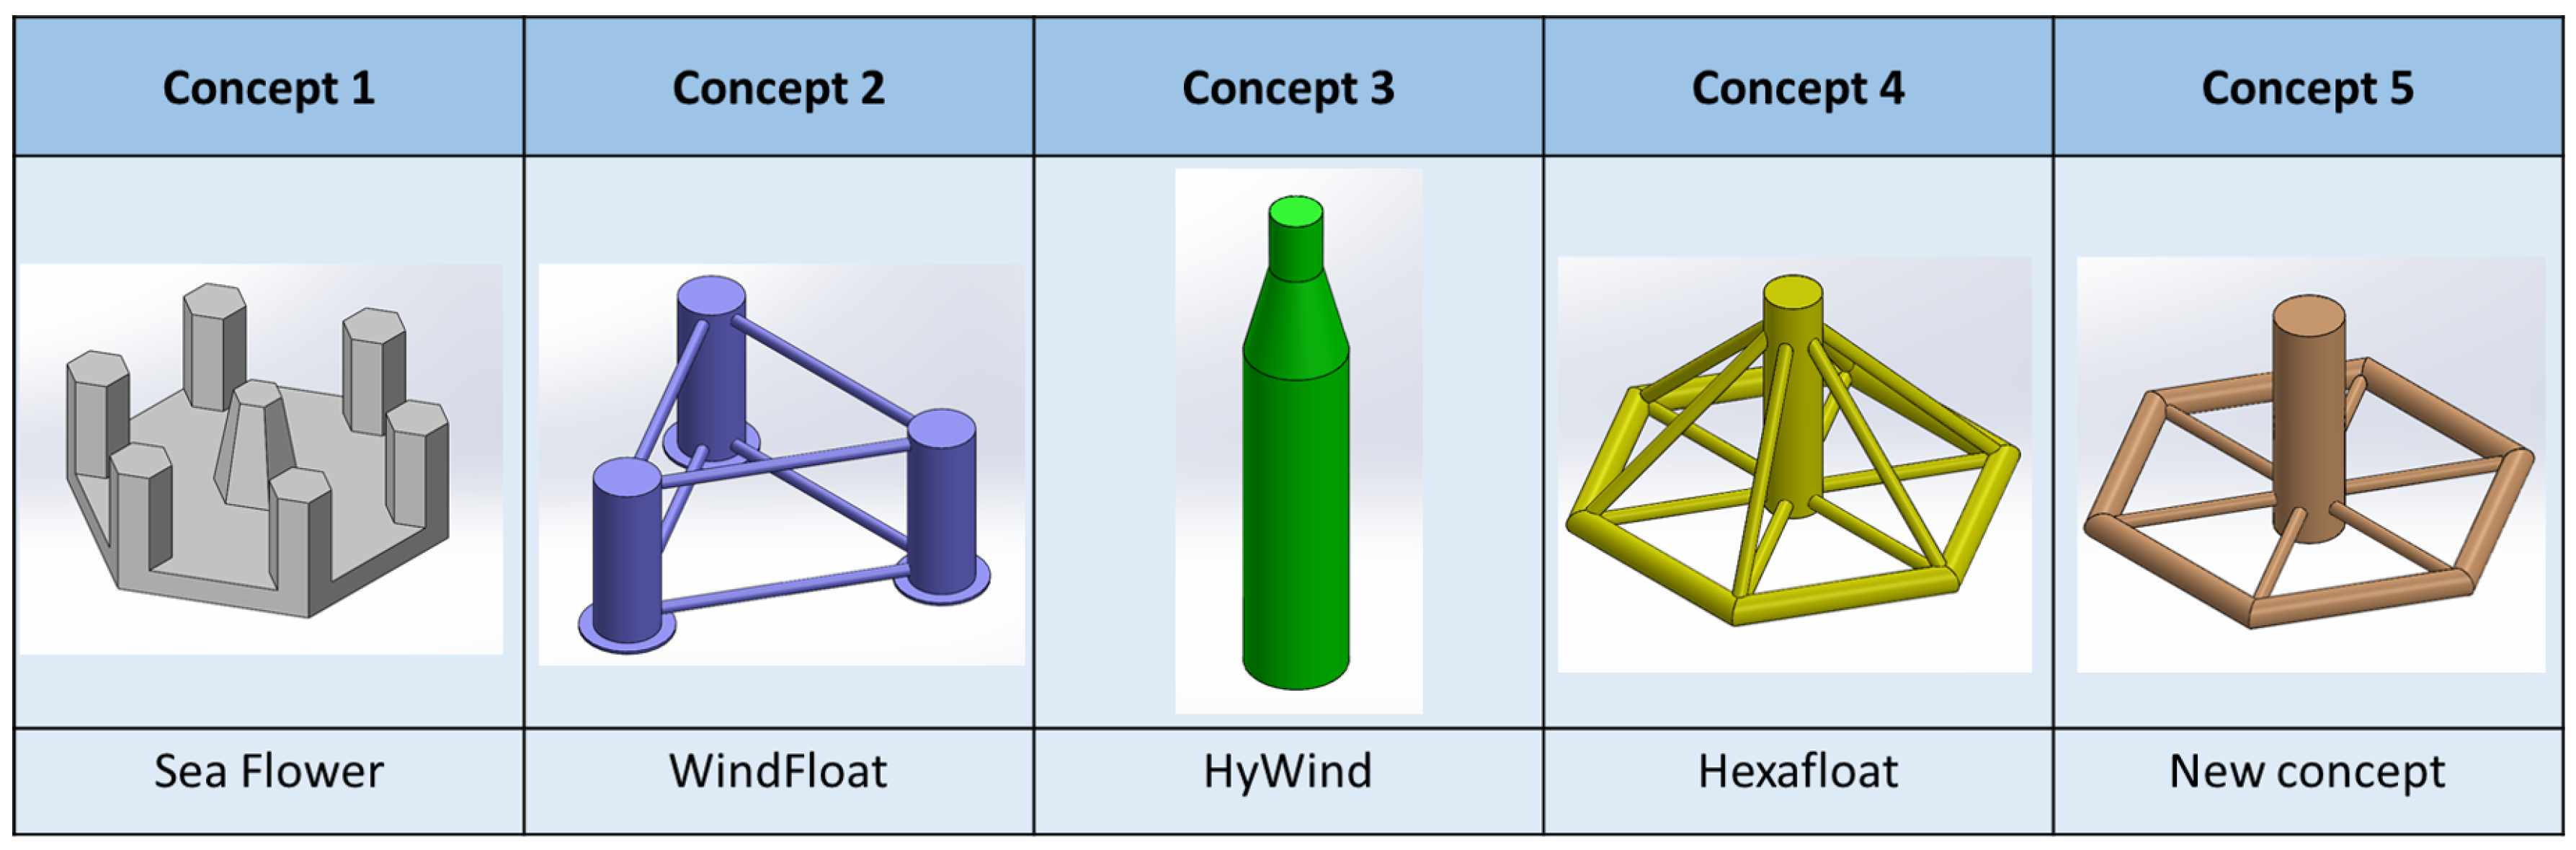
In this work, five platform concepts have been investigated: two concepts are technologically mature and have been developed in pre-commercial wind farm (HyWind’s spar-buoy and Windfloat’s semi-submersible); one has been experimentally tested with a prototype in open sea, but not yet commercialized (Hexafloat by Saipem S.A.); one has been defined only from a theoretical point of view (Sea Flower by Fincantieri); and the last one is still in a state of preliminary definition.
Sea Flower is a floating offshore wind platform designed by Fincantieri Offshore. It consists of a hexagonal submerged platform acting as main buoyant body and six semi-submerged columns at the corner. The entire structure is made of low-weight concrete. The platform can be moored with a six-line mooring system to the seabed and it is suitable for sea depth of 50–200 m. The structure’s stability allows small inclination angles and therefore an excellent exposure to winds, ensuring greater energy generation effectiveness [
19].
The second concept analyzed is the
WindFloat platform, developed by Principle Power, as part of the WindFloat Atlantic project. The substructure is a semi-submersible concept, consisting of three cylindrical-shaped columns in a triangular alignment. The columns are interconnected by horizontal bracing beams, forming a truss structure. Each column is equipped with horizontal heavy plates at the lower part of the column, so as to increase the added mass in heave, in order to reduce the global platform motion. The turbine tower is installed on one of the three columns. The diameter of the tower base should be close to the column diameter to allow the best possible continuity of the structure and to reduce the stress concentration [
20].
The third concept is the
Hywind platform, developed by Equinor (Statoil), as part of the HyWind Scotland project. The substructure is a spar-buoy concept, consisting of a cylindrical-shaped column. It is a hollow structure made of steel and it is characterized by ballast material made of generic concrete and sea water, to guarantee stability and low inclination angle in pitch even in the presence of high waves and strong winds. The steel weight is 2300 tonnes and, when the structure is ballasted, the total weight of platform and turbine is around 10,000 tonnes. The structure is anchored to the seabed by three mooring chains, each connected to a suction anchor [
8].
The fourth concept is the
Hexafloat platform, developed by Saipem SA. The floating substructure is a pendulum floater linked with six tendons connected to a counterweight. The floater is an hexagonal shape structure of steel cylinders, with a central column that supports the wind turbine. The counterweight is made of steel and will be shaped as a cylinder in order to accommodate the ballast inert material: in this work, magnetite is considered as the material for the counterweight, that is, iron powder with a density of 5200 kg/m
3. The structure needs from three to six mooring lines, typically composed by chain or taut-leg moorings and a drag anchor for each line. The main advantage of this concept is that the diameter of the tubular structure could be slightly adapted and the ballast depth could be adjusted to suit different turbine sizes, from 2 up to 15 MW. Otherwise, the overall dimensions of the structure will remain similar regardless of turbine size. That could make it easier to move towards serial manufacturing of the substructure, helping to reduce the Levelized Cost Of Energy [
21]. This substructure is relatively newer if compared to the others concepts: patented in December 2018, it is involved in the Aflowt project (2019–2022), during which a full-scale floating turbine will be built and tested in the northern part of Ireland [
22].
The last concept, called New Concept, is a new platform and it is not involved in any project. The design comes from the Hexafloat structure, with some changes to reduce the steel weight of the platform: in particular, all lateral brackets have been removed. The floater is a hexagonal shape structure of steel cylinders, with a central column that supports the wind turbine. Like the previous structure, there is a counterweight so as to accommodate the ballast inert material. The ballast depth can be adjusted to suit different turbine sizes.
The TLP structure was not considered as there is already an experimental prototype built and installed in Southern Italy: Blue H has launched and validated a prototype off the coast of Brindisi, at the end of 2007 [
23]. Consequently, it was preferred to focus on the spar and semi-submerged structures.
All the concepts previously introduced are shown in
Figure 5.
4. Optimization through Matlab Genetic Algorithm
The hydrostatic tool previously developed has been implemented with genetic algorithm by Matlab, in order to find the best concept in terms of weight and material cost.
A genetic algorithm (GA) is a method for solving both constrained and unconstrained optimization problems based on a natural selection process that mimics biological evolution. The algorithm repeatedly modifies a population of individual solutions. At each step, the genetic algorithm randomly selects individuals from the current population and uses them as parents to produce the children for the next generation. Over successive generations, the population “evolves” toward an optimal solution.
The generic syntax of Matlab genetic algorithm has the following form [
27],
x = ga(fun,nvars)
where ga finds a local unconstrained minimum, x; to the fitness function, fun; and nvars is the number of design variables of fun. In the considered case, the syntax changes to
[x,fval] = ga(fun,nvars,[],[],[],[],lb,ub, nonlcon)
where fun represents the fitness function to be minimized, nvars is the number of variables present in fun, LB and UB defines a set of lower and upper bounds on the design variables, x, so that a solution is found in the range lb ≤ x ≤ ub and nonlcon is a Matlab function that contains nonlinear constraints. The function nonlcon accepts x and returns two vectors C and Ceq, representing the nonlinear inequalities and equalities, respectively. The solver ga minimizes the function fun such that C(x) ≤ 0 and Ceq(x) = 0. Finally, fval is the value of the fitness function at x. In order to find minimum of function using genetic algorithm, the following steps are required.
Problem definition and variables identification.
Coding the fitness function.
Coding the constraint function.
Minimizing the fitness function using ga.
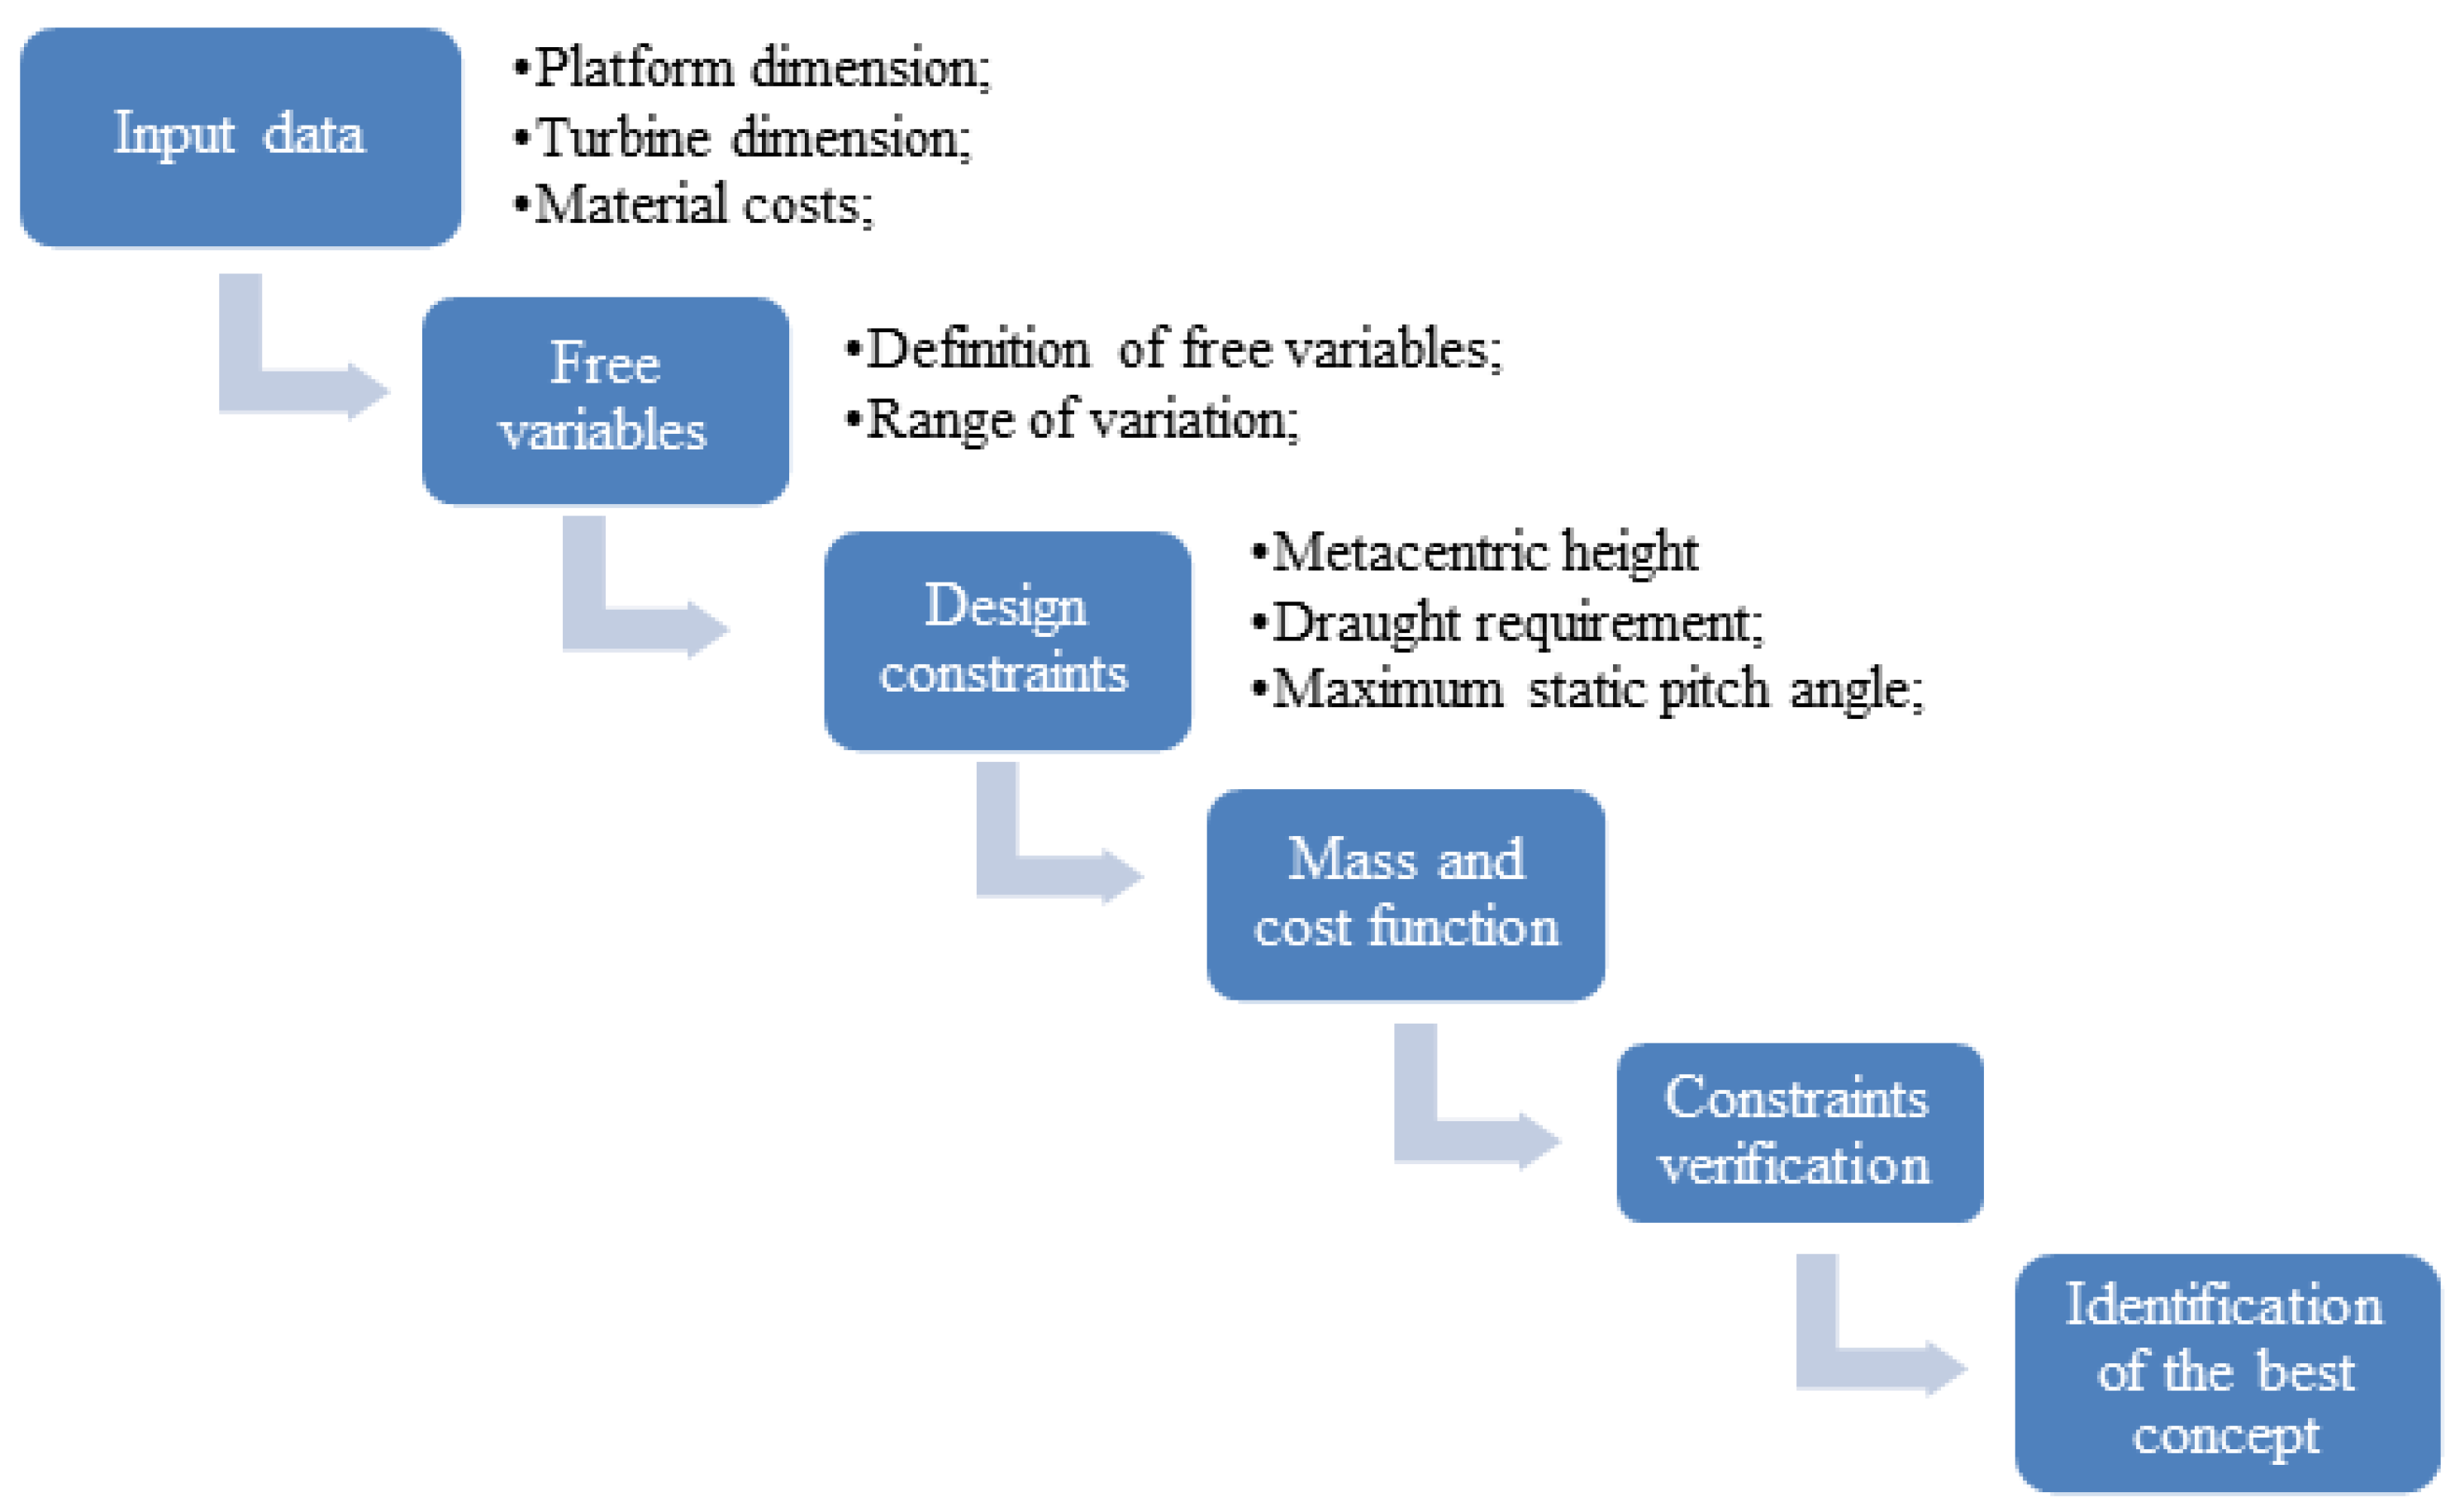
In this study, genetic algorithm is used to minimize the material cost function for each floating platform and to identify the lightest and least expensive structure. The iterative process is illustrated in
Figure 9 below.
The first step of the process provides for the identification of free variables for each concept: it is about those quantities, such as platform radius, column height, and mass of ballast, which intrinsically characterize a structure. Furthermore, to avoid unfounded or out-of-scale solutions, the variation ranges are defined for each of them. Constraints and requirements, concerning stability and buoyancy of the FOWT system are imposed, in accord to actual standards. Finally, for each concept a mass and a cost function are defined. In particular, the cost function works as a fitness function for genetic algorithm: for each cycle, genetic algorithm provides to minimize the cost function in order to satisfy all the constraints. The process evolves until the value of the cost function no longer decreases, as a minimum value has been reached. This process is repeated separately for each type of platform and subsequently by their comparison it is possible to identify the best concept in terms of material cost.
4.1. Free Variables Definition
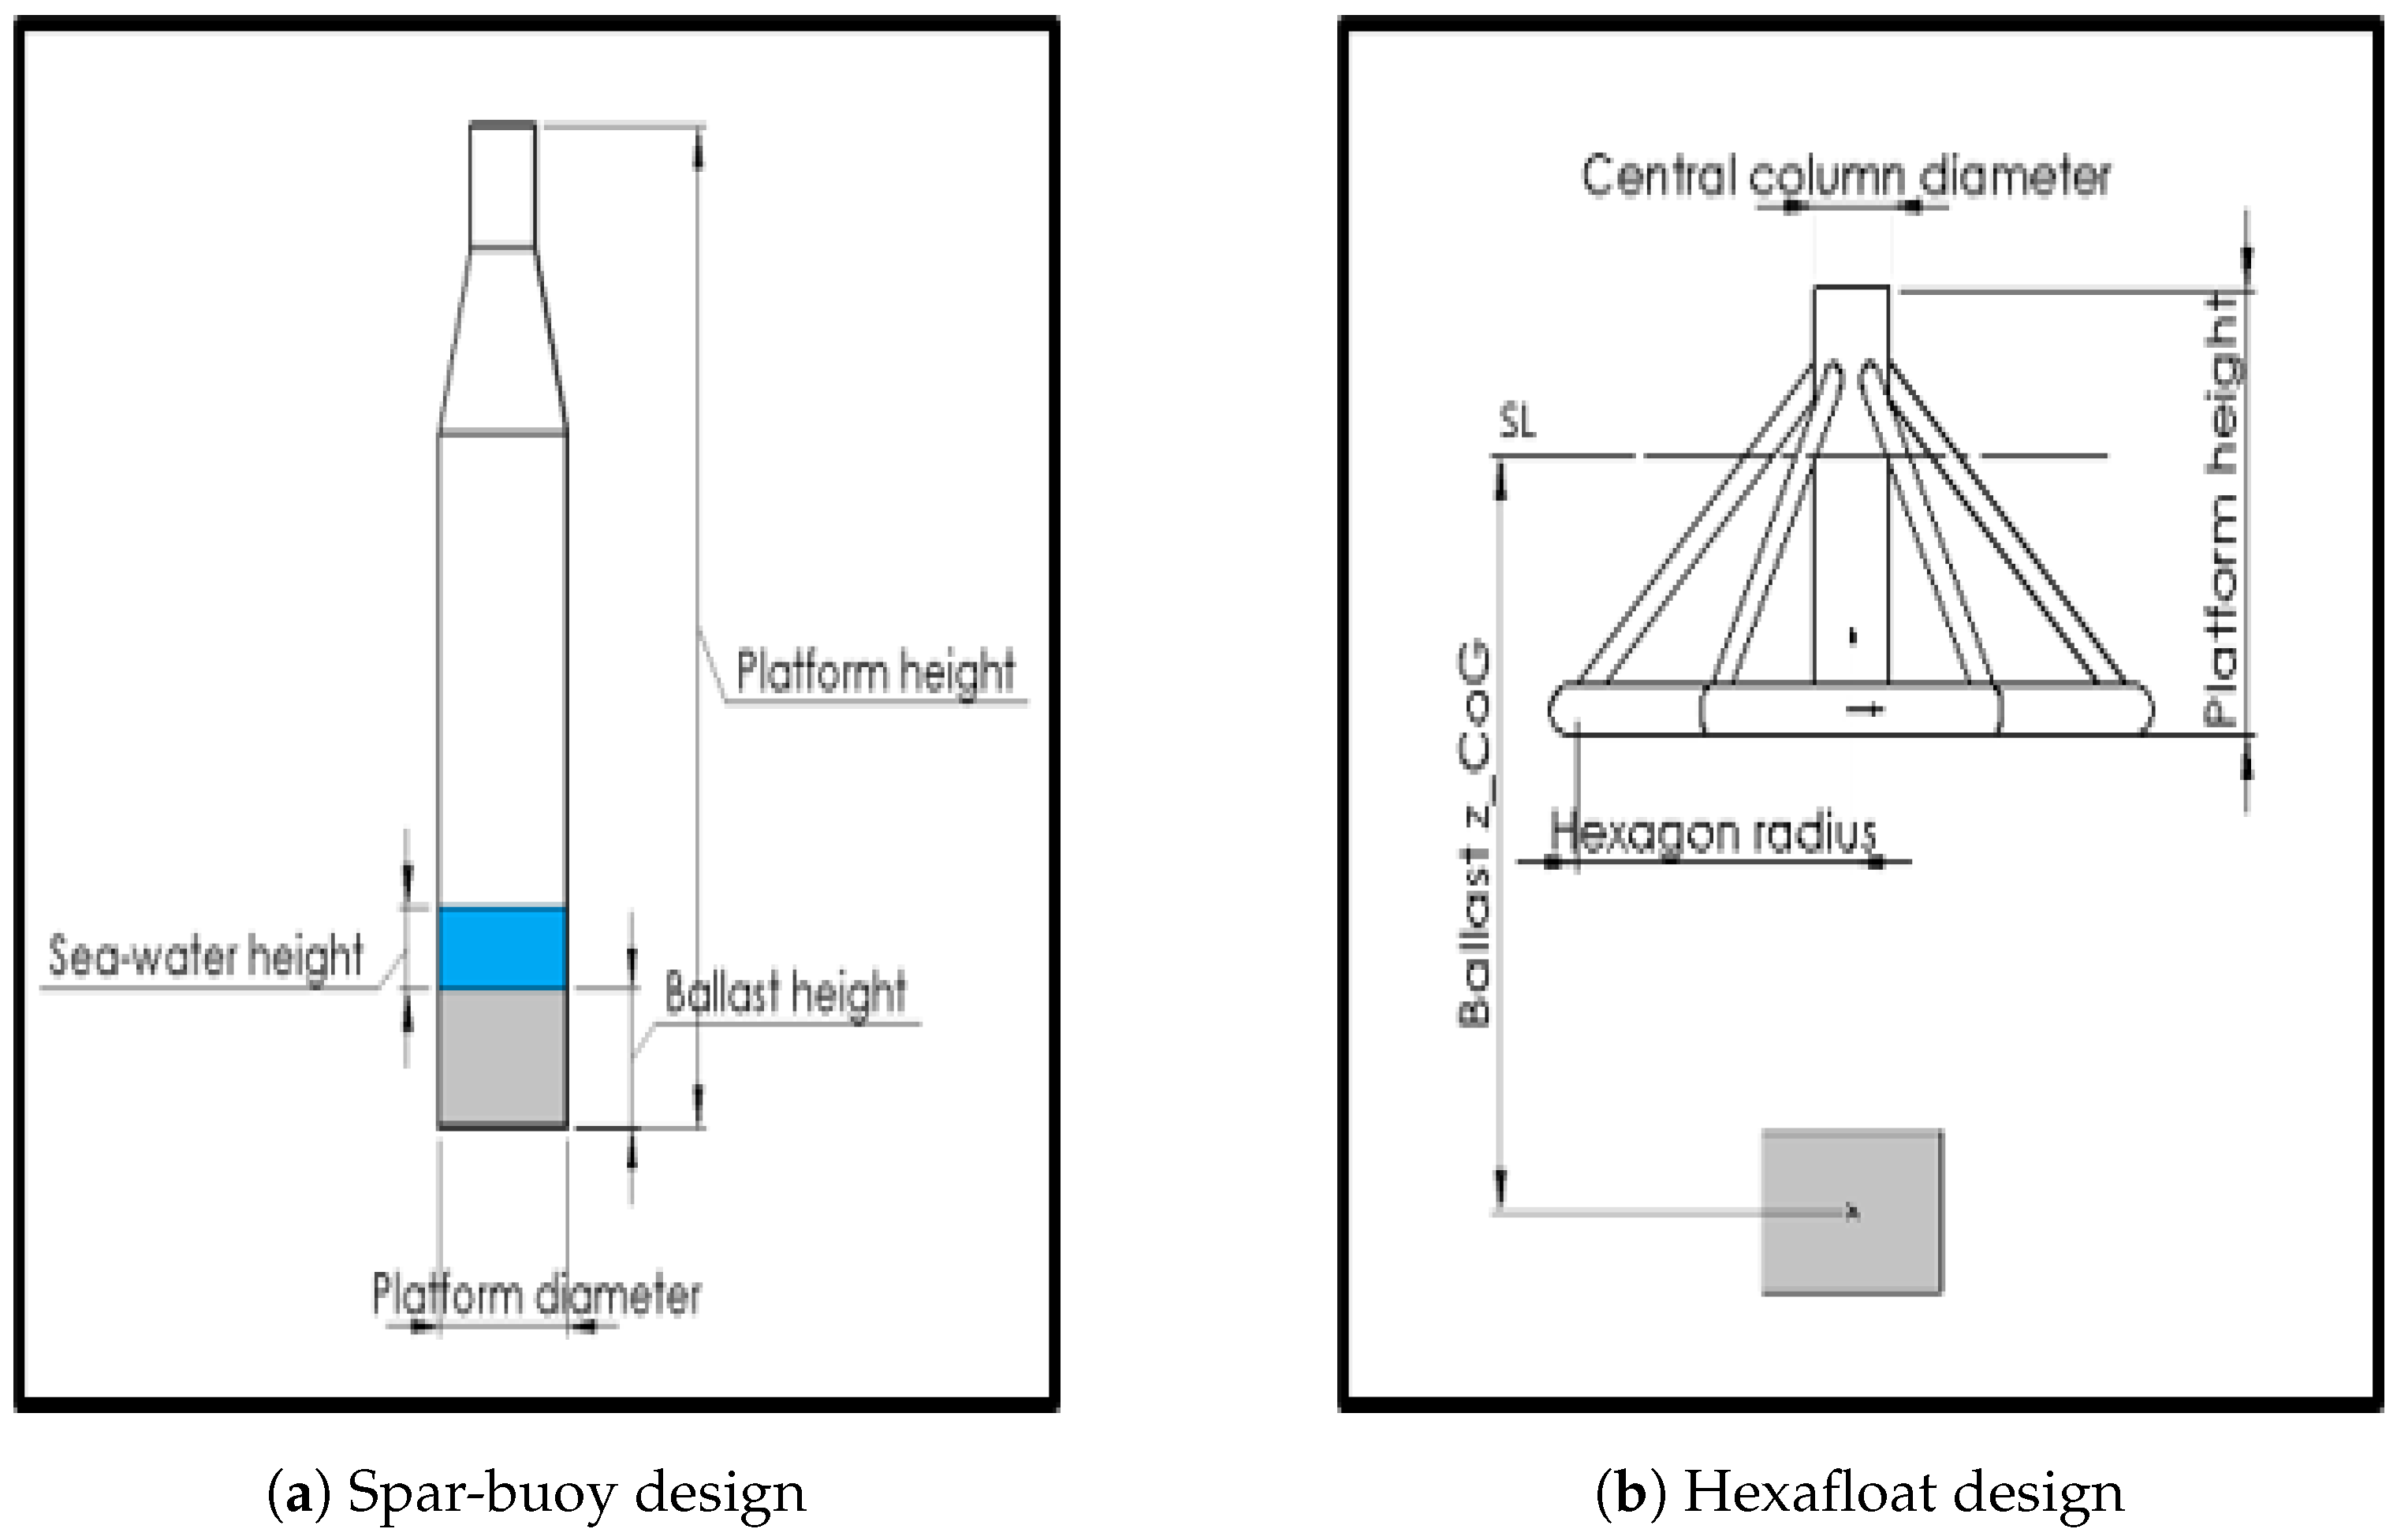
For each design, free variables were identified among the dimensions that most distinguished a certain concept, such as height, diameter, amount of solid ballast, and sea water. Moreover, a range of variation has been defined for each variable, in order to allow the algorithm to cycle and obtain reasonable results, comparable with the existing structures.
For example, in the
Spar-buoy design, four variables have been considered, as reported in
Figure 10b.
Platform diameter.
Platform height.
Ballast height.
Sea-water height.
Instead, in the
Hexafloat design, due to the fact that the geometry was completely different, the following parameters have been considered, as reported in
Figure 10b.
4.2. Material Cost
A very important aspect in a floating platform design is the material cost, by the fact that the size of the structure is imposing, this cost item must be considered. Today, platform structures are made of steel or concrete. The main material costs considered are shown in
Table 2.
With regard to S355 naval steel, the original density of 7850 kg/m3 has been incremented to 8500 kg/m3 in order to consider the presence of flanges and welds, that otherwise would have been overlooked.
4.3. Design Constraints
For the preliminary design of the structure, a set of requirements are made to achieve floating equilibrium, static stability, and to ensure that the structure does not exceed allowable dimensions. The initial requirements are stated in four points.
Metacentric height must be higher than 1 m.
Minimum draught of 10 m is required.
Freeboard height must be larger than 5 m.
Maximum static pitch angle must be less than 5°.
Metacentric height greater than 1 m is required for deep draught floaters such as spars in DNVGL-ST-0119 Standard [
30], and it is used as a requirement for the semi-submersible in this project as well. The draught requirement was set as 10 m in order to avoid slamming loads, as reported in [
31]. Freeboard height has been considered in order to prevent the turbine tower from being at sea level, to avoid corrosion phenomena that could damage it quickly. The maximum static pitch angle falls within the constraints imposed by Standard, as illustrated in [
25].
4.4. Material Cost Function
The material cost function is the fitness function, which is optimized through Matlab genetic algorithm. The cost function is defined as the sum of different material weight per cost material:
where
m is the mass and
c is the cost for each type of material of the concept considered.
6. Case Study—Pantelleria Island
The goal of this study is the installation of an offshore wind farm in the Italian Mediterranean. For the preliminary study, wind availability and productivity data have been extrapolated from the database of anemometric data, which can be found on the RSE website that also prepared the wind atlas [
32]. As it is shown in
Figure 14, the greatest resource is available in the south of Sardinia and along Sicily channel. For geographical reasons Pantelleria island was chosen as the installation site.
Pantelleria is a small Italian island located in the Sicily channel, 110 km southwest from Sicily and 65 km northeast of Tunisia, in one of the windiest areas of Italy. However, this energy potential has not yet been exploited, as there are not both onshore and offshore wind farms in the island. In fact, the electricity requirement, quantified as about 37.6 GWh per year, is completely provided by a thermoelectric power station (Smede) and some small photovoltaic parks [
33]. Consequently, as the island is not connected to the national electricity grid and electricity must be produced on site, the cost of electricity is higher than in the rest of Italy. The aim of this study is to size a small wind farm, able to completely satisfy the island’s electricity needs.
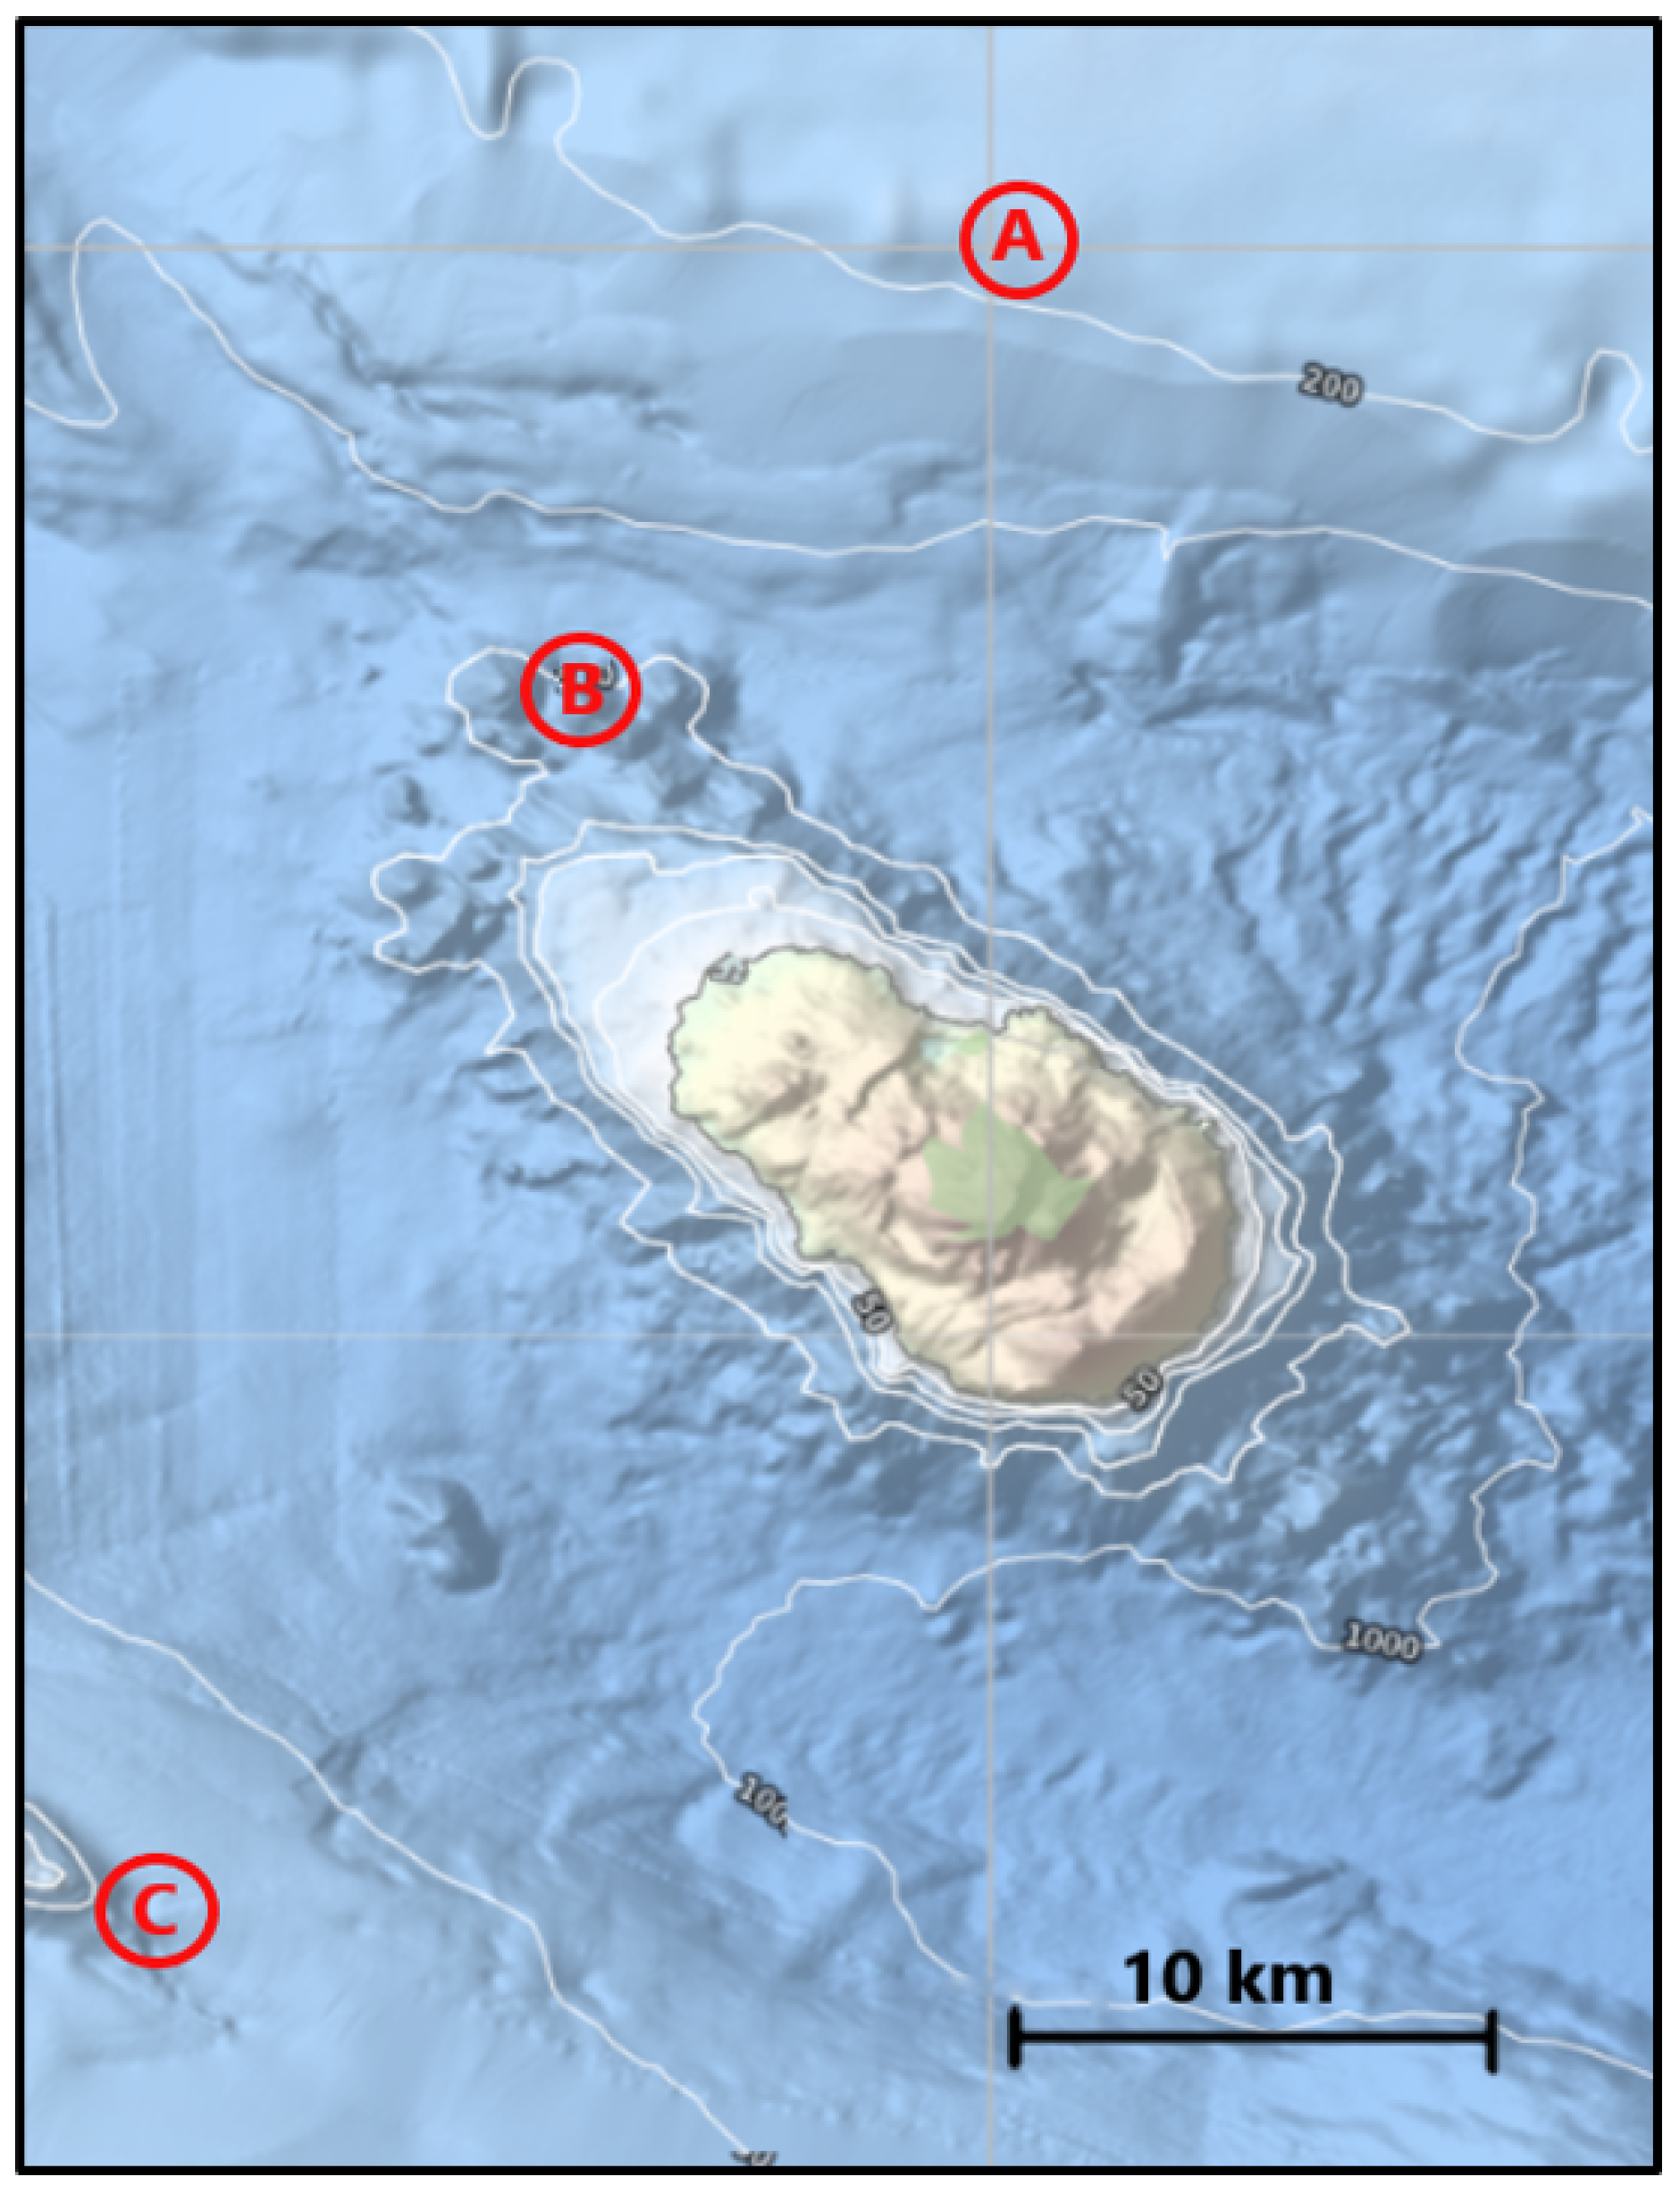
6.1. Sites Identification
In order to identify the best site around Pantelleria, the entire area around the island within national borders was selected as the first survey. After that, hourly wind data of the last decade were obtained from the database of ERA5 ECMWF and extracted using software Qgis. Through this data, it was possible to generate the Weibull distribution and, by putting it together with the power curve of a NREL 5 MW reference wind turbine, it was possible evaluate the annual productivity of the selected area. The average sea depth for each site was obtained by EMODnet Bathymetry portal [
34]. Three sites were considered, as reported in
Table 5 and illustrated in
Figure 15.
6.2. Wind Farm Definition
In this paragraph, the proposal of a wind farm is presented. The aim is to generate almost all the island’s electricity needs and to release it from the use of diesel fuel, necessary for the thermoelectric power station. This would contribute to making the island energetically independent, as well as reducing polluting emissions. The study is based on the following hypotheses.
10 MW wind farm, to satisfy electrical needs of 37 GWh per year;
two floating platforms, each of them supporting a wind turbine;
use of NREL 5 MW wind turbine; and
one offshore electrical substation.
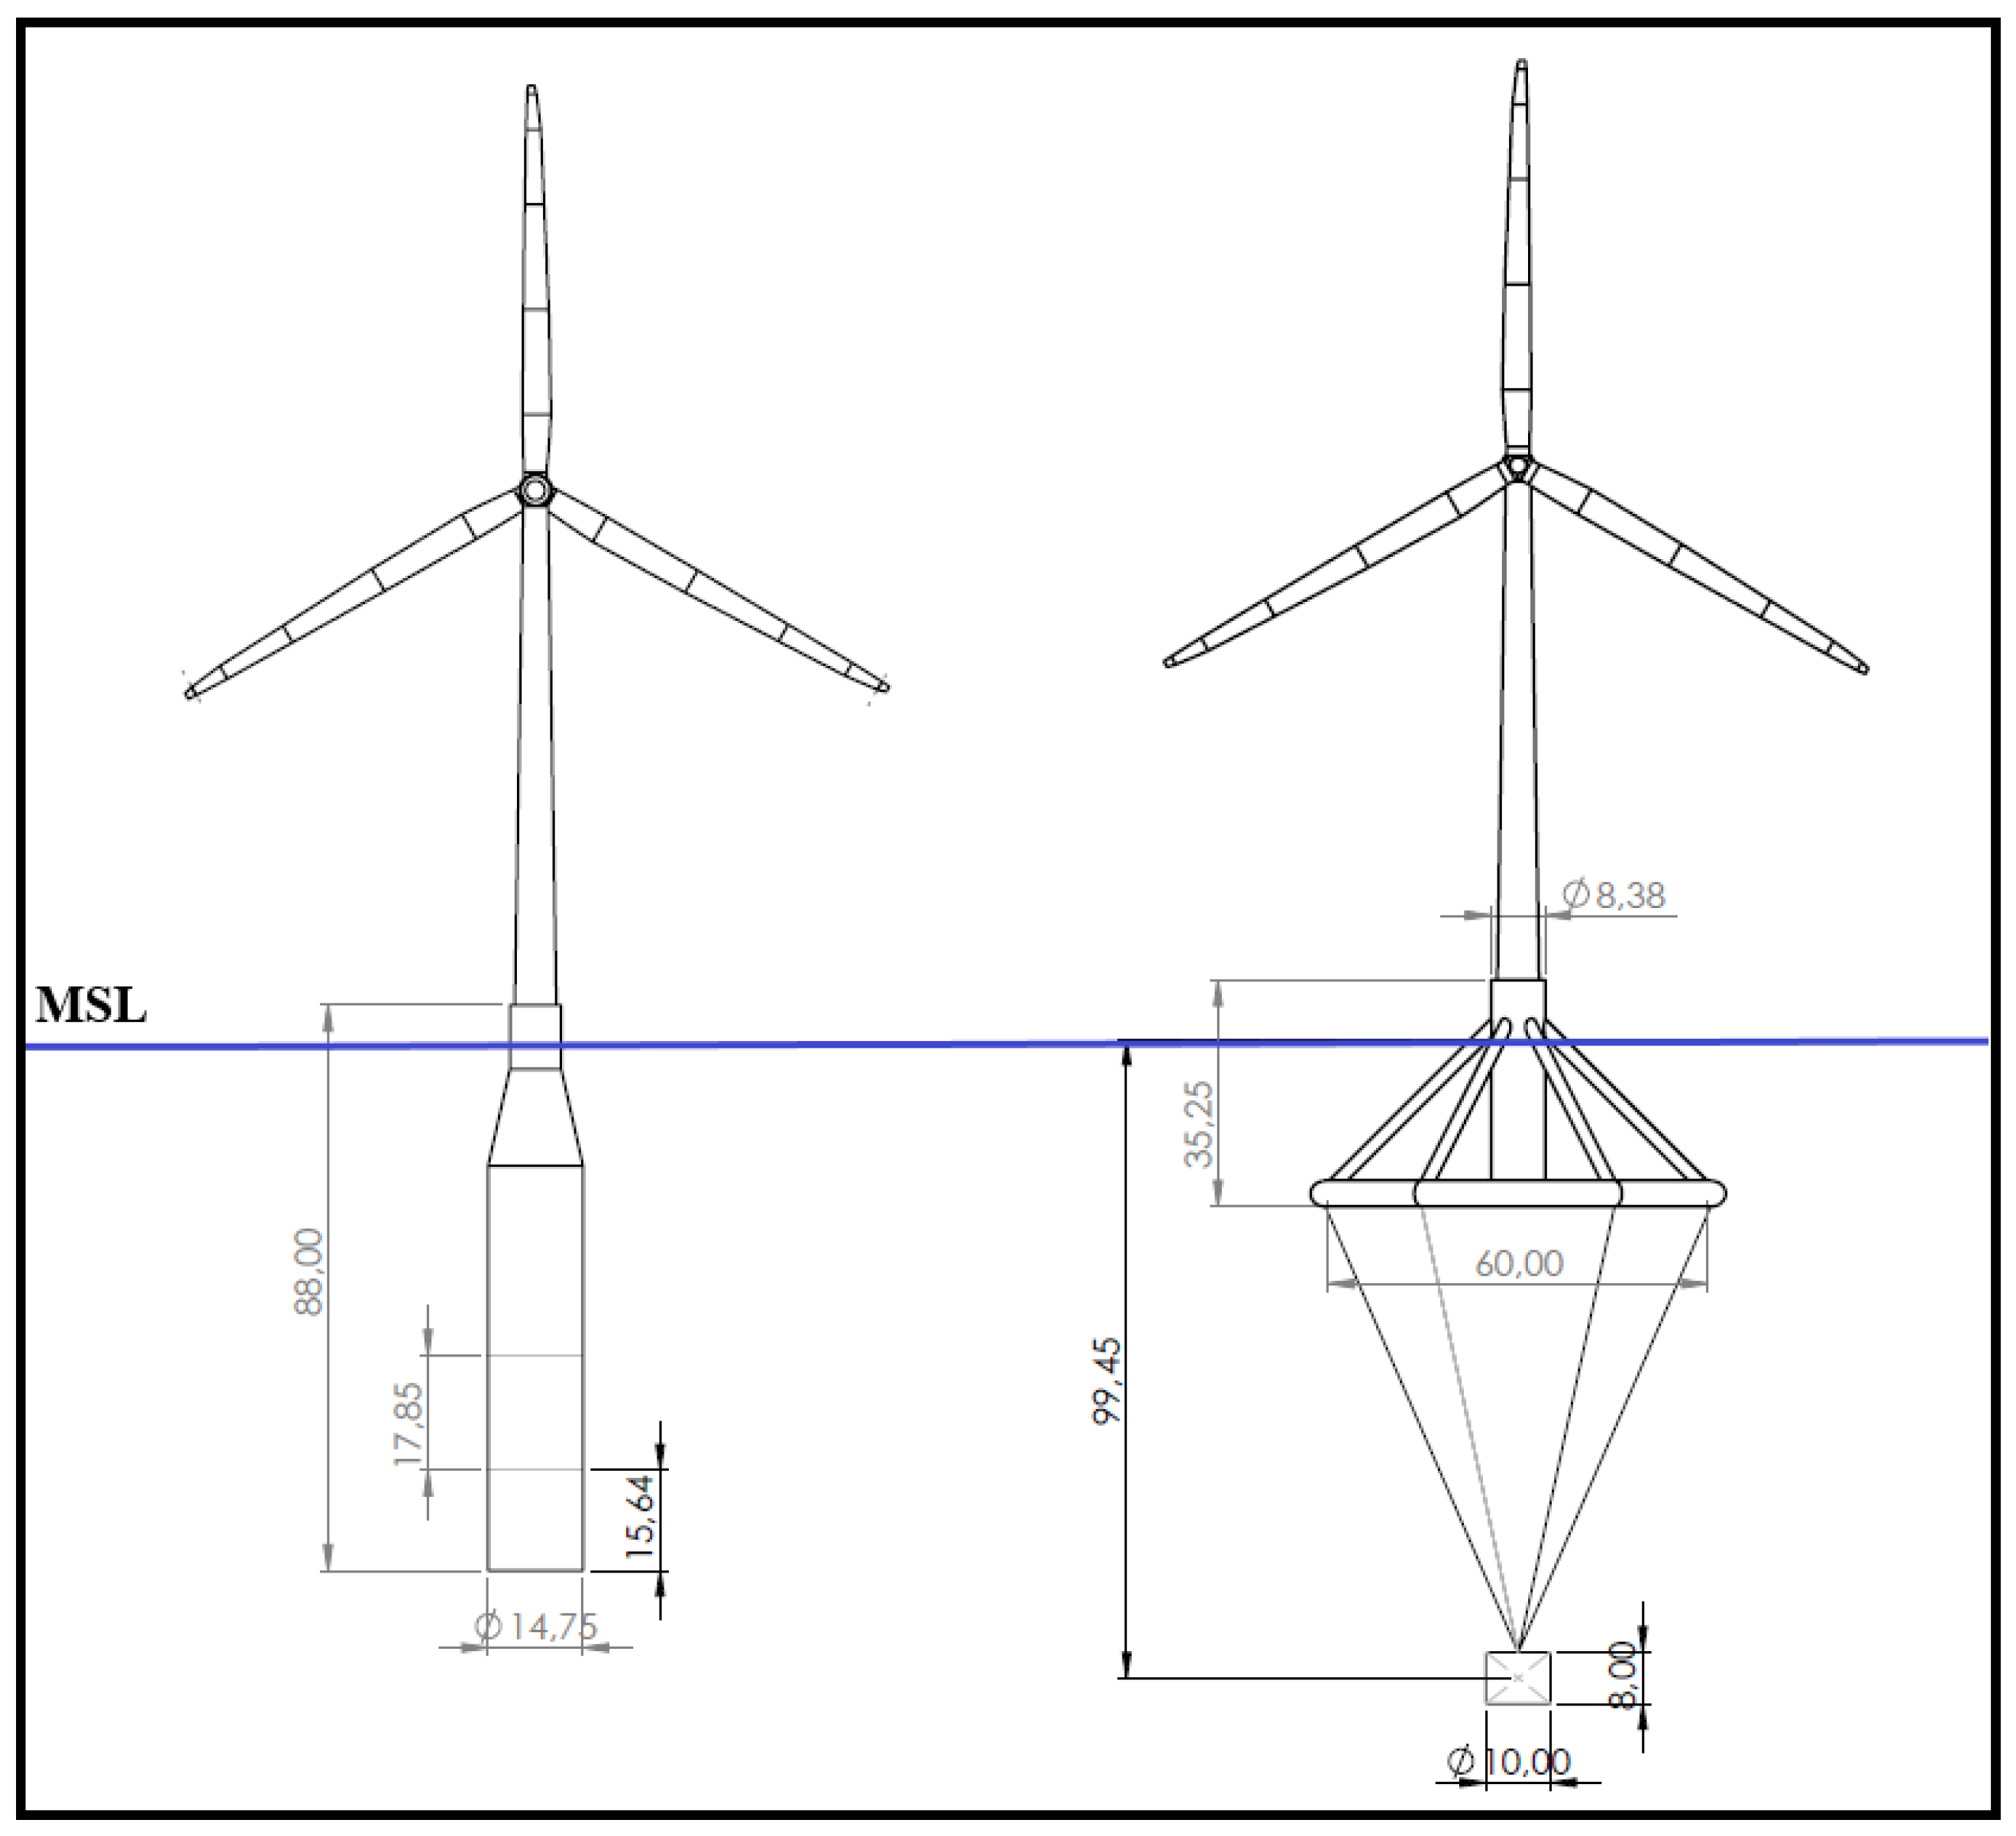
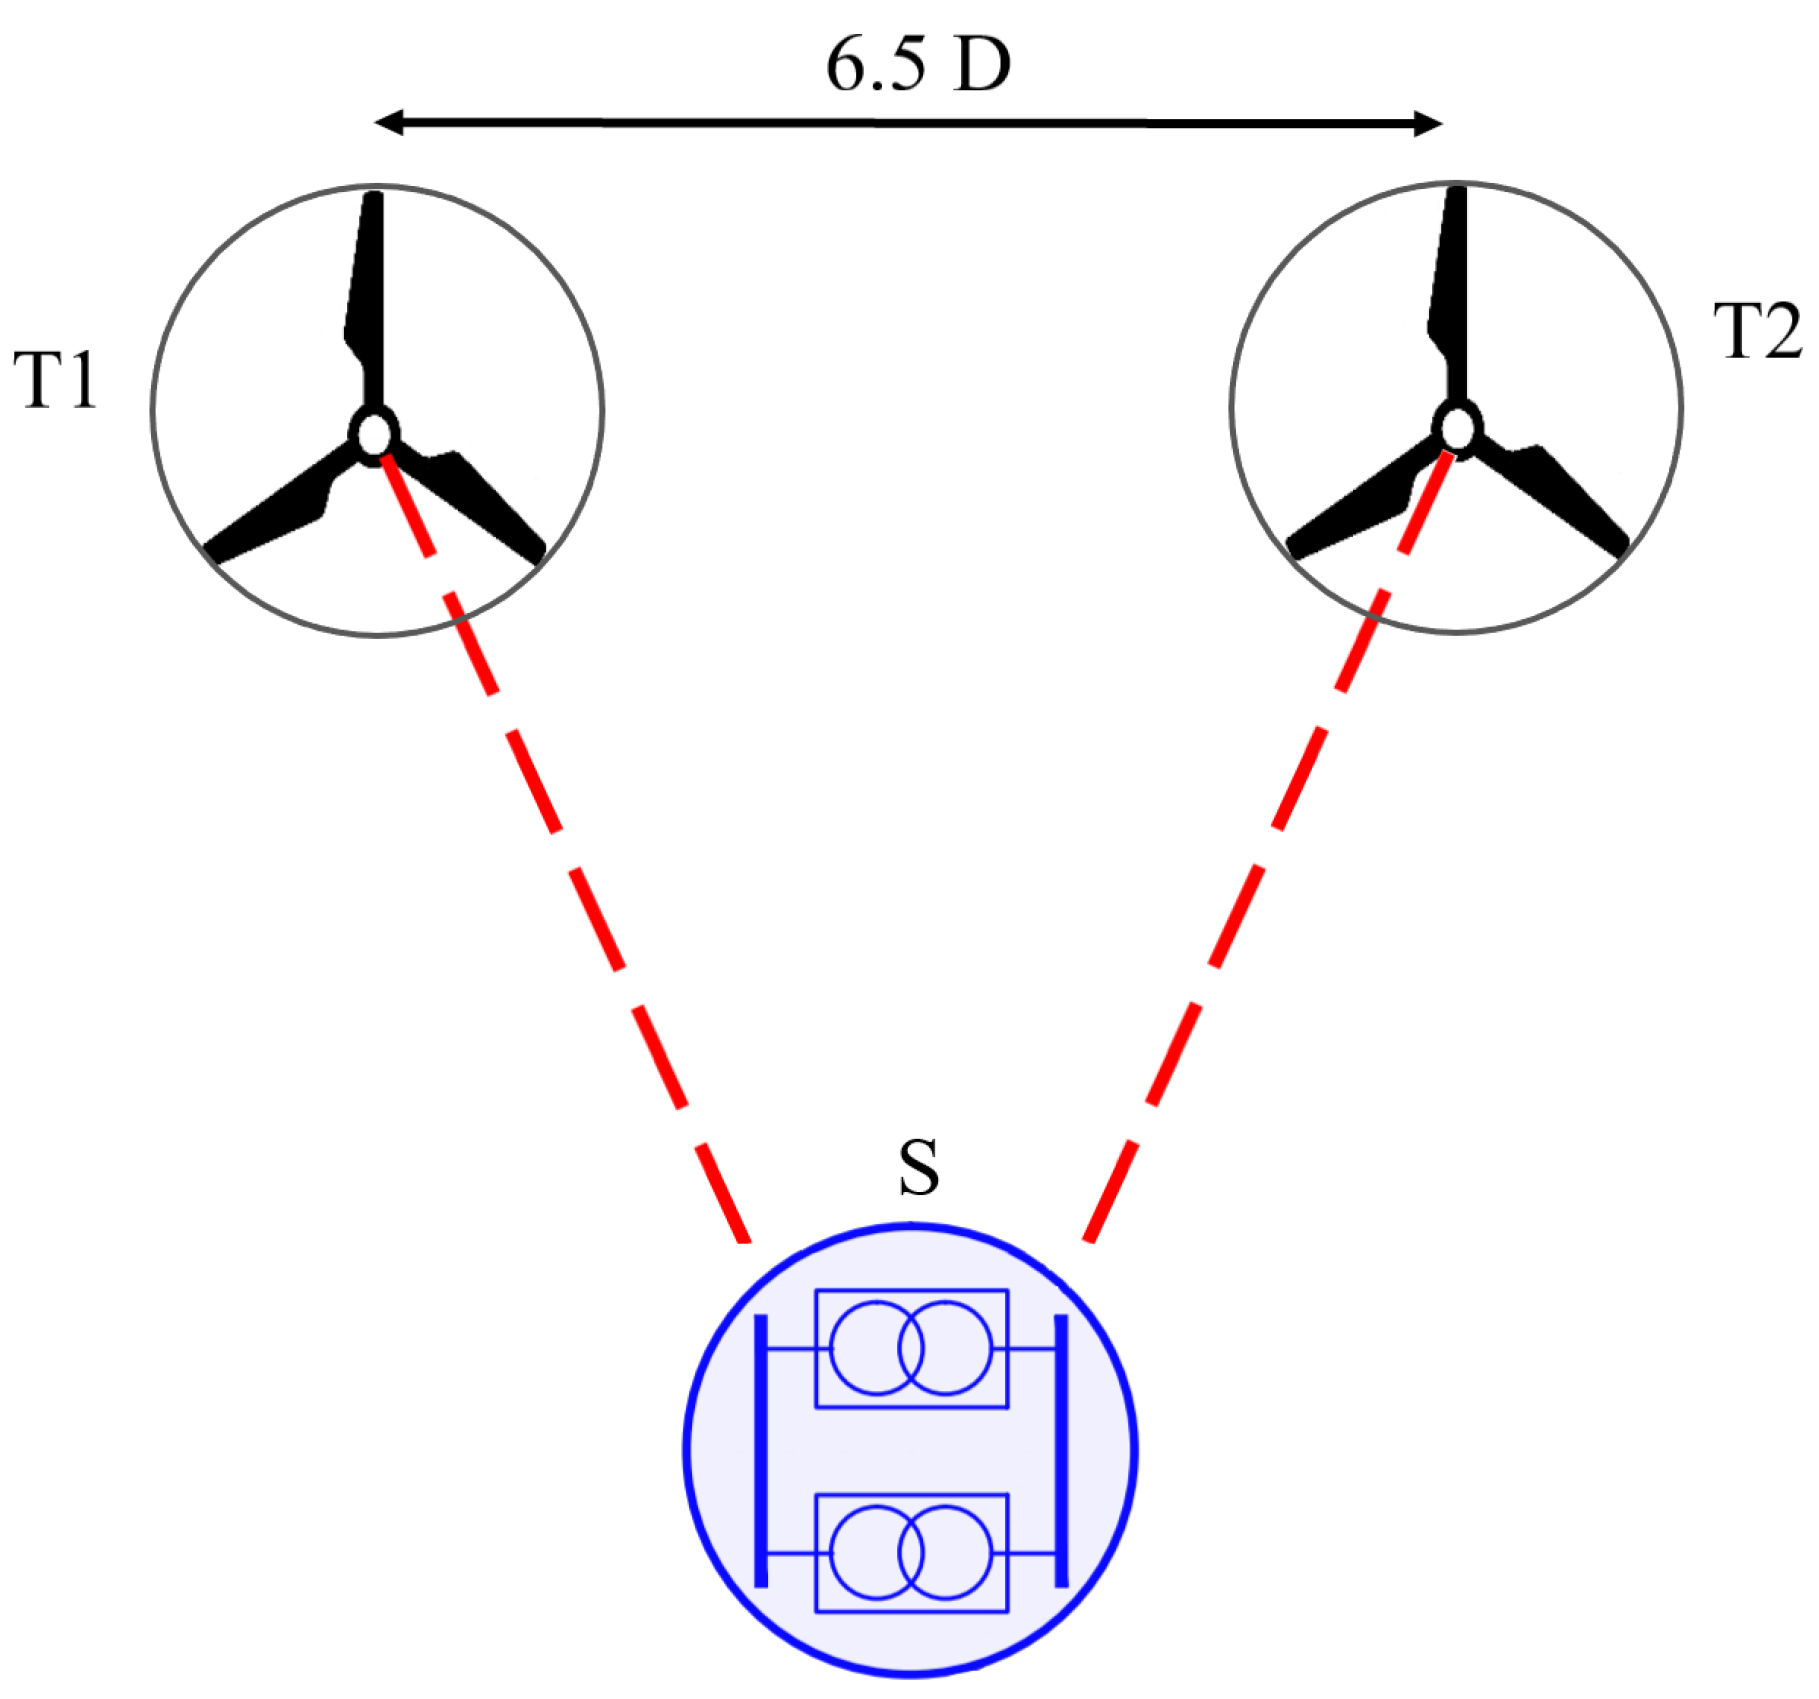
The wind farm, as visible in
Figure 16, is constituted by two platforms, each of which supports a NREL 5 MW wind turbine. This turbine was used because unlike commercial turbines, all the data and fundamental dimensions are known, and the large diffusion allows comparisons with other projects and publications. Furthermore, despite the growing trend in power ratings in recent years, in the study it is considered a 5 MW turbine for visibility reasons: the island of Pantelleria is rich in scenic beauty and some areas are subject to severe environmental constraints. The use of larger turbines would involved greater visual impact and would require greater distances from the coast; consequently, higher costs associated with the presence of marine cables.
The platform is moored by three catenary lines and it is anchored by three drag-embedded anchors. The length of the moorings has been considered equal to 3 times the sea-depth. The distance between each turbine is 6.5 times the rotor diameter. Two kinds of floating platform would be considered—the Spar-buoy and the Hexafloat—in the configuration optimized by genetic algorithm. As far as the electric grid is concerned, the turbines are connected to the offshore substation by array marine cables. The substation raises the electrical voltage so as to minimize losses and it is connected to the onshore substation through export cables, for the stretch along the sea, and terrestrial cables for the stretch along the coast.
6.3. Capex and Opex Assumptions
The Capital Expenditure (CAPEX) for an offshore wind farm is difficult to define, because of the high number of cost items, often complex to estimate. Based on the currently built projects, like HyWind Scotland and Windfloat, and studies conducted such as that of the Carbon Trust in 2015, the main cost items are relative to turbines and platforms, moorings and anchors, the balance of the system that includes the cost of the electrical grid and connections to shore, and installation. In particular, regarding the costs of the platform, it consists of the material cost multiplied by a form factor, which takes into account the complexity of the structure and the cost of manufacture and it is 1.1 for the spar-buoy design and 1.3 for the Hexafloat design. As moorings, simple catenaries have been considered, connected with drag-embedded anchors. Costs relating to the electrical part, such as marine cables and electrical substations, were obtained from a wind farm project in the Sicily canal, near Marsala, available on the Italian Ministry of the Environment website. The installation cost is higher for the spar design because the assembly of the turbine takes place in open sea and requires the use of large laying vessels; instead, for the semi-submersible concept, the assembly of the turbine on the platform can be done in a dry dock and the structure can be transported on site by simple tugs.
Table 6 illustrates the assumptions made for each Capex item.
Instead, regarding the operational expenditure (OPEX), which include both maintenance and inspection costs and transmission charges, were derived from the following expression from the Carbon Trust [
36], expressed in million Norwegian Kroner per megawatt hour:
6.4. LCOE
The Levelized Cost Of Energy (LCOE) in electrical energy production can be defined as the present value of the price of the produced electrical energy, usually expressed in Euros per megawatt hour, considering the economic life of the plant and the costs incurred in the construction, operation and maintenance. In other words, it is the ratio between the sum of cost over lifetime and the sum of electrical energy produced over lifetime [
38]. The LCOE formula is expressed as
where
I0 is the capital expenditure in m€,
is the annual operating costs in year in m€,
is the produced electricity in the corresponding year in MWh,
i is the weighted average cost of capital in %,
n is the operational lifetime in years, and
t is the individual year of lifetime.
The produced electricity has been obtained from the productivity, estimated from Era5 database, multiplied for the nominal power. Losses were also considered: electrical losses equal to 3.6% of total and aerodynamic losses equal to 10% of total, mainly due to wake effect. Consequently, site A is characterized by 3764 full load hours/year, site B by 3748 full load hours/year, and site C by 3648 full load hours/year. The operational lifetime is 25 years, while for the WACC an 8% value has been considered, as suggested from The Offshore Wind Outlook 2019 [
2].
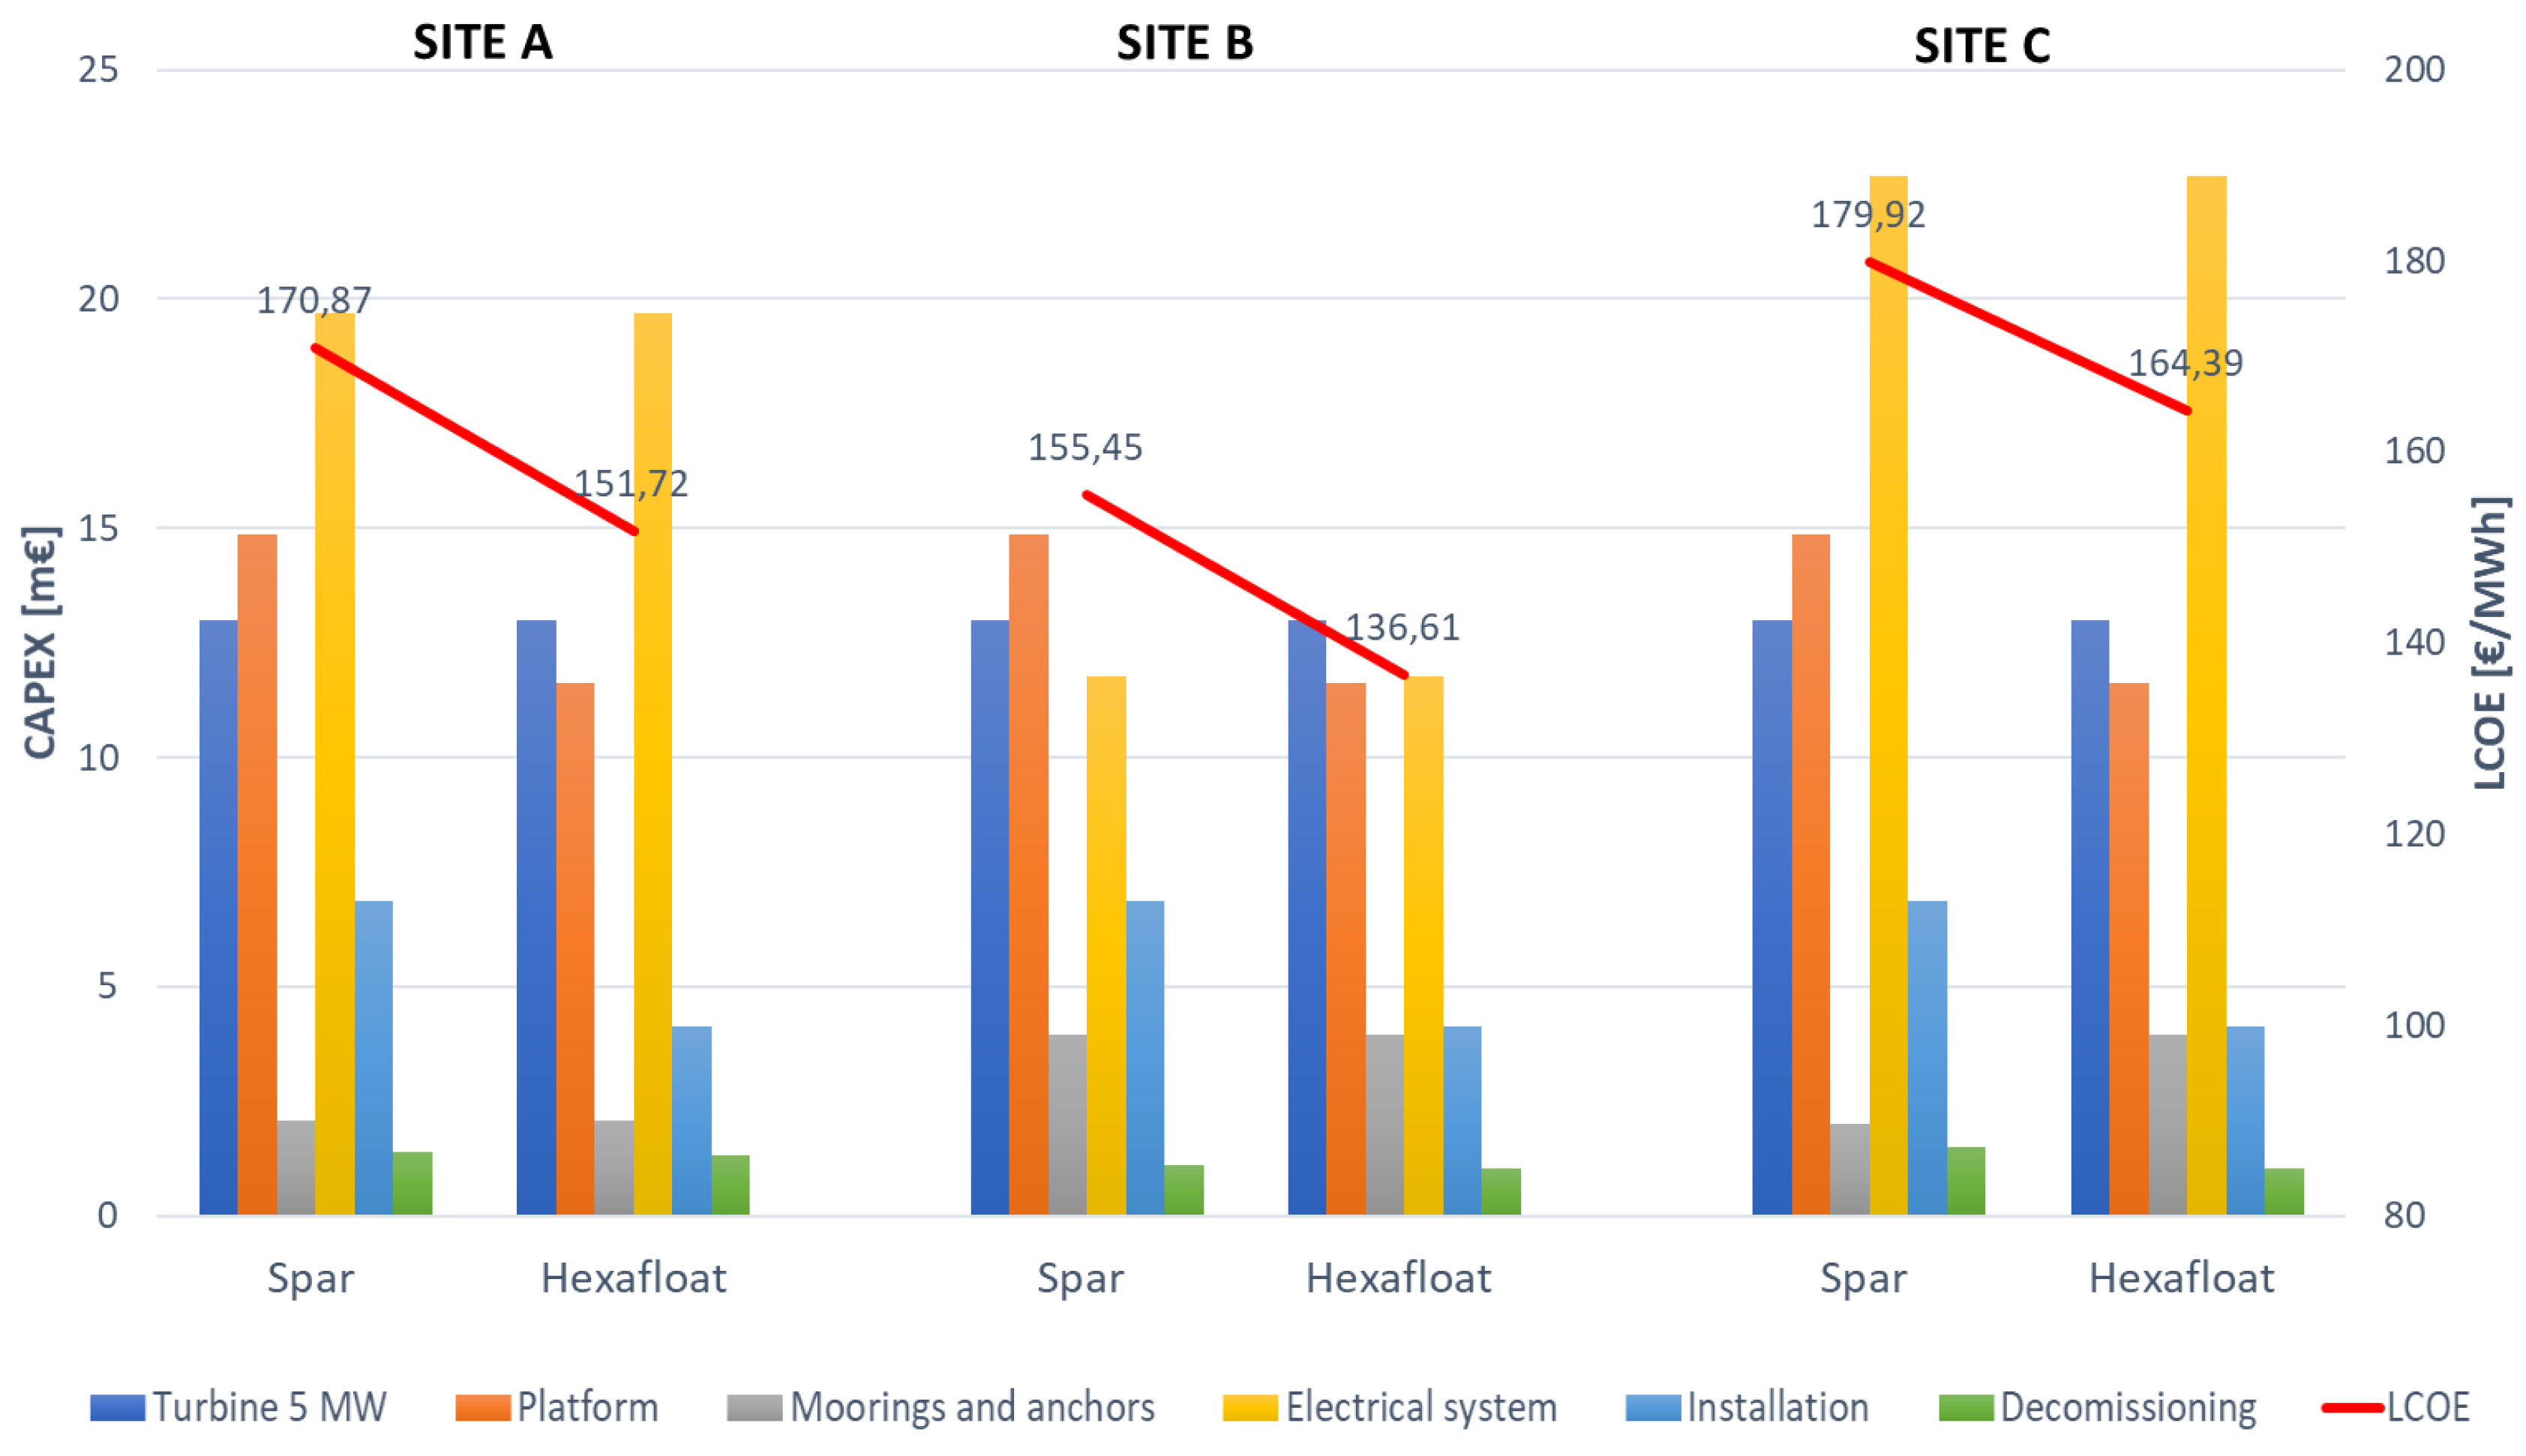
In the following
Figure 17, the main results about Capex and LCOE are reported.
Regarding site A, which is 21.5 km far from the cost, the most relevant cost item is the electrical system for both platforms. Moreover, the most competitive platform is the Hexafloat, and it is economically more convenient for the platform material and installation costs than the spar-buoy. This is also true for the site B: in this case, the electrical system cost is inferior because it is only 8.5 km far from the coast and marine cables are less impacting in total Capex. Finally, site C has a greater LCOE among the three sites, as it is similar to site A for the depth of the sea, but has a greater distance from the coast.
Overall, the value of the LCOE is quite high when compared with other offshore wind projects, as reported in [
36]. This is mainly related to two different aspects:
the presence of very high fixed costs, related to electrical system and cables, and
the use of only two wind turbines, which do not allow amortization of fixed costs.


