Quantifying Economic Value of Coastal Ecosystem Services: A Review

 ,
,
Abstract
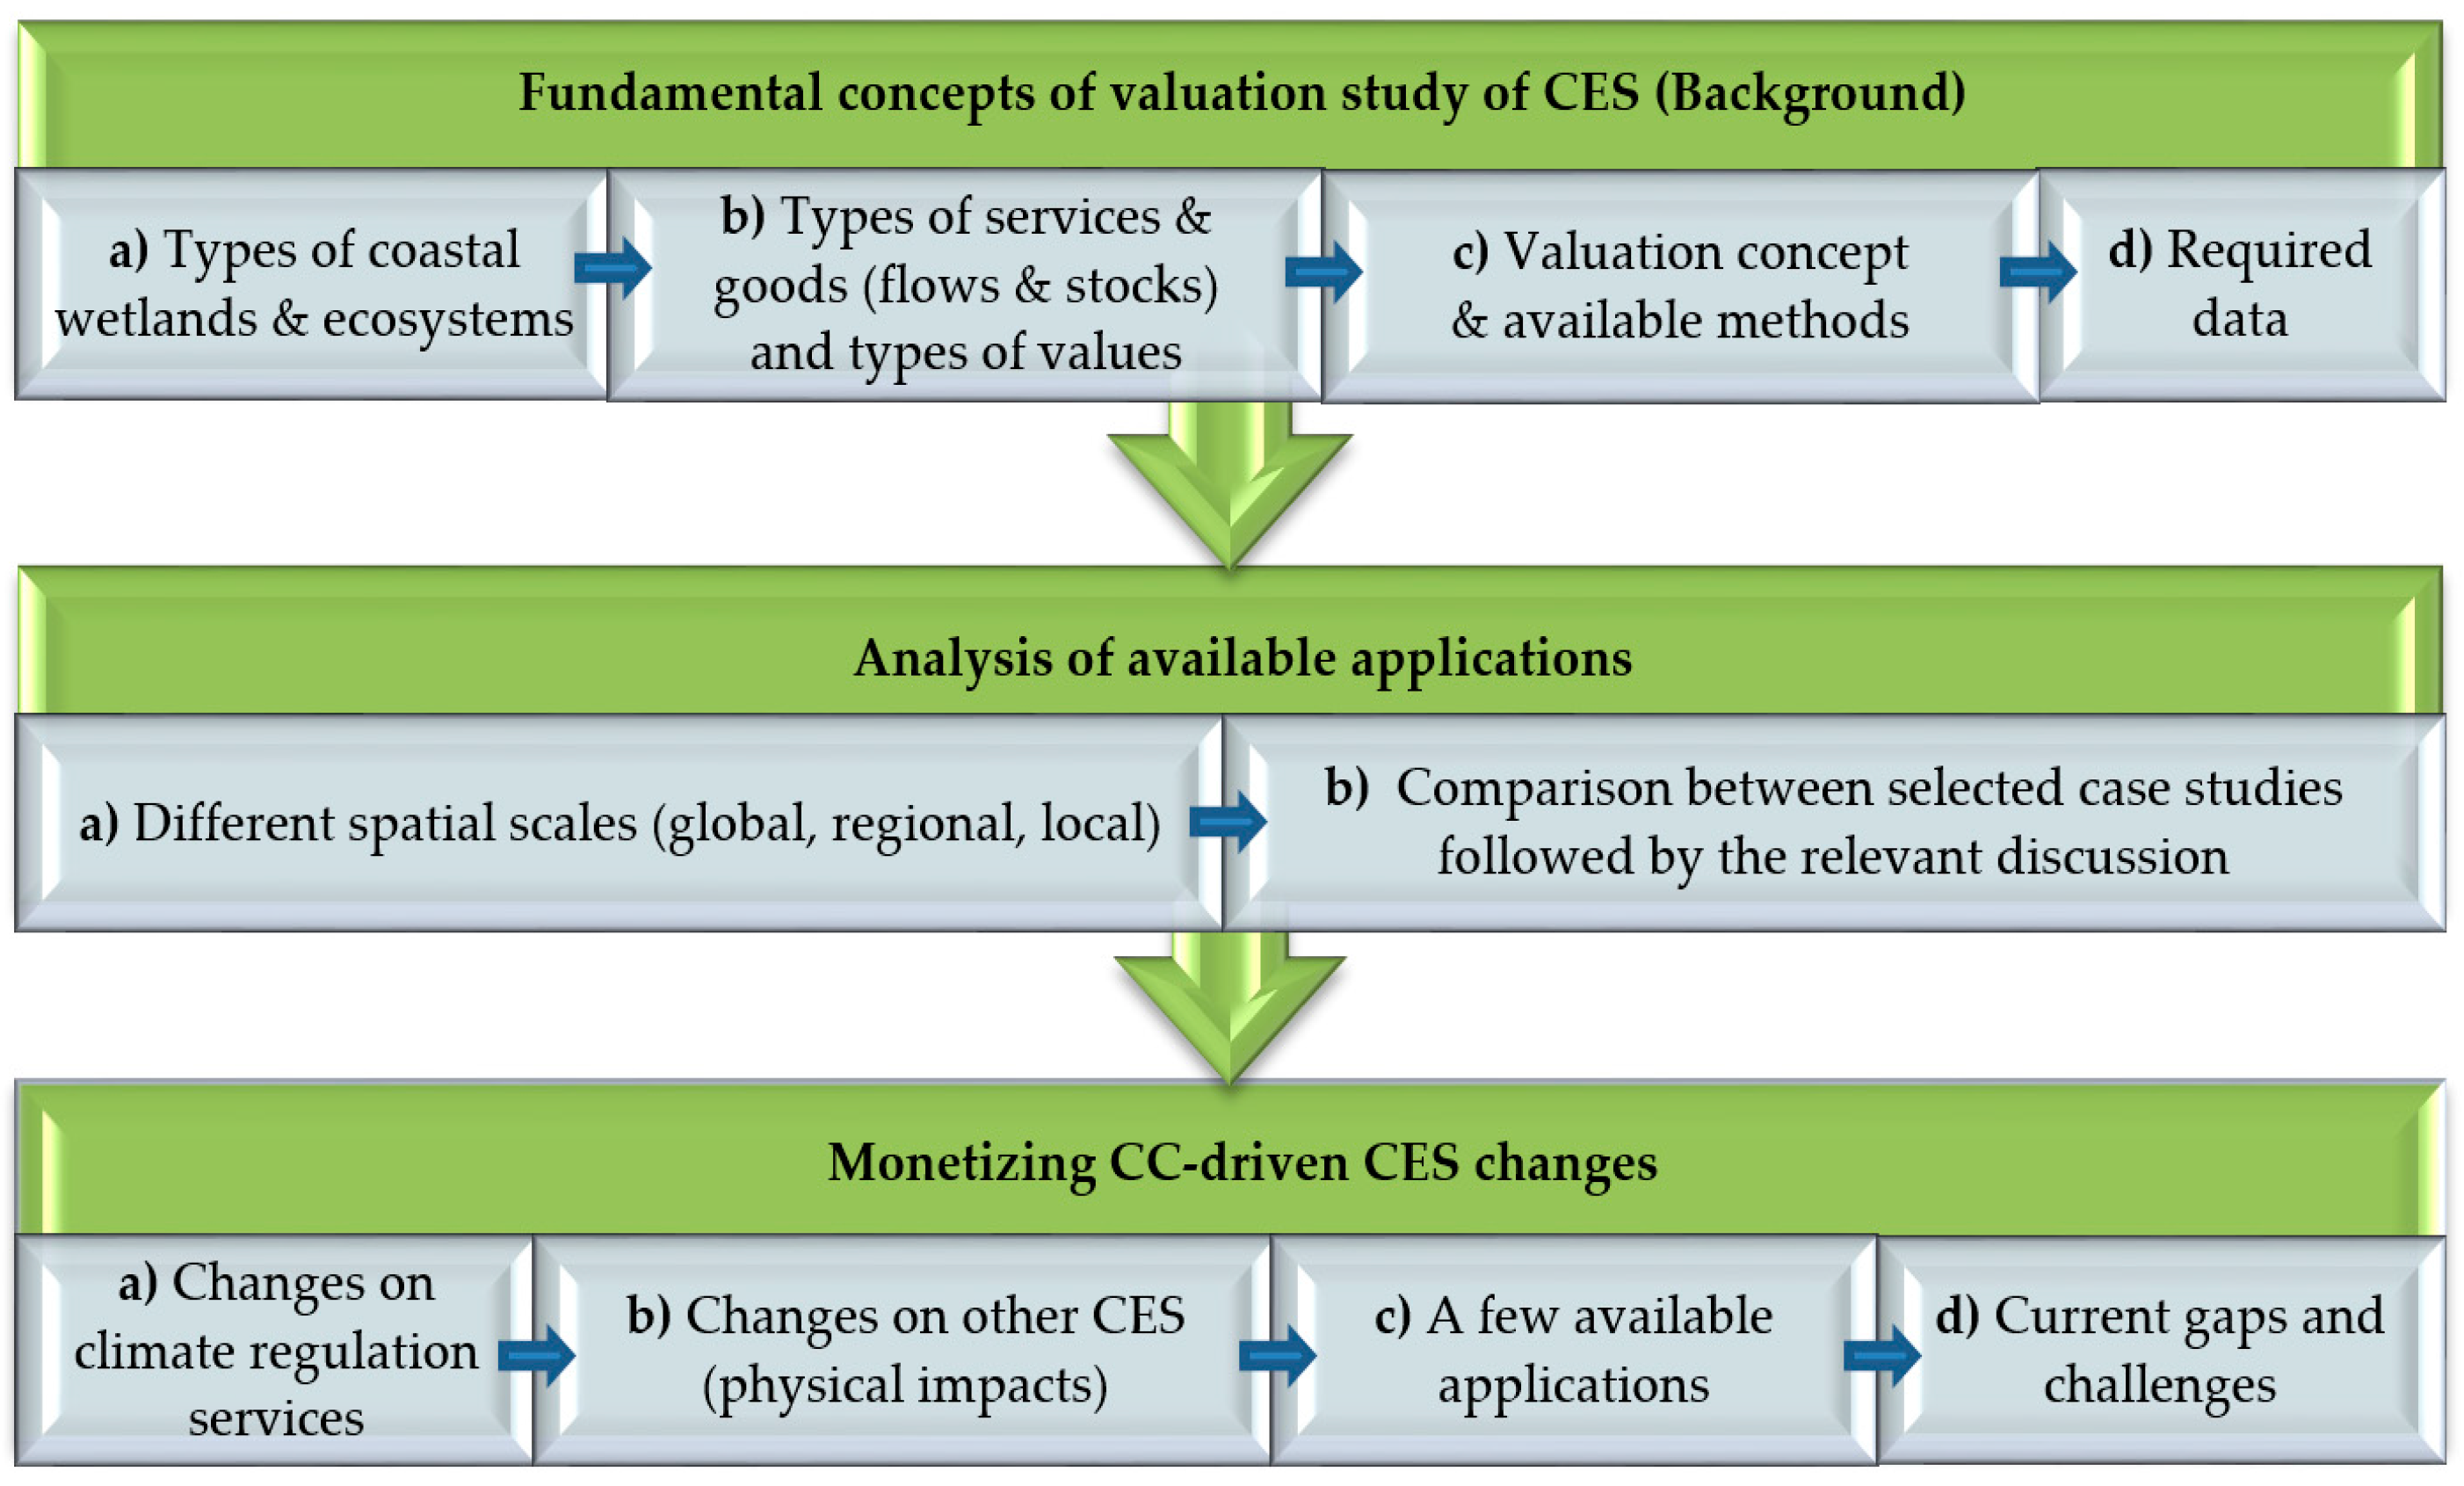
:1. Introduction
2. Background
2.1. Coastal Wetlands, Ecosystems, Services and Goods
2.2. Valuation of Ecosystem Services
2.2.1. Valuation Methods
2.2.2. Required Data
3. Analysis of the Available Valuation Studies—Selected Sample
3.1. Local and Regional Scale Applications
3.2. Global Scale Applications
3.3. Discussion
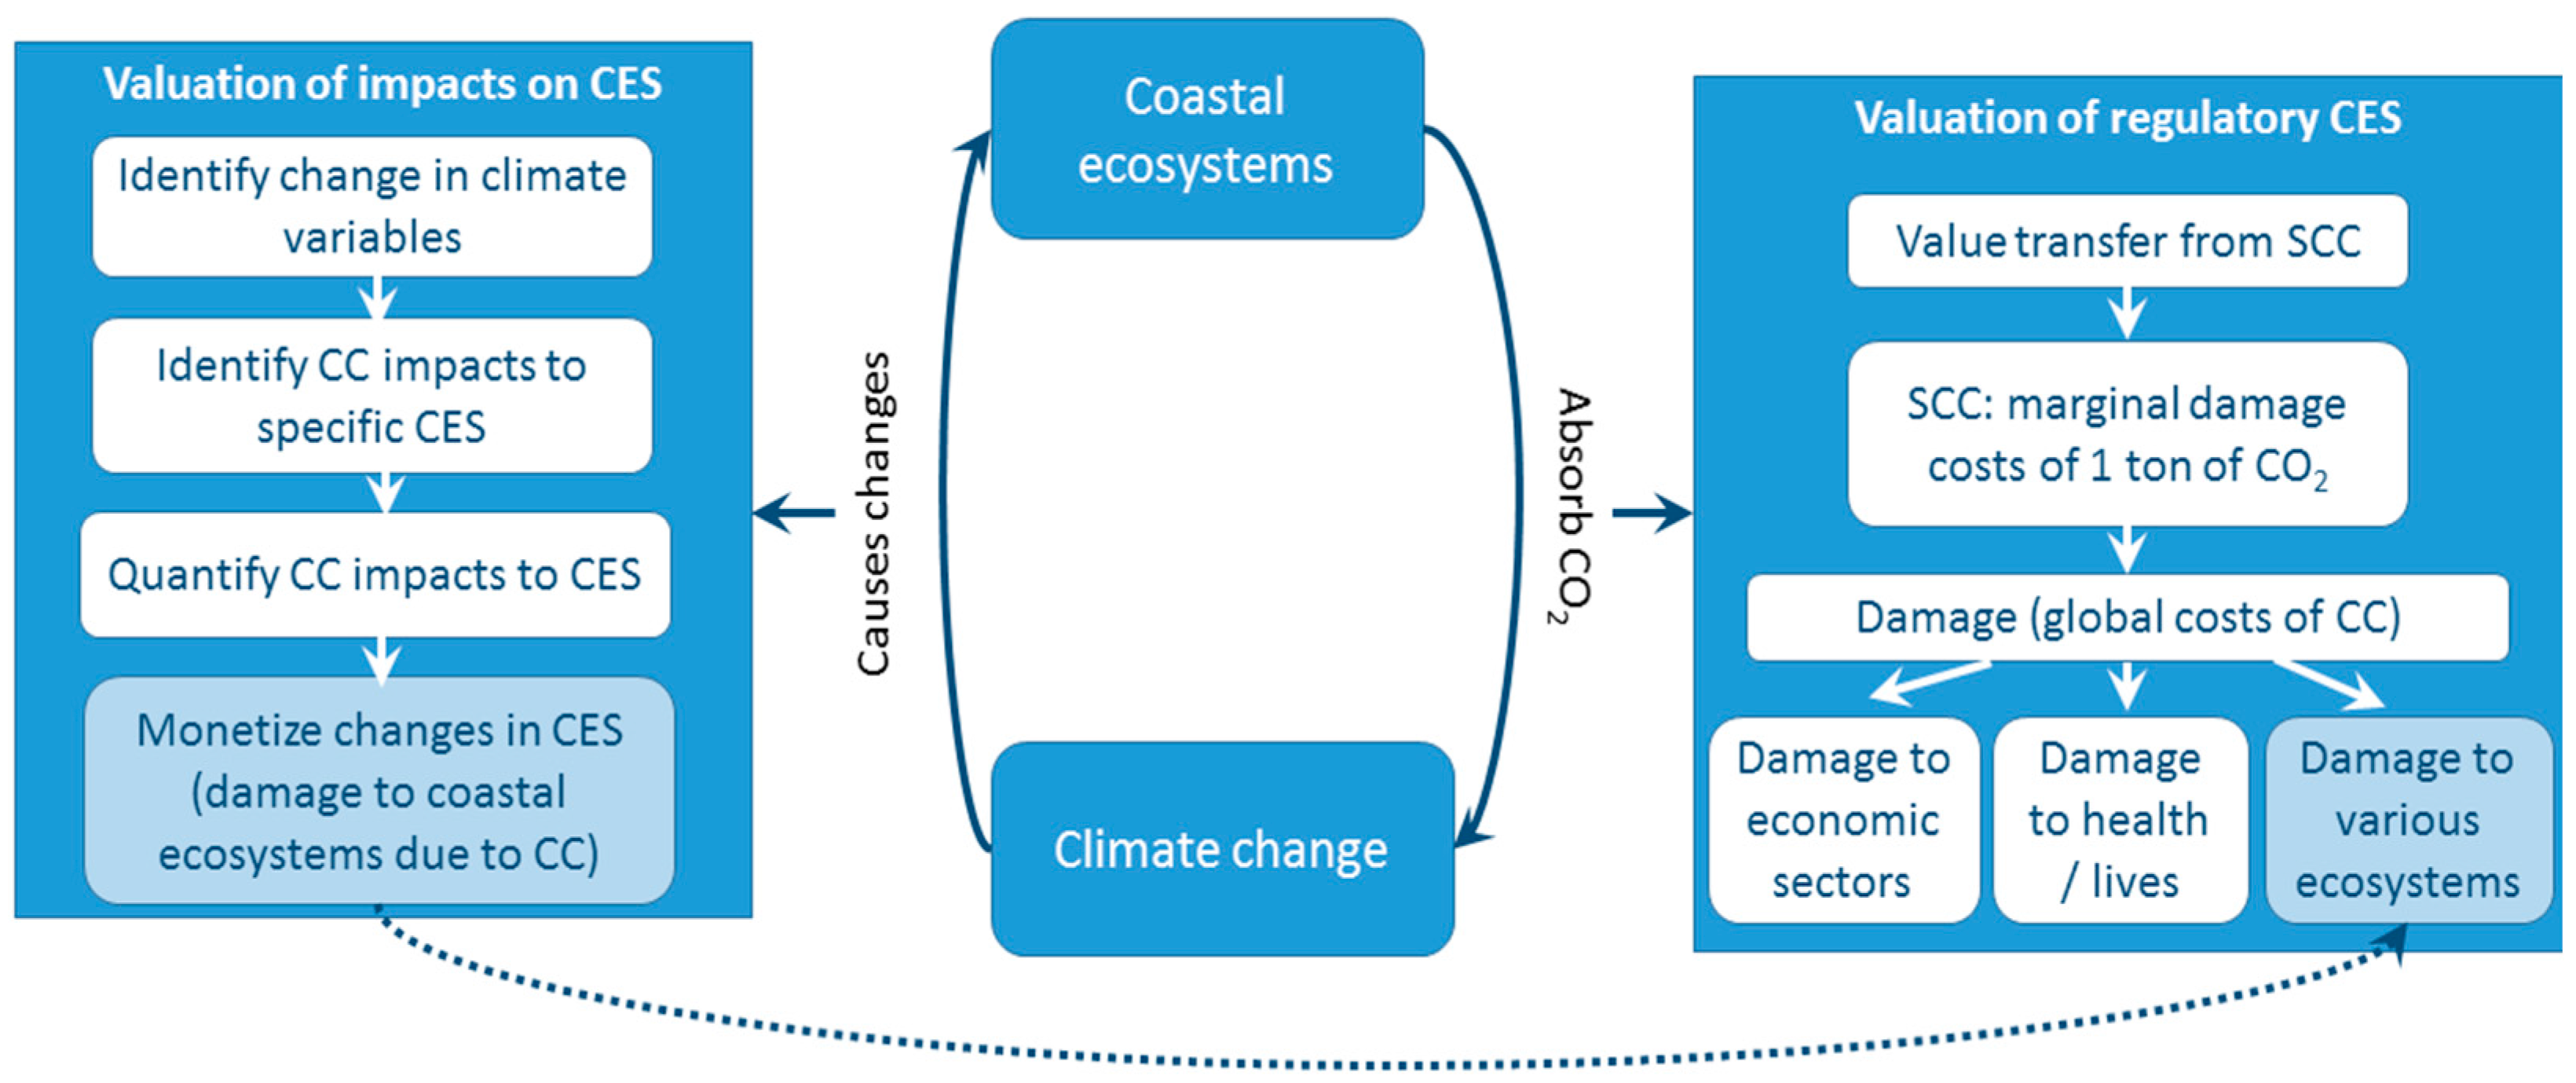
4. Coastal Ecosystems and Climate Change Impacts: Monetizing Changes in the Value of Ecosystem Services
4.1. CC Link with Climate Regulation Service
4.2. CC Driven Changes on CES
5. Concluding Remarks
Acknowledgments
Author Contributions
Conflicts of Interest
References
- Neumann, B.; Vafeidis, A.T.; Zimmermann, J.; Nicholls, R.J. Future coastal population growth and exposure to sea-level rise and coastal flooding-a global assessment. PLoS ONE 2015, 10, e0118571. [Google Scholar] [CrossRef] [PubMed]
- Barbier, E.B. Valuing ecosystem services for coastal wetland protection and restoration: Progress and challenges. Resources 2013, 2, 213–230. [Google Scholar] [CrossRef]
- Assessment, M.E. Ecosystems and Human Well-Being: Wetlands and Water Synthesis; World Resources Institute: Washington, DC, USA, 2005; Volume 5. [Google Scholar]
- Bierbaum, R.M.; Fay, M.; Ross-Larson, B. World Development Report 2010: Development and Climate Change; World Bank Group: Washington, DC, USA, 2009. [Google Scholar]
- Ranasinghe, R. Assessing climate change impacts on open sandy coasts: A review. Earth Sci. Rev. 2016, 160, 320–332. [Google Scholar] [CrossRef]
- Pachauri, R.K.; Allen, M.R.; Barros, V.R.; Broome, J.; Cramer, W.; Christ, R.; Church, J.A.; Clarke, L.; Dahe, Q.; Dasgupta, P. Climate Change 2014: Synthesis Report. Contribution of Working Groups I, II and III to the Fifth Assessment Report of the Intergovernmental Panel on Climate Change; IPCC: Geneva, Switzerland, 2014; p. 151. ISBN 978-92-9169-143-2. [Google Scholar]
- Leemans, R.; de Groot, R.S. Millennium Ecosystem Assessment: Ecosystems and Human Well-Being: A Framework for Assessment; Island Press: Washington, DC, USA, 2003. [Google Scholar]
- Braat, L.C.; de Groot, R. The ecosystem services agenda: Bridging the worlds of natural science and economics, conservation and development, and public and private policy. Ecosyst. Serv. 2012, 1, 4–15. [Google Scholar] [CrossRef]
- Lew, D.K.; Larson, D.M. Is a fish in hand worth two in the sea? Evidence from a stated preference study. Fish. Res. 2014, 157, 124–135. [Google Scholar] [CrossRef]
- Castaño-Isaza, J.; Newball, R.; Roach, B.; Lau, W.W. Valuing beaches to develop payment for ecosystem services schemes in colombia’s seaflower marine protected area. Ecosyst. Serv. 2015, 11, 22–31. [Google Scholar] [CrossRef]
- Emerton, L.; Kekulandala, L. Assessment of the Economic Value of Muthurajawela Wetland; Occasional Papers of IUCN Sri Lanka; IUCN-World Conservation uNion, Sri Lanka Country Office: Colombo, Sri Lanka, 2003; Volume 4. [Google Scholar]
- Hussain, S.A.; Badola, R. Valuing mangrove ecosystem services: Linking nutrient retention function of mangrove forests to enhanced agroecosystem production. Wetl. Ecol. Manag. 2008, 16, 441–450. [Google Scholar] [CrossRef]
- Vo, T.Q.; Künzer, C.; Oppelt, N. How remote sensing supports mangrove ecosystem service valuation: A case study in ca mau province, Vietnam. Ecosyst. Serv. 2015, 14, 67–75. [Google Scholar]
- Chaikumbung, M.; Doucouliagos, H.; Scarborough, H. The economic value of wetlands in developing countries: A meta-regression analysis. Ecol. Econ. 2016, 124, 164–174. [Google Scholar] [CrossRef]
- Rao, N.S.; Ghermandi, A.; Portela, R.; Wang, X. Global values of coastal ecosystem services: A spatial economic analysis of shoreline protection values. Ecosyst. Serv. 2015, 11, 95–105. [Google Scholar] [CrossRef]
- Costanza, R.; d’Arge, R.; de Groot, R.; Faber, S.; Grasso, M.; Hannon, B.; Limburg, K.; Naeem, S.; O’neill, R.V.; Paruelo, J. The value of the world’s ecosystem services and natural capital. Nature 1997, 387, 253–260. [Google Scholar] [CrossRef]
- Martínez, M.; Intralawan, A.; Vázquez, G.; Pérez-Maqueo, O.; Sutton, P.; Landgrave, R. The coasts of our world: Ecological, economic and social importance. Ecol. Econ. 2007, 63, 254–272. [Google Scholar] [CrossRef]
- Costanza, R.; de Groot, R.; Sutton, P.; van der Ploeg, S.; Anderson, S.J.; Kubiszewski, I.; Farber, S.; Turner, R.K. Changes in the global value of ecosystem services. Glob. Environ. Chang. 2014, 26, 152–158. [Google Scholar] [CrossRef]
- Hassan, R.; Scholes, R.; Ash, N. Ecosystems and Human Well-Being: Current State and Trends, vol 1. Findings of the Condition and Trends Working Group of the Millennium Ecosystem Assessment; Island Press: Washington, DC, USA, 2005. [Google Scholar]
- Barbier, E.B.; Acreman, M.; Knowler, D. Economic Valuation of Wetlands: A Guide for Policy Makers and Planners; Ramsar Convention Bureau: Gland, Switzerland, 1997. [Google Scholar]
- Barbier, E.B. Valuing environmental functions: Tropical wetlands. Land Econ. 1994, 70, 155–173. [Google Scholar] [CrossRef]
- Tinch, R.; Mathieu, L. Marine and Coastal Ecosystem Services: Valuation Methods and Their Practical Application; Biodiversity Series; UNEP-WCMC: Cambridge, UK, 2011. [Google Scholar]
- Cesar, H.S. Coral reefs: Their functions, threats and economic value. In Collected Essays on the Economics of Coral Reefs; Cesar, H.S.J., Ed.; CORDIO, Department of Biology and Environmental Sciences, Kalmar University: Kalmar, Sweden, 2000; pp. 14–39. [Google Scholar]
- Barbier, E.B.; Hacker, S.D.; Kennedy, C.; Koch, E.W.; Stier, A.C.; Silliman, B.R. The value of estuarine and coastal ecosystem services. Ecol. Monogr. 2011, 81, 169–193. [Google Scholar] [CrossRef]
- Dluzewska, A. Cultural ecosystem services-framework, theories and practices. Probl. Sustain. Dev. 2016, 12, 101–110. [Google Scholar]
- Chen, N.; Li, H.; Wang, L. A gis-based approach for mapping direct use value of ecosystem services at a county scale: Management implications. Ecol. Econ. 2009, 68, 2768–2776. [Google Scholar] [CrossRef]
- Hein, L.; Van Koppen, K.; de Groot, R.S.; Van Ierland, E.C. Spatial scales, stakeholders and the valuation of ecosystem services. Ecol. Econ. 2006, 57, 209–228. [Google Scholar] [CrossRef]
- Sukhdev, P.; Wittmer, H.; Miller, D. The economics of ecosystems and biodiversity (teeb): Challenges and responses. In Nature in the Balance: The Economics of Biodiversity; Oxford University Press: Oxford, UK, 2014; pp. 135–152. [Google Scholar]
- Van Beukering, P.; Haider, W.; Longland, M.; Cesar, H.; Sablan, J.; Shjegstad, S.; Beardmore, B.; Liu, Y.; Garces, G.O. The economic value of guam’s coral reefs. Univ. Guam Mar. Lab. Tech. Rep. 2007, 116, 102. [Google Scholar]
- Ecosystem Valuation. Available online: http://www.ecosystemvaluation.org/ (accessed on 24 January 2017).
- Bateman, I.J.; Mace, G.M.; Fezzi, C.; Atkinson, G.; Turner, K. Economic analysis for ecosystem service assessments. Environ. Resour. Econ. 2011, 48, 177–218. [Google Scholar] [CrossRef]
- Russi, D.; ten Brink, P.; Farmer, A.; Badura, T.; Coates, D.; Förster, J.; Kumar, R.; Davidson, N. The Economics of Ecosystems and Biodiversity for Water and Wetlands; IEEP: London, UK; Brussels, Belgium, 2013. [Google Scholar]
- Champ, P.A.; Boyle, K.J.; Brown, T.C. The Economics of Non-Market Goods and Resources, a Primer on Nonmarket Valuation Second Edition; Springer: Dordrecht, The Netherlands, 2017; Volume 13. [Google Scholar]
- Richardson, L.; Loomis, J.; Kroeger, T.; Casey, F. The role of benefit transfer in ecosystem service valuation. Ecol. Econ. 2015, 115, 51–58. [Google Scholar] [CrossRef]
- Aburto-Oropeza, O.; Ezcurra, E.; Danemann, G.; Valdez, V.; Murray, J.; Sala, E. Mangroves in the gulf of california increase fishery yields. Proc. Natl. Acad. Sci. USA 2008, 105, 10456–10459. [Google Scholar] [CrossRef] [PubMed] [Green Version]
- Barbier, E.B.; Koch, E.W.; Silliman, B.R.; Hacker, S.D.; Wolanski, E.; Primavera, J.; Granek, E.F.; Polasky, S.; Aswani, S.; Cramer, L.A. Coastal ecosystem-based management with nonlinear ecological functions and values. Science 2008, 319, 321–323. [Google Scholar] [CrossRef] [PubMed]
- Koch, E.W.; Barbier, E.B.; Silliman, B.R.; Reed, D.J.; Perillo, G.M.; Hacker, S.D.; Granek, E.F.; Primavera, J.H.; Muthiga, N.; Polasky, S. Non-linearity in ecosystem services: Temporal and spatial variability in coastal protection. Front. Ecol. Environ. 2009, 7, 29–37. [Google Scholar] [CrossRef]
- De Groot, R.; Brander, L.; Van Der Ploeg, S.; Costanza, R.; Bernard, F.; Braat, L.; Christie, M.; Crossman, N.; Ghermandi, A.; Hein, L. Global estimates of the value of ecosystems and their services in monetary units. Ecosyst. Serv. 2012, 1, 50–61. [Google Scholar] [CrossRef]
- Mathieu, L.F.; Langford, I.H.; Kenyon, W. Valuing marine parks in a developing country: A case study of the seychelles. Environ. Dev. Econ. 2003, 8, 373–390. [Google Scholar] [CrossRef]
- Wilkinson, C.; Lindén, O.; Cesar, H.; Hodgson, G.; Rubens, J.; Strong, A.E. Ecological and socioeconomic impacts of 1998 coral mortality in the indian ocean: An enso impact and a warning of future change? Ambio 1999, 28, 188–196. [Google Scholar]
- Seenprachawong, U. An economic analysis of coral reefs in the andaman sea of thailand. In Marine and Coastal Ecosystem Valuation, Institutions, and Policy in Southeast Asia; Springer: Singapor, 2016; pp. 31–45. [Google Scholar]
- Schep, S.; van Beukering, P.; Brander, L.; Wolfs, E. The Tourism Value of Nature on Bonaire Using Choice Modelling and Value Mapping; IVM Institute for Environmental Studies: Amsterdam, The Netherlands, 2013. [Google Scholar]
- Berg, H.; Öhman, M.C.; Troëng, S.; Lindén, O. Environmental economics of coral reef destruction in sri lanka. Ambio 1998, 27, 627–634. [Google Scholar]
- Burke, L.; Maidens, J. Reefs at Risk in the Caribbean; World Resources Institute: Washington, DC, USA, 2004. [Google Scholar]
- Van Zanten, B.; van Beukering, P. Coastal Protection Services of Coral Reefs in Bonaire, Economic Values and Spatial Maps; IVM Institute for Environmental Studies: Amsterdam, The Netherlands, 2012. [Google Scholar]
- Burke, L.; Greenhalgh, S.; Prager, D.; Cooper, E. Coastal Capital: Economic Valuation of Coral Reefs in Tobago and st. Lucia; World Resources Institute (WRI): Washington, DC, USA, 2008. [Google Scholar]
- Barbier, E.B. Valuing ecosystem services as productive inputs. Econ. Policy 2007, 22, 178–229. [Google Scholar] [CrossRef]
- Das, S.; Crépin, A.-S. Mangroves can provide protection against wind damage during storms. Estuar. Coast. Shelf Sci. 2013, 134, 98–107. [Google Scholar] [CrossRef]
- Brander, L.M.; Wagtendonk, A.J.; Hussain, S.S.; McVittie, A.; Verburg, P.H.; de Groot, R.S.; van der Ploeg, S. Ecosystem service values for mangroves in southeast asia: A meta-analysis and value transfer application. Ecosyst. Serv. 2012, 1, 62–69. [Google Scholar] [CrossRef]
- Bell, F.W. The economic valuation of saltwater marsh supporting marine recreational fishing in the southeastern united states. Ecol. Econ. 1997, 21, 243–254. [Google Scholar] [CrossRef]
- Molnar, M.; Kocian, M.; Batker, D. Nearshore Natural Capital Valuation. Valuing the Aquatic Benefits of British Columbia’s Lower Mainland; A report; David Suzuki Foundation: Vancouver, BC, Canada, 2012; Earth Economics: Tacoma, WA, USA, 2012; p. 103. [Google Scholar]
- Boero, F.; Briand, F. Price and Value, Alternatives to Biodiversity Conservation (in the Seas); CIESM: Monaco, 2008. [Google Scholar]
- Czajkowski, M.; Ahtiainen, H.; Artell, J.; Budziński, W.; Hasler, B.; Hasselström, L.; Meyerhoff, J.; Nõmmann, T.; Semeniene, D.; Söderqvist, T. Valuing the commons: An international study on the recreational benefits of the baltic sea. J. Environ. Manag. 2015, 156, 209–217. [Google Scholar] [CrossRef] [PubMed]
- Cooper, E.; Burke, L.; Bood, N. Coastal Capital: Belize-The Economic Contribution of Belize’s Coral Reefs and Mangroves; WRI Working Paper; World Resource Institute: Washington, DC, USA, 2009; p. 53. [Google Scholar]
- Van Beukering, P.; Wolfs, E. Essays on Economic Values of Nature of Bonaire. A Desk Study; IVM Report (W12-14); Institute for Environmental Studies, VU University Amsterdam: Amsterdam, The Netherlands, 2012. [Google Scholar]
- Gibbons, S.; Mourato, S.; Resende, G.M. The amenity value of english nature: A hedonic price approach. Environ. Resour. Econ. 2014, 57, 175–196. [Google Scholar] [CrossRef] [Green Version]
- Grimm, N.B.; Groffman, P.; Staudinger, M.; Tallis, H. Climate change impacts on ecosystems and ecosystem services in the united states: Process and prospects for sustained assessment. Clim. Chang. 2016, 135, 97–109. [Google Scholar] [CrossRef]
- Shaw, M.R.; Pendleton, L.; Cameron, D.R.; Morris, B.; Bachelet, D.; Klausmeyer, K.; MacKenzie, J.; Conklin, D.R.; Bratman, G.N.; Lenihan, J. The impact of climate change on california’s ecosystem services. Clim. Chang. 2011, 109, 465–484. [Google Scholar] [CrossRef] [Green Version]
- Vierros, M. Communities and blue carbon: The role of traditional management systems in providing benefits for carbon storage, biodiversity conservation and livelihoods. Clim. Chang. 2017, 140, 89–100. [Google Scholar] [CrossRef]
- Jerath, M.; Bhat, M.; Rivera-Monroy, V.H.; Castañeda-Moya, E.; Simard, M.; Twilley, R.R. The role of economic, policy, and ecological factors in estimating the value of carbon stocks in everglades mangrove forests, south florida, USA. Environ. Sci. Policy 2016, 66, 160–169. [Google Scholar] [CrossRef]
- Greenstone, M.; Kopits, E.; Wolverton, A. Developing a social cost of carbon for US regulatory analysis: A methodology and interpretation. Rev. Environ. Econ. Policy 2013, 7, 23–46. [Google Scholar] [CrossRef]
- Hallegatte, S.; Mach, K.J. Make climate-change assessments more relevant. Nature 2016, 534, 613–615. [Google Scholar] [CrossRef] [PubMed]
- Burke, M.; Craxton, M.; Kolstad, C.; Onda, C.; Allcott, H.; Baker, E.; Barrage, L.; Carson, R.; Gillingham, K.; Graff-Zivin, J. Opportunities for advances in climate change economics. Science 2016, 352, 292–293. [Google Scholar] [CrossRef] [PubMed]
- Lane, D.; Jones, R.; Mills, D.; Wobus, C.; Ready, R.C.; Buddemeier, R.W.; English, E.; Martinich, J.; Shouse, K.; Hosterman, H. Climate change impacts on freshwater fish, coral reefs, and related ecosystem services in the united states. Clim. Chang. 2015, 131, 143–157. [Google Scholar] [CrossRef]
- Turner, R.K.; Palmieri, M.G.; Luisetti, T. Lessons from the construction of a climate change adaptation plan: A broads wetland case study. Integr. Environ. Assess. Manag. 2016, 12, 719–725. [Google Scholar] [CrossRef] [PubMed]
- Kuhfuss, L.; Rey-Valette, H.; Sourisseau, E.; Heurtefeux, H.; Rufray, X. Evaluating the impacts of sea level rise on coastal wetlands in languedoc-roussillon, france. Environ. Sci. Policy 2016, 59, 26–34. [Google Scholar] [CrossRef]
- Daw, T.; Adger, W.N.; Brown, K.; Badjeck, M.-C. Climate change and capture fisheries: Potential impacts, adaptation and mitigation. Climate change implications for fisheries and aquaculture: Overview of current scientific knowledge. FAO Fish. Aquac. Tech. Pap. 2009, 530, 107–150. [Google Scholar]
- Cochrane, K.; De Young, C.; Soto, D.; Bahri, T. Climate change implications for fisheries and aquaculture. FAO Fish. Aquac. Tech. Pap. 2009, 530, 212. [Google Scholar]
- Sumaila, U.R.; Cheung, W.W.; Lam, V.W.; Pauly, D.; Herrick, S. Climate change impacts on the biophysics and economics of world fisheries. Nat. Clim. Chang. 2011, 1, 449–456. [Google Scholar] [CrossRef]
- Mohanty, B.; Sharma, A.; Sahoo, J.; Mohanty, S. Climate Change: Impacts on Fisheries and Aquaculture; INTECH Open Access Publisher: Rijeka, Croatia, 2010. [Google Scholar]
- MAB (Multi-Agency Brief). Fisheries and Aquaculture in a Changing Climate; FAO: Rome, Italy, 2009; p. 6. [Google Scholar]
- Portner, H.O.; Knust, R. Climate change affects marine fishes through the oxygen limitation of thermal tolerance. Science 2007, 315, 95–97. [Google Scholar] [CrossRef] [PubMed]
- McLeod, E.; Salm, R.V. Managing Mangroves for Resilience to Climate Change; World Conservation Union (IUCN): Gland, Switzerland, 2006. [Google Scholar]
- Field, C.D. Impact of Expected Climate Change on Mangroves. In Asia-Pacific Symposium on Mangrove Ecosystems; Springer: Dordrecht, The Netherlands, 1995; pp. 75–81. [Google Scholar]
- Snedaker, S.C. Mangroves and climate change in the florida and caribbean region: Scenarios and hypotheses. In Asia-Pacific Symposium on Mangrove Ecosystems; Springer: Dordrecht, The Netherlands, 1995; pp. 43–49. [Google Scholar]
- Cheung, W.W.; Dunne, J.; Sarmiento, J.L.; Pauly, D. Integrating ecophysiology and plankton dynamics into projected maximum fisheries catch potential under climate change in the northeast atlantic. ICES J. Mar. Sci. 2011, 68, 1008–1018. [Google Scholar] [CrossRef]
- Sumaila, U.R.; Cheung, W.W. Cost of Adapting Fisheries to Climate Change; World Bank Discussion Paper; World Bank: Washington, DC, USA, 2010. [Google Scholar]
- Kragt, M.E.; Roebeling, P.C.; Ruijs, A. Effects of great barrier reef degradation on recreational reef-trip demand: A contingent behaviour approach. Aust. J. Agric. Resour. Econ. 2009, 53, 213–229. [Google Scholar] [CrossRef]
- Fanning, A.L. Towards valuing climate change impacts on the ecosystem services of a uruguayan coastal lagoon. In International Perspectives on Climate Change; Springer: Cham, Switzerland, 2014; pp. 61–77. [Google Scholar]
- Roebeling, P.; Costa, L.; Magalhães-Filho, L.; Tekken, V. Ecosystem service value losses from coastal erosion in europe: Historical trends and future projections. J. Coast. Conserv. 2013, 17, 389–395. [Google Scholar] [CrossRef]


| Use Values | Non-Use Values | |
|---|---|---|
| Direct Values | Indirect Values | Existence and Bequest Values |
| Food, fiber and raw materials provision | Flood control | Cultural heritage and spiritual benefits |
| Transport | Storm protection, wave attenuation | Resources for future generations |
| Water supply | CC impacts mitigation | Biodiversity |
| Recreation and tourism | Contaminant storage, detoxification | |
| Wild resources | Shoreline stabilization/erosion control | |
| Genetic material | Nursery and habitat for fishes and other marine species | |
| Educational opportunity | Nutrient retention and cycling | |
| Aesthetic | Regulation of water flow, water filtration | |
| Art | Source of food for sea organisms | |
| Climate regulation, primary productivity as Oxygen production and CO2 absorption, Carbon sequestration etc. | ||
| Coastal Ecosystem | Direct Use Value | Indirect Use Value |
|---|---|---|
| Mangrove forests | Raw material (wood production), aesthetic, educational opportunities, artistic value | CC impact mitigation, storm protection and wave attenuation, shoreline stabilization and erosion control, flood control, nursery and habitat for fishes and other marine species, regulation of water flow and filtration, carbon sequestration, oxygen production and CO2 absorption, contaminant storage and detoxification |
| Coral reefs | Aesthetic, recreation and tourism (snorkeling), educational opportunities, artistic value, raw material for building, jewelry and aquarium trade | Nursery and habitat for fishes and other marine species, wave attenuation and shoreline stabilization, nitrogen fixation |
| Sea-grass beds | Aesthetic, contribution to recreation and tourism (snorkeling) | Nursery and habitat for fishes and other marine species, source of food for sea organisms, shoreline stabilization and erosion control, primary productivity as oxygen production and CO2 absorption, water filtration |
| Beach and dune systems | Recreation and tourism, fiber and raw material (wood source) provided by the dune vegetation, aesthetic value, artistic value | Flood control, erosion control, nursery for some marine species (turtles) |
| Pelagic systems | Food source, aesthetic value, tourism services, artistic value | Source of food for sea organisms, nursery and habitat for fishes and other marine species |
| Valuation Method | Description | Coastal Ecosystem Services and Goods | |
|---|---|---|---|
| Revealed preference methods (use-value) | Production-based (net factor income) | Often used to value the ecosystem services that contribute to the production of commercially marketed goods | Regulating services such as oxygen production, CO2 absorption, nitrogen fixation and carbon storage, providing fish nurseries, water purification, coastal protection |
| Hedonic pricing | Commonly used to value the environmental services contributing to amenities. Property’s price often represents the amenity value of ecosystems | Tourism and recreation, aesthetic, improving air quality | |
| Travel cost | Basically considers the travel costs paid by tourists and visitors to the environmental value of a recreation site | Tourism and recreation, recreational fishery and water sports | |
| Damage avoided cost, replacement cost | Based on either the cost that people are willing to pay to avoid damages or lost services, the cost of replacing services or the cost paid for substitute services providing the same functions and benefits | Buffering CC impacts such as wave attenuation, providing coastal protection against storms and erosion, flood impact reduction, water purification, carbon storage | |
| Stated preference methods (both use and non-use value) | Contingent valuation (CVM) | The most applied method for both use and non-use values, based on surveys asking people their willingness to pay (WTP) to obtain an ecosystem service | Tourism and recreation, recreational fishery and water sports, aesthetic value, cultural and spiritual value, art value, educational value |
| Contingent choice (CCM) | WTP is stated based on choices between different hypothetical scenarios of ecosystem conditions | ||
| Market price | Often used for the ecosystem products that are explicitly traded in the market | Fiber, wood and sea food provision, raw material for building, and aquarium | |
| Benefit transfer | It transfers available data from previous valuation studies for a similar application | Mostly applied for gross value of coastal ecosystems associated with recreation | |
| Reference | Valuation Method/s | Ecosystem Service/Good | Estimated Value |
|---|---|---|---|
| [39] | Stated preference | Tourism and recreation (marine national park in Seychelles) | US $88,000 (whole area) |
| [40] | Hedonic property price | Aesthetic (Indian ocean) | US $174 (per hectare) |
| [41] | Travel cost, stated preference | Recreation (Andaman sea of Thailand) | US $205.41 million (per year) |
| [29] | Production-based, avoided damage cost, travel cost, stated preference | Fishery, tourism, biodiversity, amenity, coastal protection (Guam) | US $141 million (per year) |
| [42] | Market price, net factor income, stated preference | Recreational and commercial fishing (Caribbean Netherlands, Bonaire) | US $400,000 and US $700,000 (per year) |
| [43] | Avoided damage cost | Protection to coastal erosion (Sri Lanka) | US $160–172,000 (per km of reef, per year) |
| [44] | Avoided damage cost | Habitat support for fisheries (Caribbean sea) | US $95–140 million (projected by 2015) |
| [44] | Avoided damage cost | Tourism (Caribbean sea) | US $300 million (projected by 2015) |
| [45] | Avoided damage cost | Coastal protection by wave dissipation (Bonaire Island, Caribbean, Netherlands) | US $33,000–70,000 (within 10 years–beyond 10 years) |
| [46] | Avoided damage cost | Coastal protection (Tobago, St. Lucia, (Caribbean) | US $18–33 million, US $28–50 million (annual values) |
| [44] | Replacement, substitute cost | Coastal protection in Caribbean coastline | US $750 million–2.2 billion (annually) |
| Reference | Valuation Methods | Ecosystem Service/Good | Estimated Value |
|---|---|---|---|
| [13] | Market price, replacement cost | Fishery, timber, carbon sequestration and storm protection (Vietnam) | US $3000 (per hectare, per year) |
| [47] | Avoided damage cost | Coastal protection, wood, habitat support for fishery (Thailand) | US $10,158–12,392 (per hectare) |
| [48] | Avoided damage cost | Storm (wind) protection (Odisha region, India) | US $177 (per hectare) (1999 price level) |
| [49] | Benefit transfer (from 48 selected studies) | Fisheries, fuel wood, coastal protection, water quality (Southeast Asia) | (mean) US $4185 (per hectare, per year) (2007 price level) |
| [12] | Replacement cost | Nutrient retention value (India) | US $232 (per hectare) |
| Reference | Ecosystem | Valuation Methods | Ecosystem Service/Good | Estimated Value |
|---|---|---|---|---|
| [11] | Marsh | Avoided damage cost | Flood attenuation (Colombo, Sri Lanka) | US $5 million (per year) |
| [50] | Marsh | Production-based | Habitat support for fisheries (Florida coast) | a. US $6471 (East) b. US $981 (West) (per acre) |
| [10] | Beach and dune system | Stated preference | Tourism (San Andres Island, Colombia) | US $997,468 (annual consumer surplus) |
| [52] | Pelagic system | Avoided damage cost, market price | Food provision (fish) (UK) | £513 million (in 2004) |
| [51] | Pelagic system | Benefit transfer (literature data) | Aesthetic and recreation (British Colombia) | US $23-44 billion (per year) |
| [53] | Pelagic system | Travel cost | Recreation (Baltic Sea) | €15 billion (total annual) |
| [9] | Pelagic system | Stated preference | Food provision (fish) (coast of Southeast Alaska) | US $248–313 Mean value for single-day private boat fishing trips |
| Reference | Ecosystem | Valuation Methods | Ecosystem Service/Good | Estimated Value |
|---|---|---|---|---|
| [55] | Coastal nature | Net factor income | Research opportunity (Bonaire Island, Caribbean) | US $1,240,000–1,485,000 (in 2011) |
| [55] | Coastal nature | Net factor income | Pharmaceutic (Bonaire Island, Caribbean) | US $688,788 (annual) |
| [55] | Coastal nature | Net factor income | Art (Bonaire Island, Caribbean) | US $460,000 (annual) |
| [42] | Coastal nature | Stated preference | Tourism (Bonaire Island, Caribbean) | US $50 million (annual) |
| [56] | Coastal nature | Hedonic property price | Amenity (analysis of 1 million housing transactions) from 1996 to 2008 (UK) | £3700 (moving the bottom 1% postcode to the best 1% postcode (per year) |
| [54] | Coral reef and mangrove | Net factor income, avoided damage cost | a. Tourism b. Fisheries c. Erosion protection (Belize, Caribbean) | a. US $150–196 mil. b. US $14–16 mil. c. US $231–347 mil. (in 2007) |
| [55] | Coral reef and mangrove | Market price | Carbon sequestration (Bonaire Island, Caribbean) | US $290,000 (annual) |
| Coastal Wetlands/Ecosystems | No. of Estimates | Total of Service Mean Value | Total of Median Value | Total of Minimum Value | Total of Maximum Value |
|---|---|---|---|---|---|
| Open ocean | 14 | 491 | 135 | 85 | 1664 |
| Coastal systems | 28 | 28,917 | 26,760 | 26,167 | 42,063 |
| Coastal wetlands | 139 | 193,845 | 12,163 | 300 | 887,828 |
| Coral reefs | 94 | 352,915 | 197,900 | 36,794 | 2,129,122 |
© 2018 by the authors. Licensee MDPI, Basel, Switzerland. This article is an open access article distributed under the terms and conditions of the Creative Commons Attribution (CC BY) license (http://creativecommons.org/licenses/by/4.0/).
Share and Cite
Mehvar, S.; Filatova, T.; Dastgheib, A.; De Ruyter van Steveninck, E.; Ranasinghe, R. Quantifying Economic Value of Coastal Ecosystem Services: A Review. J. Mar. Sci. Eng. 2018, 6, 5. https://doi.org/10.3390/jmse6010005
Mehvar S, Filatova T, Dastgheib A, De Ruyter van Steveninck E, Ranasinghe R. Quantifying Economic Value of Coastal Ecosystem Services: A Review. Journal of Marine Science and Engineering. 2018; 6(1):5. https://doi.org/10.3390/jmse6010005
Chicago/Turabian StyleMehvar, Seyedabdolhossein, Tatiana Filatova, Ali Dastgheib, Erik De Ruyter van Steveninck, and Roshanka Ranasinghe. 2018. "Quantifying Economic Value of Coastal Ecosystem Services: A Review" Journal of Marine Science and Engineering 6, no. 1: 5. https://doi.org/10.3390/jmse6010005