Article

Channel Shallowing as Mitigation of Coastal Flooding

1
Davidson Laboratory, Stevens Institute of Technology, Castle Point on Hudson, Hoboken, NJ 07030, USA
2
Department of Civil and Environmental Engineering, Portland State University, Post Office Box 751, Portland, OR 97207-0751, USA
3
ARCADIS, 630 Plaza Drive, Suite 100, Highlands Ranch, CO 80129, USA
4
Center for International Earth Science Information Networks, Columbia University, PO Box 1000, 61 Route 9W, Palisades, NY 10964, USA
*
Author to whom correspondence should be addressed.
J. Mar. Sci. Eng. 2015, 3(3), 654-673; https://doi.org/10.3390/jmse3030654
Submission received: 4 May 2015 / Revised: 4 May 2015 / Accepted: 6 July 2015 / Published: 21 July 2015
(This article belongs to the Special Issue Coastal Hazards Related to Storm Surge)

Abstract

:
Here, we demonstrate that reductions in the depth of inlets or estuary channels can be used to reduce or prevent coastal flooding. A validated hydrodynamic model of Jamaica Bay, New York City (NYC), is used to test nature-based adaptation measures in ameliorating flooding for NYC’s two largest historical coastal flood events. In addition to control runs with modern bathymetry, three altered landscape scenarios are tested: (1) increasing the area of wetlands to their 1879 footprint and bathymetry, but leaving deep shipping channels unaltered; (2) shallowing all areas deeper than 2 m in the bay to be 2 m below Mean Low Water; (3) shallowing only the narrowest part of the inlet to the bay. These three scenarios are deliberately extreme and designed to evaluate the leverage each approach exerts on water levels. They result in peak water level reductions of 0.3%, 15%, and 6.8% for Hurricane Sandy, and 2.4%, 46% and 30% for the Category-3 hurricane of 1821, respectively (bay-wide averages). These results suggest that shallowing can provide greater flood protection than wetland restoration, and it is particularly effective at reducing “fast-pulse” storm surges that rise and fall quickly over several hours, like that of the 1821 storm. Nonetheless, the goal of flood mitigation must be weighed against economic, navigation, and ecological needs, and practical concerns such as the availability of sediment.

Graphical Abstract

1. Introduction

Our coastlines provide many social, economic, and ecological benefits, but are increasingly vulnerable to damages from coastal storms and sea level rise. There is an increasing societal awareness and interest in the application of natural coastal systems for coastal risk reduction, through both reducing flood levels and avoiding increased development. In response to this trend, as well as the devastation caused by Hurricane Sandy, the US Army Corps of Engineers is evaluating the use of natural and nature-based approaches where possible to support coastal resilience and risk reduction [1]. In Northern Europe, beach nourishment projects, dunes and other natural features have long been used along with engineered infrastructure to reduce and mitigate against coastal flooding, e.g., [2].
Hurricane Sandy severely impacted New York City (NYC) in 2012, flooding a 132 km2 area (17% of total land mass) with a population of 443,000 people [3]. Flooding was particularly widespread around Jamaica Bay, a large coastal embayment in NYC where surrounding neighborhoods include a large proportion of the 1,116,000 city residents (Figure 1) living on land within range of a 5 m coastal flood level (measured relative to the 1983–2001 mean sea level, MSL). The baseline FEMA 500-year coastal flood at Howard Beach, northern Jamaica Bay, is 3.8 m MSL, but this increases to 5.4 m with a high-end projection of sea level rise for the 2080s [4], raising the flood risk for this population.
The flood risk in Jamaica Bay has possibly been aggravated by widespread anthropogenic alterations over the past century. The entrance channel in Jamaica Bay was dredged to a depth of 5.5 m and width of 150 m, beginning about 1910, and eventually deepened to 9.1 m. Archival research has shown that the average depth of the bay has increased from 1 m in the mid-1800s to 5 m at the present [5]. As a result of this deepening and possibly also the smaller water depth increases due to sea level rise, tide ranges have increased ~0.5 m (25%–45%) and tides are amplified instead of being damped as they flow from the entrance to the inner reaches of the bay [6], though the contribution of sea-level rise to tidal range change is unknown. The estimated total loss of interior wetlands for the bay since the mid-1800s is 49 km2 of the original 65 km2 [7]. However, a successful Corps of Engineers pilot program rebuilt 0.64 km2 of wetlands from 2006 to 2014 [8], with a goal of eventually restoring them to their 1974 footprint [9].
The scale of the wetland losses and depth increases in Jamaica Bay, combined with the at-risk population nearby, provide an important opportunity to test whether natural and nature-based strategies can protect against coastal floods and mitigate against local sea level rise. Furthermore, the bay has a large enough length (~10 km) to make wetland-based protection plausible, if one considers qualitative (order-of-magnitude) metrics such as the 15 km for 1 m storm surge reduction that was developed for historical Gulf of Mexico wetlands and hurricanes [10,11].
The purpose of this paper is to use hydrodynamic modeling to explore the potential for using nature-based coastal flood protection to reduce flood risk in the neighborhoods surrounding Jamaica Bay. We highlight and discuss the positives and negatives of a new concept for nature-based flood protection—Channel depth shallowing, the strategy of reducing estuary or inlet depths to reduce the inland penetration of a coastal flood. The efficacy of channel shallowing and wetland restoration are quantified using the simulations of the city’s two highest known historical flood events—A Category-3 hurricane that passed over the city in 1821 [12,13] and Hurricane Sandy in 2012.
Figure 1. New York City boroughs and the western edge of Nassau County (right edge of map) showing the population density in contiguous low-elevation coastal zones below 5 m above mean sea level (MSL). The population density data are based on 100 m resolution 2010 population data [14]. LIDAR elevation data at 1 m resolution are used to filter for elevation; the map only shows population density data where >50% of a cell area is below 5 m elevation. Data available at [15].
Jmse 03 00654 g001

2. Methods

2.1. Hydrodynamic Modeling

A validated hydrodynamic model and grid covering Jamaica Bay and surrounding neighborhoods is used in this study to investigate different nature-based mitigation scenarios. The Stevens ECOM hydrodynamic model (sECOM), e.g., [16,17], provides accurate coastal flood predictions as part of the NY Harbor Observation and Prediction System (NYHOPS) and the Stevens Institute of Technology Storm Surge Warning System, with water level root mean square errors (RMSE) of 0.10 m since 2007 [18]. The sECOM model includes a coupled wave model [18,19] and robust upland inundation capabilities, known as “wetting and drying” [20].
The Jamaica Bay grid is a 30 m × 30 m, 1069 by 550 square-cell grid covering the watershed up to an elevation of 6 m (Figure 2, top left panel), and the flood simulations on it are run in two-dimensional barotropic mode. The bathymetry and topography information in the model is based on the region’s best available datasets, compiled by FEMA Region 2 for their recent coastal storm surge study [21]. The grid is doubly-nested, with a large, coarse grid modeling the Northwest Atlantic (the Stevens Northwest Atlantic Predictions grid, SNAP), a finer-resolution regional grid (the NYHOPS grid) that resolves New York Harbor regions at ~100 m [20,22], and a 30 m resolution grid that covers Jamaica Bay.
Figure 2. Maps of adaptation scenarios 1–3 and control—Land elevation (left) and Mannings-n (right). The Spring Creek Park (SCP) and Inwood (JBI) sites are also indicated (X) in the top left panel. Elevations are shown relative the NAVD88 datum.
Jmse 03 00654 g002
In storm surge modeling studies, a common simplified approach to representing the effects of wetlands is to treat them as enhanced landscape roughness features, through Mannings-n. While this neglects water—Vegetation interactions within the water column, it provides good model agreement for surges and flood recession processes at inland locations, e.g., [23]. Following this approach, Mannings-n is set via landscape types defined across Jamaica Bay using the National Land Cover Database (NLCD), as per [24]. These values are converted to drag coefficients (CD) within the model through the standard formula CD = gn2h−1/3 where g is gravitational acceleration, n is Mannings-n, and h is the time and space varying water depth. Mannings-n values for wetlands are 0.045, and those for other common land-cover types in the model are: 0.02 for open water, 0.09 for barren land (rock, sand or clay), and 0.10 and 0.13 for medium and high intensity developed land, respectively (Figure 2, right panels).

2.2. Storms and Forcing Data

Storm surge is an increase in water level caused by wind and low atmospheric pressure, and combines with the tide to form a storm tide, which here we measure relative to the storm year’s mean sea level, e.g., [25]. The two largest known historical hurricane storm tide events for New York Harbor (The Battery) are Hurricane Sandy, which caused a 3.4 m storm tide, and a Category-3 hurricane that passed over the city in 1821, which caused a storm tide estimated as 2.7–3.7 m [12], or 2.7–3.0 m [26] (Figure 3). Here, we use simulations of these two storms as tests of the efficacy of nature-based adaptation scenarios for Jamaica Bay. These two storms are highlighted here because of their magnitude and also because they represent two different types of event. The storm surge during Sandy rose slowly over three days, though it rose more rapidly in the final hours near the time of landfall. In contrast, the 1821 hurricane storm surge rose very rapidly over a period of a few hours [13].
Figure 3. Hurricane Sandy (left) and the 1821 Hurricane (right) storm track (black lines), isobars (white lines), wind vectors, and simulated water levels relative to mean sea level near the time of final landfall. The 1821 simulation is performed on the mean sea level for the 1983–2001 epoch. Blue arrows in the left panel point to locations of the Battery tide gauge and Jamaica Bay (JB).
Jmse 03 00654 g003
The Sandy simulation on the SNAP and NYHOPS domains is forced by a meteorological reanalysis produced by Oceanweather, Inc., Cos Cob, CT, USA). The resulting water levels have an RMSE at The Battery of 0.16 m. The model results from the NYHOPS domain are used as a clamped offshore boundary condition on the nested Jamaica Bay grid. Local wind forcing for the Jamaica Bay grid is applied based on measurements at Breezy Point, and is assumed to be spatially homogeneous (data courtesy of Weatherflow, Inc., Scotts Valley, CA, USA). A model validation for the Hurricane Sandy control simulation on the Jamaica Bay grid is given below in Section 3.
The hurricane of 1821 was simulated using synthetic tropical cyclone parameters based on work by Boose et al. [27] and Swiss Re [13]. The storm makes its first landfall near Cape May, New Jersey, tracks over land along the coast, crosses Raritan Bay, and makes a final landfall at NYC (Figure 3). Maximum sustained winds and radius of maximum winds at landfall are estimated to be 58 m·s−1 and 50 km, respectively. We utilize parametric equations to represent the storm’s wind and pressure forcing for our ocean model—The Holland pressure model [28] and SLOSH wind model [29]. The simulation is run with the 1983–2001 mean sea level to represent the possible flooding for a similar type of storm if it were to occur in modern times.

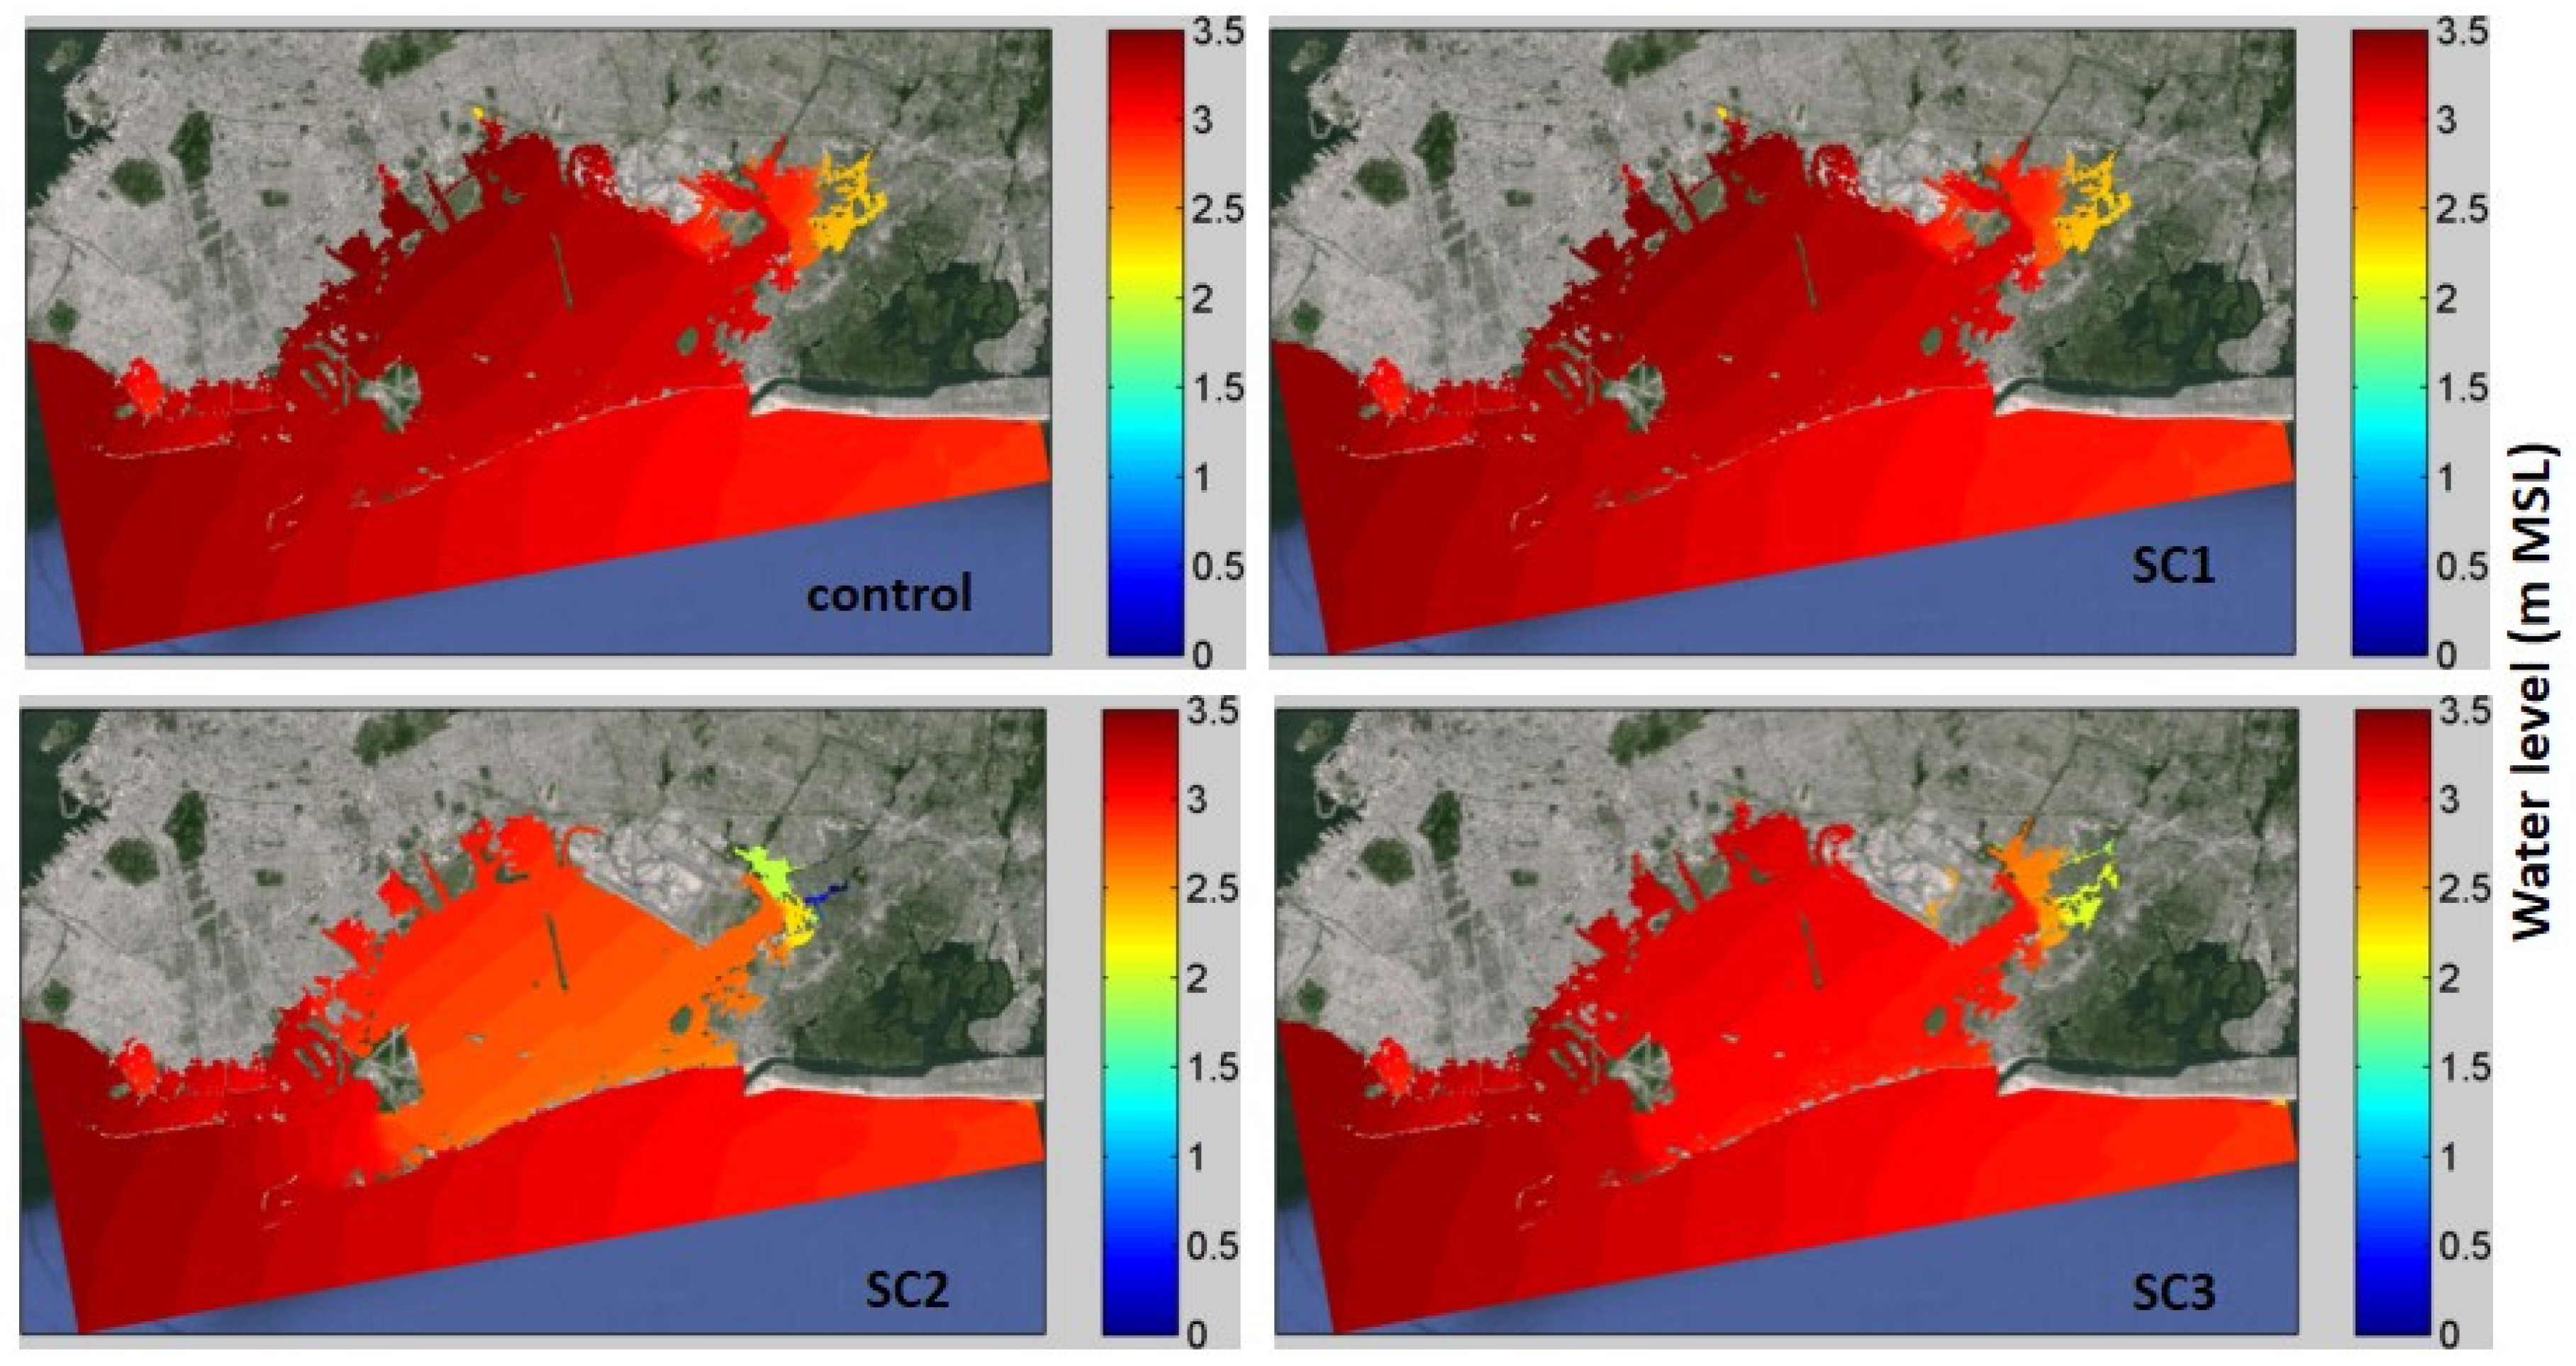
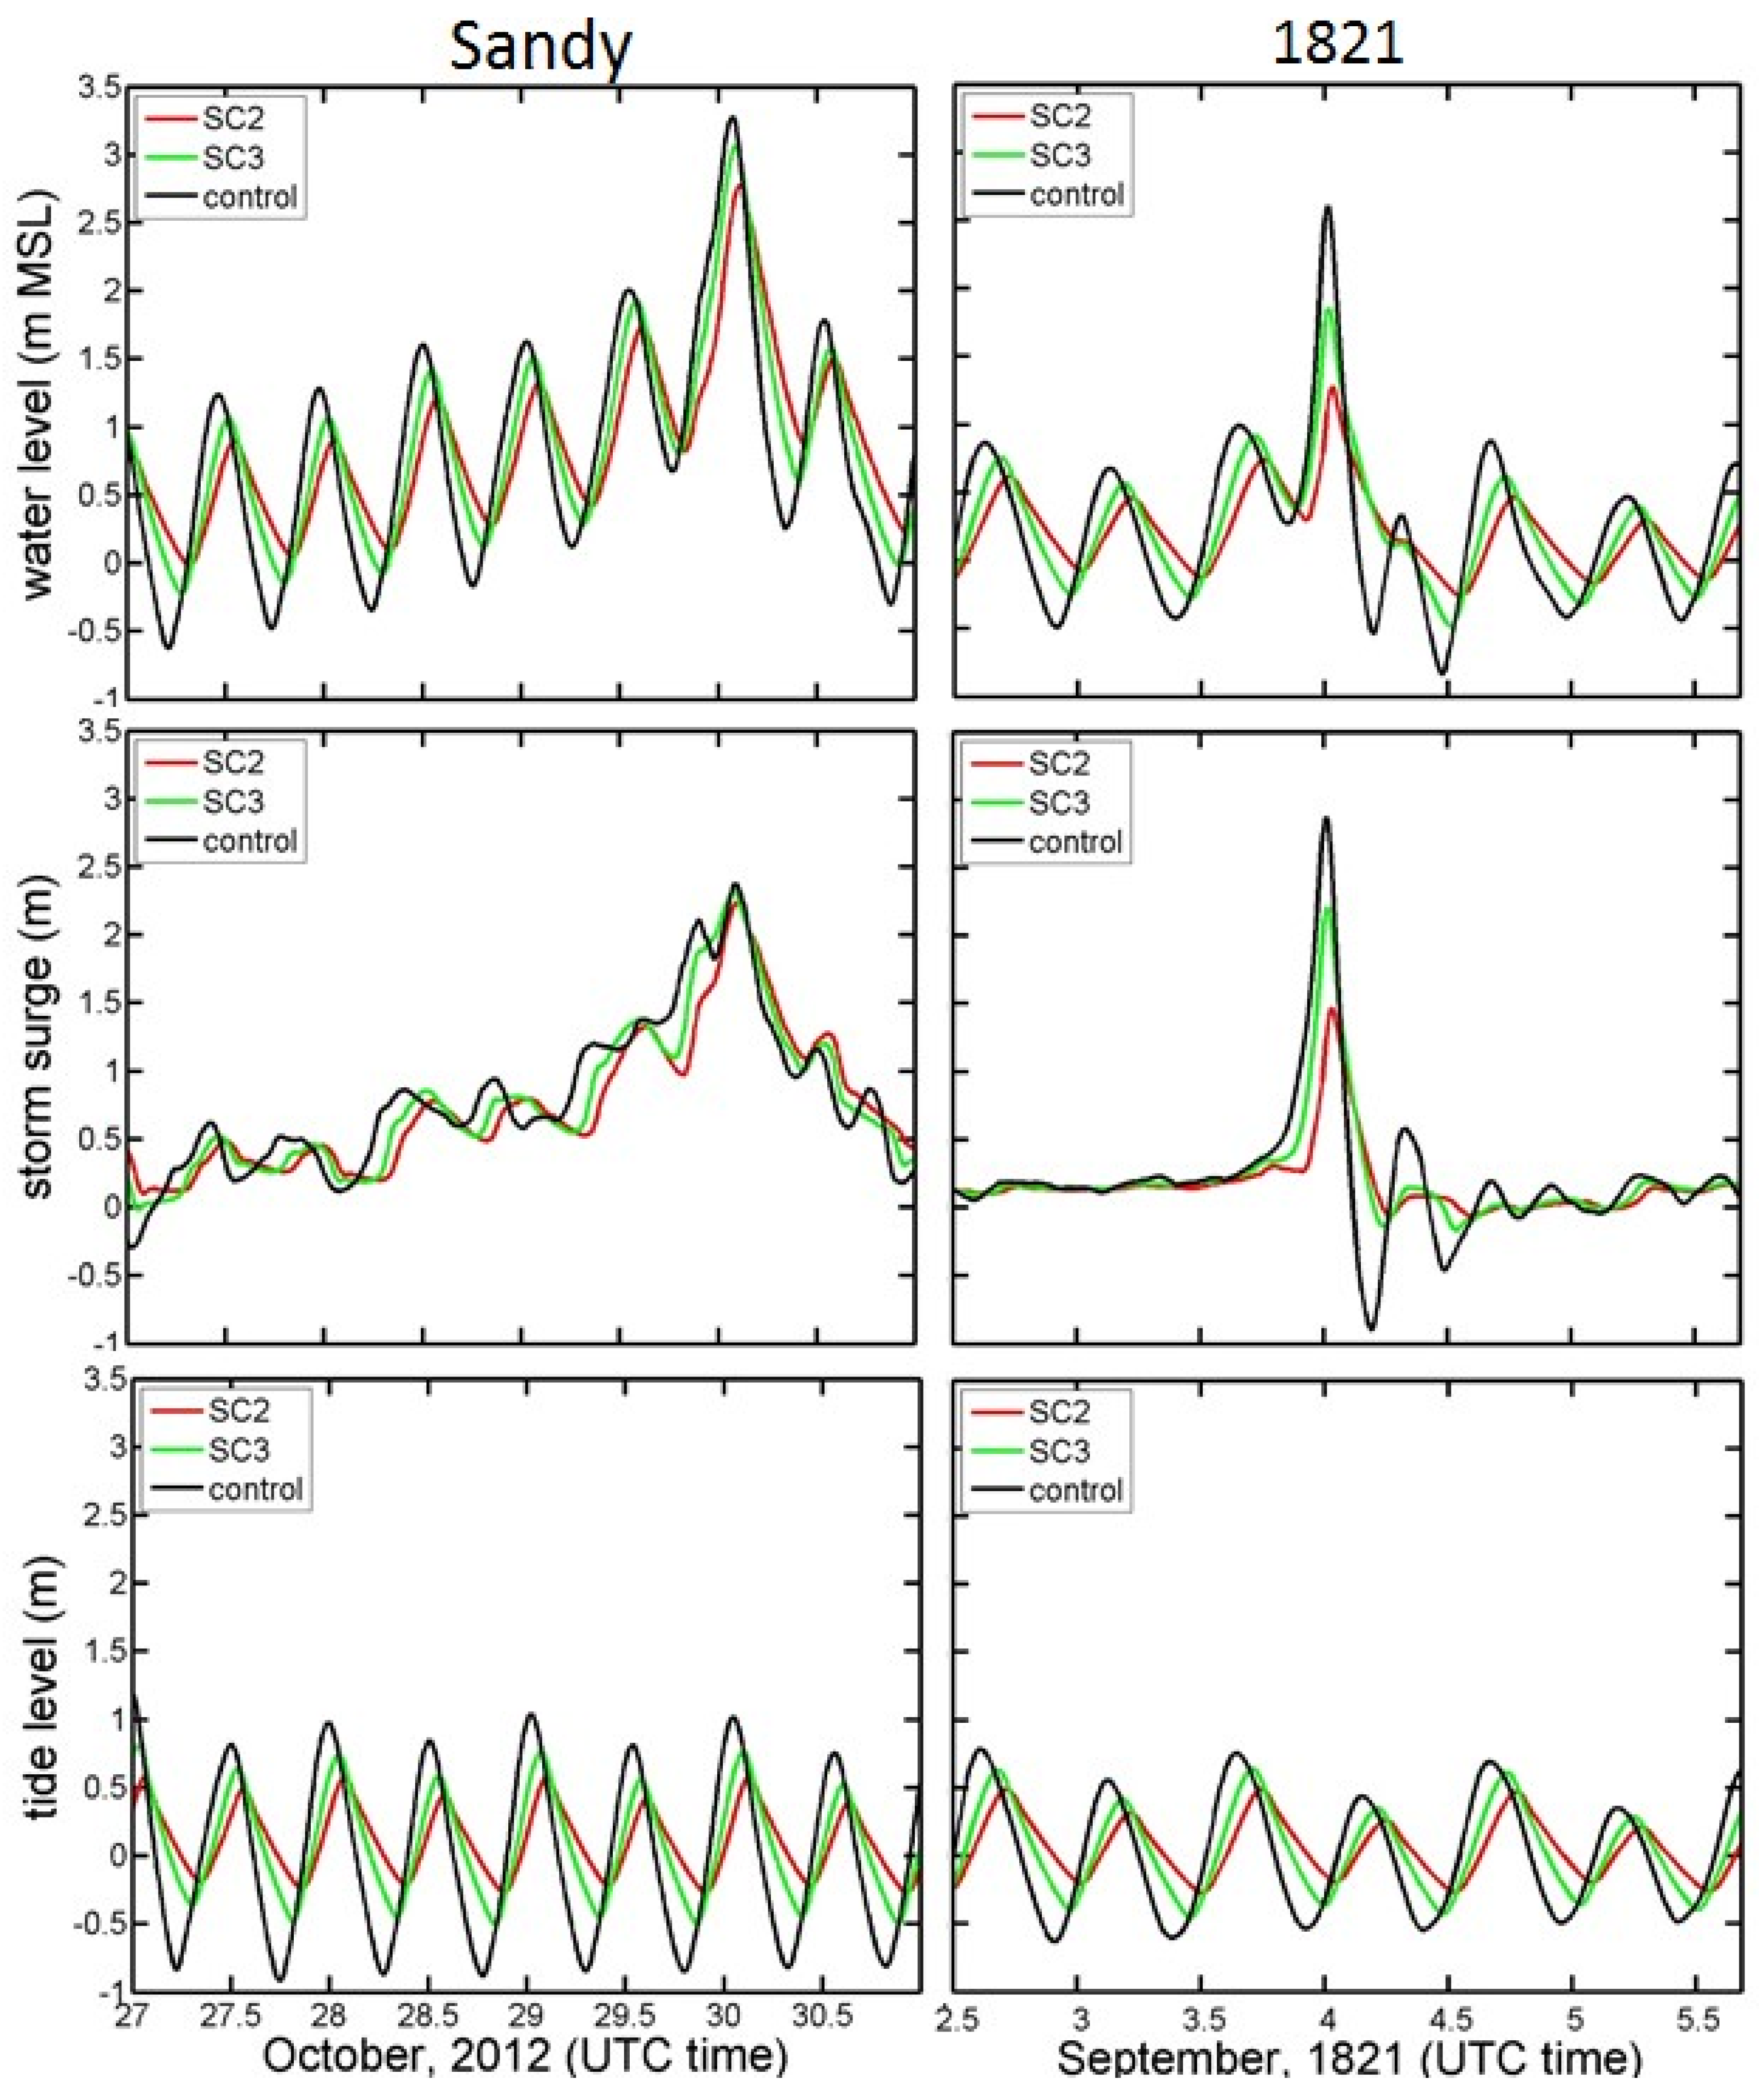
2.3. Landscape Scenarios

Four experiments with differing landscape scenarios for Jamaica Bay are used for each storm, to test the effect of changing conditions. The landscape scenarios, defined as specific cases of land elevation (topography, bathymetry) and land cover, are:
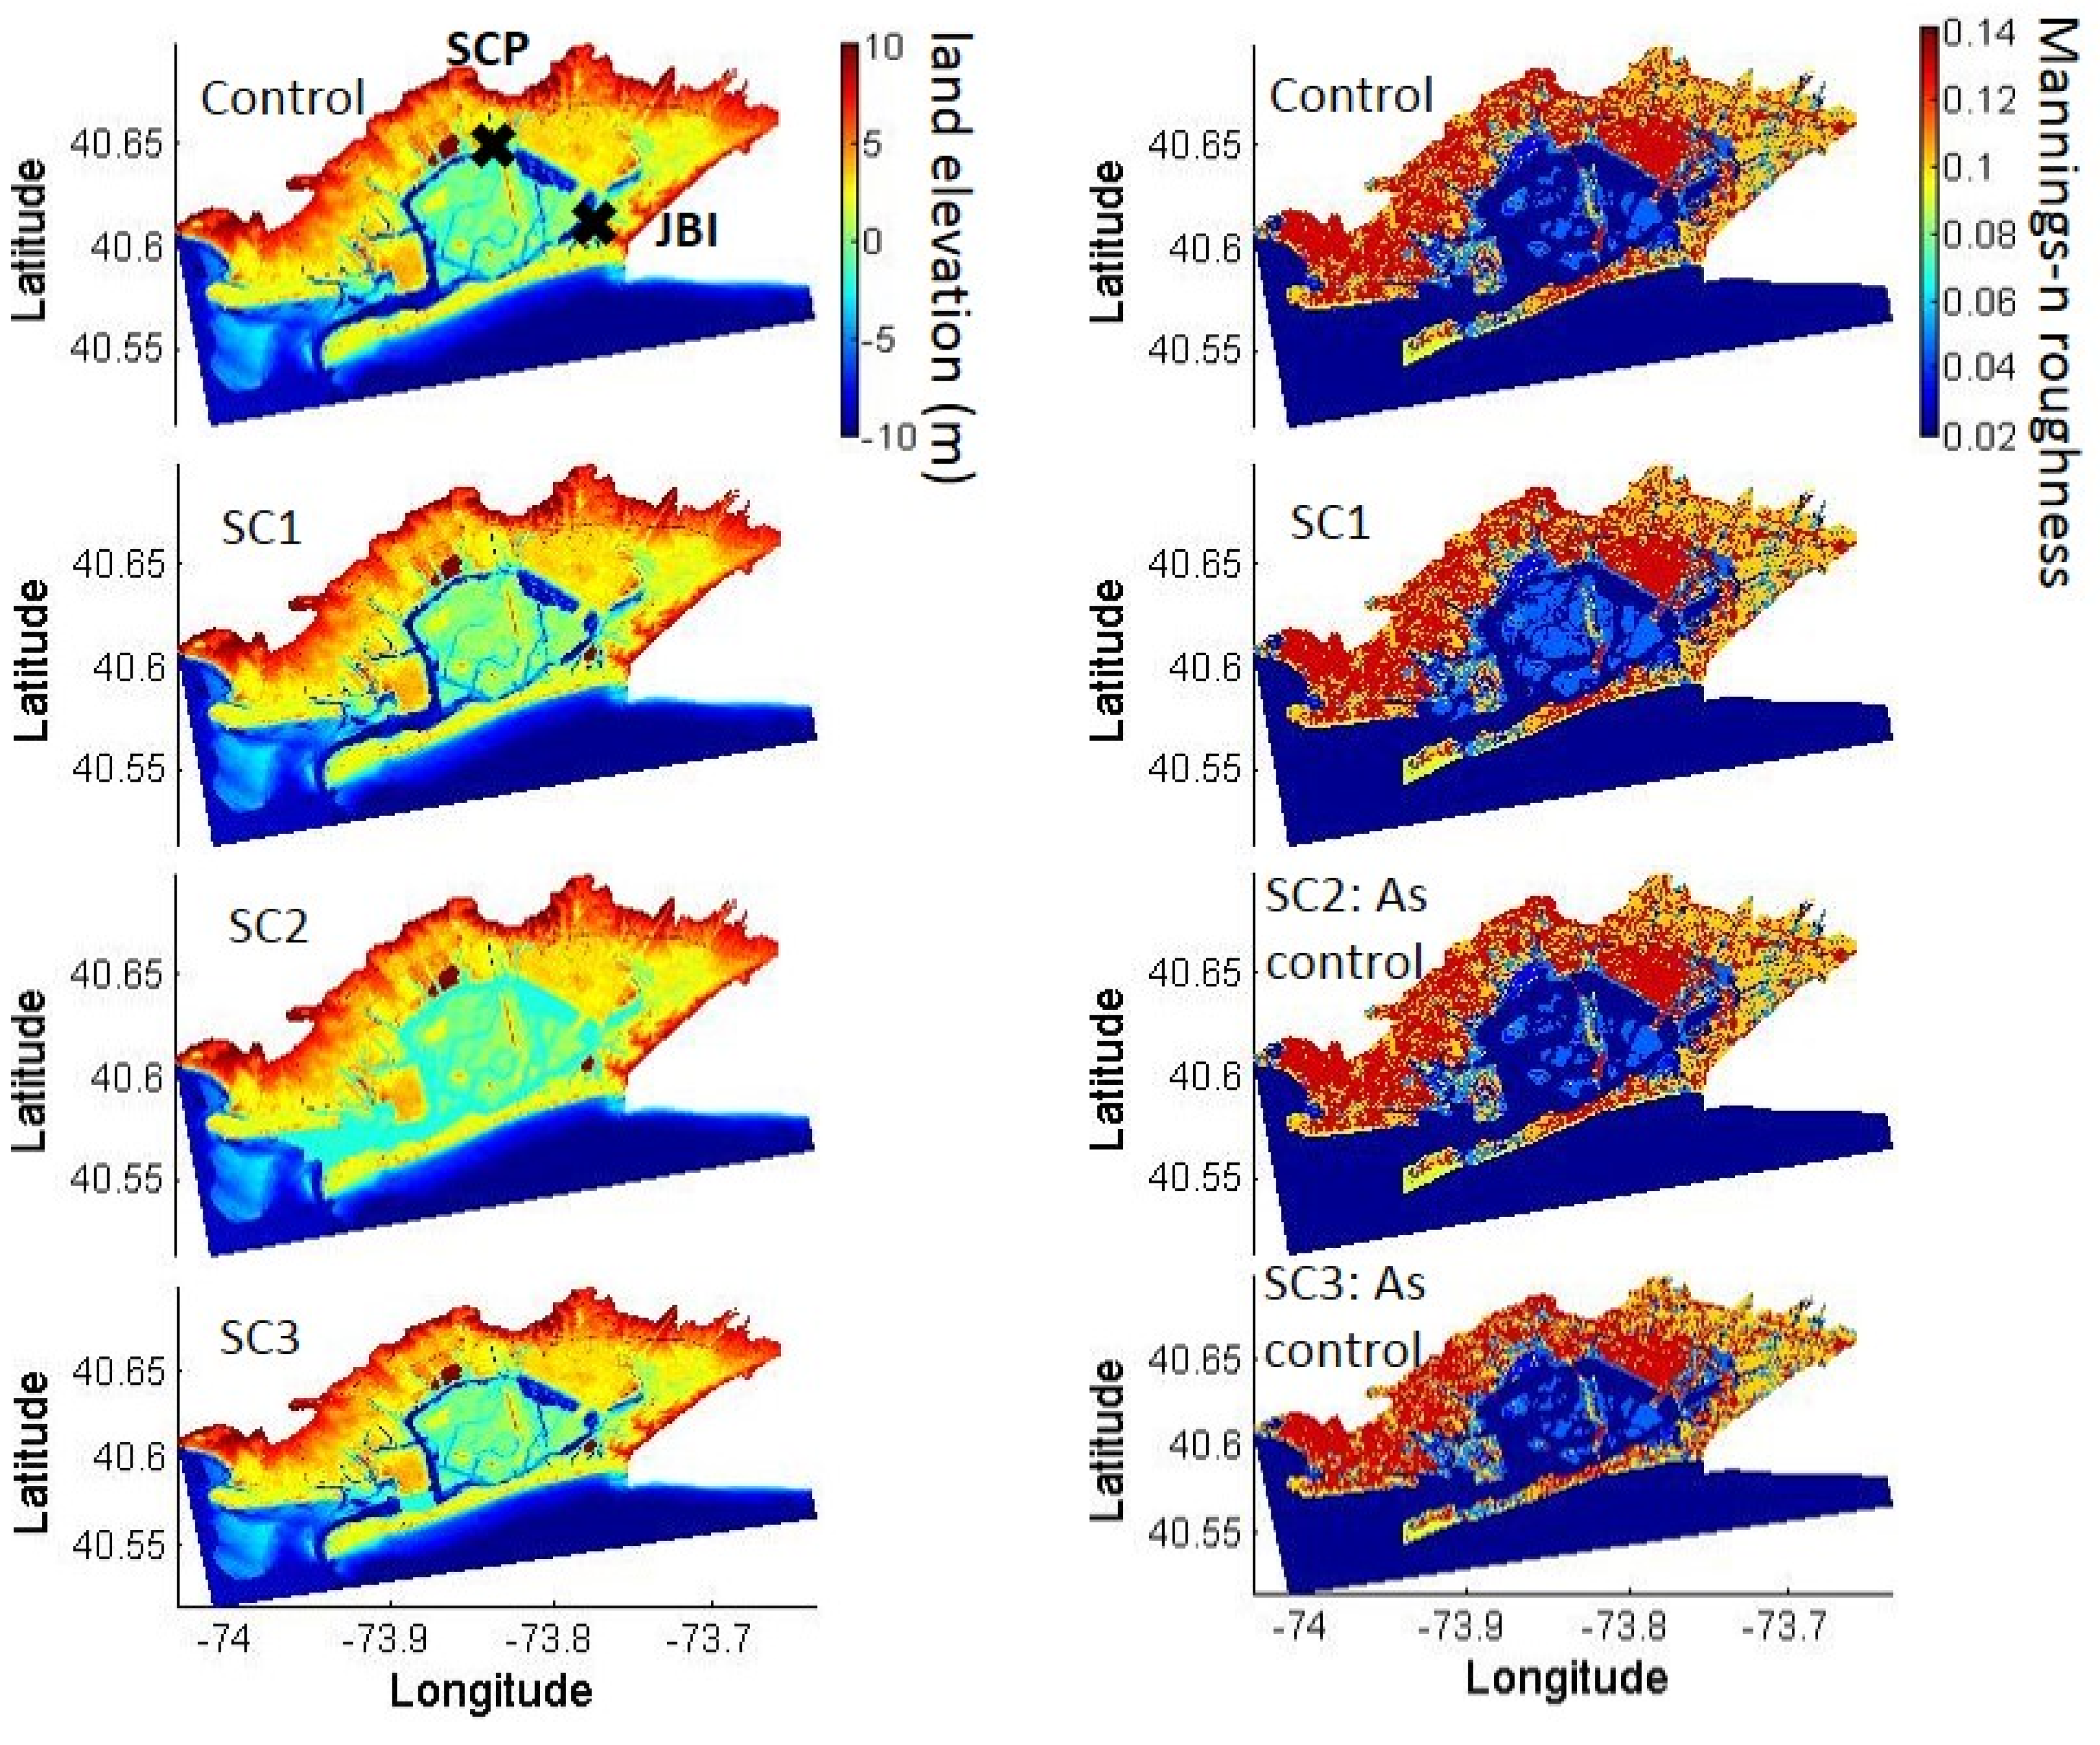
  • CONTROL: Present-day landscape and land cover;
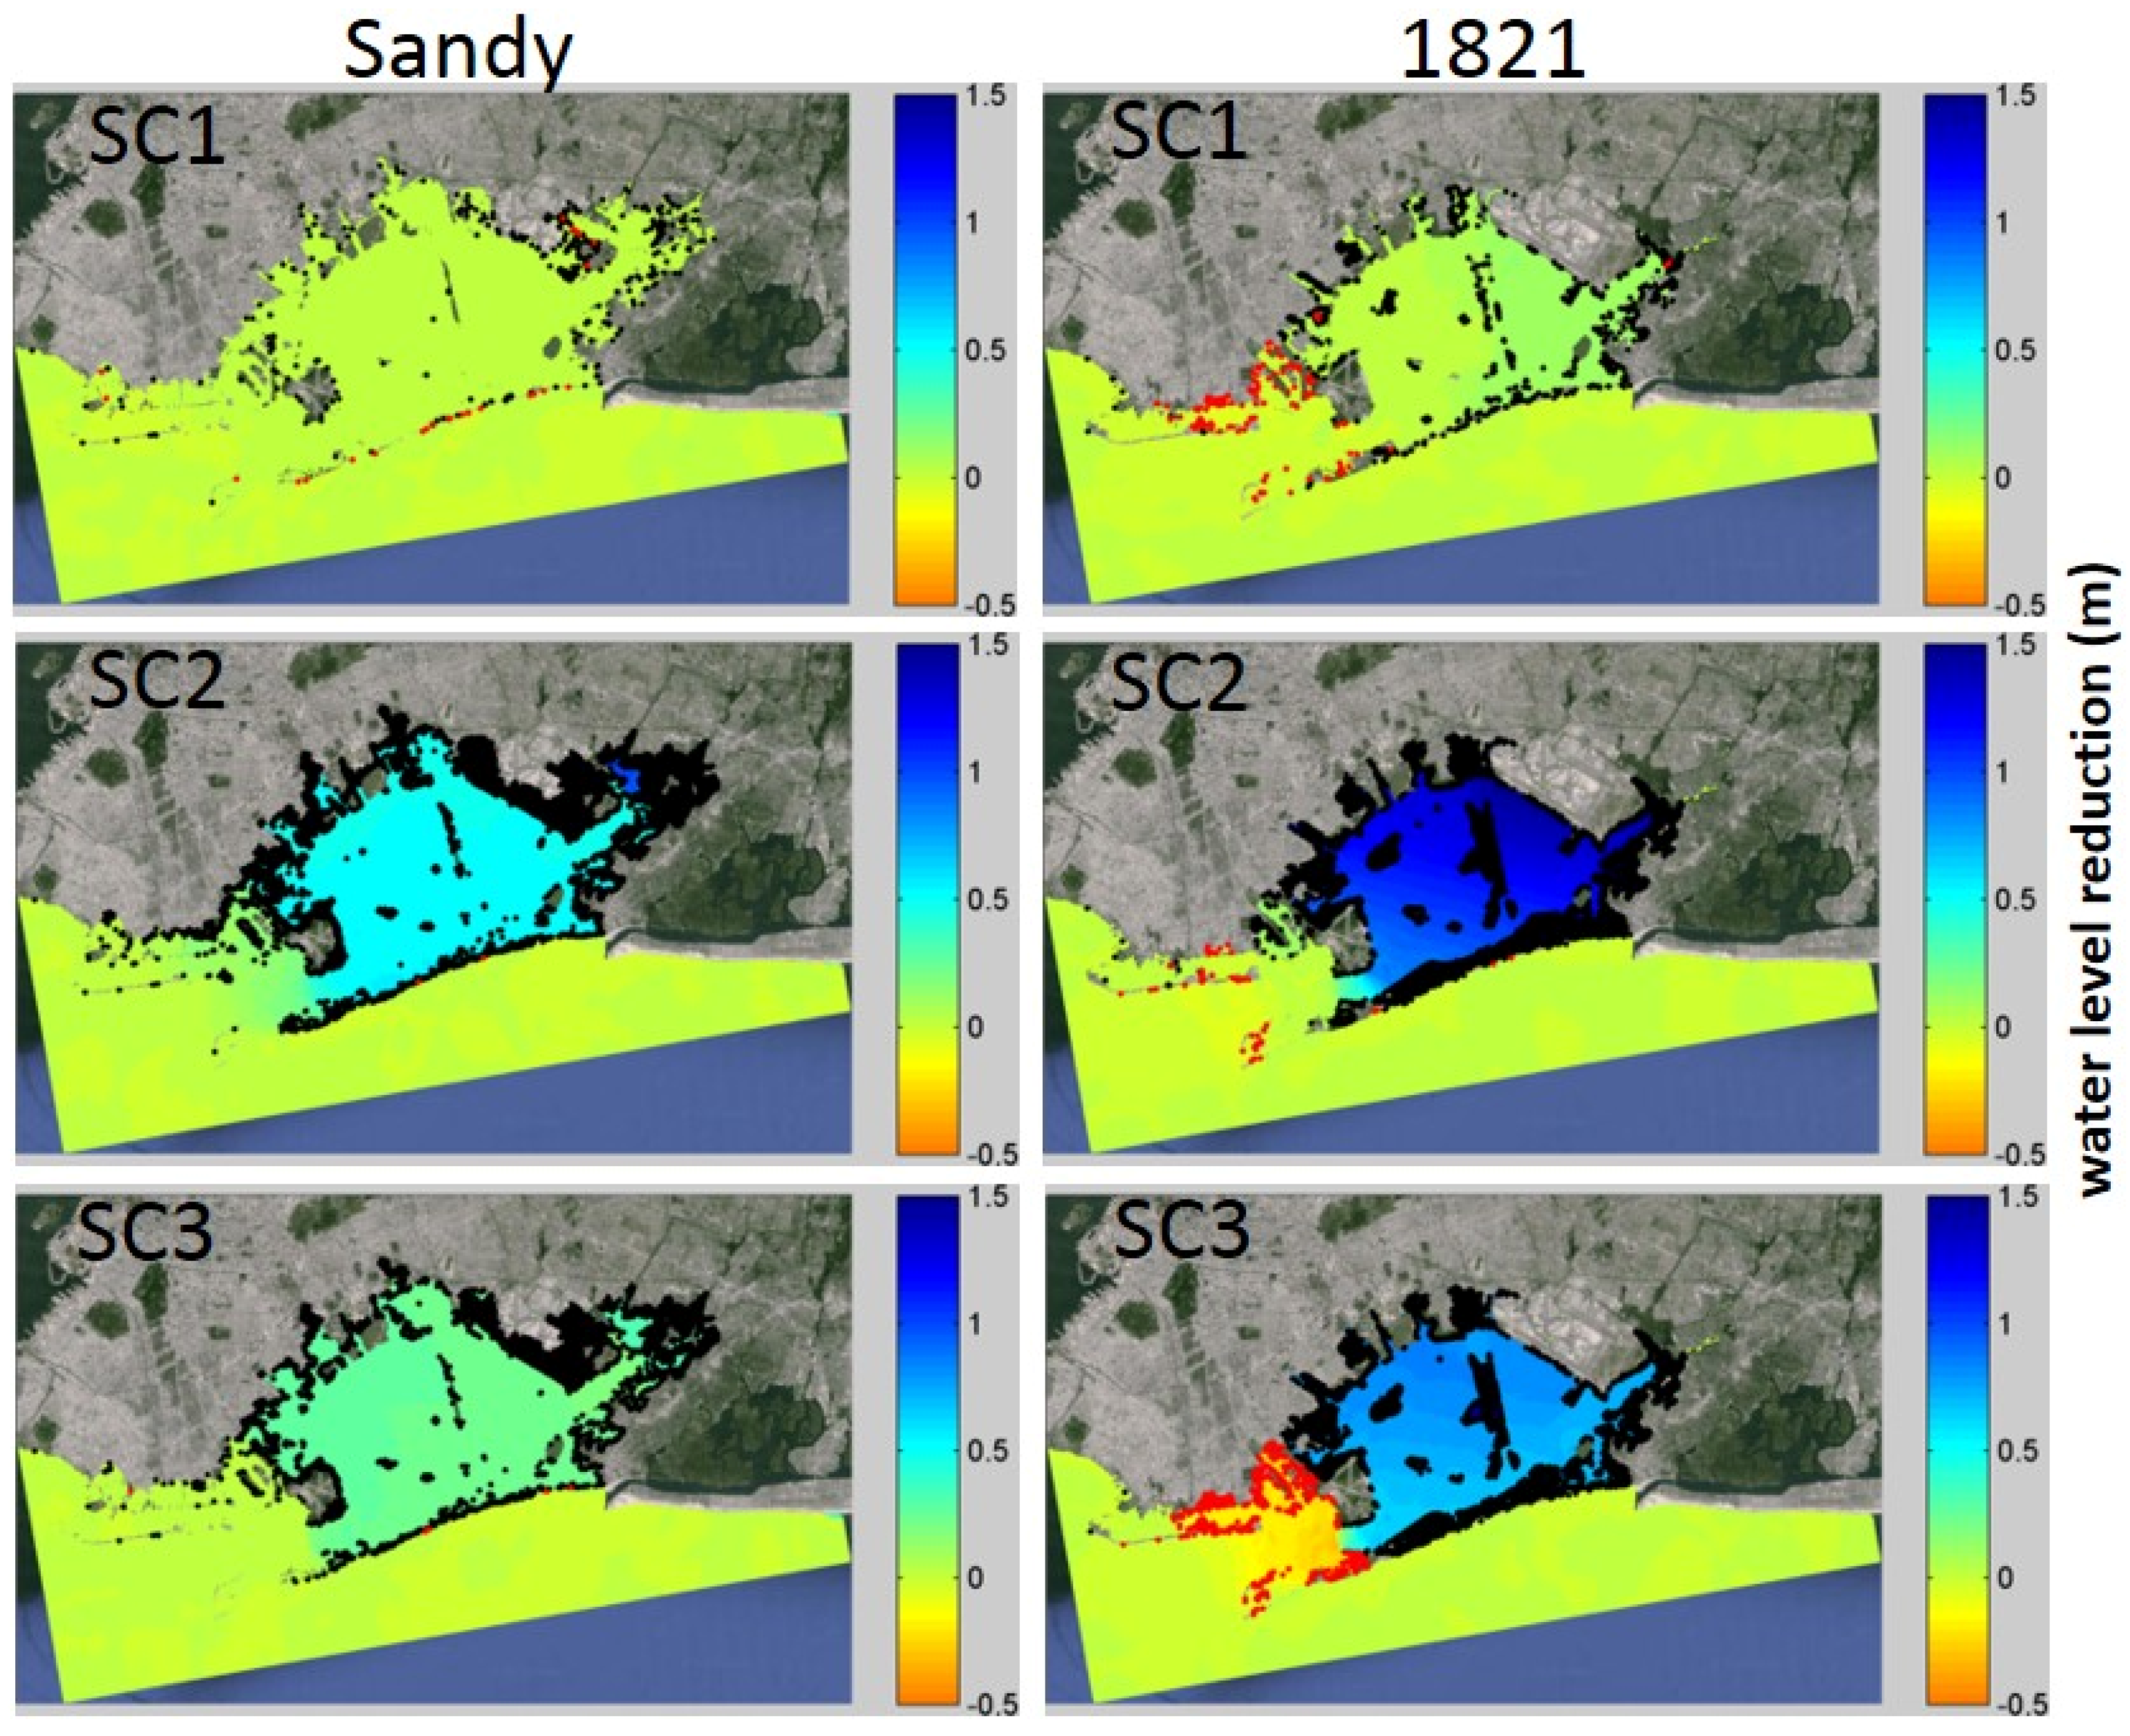
  • SC1: “Wetland restoration”: Restoring the 1879 wetland footprint and bathymetry, while not altering areas of present-day deep channels or neighborhoods;
  • SC2: “Full shallowing”: Shallowing deep (>2m) channels to 2 m depth below Mean Low Water;
  • SC3: “Inlet shallowing”: As SC2, but shallowing only the narrowest region in the inlet;
The depths and Mannings-n roughness values for the control run and adaptation scenarios are shown in Figure 2. Scenario SC1 is a wetland restoration scenario for the bay interior, including both restoration of the wetlands and the eroded land beneath them (often referred to as “marsh islands”). The restoration is to the 1879 wetland footprint [30], but ignoring areas that are deep channels (>2 m depth) or upland neighborhoods in today’s landscape. This experiment is intended to show how the present goal of restoring wetlands in the center of the bay [9] would affect extreme flooding events, if it were greatly expanded. Wetlands are represented with land elevations of 0.5 m above MSL and a characteristic wetland Mannings-n value of 0.045 [24]. Note that results with SC1 were insensitive to choosing a cutoff of 3 m instead of 2 m.
The shallowing experiments (SC2, SC3) are deliberately extreme, intended to demonstrate system sensitivities (leverage) and to provide process understanding. The bathymetry changes in each scenario would be unlikely to reflect equilibrium morphological conditions, and the inlet shallowing experiment (SC3) might induce water quality problems by creating stagnant, poorly flushed deep waters in the bay. The two shallowing scenarios have no changes to land cover; both are the same as the control, with present-day land cover.

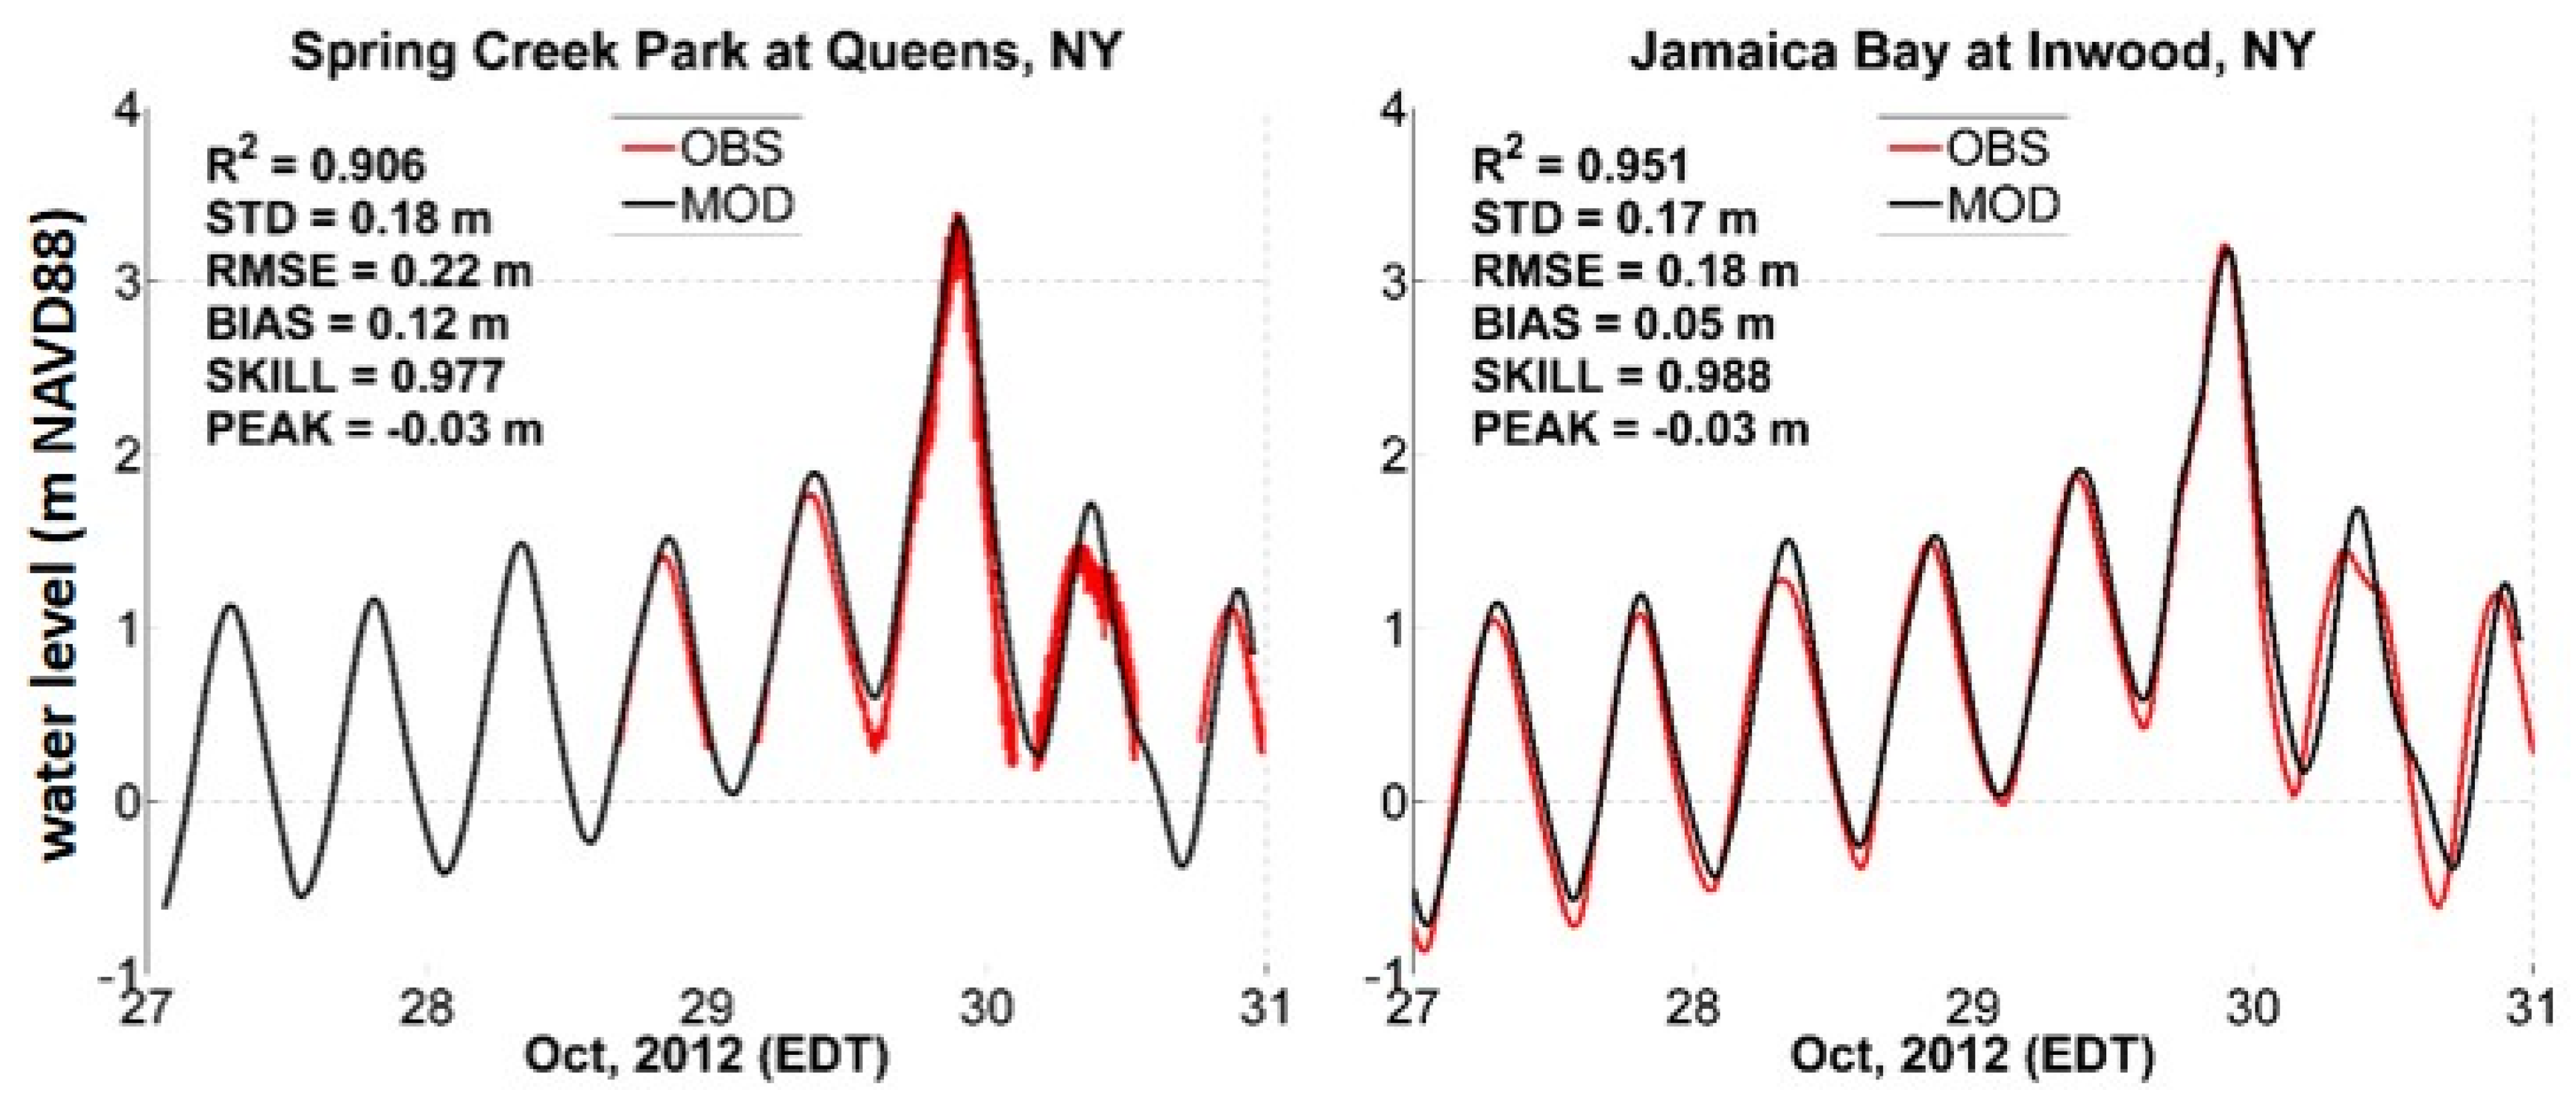
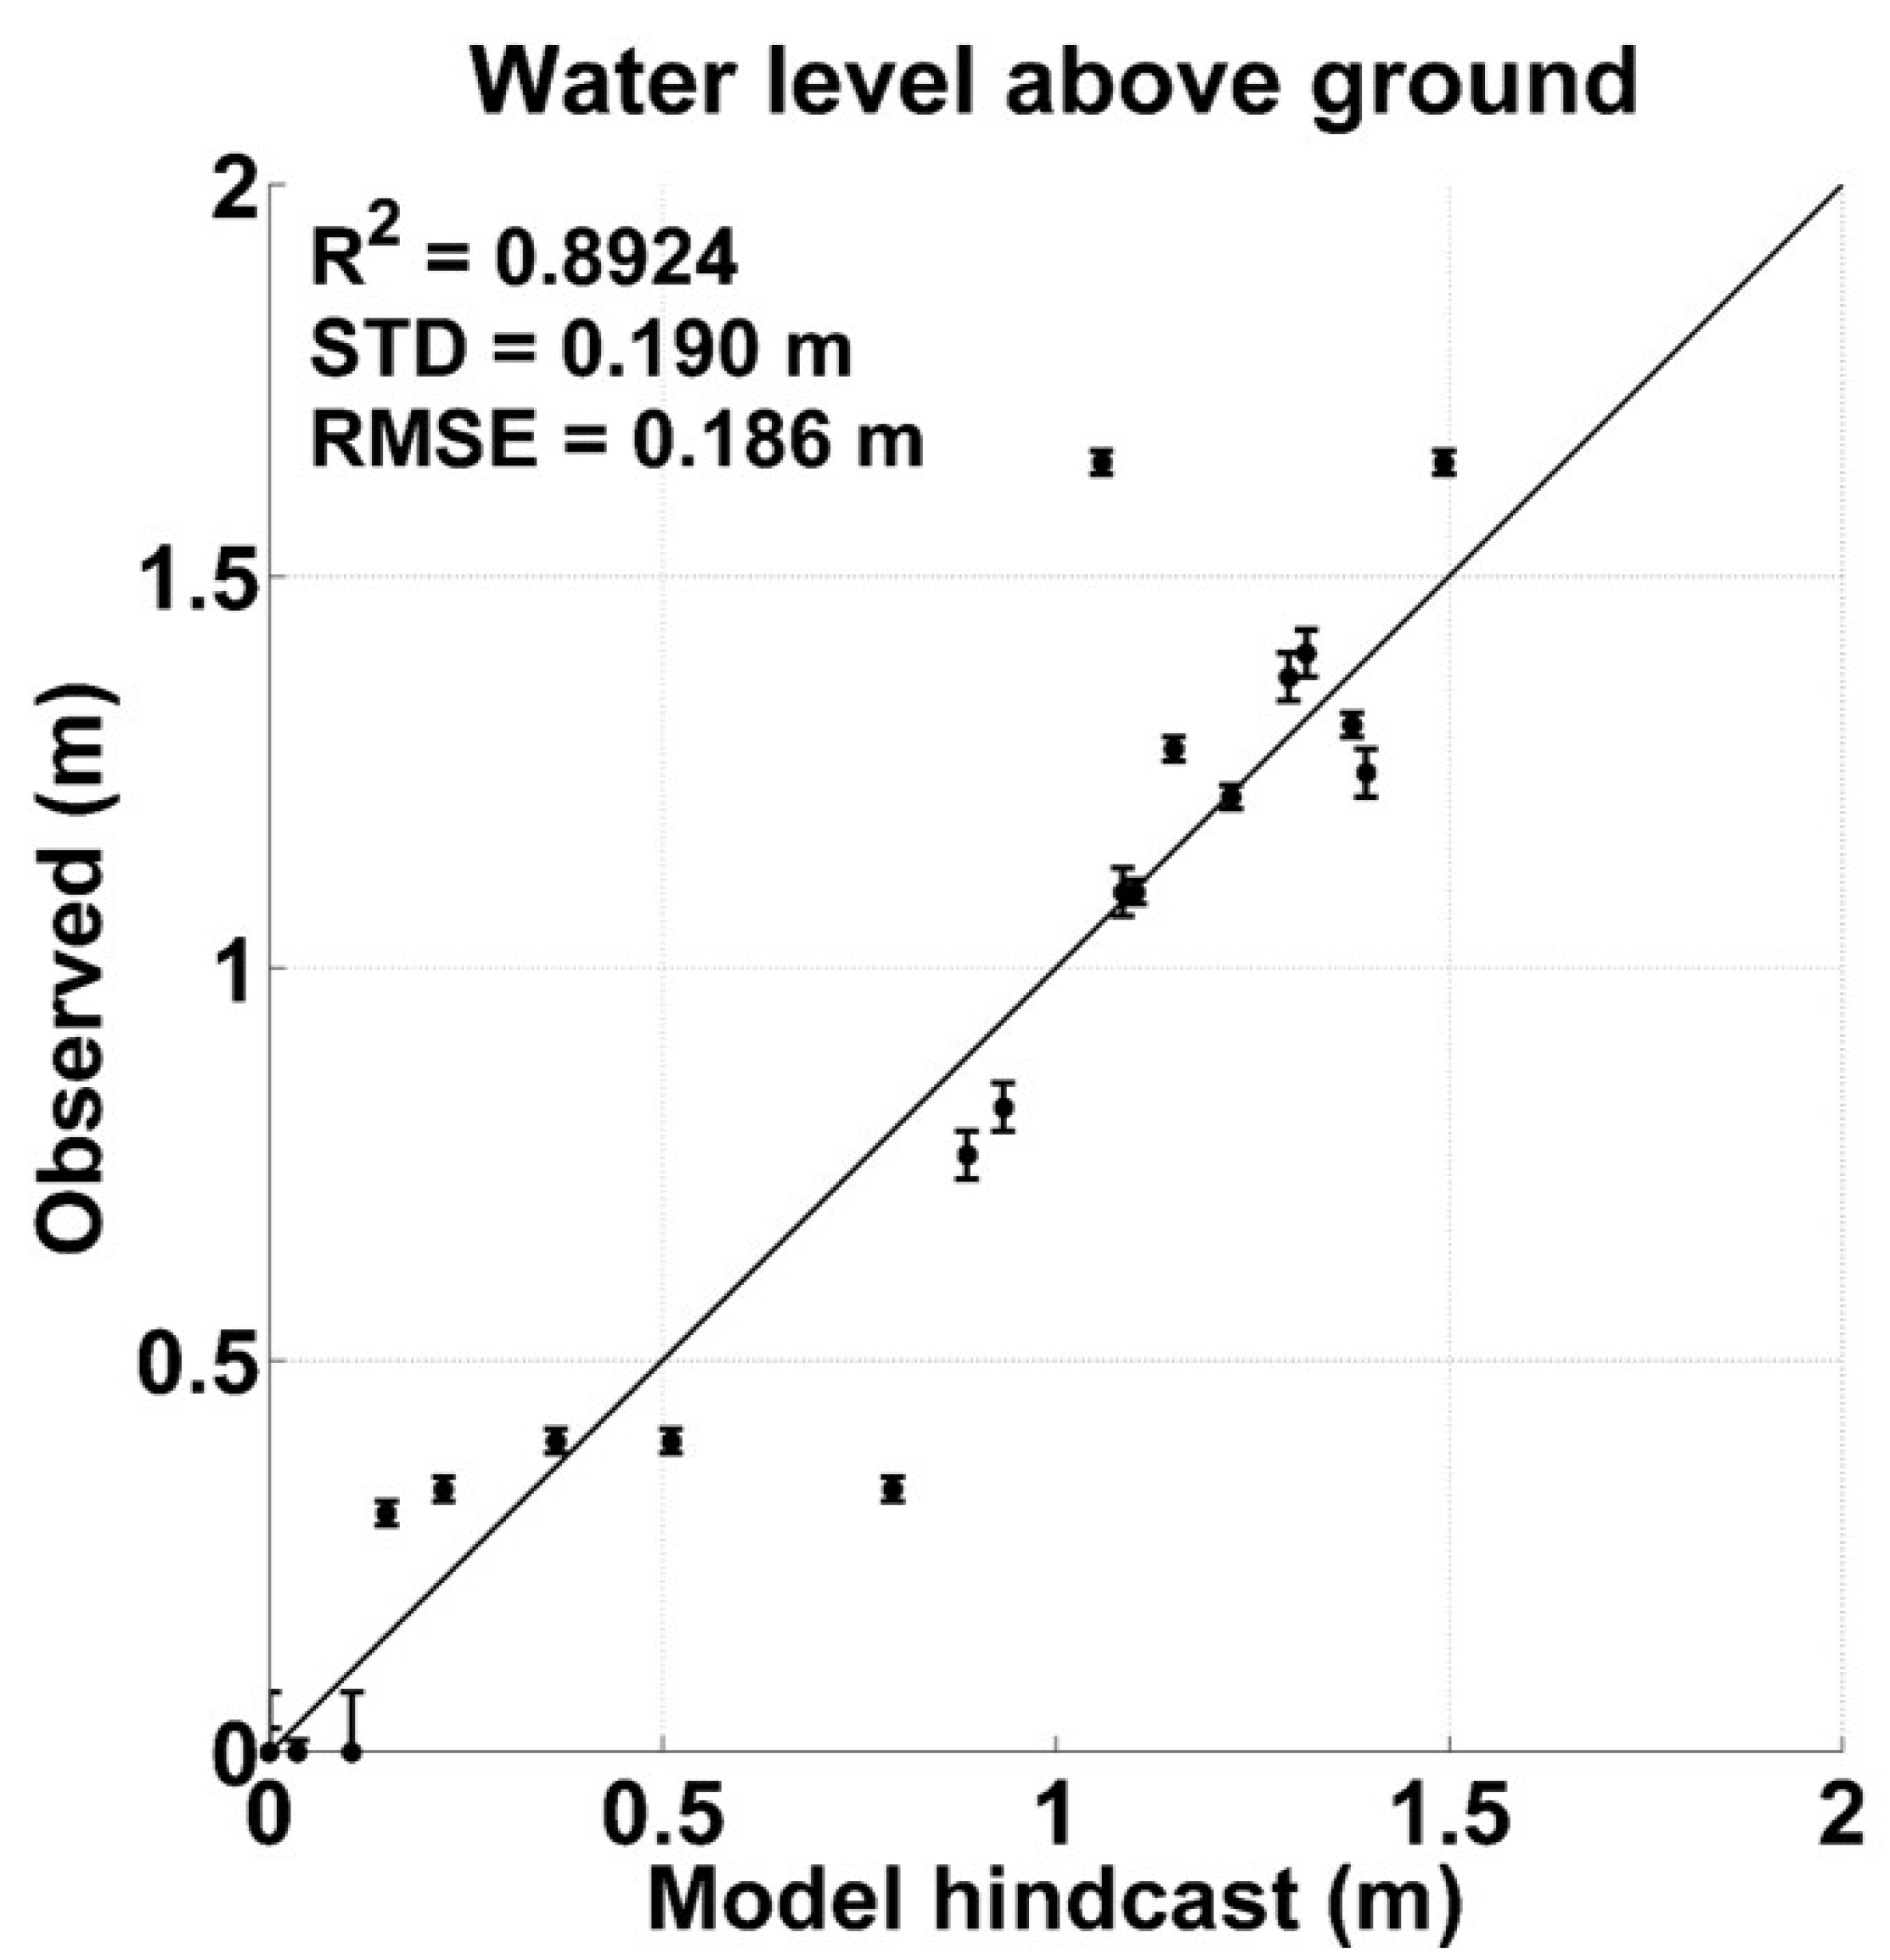
2.4. Model Validation

The Hurricane Sandy control experiment using modern bathymetry was validated using water level data from the United States Geological Survey, including a pressure sensor near Spring Creek Park (SCP) and a tide gauge at Inwood (JBI; Figure 2). The SCP station is at the northern part of the bay, and is a rapid-deployment storm surge sensor (SSS-NY-QUE-002WL), a pressure gauge that is deployed when a tropical cyclone is approaching. This sensor elevation is at 0.2 m above NAVD88, so that it provides data only when the water level is higher than this elevation. Data are corrected for atmospheric pressure based on a nearby USGS barometer deployment. The JBI tide gauge is at the eastern end of the bay, and has been running since 2002. High water marks from Sandy within Jamaica Bay collected by USGS were also used to validate the model.
Because an early 19th century digital elevation model does not exist (at present), we make the assumption that the 1821 storm tide heights in NY Harbor can be modeled (where the validation data was observed), to a first approximation, using modern bathymetry. However, as noted by Talke et al. [25], changes to bathymetry at the entrance bar and within the harbor may have altered storm tide characteristics since the mid-19th century.

3. Results

Results for the Hurricane Sandy control simulation and validation are shown in time series form in Figure 4, demonstrating good agreement. The RMSEs between the model and observations are 0.22 and 0.18 m at SCP and JBI. Model skill, e.g., [31], is 0.99 for the tide gauge site JBI, but could not be applied for SCP due to obvious wave-driven fluctuations in the pressure sensor’s data. A one-to-one plot of modeled and observed high water marks (HWMs) is shown in Figure 5, demonstrating an RMS difference of 0.19 m and r2 value of 0.89. The HWM observations have moderate uncertainty, as shown by the error bars in the figure. These results are similar to other model studies of Sandy [32,33].
Figure 4. Hurricane Sandy model validation in Jamaica Bay, at (left) Spring Creek Park and (right) the Inwood tide gauge. Station locations are shown in the first panel of Figure 2.
Jmse 03 00654 g004
Figure 5. Sandy simulation vs. Jamaica Bay high water marks (HWMs). Error bars on the observed water levels come directly from the USGS field report for each HWM.
Jmse 03 00654 g005
Maps of temporal maximum water level results for Hurricane Sandy for the control run and the three scenarios are shown in Figure 6. These results show peak water levels (averaged over the bay interior) decreasing by 0.01 m for SC1 (wetland restoration), 0.50 m for SC2 (full shallowing), and 0.23 m for SC3 (inlet shallowing). Table 1 shows detailed results for temporal maxima and their reductions.
Figure 6. Results for Hurricane Sandy (peak water levels) in map view for control run and Scenarios 1, 2 and 3. Water levels are shown relative to local mean sea level (MSL) at JBI.
Jmse 03 00654 g006
Table 1. Temporal maxima (peaks) and their reductions for each storm and scenario.
Storm EventsScenarioBay-AverageJBI Station
Peak Water Level (m a)Reduction (m)Reduction Percentage (%)Peak Water Level (m a)Peak Surge b (m)Peak Tide c (m)
Hurricane Sandy 2012Control3.39----3.272.381.03
SC13.380.010.33.252.331.01
SC22.890.5014.72.772.230.58
SC33.160.236.83.062.320.76
Hurricane 1821Control2.54----2.602.870.78
SC12.480.062.42.502.730.74
SC21.381.1645.71.271.460.49
SC31.790.7529.51.852.200.64
a Peak (temporal maximum) water levels are relative to the 1983–2001 mean sea level datum; b Peak surge was computed as the temporal maximum of the quantity (modeled storm tide-modeled tide); c Peak tide was computed as the temporal maximum in the tide-only model run (over the storm simulation time range).
The control simulation run for the 1821 Hurricane on the NYHOPS grid (Figure 3) has a peak water level of 2.95 m over local mean sea level (MSL) at the Battery, within the range of historical estimates given in Section 2.2. Temporal-maximum water level results in Jamaica Bay for the 1821 Hurricane are shown in Figure 7. For the control run, the temporal maximum water level in the bay (2.54 m) is substantially lower than at The Battery (2.95 m), likely due to the strong (over 50 m·s−1) east winds blowing against the water flowing in through the inlet prior to the final landfall at New York City (Figure 3). The results maps show peak water levels (averaged over the bay interior) decreasing by 0.06 m for SC1 (wetlands), 1.16 m for SC2 (full shallowing), and 0.75 m for SC3 (inlet shallowing) (Table 1).
Figure 7. Results for the 1821 Hurricane (peak water level) in map view for control run and scenarios 1, 2 and 3, as with Figure 6.
Jmse 03 00654 g007
Reductions in peak water level and changes to the flooded area are mapped in Figure 8. Compared to the control model runs, each scenario demonstrates a significant reduction in the flooded area (black dots). Each scenario also wets (floods) areas which remained dry in the control run, primarily near the entrance (red dots). On aggregate, the induced flooding for each scenario is small, and substantially more land is protected from flooding than is put at risk. For Sandy, the area of prevented flooding for each scenario is 0.4 km2, 19.6 km2, and 10.3 km2, respectively, and induced flooding is negligible (below 0.1 km2). For 1821, the area of prevented flooding is 1.4 km2, 18.1 km2, and 11.4 km2, respectively, and areas with induced flooding are 0.2, 0.1, and 0.8 km2. The full shallowing scenario (SC2) for the 1821 hurricane prevents flooding of elevated areas inside the bay (above 1.5 m MSL) altogether (Figure 7). We also conducted experiments (not shown) where we combined the wetlands of SC1 with the shallowing of SC2, but we found that results were nearly indistinguishable from SC2. Therefore, adding the wetlands into the shallowing scenario did not further reduce water levels.
Figure 8. Reductions in peak water level with the three scenarios for Hurricane Sandy and the 1821 Hurricane. Black dots show areas where flooding was stopped (wet in control, dry in scenario), and red dots show areas where new flooding was induced (opposite).
Jmse 03 00654 g008
Time series of water level at JBI show substantial reductions in peak water levels for SC2 and SC3 (Figure 9 top panels). Additional tide-only model runs were performed for the time period of each storm simulation, on each landscape scenario (and the control landscape), to separately elucidate effects of the adaptations on tide and surge (computed as storm tide minus tide) (Table 1; Figure 9 middle and bottom panels). In these tide-only runs, peak tide levels at JBI during 1821 and Sandy are reduced by 0.02–0.04 m (2%–4%), 0.29–0.45 m (31%–38%) and 0.14–0.27 m (15%–23%) respectively for the three experiments, relative to a tide-only run on the control landscape. Reductions in storm surge for Sandy are small (0.05, 0.15 and 0.06 m), whereas they are very large for the 1821 Hurricane (0.14, 1.41 and 0.67 m), respectively. Thus, the reductions in peak water levels and flooding for Sandy are mainly due to a reduction in the astronomical tide, whereas for 1821 the reduction in storm surge is dominant. Since the 1821 event occurred near tidal Low Water (LW), the decreased tidal range (smaller LW) actually increases the astronomical contribution to the peak water level for SC2.
Figure 9. Time series of (top) water level, (middle) surge, and (bottom) tide level at JBI for Sandy (left) and the 1821 Hurricane (right), for the control runs and two shallowing scenarios.
Jmse 03 00654 g009

4. Discussion

The primary result of the scenario experiments is that reductions of channel depth have a much stronger leverage on flood levels inside Jamaica Bay than wetland restoration, for these two extreme flood events. The full shallowing scenario (SC2) reduces peak water levels in the bay by 15% and 46%, for Sandy and 1821 respectively, and full wetland restoration only 0% and 2%, respectively. The narrow section of the inlet is demonstrated to exert strong leverage over water levels in the bay, as scenario SC3 shows reductions of 7% and 30%, respectively. This suggests that the inlet alone can provide about half (46% for Sandy and 65% for 1821) of the benefit observed in the full shallowing scenario (SC2), dividing the water level reduction for SC3 by the reduction for SC2. Thus, the channel shallowing scenarios demonstrate that reducing estuary or inlet depth can be a powerful option for reducing the inland penetration of coastal floods.
The utility of wetlands for flood protection is often cited as a reason to build or restore wetlands, and in some cases they can cause reductions in flooding [11]. These results suggest that the presence of deep shipping channels can eliminate this benefit, even with wetland restoration on a massive scale. Though 40% (24 km2) of Jamaica Bay is wetlands in SC1 (Figure 2), the deep inlet and circumferential deep channels inside the bay efficiently deliver flood waters to the surrounding neighborhoods. A recent modeling study showed similar results for an idealized coastline that mimicked the Gulf Coast, demonstrating how increasing channel sizes lead to increasing storm surge penetration through a coastal wetland [34]. In spite of the minimal effect wetlands have on coastal flooding in this study, wetlands are also known to provide wave attenuation benefits, and they can reduce erosion by stabilizing sediments [35]; neither is quantified in this study. Moreover, they provide high-value habitat and ecosystem services, as summarized in the recent Corps of Engineers report on nature-based coastal resilience [1].
Storm characteristics such as track, speed, size, central pressure and wind speed (Figure 3) are well-known to influence the development of surge on the continental shelf [31,36], but these results also suggest that the characteristics of the hurricane affect the amount of flood-mitigation benefit of local changes to the bay, as has previously been observed with wetlands, e.g., [11]. Even though the overall peak water level in the 1821 control case was about 1 m less than the Sandy case in Jamaica Bay (Figure 9), significantly more benefit was derived thru shallowing in terms of reductions in peak water level and flood area (Figure 8 and Figure 9). As discussed below in Section 4.1., tidal theory provides additional insights into the observed differences in the efficacy of shallowing for the two hurricanes. In Section 4.2, we discuss the broader considerations and timescale over which a shallowing strategy could take place.

4.1. Physics of Channel Depth and Storm Tides

Flood waters are widely known to be slowed by increased friction when passing through wetlands, and this can reduce flooding when it prevents inland propagation of a storm surge [36]. Moreover, the amplitude of the surge wave is reduced, much like a river flood wave is reduced when flowing through vegetation. In studies of tidal dynamics, the interplay between water depth, tidal frequency and friction has long been studied [37,38,39,40]. However, little attention has been paid to the influence of channel and inlet depths on storm surge propagation.
Both tides and storm surge are “sea-level events” causing anomalies in sea level of varying durations, although surges are atmospherically-forced waves and tides are gravitationally-forced waves composed of constituents with well-defined periods. Tides and surges in harbors and inlets are both defined as long, or shallow water, waves, in which the wavelength is much longer than the depth. Shallow (or narrow) channels at inlets and inside estuaries can reduce inland penetration of a sea level anomaly due to a “choking” effect of reducing the cross-sectional area of the channel and the amount of water transported in and out of a bay or estuary, as is the case in the NY Bight region at Barnegat Bay and Great South Bay [41]. This is illustrated by the relative effectiveness of the inlet shallowing scenario, SC3.
The time scale of the sea-level event, whether it be tides or a storm surge, can also influence its penetration into a bay or estuary. Compared to fast-pulse events such as the 1821 Hurricane, storm surges from cold-season storms (e.g., nor’easters) have a longer time scale, on the order of 1 day, and the choking and frictional effects of a shallow inlet or channel may be lessened. A more rapid sea-level event such as semi-diurnal tide may be attenuated more strongly by a shallow inlet or channel [41]. Physically, a fast moving wave produces stronger velocities, leading to greater dissipation of energy (which scales as U3/H, where U is the velocity and H is the water depth) and attenuation. A sea-level event like Hurricane Sandy’s storm tide can be a combination of both short- and long-timescale events. During the days preceding landfall, water levels in Jamaica Bay steadily increased and were 1.3 m above the predicted tidal levels 12 h before the peak. This “forerunner surge” [42] penetrated into coastal embayments with little attenuation, and was followed by a more rapid sea-level pulse in the final hours. The 1821 Hurricane, on the other hand, was a very fast-pulse flood event, with nearly all of its storm surge (82% or 2.3 m) arriving in the final four hours (Figure 9). The different storm sizes and tracks played a large role in creating these differences in surge time-scale; Sandy, with a more offshore track (Figure 3) and very large size (radius of maximum winds 220 km just before landfall), caused moderately strong northeast winds in NY Bight for over two days before landfall, whereas the 1821 storm had an along-coast track right over NYC and a much smaller size (estimated radius of maximum winds 40 km), causing the wind-blown surge to be driven by east winds over only a few hours.
The interacting roles of friction, channel depth and wave period have been considered for estuary channels before, in the context of tide dynamics. For an idealized, rectangular basin [39], the damping term in the equation of motion depends on rU/H, where r is the linearized friction coefficient, U in the tidal velocity, and H is the mean depth. Hence, as noted by Ianniello [37] and Burchard [43], decreasing the system’s depth has a similar dynamical effect as increasing the friction or wave frequency. This is one reason why the attenuation of the diurnal tide can be different than the semi-diurnal tide in tidal rivers, though non-linear interaction between constituents and river flow must be considered [40]. Based on this linearized scaling, a 3-fold decrease in channel depth (e.g., 6 m to 2 m) has a similar dynamical effect as a 3-fold increase in drag coefficient. Similar results are found by Friedrichs and Aubrey [38] for tidal propagation in convergent estuaries.
The peak surge results for Sandy (Table 1) show a relatively small reduction of 0.15 m at JBI for the full shallowing scenario, indicating that the water level reduction of 0.49 m at that station was predominantly (69%) due to a reduction in the tide. On the other hand, the surge reduction of 1.41 m for the 1821 Hurricane at JBI represents slightly more than 100% of the reduction in total water level, 1.33 m. The forerunner surge, combined with higher mean depth due to the tidal stage, means that the mean water depth just before Sandy’s landfall was ~2 m greater than during a similar phase of the 1821 event. Model results also demonstrate that flow velocities in the inlet were significantly larger during 1821 (1.94 m·s−1) than in 2012 (1.03 m·s−1), due to the smaller time scale over which water levels rose. Combined, the depth and velocity effects both act to attenuate and mitigate the 1821 event more than Sandy in SC2 and SC3.
Two primary processes reduce storm-tide magnitudes within Jamaica Bay. The reduction of depths with SC2 (full shallowing) and the greater resulting frictional drag increase the shallow water wave attenuation (SC2). The reduction of inlet depth only (SC3) constricts flow, producing only a choking effect. The reductions in peak water level for SC3 are about half of those for SC2, demonstrating that the effects are of roughly similar magnitude. Nonetheless, the increased damping in the SC2 scenario appears to produce the positive effect of reducing surge wave reflection, which likely causes increased flooding near the inlet in SC3 (Figure 8). Careful consideration must therefore be made to avoid unwanted side-effects when designing coastal flood mitigation strategies.
The shallowing experiments also induce a lag in the times of peak surge and peak water level, relative to the control runs, and the sizes of these lags typically show inverse relationships with water depth and sea level pulse period. Defining the “lag” as the time of the peak in the full shallowing (SC2) experiment minus the time of the peak in the control run, the lags of peak surge are 10 (Sandy) and 40 min (1821). The lags of peak water level are 60 (Sandy) and 30 min (1821). The lags in tide-only runs are substantially larger, at 110 (Sandy) and 90 min (1821) (Figure 9). The lags are usually larger for cases when there is shallower water (e.g., tide-only runs), consistent with stronger frictional effects. The reason for the small time lag for surge with Sandy SC2 (10 min) is because the water is deep when the final pulse arrives, even in the shallowing experiments, and the pulse has a long period (relative to tide or water level, which have lags of 110 and 60 min, respectively). The 1821 surge has a 40 min lag, and this moderately large lag can be explained by the surge pulse coming on top of a low tide, so in shallow water, and having a short pulse period. Lastly, the lags for SC3 (inlet shallowing) are about half those for SC2 (full shallowing), suggesting more shallow water area (and smaller bay-average depth) leads to larger lags. In conclusion, these results are generally consistent with the interpretation of frictional effects being the dominant reason that shallowing is effective at reducing peak storm-driven water levels, dependent upon both pulse period and water depth. It is also noteworthy that the lags of 30–60 min in peak water level could be viewed as additional protection against flooding, slowing arrival of the flooding in addition to reducing the water levels.
The results shown in this manuscript are broadly consistent with the results of Talke et al. [25], who hypothesized that local changes to bathymetry and channel depth in New York Harbor could help explain the long-term trends in storm tides measured at tide gauges. Nonetheless, the detailed hydrodynamic effects of channel shallowing require further study and may be highly site or storm specific. As shown in Figure 8, there are locations where a shallowed channel might worsen flooding. An analogy can be made to river channels, where constricting a channel cross-sectional area can produce flooding upstream.

4.2. Broader Considerations for Shallowing as Mitigation of Coastal Flooding

As a flood adaptation strategy, channel shallowing can be challenging if the channels were historically dredged for navigational purposes and there is an economic driver behind their maintenance. In the case of Jamaica Bay, the use of deep-hull shipping in the bay has decreased, but there are still important commercial shipping and municipal (e.g., sewage sludge transport, fire safety access) uses of the deep channels [44]. The use of a dredged channel as a public recreational amenity (e.g., fishing charters) can be extremely important. However, most fishing and recreational vessels in this region have draft depths of no more than 2 m, relative to the channel depth of 6 m, so some degree of shallowing may be possible. Looking more broadly around the world, the flood impacts of proposed channel deepening projects should be quantified using a range of realistic local storm tide events (e.g., fast-pulse and slow-pulse), to evaluate whether they would worsen flooding at inland locations.
The practicality of creating and maintaining shallow depths is also an open question. At one extreme, shallowing could be accomplished through direct sediment in-fill, similar to beach replenishment. However, for some systems like Jamaica Bay, this would require much larger volumes of sediment than beach replenishment. Moreover, designing an optimal in-fill strategy that would allow a bathymetric equilibrium to quickly develop is a challenging engineering problem.
At the other extreme, shallowing could simply be initiated by decommissioning a dredged channel and allowing natural sedimentation to occur over a longer period of time. This could be a simple and potentially cost-effective strategy, though the shallowing would need to occur at a rate faster than the sea level rise rate, to reduce flood levels. The cessation of maintenance dredging is referred to by the USACE as “de-authorization” and would require an economic assessment of tradeoffs. De-authorization is not likely viable for large, high-traffic channels. However, one recent example exists with the Mississippi River Gulf Outlet canal, a shipping channel that was de-authorized by the USACE in 2007, in part because of a debate over whether it caused increased storm surge penetration. The channel was physically blocked in 2009 [45].
These considerations suggest that further study is required to understand the morphodynamic processes and timescales that control long-term sedimentation in Jamaica Bay and the broader New York Harbor area. At least one formerly-dredged system within New York Harbor area, the Passaic River estuary, has recovered to pre-dredging depths over the time scale of decades [46]. There is some evidence that Jamaica Bay is sediment-starved [44], but a shallowing of the Jamaica Bay might naturally occur over many decades. More research is needed to better understand the sediment transport processes and budget for Jamaica Bay and the surrounding region, and the potential effects of channel-depth modification thereon. It is possible, for example, that channel shoaling would reduce sediment transport by reducing tidal exchange, thus exerting a self-reinforcing effect, once initiated.
A gradual channel shallowing over many decades could provide flood risk reduction on a timescale that is similar to that of the sea level rise. The full shallowing scenario results reported here show reductions in flood levels of 0.50 and 1.16 m for Sandy and the 1821 Hurricane, comparable to the central range of sea level rise estimates (25th–75th percentile) expected for the 2080s, 0.56–1.27 m [47]. It is also noteworthy that the reduction in peak tide levels for adaptation scenarios 2 and 3 (Figure 9) would also protect against nuisance-flooding from “king tides” or from rainfall at times when sewer drainage is blocked by high tides. These types of flooding already occur in the low-lying Jamaica Bay neighborhoods such as Old Howard Beach and Broad Channel.
The water-quality and ecosystem impacts of shallowing for a given site would also require considerable study. Creek and inlet bathymetric recontouring has been identified as a restoration technique appropriate for smaller-scale tidal tributaries of Jamaica Bay, to decrease residence time of water and improve water quality [48]. However, the shallowing of an inlet can reduce the water exchange between the bay area and the open ocean, which could adversely impact the water quality inside the bay. An extreme example of the relationship between inlets and flushing is the breach on Fire Island, which was left open because of its potential to improve water quality due to increased flushing of stagnant bay waters [49].

5. Summary and Conclusions

In this study, we have explored the potential for mitigation of coastal flooding by natural systems, focusing on New York City’s Jamaica Bay. Water depths in the bay have increased from an average of 1 m to 5 m since the mid-1800s, due in part to extensive channel dredging, and tidal marsh islands in the Bay have been rapidly eroding. For these reasons, we conducted numerical model experiments into how much leverage extensive restoration of wetlands or shallowing of dredged channels can have in reducing coastal flooding from the city’s two highest historical storm tide events, Hurricane Sandy and the 1821 Hurricane.
Results show that restoring wetlands in the center of the bay to their 1879 footprint results in relatively small reductions in peak water levels (0.3% and 2.4% for Sandy and 1821, respectively) and flood area, while shallowing of dredged channels leads to much greater reductions (15% and 46%). A third scenario that shallowed only the narrowest region of the bay’s inlet found roughly half as much (46%–65%) reduction in flood levels in the bay, relative to the full shallowing scenario.
Flood waters are widely known to be slowed by increased friction when passing through wetlands, and this can in some cases reduce flooding when it prevents inland propagation of a storm surge. Water depths and friction have been shown to have parallel influences through estuarine channels when it comes to tide propagation, and here we have demonstrated similar effects for storm tides at Jamaica Bay. The relative efficacy of shallowing for the 1821 Hurricane demonstrates that channel shallowing is particularly effective at reducing peak water levels at inshore locations for fast-pulse sea level events with periods of several hours.
For Jamaica Bay, we have begun conducting deeper analyses into the impacts that a broader set of coastal adaptation measures would have on flooding, water quality and storm waves, as well as for a range of different storms. The realism of channel shallowing must be evaluated in terms of other societal interests (e.g., recreation or shipping), costs, time frame, and the availability of sediments or other materials for in-fill. However, no method of coastal flood mitigation is without its limitations, and here we have demonstrated a novel and effective approach for reducing coastal flooding.
These results suggest that when looking at nature-based solutions to sea level rise, more focus needs to be placed on sedimentary systems and bathymetry, including deep channels and topography in wetland areas, and not simply on wetlands. Regardless of whether Jamaica Bay shallowing is ever practical or economically affordable, we hope that the modeling and physical conceptualization above will help inspire additional creative research into nature-based and gray-green solutions for coastal flooding.

Acknowledgments

The authors would like thank Gena Wirth, Philippa Brashear, Lauren Elachi, Emily Silber and Kate Orff (SCAPE design), and Eric Sanderson and Mario Giampieri (Wildlife Conservation Society) for their fruitful collaborations and important contributions to moving this research forward. We would also like to thank Megan Linkin (Swiss Re) for sharing data on the 1821 Hurricane. Funding for the Stevens Institute researchers conducting this research was provided by the NOAA-RISA project “Consortium for Climate Risk in the Urban Northeast” (Rosenzweig, PI), and the NOAA-CPO-CSI-COCA project “Quantifying the Value and Communicating the Protective Services of Living Shorelines Using Flood Risk Assessment”, award NA13OAR4310144. Funding for Stefan Talke was under National Science Foundation (NSF) award OCE-1155610 and U.S. Army Corps of Engineers, sponsor award number W1927N-14-2-0015. Computer modeling was made possible, in part, by a grant of computer time from the City University of New York High Performance Computing Center under NSF Grants CNS-0855217, CNS-0958379 and ACI-1126113.

Author Contributions

P.O. designed the experiments, interpreted results, and wrote most the text; S.T. and D.J. helped interpret results and write text; L.Y. designed the model grid and ran the validation experiments; A.B. helped write the text and create the model; N.G. helped create the model and interpret results; H.Z. helped write text; H.R. helped interpret results; and K.M. developed a figure and helped write text.

Conflicts of Interest

The authors declare no conflicts of interest.

References

  1. Bridges, T.S.; Wagner, P.W.; Burks-Copes, K.A.; Bates, M.E.; Collier, Z.A.; Fischenich, C.J.; Gailani, J.Z.; Leuck, L.D.; Piercy, C.D.; Rosati, J.D. Use of Natural and Nature-Based Features (NNBF) for Coastal Resilience; Engineer Research and Development Center, Vicksburg MS Environmental Lab: Vicksburg, MS, USA, 2015. [Google Scholar]
  2. Hanson, H.; Brampton, A.; Capobianco, M.; Dette, H.; Hamm, L.; Laustrup, C.; Lechuga, A.; Spanhoff, R. Beach nourishment projects, practices, and objectives—A European overview. Coast. Eng. 2002, 47, 81–111. [Google Scholar] [CrossRef]
  3. City of New York. A Stronger, More Resilient New York; City of New York: New York, NY, 2013; p. 445.
  4. Orton, P.; Vinogradov, S.; Georgas, N.; Blumberg, A.; Lin, N.; Gornitz, V.; Little, C.; Jacob, K.; Horton, R. New York City Panel on Climate Change 2015 Report Chapter 4: Dynamic Coastal Flood Modeling. Ann. N. Y. Acad. Sci. 2015, 1336, 56–66. [Google Scholar] [CrossRef] [PubMed]
  5. Swanson, R.; West-Valle, A.; Decker, C. Recreation vs. waste disposal: The use and management of Jamaica Bay. Long Isl. Hist. J. 1992, 5, 21–41. [Google Scholar]
  6. Swanson, R.L.; Wilson, R.E. Increased tidal ranges coinciding with Jamaica Bay development contribute to marsh flooding. J. Coast. Res. 2008, 1565–1569. [Google Scholar] [CrossRef]
  7. NYC-DEP. Jamaica Bay Watershed Protection Plan; New York City Department of Environmental Protection (DEP): New York, NY, USA, 2007; Volume 1, p. 128.
  8. USACE. Fact Sheet: Jamaica Bay Marsh Islands. Available online: http://www.nan.usace.army. mil/Missions/CivilWorks/ProjectsinNewYork/EldersPointJamaicaBaySaltMarshIslands.aspx (accessed on 13 July 2015).
  9. NYC-DEP. Jamaica Bay Watershed Protection Plan, One-Year Progress Report; New York City Department of Environmental Protection: New York, NY, USA, 2008; p. 64.
  10. Corps of Engineers. Interim Survey Report, Morgan City, Louisiana and Vicinity: Serial no. 63; U.S. Army Corps of Engineers District: New Orleans, LA, USA, 1963. [Google Scholar]
  11. Wamsley, T.V.; Cialone, M.A.; Smith, J.M.; Atkinson, J.H.; Rosati, J.D. The potential of wetlands in reducing storm surge. Ocean Eng. 2010, 37, 59–68. [Google Scholar] [CrossRef]
  12. Scileppi, E.; Donnelly, J.P. Sedimentary evidence of hurricane strikes in western Long Island, New York. Geochem. Geophys. Geosyst. 2007, 8. [Google Scholar] [CrossRef]
  13. Swiss Re. The big one: The East Coast’s USD 100 billion hurricane event; Swiss Re America Holding Corporation: Armonk, NY, USA, 2014; p. 21. [Google Scholar]
  14. Doxsey-Whitfield, E.; MacManus, K.; Adamo, S.B.; Pistolesi, L.; Squires, J.; Borkovska, O.; Baptista, S.R. Taking advantage of the improved availability of census data: A first look at the Gridded Population of the World, Version 4 (GPWv4). Appl. Geogr. 2015, in press. [Google Scholar]
  15. Columbia University Center for International Earth Science Information Network (CIESIN). New York City, 5 meter Low Elevation Coastal Zone Population Estimates. Available online: http://www.ciesin.columbia.edu/data/nyc5mlecz2010/nyc5mlecz2010.zip (accessed on 13 July 2015).
  16. Blumberg, A.F.; Georgas, N. Quantifying uncertainty in estuarine and coastal ocean circulation modeling. J. Hydraul. Engin. 2008, 134, 403–415. [Google Scholar] [CrossRef]
  17. Blumberg, A.F.; Khan, L.A.; St John, J. Three-dimensional hydrodynamic model of New York Harbor region. J. Hydraul. Eng. 1999, 125, 799–816. [Google Scholar] [CrossRef]
  18. Georgas, N.; Blumberg, A.F. Establishing Confidence in Marine Forecast Systems: The Design and Skill Assessment of the New York Harbor Observation and Prediction System, Version 3 (NYHOPS v3). In Proceedings of the Eleventh International Conference in Estuarine and Coastal Modeling (ECM11), Seattle, WA, USA, 4–6 November 2009.
  19. Georgas, N.; Blumberg, A.; Herrington, T. An operational coastal wave forecasting model for New Jersey and Long Island waters. Shore Beach 2007, 75, 30–35. [Google Scholar]
  20. Blumberg, A.; Georgas, N.; Yin, L.; Herrington, T.; Orton, P. Street scale modeling of storm surge inundation along the New Jersey Hudson River waterfront. J. Atmos. Oceanic Technol. 2015, 32. [Google Scholar] [CrossRef]
  21. FEMA. Region II Coastal Storm Surge Study: Overview; Federal Emergency Management Agency: Washington, DC, USA, 2014; p. 15.
  22. Georgas, N.; Orton, P.; Blumberg, A.; Cohen, L.; Zarrilli, D.; Yin, L. The impact of tidal phase on Hurricane Sandy's flooding around New York City and Long Island Sound. J. Extreme Events 2014, 1, 1450006. [Google Scholar] [CrossRef]
  23. Bunya, S.; Dietrich, J.C.; Westerink, J.J.; Ebersole, B.A.; Smith, J.M.; Atkinson, J.H.; Jensen, R.; Resio, D.T.; Luettich, R.A.; Dawson, C.; et al. A high-resolution coupled riverine flow, tide, wind, wind wave, and storm surge model for Southern Louisiana and Mississippi. Part I: Model development and validation. Mon. Weather. Rev. 2010, 138, 345. [Google Scholar] [CrossRef]
  24. Mattocks, C.; Forbes, C. A real-time, event-triggered storm surge forecasting system for the state of North Carolina. Ocean Model. 2008, 25, 95–119. [Google Scholar] [CrossRef]
  25. Talke, S.; Orton, P.; Jay, D. Increasing storm tides at New York City. Geophys. Res. Lett. 2014, 41, 1844–2013. [Google Scholar] [CrossRef]
  26. Kussman, A.S. Report on the Hurricane of September 3, 1821; U.S. Weather Bureau: New York, NY, USA, 1957; p. 54.
  27. Boose, E.R.; Chamberlin, K.E.; Foster, D.R. Landscape and regional impacts of hurricanes in New England. Ecol. Monogr. 2001, 71, 27–48. [Google Scholar] [CrossRef]
  28. Holland, G.J. An analytic model of the wind and pressure profiles in hurricanes. Mon. Weather. Rev. 1980, 108, 1212–1218. [Google Scholar] [CrossRef]
  29. Jelesnianski, C.; Chen, J.; Shaffer, W.; Oceanic, U.S.N.; Administration, A.; Service, U.S.N.W. SLOSH: Sea, lake, and overland surges from hurricanes; US Dept. of Commerce, National Oceanic and Atmospheric Administration, National Weather Service: Silver Spring, MD, USA, 1992.
  30. USC & GS. Jamaica Bay and Rockaway Inlet, Long Island, New York; United States Coast and Geodetic Survey: Washington, DC, USA, 1879.
  31. Orton, P.; Georgas, N.; Blumberg, A.; Pullen, J. Detailed modeling of recent severe storm tides in estuaries of the New York City region. J. Geophys. Res. 2012, 117, C09030. [Google Scholar] [CrossRef]
  32. Wang, H.V.; Loftis, J.D.; Liu, Z.; Forrest, D.; Zhang, J. The storm surge and sub-grid inundation modeling in New York City during Hurricane Sandy. J. Mar. Sci. Eng. 2014, 2, 226–246. [Google Scholar] [CrossRef]
  33. Forbes, C.; Rhome, J.; Mattocks, C.; Taylor, A. Predicting the storm surge threat of Hurricane Sandy with the National Weather Service SLOSH model. J. Mar. Sci. Eng. 2014, 2, 437–476. [Google Scholar] [CrossRef]
  34. Loder, N.; Irish, J.; Cialone, M.; Wamsley, T. Sensitivity of hurricane surge to morphological parameters of coastal wetlands. Estuar. Coast. Shelf Sci. 2009, 84, 625–636. [Google Scholar] [CrossRef]
  35. Shepard, C.C.; Crain, C.M.; Beck, M.W. The protective role of coastal marshes: A systematic review and meta-analysis. PLoS ONE 2011, 6. [Google Scholar] [CrossRef] [PubMed]
  36. Resio, D.T.; Westerink, J.J. Modeling the physics of storm surges. Phys. Today 2008, 61, 33–38. [Google Scholar] [CrossRef]
  37. Ianniello, J. Tidally induced residual currents in estuaries of constant breadth and depth. J. Mar. Res. 1977, 35, 755–786. [Google Scholar]
  38. Friedrichs, C.T.; Aubrey, D.G. Tidal propagation in strongly convergent channels. J. Geophys. Res. 1994, 99, 3321–3336. [Google Scholar] [CrossRef]
  39. Dronkers, J.J. Tidal computations in rivers and coastal waters; North Holland Publishing: Amsterdam, The Netherlands, 1964; p. 296. [Google Scholar]
  40. Jay, D.A. Green’s law revisited: Tidal long-wave propagation in channels with strong topography. J. Geophys. Res. 1991, 96, 20585–20598. [Google Scholar] [CrossRef]
  41. Aretxabaleta, A.L.; Butman, B.; Ganju, N.K. Water level response in back-barrier bays unchanged following Hurricane Sandy. Geophys. Res. Lett. 2014, 41, 3163–3171. [Google Scholar] [CrossRef]
  42. Kennedy, A.B.; Gravois, U.; Zachry, B.C.; Westerink, J.J.; Hope, M.E.; Dietrich, J.C.; Powell, M.D.; Cox, A.T.; Luettich, R.A.; Dean, R.G. Origin of the Hurricane Ike forerunner surge. Geophys. Res. Lett. 2011, 38. [Google Scholar] [CrossRef]
  43. Burchard, H. Combined effects of wind, tide, and horizontal density gradients on stratification in estuaries and coastal seas. J. Phys. Oceanogr. 2009, 39, 2117–2136. [Google Scholar] [CrossRef]
  44. Seavitt, C.; Alexander, K.; Alessi, D.; Sands, E. Shifting Sands: Sedimentary Cycles for Jamaica Bay, New York; Catherine Seavitt Nordenson: New York, NY, USA, 2015; p. 218. [Google Scholar]
  45. Shaffer, G.P.; Day, J.W., Jr.; Mack, S.; Kemp, G.P.; van Heerden, I.; Poirrier, M.A.; Westphal, K.A.; FitzGerald, D.; Milanes, A.; Morris, C.A. The MRGO Navigation Project: A massive human-induced environmental, economic, and storm disaster. J. Coast. Res. 2009, 54, 206–224. [Google Scholar] [CrossRef]
  46. Chant, R.J.; Fugate, D.; Garvey, E. The shaping of an estuarine superfund site: Roles of evolving dynamics and geomorphology. Estuar. Coasts 2011, 34, 90–105. [Google Scholar] [CrossRef]
  47. Horton, R.; Little, C.; Gornitz, V.; Bader, D.; Oppenheimer, M. New York City Panel on Climate Change 2015 report Chapter 2: Sea level rise and coastal storms. Ann. N. Y. Acad. Sci. 2015, 1336, 36–44. [Google Scholar] [CrossRef] [PubMed]
  48. USACE. Hudson-Raritan Estuary Comprehensive Restoration Plan Potential Restoration Opportunities Project Summary Sheets: Jamaica Bay, United States Army Corps of Engineers; USCAE: New York, NY, USA, 2014; p. 138. [Google Scholar]
  49. Hapke, C.J.; Stockdon, H.F.; Schwab, W.C.; Foley, M.K. Changing the paradigm of response to coastal storms. Eos Trans. Am. Geophys. Union 2013, 94, 189–190. [Google Scholar] [CrossRef]

