Article

The Oscillating Behavior of Trawl Codends Including Various Geometric Configurations of Simulated Catch

1
College of Marine Sciences, Shanghai Ocean University, 999 Huchenghuan Road, Lingang New District, Shanghai 201306, China
2
National Engineering Research Center for Oceanic Fisheries, Shanghai 201306, China
3
Key Laboratory of Oceanic Fisheries Exploration, Ministry of Agriculture and Rural Affairs, Shanghai 201306, China
4
The Key Laboratory of Sustainable Exploitation of Oceanic Fisheries Resources, Shanghai Ocean University, Ministry of Education, Shanghai 201306, China
5
Scientific Observing and Experimental Station of Oceanic Fishery Resources, Ministry of Agriculture and Rural Affairs, Shanghai 201306, China
6
Faculty of Marine Science, Tokyo University of Marine Science and Technology, Minato, Tokyo 108-8477, Japan
*
Authors to whom correspondence should be addressed.
J. Mar. Sci. Eng. 2023, 11(5), 1026; https://doi.org/10.3390/jmse11051026
Submission received: 31 March 2023 / Revised: 4 May 2023 / Accepted: 9 May 2023 / Published: 11 May 2023
(This article belongs to the Special Issue Advanced Analysis of Marine Structures)

Abstract

:
Codends are the posterior components of trawl nets that collect the catch and play a crucial role in the selectivity process. Due to the accumulation of catch and the variety of catch types, the quality of catch and trawl selectivity can be negatively impacted. Therefore, this study aims to investigate the effects of various catch configurations on the hydrodynamic characteristics, geometrical profile, and fluttering motions of the codend in a flume tank. A codend structure was designed and tested using various catch configurations, including grooved-type configurations (canvas, green canvas, basketballs) and spherical configurations (table tennis balls filled with water, balloons filled with water, and balls made of twine) in the flume tank. The sea trial data were compared with the flume tank data. The results indicate that there were no significant differences in the codend profiles between the different catch configurations. The drag of the codend with a grooved-type configuration was 13.63% greater than that obtained using a spherical configuration as the catch. The wavelet coefficient obtained from the codend drag revealed that the oscillations of the codend with a grooved-type catch configuration began at a periodicity of 0.07 s and were more intense than that of the codend with the spherical catch configuration. Moreover, these amplitudes increased as the codend flow velocity increased. The wavelet analysis results showed that the dominant frequency of the periodic high-energy coherent structures for the codend drag and codend displacements was detected at a low-frequency. In terms of displacement oscillation characteristics, the table tennis ball filled with water was an approximate substitute for real catch during the sea trial because the difference in wavelet coefficients for the codend displacements in amplitude and the period between the model codend with the table tennis ball filled with water and the full-scale codend was 91% and 89%, respectively. The findings of this study confirm the feasibility of replacing real catch with simulated catch configurations with similar shapes in model testing. They can provide basic scientific data for improving the hydrodynamic characteristics and selectivity of the codend structure.

1. Introduction

The codend structure, located at the rear of the trawl net, is a critical component of the trawl net that is used to collect the catch during the trawling process, with a drag that accounts for 10% of the total drag of the trawl net [1,2]. Thus, understanding its hydrodynamic behavior and fluttering motions is crucial for determining trawl stability, improving catch performance, and comprehending the juvenile fish escape process in codends. The underwater shape, selectivity, and hydrodynamic characteristics of the codend are highly influenced by catch configurations inside the codend and dependent on the structure’s flexible characteristics, mesh size, twine diameter, and fishing operation parameters [3,4,5].
Indeed, depending on the catch type, catch accumulations, and catch shape, the codend structure bulges and oscillates, resulting in a variation in the codend’s front mesh opening, which affects the drag, shape, and stability of the codend [6]. Consequently, the scientific community has been increasingly focused on addressing one of the primary challenges, which is the development and innovation of codend design based on simulated catch configurations that accurately emulate the shape of actual catches within a full-scale codend. This development aims to enhance the selective properties of the codend and promote greater sustainability within the fisheries sector [7,8].
Several studies have reported on experimental studies on the analysis of codend behavior over the last few decades. O’Neill et al. [9] discovered that as catch accumulates, the front mesh of the codend closes and the codend shape bulges, increasing codend motions and codend drag. Therefore, when various types of fish enter in the codend, they are gradually pressed and blocked at the end-part of the codend, causing a change in codend volume, which then affects the trawl’s drag and water filtering performance [10]. Priour et al. [11] compared the shape of the T90 mesh and traditional T0 mesh on the codend and discovered that the T90 codend is more conducive to juvenile fish escape, while the T90 codend with catch has a larger geometric configuration bulge and greater drag than the T0 codend [12]. Indeed, the presence of catch inside the trawl net will reduce the mesh opening of the codend, which will limit the flow passage through the codend and lead to the creation of vortex shedding behind the codend and turbulent flow due to the codend wake. Theses turbulent flows will create a pressure gradient on the codend surface that will create intense codend motions and may affect selectivity via the fish response, such as swimming speed and maneuverability [13,14,15]. Thus, keeping the trawl system in a relatively stable state is required to reduce codend oscillation, which causes skin damage to the fish and a decline in quality [16,17]. As a result of flume tank experiments, some progress has been made in the analysis of the complex interaction between a flexible fluttering trawl net and turbulent flow. According to Priour and Prada [18], the codend oscillations and configurations are primarily determined by the shape of catch and mesh, and as the catch obstructs the water flow passage directly through the mesh, codend oscillations are produced [19]. Druault and Germain [20] investigated the flow in the unsteady wake formed behind the fluttering codend structure and discovered that the codend oscillations can be caused by the local hydrodynamic effects that occur in the wake zone as well as the motion of the fluttering codend. Thierry et al. [21,22] used an electromagnetic current meter to investigate the distribution of the flow field inside and around the bottom trawl net model, revealing that changes in the surrounding unsteady flow produced oscillations in different parts of the trawl net, affecting catch quality and the overall trawl net performance.
Furthermore, various catch configurations have recently been used to simulate catches inside the codend rather than actual catches such as fish to avoid adverse effects on precision instruments and water quality. O’Neill and O’Donoghue [16] used small polystyrene nettings of sufficient size as the simulated catch to measure the geometric shape of the trawl codend and analyze its shape and pressure distribution. In the codend selectivity experiments, O’Neill et al. [23] used water-filled balloons instead of real catch, indicating that the codend oscillations were rather obvious. Bouhoubeiny et al. [13] used Particle Image Velocimetry (PIV) technology to measure the wake effect and flow field around the codend with a hemispherical cap and water-filled balloon instead of the actual catch, and discovered that the oscillating motion of the codend model was very significant. Madsen et al. [24] used the small plastic bags filled with water in the flume tank to analyze the behavior of different codends, revealing that the drag of two-panel T90 codends was lower than that of other codends, while indicating that the T0 codend oscillation effects were greater than those of other codends. Thierry et al. [2] used an elliptical-shaped piece of polyvinyl chloride canvas attached to the posterior of the codend and positioned slightly over the top of the codend, similar to Kim [14], to analyze the motions of the shaking codend in the flume tank. Thierry et al. [2] and Liu et al. [7] used the table tennis balls filled with, on average, 0.045 kg of water each to simulate the fish catch inside the gear and demonstrated that the codend with catch created more instabilities of the codend motion, which can influence both the catch quality and the whole trawl performance compared to the codend without catch.
However, despite the existing work on the subject and the available data, there is no relevant conclusion from the experimental studies evaluating the effect of geometric catch configuration on the hydrodynamic characteristics of codend linked to its fluttering motion and comparing them to real fish in the sea trial in order to solve the problem of selectivity and better understand fish behavior. Furthermore, in previous studies, the different types of catches in the study of codend oscillation were not taken into account in order to reliably improve the drag and understand the catch process and fish selectivity.
This study aims to evaluate the effects of the geometric catch configuration on codend oscillation motions, drag, and the geometrical shape of the codend. Thus, a model codend was designed and assembled based on the full-scale codend used in midwater trawl fisheries and was tested in the flume tank using six kinds of simulated catch configurations, such as grooved and spherical types. The measurements were conducted under five flow velocities, and the measured data were compared with those obtained using the sea trials in order to discuss the relevant information that could be used to improve codend selectivity, reduce energy consumption, and understand fish behavior. The continuous wavelet transform was used to analyze the time-frequency characteristics of the temporal codend drag and fluttering codend motions. The findings of this study will assist researchers in selecting the most appropriate simulated catch types and will provide basic scientific data for optimizing the codend structure.

2. Materials and Methods

2.1. Evaluation of the Full-Scale Prototype and Data Collection
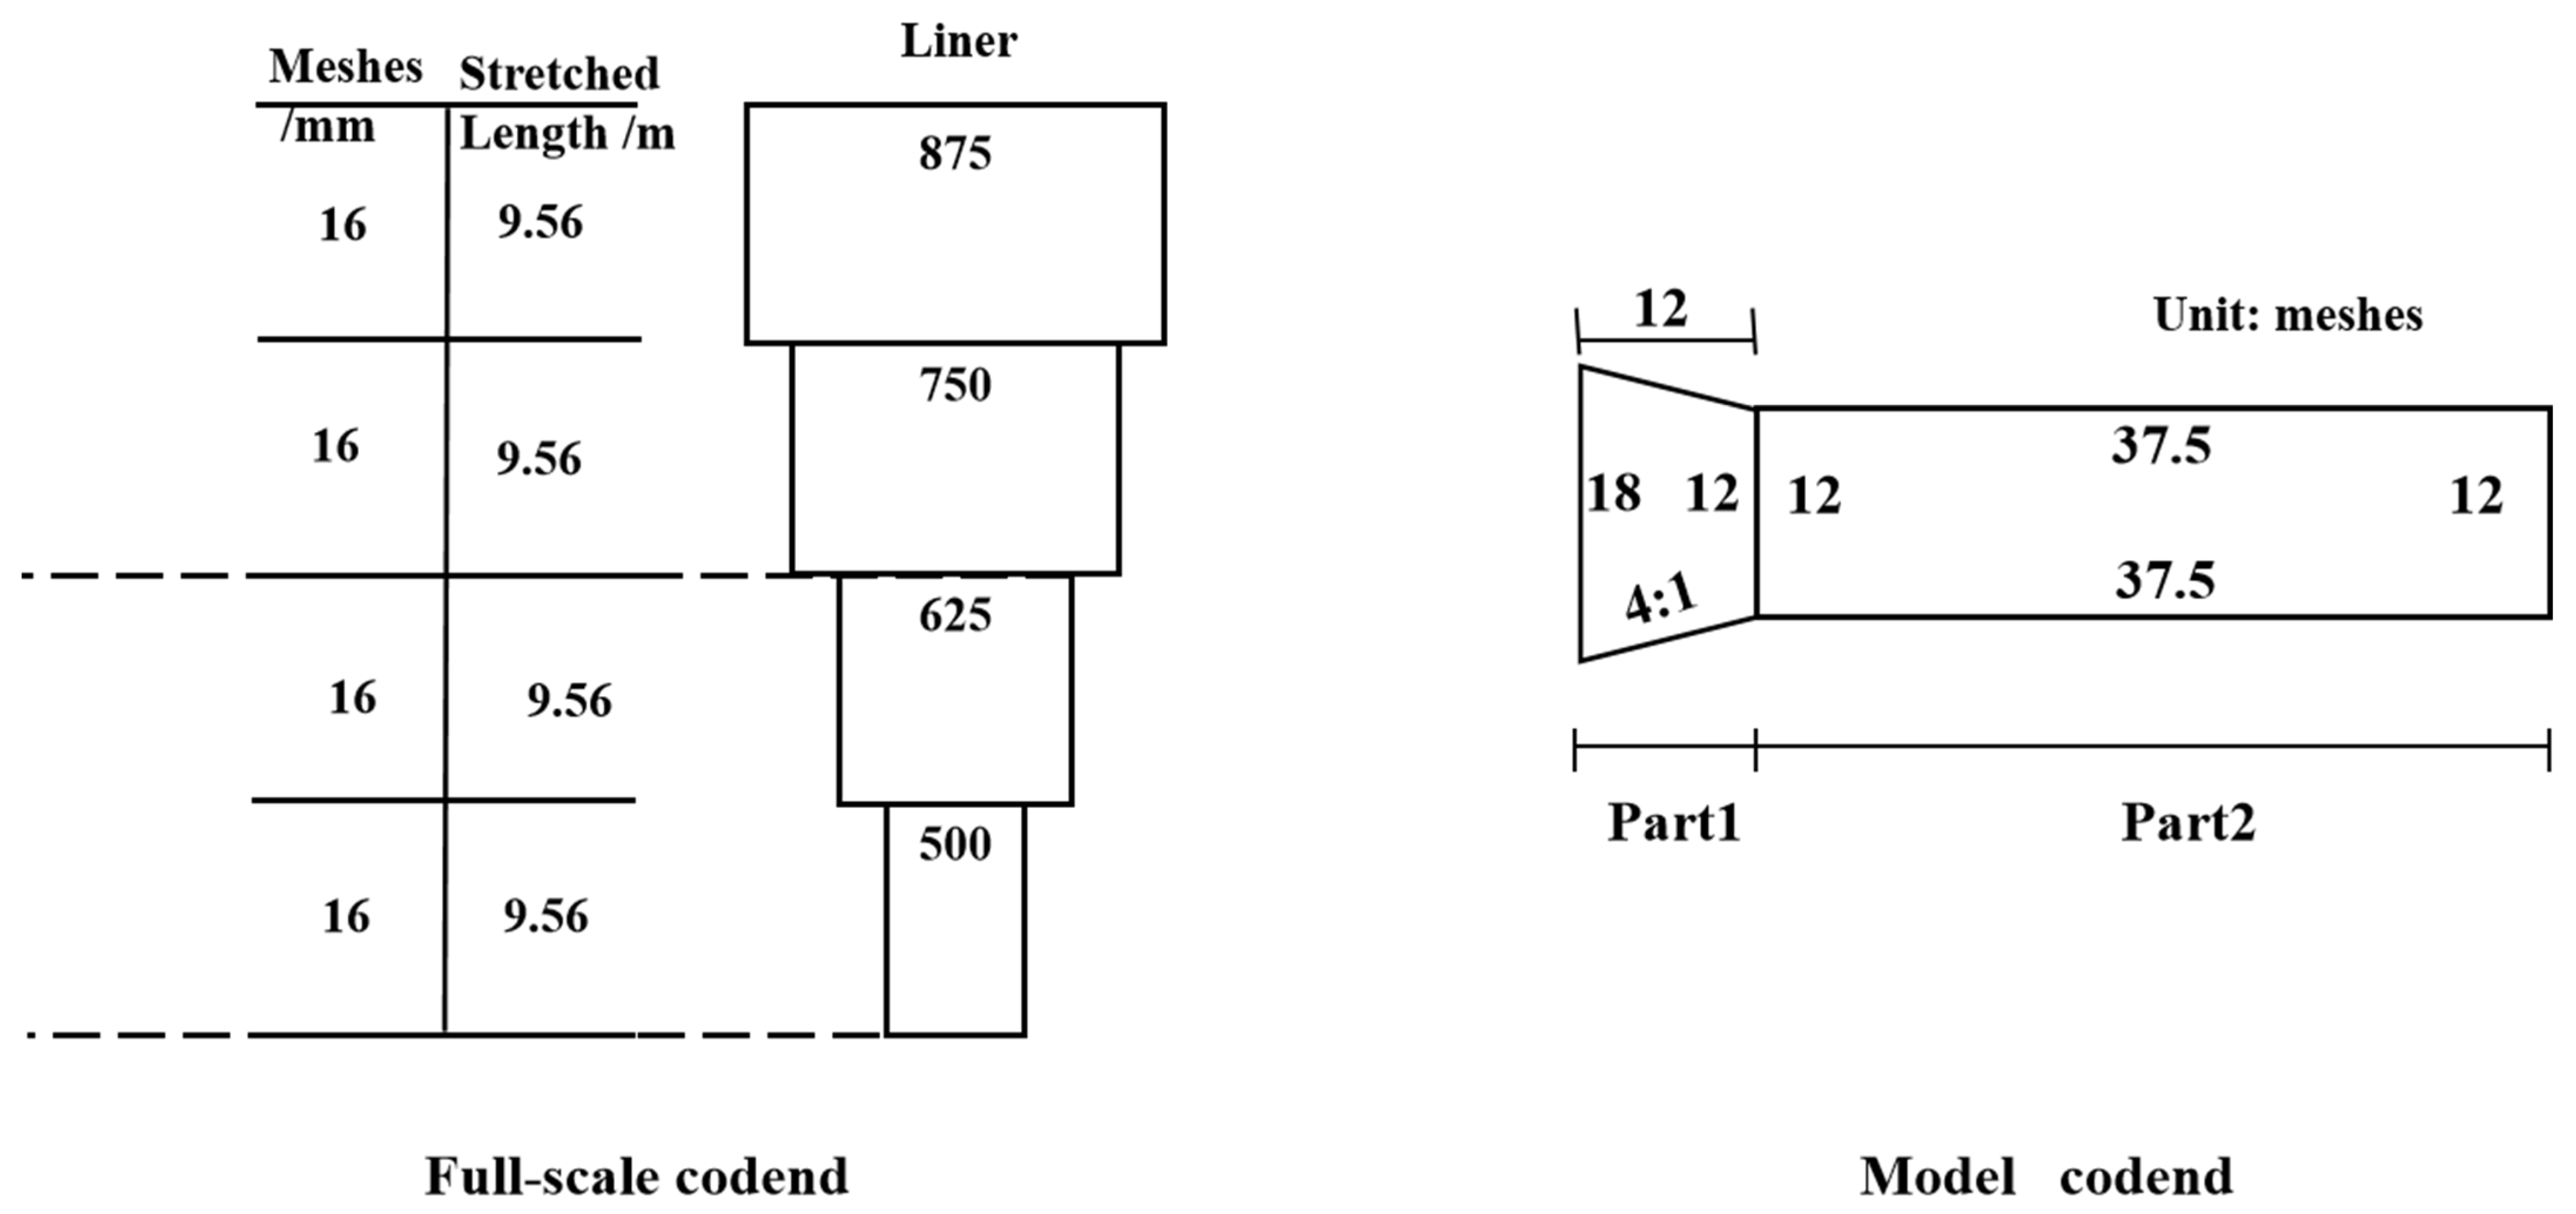
The Antarctic krill trawl net selected and designed for this study was a four-panel midwater trawl net commonly used by Chinese fishing vessel “Long Teng” of China National Fisheries Corp. The main specifications and characteristic parameters of the vessel are listed in Table 1. The circumference of the trawl net at the mouth was 300 m, the trawl length was 132.8 m, the headline length was 55.38 m, and the fishing line length was 54.88 m. The trawl was made of 6.0 mm and 4.0 mm polyethylene (PE) twine diameters, with mesh sizes ranging from 400 mm in the wing (total length of 20 m) and the 1st trawl body section to 200 mm in 2nd to 7th trawl body sections, and 144 mm in the remaining trawl body (total length of 88.8 m) sections and the codend (30 m). The liner was made of polyamide (PA) with a mesh size of 16 mm and twine diameter of 2.0 mm. The vertical opening was maintained by floats distributed on the headline and providing a total buoyancy of 21.462 kN as well as 300 kg chains on the fishing line and two 300 kg heavy bobs attached to each wing-end (Figure 1).
Full-scale observation of the Antarctic krill trawl in action was carried out in the South Orkney Islands, the Antarctic Peninsula, and the South Shetland Islands (60° S; 45° W and 64° S; 59° W, respectively) during the fishing operation conducted between February and March of 2020. The towing speeds were recorded based on the data displayed by the vessel’s GPS radar and ranged from 2 to 3 knots. The data related to the codend depths (the distance from the sea surface) were obtained using DR (Dr-1050 bathymetric meter, Canada) hydroacoustic trawl monitoring sensors attached to the fishing gear on the upper middle point of the codend. According to the manufacturer’s specifications, this instrument had a measuring range of 0–750 m and a specified accuracy of ±0.05%. The total operating time was longer and varied between 254 and 7254 s according to the Antarctic krill school size, which was convenient for data recording and analysis accuracy setting. The data were evaluated every 6 s to obtain information about the entire process, such as towing speed and codend depth.

2.2. Codend Design

The model trawl codends were selected and designed in model scale based on modified Tauti’s law, with particular attention to the Antarctic fisheries. This codend model was designed based on a 1:20 scale (λ = 10) in the length scale of the codend model, a 1:3.6 small-scale (λ’ = 3.6) in mesh size and twine diameter, and a 1:10.54 time ratio (τ = 10.54) using Tauti’s law [25,26,27]. The codend was designed by assembling four pieces of netting using a mesh size of 40 mm and a twine diameter of 1.11 mm using polyethylene (PE) twine materials with diamond-shaped meshes. The codend’s overall length was 1.5 m. Each piece of netting was joined by a codend with a circumference of 72 meshes and an extension with a circumference of 48 meshes (Table 2 and Figure 1).

2.3. Design of the Simulated Catch Configurations

The physical fishing net can accommodate catch with a diameter of approximately 2.4 m. For the experiment, simulated catch with a diameter of D = 24 cm was used to maintain consistency in size. The size of the catch determines the geometric configuration of the codend, which can be divided into different shapes such as grooves, semicircles, and spheres. Based on the simulated catch configurations, this study divided them into two categories: grooved simulated catch (canvas, green canvas, and basketball) and spherical simulated catch (table tennis ball filled with water, balloons filled with water, and balls made of twine). The simulated catches had different water filtration properties. The weights of the two types of simulated catch were quite different in air, but only slightly different in water. Table 3 shows the specific weights. While the upstream surface of the grooved simulated catch was concave and that of the spherical simulated catch was convex, both types ensured that the simulated catch in water had the same upstream surface area.

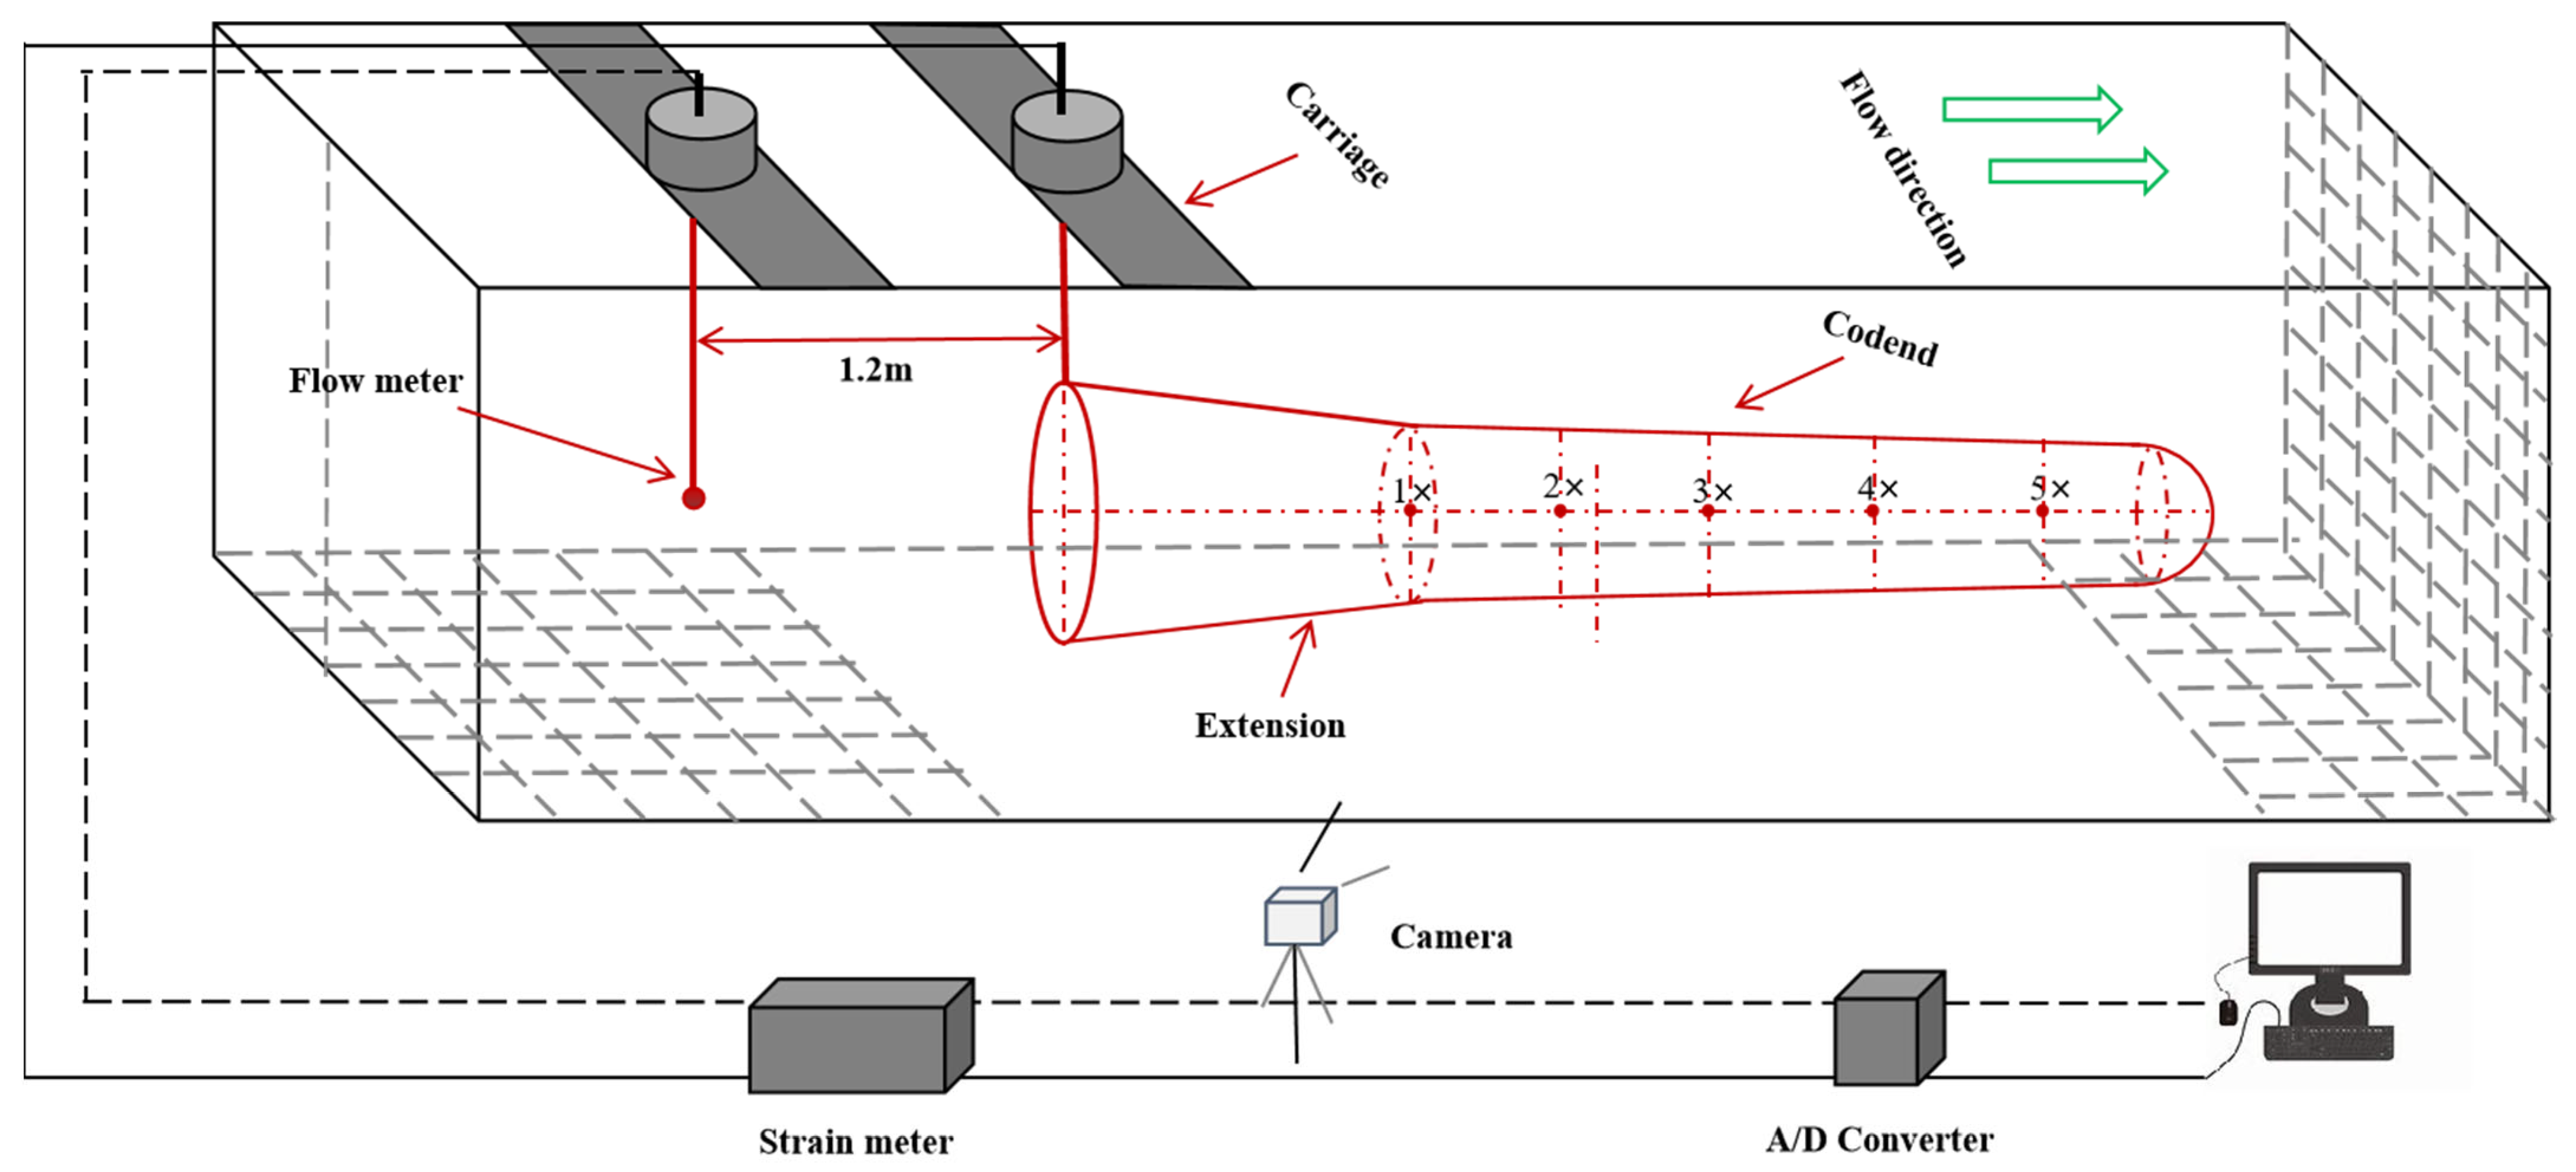
2.4. Experimental Setup and Procedures

The physical experiments were carried out in the flume tank at the National Center for Ocean Fishing Engineering Technology Research of the Shanghai Ocean University (NERCOF). The tank’s test section was 15.0 m in length, 3.5 m wide, and 2.3 m deep, holding 530 tons of freshwater. The flume tank was a horizontal and circular water channel, and the flow was driven by four contra-rotating impellers using constant-speed hydraulic delivery pumps with a rated power of 132 kW, a maximum water depth of 2.0 m, and a flow velocity range of 0–1.5 m/s. A side-viewing window on one side of the flume tank allowed users to observe and record a video of the codend’s behavior during testing. The codend behavior was recorded using a camera with a frequency of 59 Hz per frame image and a resolution of 1920 × 1080 pixels2. During the experiments, the water temperature in the flume tank was kept constant at 17.6–18.4 °C. Figure 2 depicts the specific settings of each test’s instruments and equipment. To accurately measure hydrodynamic forces, the codend model was attached to a circular rigid frame with a diameter of 36 cm and submerged in water to a depth of 10 cm. A current meter was installed approximately 2.0 m upstream of the codend model to detect the flow velocity. The hydrodynamic force signals were measured using a six-component load cell with a capacity of 5 kgf each and a specified accuracy of 2%. As measured using the load cell, these hydrodynamic force signals were amplified using a dynamic strain amplifier (DPM-6H). Afterwards, these signals were sent to an A/D converter and thereafter to a computer. During the experiment, we recorded the mean of 240 data points obtained at a frequency of 4 Hz over a period of 60 s.
The drag force of the rigid frame was first measured before conducting experimental measurements on different codends. Firstly, the drag force of the rigid frame was measured at five different flow velocities. Secondly, the codend opening was wrapped around the rigid frame, and the drag force of the codend and frame was measured in the empty stage using the same method. Finally, the combined drag force of the codend, frame, and simulated catch was measured after adding six different catch configurations. The measurements were taken using flow velocities of 0.5, 0.6, 0.7, 0.8, and 0.9 m/s.

2.5. Data Extraction and Methods

2.5.1. Data Processing of the Shape of Codend

During the experiments, a series of videos describing the codend fluttering motions were recorded from the front view of the flume tank observation port using a video camera that was fixed in position and zoomed in and out (Figure 3). Video cameras were used to capture the trawl actions and net shape geometry. From the recorded video footage, a series of images separated by 0.25 s were selected and imported into graph digitizing software to extract the coordinates of the model net’s characteristic points based on a plane-coordinate system.
Following that, the coordinates representing the codend behaviors were interpolated, allowing the temporal motions of the different codends to be determined. Initially, a series of 240 images were acquired from the recorded video footage at a frame rate of 4 Hz. These images were used to extract the coordinates of the distinctive points of the codend model with different catch configurations based on a plane-coordinate system. A reference bar was used to calibrate the measurements and reduce the impact of camera lens stresses, water refraction, and parallax on the extraction of these coordinates.

2.5.2. Pearson Correlation Test

In this study, we utilized the Pearson correlation test to investigate the relationship between the oscillation period and amplitude of the actual codend and those of the model codend containing varied simulated catch. The Pearson product-moment correlation coefficient can be calculated using Equation (1):
ρ X Y = C o v X , Y D X D Y = E X E X Y E Y D X D Y
where E is the mean, D is the variance, and are the standard deviation of variables X and Y, and E{[X-E(X)] [Y − E(Y)]} is the covariance of variables X and Y, denoted by Cov(X, Y), i.e., Cov(X, Y) = E{[X − E(X)] [Y − E(Y)]}.

2.5.3. Wavelet Analysis

The wavelet transform is an effective tool for analyzing non-periodic signals. It is critical in the context of codend motion analysis to detect coherent structures emerging from fluttering motions and to associate unsteady turbulent flow. In this study, the wavelet analysis method was used to determine the time-periodicity of the codend oscillation and codend drag. The wavelet analysis was carried out using MathWorks’ Matlab 2019B software package and its wavelet toolbox. The following is the analysis procedure:
The wavelet function is the foundation of wavelet analysis. It refers to a class of oscillating functions that can quickly decay to zero, such as the wavelet function ψ(t)∈L2(R), and satisfy:
+ ψ ( t ) d t = 0
where ψ(t) is the basic wavelet function, which can be expanded and translated on the time axis to form a family of function systems:
ψ a , b ( t ) = a 1 / 2 ψ ( t b a ) in   a , b     R ,   a     0
where a and b are the scale and the position parameter, respectively. In Morlet mother wavelet, a is roughly equal to 1/f or period in numerical value.
In the sub-wavelet given by Equation (3), for a given energy-limited signal f(t) ∈ L2(R), its wavelet transform is:
W f ( a , b ) = a 1 / 2 R ( t ) ψ ¯ ( t b a ) d t
where Wf (a,b) is the wavelet transform coefficient of a signal or square integrable function f(t) at the scale a and the location b, and ψ ¯ ( x b a ) is the complex conjugate function of ψ ( x b a ) .
The Morlet wavelet was chosen as the complex wavelet in this study, and the phase difference between its real and imaginary parts is π/2. The modulus represents the number of a certain scale component, and the phase can be used to study the singularity and real-time periodicity of the signal.

3. Results

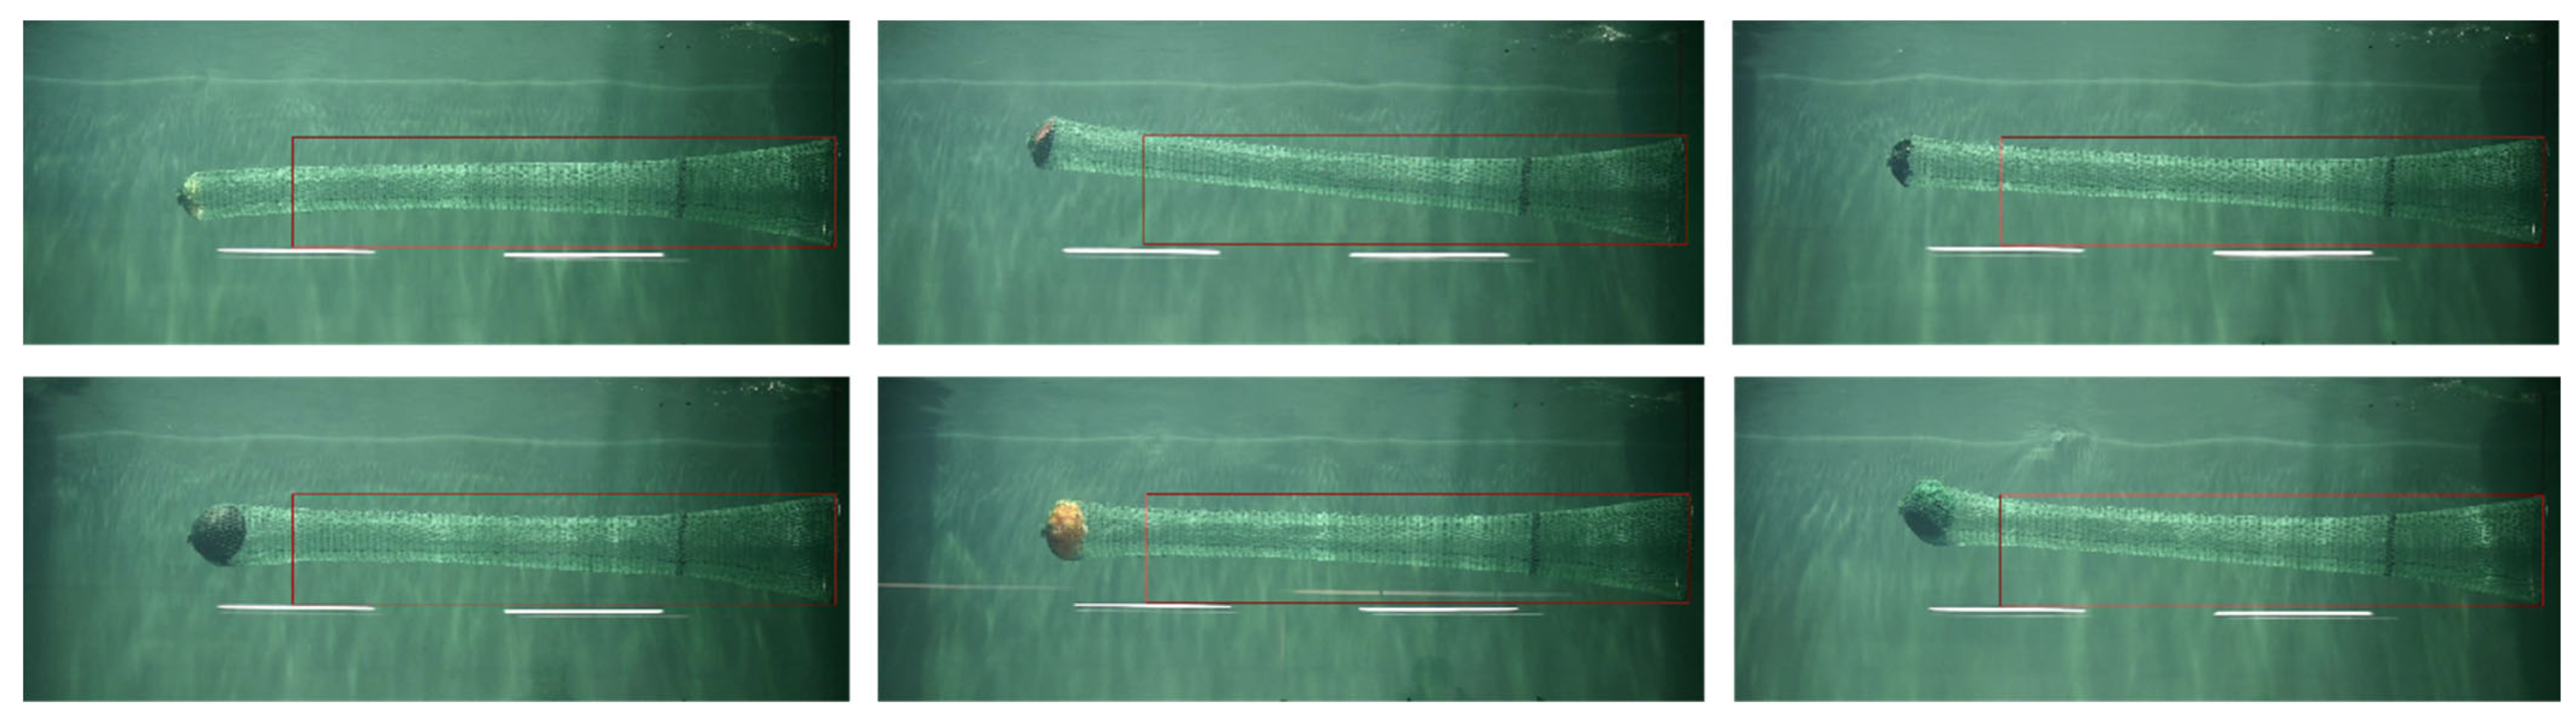
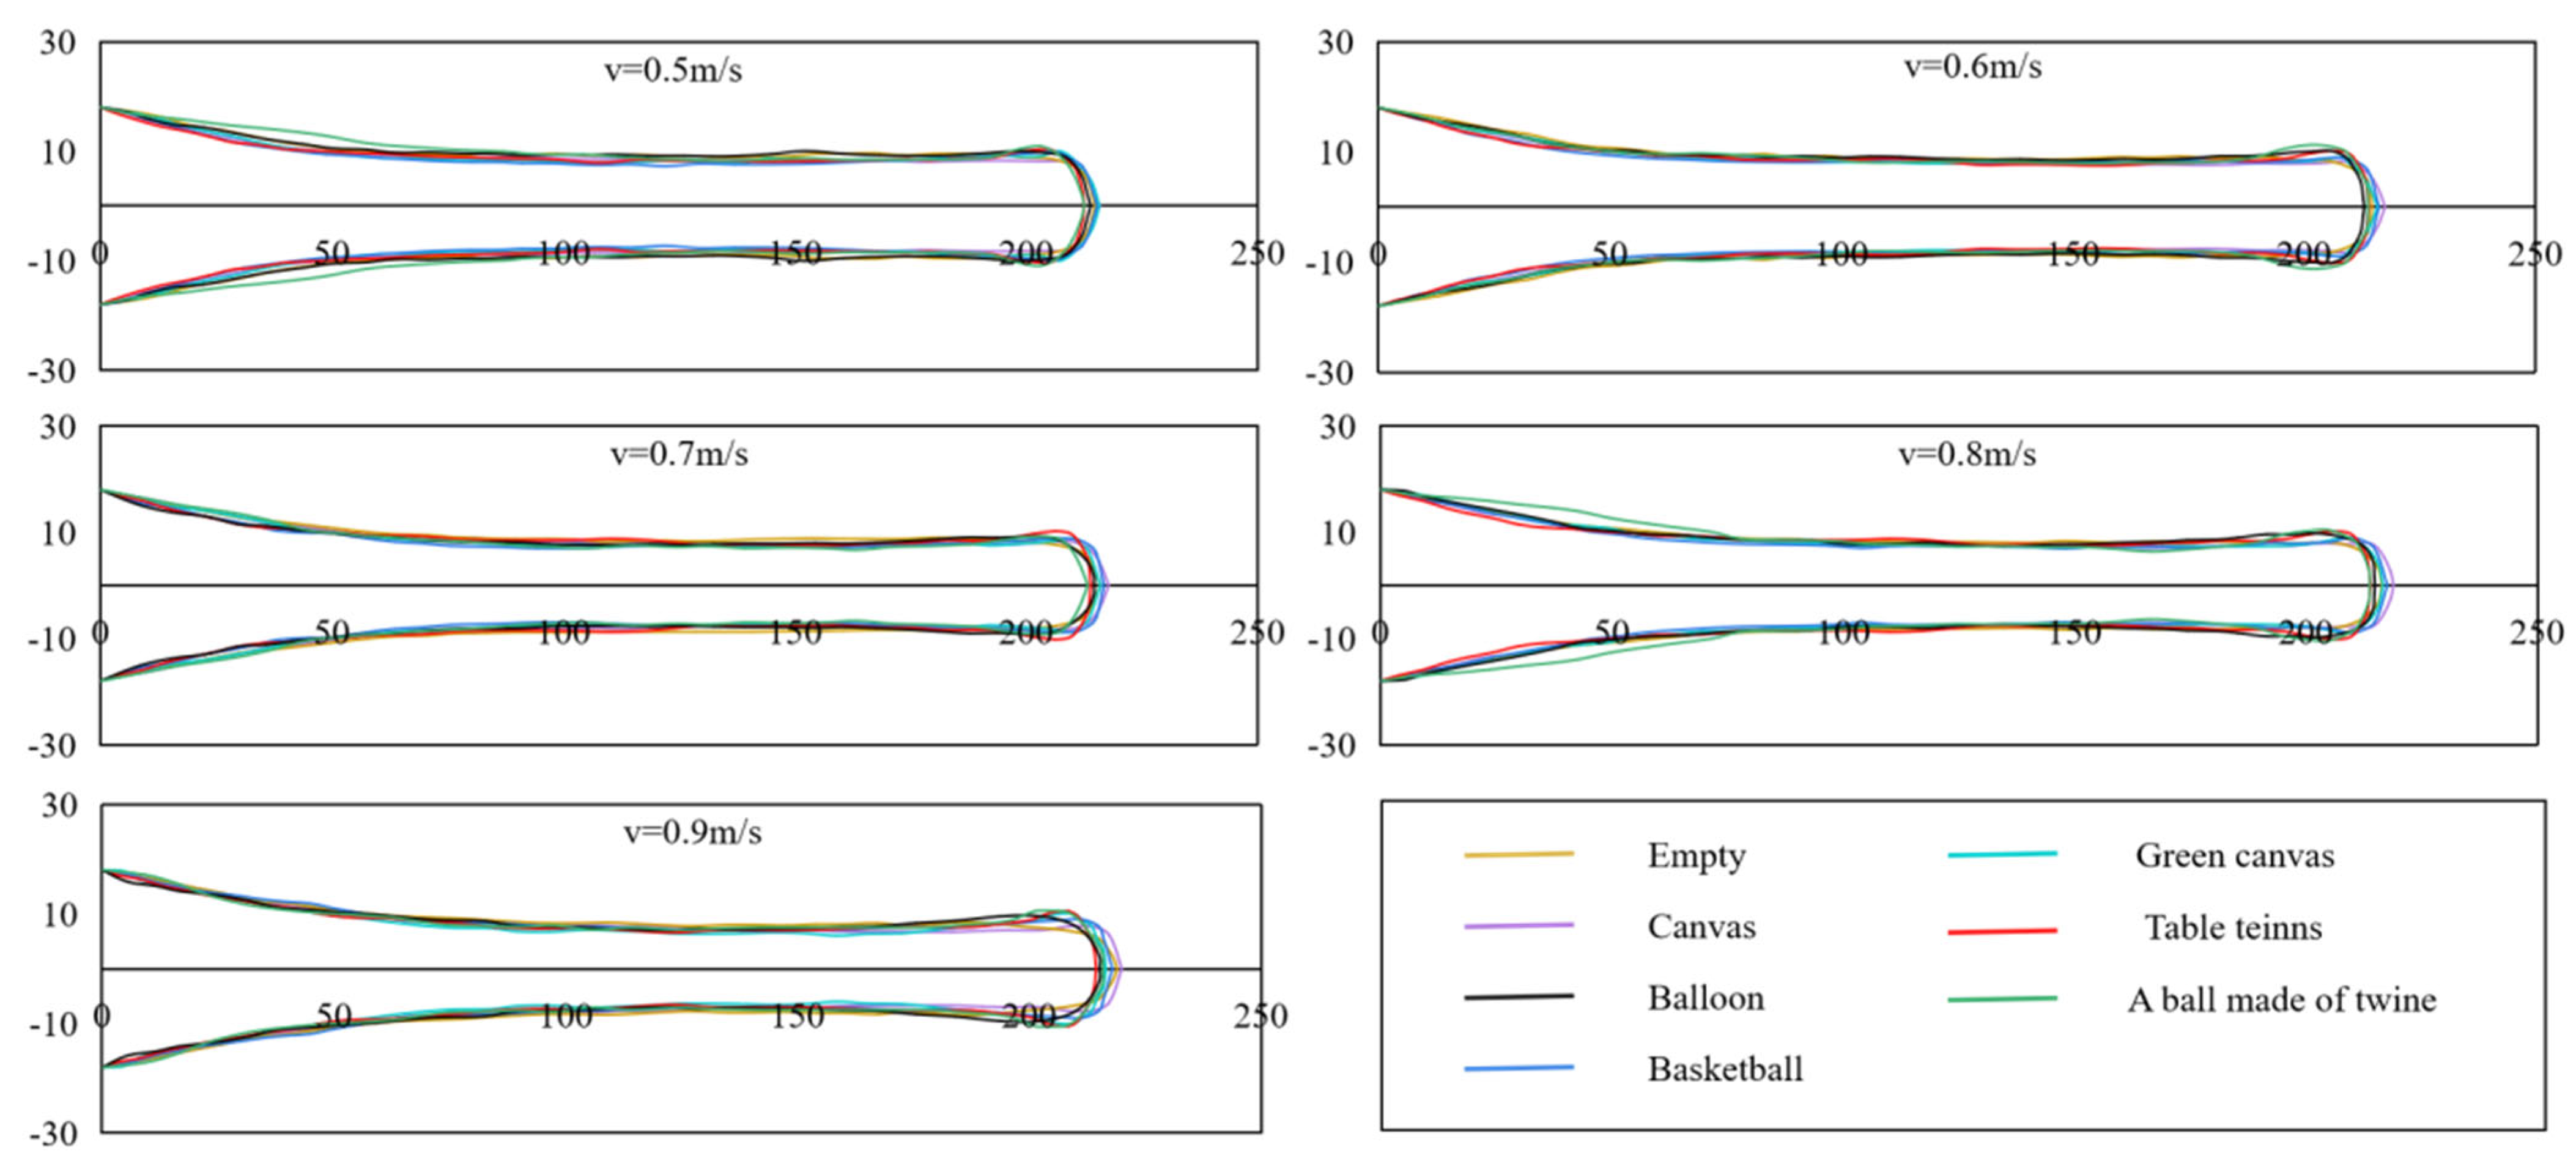
3.1. Morphological Changes of Codend

As illustrated in Figure 4, the shape of the codend structure tends to tighten as flow velocity increases. The results showed that the outlines profiles of codends with different simulated catch were essentially similar, and the horizontal length of the codend structure increased as flow velocity increased. Under the same flow velocity conditions, the horizontal length increase in the codend containing the canvas is 0.013% greater than the original codend length, while the horizontal length increase in the codend containing the ball made of twine is 0.009% greater than the original codend length. There are some differences between the codend filled with grooves and the spherical simulated catch as flow velocity increases. The end bulge of the codend with grooved catch configuration was approximately 23.54 cm, and the end bulge of the codend with spherical catch configuration was approximately 25.13 cm.

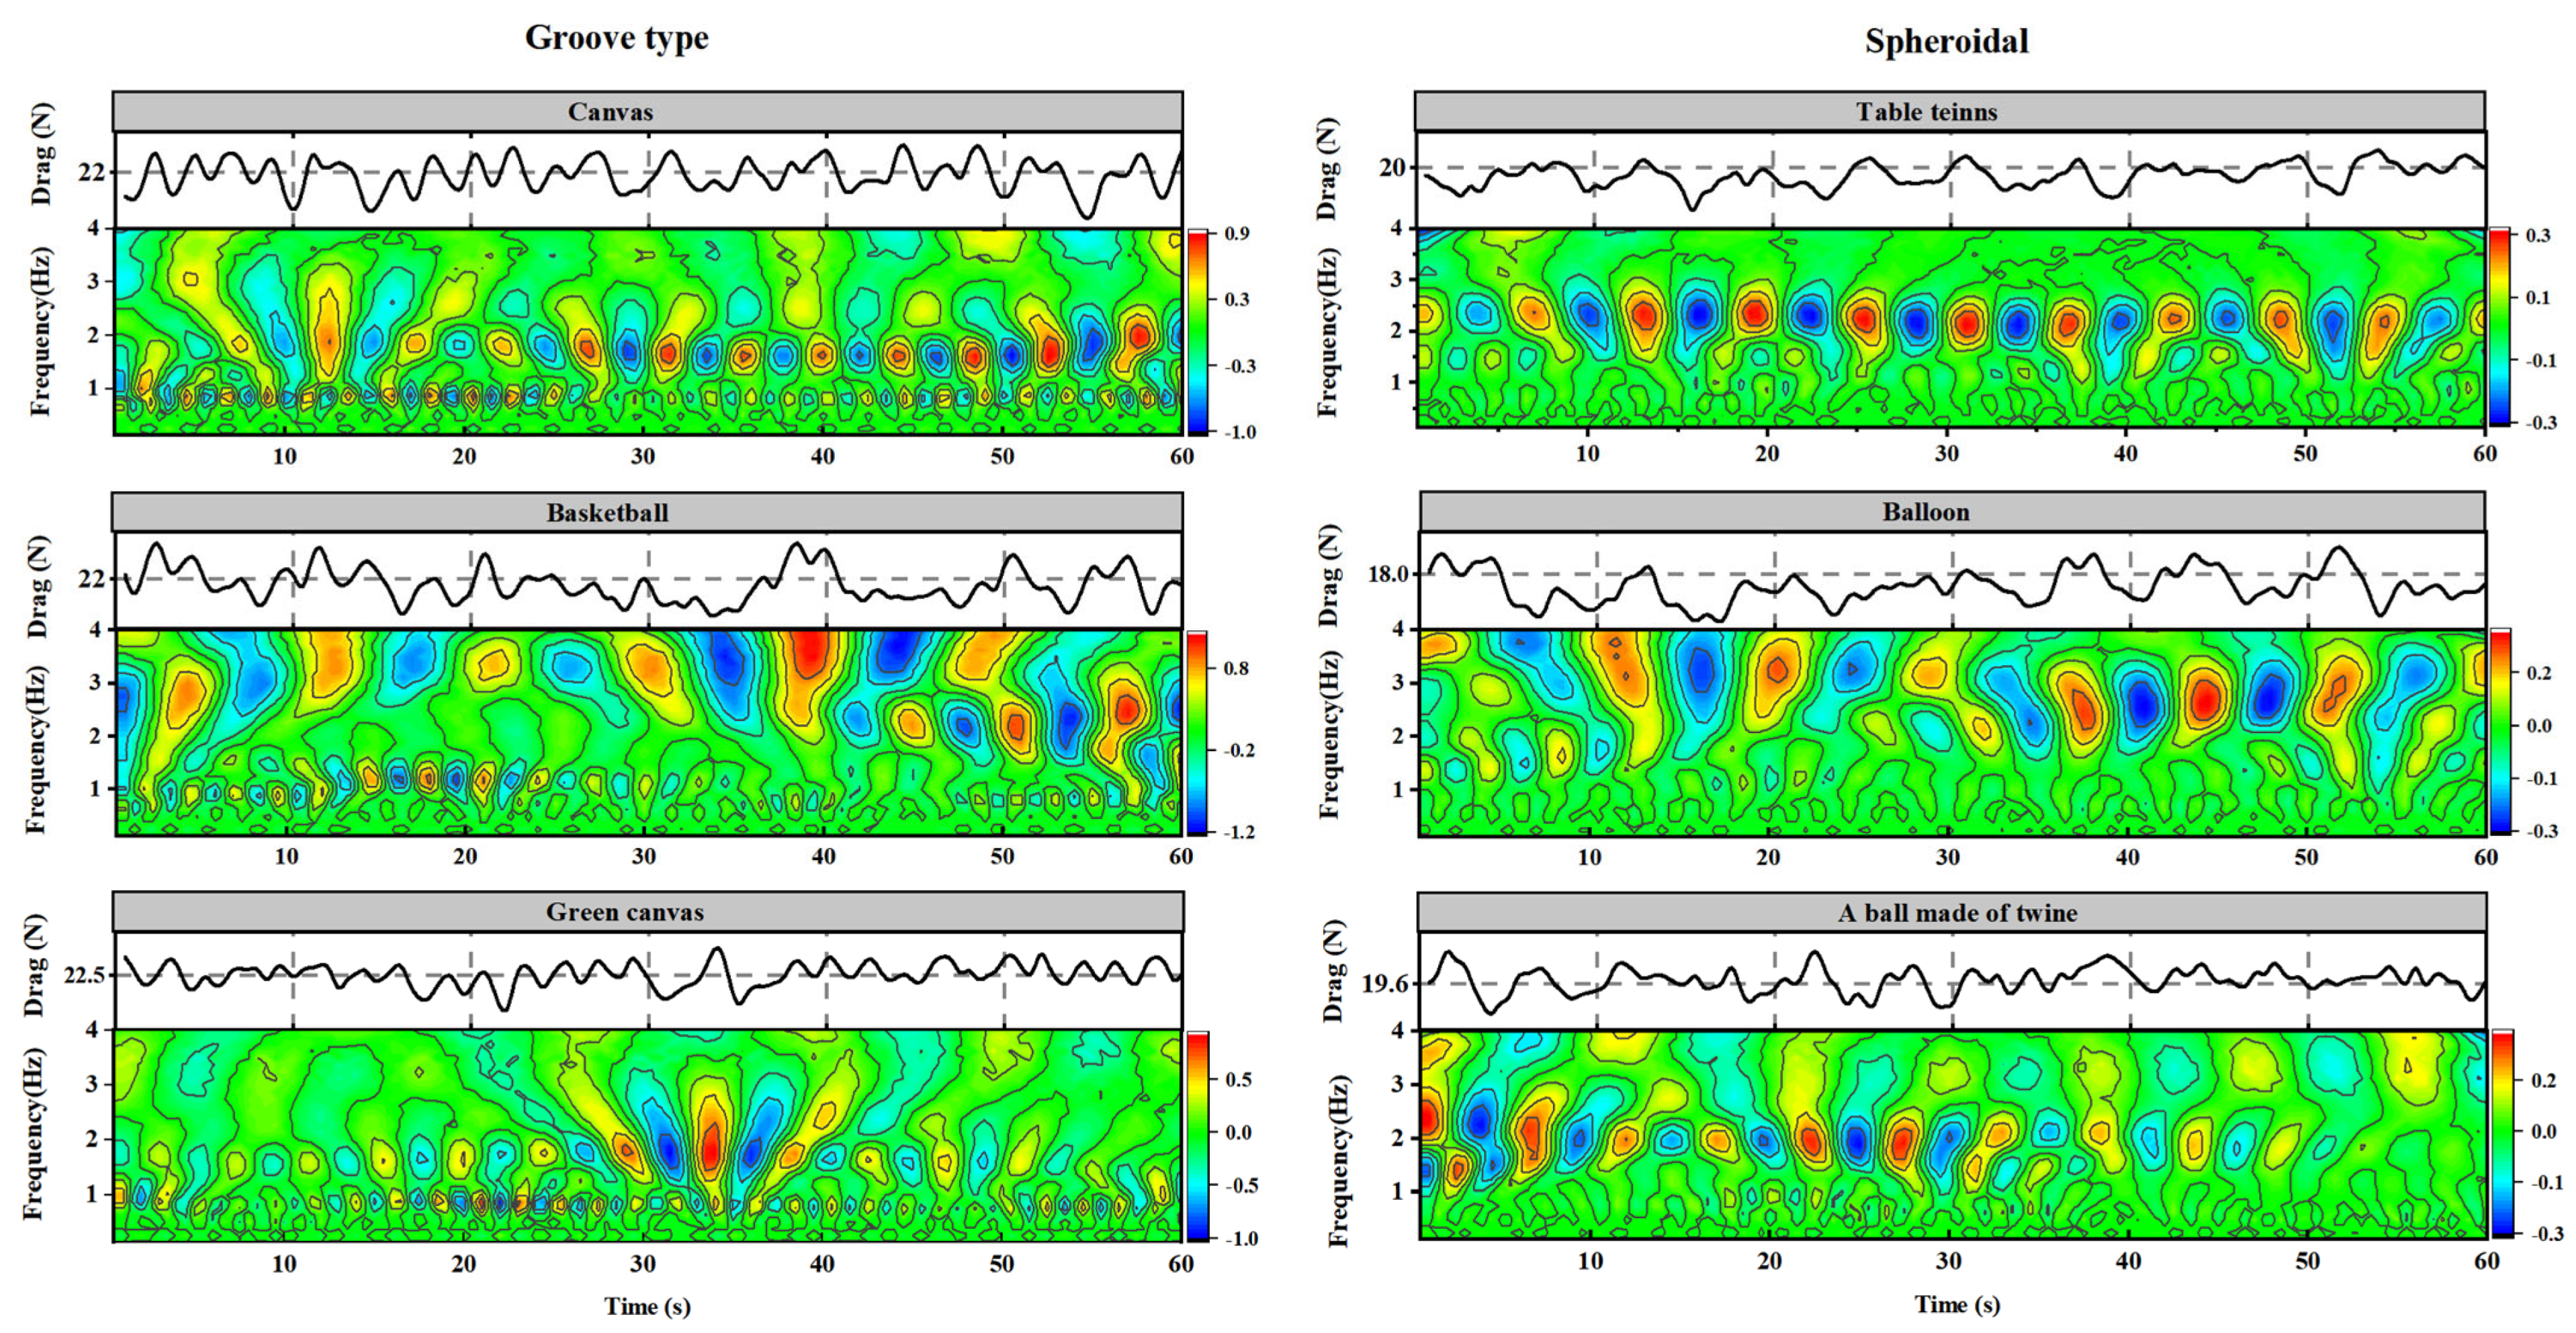
3.2. Morlet Wavelet Transform of Codend Resistance of Different Types of Simulated Catch

In this study, a flow velocity of 0.7 m/s (corresponding to the actual towing speed of 2.4 knots at sea) was chosen as the basic flow velocity of the codend model. According to Figure 5 the drag force of the codend with a grooved catch configuration was about 22.17 N on average, while that of a spherical catch configuration was about 19.20 N. Moreover, the drag force of the codend filled with green canvas was the greatest (22.7 N), while the drag force of codend with balloons filled with water was the lowest (17.9 N). Wavelet coefficients of codend drag with the grooved catch configuration mainly oscillated intensively between 30 and 60 s and were observed at the frequency of 1.3–2.2 Hz for canvas and green canvas, except for the codend with the basketball, in which the high wavelet spectrum coefficient were observed at a high frequency of 2.9–4 Hz at t = 38–42 s. For the case of codends with a spherical catch configuration, the drag oscillation was slower, and the larger wavelet spectrum was obtained at a frequency varying from 1.84 to 2.87 Hz at t = 10–40 s, 2.14 to 2.87 Hz at t = 35–50 s, and 1.04 to 2.87 Hz at t = 0–30 s for the oscillation of a table tennis ball filled with water, balloons filled with water, and balls made of twine, respectively. It was observed that the codend containing the basketball oscillated the most violently, while the codend containing the table tennis ball filled with water oscillated evenly throughout the process. The wavelet coefficient of the codend drag with grooved catch configuration began to oscillate at the frequency of 0.87 Hz first, then oscillated more intensively than the codend containing the spherical catch configuration.

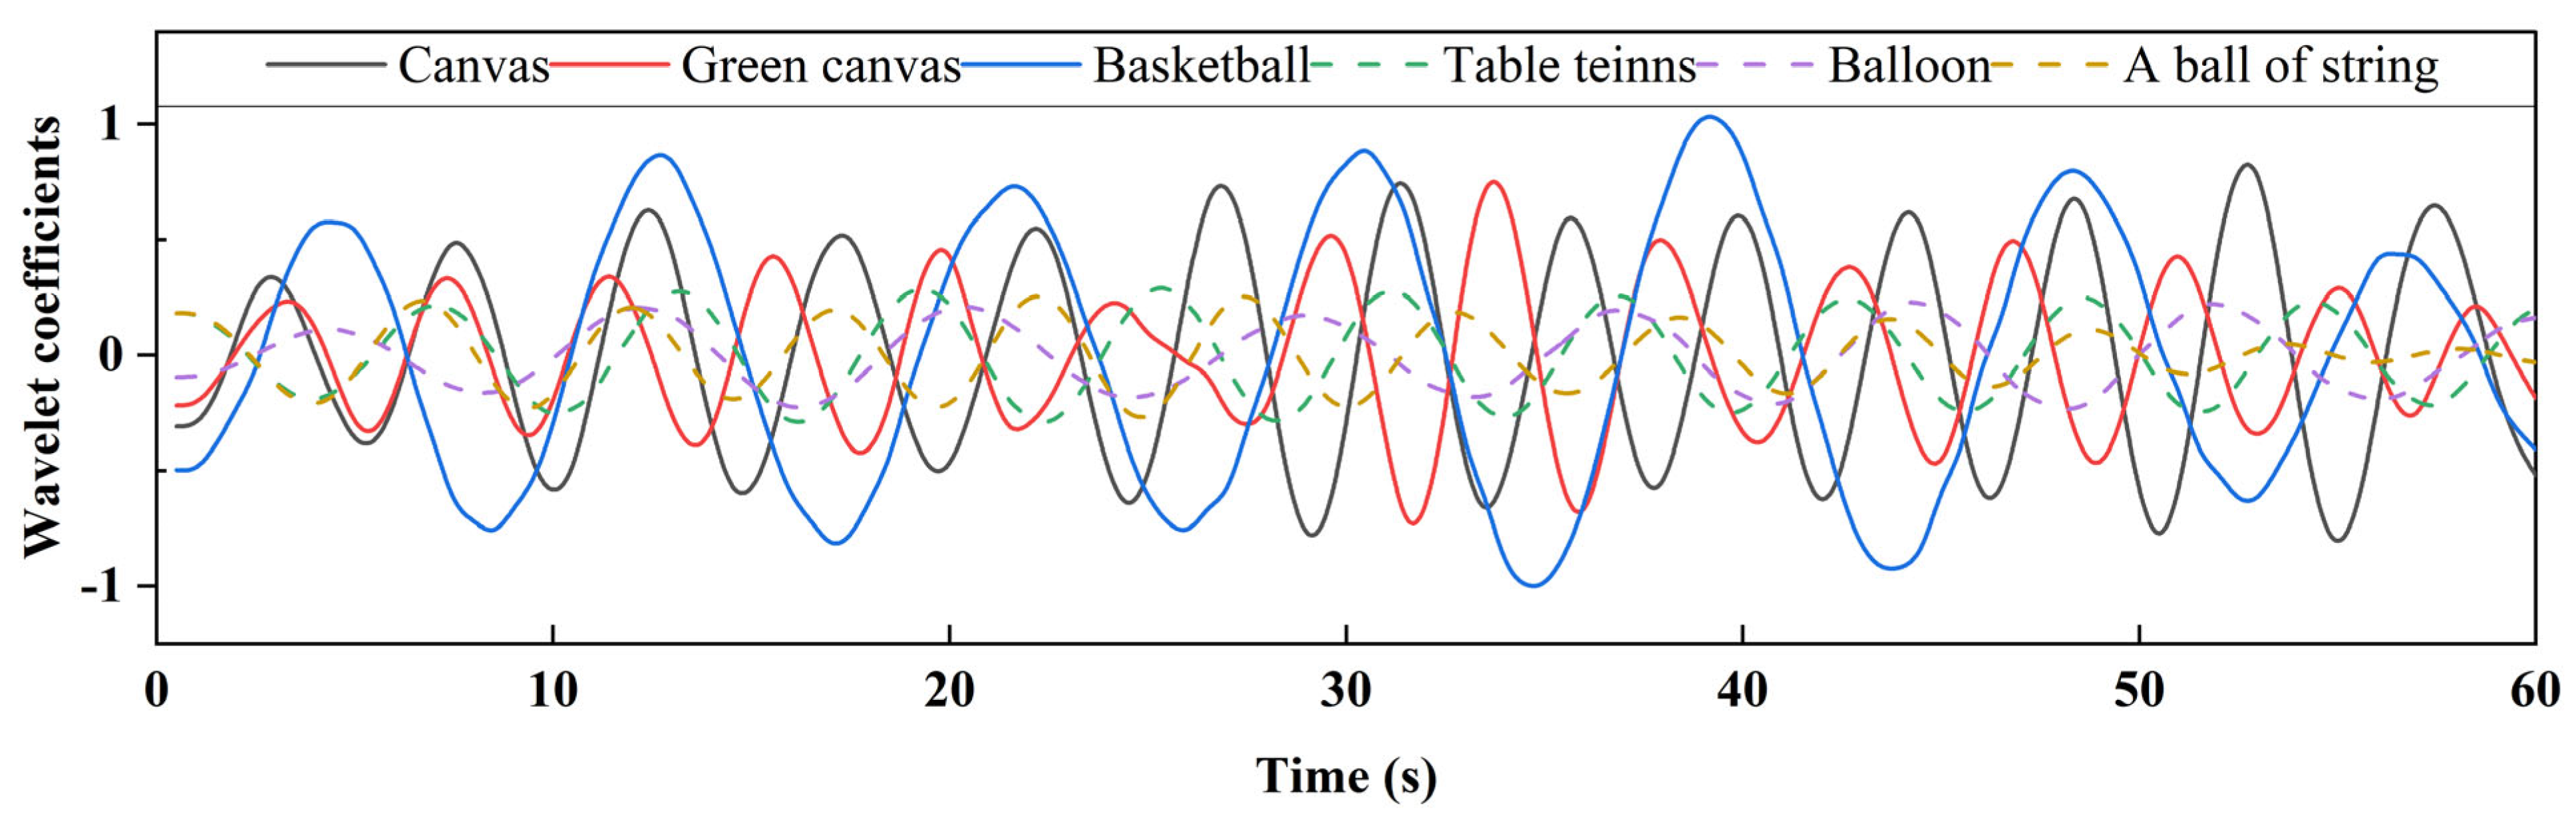
3.3. The Oscillation Characteristic of the Codend Drag Force Based on Main Period Morlet Wavelet Transform

Figure 6 depicts the oscillation of the main periodicity wavelet coefficients of codend drag with various catch configurations plotted according to the time scale of the codend drag oscillation. On average, the oscillation periodicity of wavelet coefficients of the codend drag using grooved catch configuration was about 2.49 s, while that of the spherical catch configuration was about 2.83 s, indicating that the oscillation frequency of the codend with grooved catch configuration was faster. It was observed that the codend with green canvas has the fastest oscillation frequency (0.51 Hz) compared to other catch types. The average amplitude of the wavelet coefficient of the codend drag with grooved catch configuration was approximately 0.98, while the average amplitude of the wavelet coefficient of the codend drag with spherical catch configuration was approximately 0.4. The average amplitude of the wavelet coefficient of the codend drag filled with the grooved catch configuration was approximately 2.4 times greater than that of the codend drag with spherical catch configuration, indicating that the codend filled with the grooved catch configuration is more oscillatory. In addition, the largest amplitude of the wavelet coefficient (1.3) was observed on the codend drag-filled basketball (Table 4).

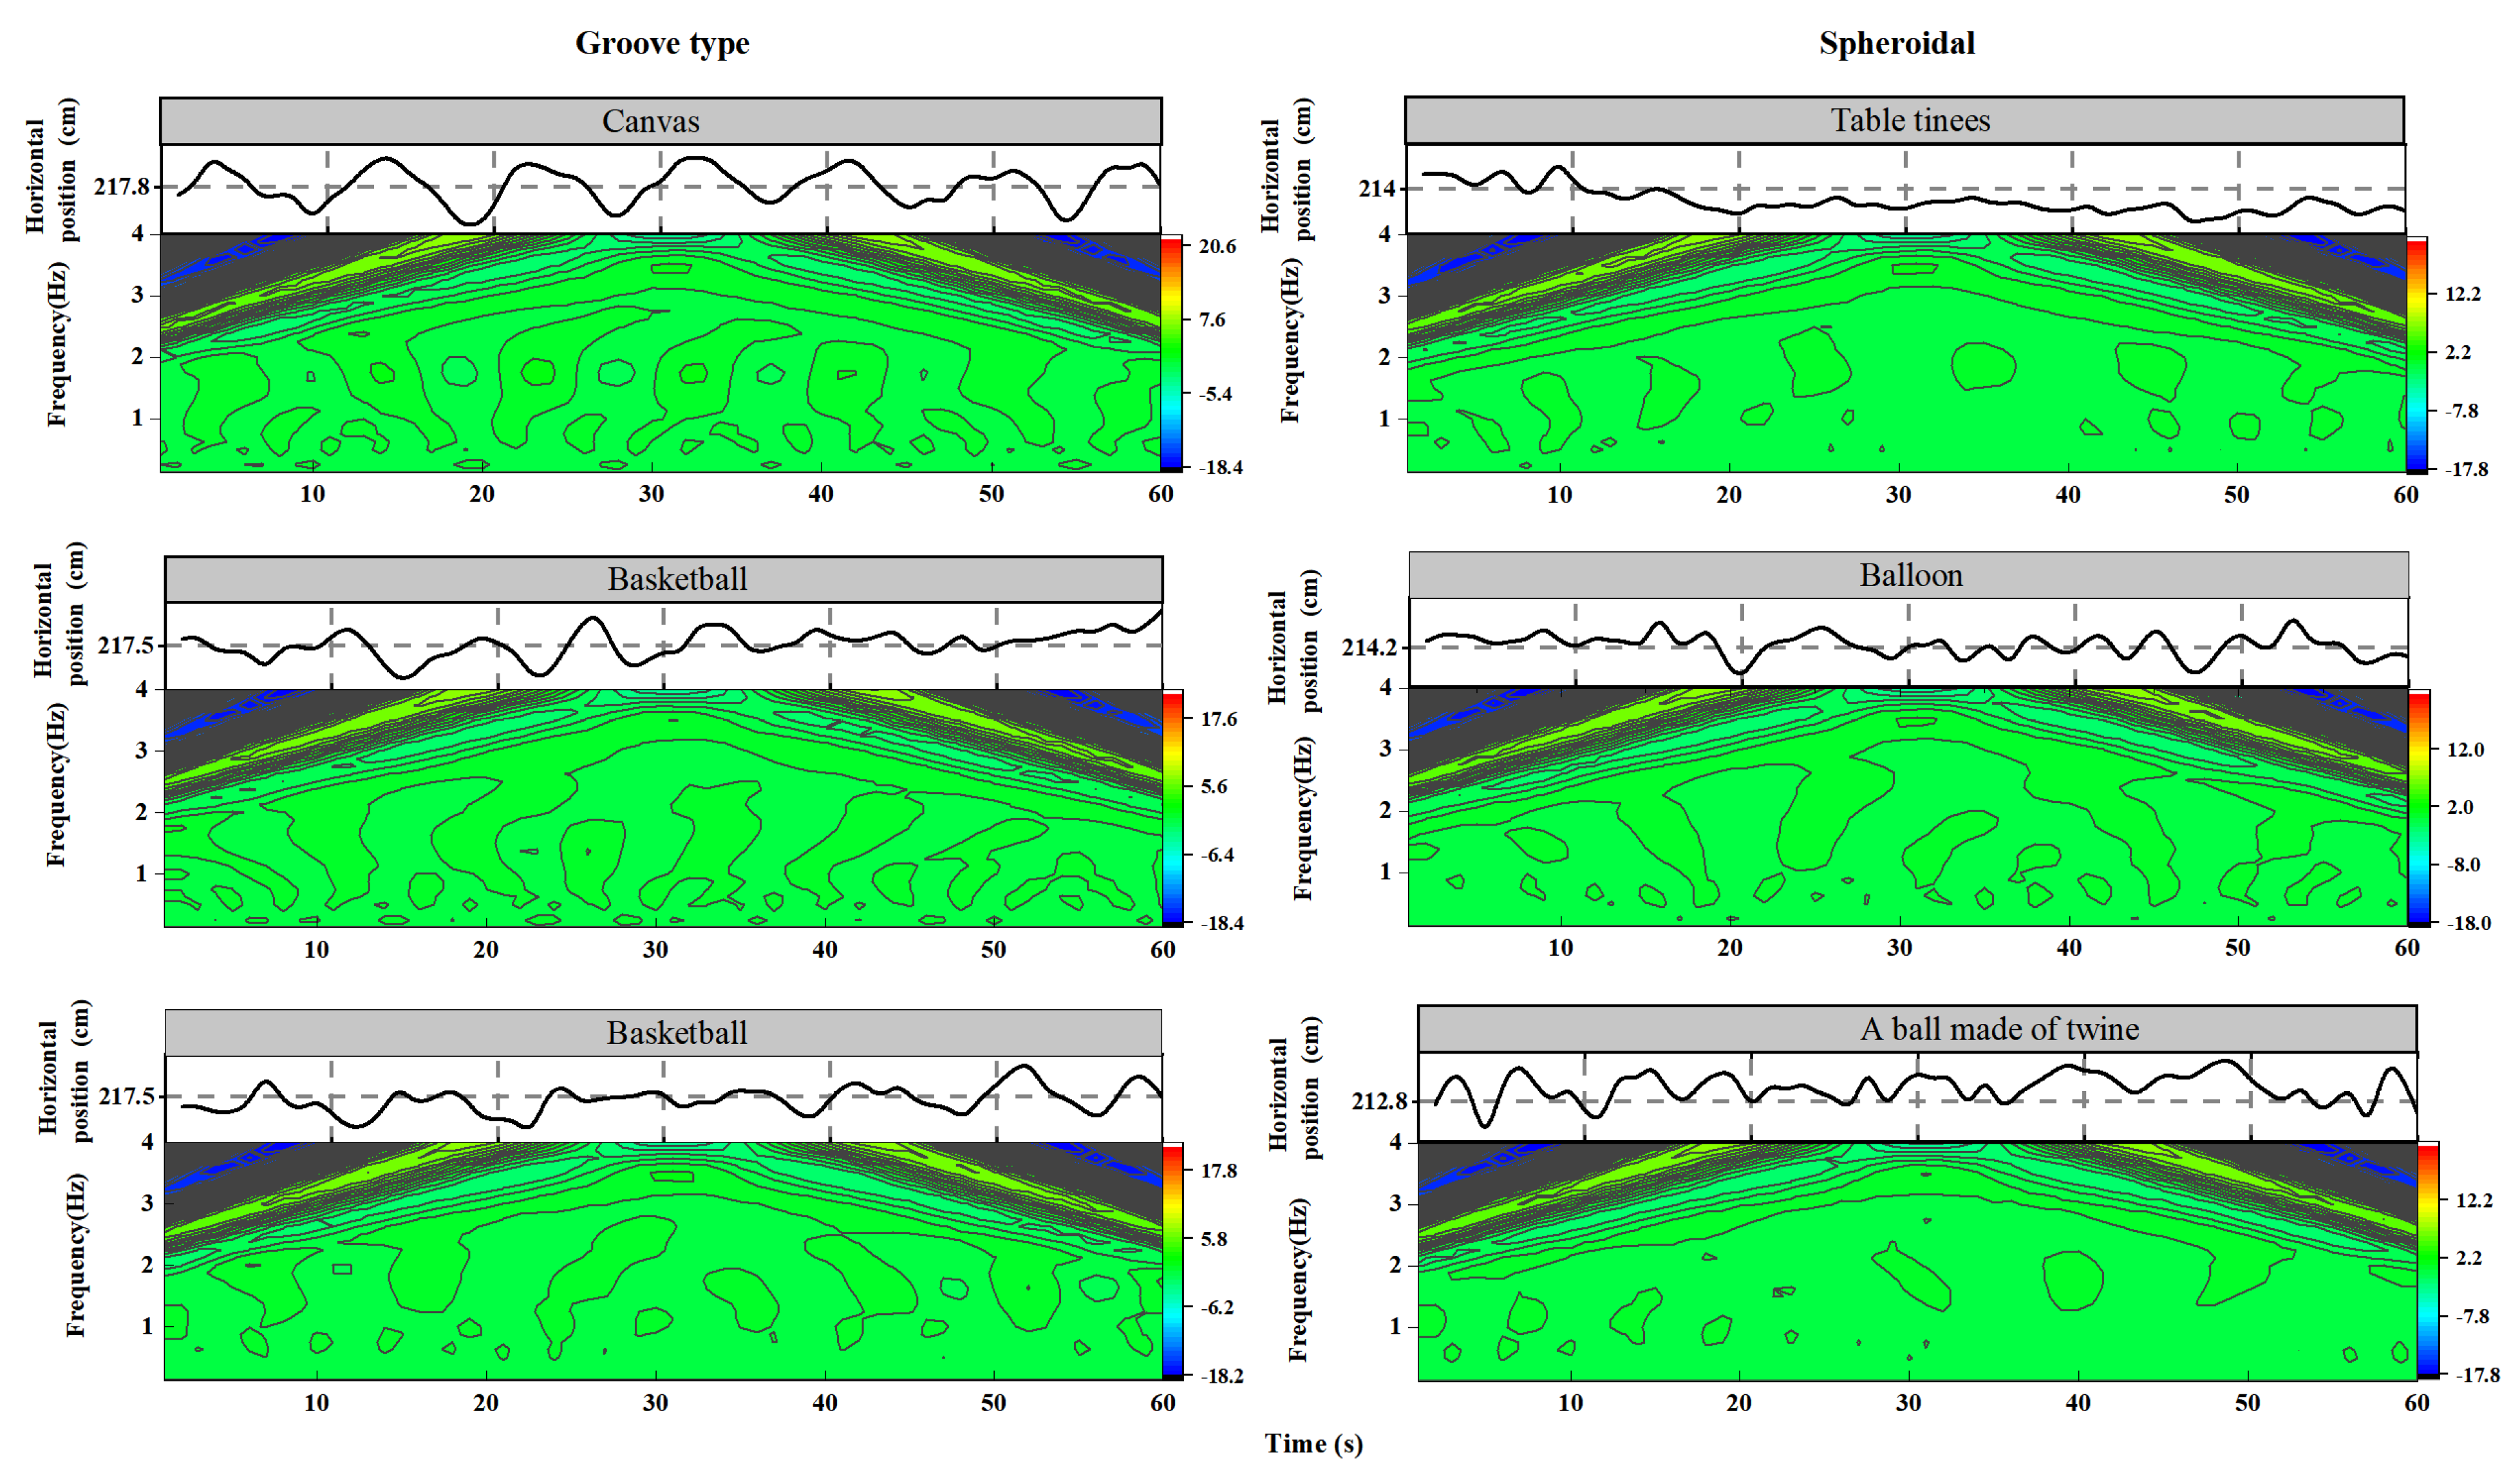
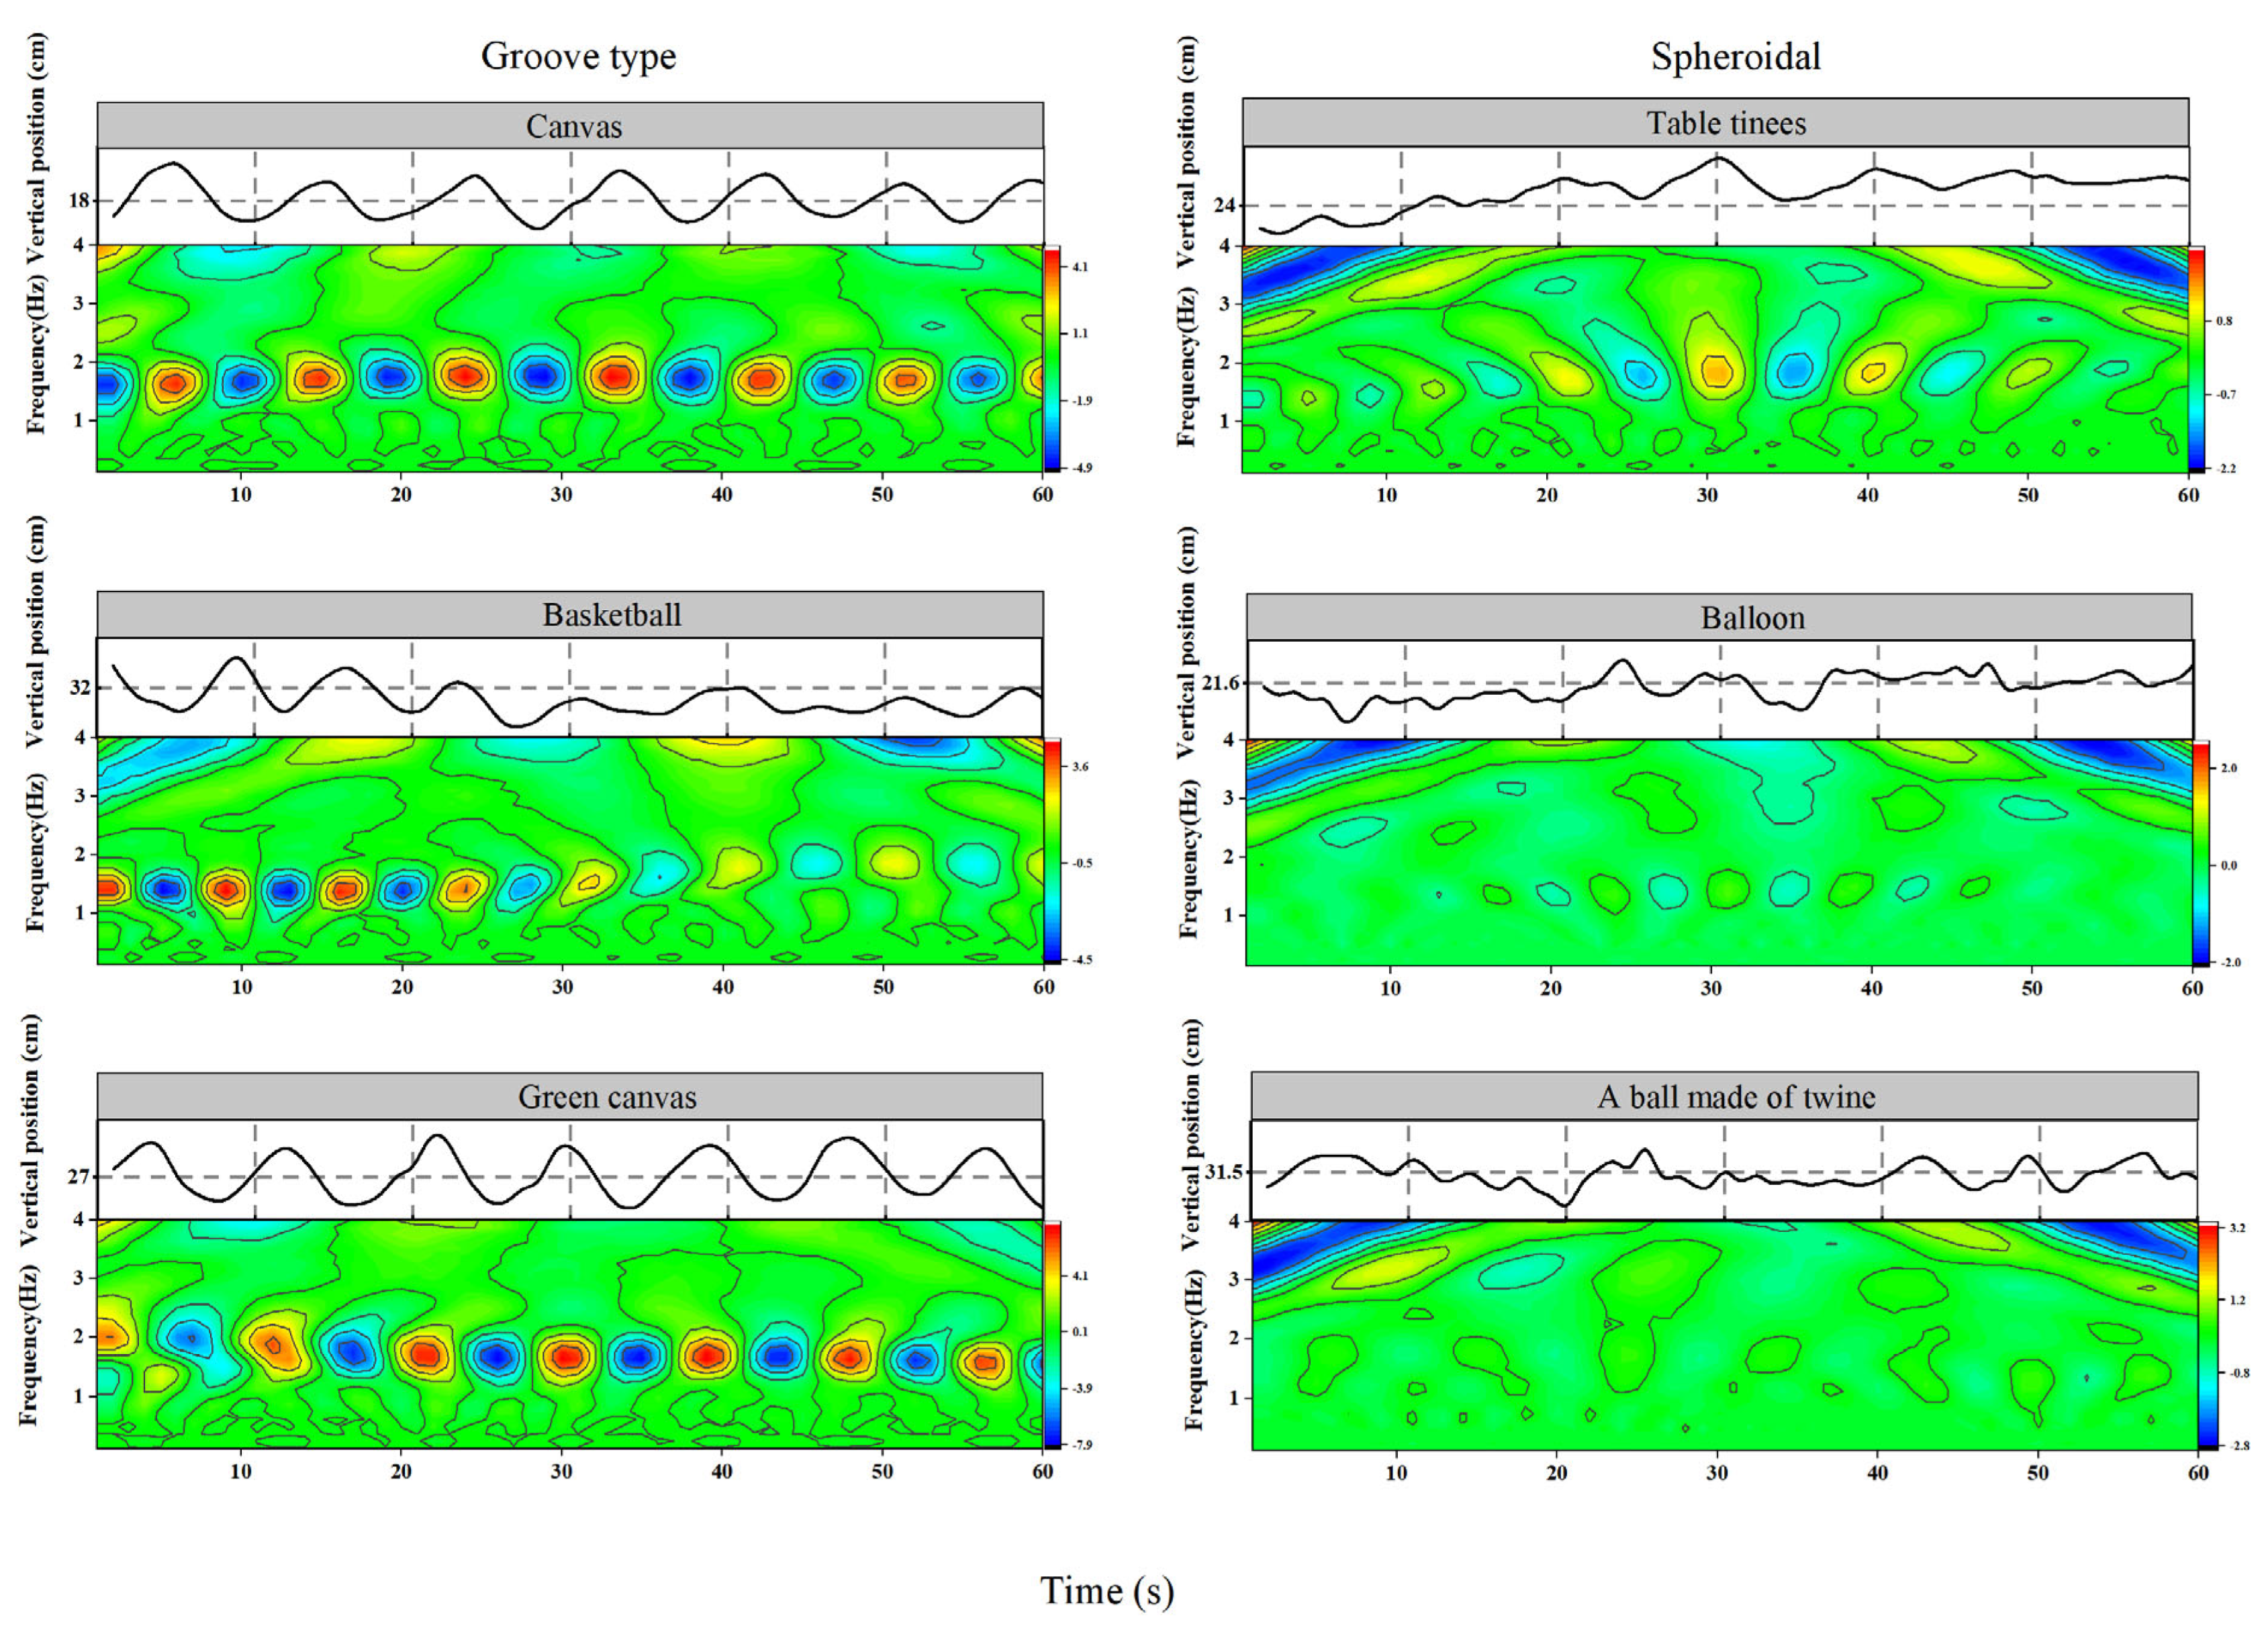
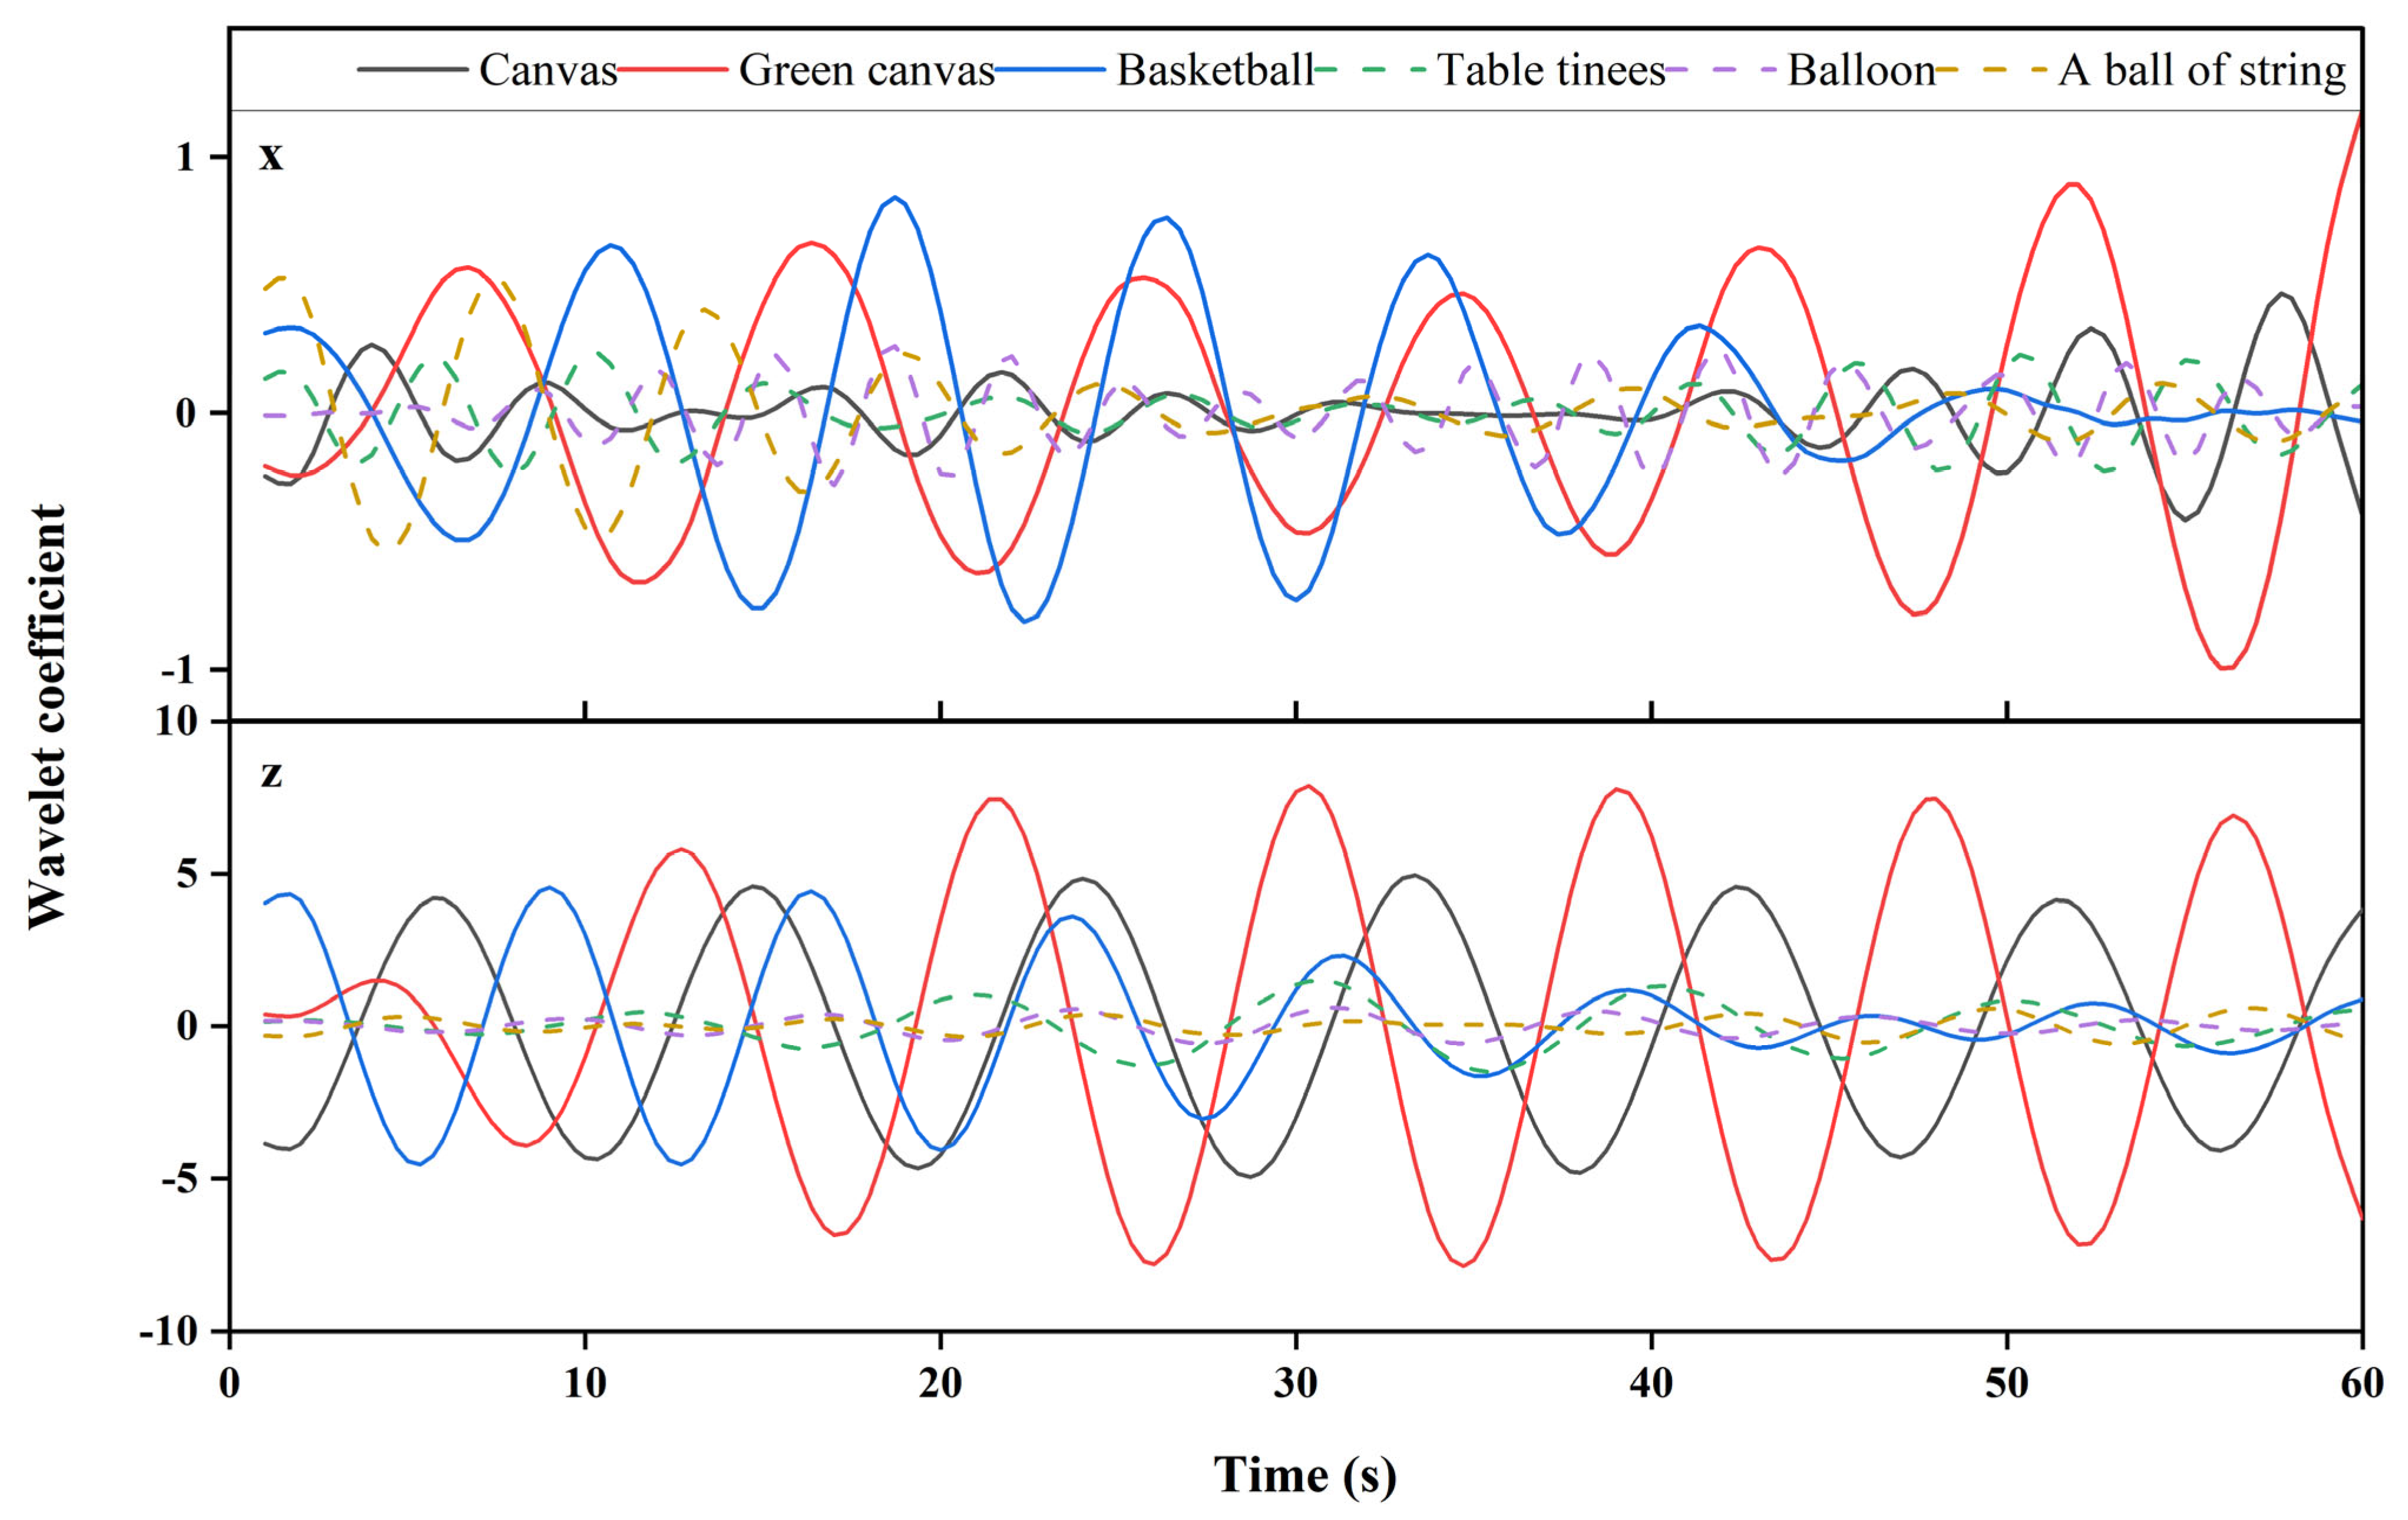
3.4. Morlet Wavelet Transform Characteristics of Spatial Displacement of Codend with Different Types of Simulated Catch

Figure 7 depicts the Morlet wavelet transform performed on the transverse (x-direction) and longitudinal (z-direction) displacements of the codend with various simulated catch configurations. According to the findings, the average transverse length of the codend with grooved catch configuration was approximately 217.60 cm, which was greater than that of the codend with spherical catch configuration (~213.67 cm). The amplitude of transverse displacement for the codend with all the simulated catch configurations varied little, ranging from −2 to 2 cm. The wavelet spectrum coefficient of all the codend oscillations in the transverse direction varied slightly. During time intervals of 0–15 s and 45–60 s, dominant periodic positive and negative peaks were observed at frequencies ranging from 2.06 to 4 Hz, indicating the presence of strong periodic oscillations. This indicated that the simulated catch configurations had a low effect on the transverse displacement of the codend.
Figure 8 displays the time evolution of the codend oscillations in the z-direction. The codend motions in the longitudinal direction were influenced by the simulated catch configuration and characterized by quasi-periodic oscillations. The oscillation amplitude in the z-direction of the codend with a grooved catch configuration was greater than that of the codend with a spherical catch configuration. Additionally, the amplitude of the longitudinal oscillations of the codend with green canvas was much higher compared to those of the codend with other catch configurations.
The wavelet coefficient of the longitudinal displacement of the codend with a grooved catch configuration began to oscillate at approximately 0.1 s, and its oscillations were relatively intense. However, the wavelet spectrum energy of the codends with spherical catch configuration in the z-direction was lower compared to those obtained on the codend with grooved catch configuration. A higher wavelet spectrum coefficient of the codend oscillations in the z-direction was obtained at a frequency of 1.4–2 Hz for the catch configurations. Furthermore, it was observed that the codend containing the table tennis ball filled with water oscillated more violently, while the codend containing the filled-twine ball oscillated more smoothly.

3.5. The Oscillation Characteristic of the Codend Spatial Displacement Based on Main Period Morlet Wavelet Transform

Figure 9 depicts the oscillation of the main periodicity wavelet coefficients for codend displacement in both directions for all the simulated catch configurations. The amplitudes of the wavelet coefficients for codend displacement in the x-direction were relatively small and basically remained in the range of −1–1. Among them, the codend with the green canvas had the greatest amplitude (1.29), while the codend with the table tennis ball had the least amplitude (0.35). The average amplitude of the wavelet coefficients of the codend with a grooved catch configuration was about 0.91, which is about 2.86 times that of the codends with a spherical catch (~0.32). The average amplitudes of the wavelet coefficients for the codend with grooved catch configuration was ~8.79 in the z-direction, which was 7.57 times greater than that of the codends with spherical catch configuration (Table 5).

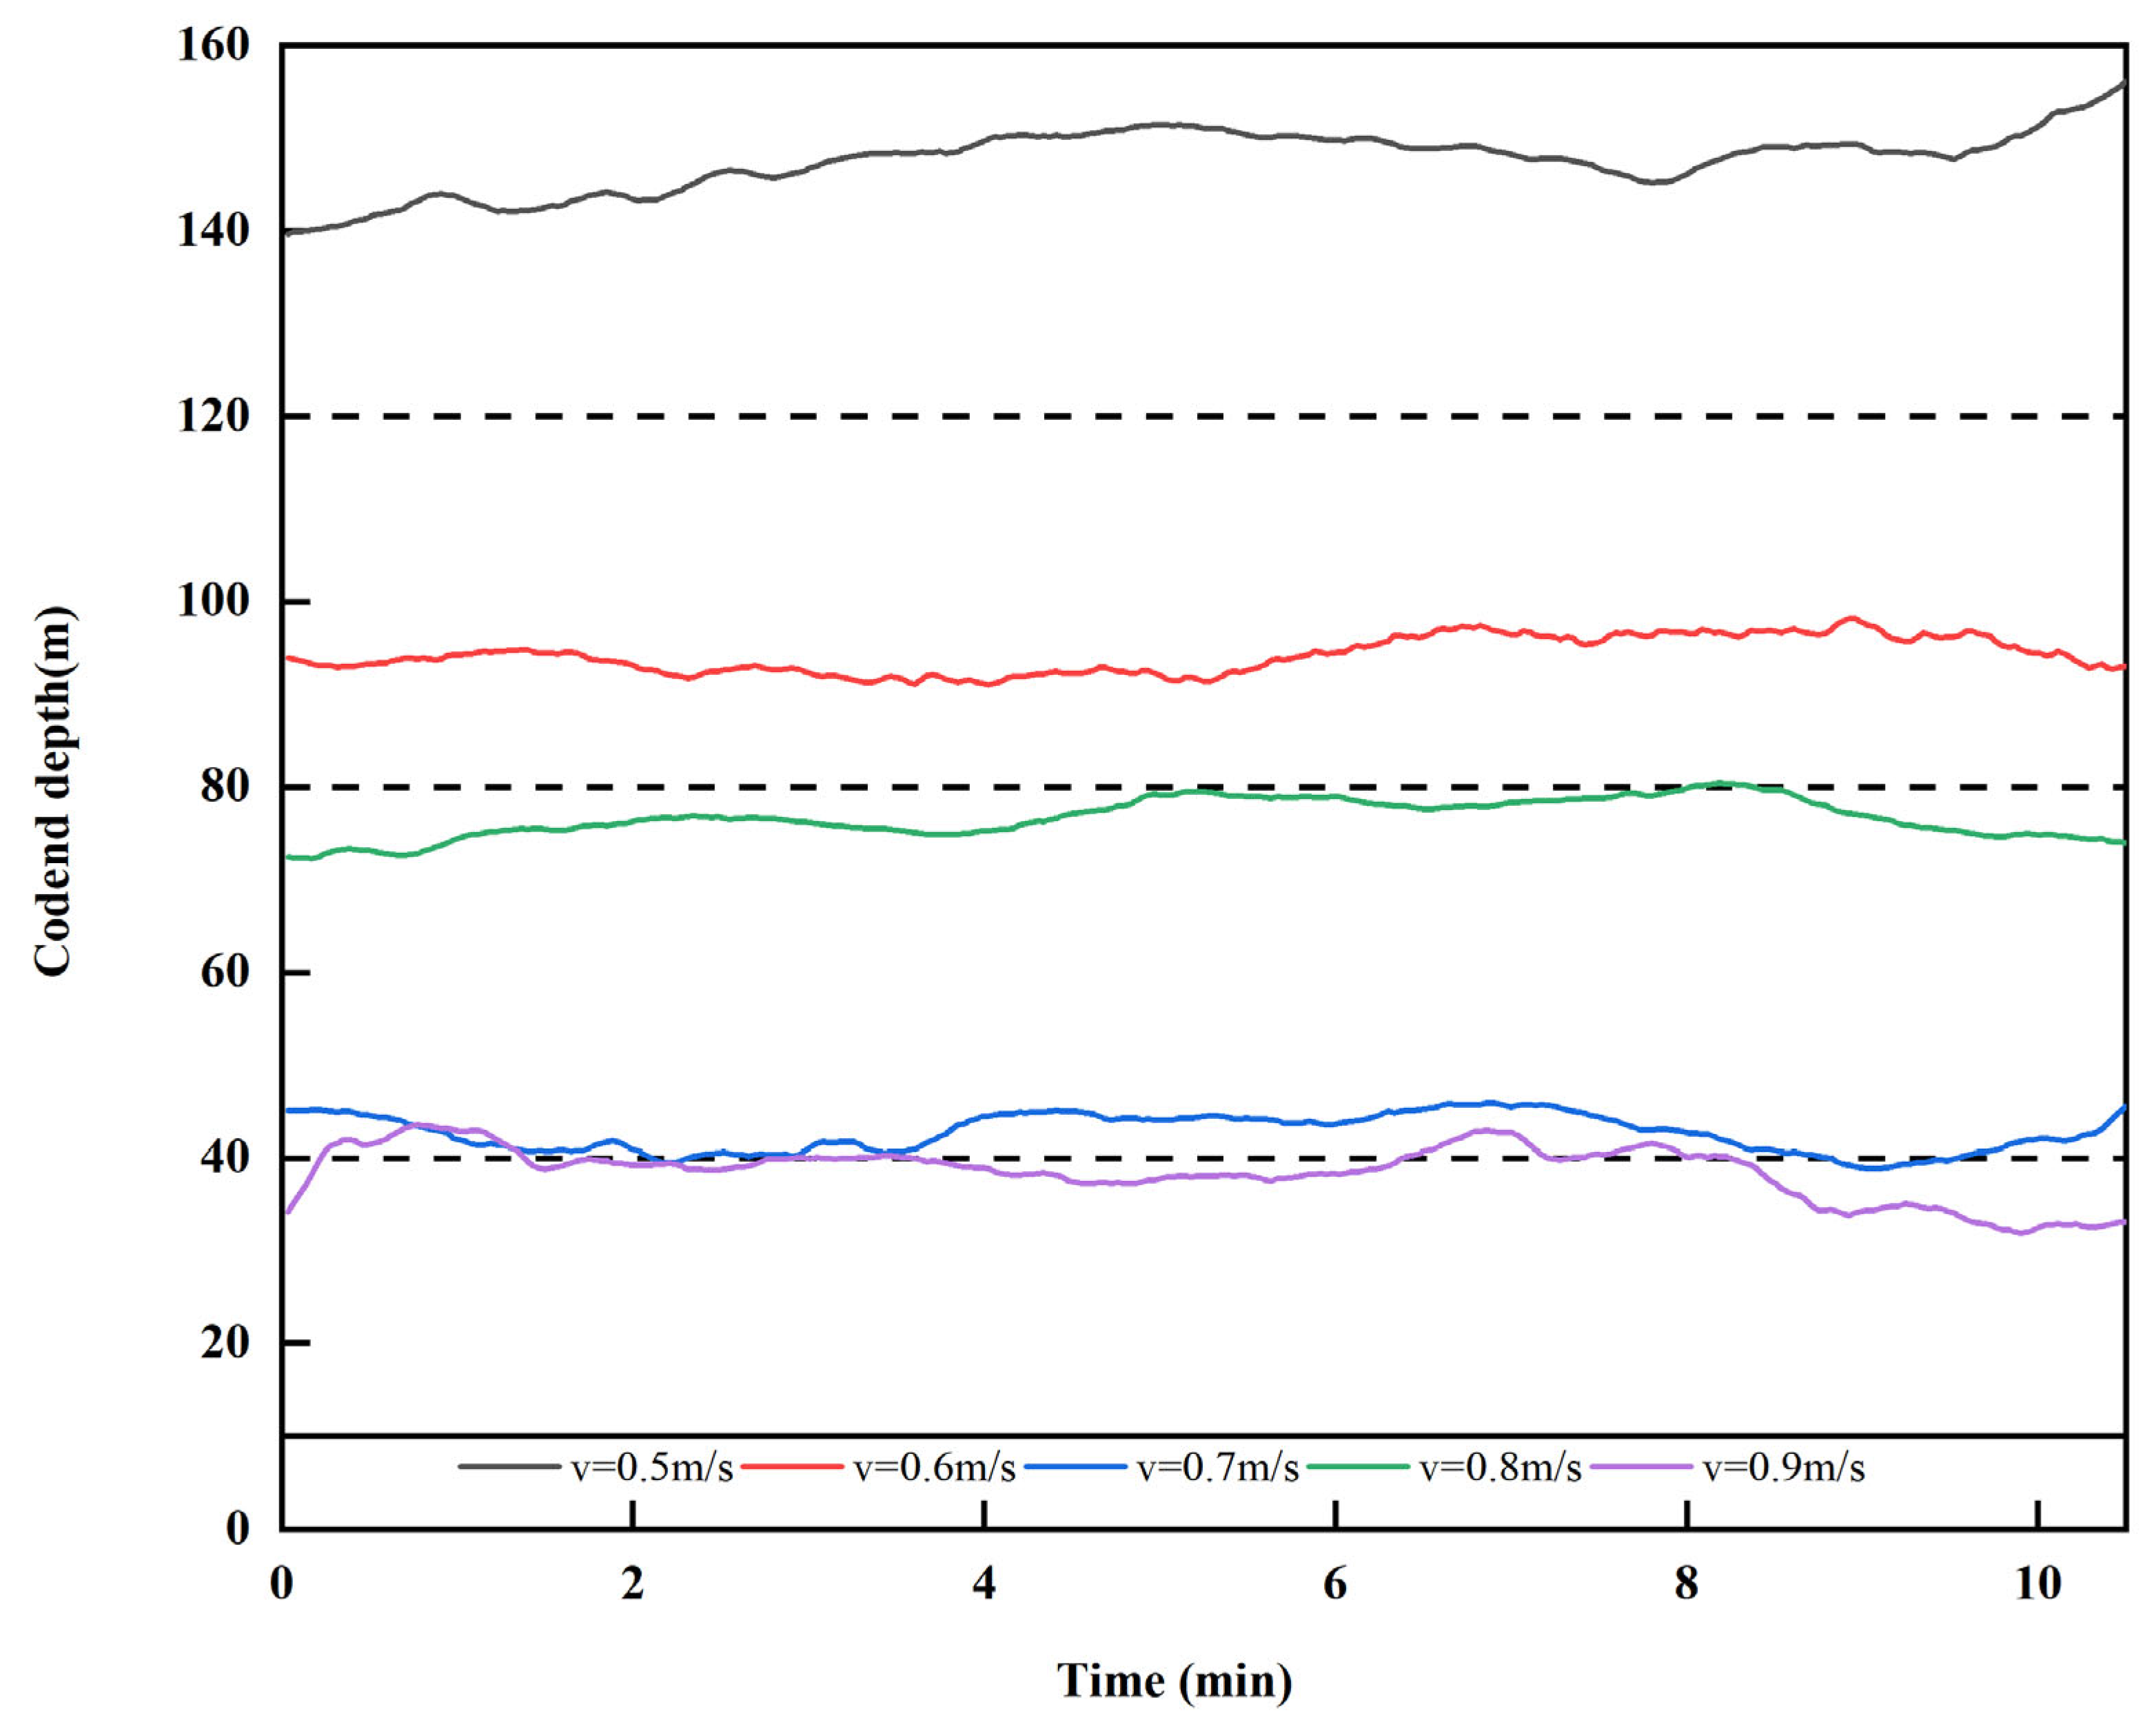
3.6. Longitudinal Displacement of Codend in Sea Trials

During fishing operations, the codend depth decreased as flow velocity increased (Figure 10). Indeed, at the lower flow velocity (0.5 m/s), the codend depth was the greatest (147.59 m), while at the higher flow velocity (0.9 m/s), it was the smallest (38.58 m). At 0.5 < V ≤ 0.7 m/s, the depth of the codend changed greatly; this depth decreased by 35.5% each time the flow velocity increased by 0.1 m/s.

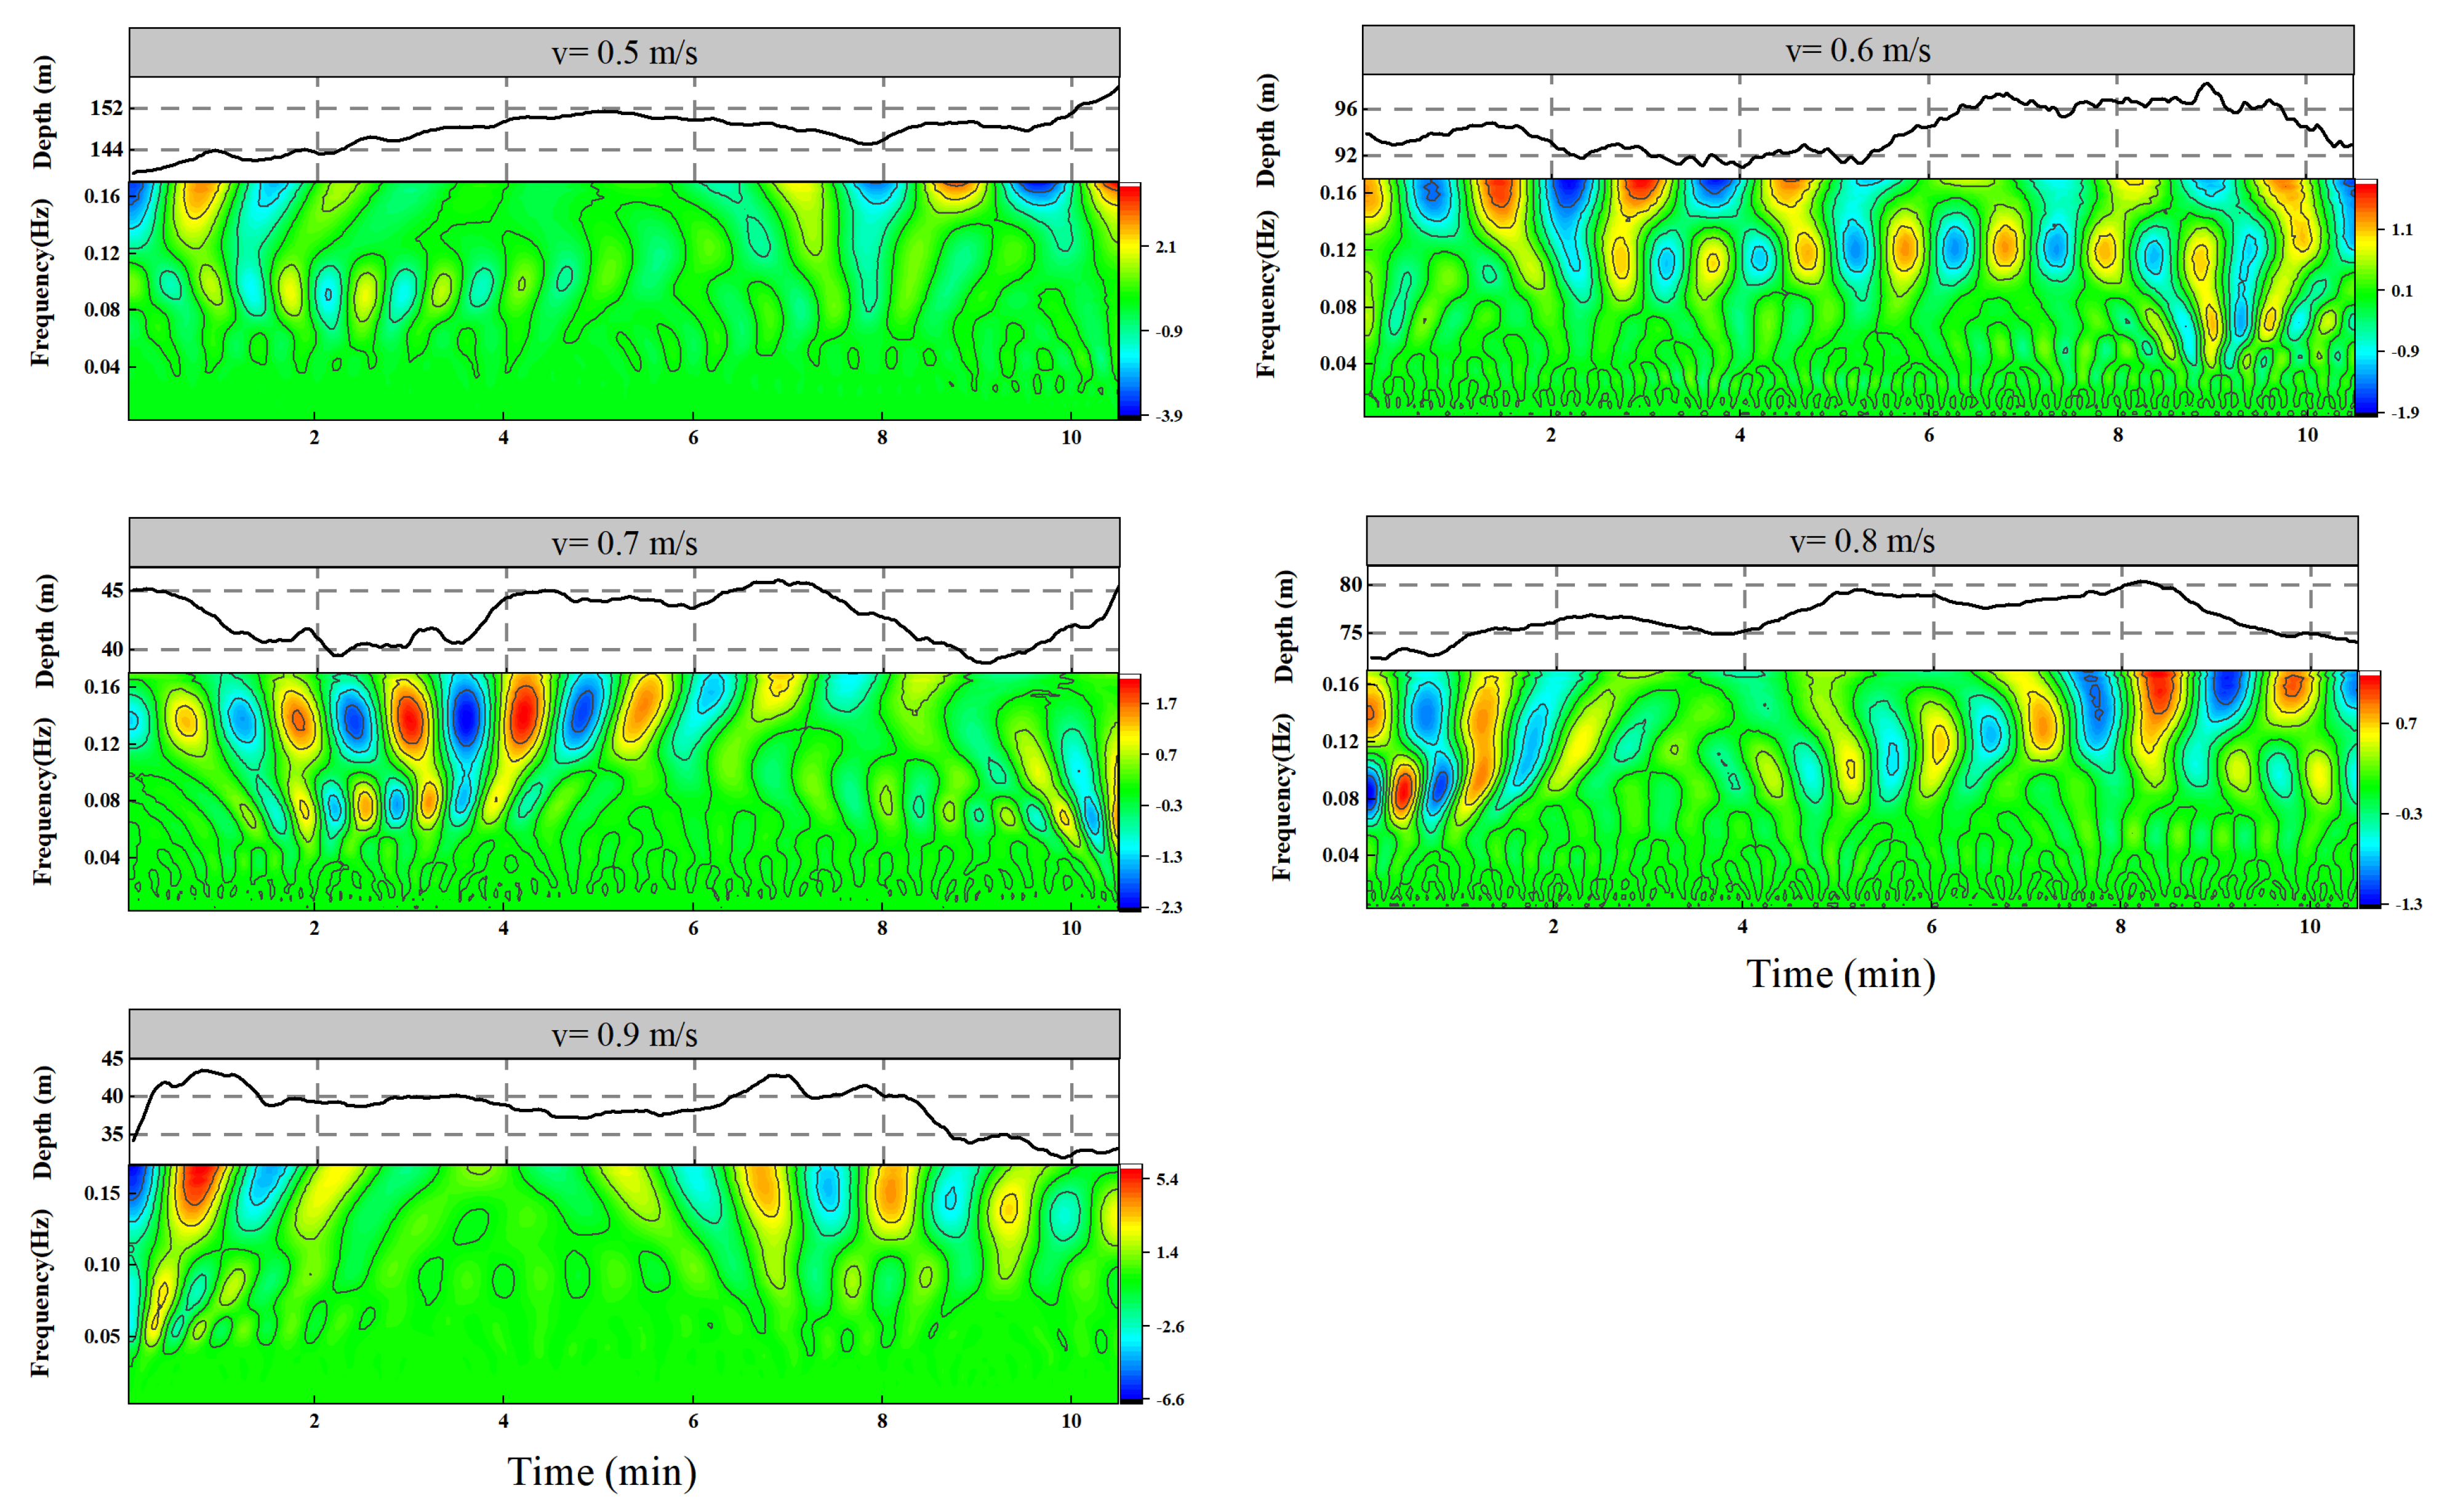
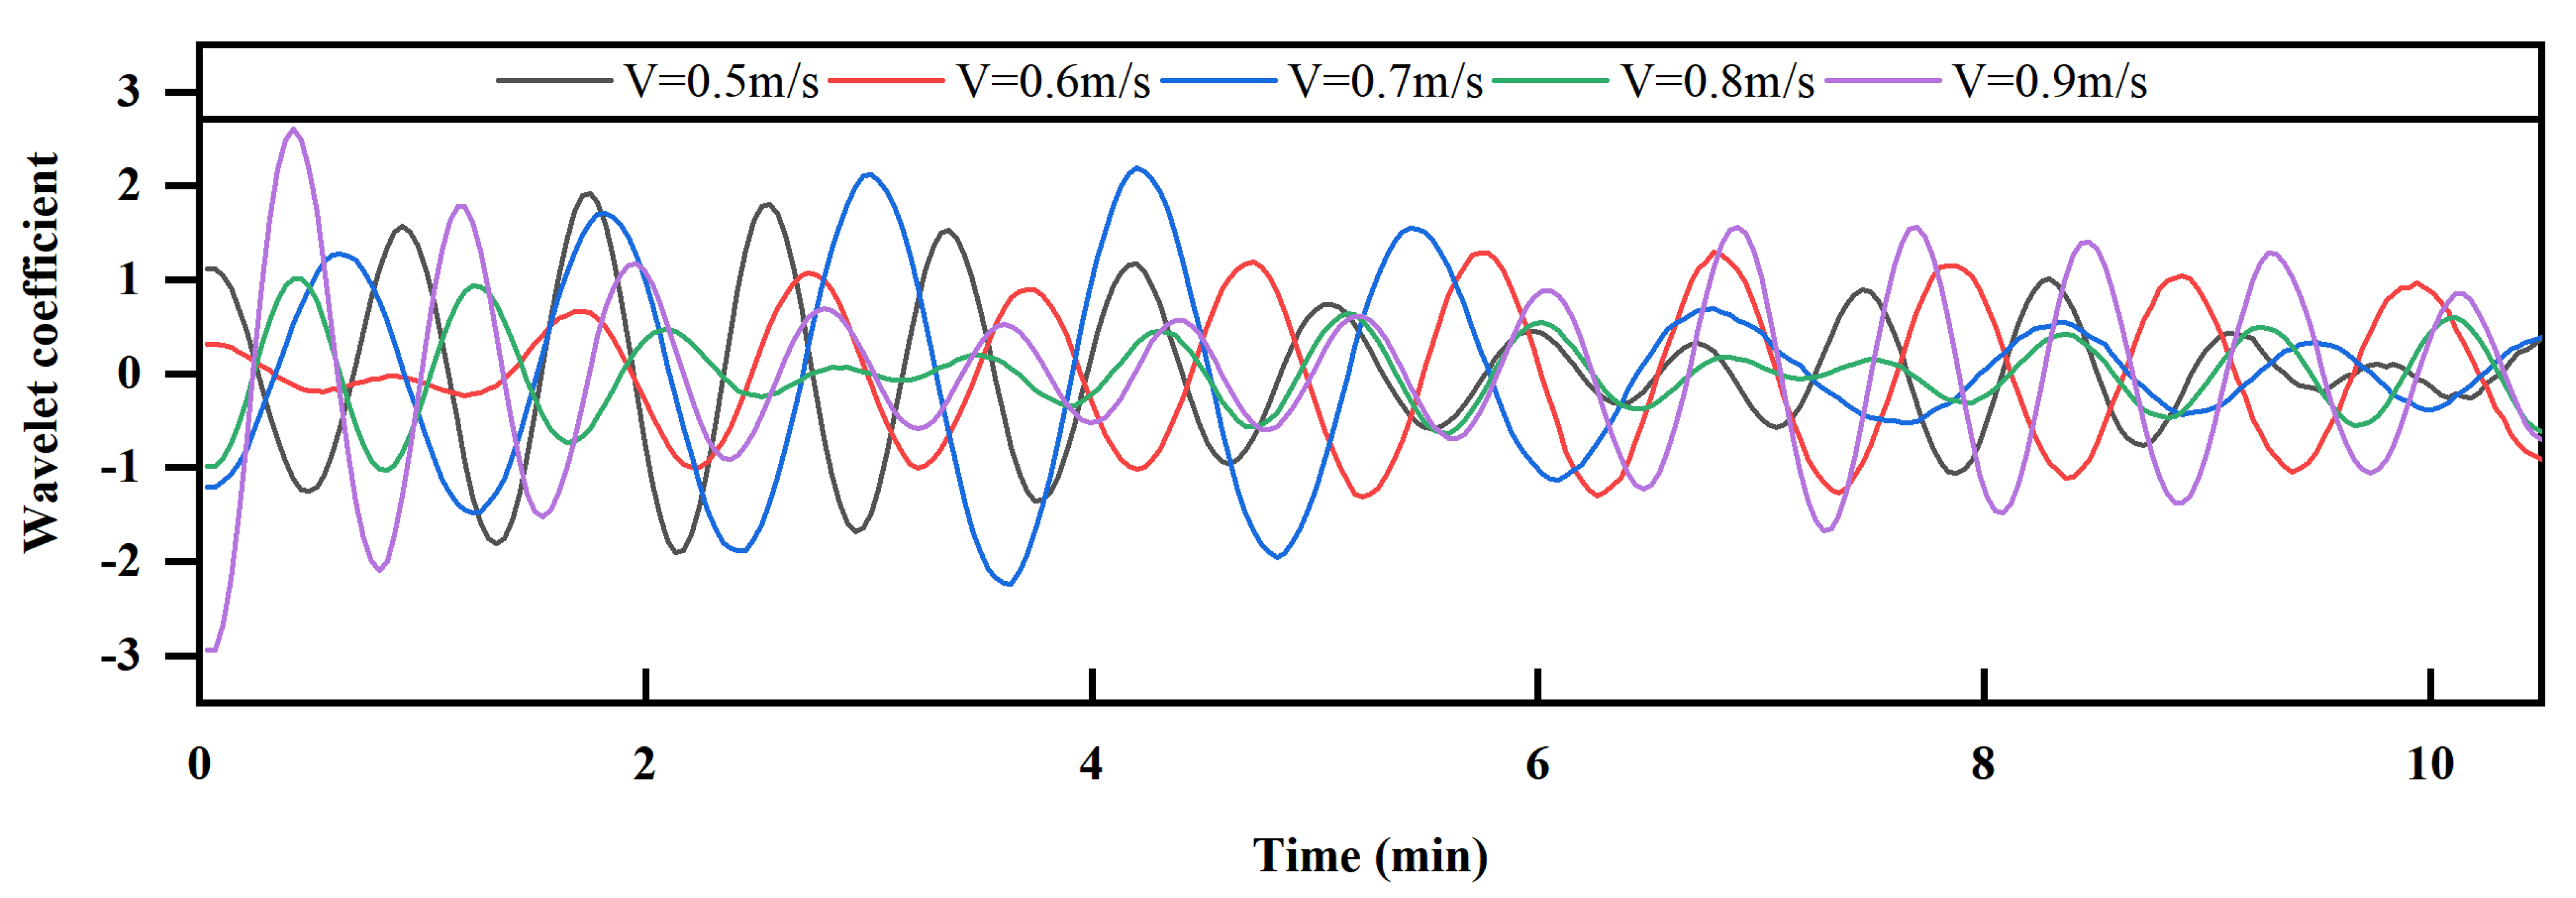
3.7. The Oscillation Characteristic of the Codend Longitudinal (z-Direction) Displacement Based on Morlet Wavelet Transform in Sea Trials

The higher wavelet spectrum coefficient of the codend oscillations in the depth-direction was obtained at the frequency of 0.13–0.17 Hz at t = 25–30 s and 5–10 s for v = 0.5, 0.6, and 0.9 m/s. However, when v = 0.7 and 0.8 m/s, two large events were visible on the codend depth oscillation. For the first even, a higher wavelet coefficient was observed at a frequency of 0.08–0.09 Hz at the times of 0.1 s, 5 s, and 13 s during the fishing operation. In addition, for the second even, a higher wavelet coefficient was observed at the frequency of 0.13–0.17 Hz at t = 23–28 s (Figure 11). These findings imply that flow velocity has an impact on the codend depth oscillation and that it has evolved into a higher periodicity structure with much more energy than small-scale structures. The wavelet analysis results revealed that alternate strong positive and negative peaks of wavelet coefficients appeared. The wavelet coefficients of the depth displacement of the codend oscillated most intensely when the flow velocity was v = 0.7 m/s, while at v = 0.8 m/s, the wavelet coefficients of the depth displacement of the codend oscillated slowly.
As shown in Figure 12, at the flow velocity of 0.5 m/s, the oscillation frequency of wavelet coefficients of the longitudinal displacement of the codend was the slowest, and it increased as the flow velocity increased. The oscillation frequency was the fastest at v = 0.8 and 0.9 m/s. When the flow velocity was v ≤ 0.7 m/s, the amplitude of the measured longitudinal wavelet coefficients increased as the flow velocity increased, and when v > 0.7 m/s, it decreased as the flow velocity increased (Table 6).

3.8. Contrast and Analysis of Measured and Test Results at Sea

Both the sea measurement and flume test flow velocities range from 0.5 to 0.9 m/s, and there is an obvious up-and-down vibration in the longitudinal position at the end of various types of simulated catch codend structures (Table 7). Figure 13 shows the analysis of displacement fluctuation using the wavelet transform, and the Pearson correlation coefficient is used to test the correlation between the analysis results and the actual codend oscillation. Based on the test results, the oscillation periods of the codend wavelet coefficients for both measured and simulated catches are highly correlated (50%), strongly correlated (16.7%), and extremely weak. Furthermore, the oscillation periods of the codends with canvas, green canvas, and table tennis balls are highly correlated, with correlation coefficients of 90%, 90%, and 89%, respectively.
However, the amplitudes of the wavelet coefficients of the codend measured at sea and simulated catches measured in the flume tank were extremely strongly correlated in 33.3%, and extremely weakly correlated in 50%. The amplitudes of the codends containing the table tennis ball filled with water and balloons filled with water are highly correlated among them, with correlation coefficients of 91% and 89%, respectively.

4. Discussions

4.1. Effects of Simulated Catches on the Morphology of Codend

The main factors influencing the motion of the flexible codend and its shape were the towing speed, ship motion caused by wave or wind, and the catch inside. As a result, it was discovered in this study and that of O’Neill et al. [23] that due to catch accumulation inside the codend and under flow velocity, the codend front meshes closed and the tail swelled. This was due to the fact that the more the catches accumulated in the codend, the more the length of the codend increased and the width narrowed, which was consistent with the finding of Meyler et al. [28].
However, Cui et al. [29] observed changes in codend morphology using underwater cameras, and the results revealed that as towing speed increased, the oncoming surface curved into an arc in the horizontal direction. The bending degree of the panel increased as the towing speed increased. This is consistent with the findings of this study, which showed that the horizontal length of codends with each catching configuration increased as flow velocity increased. Furthermore, the findings of this study showed that the contour of the codend with different simulated catch configurations were essentially the same, which contradicts the conclusion by Hermann et al. [30] that a change in catch types would result in a change in the codend shape, providing a spherical bottom with a continuous accumulation of catches. However, due to the different materials used in the catch configurations as mentioned above, and the water filterability through the codend, as flow velocity increased, the channel between the codend narrowed and the horizontal length increased, with no discernible length difference, indicating that the simulated catch configuration had little influence on the length of the codend.

4.2. Effect of Simulated Catch Configuration on the Drag Force and Codend Motions

It was demonstrated in this study that the main factors that influenced the codend drag were the flow velocity and catch factors such as catch configurations, in addition to the wave and wing during fishing operations at sea. However, the change in codend hydrodynamic characteristics, as an important component of the trawl system, determines the hydrodynamic characteristics and stability of the trawl system [31]. Nevertheless, it was demonstrated in this study that codend drag with different simulated catch configurations increased as flow velocity increased. This was because the presence of the catch in the codend caused reflux, resulting in a pressure difference, and the greater the flow velocity, the greater the drag force. It was found in this study that drag forces obtained on the codend with grooved catch configurations was greater compared to those obtained using the spherical catch configuration. This difference in drag was attributed to the material density of the catch types. Another plausible explanation is that the grooved catch configuration made the codend more unstable, unlike the spherical catch configuration, during the flume tank experiment. This instability led to a decrease in water flow velocity and an increase in pressure on the codend surface. This increase in pressure allows the codend with grooved catch configurations to oscillate more than codend with spherical catch configuration, which decreases its mesh opening, limits the flow passage, and thus increases its drag. The wavelet results on the codend drag showed that the wallet coefficient spectrum peak shifted from low frequency (large-scale structures) to high frequency (small-scale structures). This was more pronounced on the codend with grooved catch and was in agreement with finding of Liu et al. [7] and Thierry et al. [2].
The codend oscillated in both the longitudinal and transverse directions during the experiments, which is because the codend attached to a trawl oscillated in both the longitudinal and vertical directions in response to the dynamic interaction of a fishing vessel under trawling conditions [9,23]. These codend oscillations occurred because the presence of the catch inside the codend reduced the mesh opening of the front part of the codend, limiting the flow through the codend and resulting in vortex shedding. This vortex shedding created vertical pressure on the codend, resulting in codend oscillations. However, the results of this study revealed that the longitudinal displacement of the codend filled with various simulated catch configurations changed little, and the spatial wavelet positive and negative oscillations were not visible in the time-frequency domain. This is because of the catch and the effect of water flow; the mesh closure may have been close to the maximum. Thus, it was found that the codend oscillations and codend morphology changed with the catch size and mesh size. However, it was found that the codend with grooved catch configurations oscillated with greater amplitude compared to the codend with spherical catch configuration. The reason for this phenomenon can be explained by the fact that the grooved catch configurations weighed less in comparison to the spherical catch configuration. After comparing the wavelet results of the codend oscillations obtained during the sea trial and the motions of the model codend with the spherical catch configuration, it was observed that there was a similarity between the two. However, the codend oscillations during the sea trial were influenced by factors such as warp length and towing speed. Therefore, it is reasonable to believe that the spherical catch configuration would be the better choice to replace the real catches during the model experiment.
The morphological features of the catch inside the codend can impact its selectivity. Due to the limited space and the limited stamina of the fish inside the codend, it is commonly believed that most of the fish entering the codend are already exhausted. During trawling operations, the codend often undergoes oscillation, inducing panic among fish when they collide with the netting and disturbing the balance of the school, leading to collisions between individuals and ultimately compromising the quality of the catch. Moreover, the oscillation of the codend can obstruct the escape of smaller fish through the mesh, causing them to accumulate in the back of the codend and thus affecting the selectivity of the gear. During fishing operations, vessels require a significant amount of energy, and most modern fishing vessels rely on fossil fuels. In general, resistance in fishing gear can lead to increased energy consumption. Optimizing fishing gear can reduce gear resistance, leading to increased profitability for the fishery and promoting maximum ecological sustainability.

4.3. Simulated Catch Selection

Due to difficulties in controlling the actual catch during model tests, which can significantly affect the precision of flume instruments and water quality, Meyler et al. [28], O’Neill et al. [23], Bouhoubeiny et al. [11], and other researchers utilized simulated catch. However, it is important to acknowledge that there were significant differences between the flume model test and the sea test. While the sea test was conducted on the trawl system under varying and complex sea and operation conditions, the model test had its limitations. The complexity of the sea conditions and operation environment also had a significant impact on the codend, and the actual catch varied from the simulated catch used in the model tests. The experimental model used in this study is based on the way the actual catch accumulates in the sea. When the real catch is smaller, it resembles a grooved shape attached to the inner wall of the codend meshes, but as the catch continues to accumulate, it eventually assumes a hemispherical or spherical shape. The simulated catch in the codend model can be categorized into two types based on its contour: the grooved catch configuration (canvas, green canvas, and basketball) and the spherical catch configuration (table tennis ball filled with water, balloons filled with water, and balls made of twine). During the experiment, a simulated catch configuration was used in the form of a ball made of polyethylene twine instead of real catch. The results showed that the polyethylene twine ball had no significant effect on the drag and displacement oscillation of the codend. This finding is consistent with the study conducted by O’Neill and Donoghue [16], in which polystyrene small nettings of sufficient size were used as a simulated catch configuration to measure the geometric shape of the trawl codend and the pressure distribution on it. However, differences were observed in the material and shape of the simulated catch. The reason why the catch configuration did not affect the drag and motion of the codend was that the ball made of polyethylene twine had a porous structure that allowed water to flow freely through the codend, resulting in a decrease in vertical pressure due to the reduction in vortex shedding effects. Another simulated catch configuration used in this study was water-filled balloons, and the results showed that the codend oscillations obtained with these water-filled balloons, rather than real catch, were less significant than those of other catch configurations. This could be due to two reasons: firstly, the water flow was able to easily pass through the smooth surface of the balloon, causing a small vortex to form around it, and secondly, the weight of the water-filled balloons in the water reduced the oscillation amplitude. However, these results were different from the findings of O’Neill et al. [23], who also used water-filled balloons instead of real catch and found that there was an obvious codend oscillation effect (p < 0.05). This study showed that using a grooved catch configuration allowed greater and easier oscillation of the codend compared to a spherical configuration (p < 0.05). The reason for this finding is that the grooved catch configuration had poor water filtration, which significantly modified the mesh opening and resulted in a decrease in flow passage. This decrease led to the development of greater vortex shedding around the codend, which increased transverse motions and codend drag [8,32]. In contrast to the grooved catch configuration, the smooth surface of the spherical catch configuration and the small spacing between the catches reduced vortex shedding around the codend, resulting in the weaker oscillation amplitude of the codend.
The wavelet transform was utilized in this study to demonstrate that the codend drag and motions with different simulated catch configurations were out of equilibrium, indicating the presence of coherent structures that were identified. The Pearson correlation coefficient was then used to test the correlation between codend oscillations obtained on the codend during the physical model test and during the sea trial. The higher the correlation coefficient was, the closer the measurement results were to each other. The results showed that the oscillation period of the wavelet coefficients of the codend at sea had a strong correlation (50%) and the amplitude had a strong correlation (33.3%), indicating that the codend of the simulated catch was close to the measured period, but the amplitude was not necessarily close to the measured amplitude.

5. Conclusions

This study was carried out to experimentally evaluate the impact of simulated catch configurations on hydrodynamic characteristics, codend shape, and codend motions, with the aim of choosing the better simulated catch to replace the real catch during flume tank experiments. To this end, a model codend was designed and tested in the flume tank using six different simulated catch types, including grooved and spherical types. The results were compared to sea trial measurements. The wavelet transform method was used to analyze the non-stationary time series of the oscillatory phenomena of the drag force and codend motions. The main conclusions are as follows:
(1)
The horizontal length of the codends with different simulated catch configurations increased with increasing flow velocity, but the range of the increase was not obvious, and the simulated catch configuration had little effect on the overall longitudinal displacement (codend motion in x-direction) of the codends (p > 0.05).
(2)
The drag and displacement oscillations of the codend with grooved catch configuration were obvious, and the oscillations were more severe than those of the codend with spherical catch configuration. Additionally, the longitudinal displacement amplitude of the codend with grooved catch configurations was approximately 8.79 times greater than that of the codend with spherical catch configuration.
(3)
The findings of the wavelet transform analysis on the codend drag and codend motions showed that the wavelet coefficients of the codends with grooved catch configurations were greater than those of codends with spherical catch configurations. Additionally, intense oscillations were observed in the low frequencies for all simulated catch configurations.
(4)
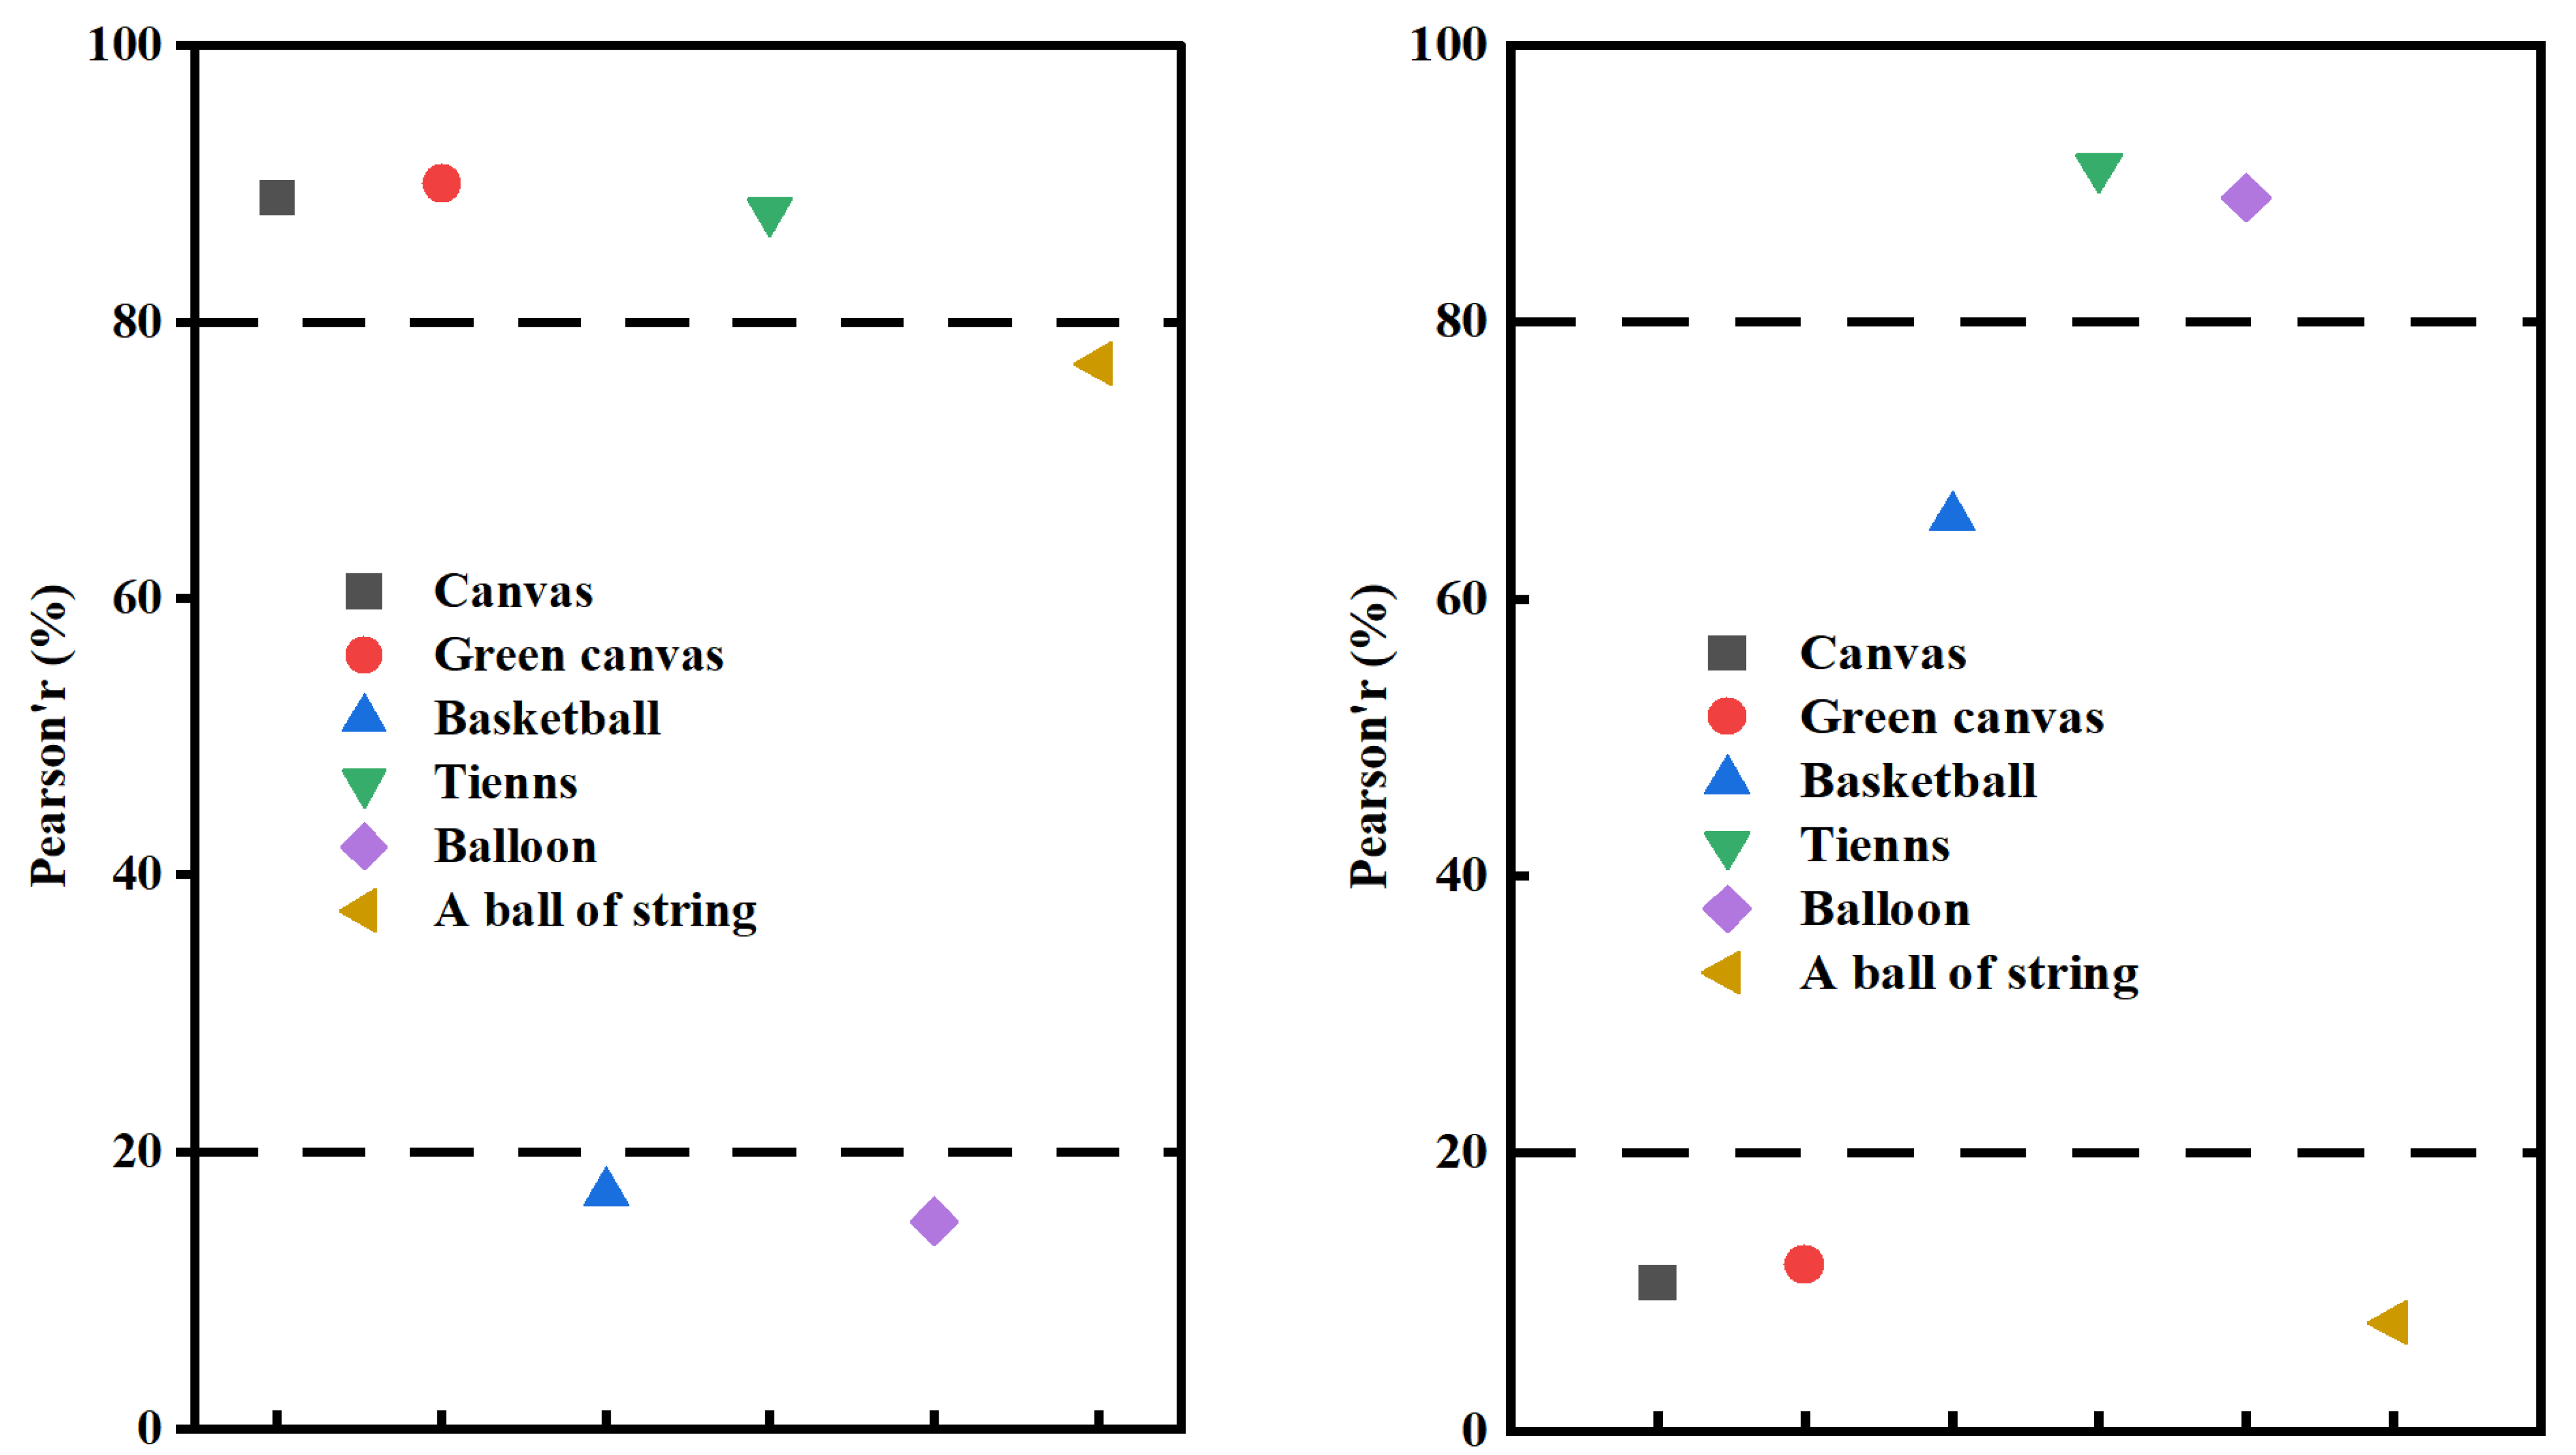
The correlation coefficient of the codend period with the water-filled table tennis ball was 89%, with an amplitude of 91%, which was closer to the actual measurement. The simulated catch used in the flume test is an approximation within a certain range rather than a catch set that fully matches the actual law of change. Therefore, this study suggests using the tennis ball as the simulated catch because it provided the oscillations that were consistent with those obtained during the sea trial.

Author Contributions

Methodology, F.Z.; Investigation, F.Z., H.T., W.L., Q.S., M.Z., C.Z., X.G. and. C.S.; Resources, F.Z; Data curation, F.Z; Writing—original draft, F.Z and H.T.; Writing—review & editing, N.N.B.T., W.L, L.X. and F.H. All authors have read and agreed to the published version of the manuscript.

Funding

This study is partially supported by the Natural Science Foundation of Shanghai, grant number 23ZR1427000 and the National Natural Science Foundation of China, grant number Grand No. 31902426.

Institutional Review Board Statement

Not applicable.

Informed Consent Statement

Not applicable.

Data Availability Statement

The data that support the fundings of this study are available from the corresponding author upon reasonable request.

Acknowledgments

The authors thank the scientific observers who collected the scientific data onboard commercial trawlers Long Teng.

Conflicts of Interest

The authors declare no conflict of interest. The funders had no role in the design of the study; in the collection, analyses, or interpretation of data; in the writing of the manuscript; or in the decision to publish the results.

References

  1. Stewart, P.A.M.; Ferro, R.S.T. Four experiments investigating codend drag. Fish. Res. 1987, 5, 349–358. [Google Scholar] [CrossRef]
  2. Thierry, B.N.N.; Tang, H.; Zhang, J.; Liu, W.; Xu, L.X.; Hu, F.X. Experimental analysis of the influence of gear design and catch weight on the fluid–structure interaction of a flexible codend structure used in trawl fisheries. Appl. Sci. 2023, 13, 2505. [Google Scholar] [CrossRef]
  3. Broadhurst, M.K.; Larsen, R.B.; Kennelly, S.J.; McShane, P.E. Use and success of composite square-mesh codends in reducing bycatch and in improving size-selectivity of prawns in Gulf St. Vincent, South Australia. Fish. Bull. 1999, 97, 434–448. [Google Scholar]
  4. Broadhurst, M.K.; Millar, R.B.; Wooden, M.E.L.; Macbeth, W.G. Fish. Manag. Ecol. 2006, 13, 81–92. [Google Scholar] [CrossRef]
  5. Priour, D. Numerical optimisation of trawls design to improve their energy efficiency. Fish. Res. 2009, 98, 40–50. [Google Scholar] [CrossRef]
  6. Wileman, D.A.; Ferro, R.S.T.; Fonteyne, R.; Millar, R.B. Manual of methods of measuring the selectivity of towed fishing gears. ICES Coop. Res. Rep. No. 1996, 126, 215. Available online: https://core.ac.uk/reader/45439858 (accessed on 3 February 2022).
  7. Liu, W.; Tang, H.; Xu, L.X.; Dong, S.H.; Xu, L.X.; Hu, F.X. Effect of cutting ratio and catch on drag characteristics and fluttering motions of midwater trawl codend. J. Mar. Sci. Eng. 2021, 9, 256. [Google Scholar] [CrossRef]
  8. Thierry, B.N.N.; Tang, H.; Xu, L.X.; You, X.X.; Hu, F.X.; Achile, N.P. Hydrodynamic performance of bottom trawls with different materials, mesh sizes, and twine thicknesses. Fish. Res. 2020, 221, 105403. [Google Scholar] [CrossRef]
  9. O’Neill, F.G.; Knudsen, L.H.; Wileman, D.A.; McKay, S.J. Cod-end drag as a function of catch size and towing speed. Fish. Res. 2005, 72, 163–171. [Google Scholar] [CrossRef]
  10. Pichot, G.; Germain, G.; Priour, D. On the experimental study of the flow around a fishing net. Eur. J. Mech. 2009, 28, 103–116. [Google Scholar] [CrossRef]
  11. Priour, D. Modelling axisymmetric codends made of hexagonal mesh types. Ocean Eng. 2014, 92, 1–11. [Google Scholar] [CrossRef]
  12. Cheng, Z.H.; Paul, D.W.; David, K. Hydrodynamic performance of full−scale T0 and T90 codends with and without a codend cover. Ocean Eng. 2022, 10, 440. [Google Scholar] [CrossRef]
  13. Bouhoubeiny, E.; Germain, G.; Druault, P. Time-resolved PIV investigations of the flow field around rigid codend net structure. Fish. Res. 2011, 108, 344–355. [Google Scholar] [CrossRef]
  14. Kim, H.Y. Analysis of the turbulent flow and tilt in the codend of a bottom trawl during fishing operations. Ocean Eng. 2013, 64, 100–108. [Google Scholar] [CrossRef]
  15. Blevins, R.D.; Saunders, H. Flow-induced vibration. J. Mech. Des. 1977, 101, 6. [Google Scholar] [CrossRef]
  16. O’Neill, F.G.; O’Donoghue, T. The fluid dynamic loading on catch and the geometry of trawl codends. Proc. R. Soc. Lond. A 1997, 453, 1631–1648. [Google Scholar] [CrossRef]
  17. Wan, R.; Jia, M.X.; Guan, Q.L.; Huang, L.Y.; Cheng, H.; Zhao, F.F.; He, P.G.; Hu, F.X. Hydrodynamic performance of a newly-designed Antarctic krill trawl using numerical simulation and physical modeling methods. Ocean Eng. 2019, 179, 173–179. [Google Scholar] [CrossRef]
  18. Priour, D.; Prada, A. An experimental numerical study of the catch weight influence on trawl behavior. Ocean Eng. 2015, 94, 94–102. [Google Scholar] [CrossRef]
  19. Jones, E.G.; Summerbell, K.; O’Neill, F. The influence of towing speed and fish density on the behaviour of haddock in a trawl codend. Fish. Res. 2008, 94, 166–174. [Google Scholar] [CrossRef]
  20. Druault, P.; Germain, G. Analysis of hydrodynamics of a moving trawl codend and its fluttering motions in flume tank. Eur. J. Mech. B Fluid 2016, 60, 219–229. [Google Scholar] [CrossRef]
  21. Thierry, N.N.B.; Tang, H.; Xu, L.X.; Hu, F.X.; You, X.X.; David, M.A.; Achille, N.P. Identifying the turbulent flow developing inside and around the bottom trawl by electromagnetic current velocity meter approach in the flume tank. J. Hydrodyn. 2021, 33, 636–656. [Google Scholar] [CrossRef]
  22. Thierry, B.N.N.; Tang, H.; Achile, N.P.; Xu, L.X.; Zhou, C.; Hu, F.X. Unsteady turbulent flow developing inside and around different parts of fluttering trawl net in flume tank. J. Fluid Struct. 2022, 108, 103451. [Google Scholar] [CrossRef]
  23. O’Neill, F.G.; McKay, S.J.; Ward, J.N.; Strickland, A.; Kynoch, R.J.; Zuur, A.F. An investigation of the relationship between sea state induced vessel motion and codend selection. Fish. Res. 2003, 60, 107–130. [Google Scholar] [CrossRef]
  24. Madsen, N.; Hansen, K.; Madsen, N.A.H. Behavior of different trawl codend concepts. Ocean Eng. 2015, 108, 571–577. [Google Scholar] [CrossRef]
  25. Tauti, M. A relation between experiments on model and on full-scale of fishing net. Nippon Suisan Gakkai Shi 1934, 3, 171–177. [Google Scholar] [CrossRef]
  26. Hu, F.X.; Matuda, K.; Tokai, T. Effects of drag coefficient of netting for dynamic similarity on model testing of trawl nets. Fish. Sci. 2001, 67, 84−89. [Google Scholar] [CrossRef]
  27. Tang, H.; Hu, F.X.; Xu, L.X.; Dong, S.C.; Zhou, C.; Wang, X.F. Variations in hydrodynamic characteristics of netting panels with various twine materials, knot types and weave patterns at small attack angles. Sci. Rep. 2019, 9, 1923. [Google Scholar] [CrossRef] [PubMed]
  28. Meyler, L.; Petrone, G.; Cammarata, G. Simulation of net structures hydrodynamic fields. In Modelling and Simulation; Intech Open: London, UK, 2008; pp. 261–282. [Google Scholar] [CrossRef]
  29. Cui, Y.; Guan, C.Y.; Wan, R.; Huang, B.; Li, J. Numerical simulation of a flatfish cage system in waves and currents. Aquac. Eng. 2013, 56, 26–33. [Google Scholar] [CrossRef]
  30. Herrmann, B.; Priour, D.; Krag, L.A. Simulation-based study of the combined effect on codend size selection of turning meshes by 90° and reducing the number of meshes in the circumference for round fish. Fish. Res. 2007, 84, 222–232. [Google Scholar] [CrossRef]
  31. Balash, C.; David, S.; Jonathan, B.; Giles, T.; Neil, B. Drag characterisation of prawn-trawl bodies. Ocean Eng. 2016, 113, 18–23. [Google Scholar] [CrossRef]
  32. Bouhoubeiny, E.; Druault, P.; Germain, G. Phase-averaged mean properties of turbulent flow developing around a fluttering sheet of net. Ocean Eng. 2014, 82, 160–168. [Google Scholar] [CrossRef]
Figure 1. The schematic diagram of the full-scale codend and the model codend structure.
Jmse 11 01026 g001
Figure 2. Flume tank and equipment.
Jmse 11 01026 g002
Figure 3. The camera footages of codend (lower: Spheroidal; upper: Grooved type).
Jmse 11 01026 g003
Figure 4. The shape transformation for codend with simulated catch at different flow velocity.
Jmse 11 01026 g004
Figure 5. Morlet wavelet transform of codend drag with different simulated catch.
Jmse 11 01026 g005
Figure 6. Principal period wavelet coefficient oscillation of codend drag with simulated catch.
Jmse 11 01026 g006
Figure 7. Morlet wavelet transform of different simulated catch codend displacements in x-direction.
Jmse 11 01026 g007
Figure 8. Morlet wavelet transform of different simulated catch codend displacements in z-direction.
Jmse 11 01026 g008
Figure 9. Oscillations of principal period wavelet coefficients of simulated catch displacement of codend (upper: x-direction; lower: z-direction).
Jmse 11 01026 g009
Figure 10. Longitudinal displacement of codend measured at sea.
Jmse 11 01026 g010
Figure 11. Morlet wavelet transform of longitudinal (z-direction) displacement of codend measured at sea.
Jmse 11 01026 g011
Figure 12. Oscillations of principal period wavelet coefficients of measured longitudinal (z-direction) displacement of codend.
Jmse 11 01026 g012
Figure 13. Correlation test between measured and tested codend oscillation frequency and amplitude.
Jmse 11 01026 g013
Table 1. Main dimension of Antarctic krill trawler “Long Teng”.
Total Length (m)Main Engine Power (kW)Total Tonnage (t)Max
Speed (kn)
Moulded Depth (m)Moudeld Breadth (m)
120.752967765131219
Table 2. Specifications and parameters of experiment codend.
Twine MaterialsMesh Size (mm)Knot DirectionCodend Length (mm)Cutting Ratio
Extension
codend
PE
PE
40
40
T0
T0
480
1500
4:1(/NBNBN/3)
AN
Table 3. Simulated catch weights in air and water.
The Type of The Simulated CatchGrooved Type Simulated CatchSpheroidal Simulated Catch
CanvasGreen CanvasBasketballTable Tennis BallA Ball Made of TwineBalloon
Material (cotton content)Cotton (85–95%)Cotton
(81–90%)
polyurethaneCarbon nitridePolyethyleneLatex
Thickness (mm)0.40.91.5
Weight in air (N)0.250.511.0410.66.0314.5
Weight in water(N)0.160.300.572.70.922.1
Table 4. Oscillation period amplitude of wavelet coefficient of codend drag with simulating catch.
The Type of The Simulated CatchGrooved Type Simulated CatchSpheroidal Simulated Catch
CanvasBasketballGreen CanvasTable Tennis BallBalloonA Ball Made of Twine
Frequency (Hz)0.480.290.510.370.290.42
Amplitude0.811.30.850.510.370.34
Table 5. Oscillation period amplitude of wavelet coefficient of simulated catch codend displacement.
The Type of The Simulated CatchGrooved Type Simulated CatchSpheroidal Simulated Catch
CanvasBasketballGreen CanvasTable Tennis BallBalloonA Ball Made of Twine
XFrequency (Hz)0.740.610.530.91.250.67
Amplitude0.351.081.290.260.320.37
ZFrequency (Hz)0.520.540.610.50.630.61
Amplitude8.914.5413.721.940.780.69
Table 6. Oscillation period amplitude of wavelet coefficient measured longitudinal (z-direction) displacement of codend.
Flow Velocity (m/s)0.50.60.70.80.9
MeasuredFrequency (Hz)0.030.040.040.050.05
Amplitude1.721.852.330.812.02
Table 7. Oscillation period amplitudes of measured and tested codend wave coefficients.
Flow Velocity (m/s)MeasuredCanvasGreen CanvasBasketballTennis BallBalloonA Ball Made of Twine
Frequency (Hz)0.50.030.430.420.450.430.480.56
0.60.040.450.430.470.480.560.60
0.70.040.520.540.610.500.630.61
0.80.050.570.630.410.600.330.63
0.90.050.630.630.320.580.490.72
Amplitude0.51.7213.0315.415.041.320.90.53
0.61.8510.597.586.841.40.711.13
0.72.338.9113.724.541.940.780.69
0.80.818.6711.441.780.792.690.77
0.92.029.4411.364.262.061.210.93
Disclaimer/Publisher’s Note: The statements, opinions and data contained in all publications are solely those of the individual author(s) and contributor(s) and not of MDPI and/or the editor(s). MDPI and/or the editor(s) disclaim responsibility for any injury to people or property resulting from any ideas, methods, instructions or products referred to in the content.

