1. Introduction
In recent years, impressive progress has been made in the construction of artificial islands in the South China Sea [
1]. These islands and reefs are located on the western side of the Circum-Pacific seismic belt, at the intersection of the Pacific Plate, the Pacific Plate, and the Indo-Australian Plate, with complex geological configurations and active seismic activity [
2]. Any unforeseen damage to these reef infrastructures, caused by natural calamities such as earthquakes, could negatively impact the South China Sea’s economic progress, scientific explorations, and regional security. Consequently, it is of great significance to conduct comprehensive research on the seismic safety of the reef engineering in the South China Sea.
Reef engineering projects typically rely on naturally formed reef islands that develop from the seabed. The seismic response of such an offshore site differs from that of traditional onshore engineering sites due to the unique geological features of the reef topography, the mechanical properties of coral sand and reef limestone, and the wave radiation effects of the seawater layer. Therefore, the seismic response mechanisms and laws of such areas require specialized consideration.
Initially, the seismic response analysis of an ocean site primarily relied on analytical methods. The generation and propagation of seismic waves in the ocean environment were simplified into mathematical models, and the stress field or wave field was then obtained through theoretical deduction. Scholars such as Lindsay [
3], Brekhovskikh [
4], Zheng et al. [
5], Zhu [
6], Feng [
7], and Chen et al. [
8] have conducted research in this field, uncovering the laws of wave propagation and its influencing factors in open systems involving fluid-solid interaction.
Some researchers have also studied the mechanical properties of the ocean engineering site, particularly the marine coral sand, through physical tests. He et al. [
9] investigated the resilient modulus response of coral sand from the South China Sea under cyclic loading and established a new prediction model to predict the resilient modulus of coral sand in the whole stress interval. Liu et al. [
10] investigated the cyclic behavior of calcareous sand from the South China Sea through a series of undrained cyclic triaxial tests and found that cyclic stress ratios and relative density had a notable effect on the cyclic behavior of calcareous sand, which had higher liquefaction resistance than silica sand due to its angular nature. Ma et al. [
11] presented the results of a multi-stage strain-controlled undrained cyclic shear test on saturated coral sand and proposed a new index to modify the prediction model of the maximum shear modulus and reference shear strain under different consolidation conditions, which shows an excellent prediction of shear modulus with a deviation within ±10%. Chen et al. [
12] investigated the mechanical behavior of coral sand under different saturation (Sr) levels, which is crucial for the stability of island-reef foundations. Results showed that shear strength and internal friction angle decreased with increasing Sr, while cohesion was not significantly affected. Particle breakage also increases with increasing Sr, and 92.5% is suggested as the maximum Sr value for coral sand testing.
With the development and advancement of numerical calculation methods in recent years, numerical simulation methods have increasingly been applied in site seismic response analysis due to their effectiveness in solving complex models and boundary conditions. Chen et al. [
13] processed new multichannel reflection seismic profiles in the continent-ocean transition zone of the northern South China Sea and developed effective techniques to attenuate different types of seismic multiples. Guo et al. [
14] and Tang et al. [
15] employed the limit equilibrium method to examine the stability of Zhubi Reef and Yongshu Reef in the South China Sea, respectively. Their findings indicate that while the reef body has good stability under self-gravity, earthquakes can cause slope instability and slumping, particularly in newly developed parts of the reef. Hu et al. [
16] delved into the amplification effect of coral reef sites on pulse-type seismic motions utilizing a one-dimensional (1D) site seismic analysis model based on the geological structure of the coral reef. They suggested that the amplification ratio of the ground motion on the reef flat is between 1.6–2.4, and the notable period is between 0.2–0.8 s. Further, they established a two-dimensional (2D) shallow reef model with a height of 40 m [
17], simulated the coupling effect of seawater using equivalent node forces, and investigated the seismic response of reef sites when the seismic waves are vertically incident. Chen et al. [
18] took into account the dynamic nonlinear characteristics of coral sand and the wave radiation effect at the near-field truncation. They developed a two-dimensional analysis model of a shallow coral reef with a height of 20 m and analyzed the seismic amplification effect of the reef sites. Their results showed that the peak accelerations at the coral sand site tend to increase with elevation and are particularly strong in the lime-sand island and harbor basin regions. The ground surface acceleration response spectra are significant for periods less than 0.7 s, and the ground motion durations are closely related to the characteristics of seismic bedrock motions and the topographical and geomorphic characteristics of the coral island.
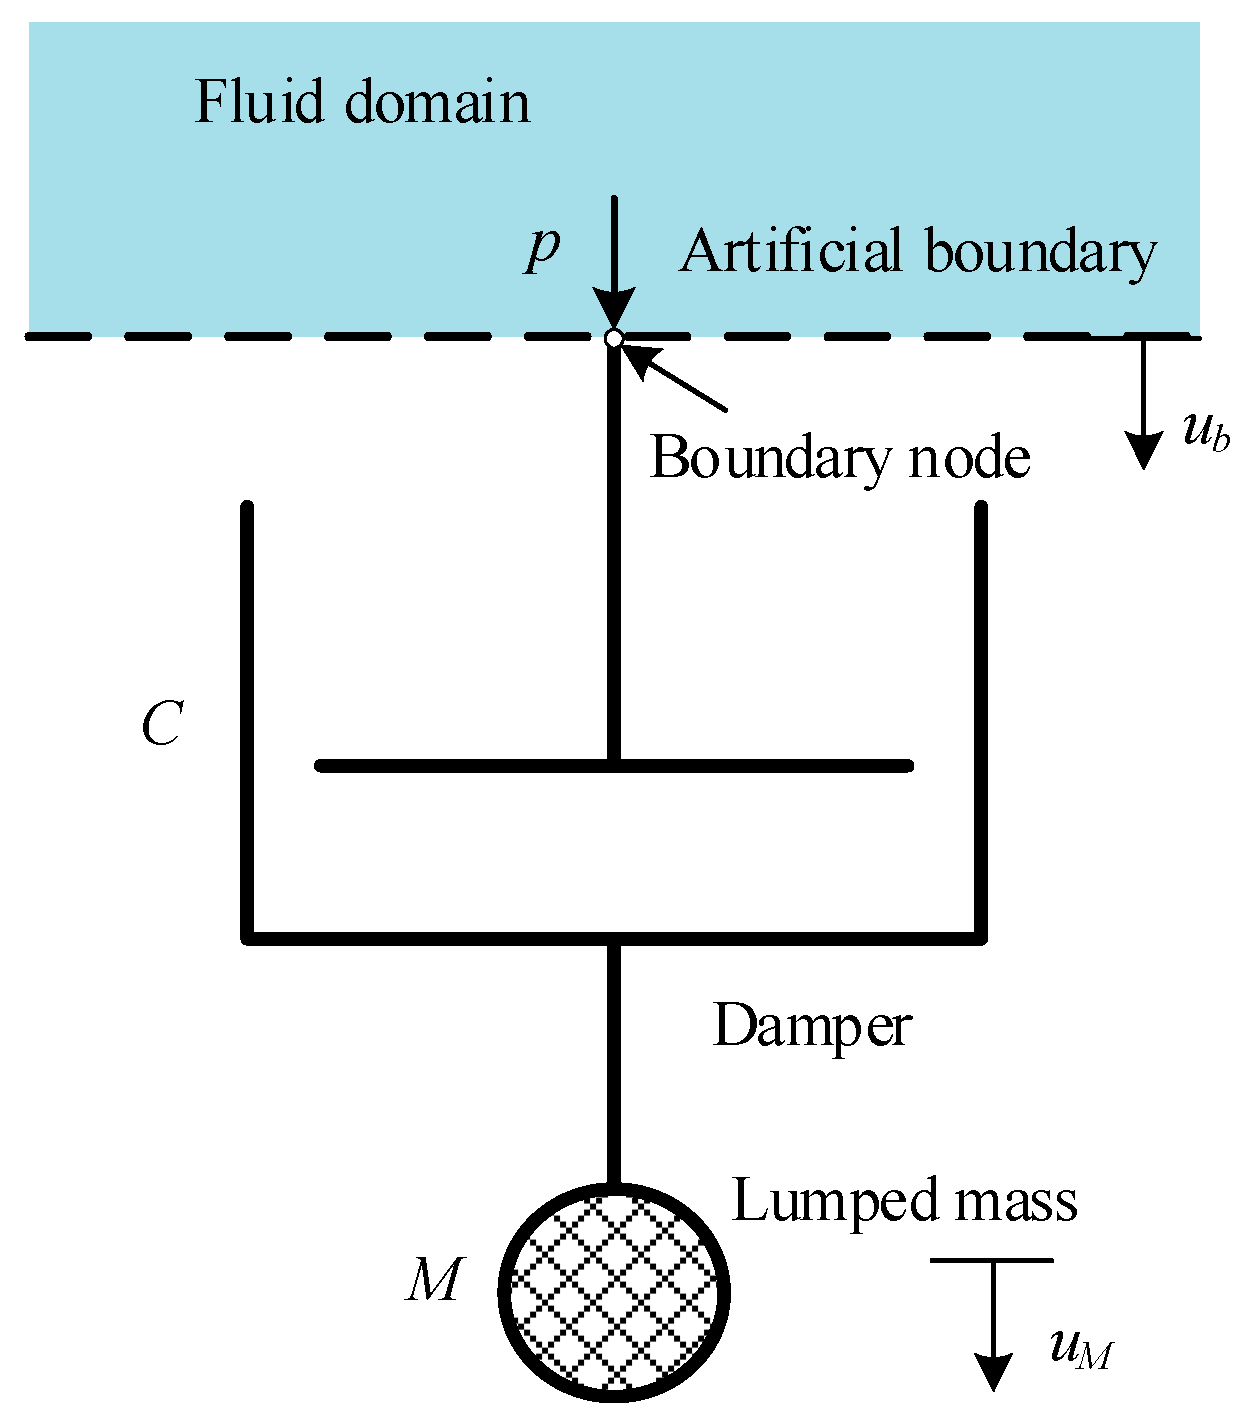
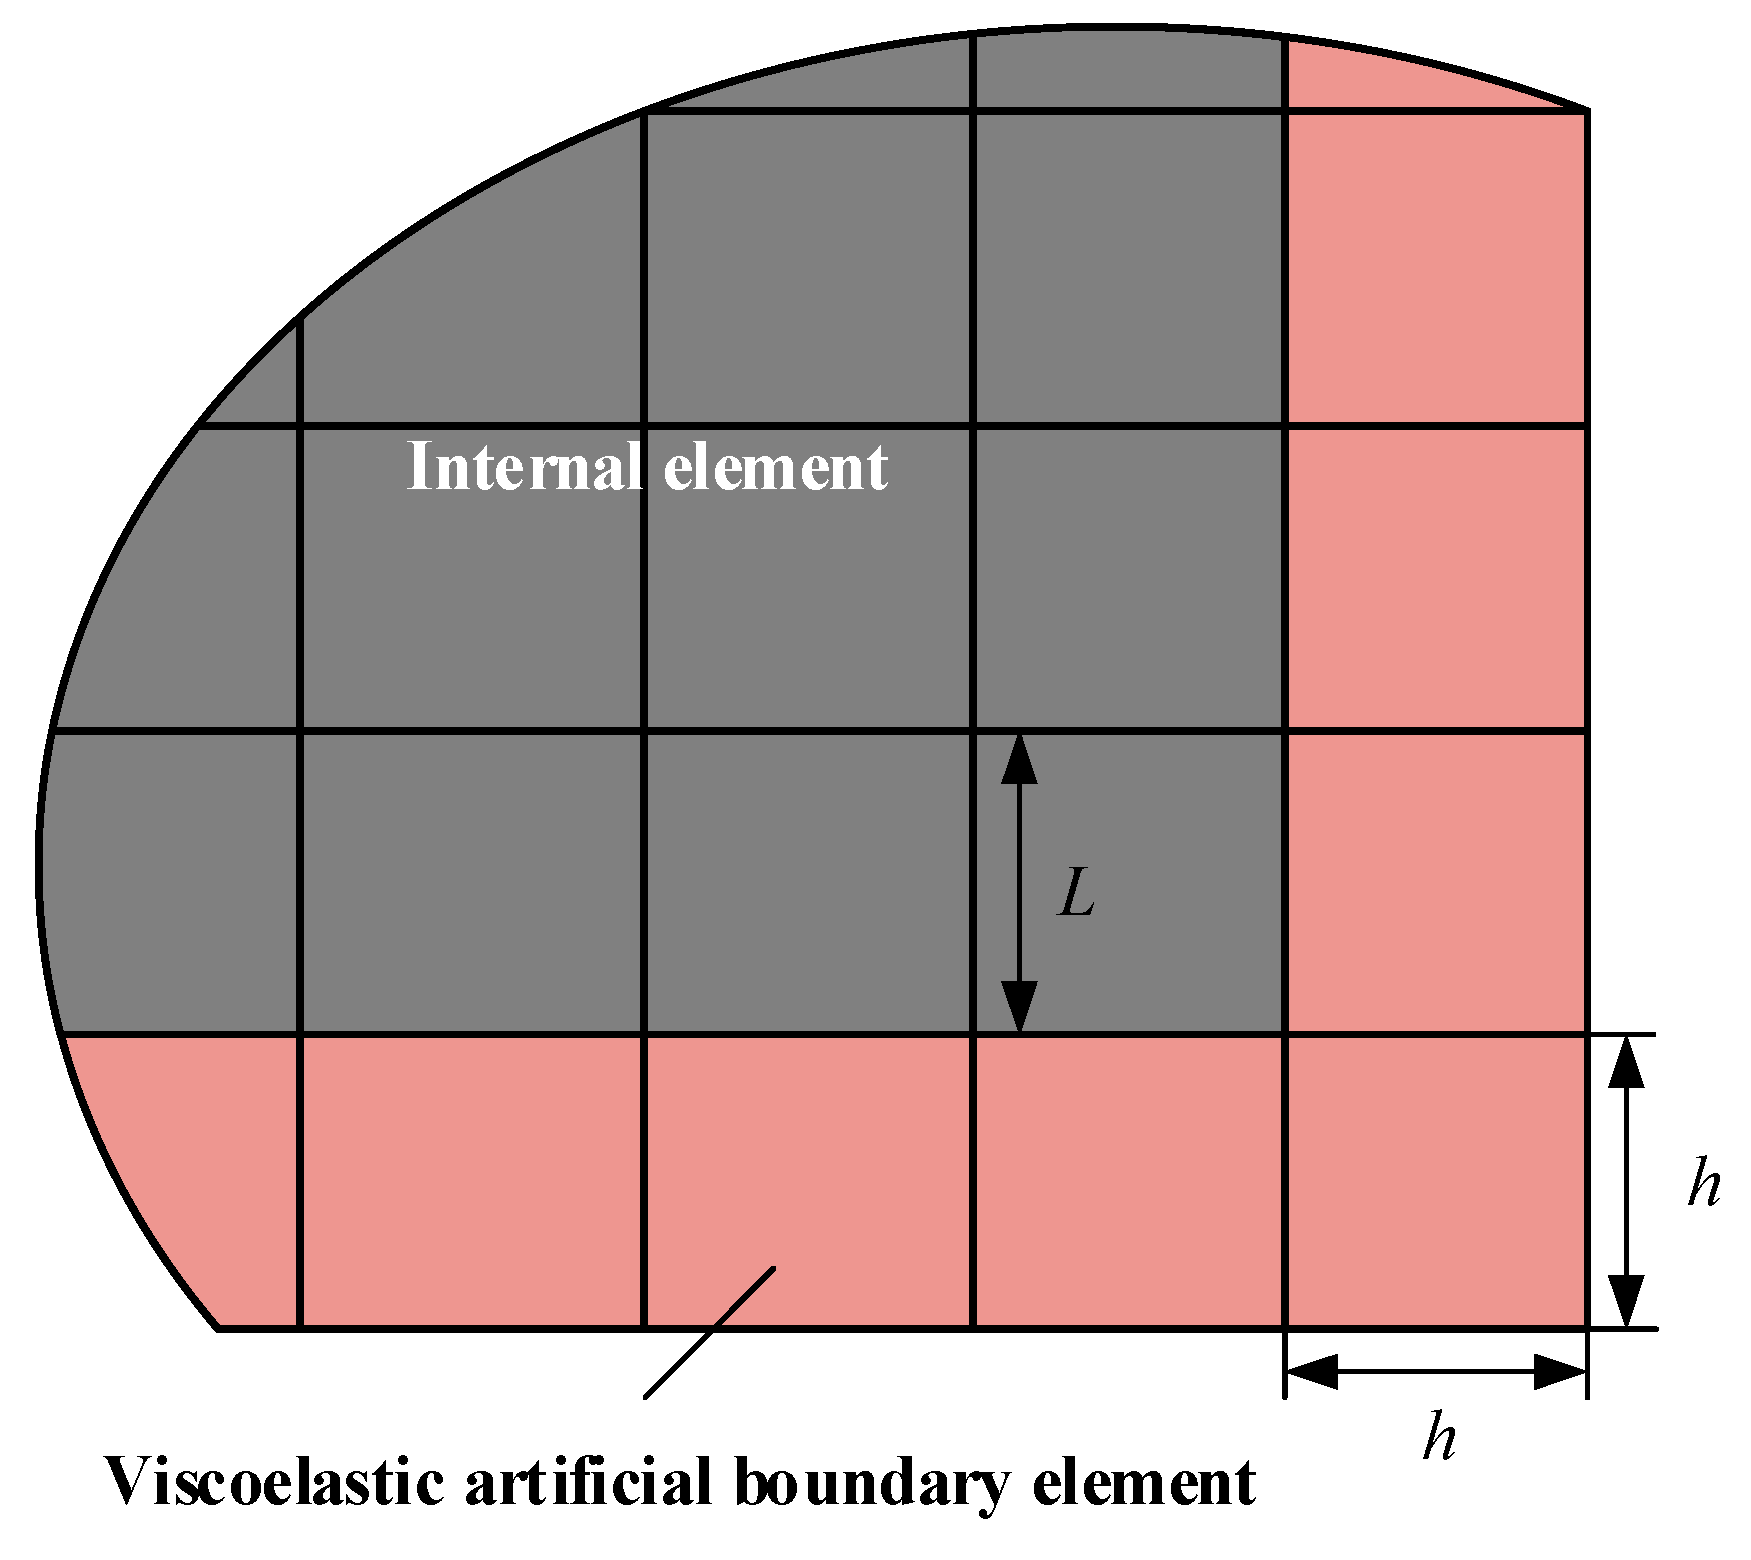
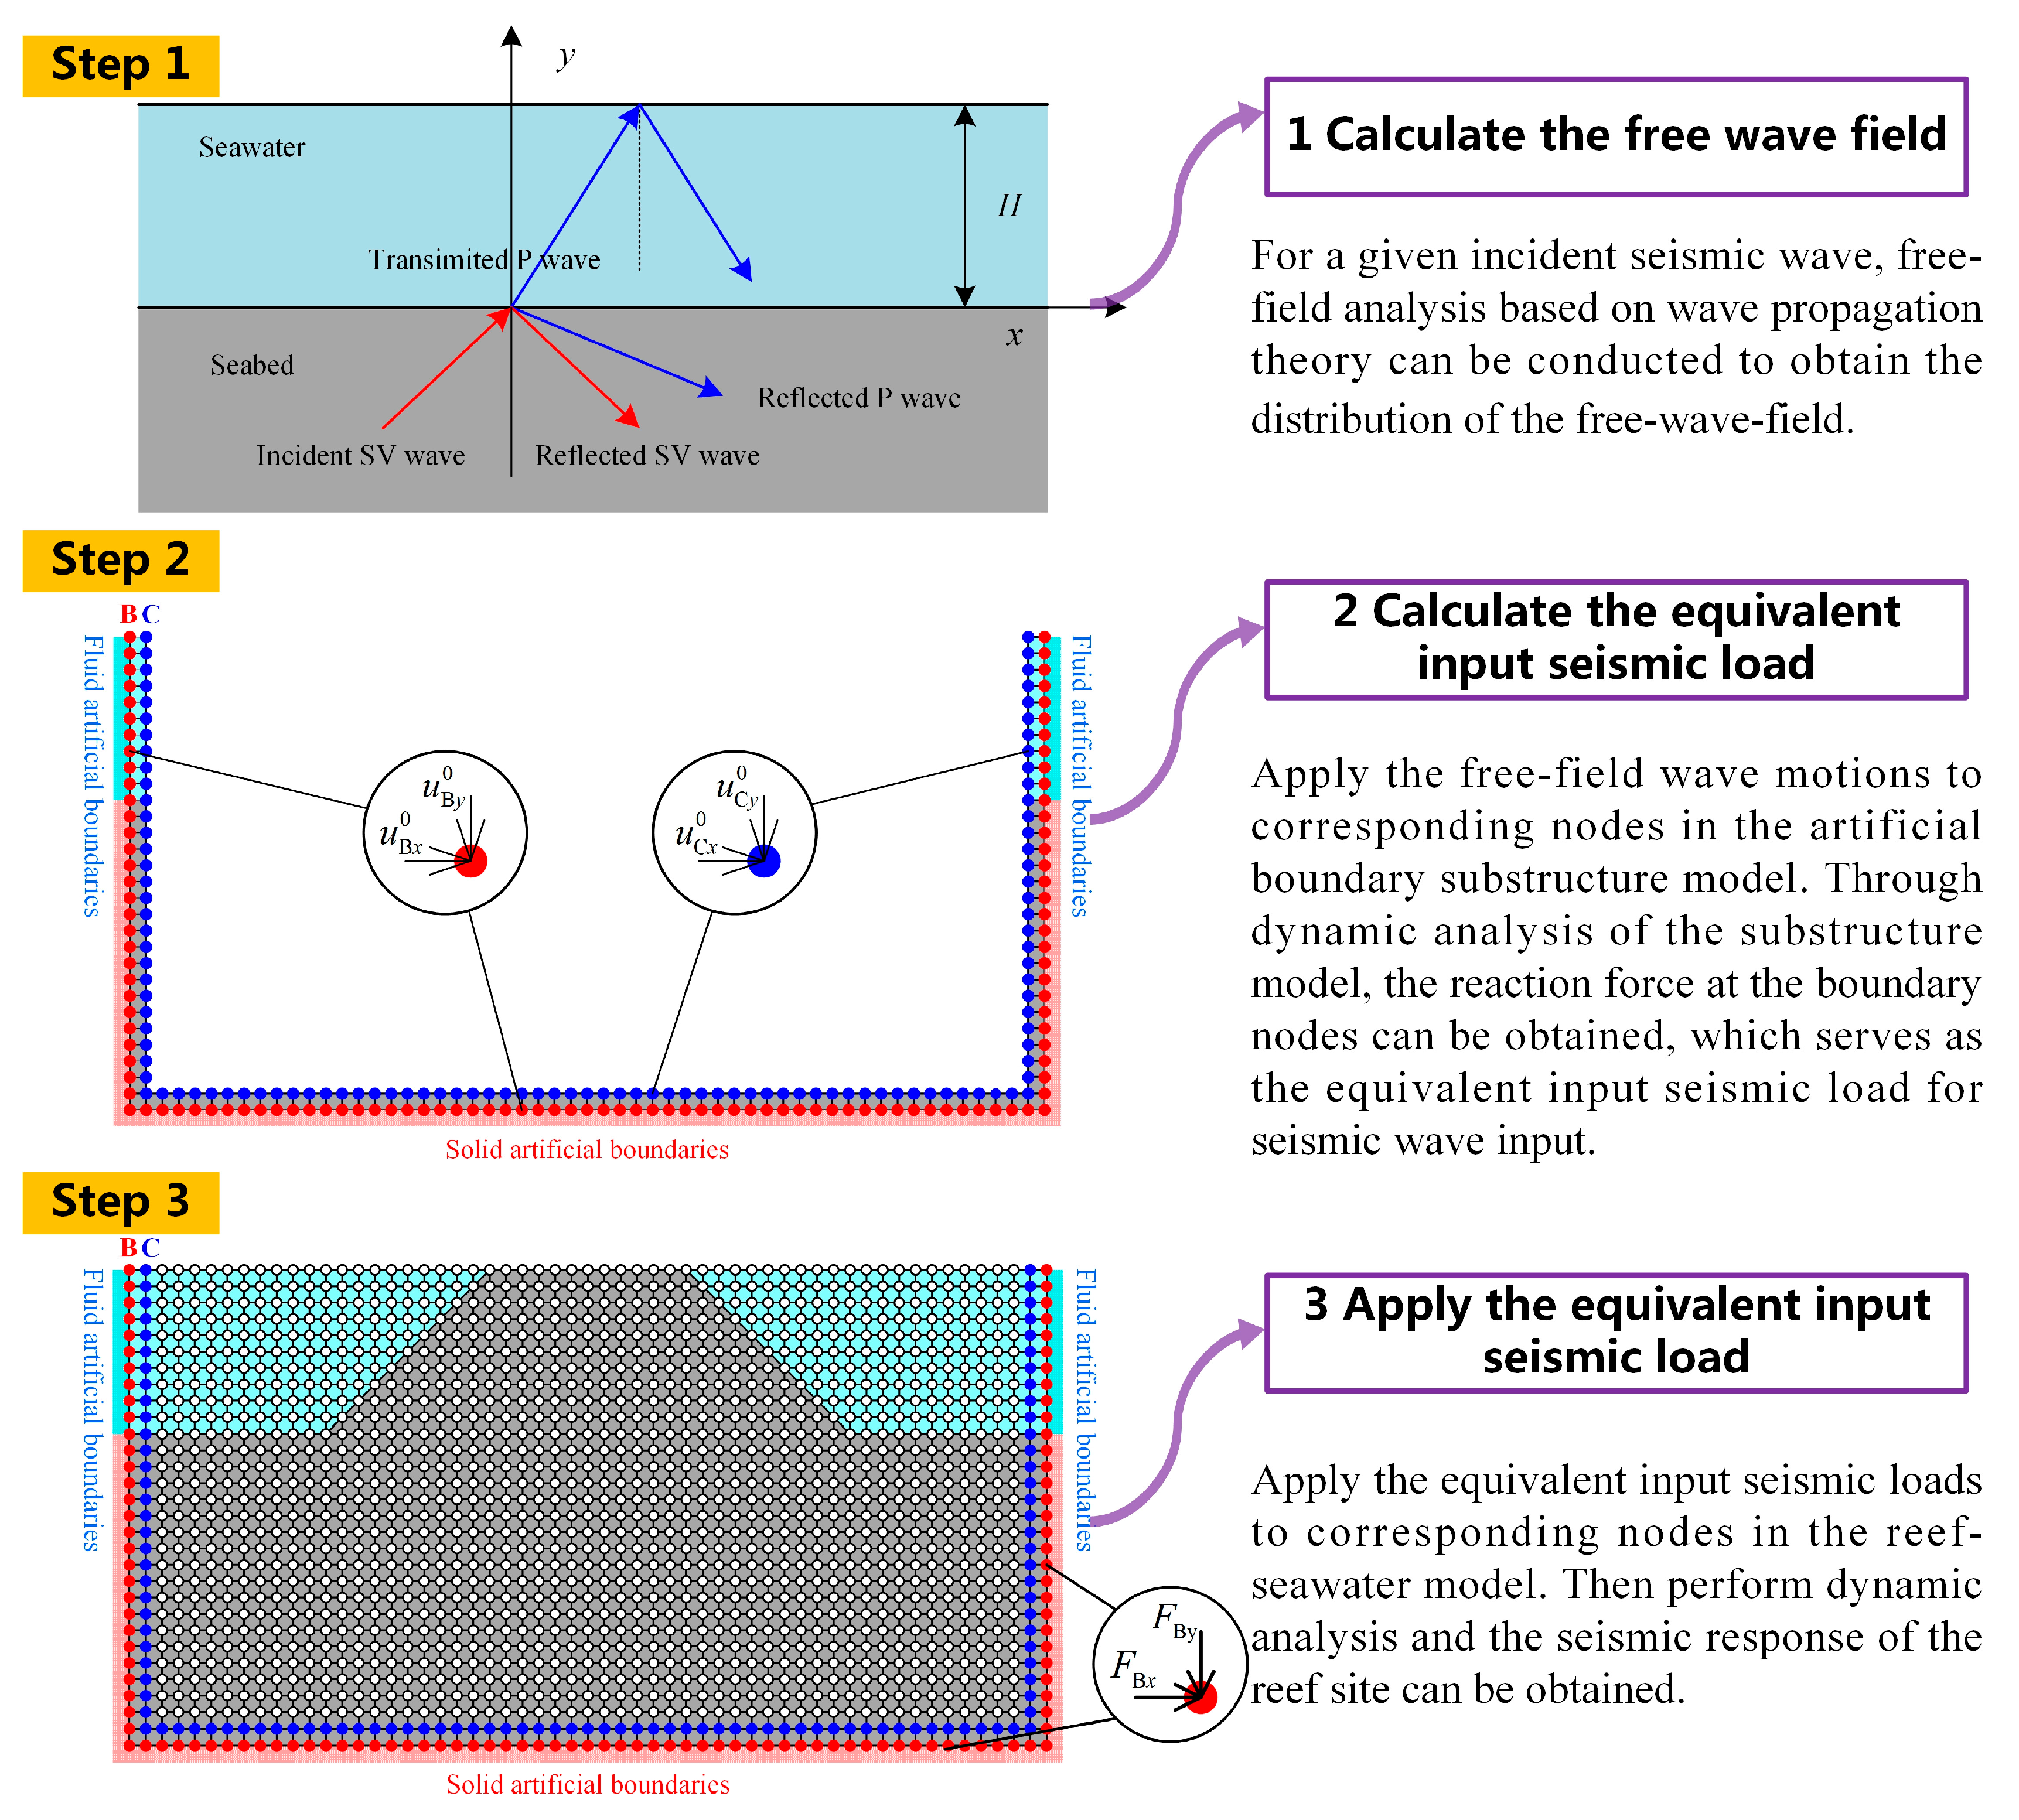
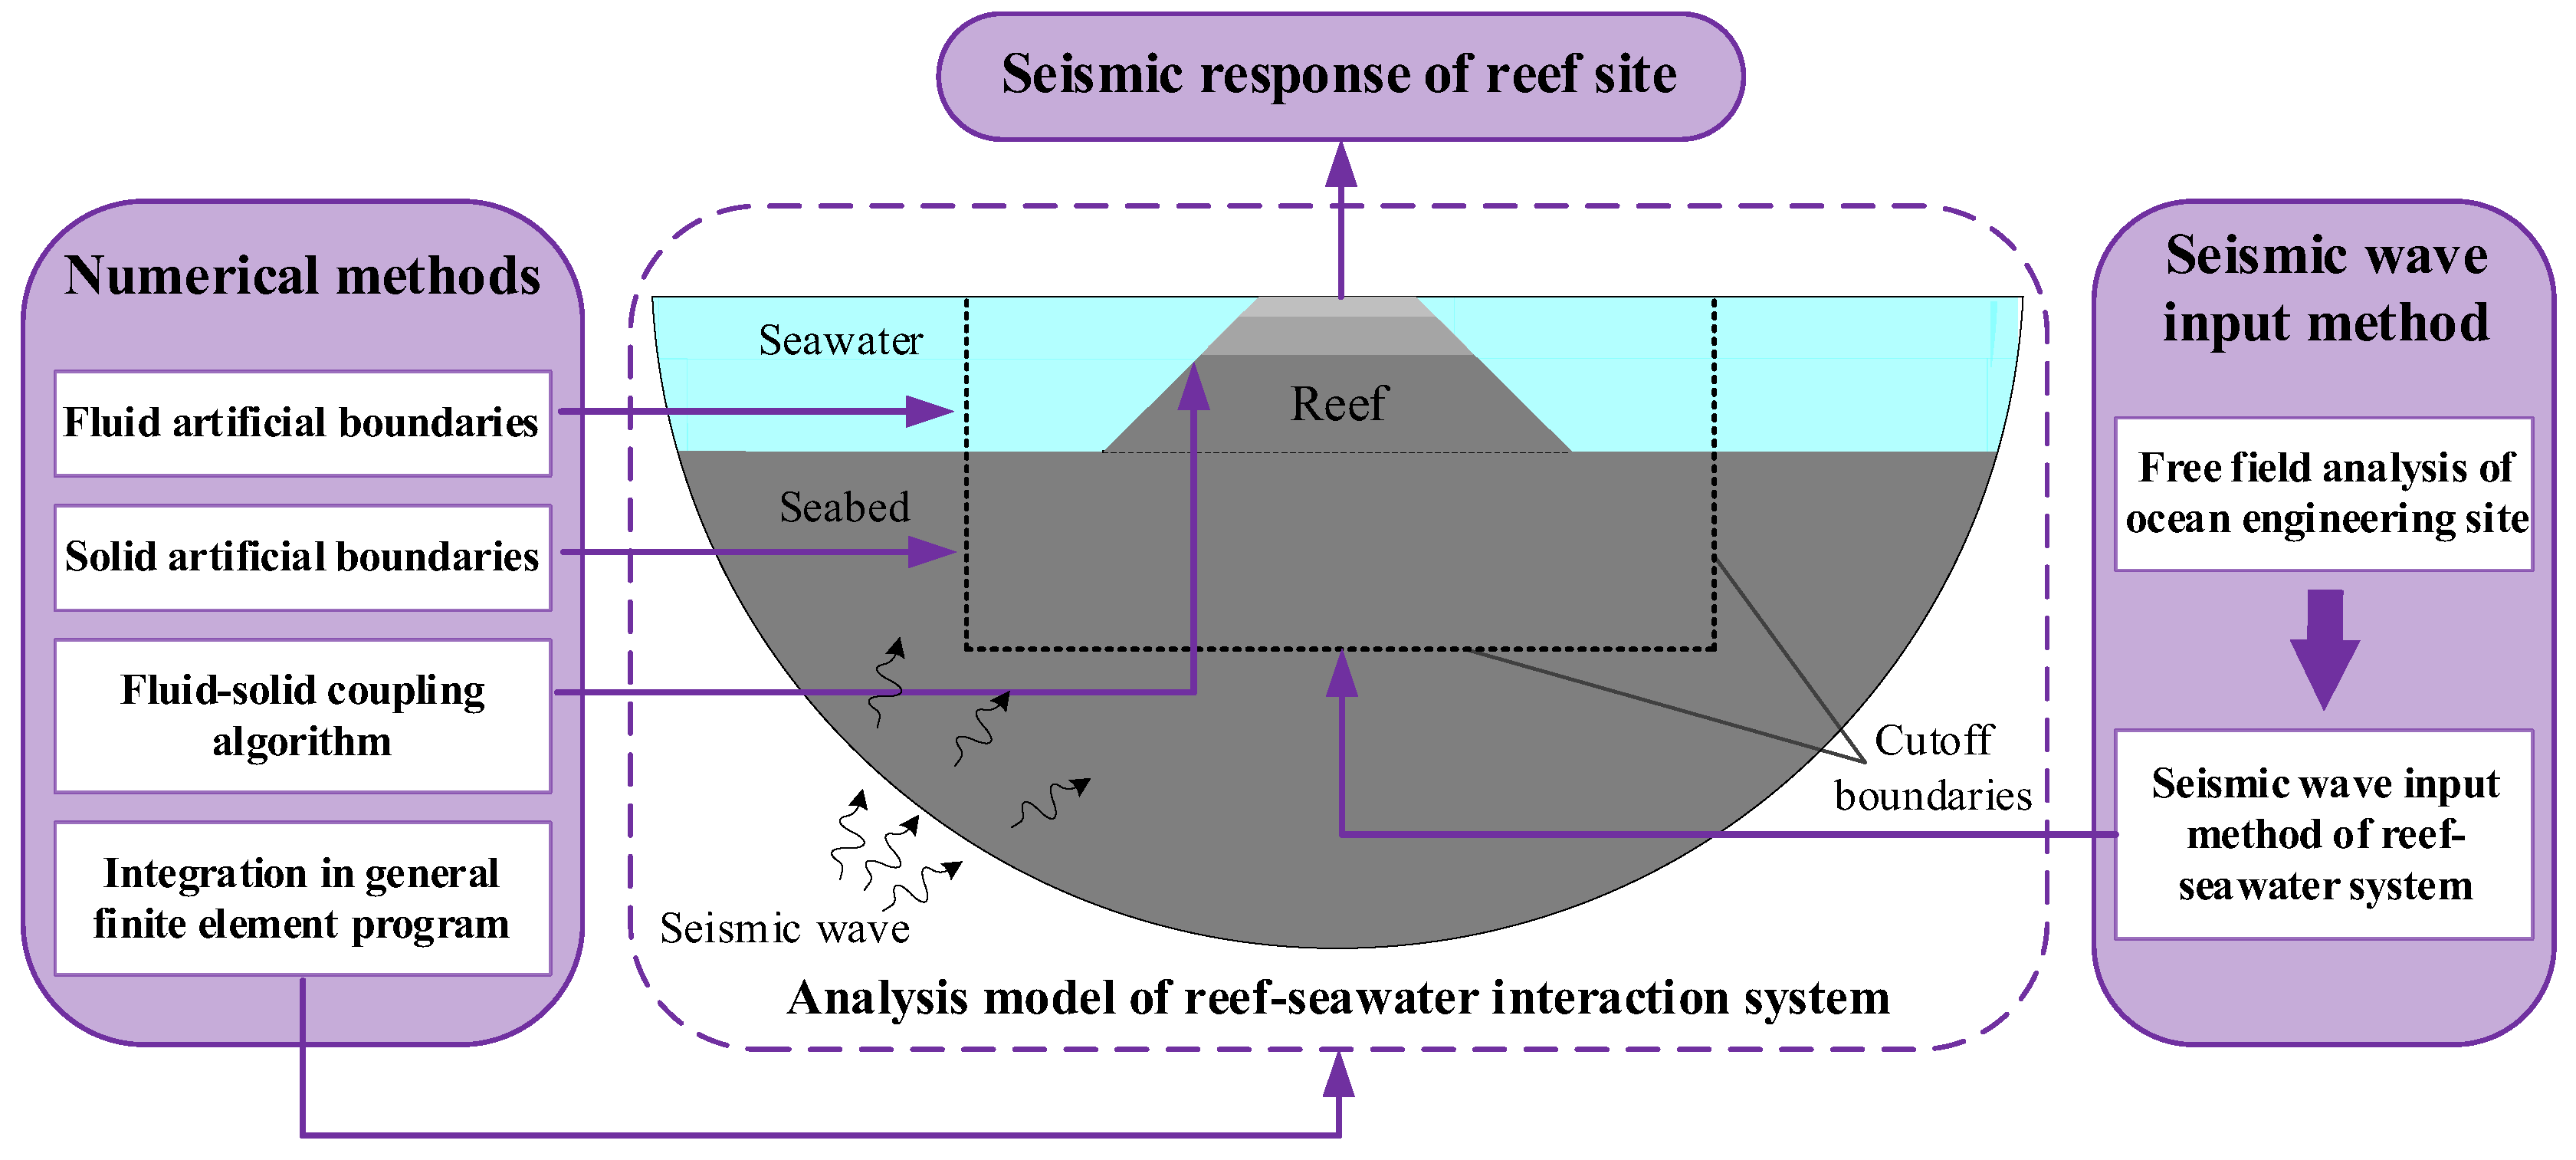
In order to comprehensively consider the dynamic coupling effect of seawater, the deep-sea topography of the reef, and the far-field wave radiation effect on the seismic response of the reef site, the author’s team employed the fluid-structure interaction algorithm to simulate the interaction between the reef and seawater [
19]. They also developed a spatially decoupled artificial boundary for the fluid medium [
20] and proposed a boundary substructure method (BSM) for seismic wave input [
21], enabling the input of seismic P and SV waves into the reef-seawater system at different angles. All these methods were then integrated into general finite element software to establish a dynamic interaction model of a two- or three-dimensional reef-seawater system [
22,
23].
Although the seismic response analysis method for reef sites has gradually been reported, the complex terrain and topography of the reefs in the South China Sea, coupled with the significant variability in the material characteristics of the coral sand and reef limestone, make it difficult to conduct on-site surveys and obtain material samples. Consequently, the insufficiency of accumulated data on the reef terrain, geology, and material characteristics impedes the thorough depiction of the terrain and geological features of the reefs, which are fundamental factors in analyzing the seismic response of reef engineering sites and assessing their seismic safety.
One feasible solution to address the aforementioned issue is to conduct sensitivity analyses [
24] or parameter analyses to identify the key parameters and evaluate their influence on the seismic response of reef sites. The present study formulated a seismic response analysis model for the reef-seawater system, in which the fluid-solid interaction effect, the wave radiation effect of the infinite seawater layer and the semi-infinite seabed, as well as the seismic wave input process of the reef-seawater system, are comprehensively taken into account. Through targeted parameter analyses, the impact of various factors on the seismic response of reef sites is meticulously investigated, including the shear wave velocity, thickness, and slope of distinct reef layers, the width of the reef flat, and the dynamic coupling effect of seawater. Ultimately, the study seeks to provide valuable insights into the seismic response characteristics of reef sites and the seismic safety evaluation of artificial islands and reef engineering.
3. Topographic and Geological Parameters of the Reef-Seawater Model
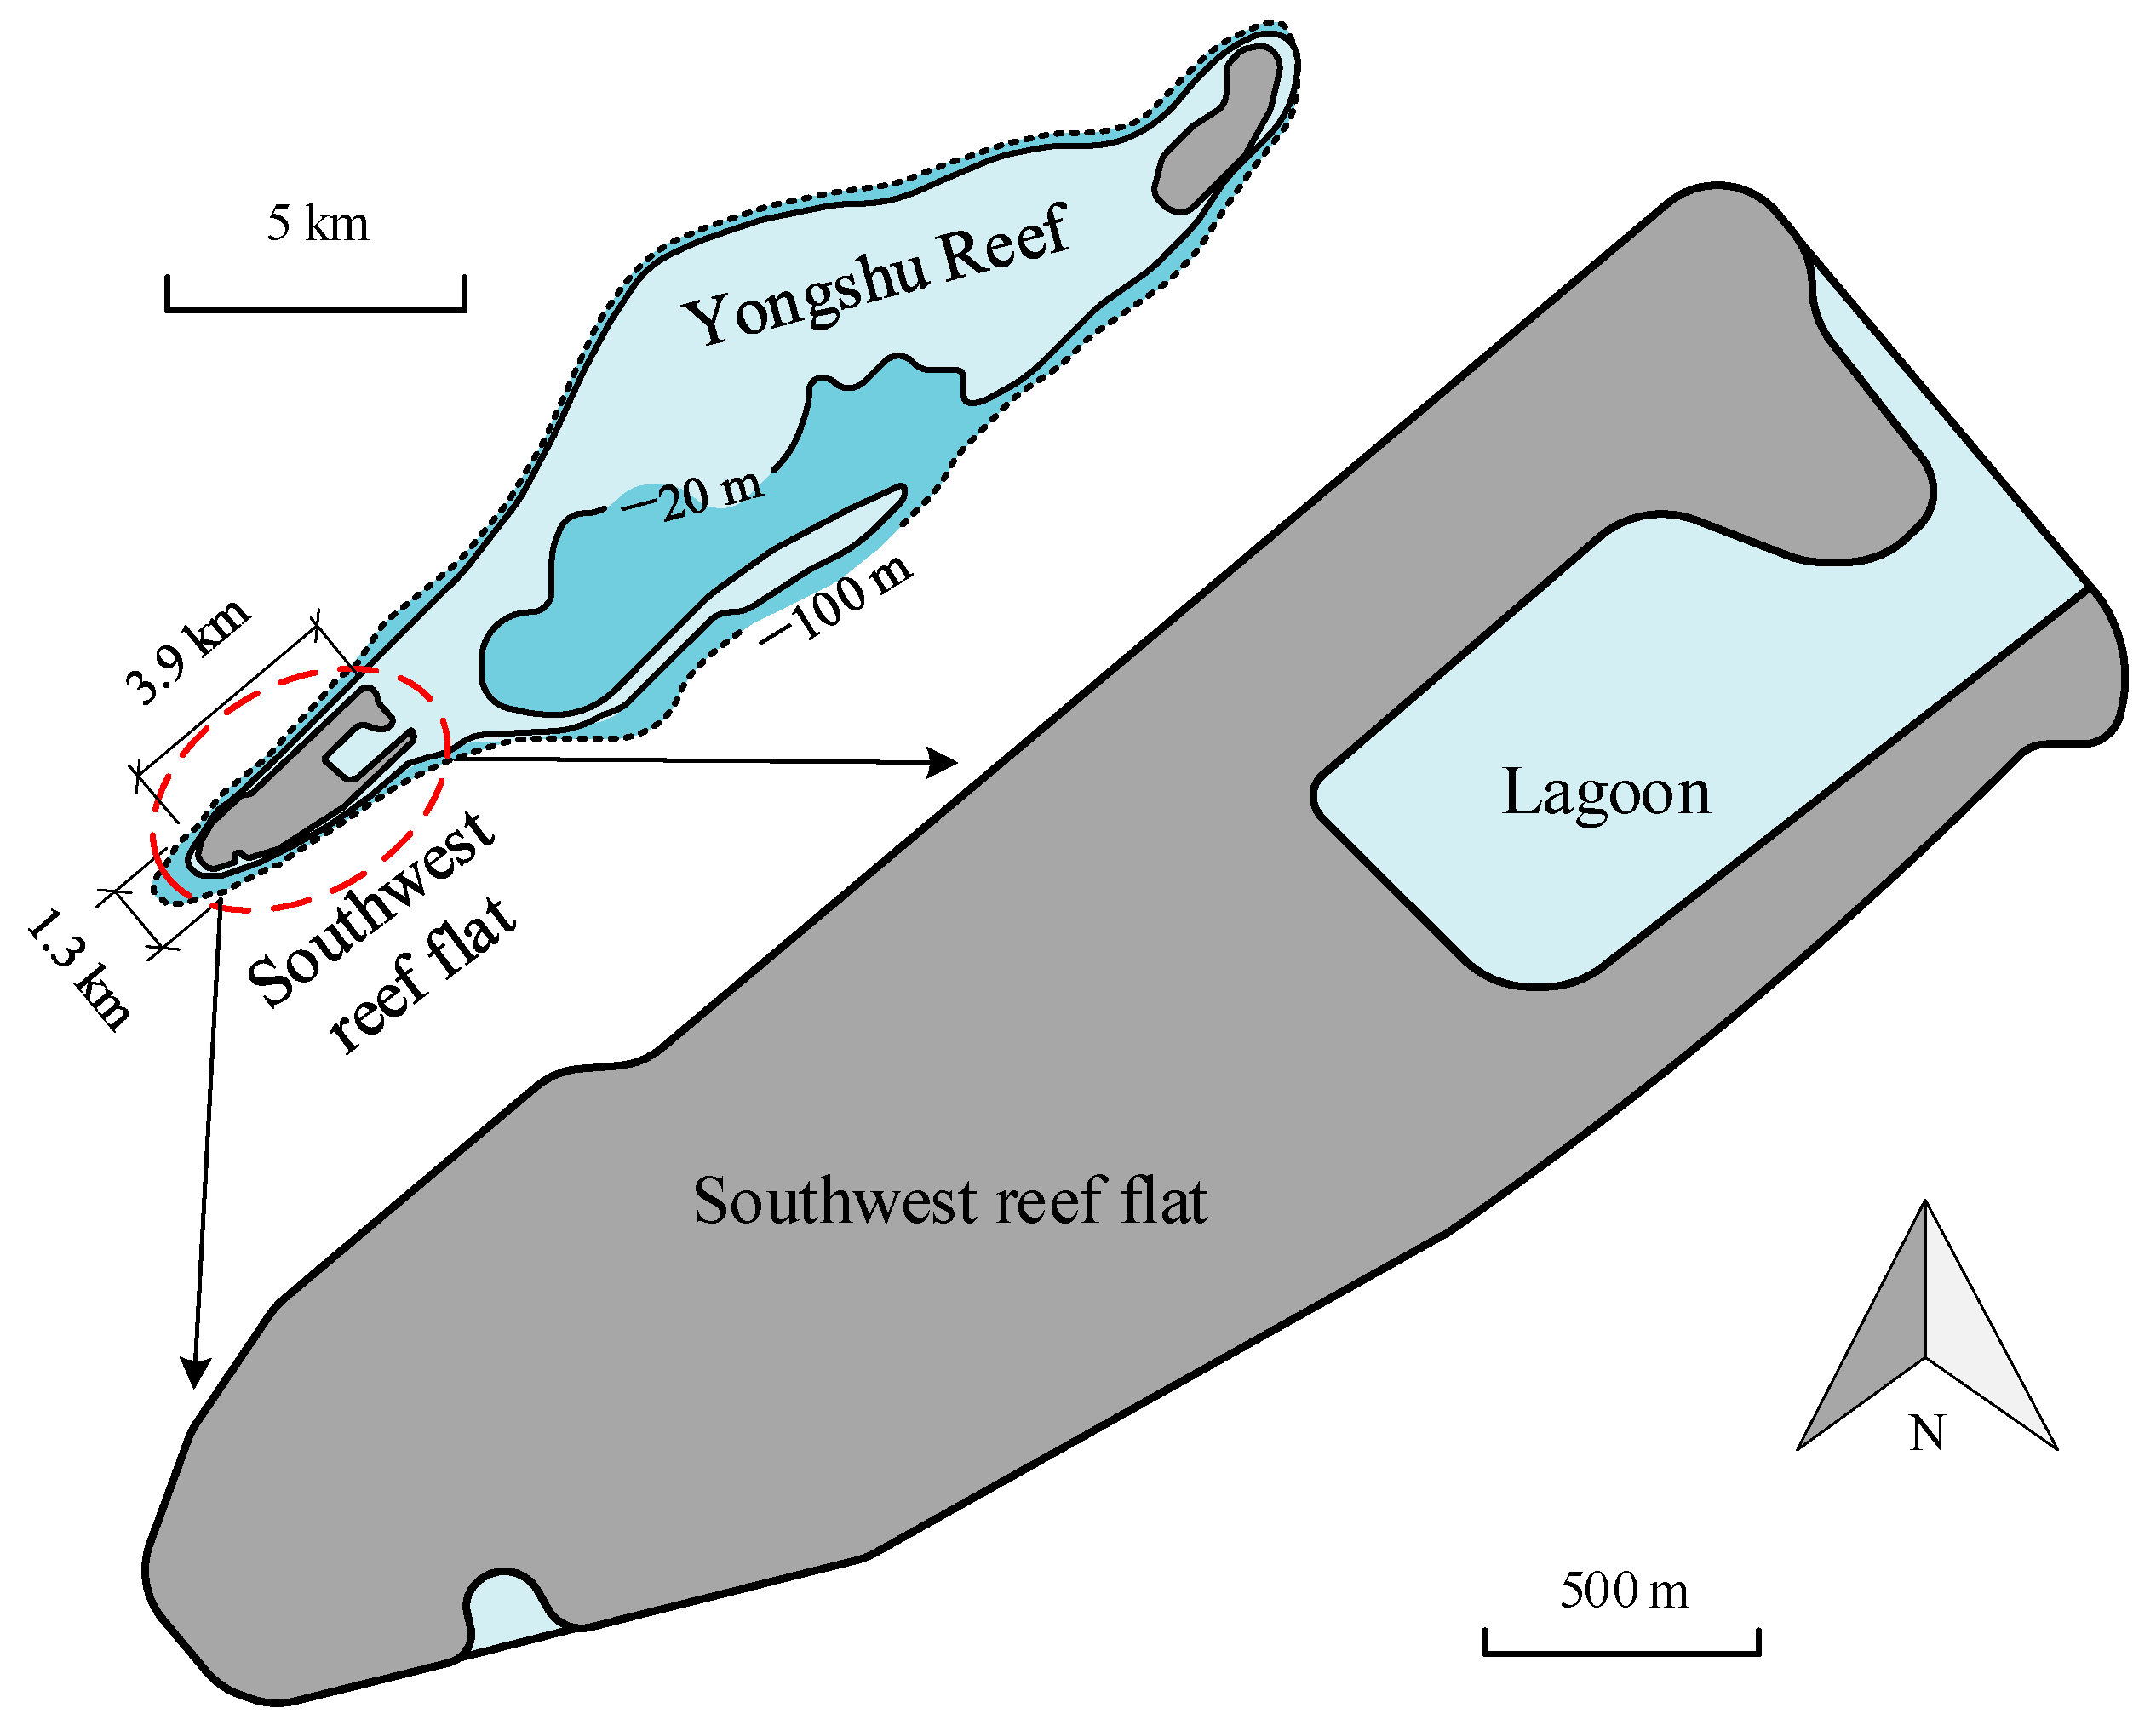
Figure 5 depicts a schematic diagram of the Yongshu Reef, which exhibits a narrow spindle shape [
2]. The reef construction is mainly concentrated on the southwestern flat, which is 3.9 km in length and nearly 1.3 km in maximum width. The reef is characterized by a mountain-shaped structure, with the average slope gradient of the offshore slope ranging between 20° and 30°, within the range of 0–800 m beneath the sea level. The upper slope, particularly within 20 m, is much steeper, with slope gradients ranging from 45° to 60° and even reaching up to 90° in some parts [
31]. Given the large geometric scale of Yongshu Reef and the fact that the length of the long axis is much greater than that of the short axis, the stress state of the reef body is approximately in a plane strain state when subjected to seismic loads vibrating along the short axis direction. Therefore, typical two-dimensional cross-sections can be extracted along the short axis of the reef for modeling and analysis.
In recent years, there has been a growing need for the development and utilization of reef resources, prompting researchers to investigate the engineering characteristics of coral sand on reef sites [
32,
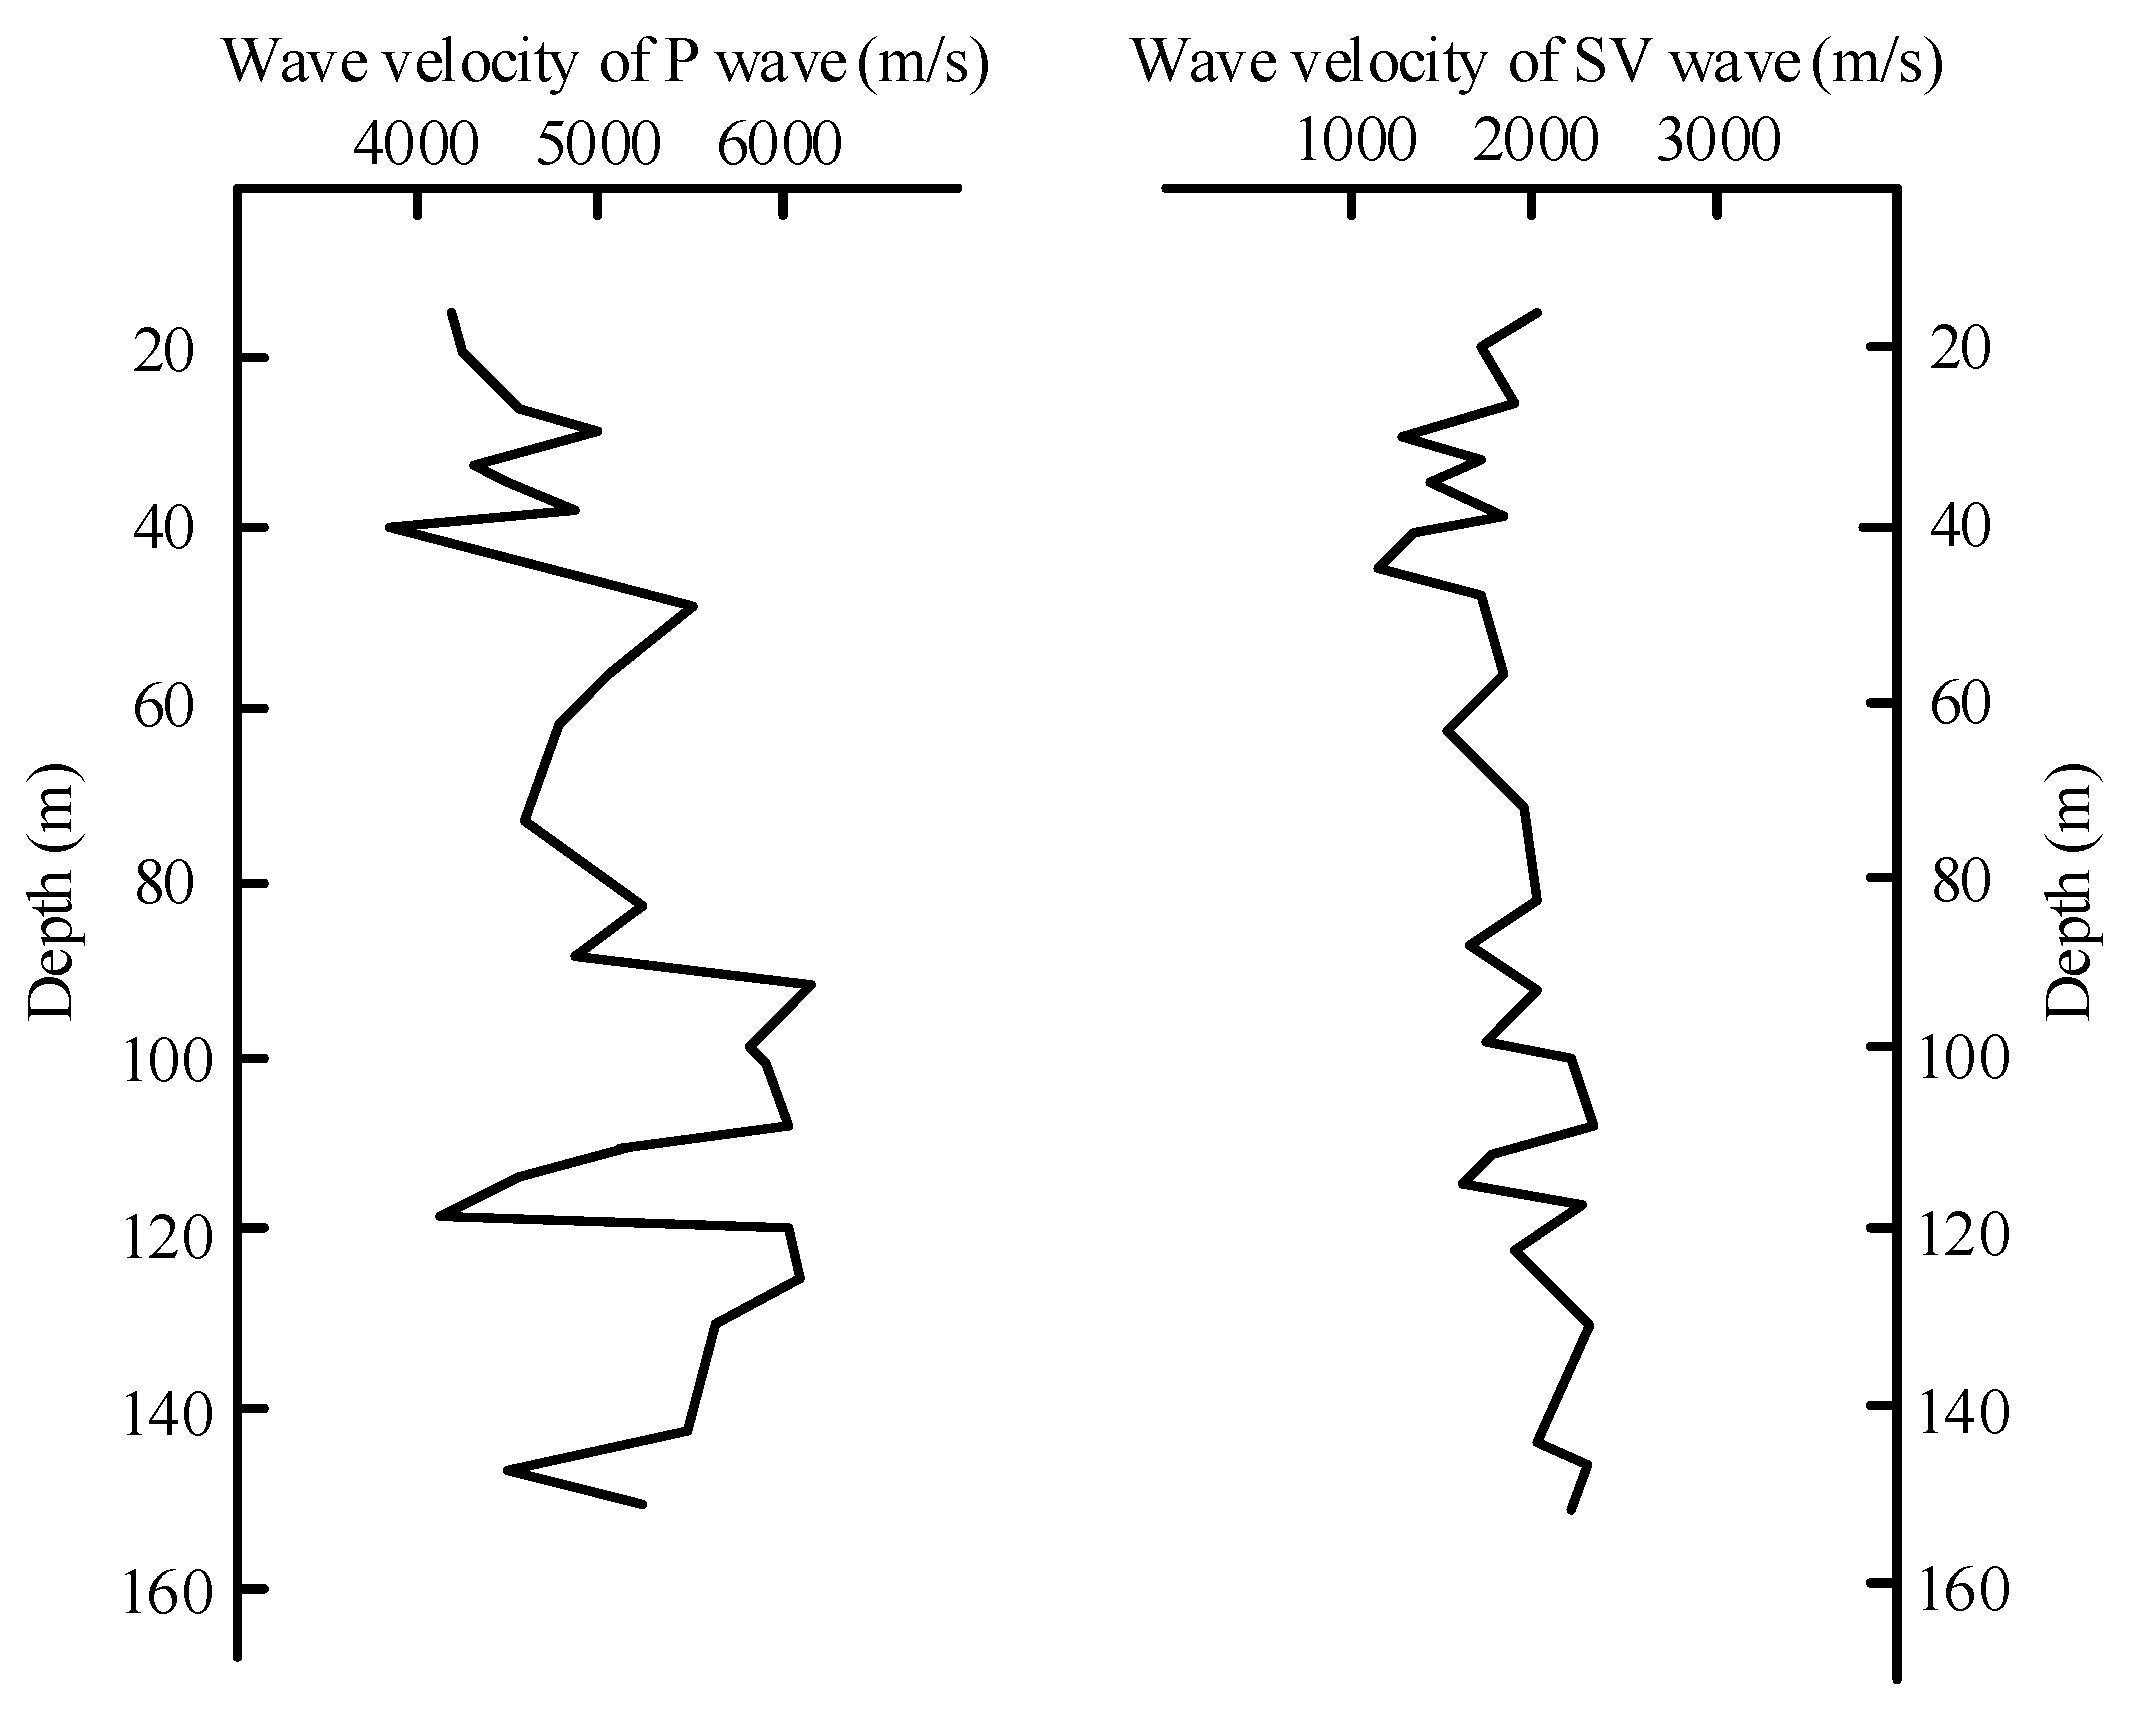
33]. However, the mechanical properties of reef limestone remain understudied due to the challenges of conducting on-site surveys and sampling. Currently, most of the available data on reef limestone are based on the 152-meter geological drilling conducted at Yongshu Reef in the 1990s [
34].
Figure 6 illustrates the variation of wave velocity with burial depth obtained from the drill core samples, which generally increases with depth but exhibits significant dispersion. Moreover, the complex environmental conditions such as ocean currents, tides, self-weight, and geothermal energy during the growth and development of coral reefs may lead to variations in the wave velocity distribution of reef limestone at different locations on the reef islands.
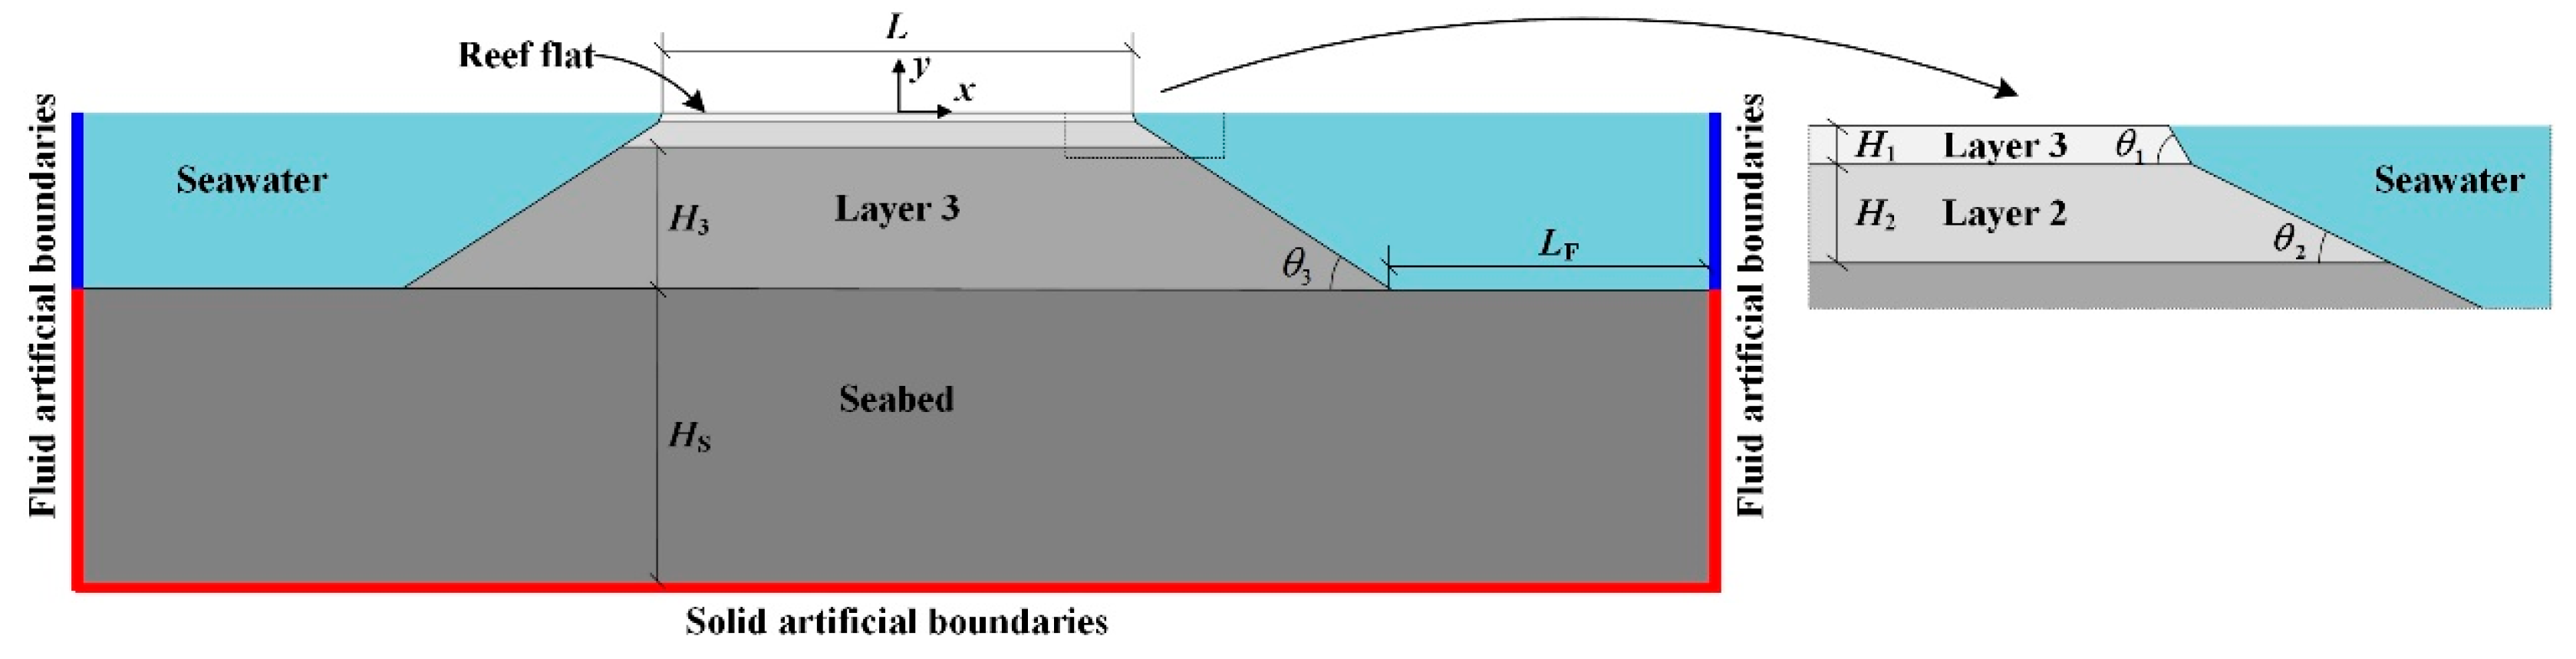
In general, publicly available literature on reef islands in the South China Sea lacks comprehensive information on their geometric and material features. To address this issue, this study first establishes a 2D layered seismic response analysis model of the reef-seawater system, utilizing the general finite element software ANSYS, as depicted in
Figure 7. The model incorporates the estimated geometry and material parameters presented in
Table 2. Using this model as a reference, this study investigates the effects of key morphology and material parameters of the reef site on its seismic response through parameter analyses.
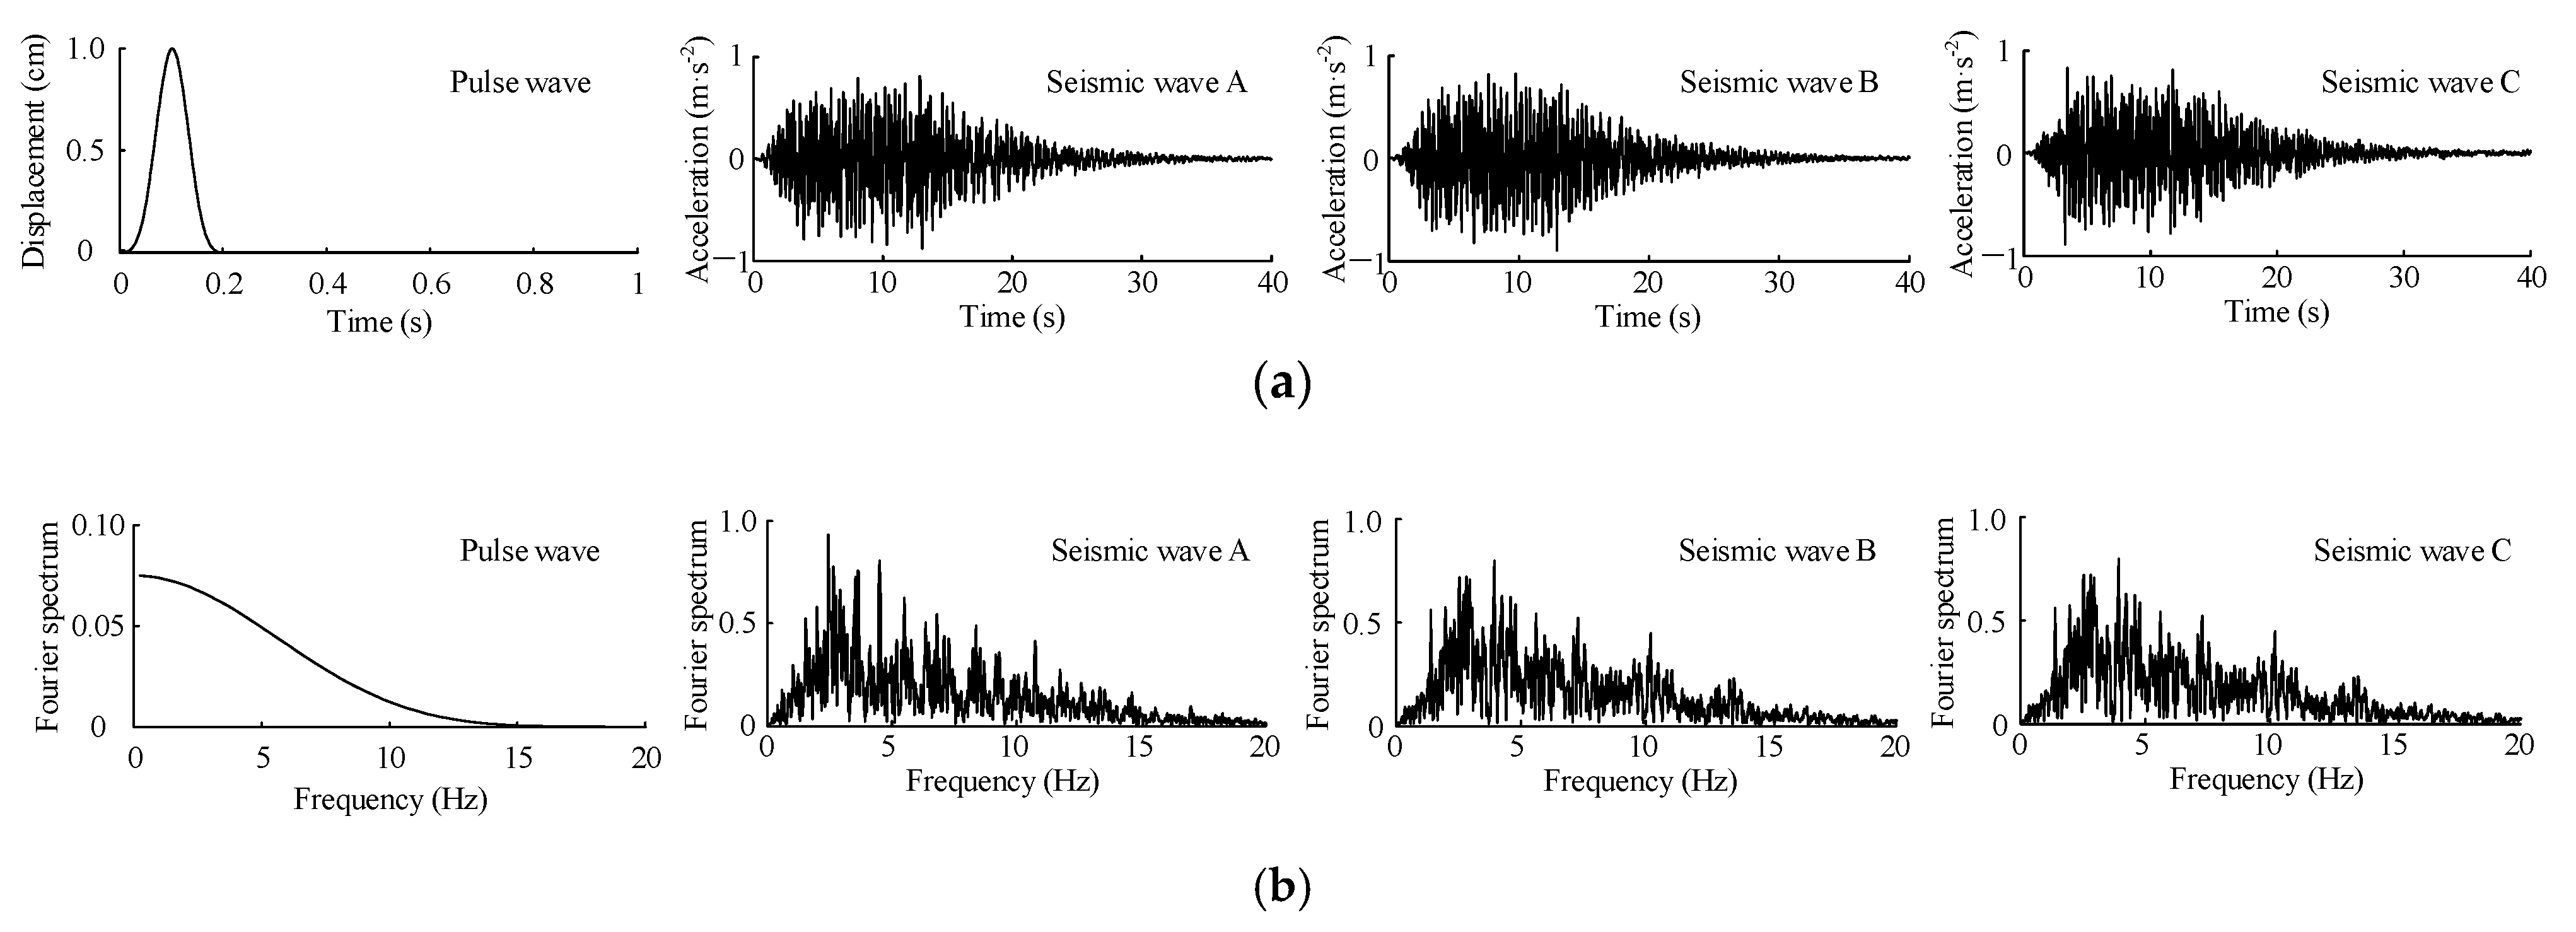
The analysis utilizes a pulse wave with a duration of 0.2 s as well as three artificial seismic waves obtained by Dr. Li and the team from the Institute of Geophysics, China Earthquake Administration. These seismic waves are tailored to match the acceleration response spectrum parameters of the South China Sea bedrock, as depicted in
Figure 8. The boundary substructure method introduced earlier is employed to introduce these seismic waves into the reef-seawater model.
4. Influence of Topographic and Material Features on the Seismic Response of the Reef Site
According to a previous study [
21], the seismic amplification effect on the island reef site is most pronounced when the waves are vertically incident, which is considered the most unfavorable load case for the seismic response of the reef site. Moreover, since the peak ground acceleration (PGA) of seismic ground motion is a crucial parameter for seismic design and site seismic response evaluation, this study primarily concentrates on the acceleration seismic response of reef sites under the vertically incident SV wave and investigates the impact of various factors.
4.1. Shear Wave Velocity of the Top Reef Layer
In this section, we explore the impact of the shear wave velocity of the topmost reef layer
vs1 on the seismic response of the reef site. The shear wave velocity of reef layer one
vs1 is varied between 300 m/s, 400 m/s, 500 m/s, 600 m/s, and 700 m/s, while keeping the other model parameters in
Table 2 unchanged. The pulse wave and three artificial seismic waves shown in
Figure 8 are then vertically input into the finite element model of the reef-seawater system for analysis.
To evaluate the seismic amplification effect of the reef sites, the peak acceleration ratio
Ra is defined with the seismic response of the elastic homogeneous half space as a basis:
where
a denotes horizontal acceleration; the variable
x is the horizontal coordinate of different locations on the reef flat;
t is the time; and the subscript 0 denotes the horizontal seismic response on the surface of a homogeneous half space under the same seismic SV wave incident vertically.
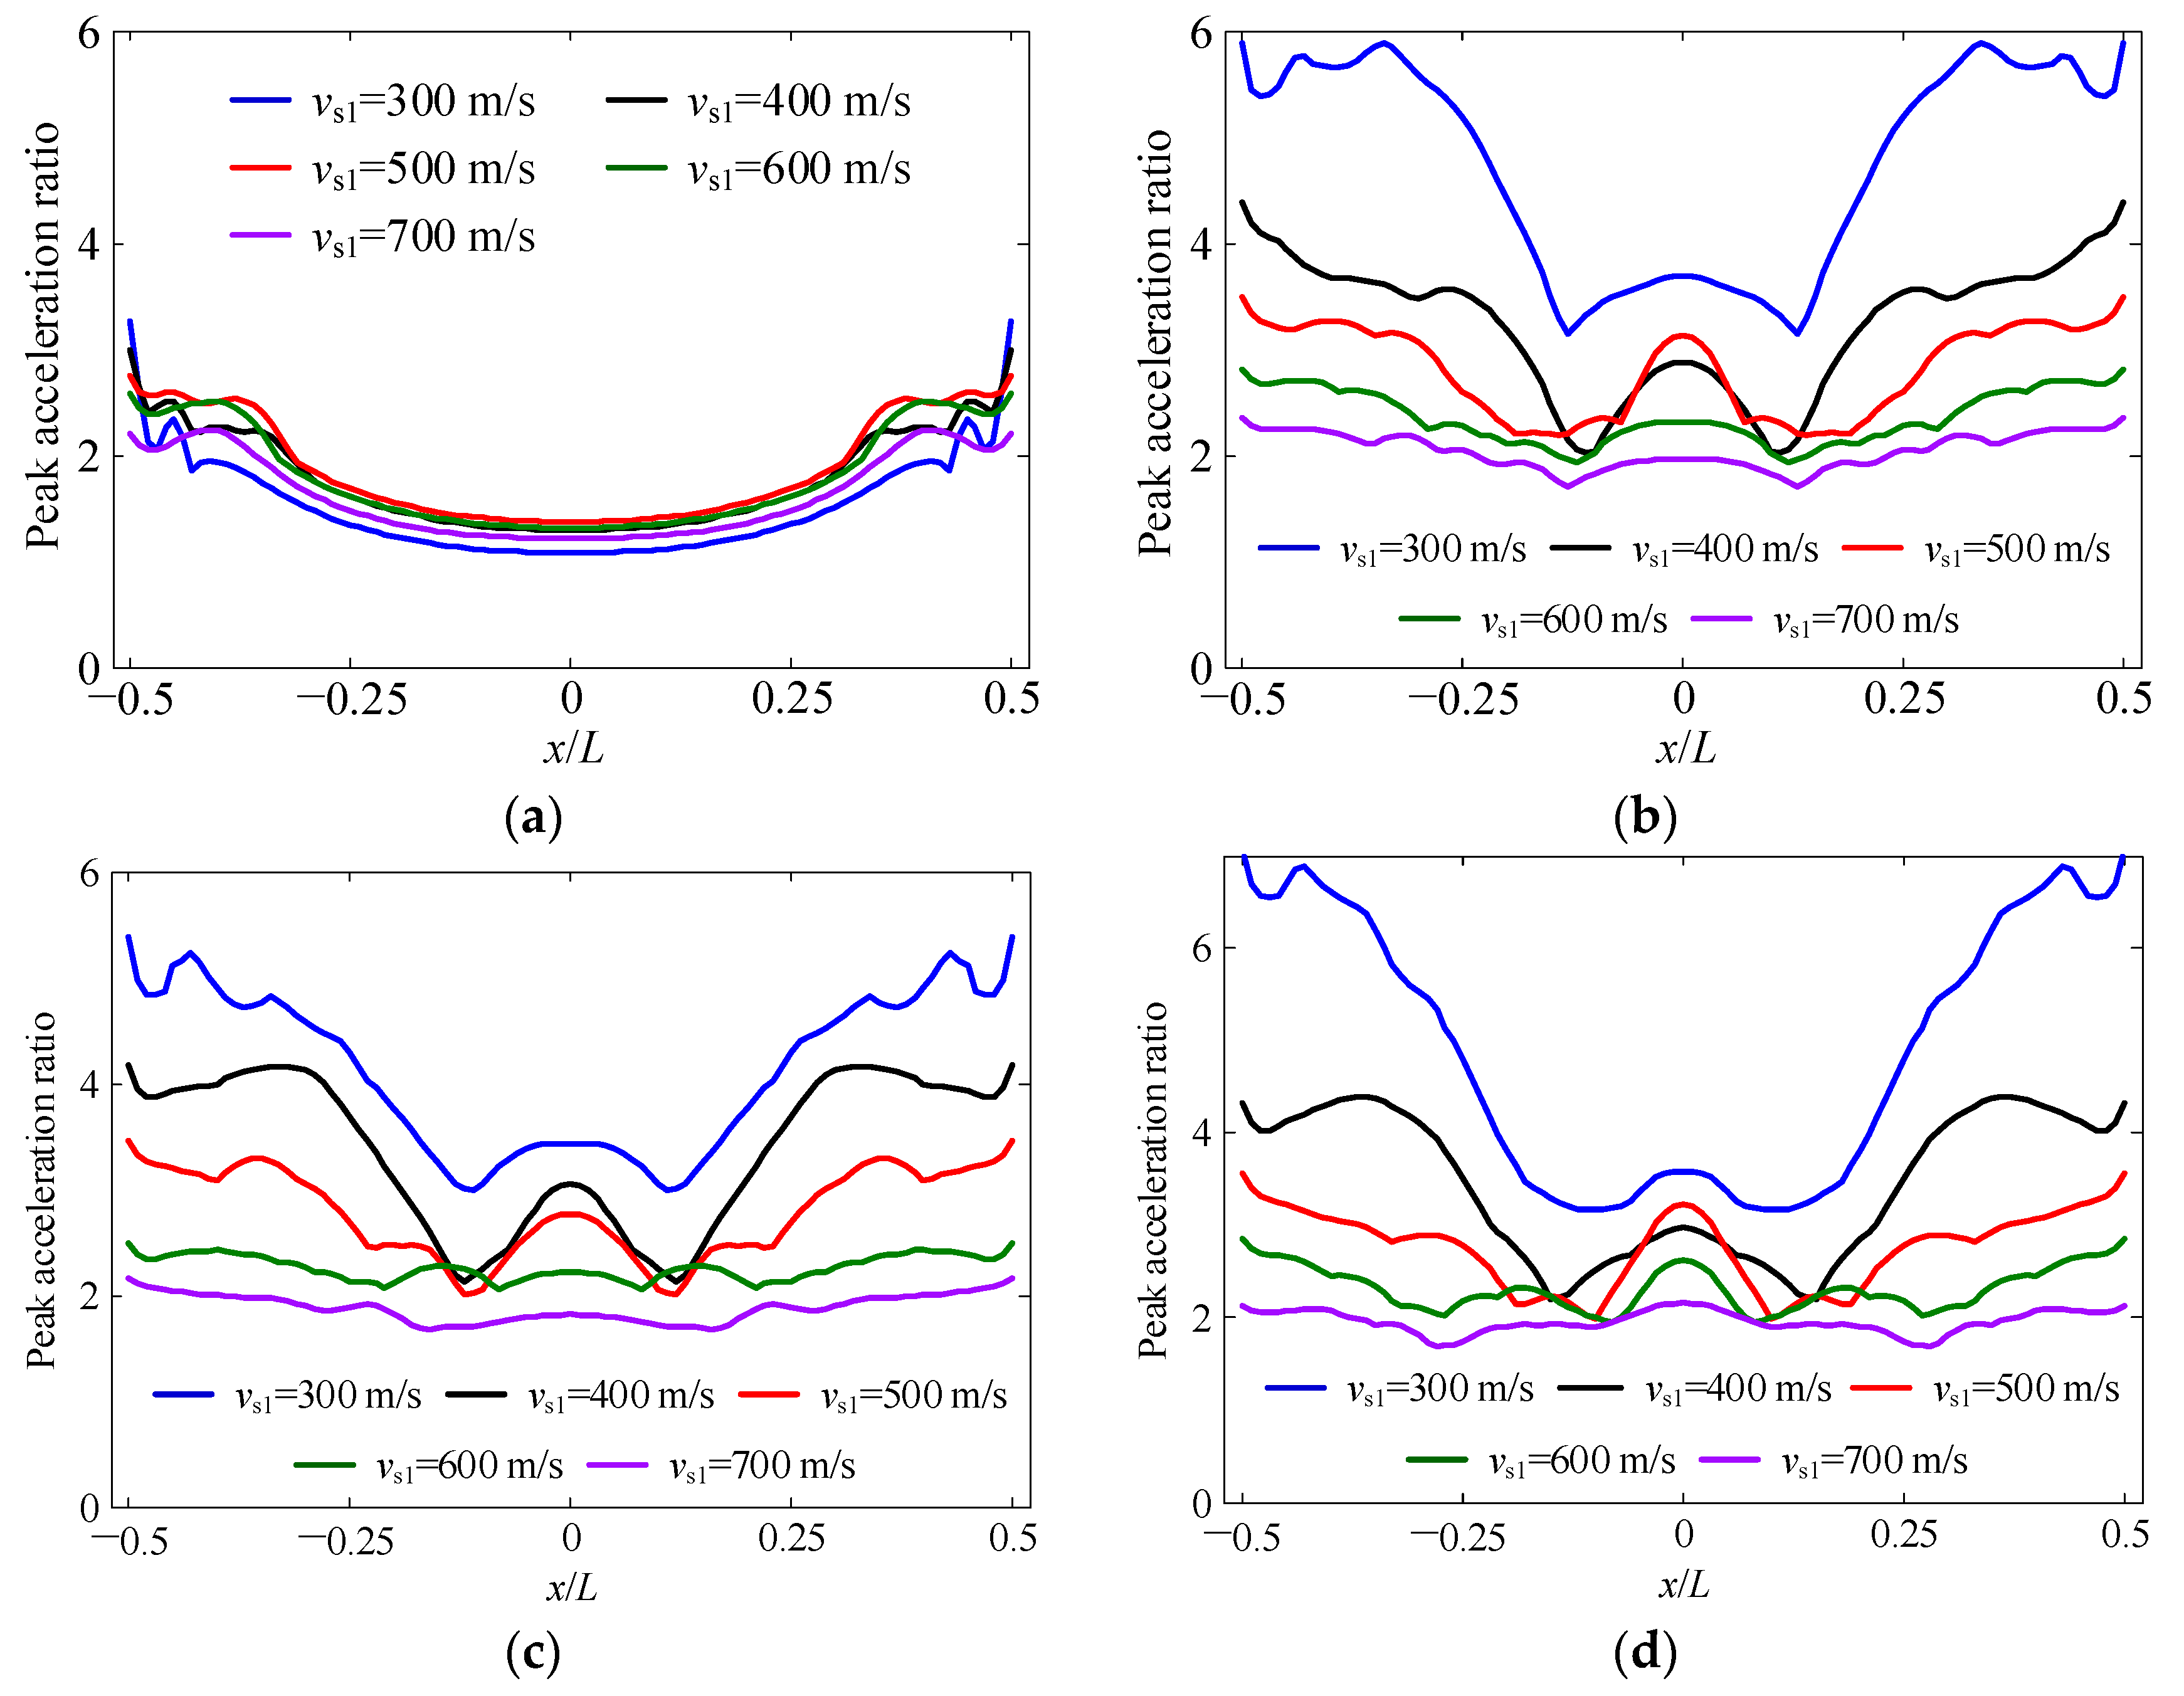
The spatial distributions of
Ra on the reef flat under different
vs1 are compared in
Figure 9.
Table 3 presents the mean values of
Ra along the reef flat calculated by different models.
The results presented in
Figure 9 and
Table 3 reveal that the influence of the shear wave velocity of the top reef layer on the spatial distribution of the horizontal acceleration response is limited under the incident pulse wave. As shear wave velocity increases, the average peak acceleration ratio first slightly increases and then decreases. However, when the reef site is subjected to artificial seismic waves, the acceleration response is significantly amplified with the decrease of the shear wave velocity of the topmost reef layer, and this trend is more pronounced in the region near the edge of the reef flat. For example, the average horizontal peak acceleration ratio on the reef flat can increase by 149% when the shear wave velocity of the top reef layer decreases from 700 m/s to 300 m/s under the incidence of artificial wave C. This significant increase in acceleration response poses a considerable risk to the safety of artificial islands and other constructions on the reef engineering site. Furthermore, the distribution of the peak acceleration ratio on the reef flat exhibits a similar tendency under the incidence of pulse and seismic waves. The peak seismic response in the central region of the reef flat is relatively diminutive, and progressively amplifies towards the edge of the reef flat. It is important to take this distribution pattern into account when designing and locating structures on a reef engineering site. Structures located closer to the edge of the reef flat may need to be designed and constructed with greater attention to seismic resistance.
To investigate the influence of different factors on the seismic response in the frequency domain, the acceleration Fourier spectrum ratio
Ha is defined as follows: The
Ha can help identify the frequency-dependent seismic response characteristics, and its value reflects the amplification and attenuation effects of the engineering site on different frequency components. Similarly, the site seismic response of the homogeneous half-space model is taken as a basis.
where
f is the frequency;
F(
x,
f) is the Fourier amplitude of the horizontal accelerations on the reef flat; and
F0(
f) is the Fourier amplitude of the acceleration response on the surface of the homogeneous half space under the same incident wave.
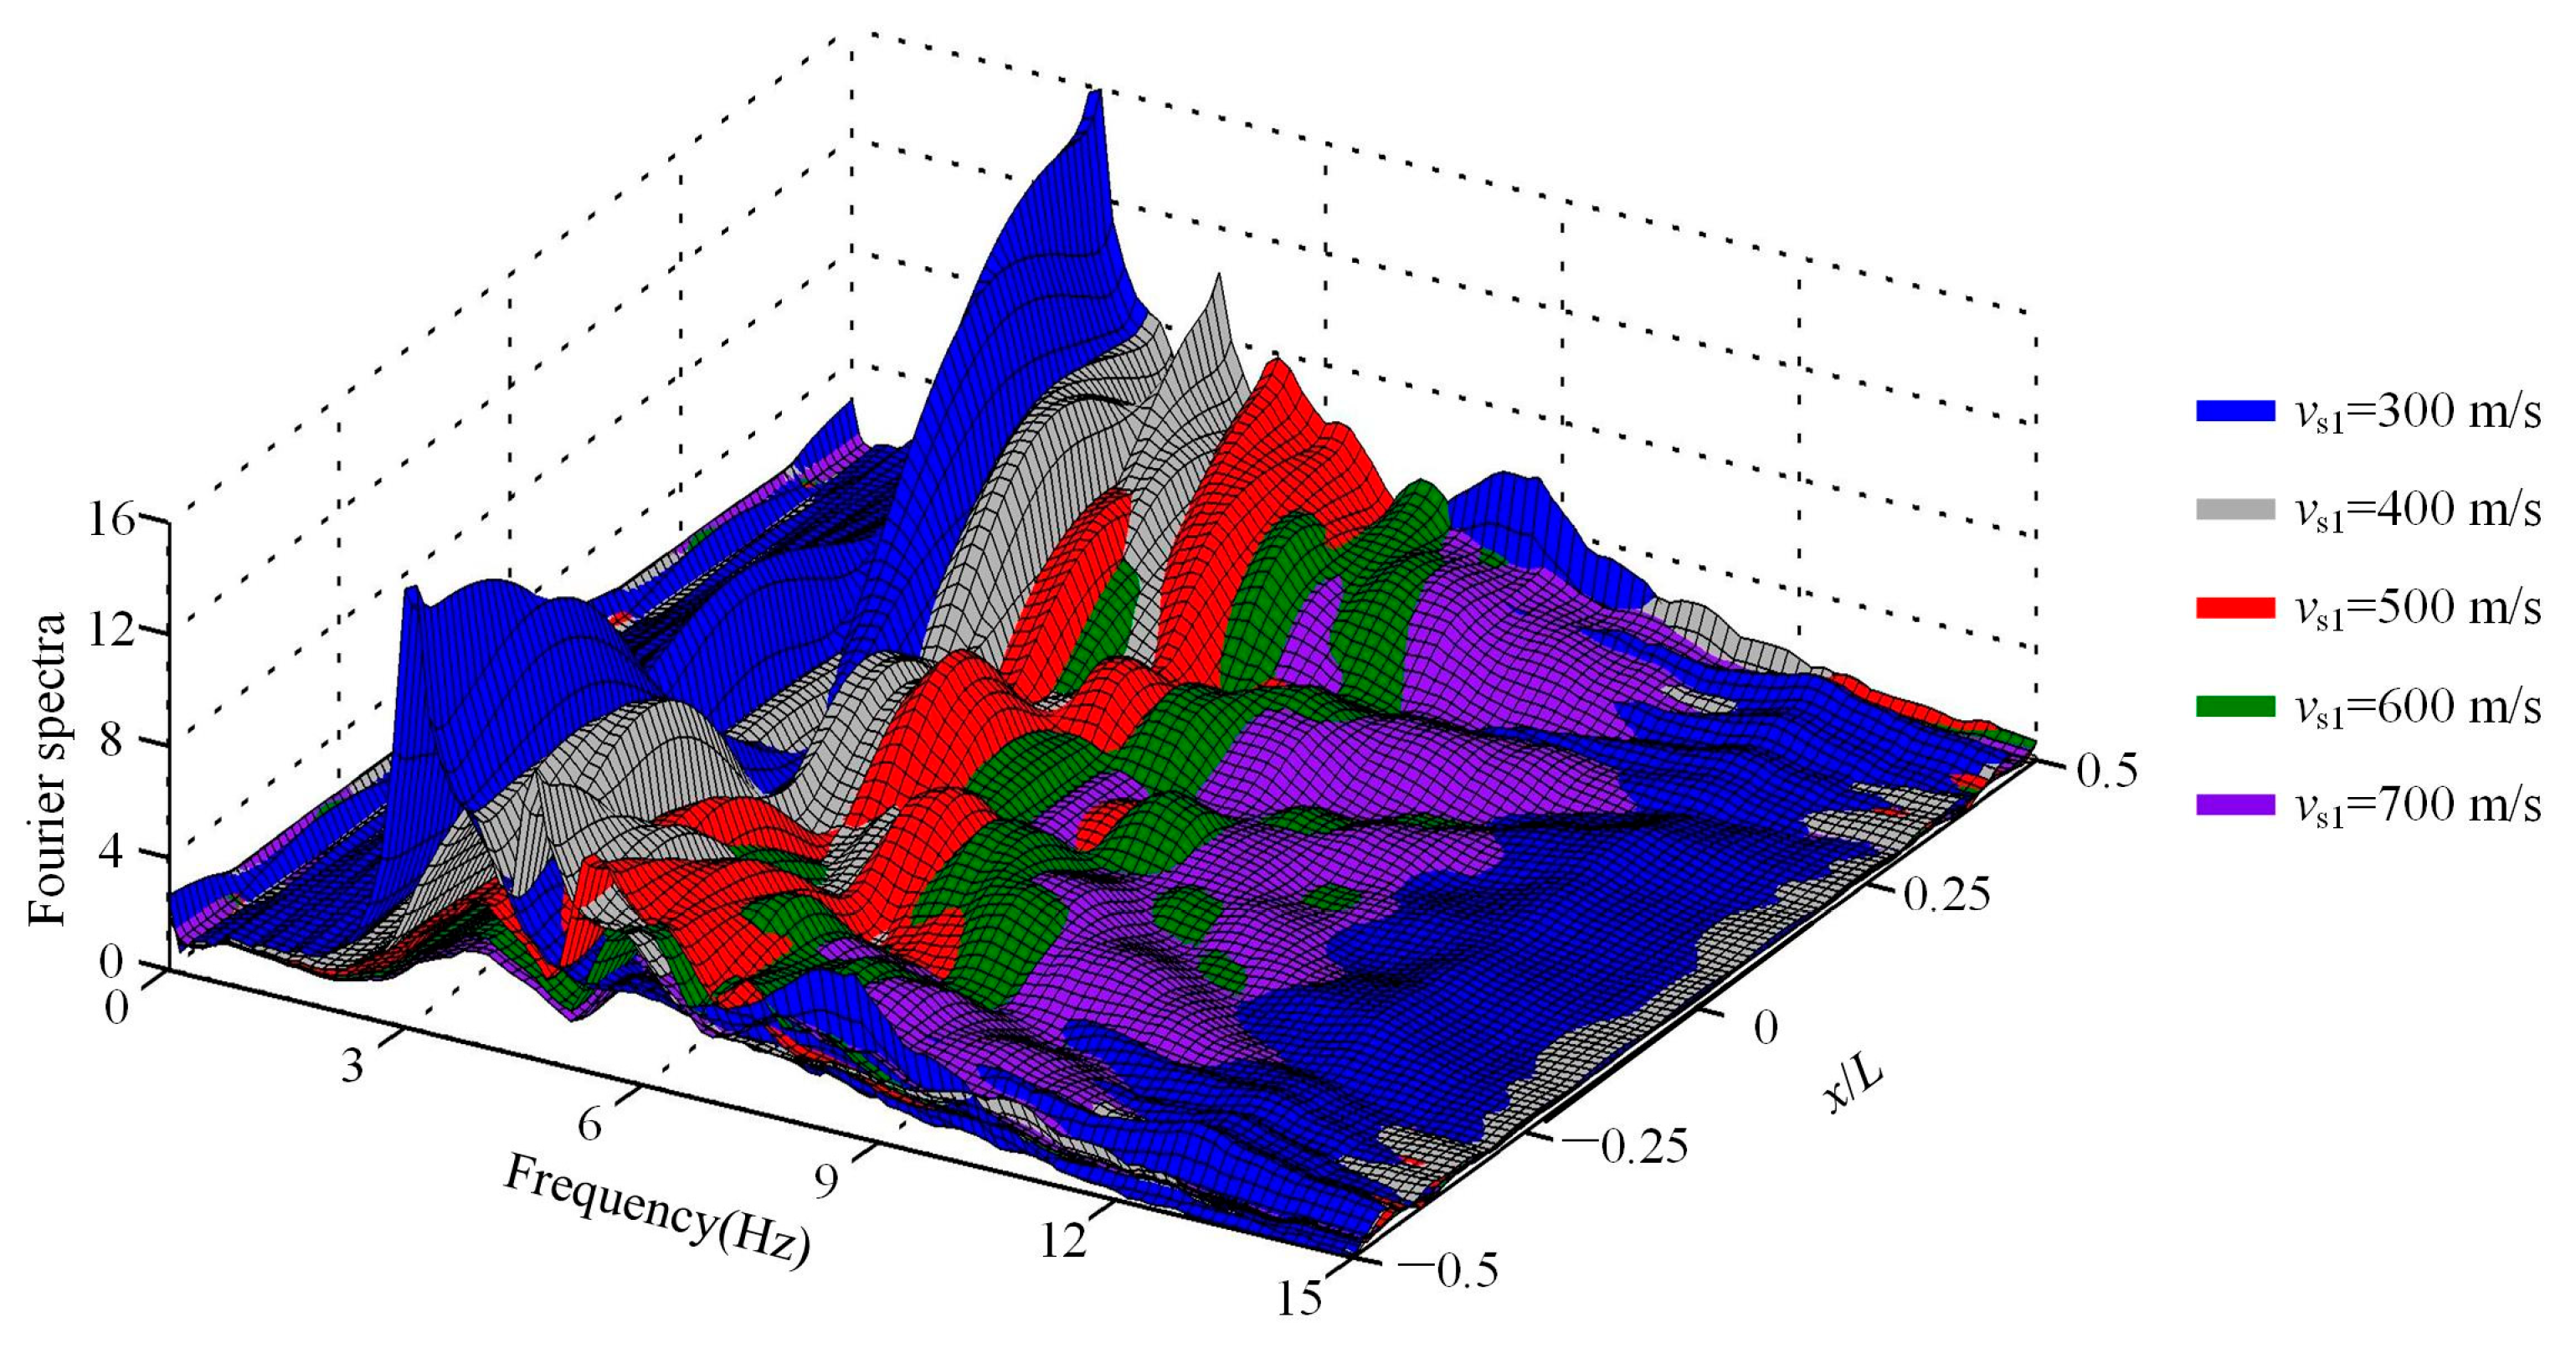
The acceleration spectral ratios of the models with various
vs1 are calculated. The results are presented in a 3D figure that uses frequency and the normalized parameter
x/
L as the horizontal coordinates, as shown in
Figure 10, where
x is the x-coordinate of the observation point and
L is the length of the reef site. This 3D figure provides a comprehensive visualization of the acceleration response of the reef site to seismic waves across a range of frequencies and locations.
As the vs1 decreases, the acceleration spectral ratio near the edge of the reef site significantly increases, and the peak component shifts towards the low-frequency direction. This indicates that the seismic response of the reef site in the frequency domain is sensitive to vs1. This sensitivity can be explained by the change in the dynamic characteristics of the reef site. Specifically, as the shear wave velocity decreases, the top reef layer becomes weaker, resulting in a lower natural frequency of the reef site. This lower natural frequency, combined with the amplification effect of the reef site, leads to larger seismic responses when subjected to low-frequency loads. This is because the lower natural frequency makes it easier for the reef site to resonate with the seismic waves. The amplification effect occurs because the reef site acts as a natural filter for seismic waves, with certain frequencies being amplified while others are attenuated. These results emphasize the importance of considering the shear wave velocity of the topmost reef layer in the seismic design of constructions on the reef engineering site, especially near the edge of the reef flat.
4.2. Thickness of the Top Reef Layer
Next, we turn our attention to the thickness of the top reef layer
H1 and its impact on the seismic response of the reef site. The top weak layer on reefs in the South China Sea typically ranges between 9 and 28 m in thickness. To explore this further, we keep all other parameters in
Table 2 constant and vary the thickness of the top reef layer in 5 m increments: 10 m, 15 m, 20 m, 25 m, and 30 m. Using these values, we establish the corresponding reef-seawater models and input a pulse wave and three artificial seismic waves for calculation and analysis.
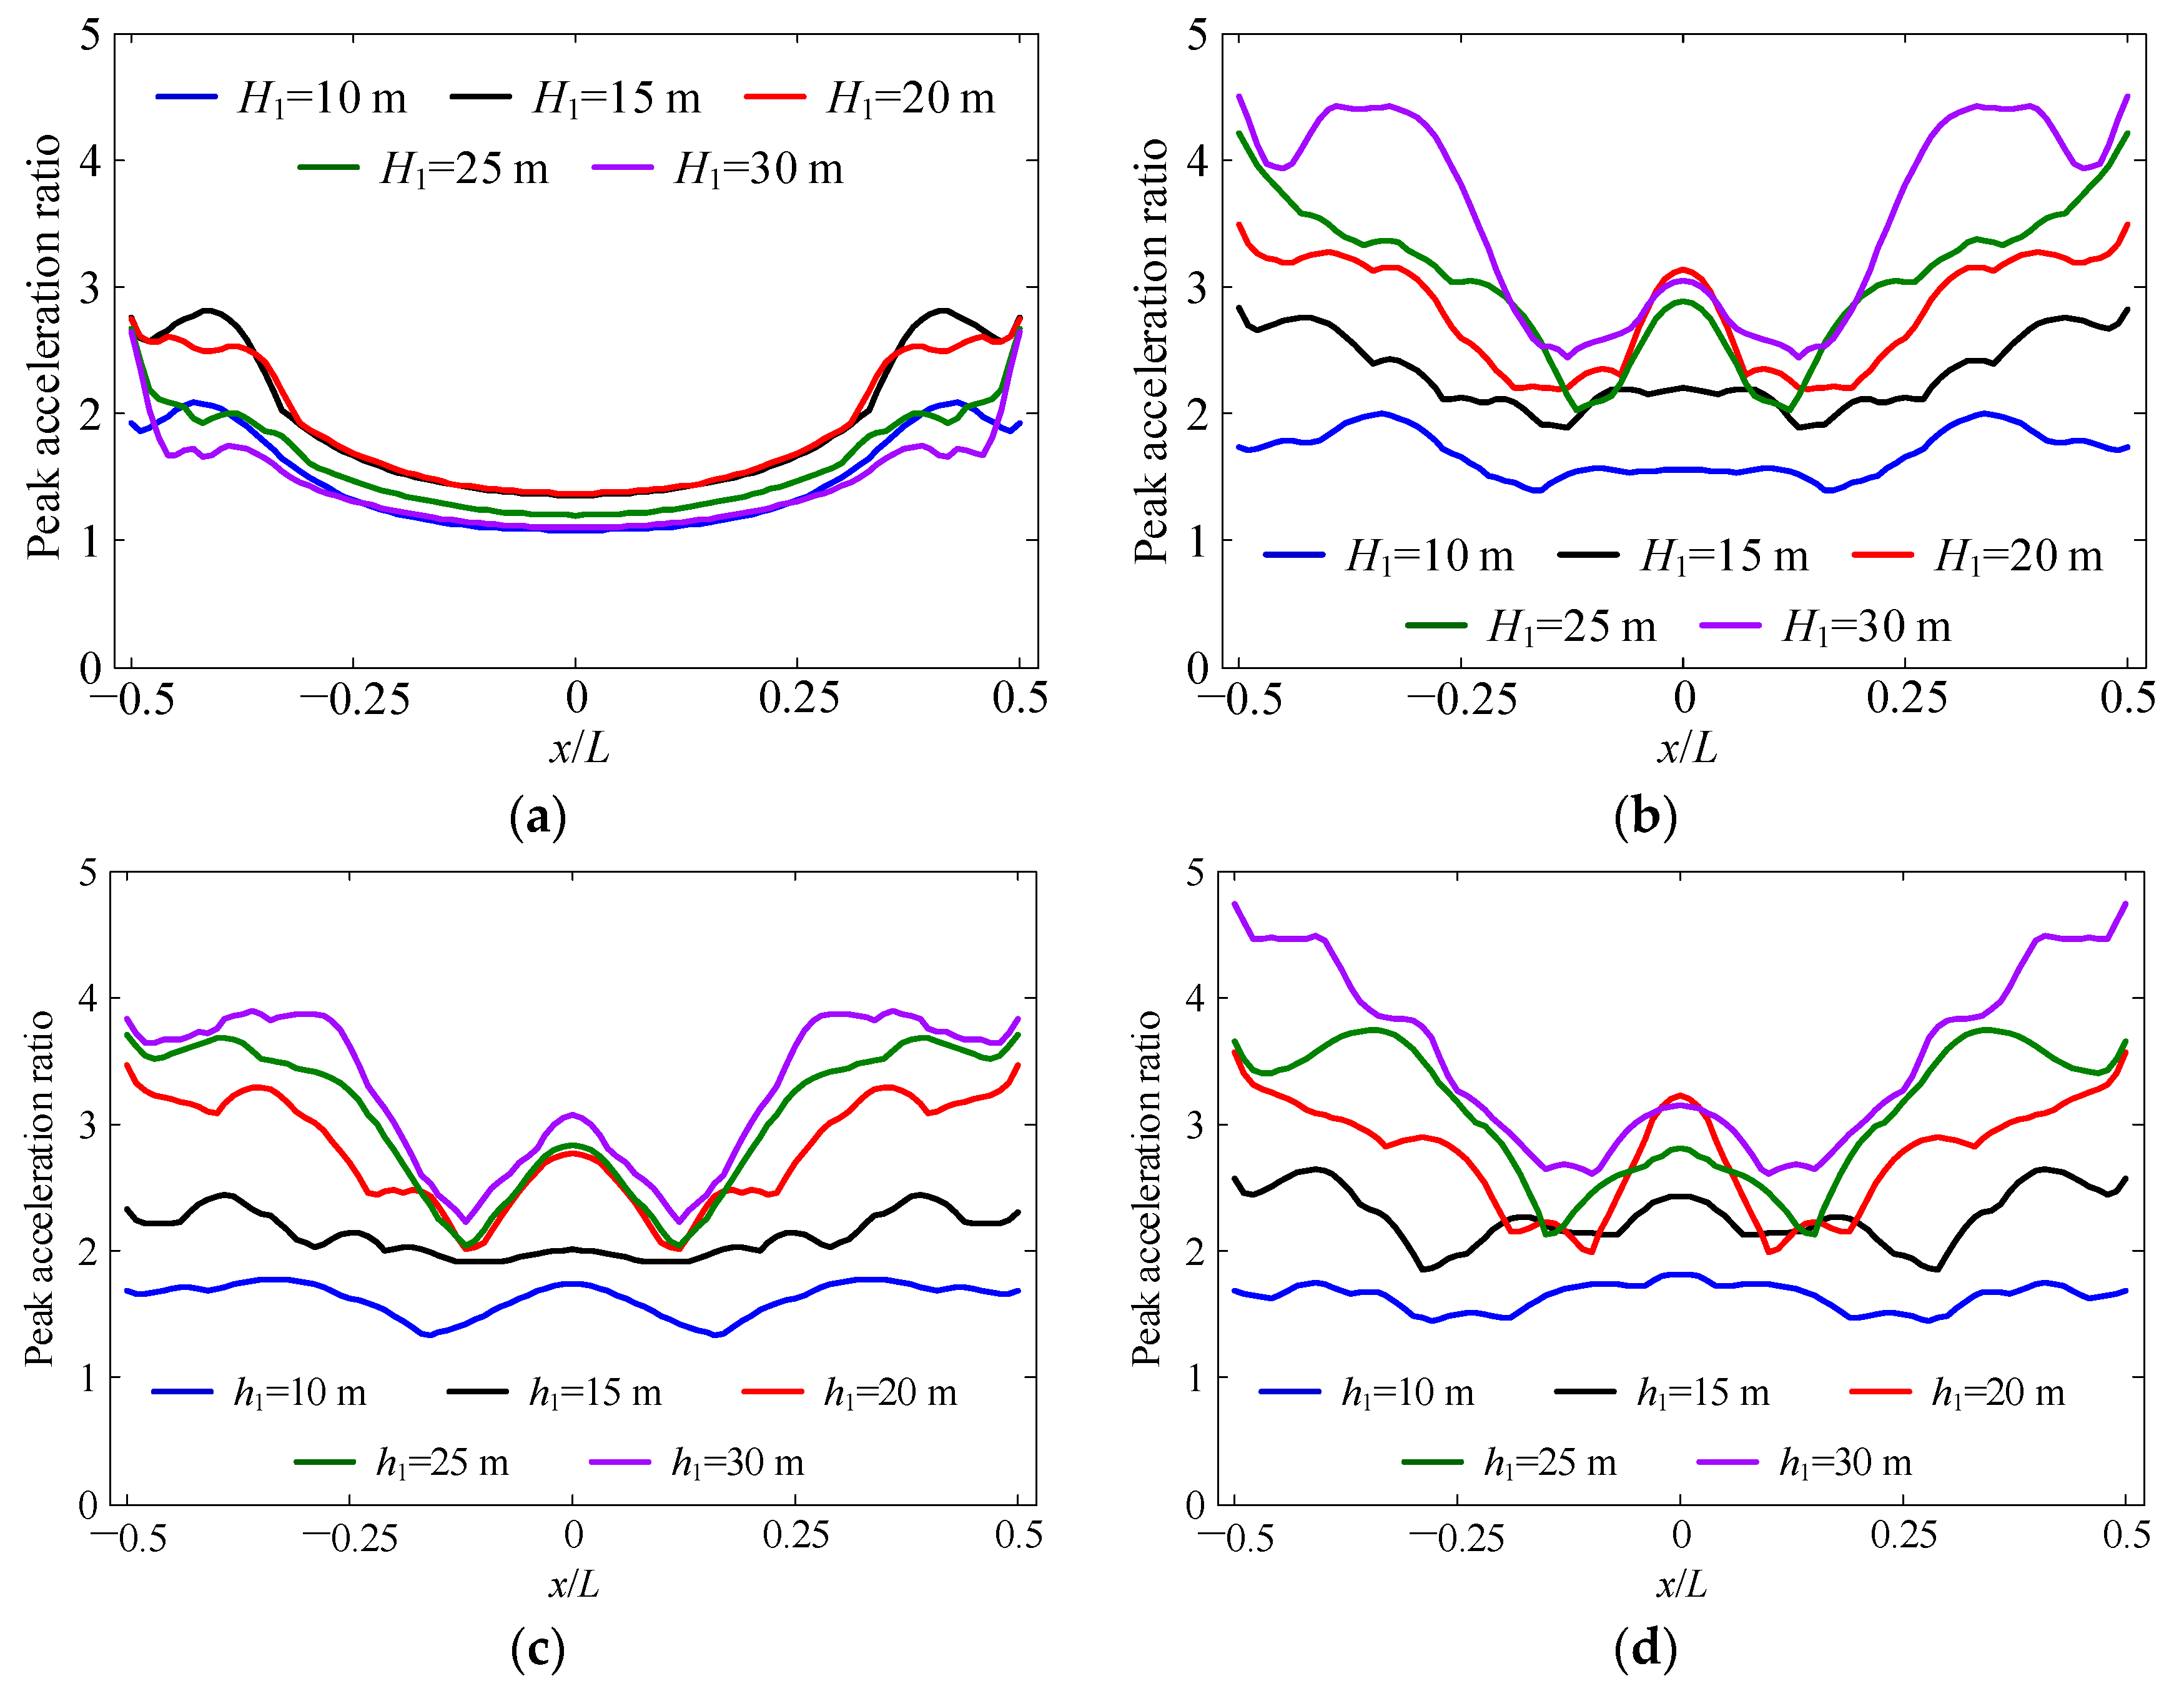
The spatial distributions of the peak acceleration ratio under different thicknesses of the top reef layer are compared, as shown in
Figure 11. Furthermore, the average values of the peak acceleration ratio along the reef platform of different models are calculated, and the results are given in
Table 4.
An initial increase and subsequent decrease in the peak acceleration ratio on the reef flat with increasing thickness of the top reef layer can be observed under the incidence of the pulse wave. The peak value of the average seismic response at a thickness of 15 m suggests that there exists an unfavorable thickness of the top reef layer for the load case of a pulse wave, over or under which the seismic response of the reef site decreases. Under artificial seismic wave incidences, the acceleration peak ratio exhibits a significant increase, particularly in the region near the reef edge, with increasing thickness of the top reef layer. The 115% increase in the average acceleration peak ratio on the reef flat when H1 is increased from 10 m to 30 m in the case of the artificial wave 3 incident highlights the sensitivity of the reef site seismic response to the height of the top reef layer.
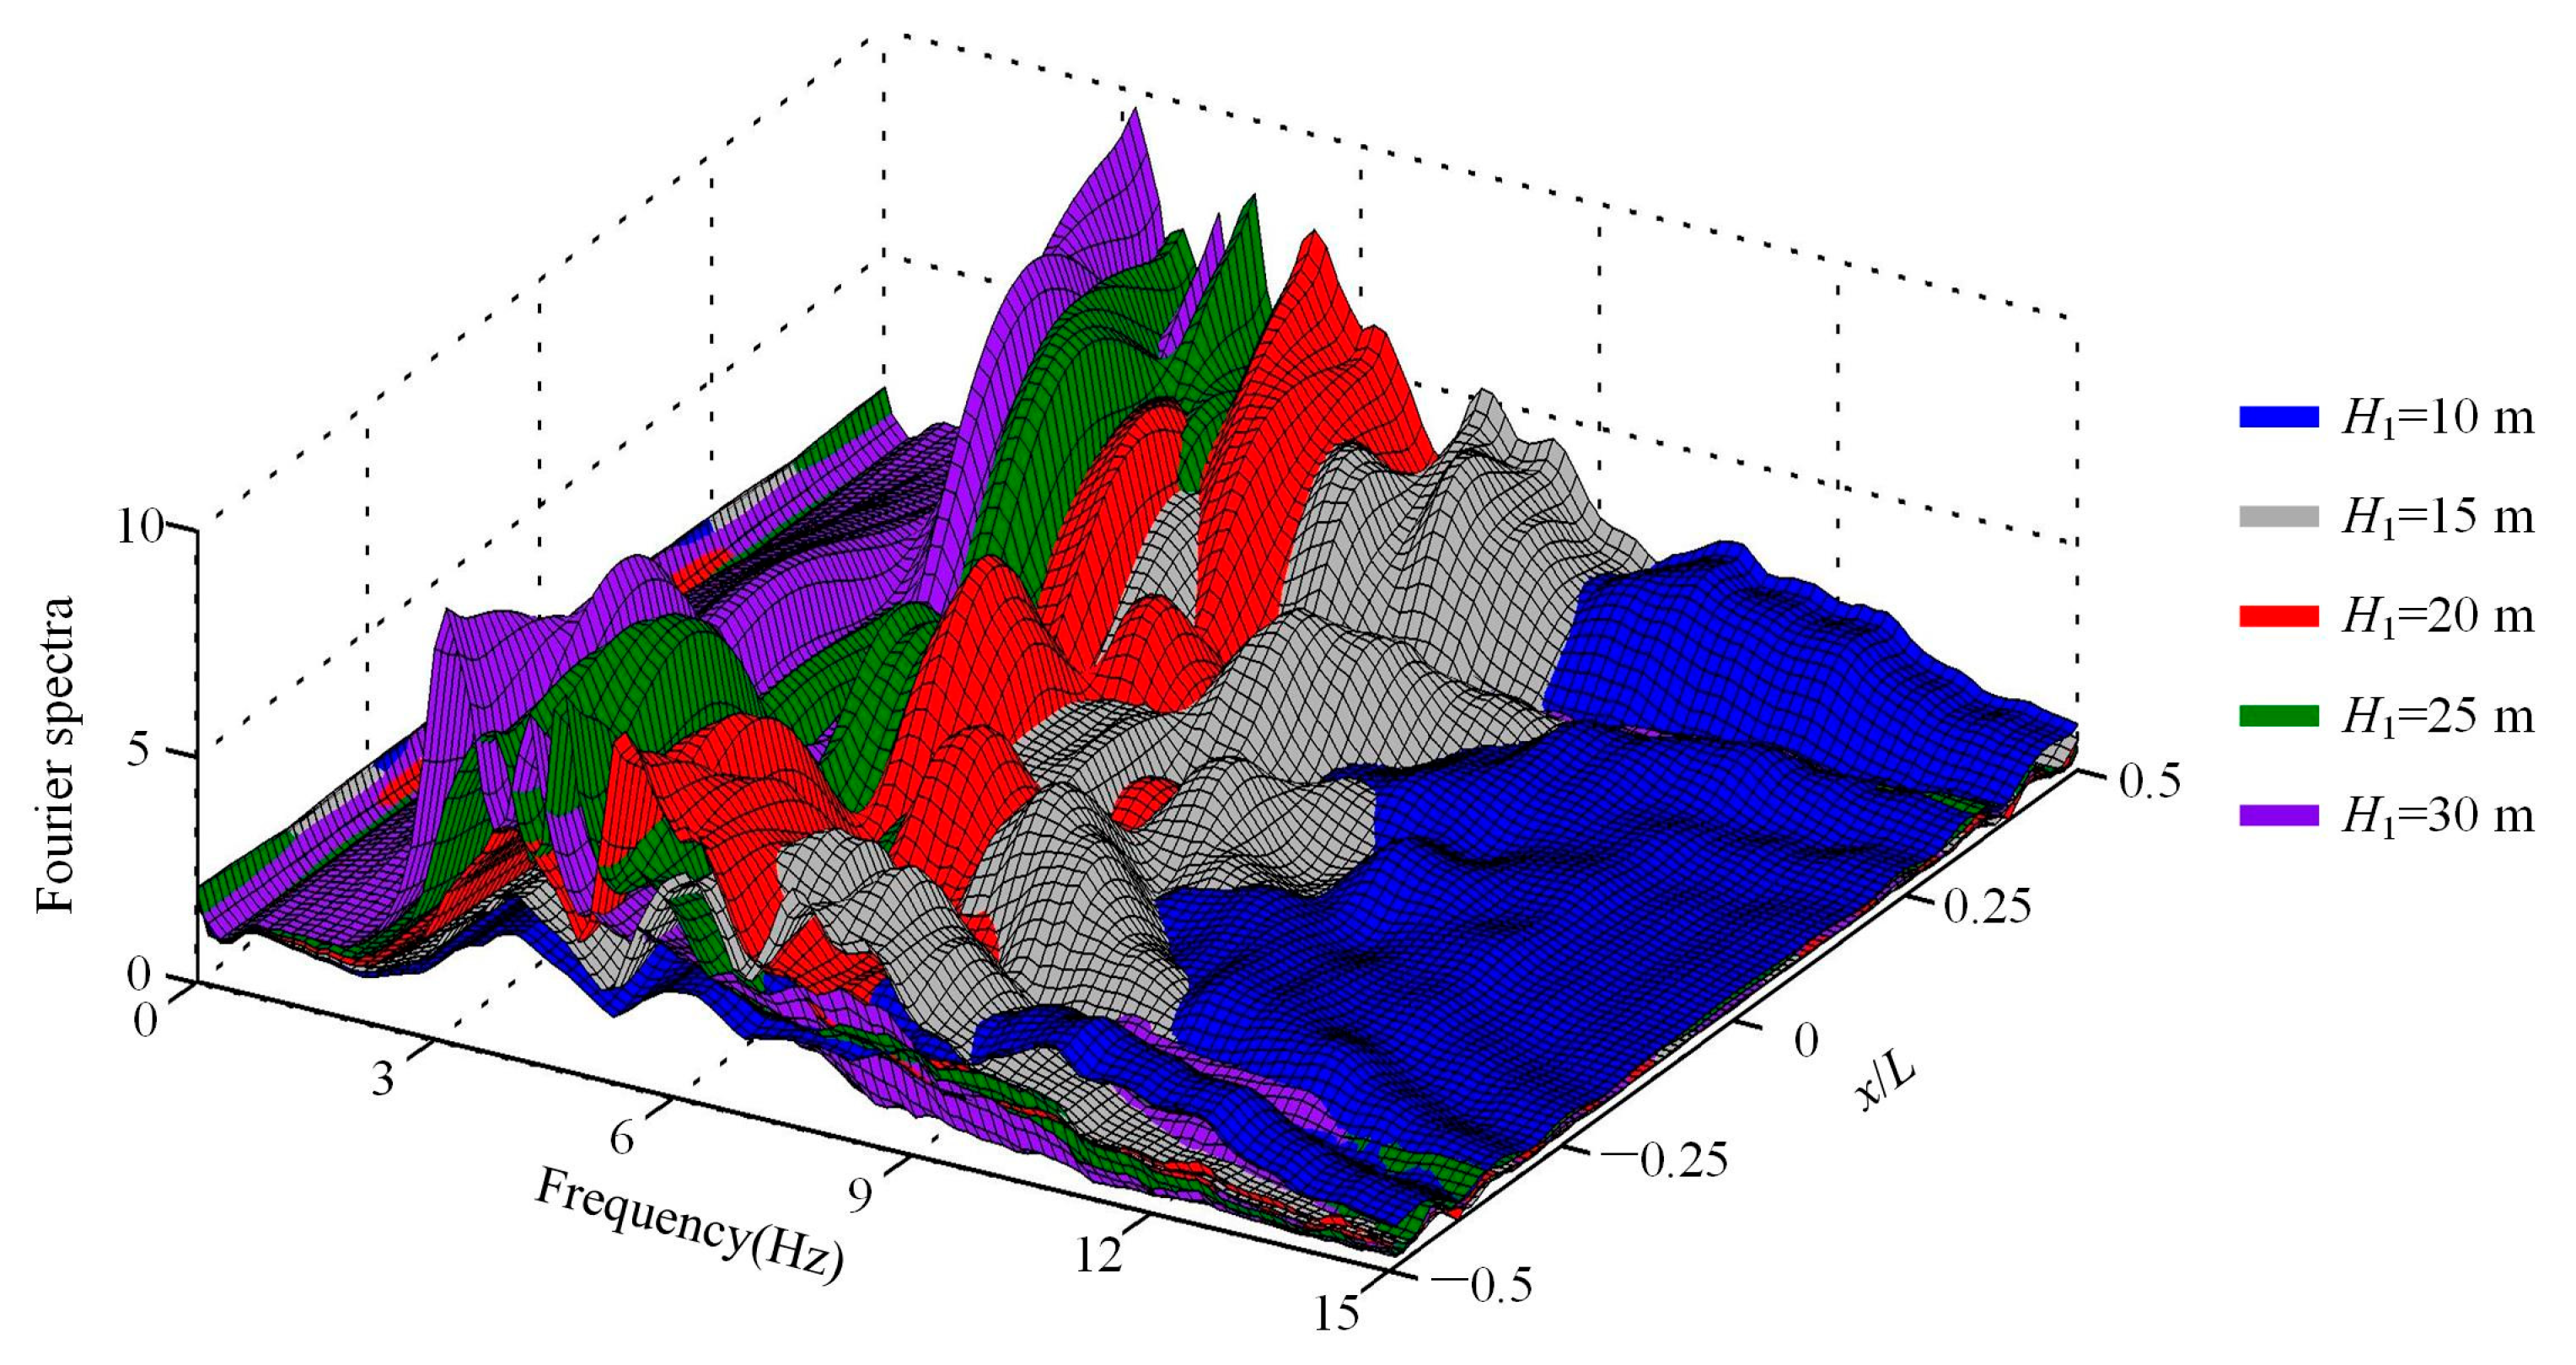
Figure 12 presents the distributions of the acceleration spectral ratios of the models with different thicknesses of the top reef layer.
It can be seen that with the increase of
H1, the peak value of the acceleration spectrum ratio significantly increases, and the peak component gradually shifts towards the low-frequency direction. Similarly to
Section 4.1, the increase in thickness of the soft layer can result in a lower natural frequency of the site model, making it more susceptible to resonance under low-frequency loading and resulting in larger site seismic responses. This effect could also contribute to the observed trend in
Figure 11, where the peak acceleration ratio increases with the thickness of the top reef layer. The results suggest that the thickness of the top reef layer should be carefully considered in the seismic design of construction on reef engineering sites. Specifically, an increase in the thickness of the top reef layer can lead to a significant increase in the acceleration peak ratio on the reef flat, particularly under low-frequency loading conditions.
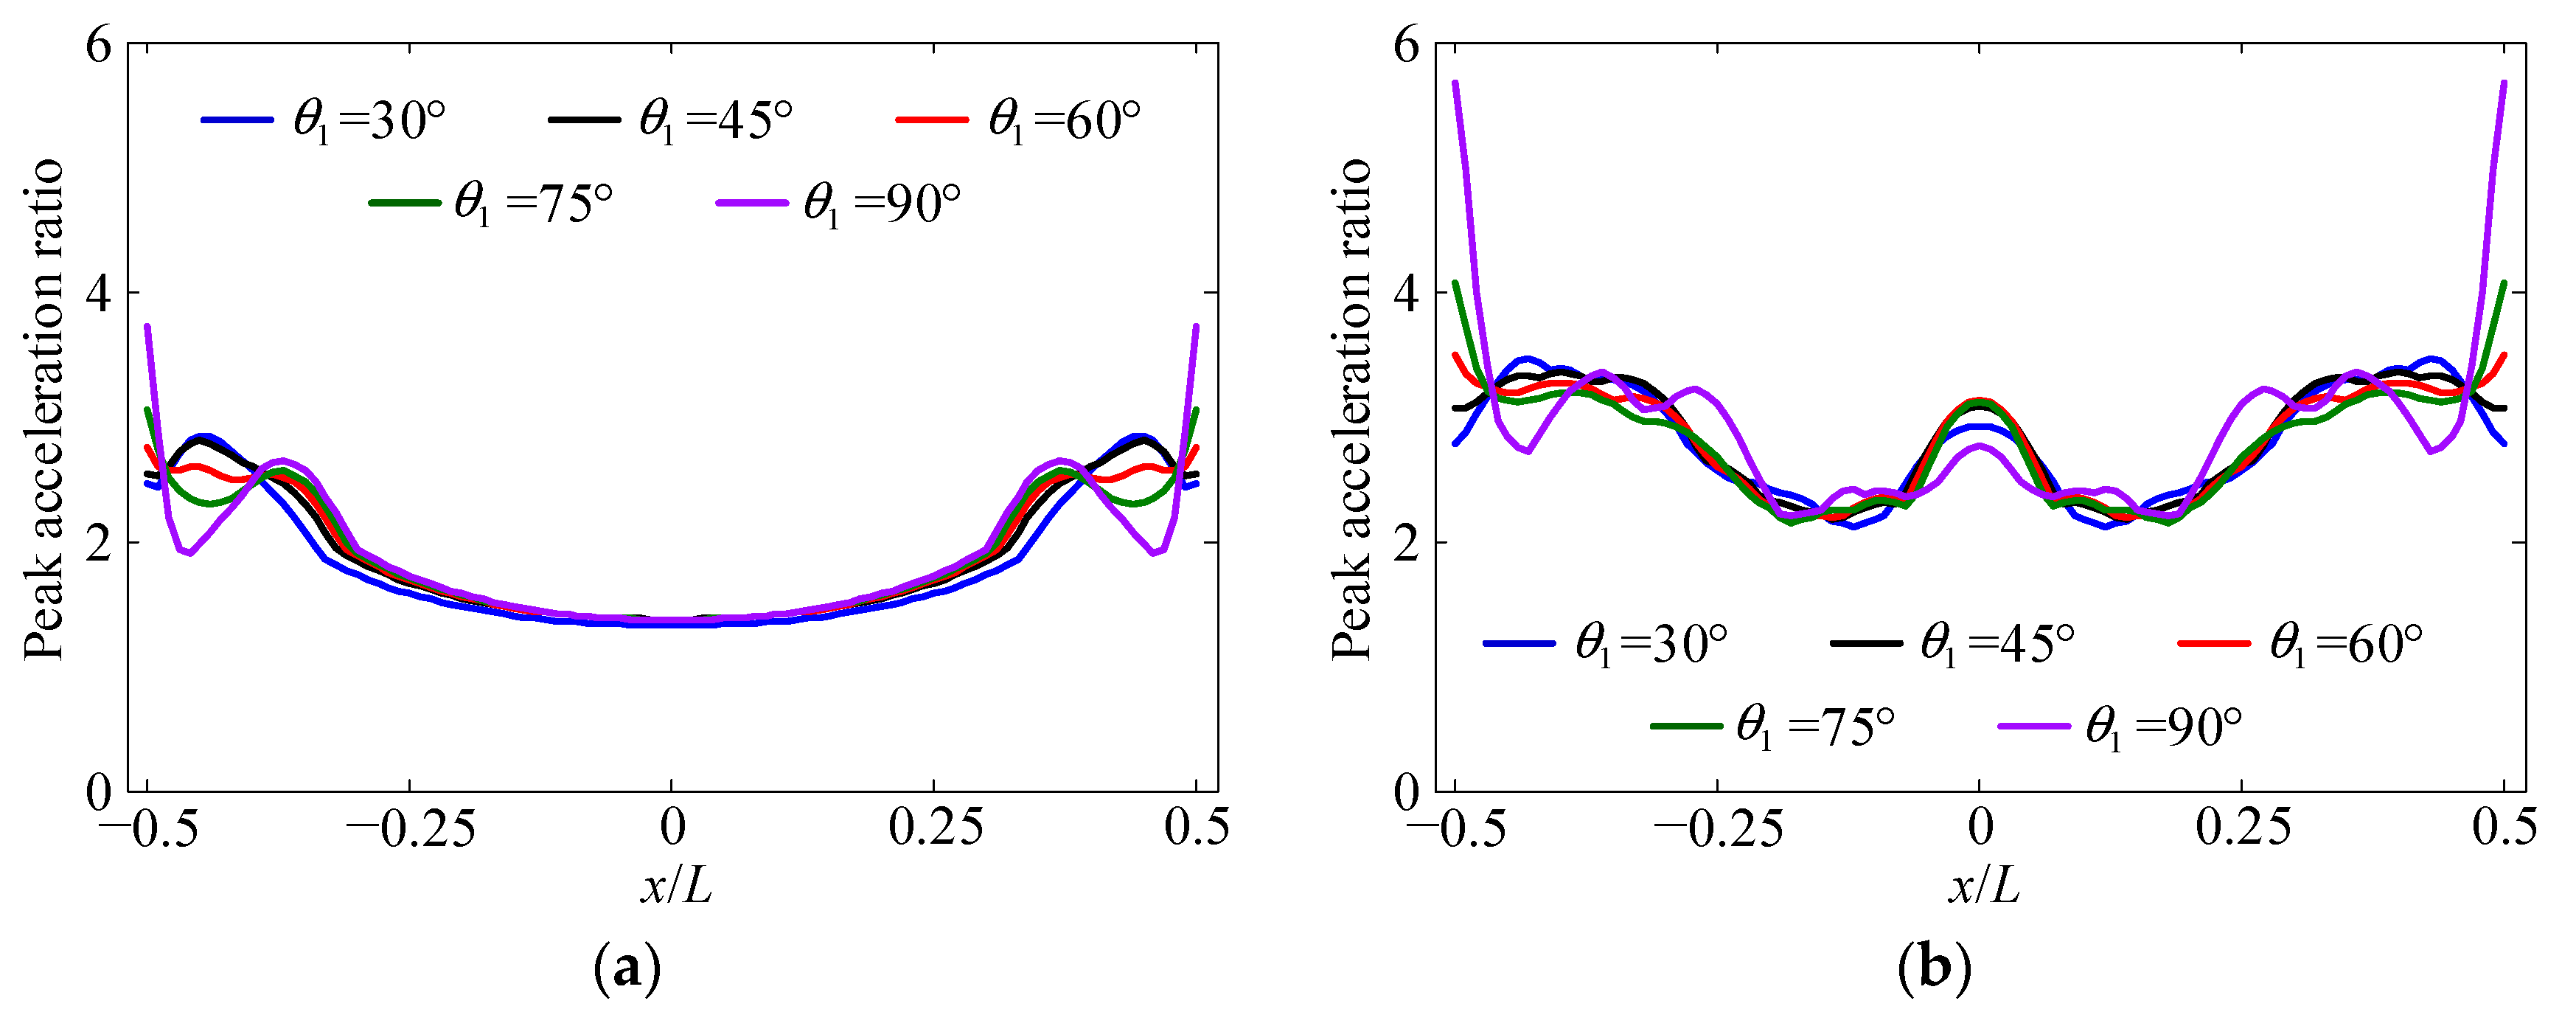
4.3. Slope Gradient of the Top Reef Layer
A previous study [
31] showed that the slope of Yongshu Reef, especially those shallower than 20 m, is steep, with the gradient ranging from 45° to 60° and even reaching up to 90° in some areas. To assess the impact of this shallow slope gradient on the seismic response of the reef site, a series of reef-seawater models with a slope gradient
θ1 of 30°, 45°, 60°, 75°, and 90°, respectively, are established. The pulse wave and three artificial seismic waves are input into the numerical model through the BSM, and the spatial distributions of the peak acceleration ratio on the reef flat are calculated and compared, as shown in
Figure 13. Furthermore, we also calculated the average peak acceleration ratios along the reef flat, which are presented in
Table 5.
The results of the comparison reveal that, on the whole, the impact of θ1 on the seismic response of the reef flat is relatively minor. It primarily affects the region near the edge area, while the central part of the reef flat remains relatively unaffected; namely, the slope gradient of the top reef layer has a localized effect on the seismic response of the reef site, with the impact being more pronounced near the edges of the reef flat. Specifically, as θ1 increases, the seismic response near the edge of the reef flat experiences an increase. However, when moving towards the middle of the reef flat, the seismic response tends to decrease slightly.
The distribution of acceleration spectral ratio calculated by the models with different
θ1 is shown in
Figure 14. Similar to the influence rule found in the time-domain seismic response analysis, the effect of the slope gradient of the top reef layer on the frequency-domain seismic response of the reef site is relatively limited. However, it is worth noting that as the slope gradient increases, the acceleration spectral ratio near the edge of the reef flat slightly increases, and the peak component shifts towards the low-frequency direction. Furthermore, for the central region of the reef site, it was observed that the models with slope gradients of 75° and 90° generate slightly larger spectral ratio values when the frequency is lower than 4 Hz. However, when the frequency is greater than 6 Hz, the influence of the top-slope gradient on the acceleration spectral ratio is significantly reduced.
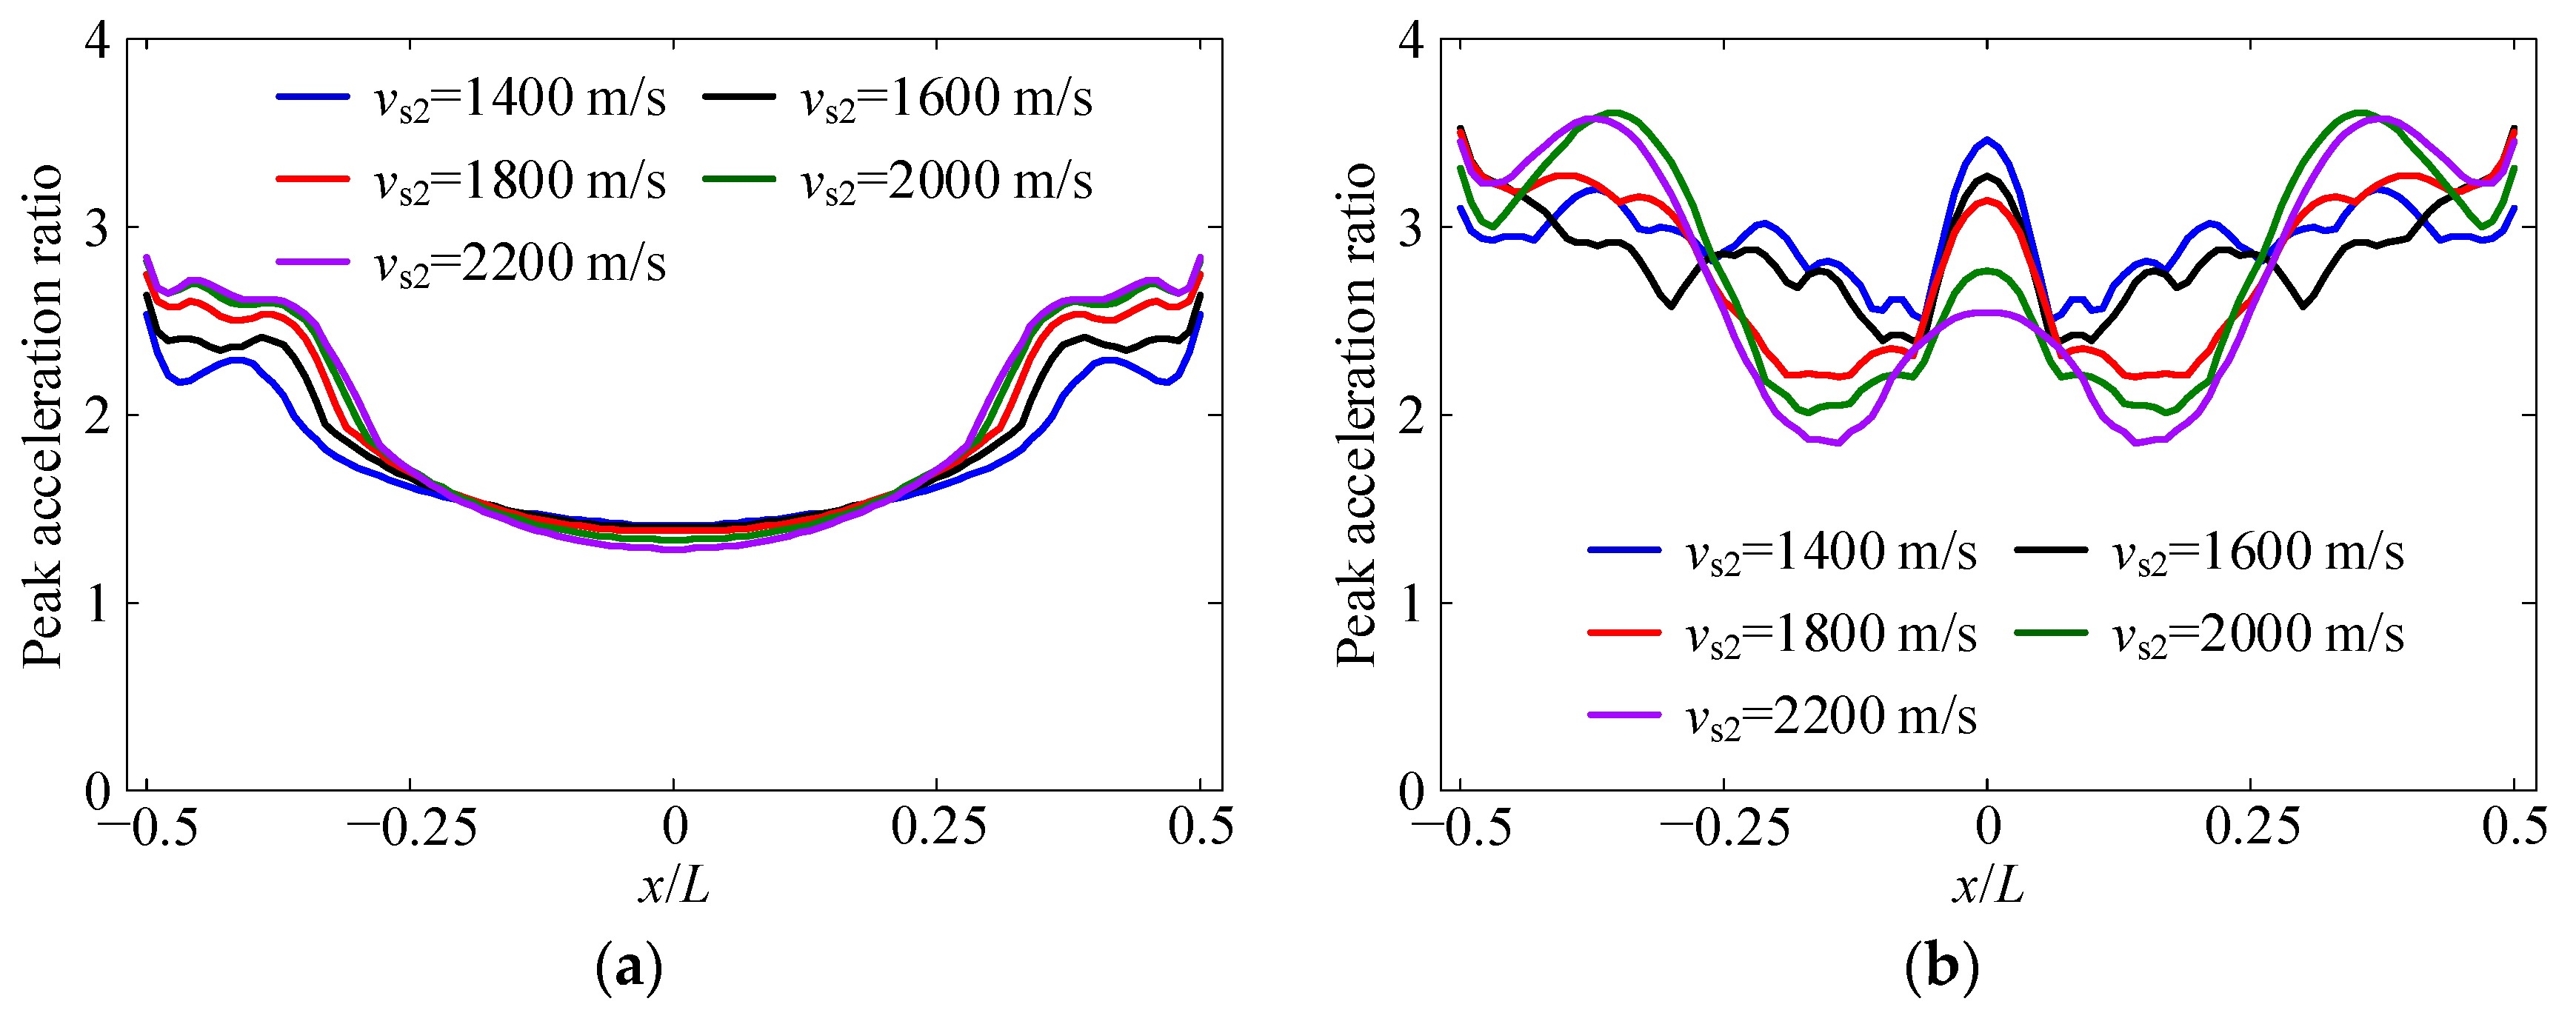
4.4. Shear Wave Velocity of the Middle Reef Layer
As depicted in
Figure 6, the wave velocity of the reef limestone exhibits a significant variation with an increase in burial depth. In
Section 4.1, we examined the impact of the shear wave velocity of the top reef layer on the seismic response of the reef site. In this section, we shift our focus towards the variability of the shear wave velocity of the middle reef layer and its influence on the site’s seismic response.
Keeping all other model parameters constant, we set the shear wave velocity of the middle reef layer vs2 to 1400 m/s, 1600 m/s, 1800 m/s, 2000 m/s, and 2200 m/s, respectively, and establish corresponding numerical models of the reef-seawater system. Subsequently, the pulse wave and three artificial seismic waves are vertically input into the models, which conduct dynamic analyses.
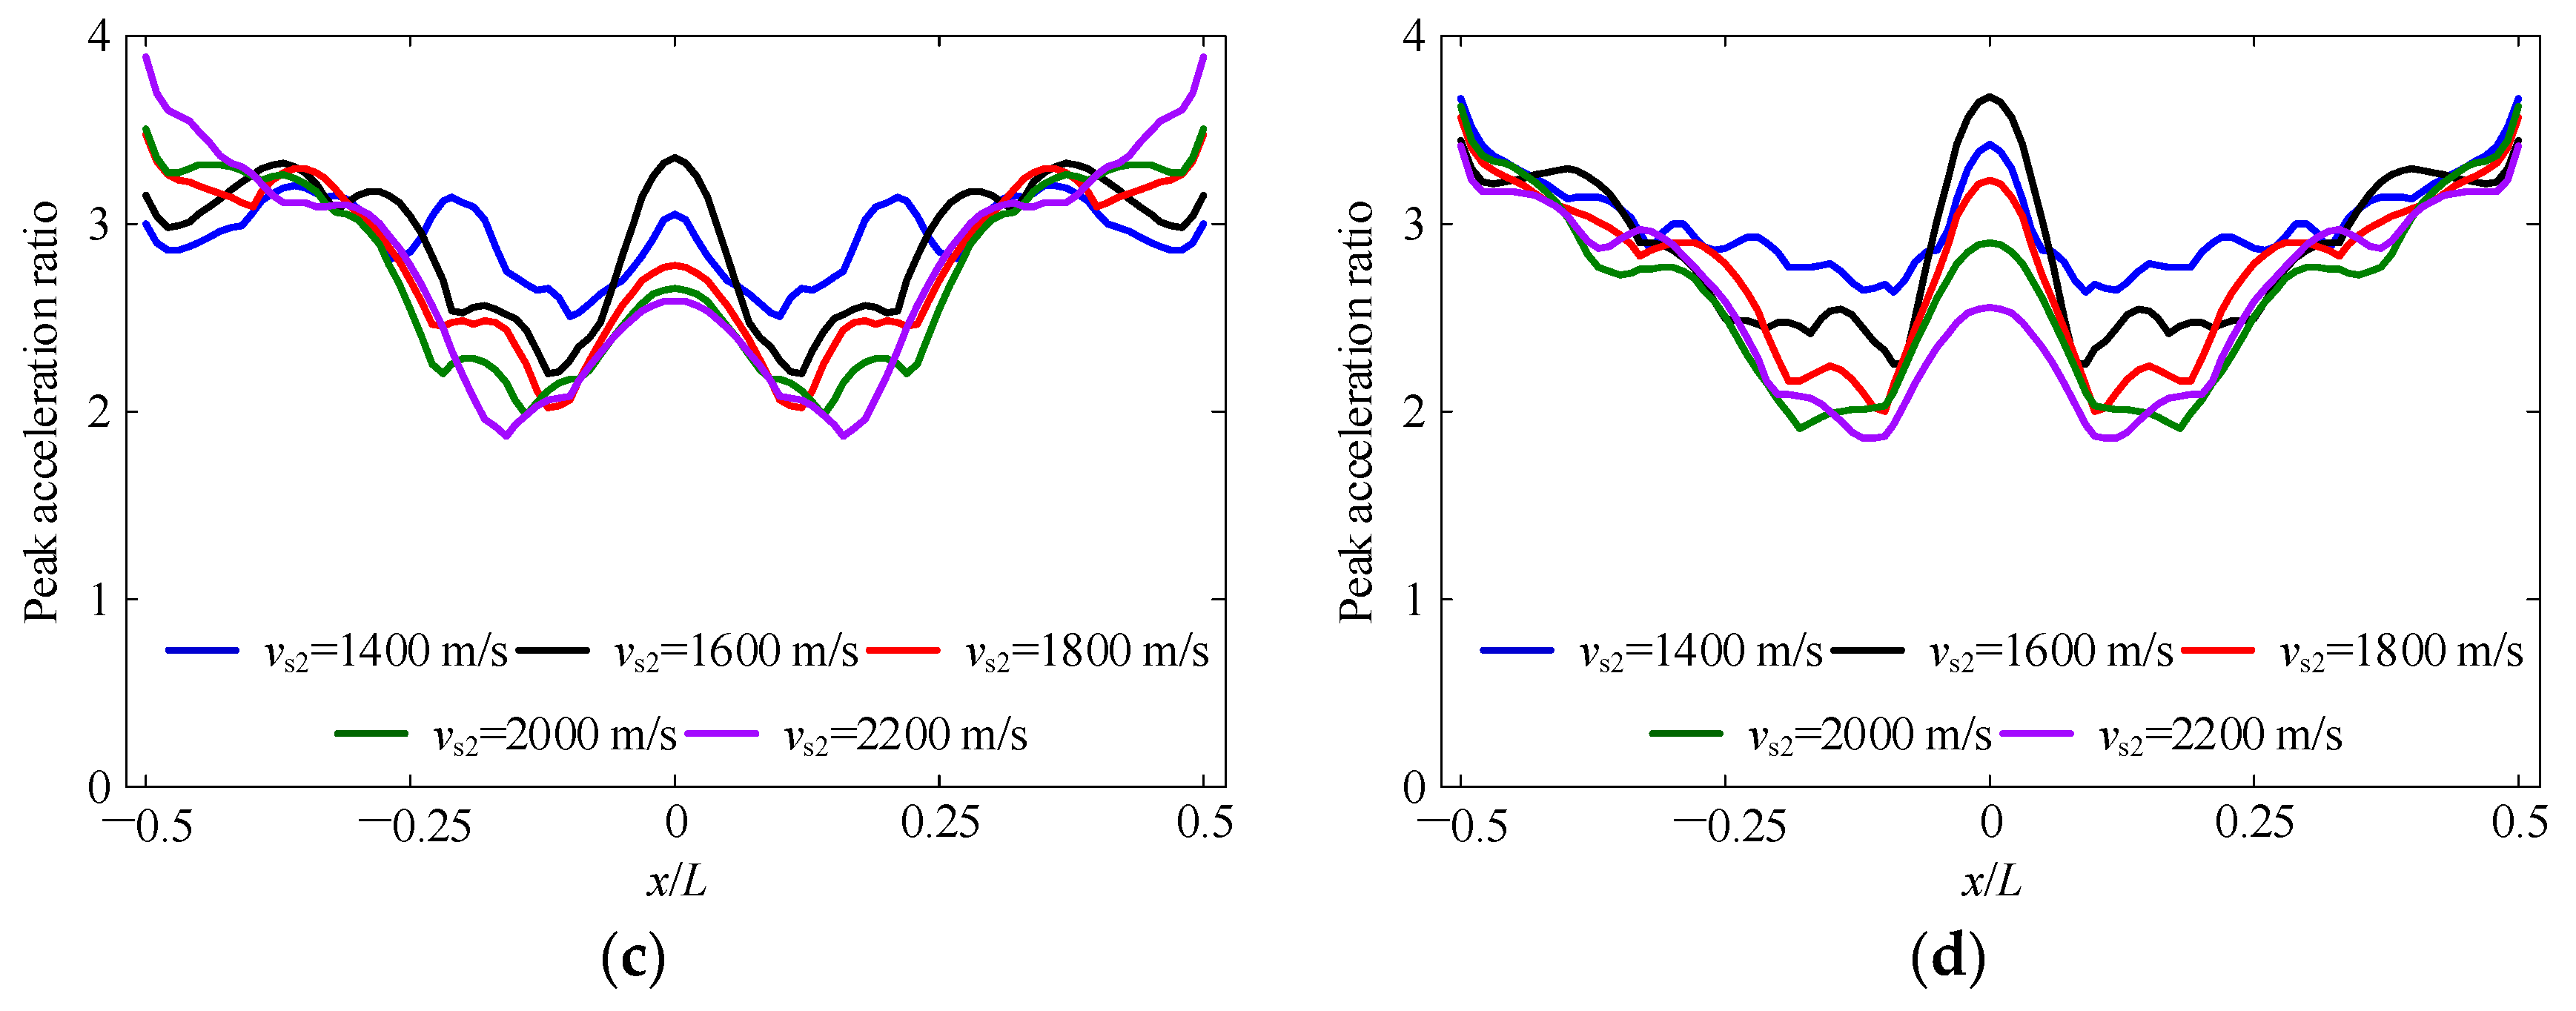
The spatial distributions of the peak acceleration ratio on the reef flat under different
vs2 are compared with each other, as shown in
Figure 15. The average values of the horizontal acceleration peak ratio along the reef flat are calculated and given in
Table 6.
The results presented in
Figure 15 and
Table 6 highlight that
vs2 has a complex influence on the seismic response of the reef site. Specifically, a substantial increase in the acceleration response near the edge of the reef flat with an increase in
vs2 can be observed. However, an opposite trend is found in the central area of the reef site.
The results also reveal that the average peak acceleration ratio increases with vs2 when subjected to a pulse wave input. By contrast, under the incidence of a seismic wave, the average peak acceleration ratio of the reef site exhibits a decreasing trend with the increase of vs2. However, it is important to note that the maximum variation observed in the acceleration response when changing vs2 does not exceed 16%. Overall, the findings indicate that the influence of vs2 on the seismic response of reef sites is relatively complex, and the effect varies depending on the location and type of seismic input.
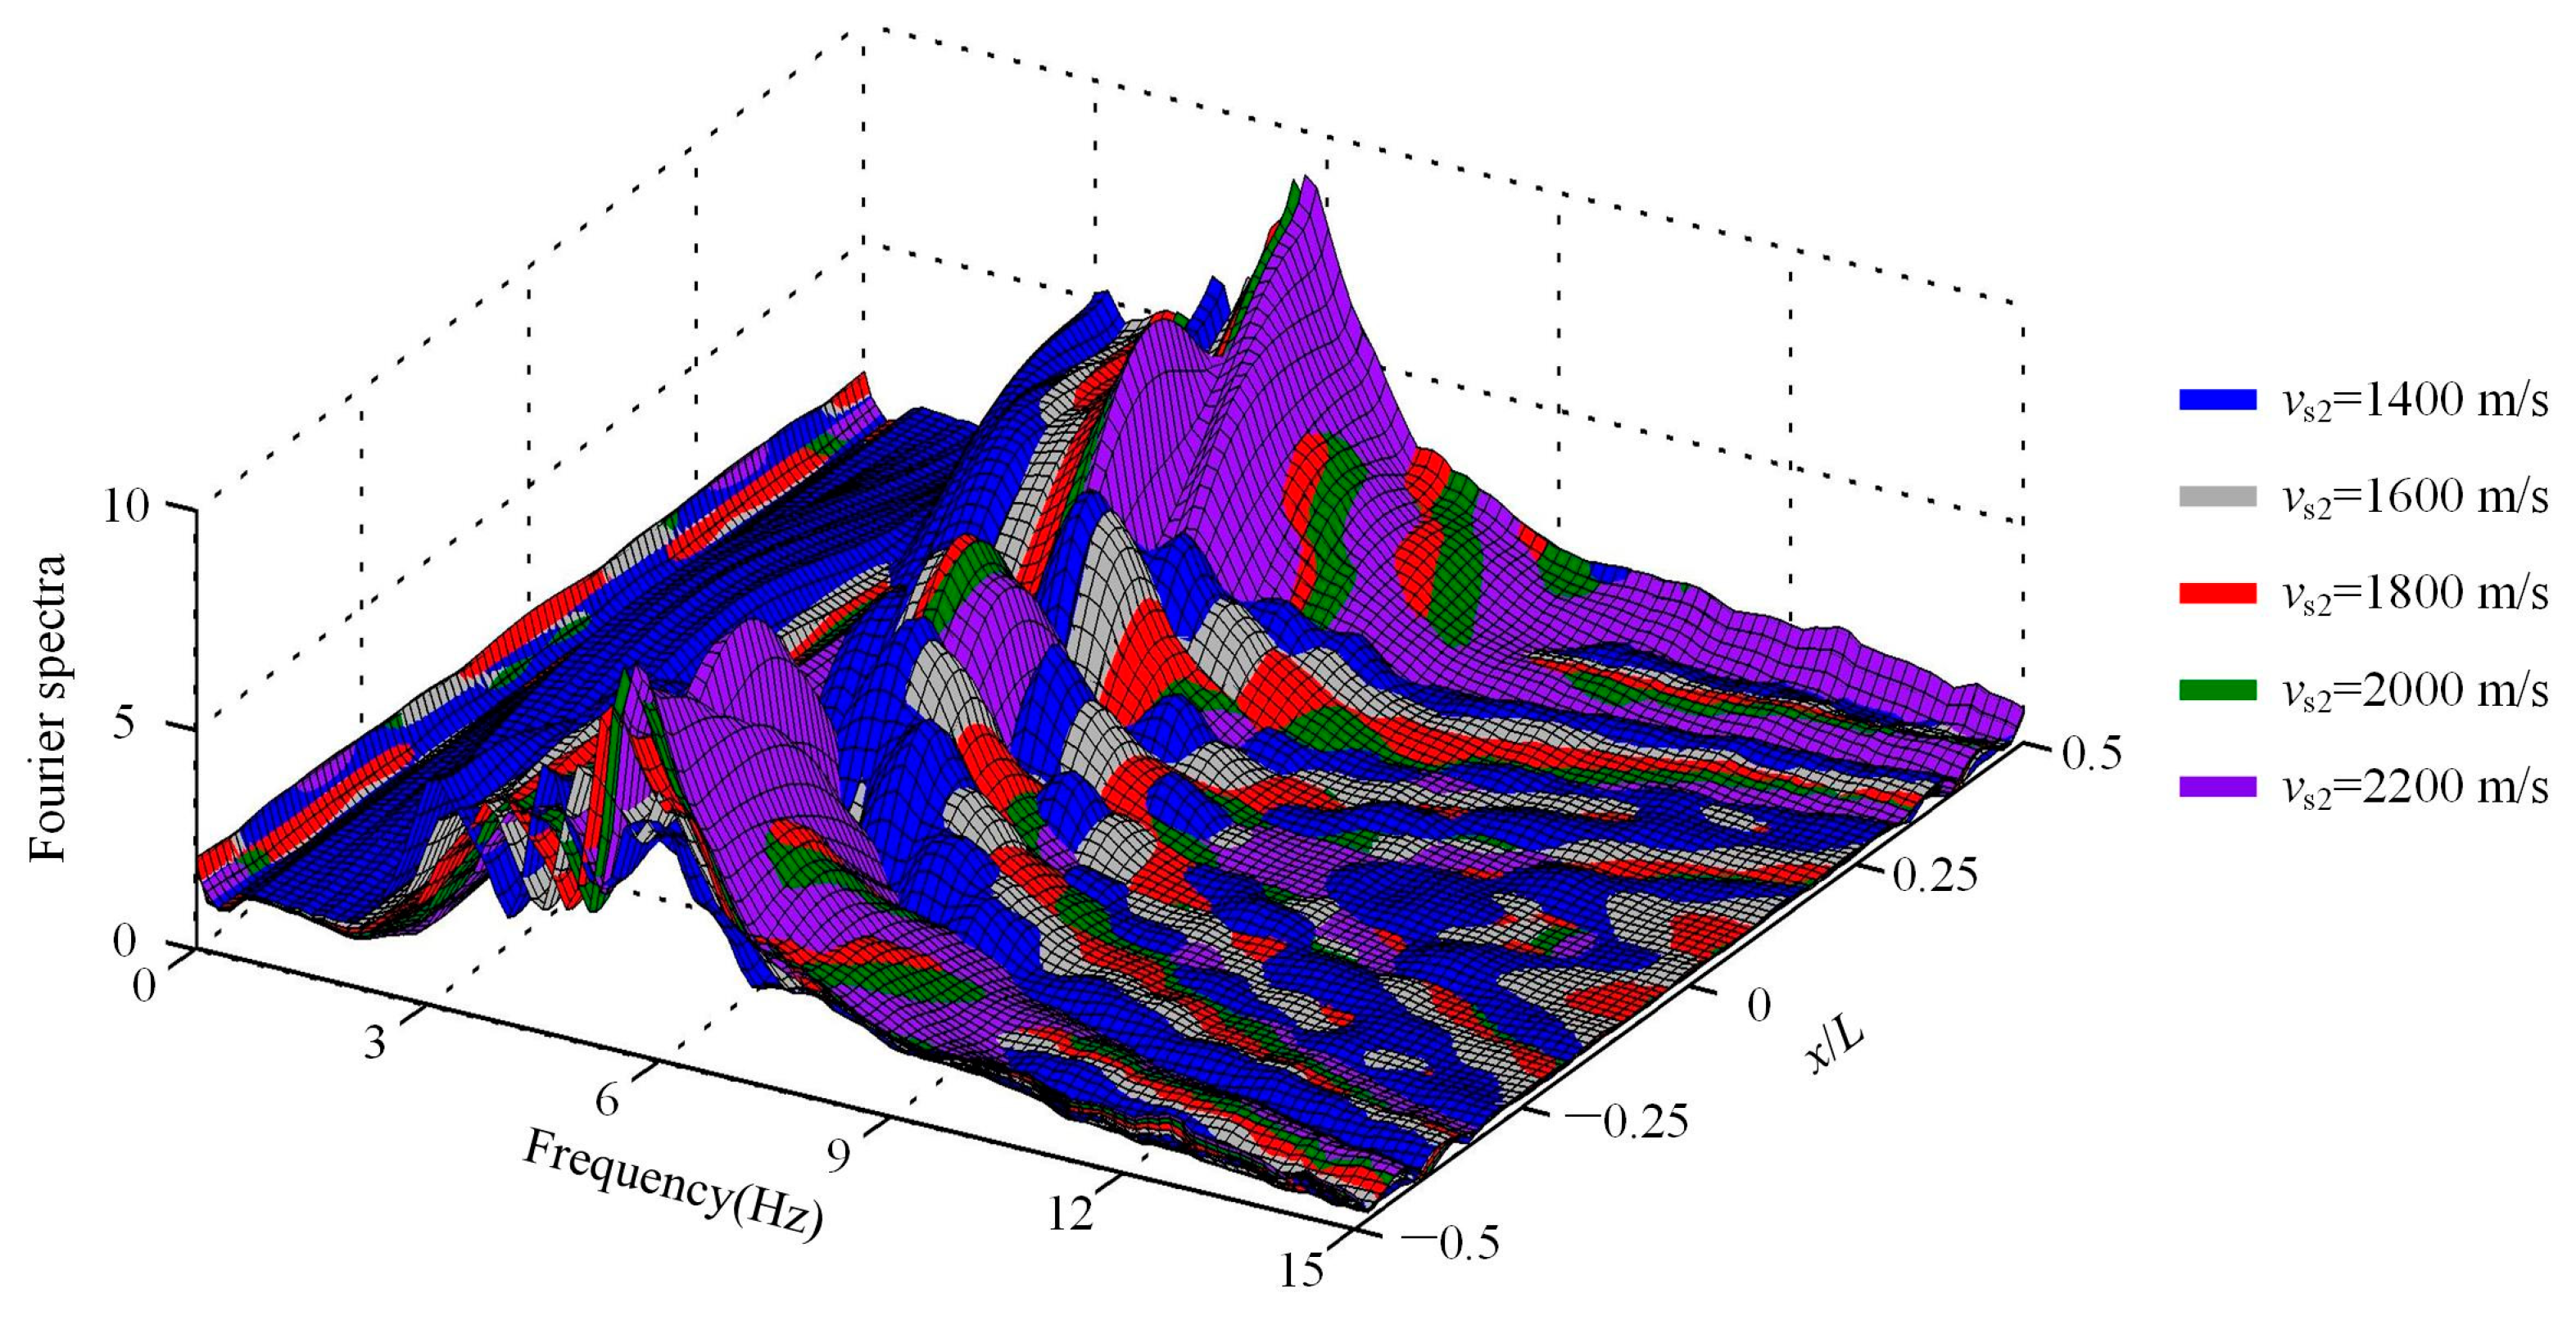
The spatial distribution of the acceleration spectrum ratio when changing the value of
vs2 is calculated. The results are shown in
Figure 16.
With the increase of vs2, the acceleration spectral ratio near the reef edge gradually increases, and the peak component in this area slightly shifts towards the high-frequency direction. In the central area of the reef flat, it is observed that the horizontal acceleration spectral ratio obtained by the low-velocity model is relatively large when the frequency is less than 4 Hz. However, when the frequency exceeds 6 Hz, the horizontal acceleration spectral ratio calculated by models with different shear wave velocities alternately reaches the maximum value in local regions from the edge area to the central area of the reef site. These findings indicate that the seismic response of the reef site is affected not only by the shear wave velocity of the topmost layer but also by the middle layer. The complex behavior observed in the acceleration spectral ratio highlights the importance of specific topographical surveys and deep material properties testing when investigating the detailed dynamic behavior of important reef engineering sites.
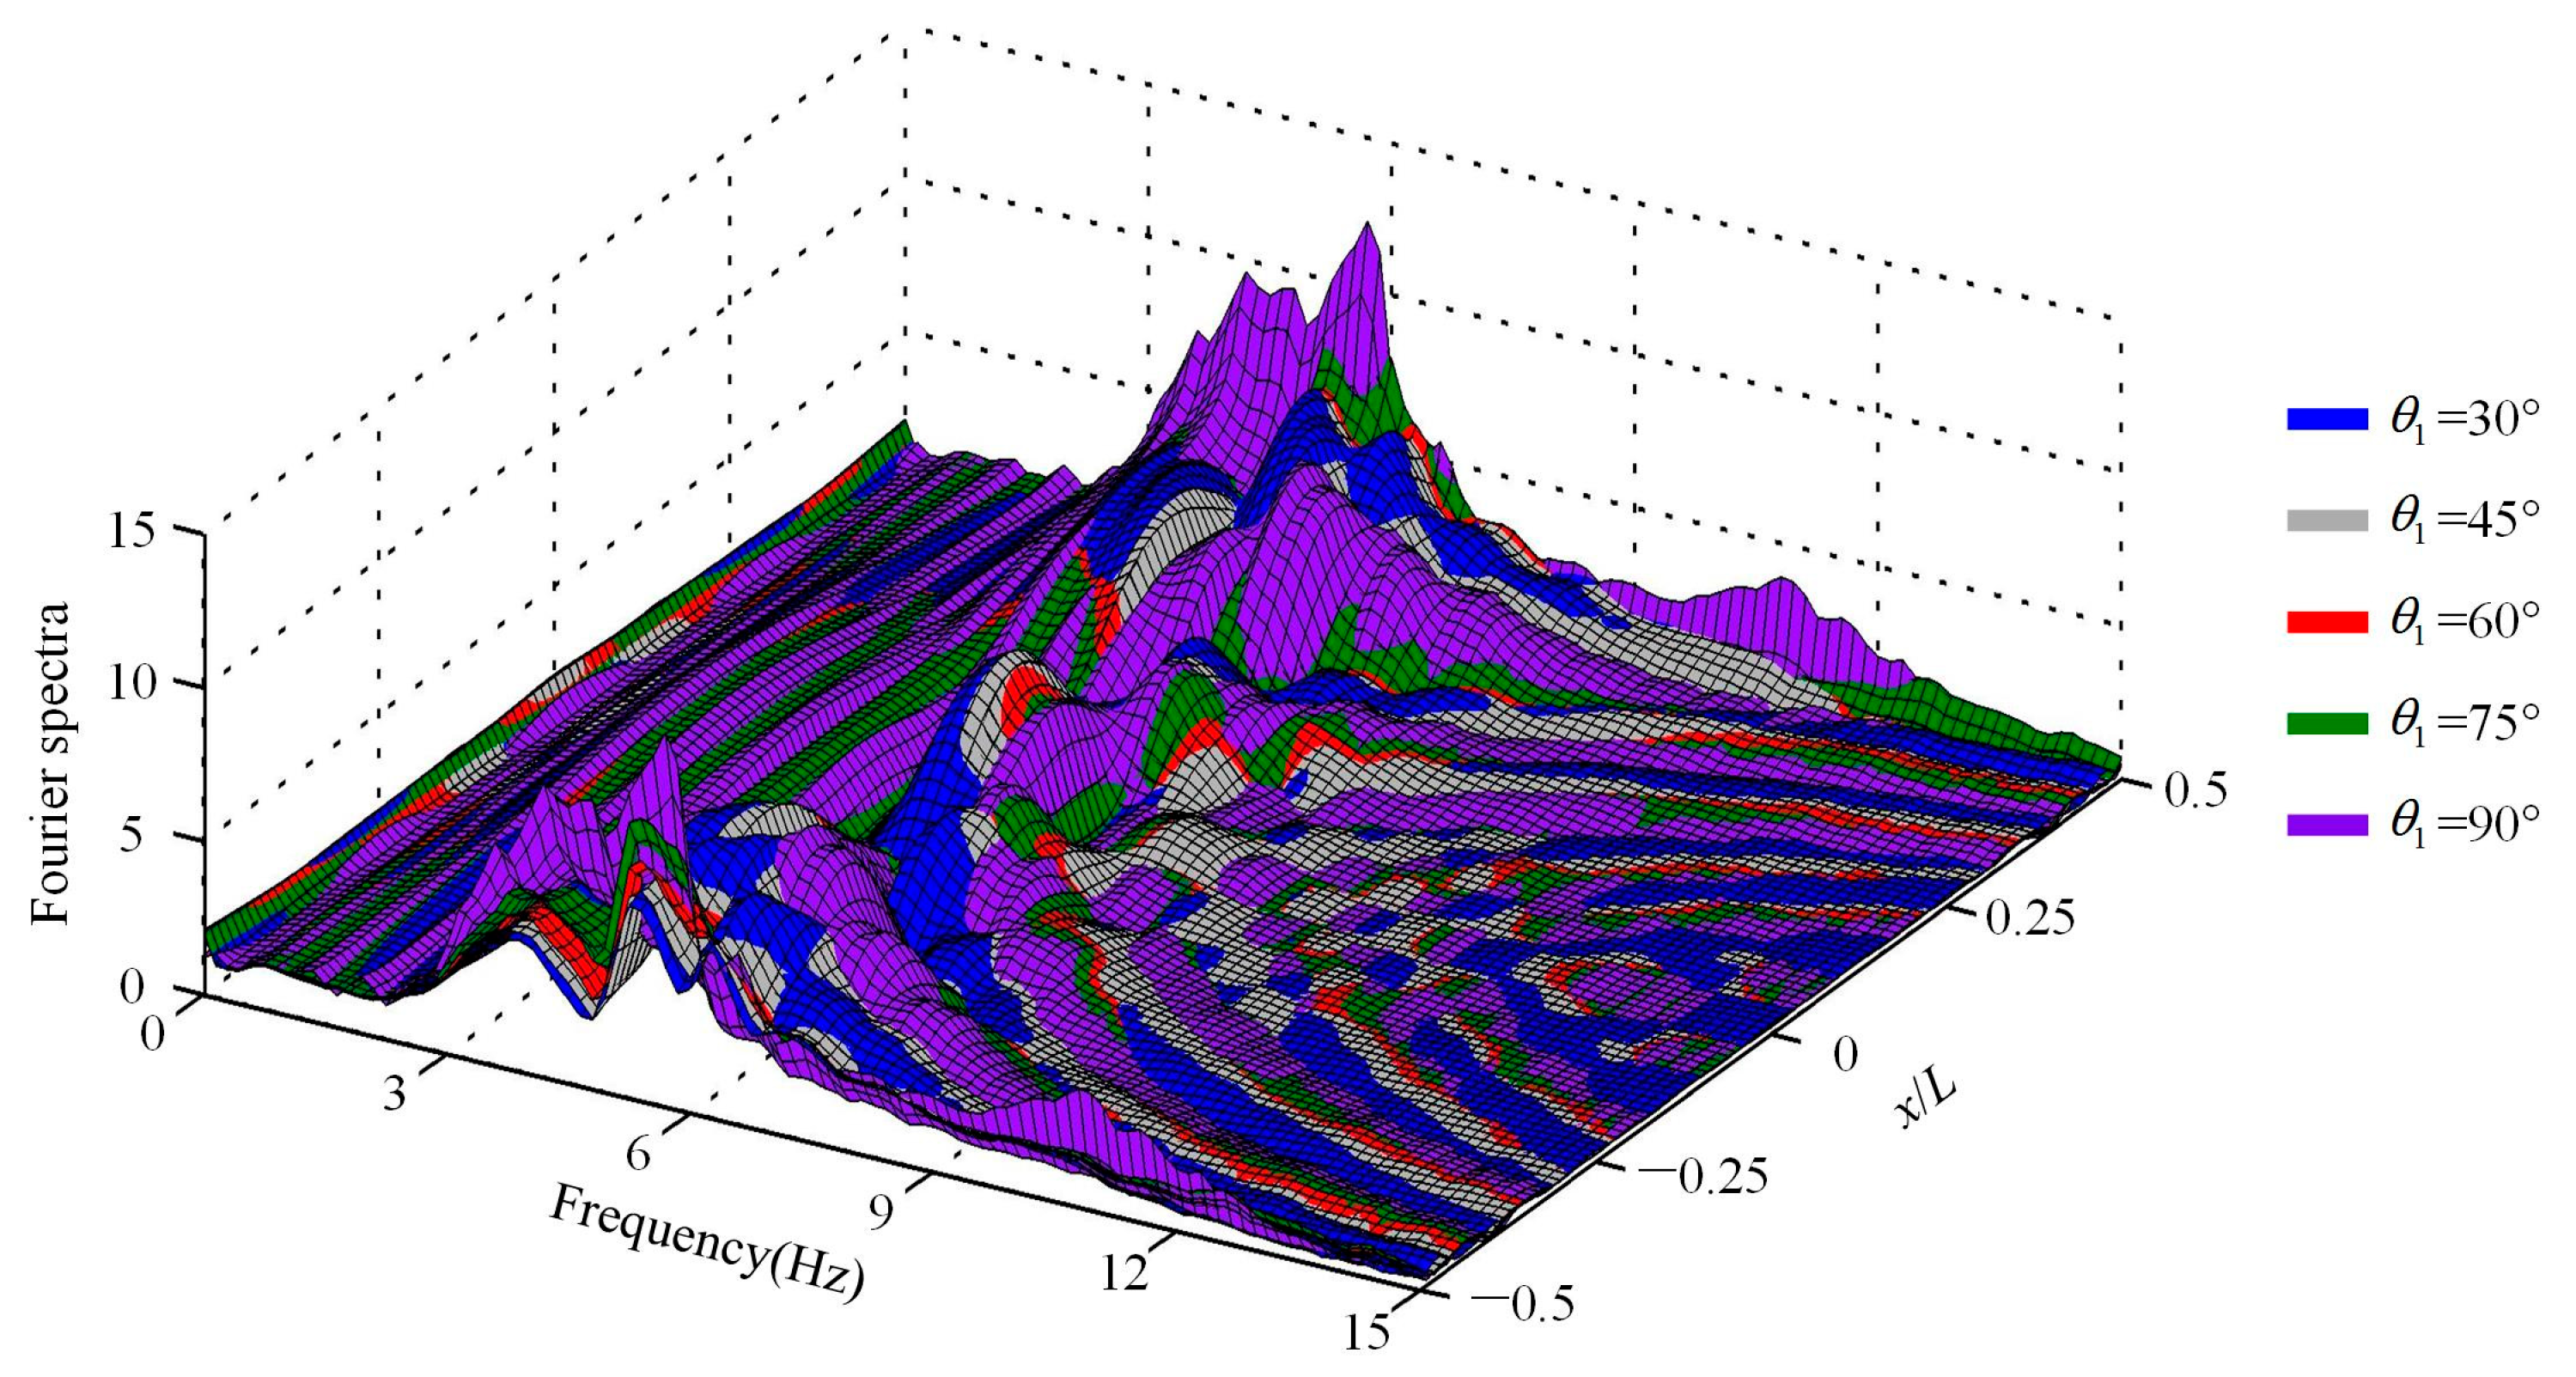
4.5. Slope Gradient of Middle and Bottom Reef Layers
Influenced by complex growth and development conditions and hydrodynamic environments, the reef body exhibits an irregular geometric structure, and the seaward slope varies at different locations. In this section, we further investigate the effect of the steep slope on the seismic response of the reef site. Existing literature [
31] suggests that the seaward slope gradient is typically between 20° and 30° for a depth less than 800 m. Therefore, with other parameters in
Table 2 remaining unchanged, we set the slope gradient of middle and bottom reef layers
θ2,3 as 20°, 25°, 30°, 35°, and 40°, respectively, and establish the corresponding models of the reef-seawater system. The pulse wave and three artificial seismic waves are then input into the numerical models to evaluate the seismic responses.
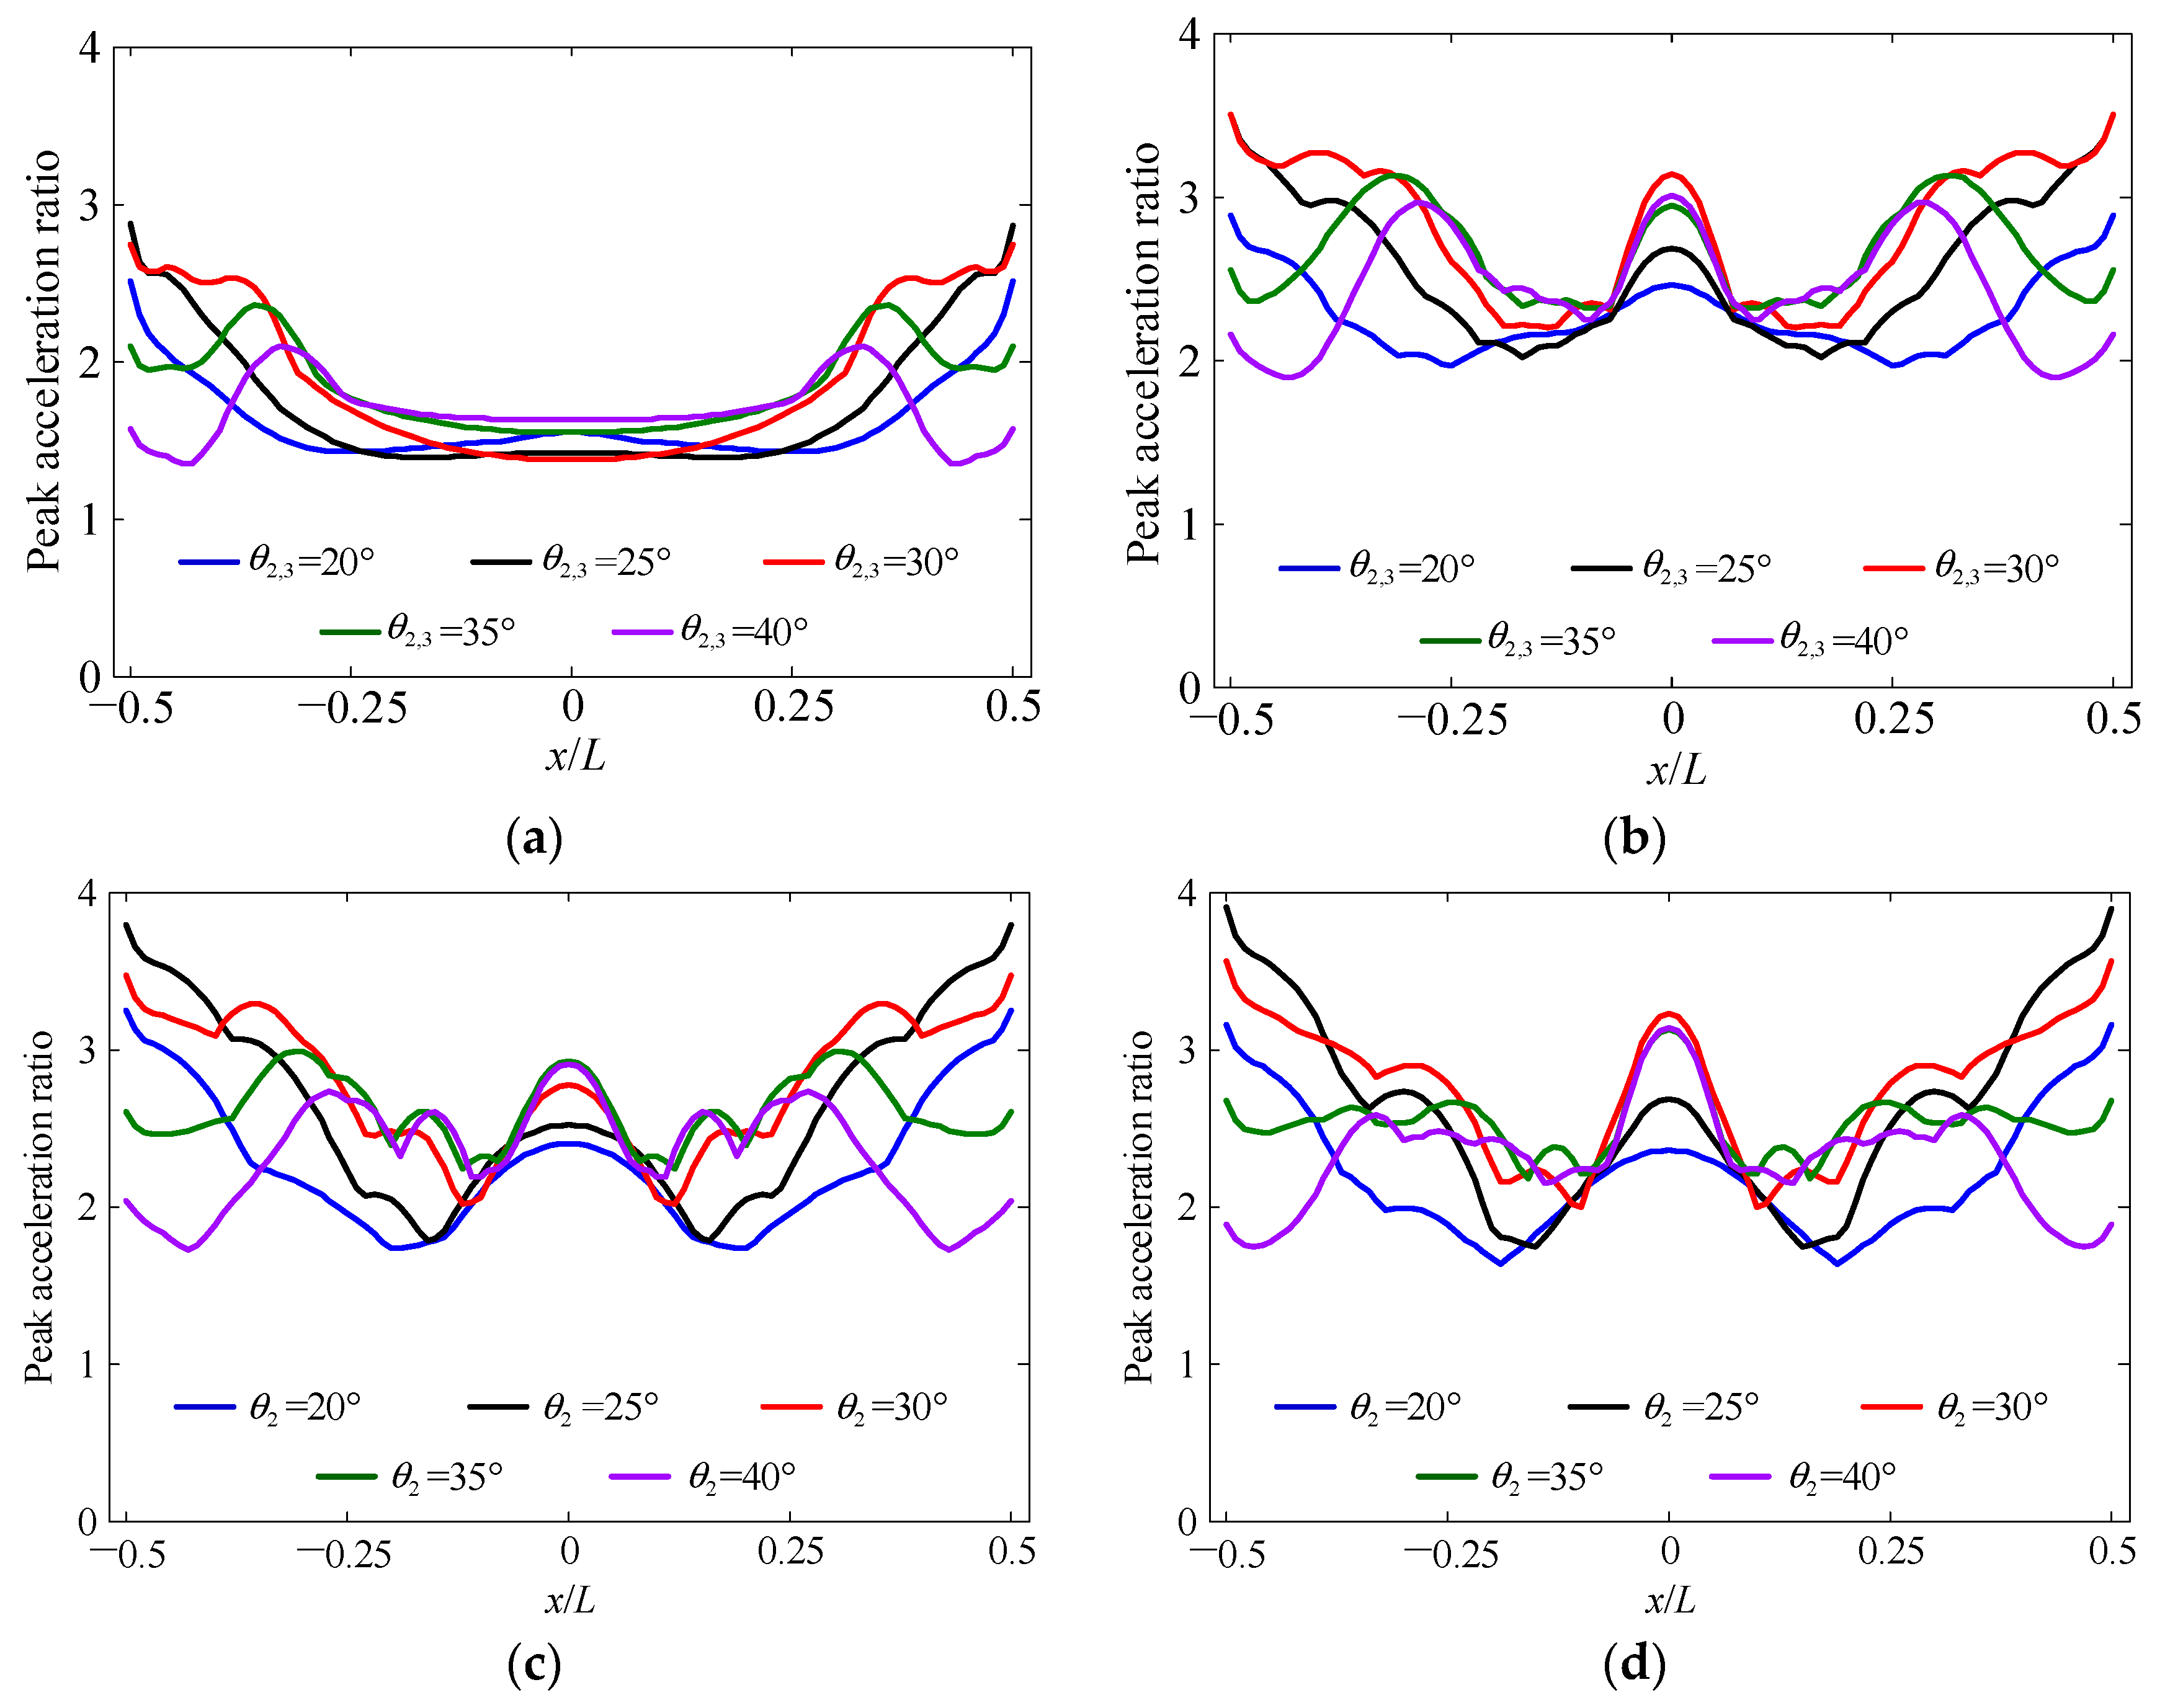
The spatial distributions of the peak acceleration ratios on the reef flat are calculated and shown in
Figure 17, while
Table 7 displays the average peak acceleration ratios along the reef flat.
Both
Figure 17 and
Table 7 show that the seismic response of the reef site shows an increasing trend followed by a decrease as the slope gradient
θ2,3 increases. Interestingly, we observed that the acceleration response was most pronounced at a slope gradient of 30°, particularly in the region near the edge of the reef flat, which suggests that a slope gradient of 30° may be the most unfavorable for the seismic response of the reef engineering site under the vertical incidence of seismic SV waves.
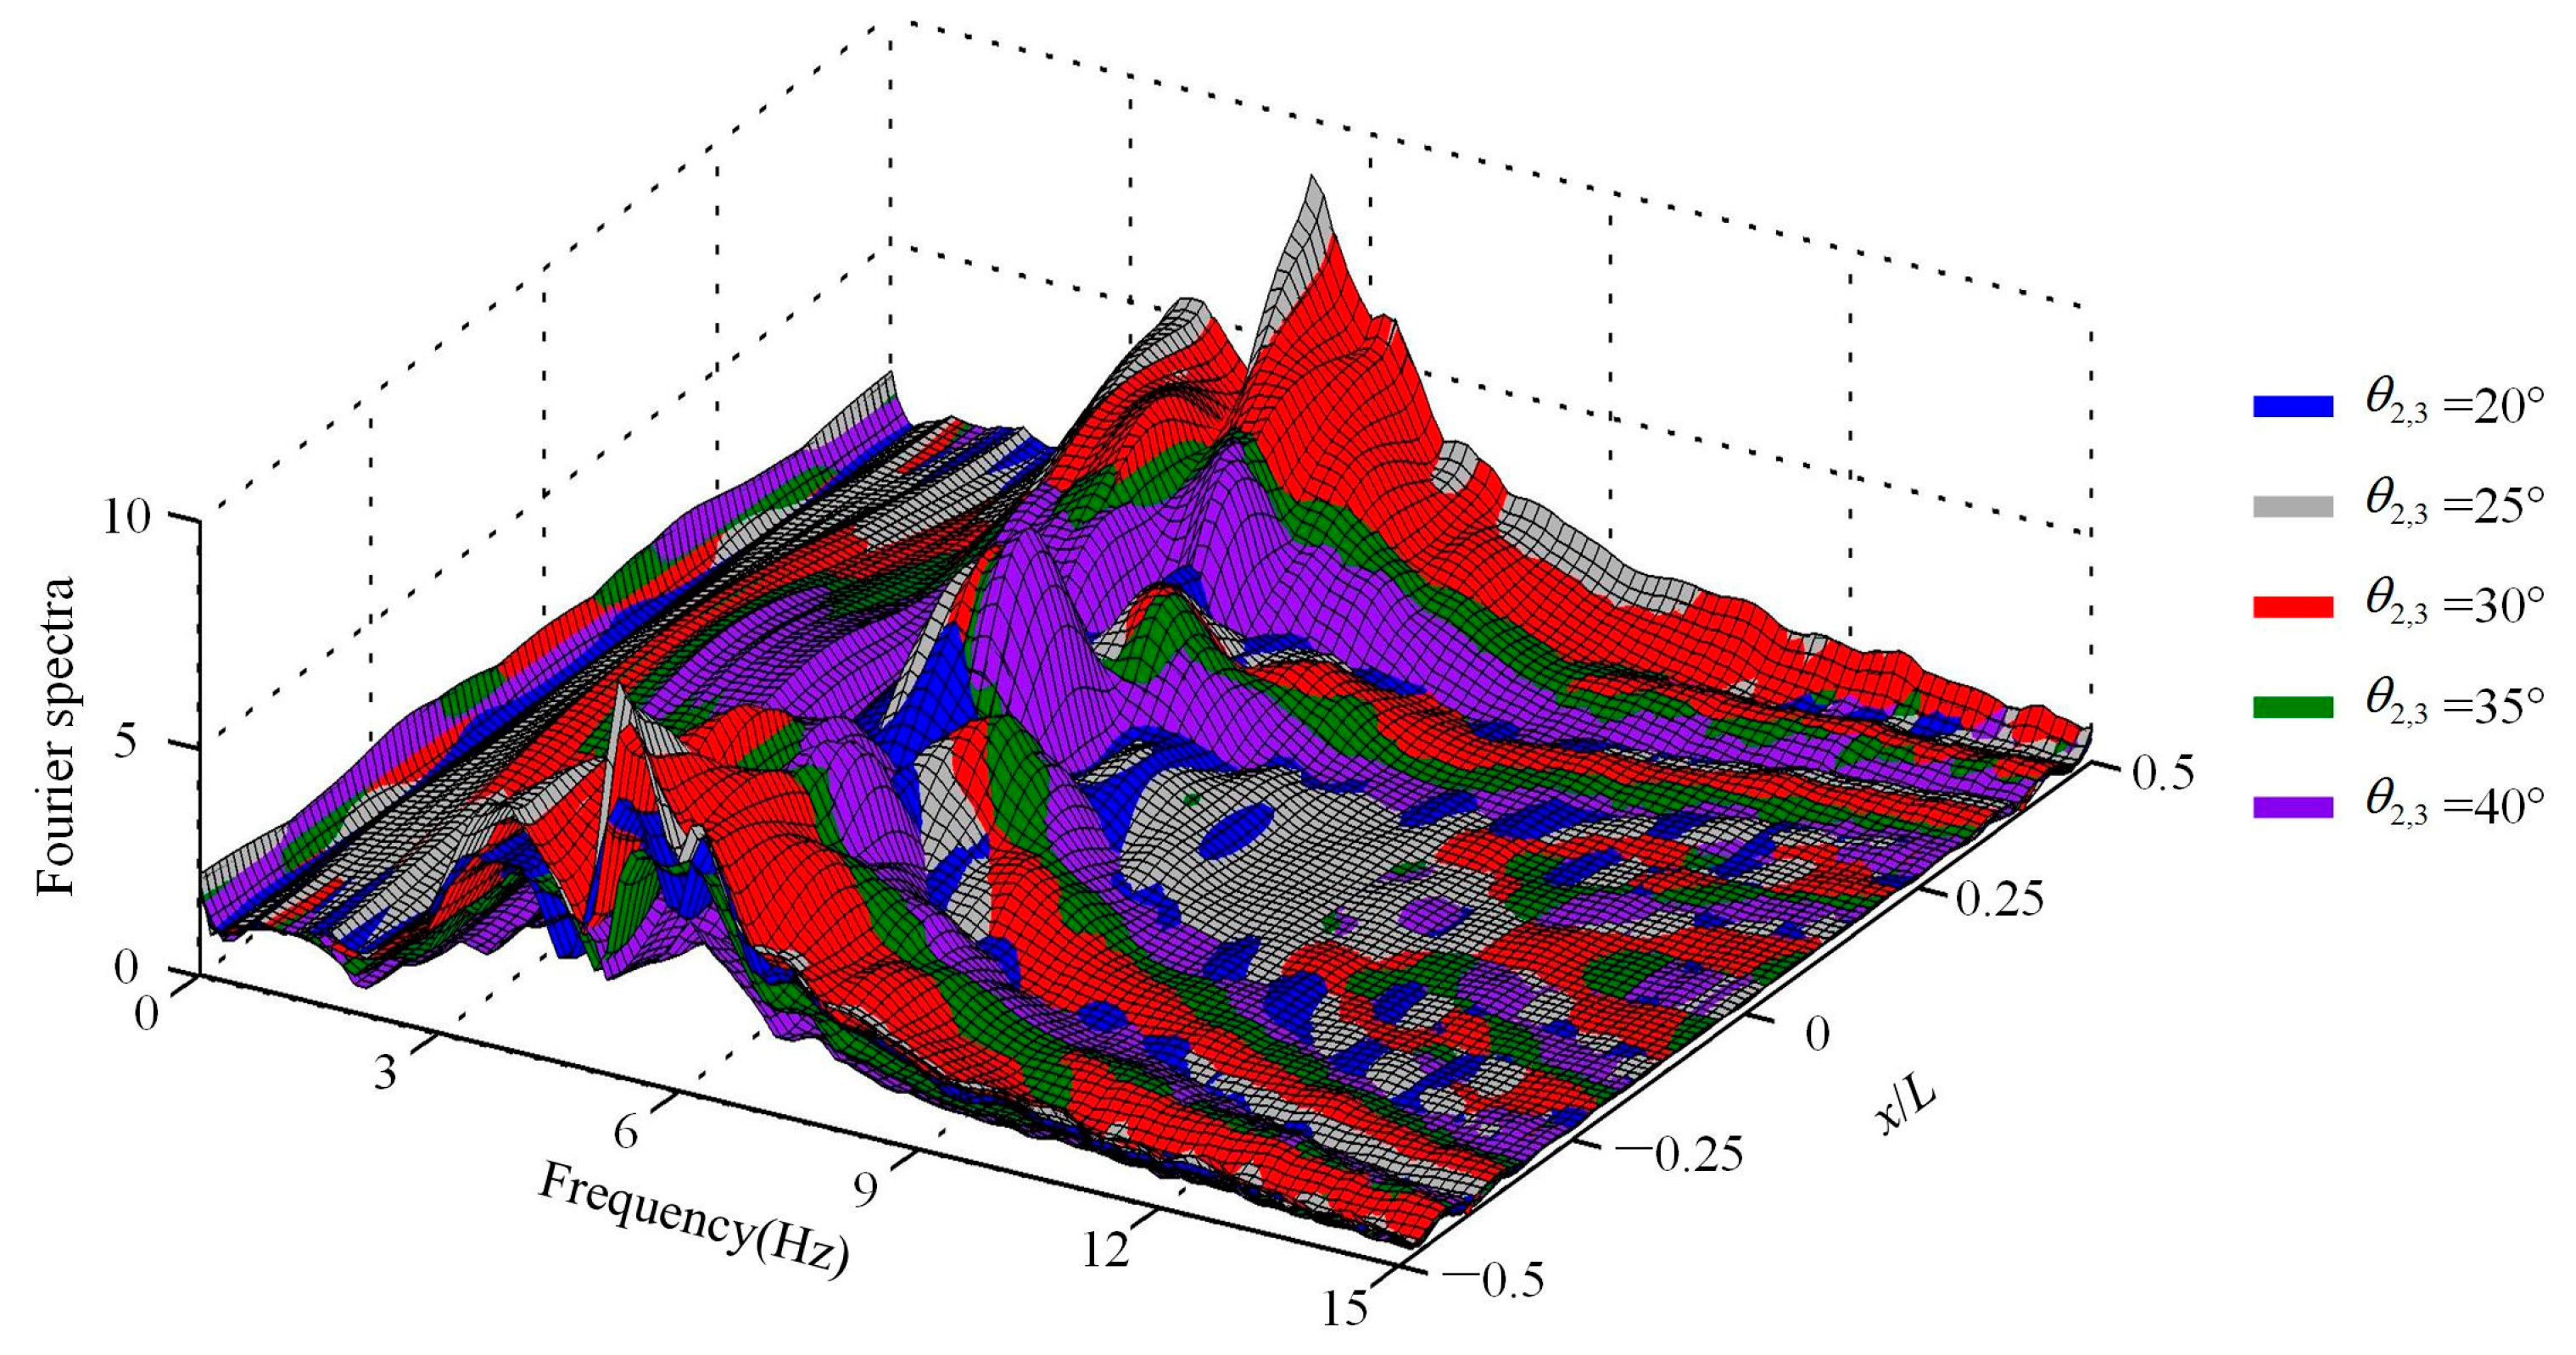
To further explore the above findings, we calculated the three-dimensional distributions of the acceleration spectral ratio
Ha with respect to the frequency and the dimensionless coordinates of the measuring points
x/
L. The results are illustrated in
Figure 18.
According to
Figure 18, for almost any frequency greater than 3 Hz, the acceleration spectral ratio calculated by the model with a slope gradient of 30° reaches a local maximum value in the region near the edge of the reef flat, which is consistent with the spatial distribution of the peak acceleration ratio in
Figure 17. In the middle area of the reef flat, when the frequency is lower than 7 Hz, the acceleration response increases, and the peak component slightly moves towards the high-frequency direction with an increase of
θ2,3. When the frequency is higher than 7 Hz, the acceleration spectral ratios calculated by the models with slopes of 25° and 30° are larger than those obtained by other models. It is worth noting that the complex behavior observed in
Figure 18, where the acceleration spectral ratio calculated by the model with a slope gradient of 30° reaches a local maximum value for almost any frequency greater than 3 Hz, can be attributed to the interplay of multiple factors, including the natural frequency of the site model, the attenuation characteristics of the soil layers, and the incident wave frequency content.
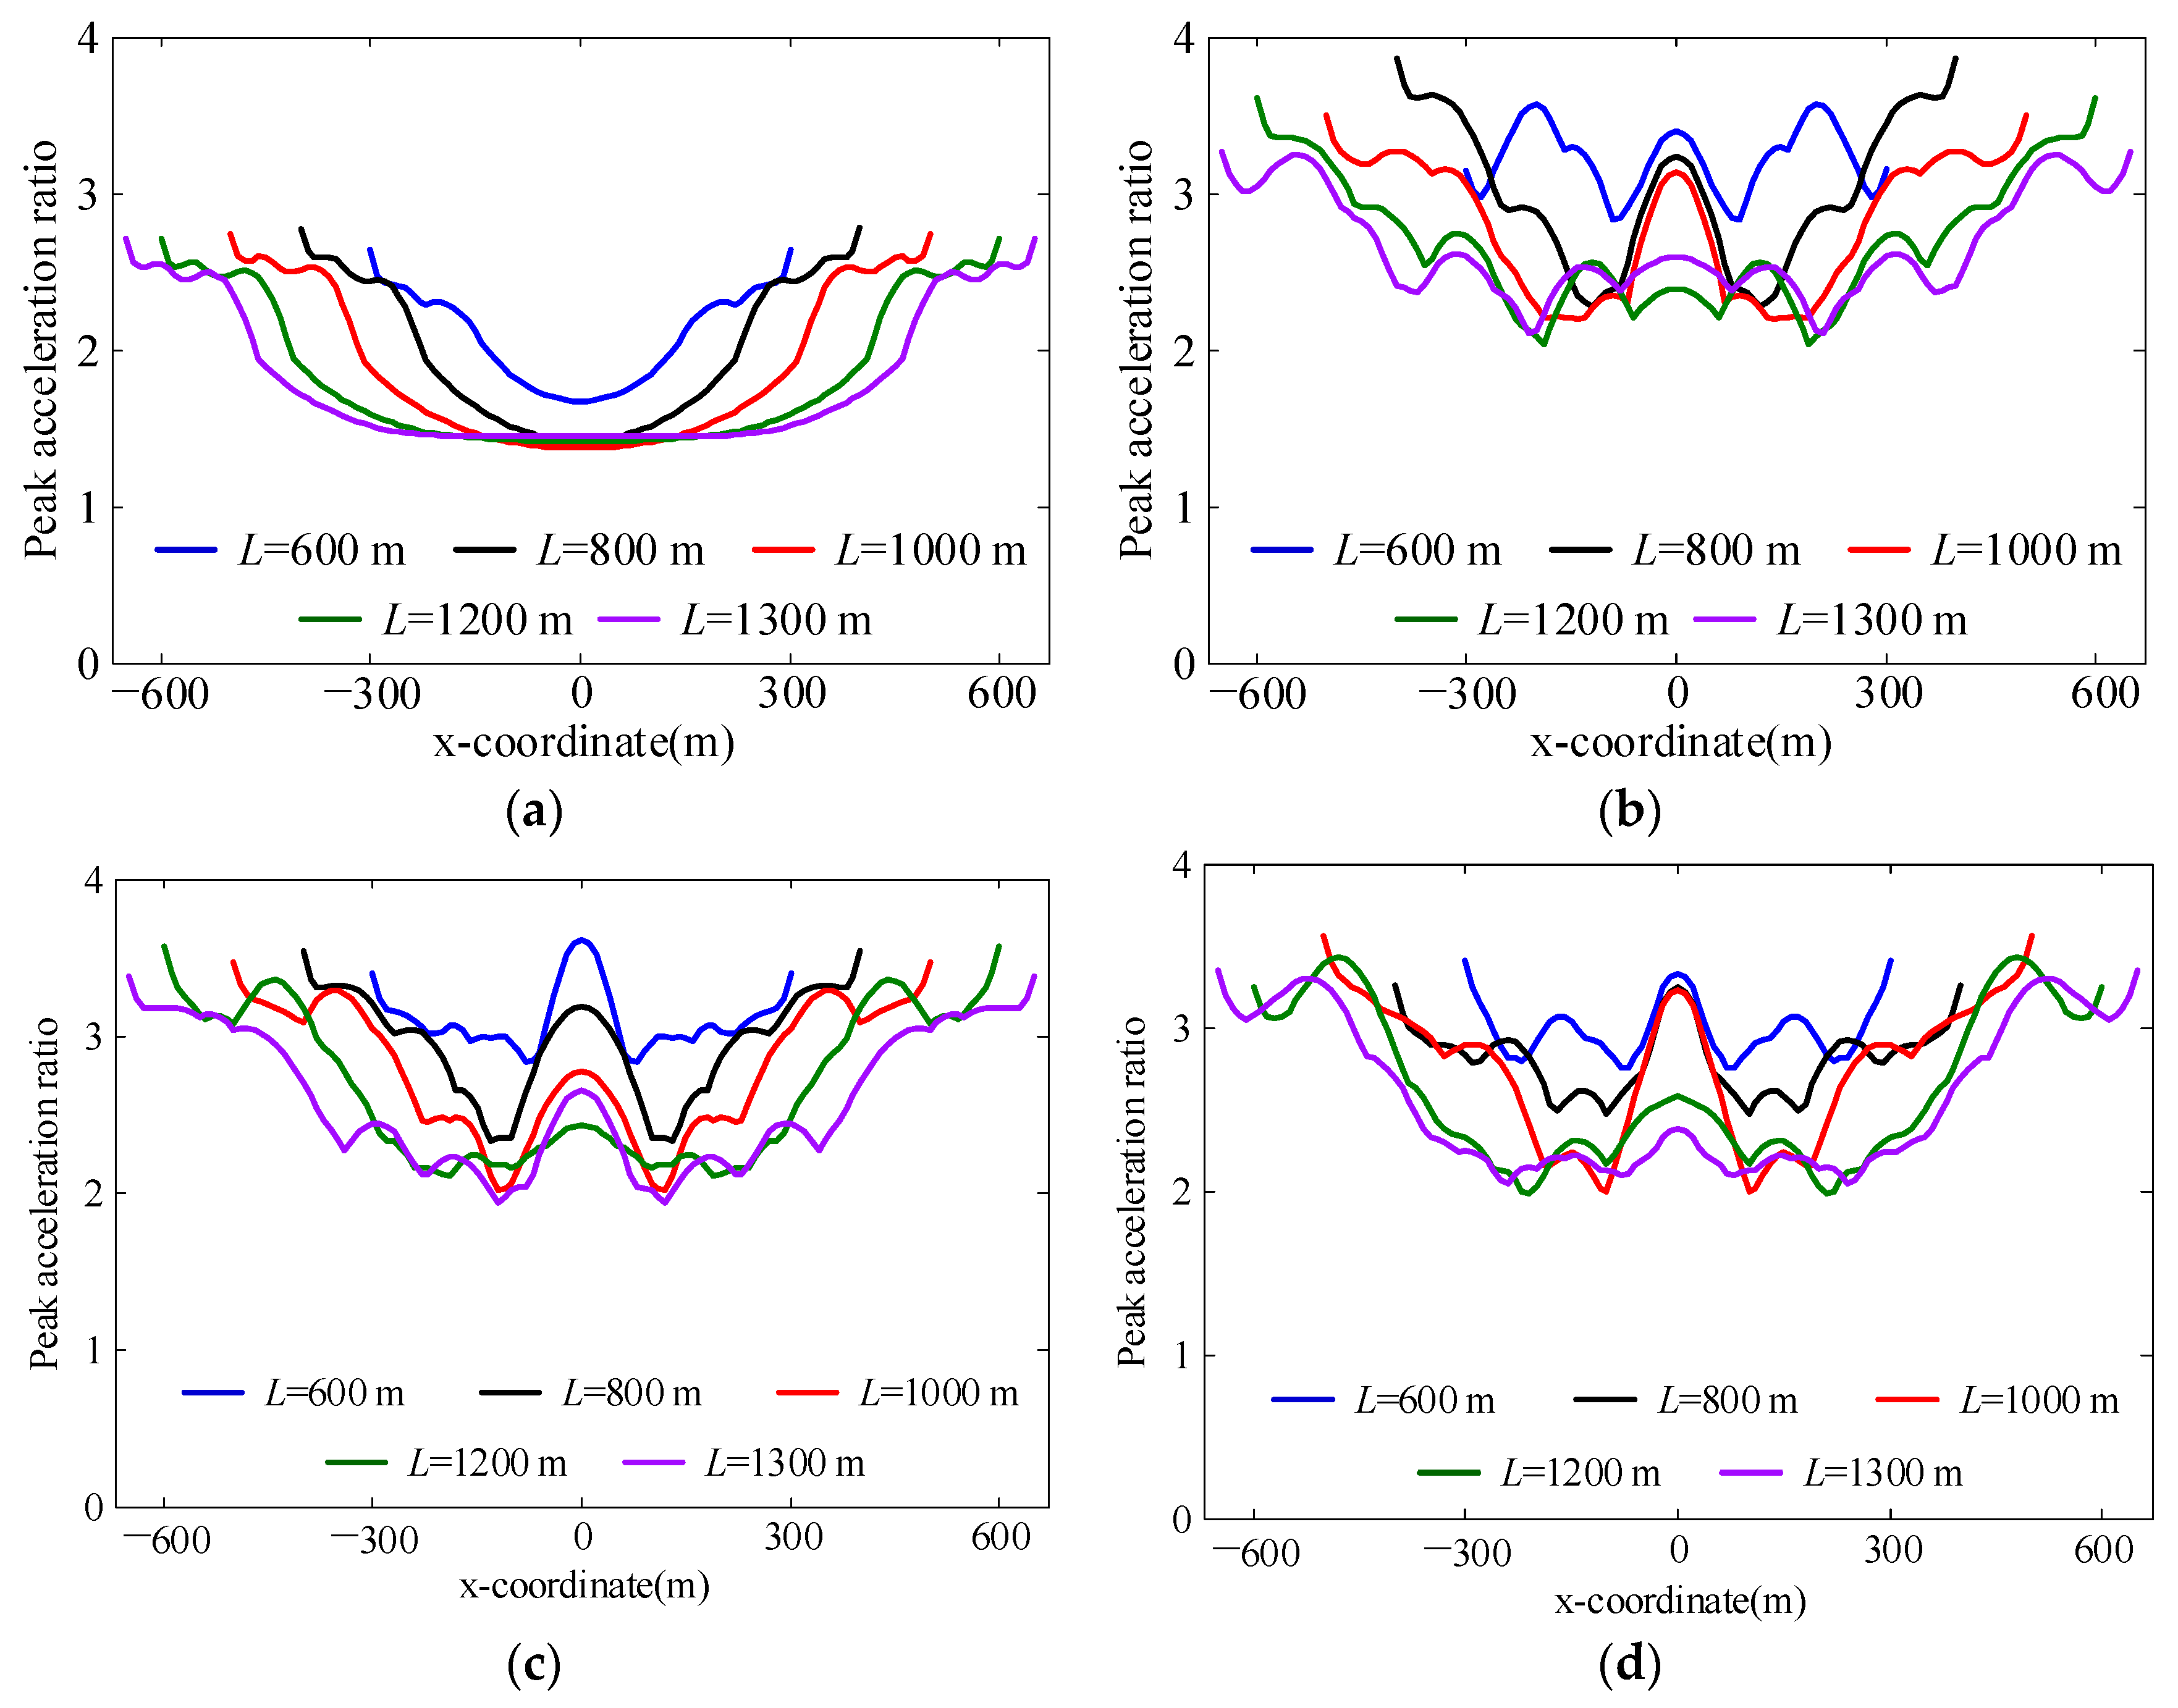
4.6. Width of the Reef Flat
Due to the influence of ocean currents and tides, the reef flats in the South China Sea normally exhibit elongated spindle shapes. Consequently, the width of the 2D cross-sectional models varies at different intercepted locations. It is necessary to study the effect of reef flat width on the seismic response of reef sites. Given that the maximum width of the southwest reef flat at Yongshu Reef is less than 1300 m, we set the width of the reef flat
L to be 600 m, 800 m, 1000 m, 1200 m, and 1300 m, respectively, while keeping all other model parameters in
Table 2 constant, and establish the corresponding reef-seawater models. The pulse wave and three artificial seismic waves are vertically input into the numerical model for dynamic analysis.
The spatial distribution of the peak acceleration ratios of different models is compared in
Figure 19. The average peak acceleration ratios along the reef flat are calculated and presented in
Table 8.
Figure 19 reveals that changes in reef flat width have a negligible effect on the acceleration response near the edge of the reef flat. However, the peak acceleration ratio in the central area of the reef flat notably increases as the reef flat width decreases, corroborating the trend observed in the average peak acceleration ratio with changes in reef flat width, as presented in
Table 8. When subjected to SV waves, the sloping topography generates scattering waves, whose amplitudes gradually decrease as they propagate. With decreasing reef flat width, the attenuation of scattering wave amplitudes becomes less pronounced as they reach the central area of the reef flat. Consequently, the superposition of waves leads to a more significant amplification effect, resulting in a more pronounced seismic peak amplification effect in this region.
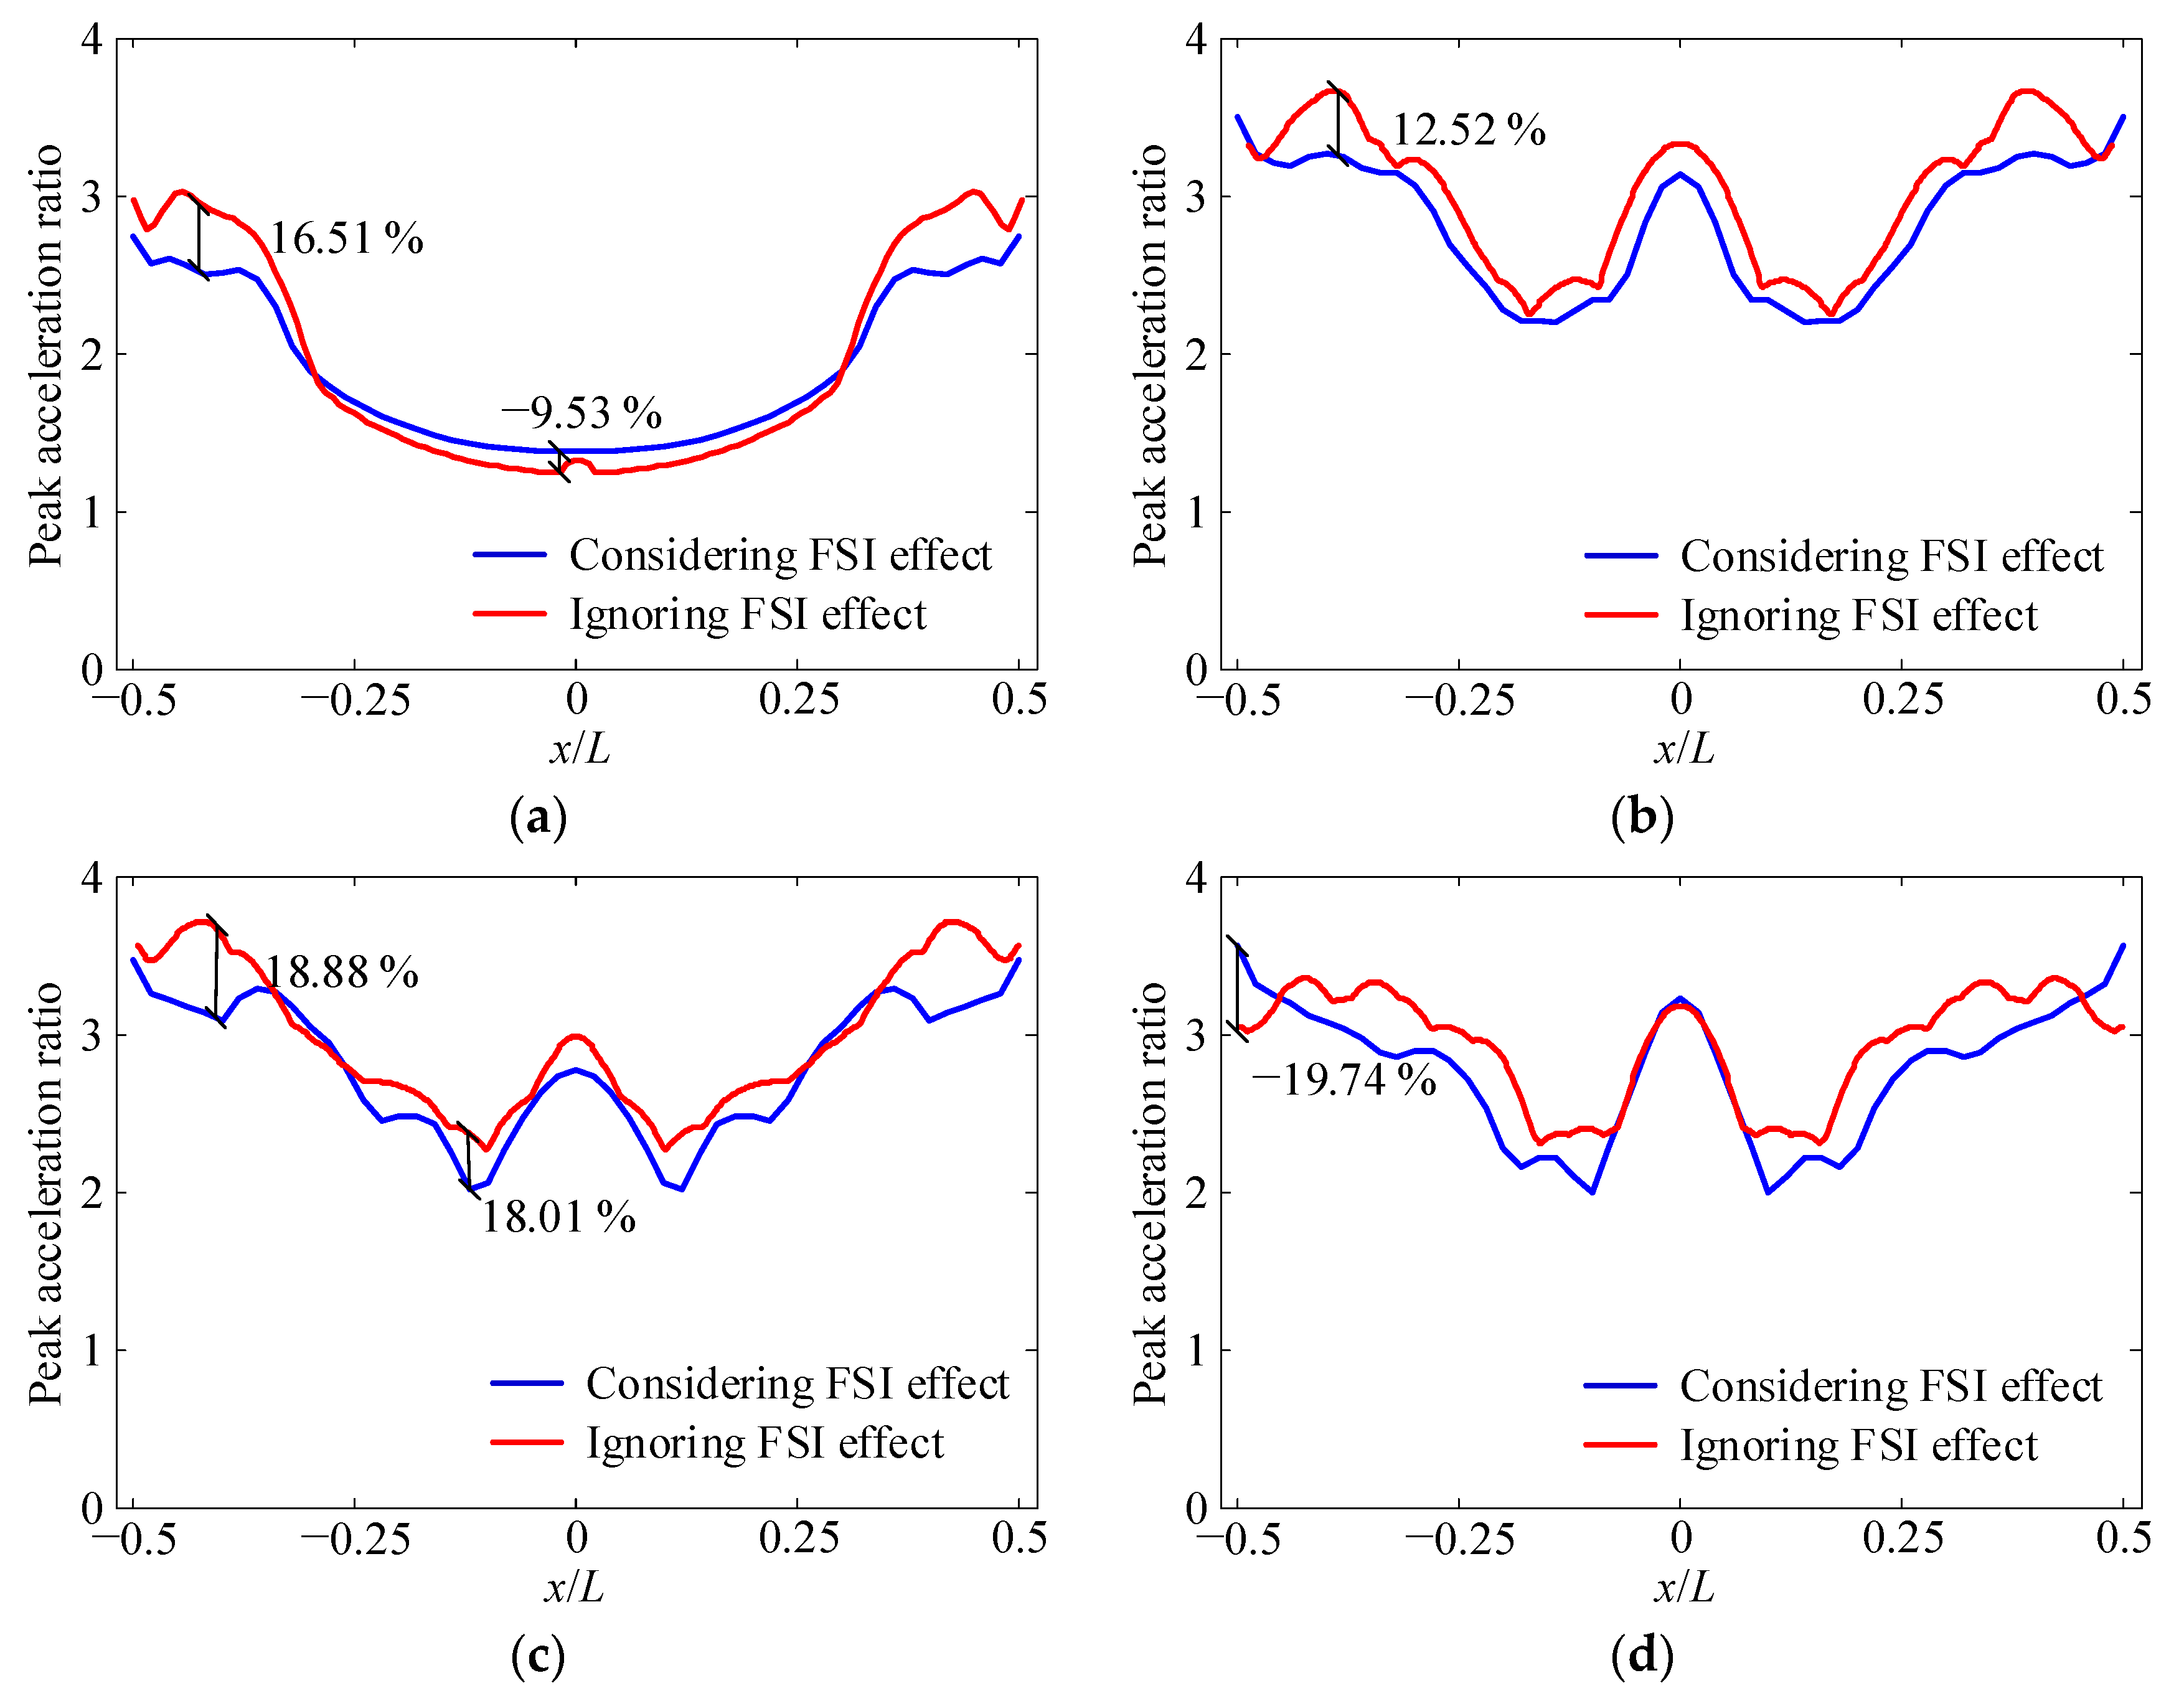
4.7. Fluid-Solid Interaction Effect
The current technical methods and data accumulation regarding site seismic response and safety evaluation are predominantly geared towards onshore engineering sites. However, research on the seismic response of offshore engineering sites remains relatively limited. One of the key differences between mechanical models of offshore sites and onshore sites is whether to consider the dynamic coupling effect of the surrounding seawater layer. To gain a better understanding of the dynamic response characteristics of the reef-seawater system, it is imperative to analyze the influence of FSI on the seismic response of reef sites.
The onshore site model (non-FSI model) corresponding to the reef-seawater model (FSI model) established in this study can be obtained by removing the fluid elements and fluid artificial boundaries in the finite element model of the reef-seawater system. Then, by using the BSM, the selected seismic waves can be input into the non-FSI model, and then the dynamic analysis can be conducted.
The peak acceleration ratios of the FSI and non-FSI models are calculated and compared, as shown in
Figure 20. The average peak acceleration ratios of these two models and their relative deviations are calculated and presented in
Table 9.
The results in
Table 9 show that, on average, the seismic response of the non-FSI model is slightly higher than that of the FSI model. For the pulse wave incidence, the relative deviation of the average peak acceleration ratio between the two models is 2.12%, while for the three seismic wave incidences, the relative deviation ranges from 6% to 7%.
Figure 20 reveals that the difference between the calculation results of these two models is most pronounced near the edge of the reef flat, where the maximum local relative deviation can be as high as 20%. Furthermore, it is observed that the local acceleration seismic response of the FSI model is greater than that of the non-FSI model in the central area under pulse wave incidence and in the edge area under seismic wave C incidence. This finding indicates that although the FSI effect generally reduces the site seismic response on average, the local seismic response in some areas may be amplified.
Figure 21 shows the distributions of the acceleration spectral ratio of the site models considering and ignoring the FSI effect. The distribution patterns of the acceleration Fourier spectrum ratios are similar for both the FSI and non-FSI models. The primary components of
Ha obtained from these two models are situated in the frequency range of 2 Hz to 8 Hz. However, for most frequency intervals, the acceleration response of the onshore site is higher than that of the reef site, which is in line with the distribution patterns observed in the time domain.
In the near-field finite element model of the reef-seawater system, seismic energy is input from the bottom of the model, and a portion of it is reflected and scattered by the interlayer interfaces and reef terrain before being finally absorbed by the solid artificial boundaries. Due to the coupling effect between the reef and seawater, the remaining portion is transmitted into the fluid medium in the form of compression waves, propagating outward until being absorbed by the fluid’s artificial boundaries at the cutoff positions. To elaborate further, the seawater layer acts as a radiation damping mechanism, which absorbs and dissipates a significant amount of seismic energy as it propagates outward from the reef. This leads to a reduction in the amplitude of seismic waves that reach the reef flat, which in turn reduces the overall seismic response of the reef site. Additionally, the seawater layer also affects the dynamic characteristics of the reef site, such as the resonance frequency and amplification factor, by altering the spatial distribution of the seismic waves on the reef flat.
5. Conclusions
Insufficient data accumulation and inadequate knowledge of the seismic impact of reef terrain, geology, and material characteristics of the reefs in the South China Sea remain major obstacles in studying the seismic response of reef engineering sites and evaluating their seismic safety. To overcome this challenge, a seismic response analysis model of the reef-seawater system is constructed in this study. This model takes into account a comprehensive range of factors, including the fluid-solid interaction effect, the wave radiation effect of the infinite seawater layer and semi-infinite seabed, as well as the seismic wave input process of the reef-seawater system. We select several key parameters that influence the seismic response of reef sites, establish a series of finite element models of the reef-seawater system, and conduct targeted parameter analyses. Based on the results of this study, the following conclusions can be drawn:
- (1)
The seismic response of the reef site is significantly amplified near the edge of the reef flat when the shear wave velocity of the topmost reef layer decreases from 700 m/s to 300 m/s and its thickness increases from 10 m to 30 m, resulting in average acceleration peak ratios that can be amplified by 149% and 115%, respectively.
- (2)
The slope gradient of the middle and bottom reef layers at 30° has the most adverse impact on the seismic response of the reef site under the vertical incidence of seismic SV waves.
- (3)
The amplitude attenuation of scattering waves generated by the sloping topography decreases as the propagation distance increases. The reduction in reef flat width leads to a more significant wave superposition effect, resulting in a more significant seismic peak amplification effect.
- (4)
Accounting for the fluid-structure interaction effect, the average seismic response of the reef site can be reduced by approximately 6–7% compared to that of the non-FSI model, with the maximum local relative deviation reaching up to 20% near the edge of the reef flat.
Overall, the obtained numerical results provide important insights into the seismic response of reef engineering sites, with specific quantitative values and trends that highlight the significance of various factors.
It is important to note that the numerical models employed in this study primarily focus on the seismic response of the reef limestone site and therefore do not account for the complex nonlinear behavior of the coral sand. Additionally, the reef structure is assumed to be vertically layered, and any potential horizontal inconsistency is disregarded. Therefore, to investigate the detailed dynamic behavior of important reef engineering sites, specific topographical surveys and deep material property testing are required. Based on these investigations, further seismic response studies can be conducted using the proposed analytical model of the reef seawater system.


