

Computing Vegetation Indices from the Satellite Images Using GRASS GIS Scripts for Monitoring Mangrove Forests in the Coastal Landscapes of Niger Delta, Nigeria


Abstract
:1. Introduction
1.1. Background
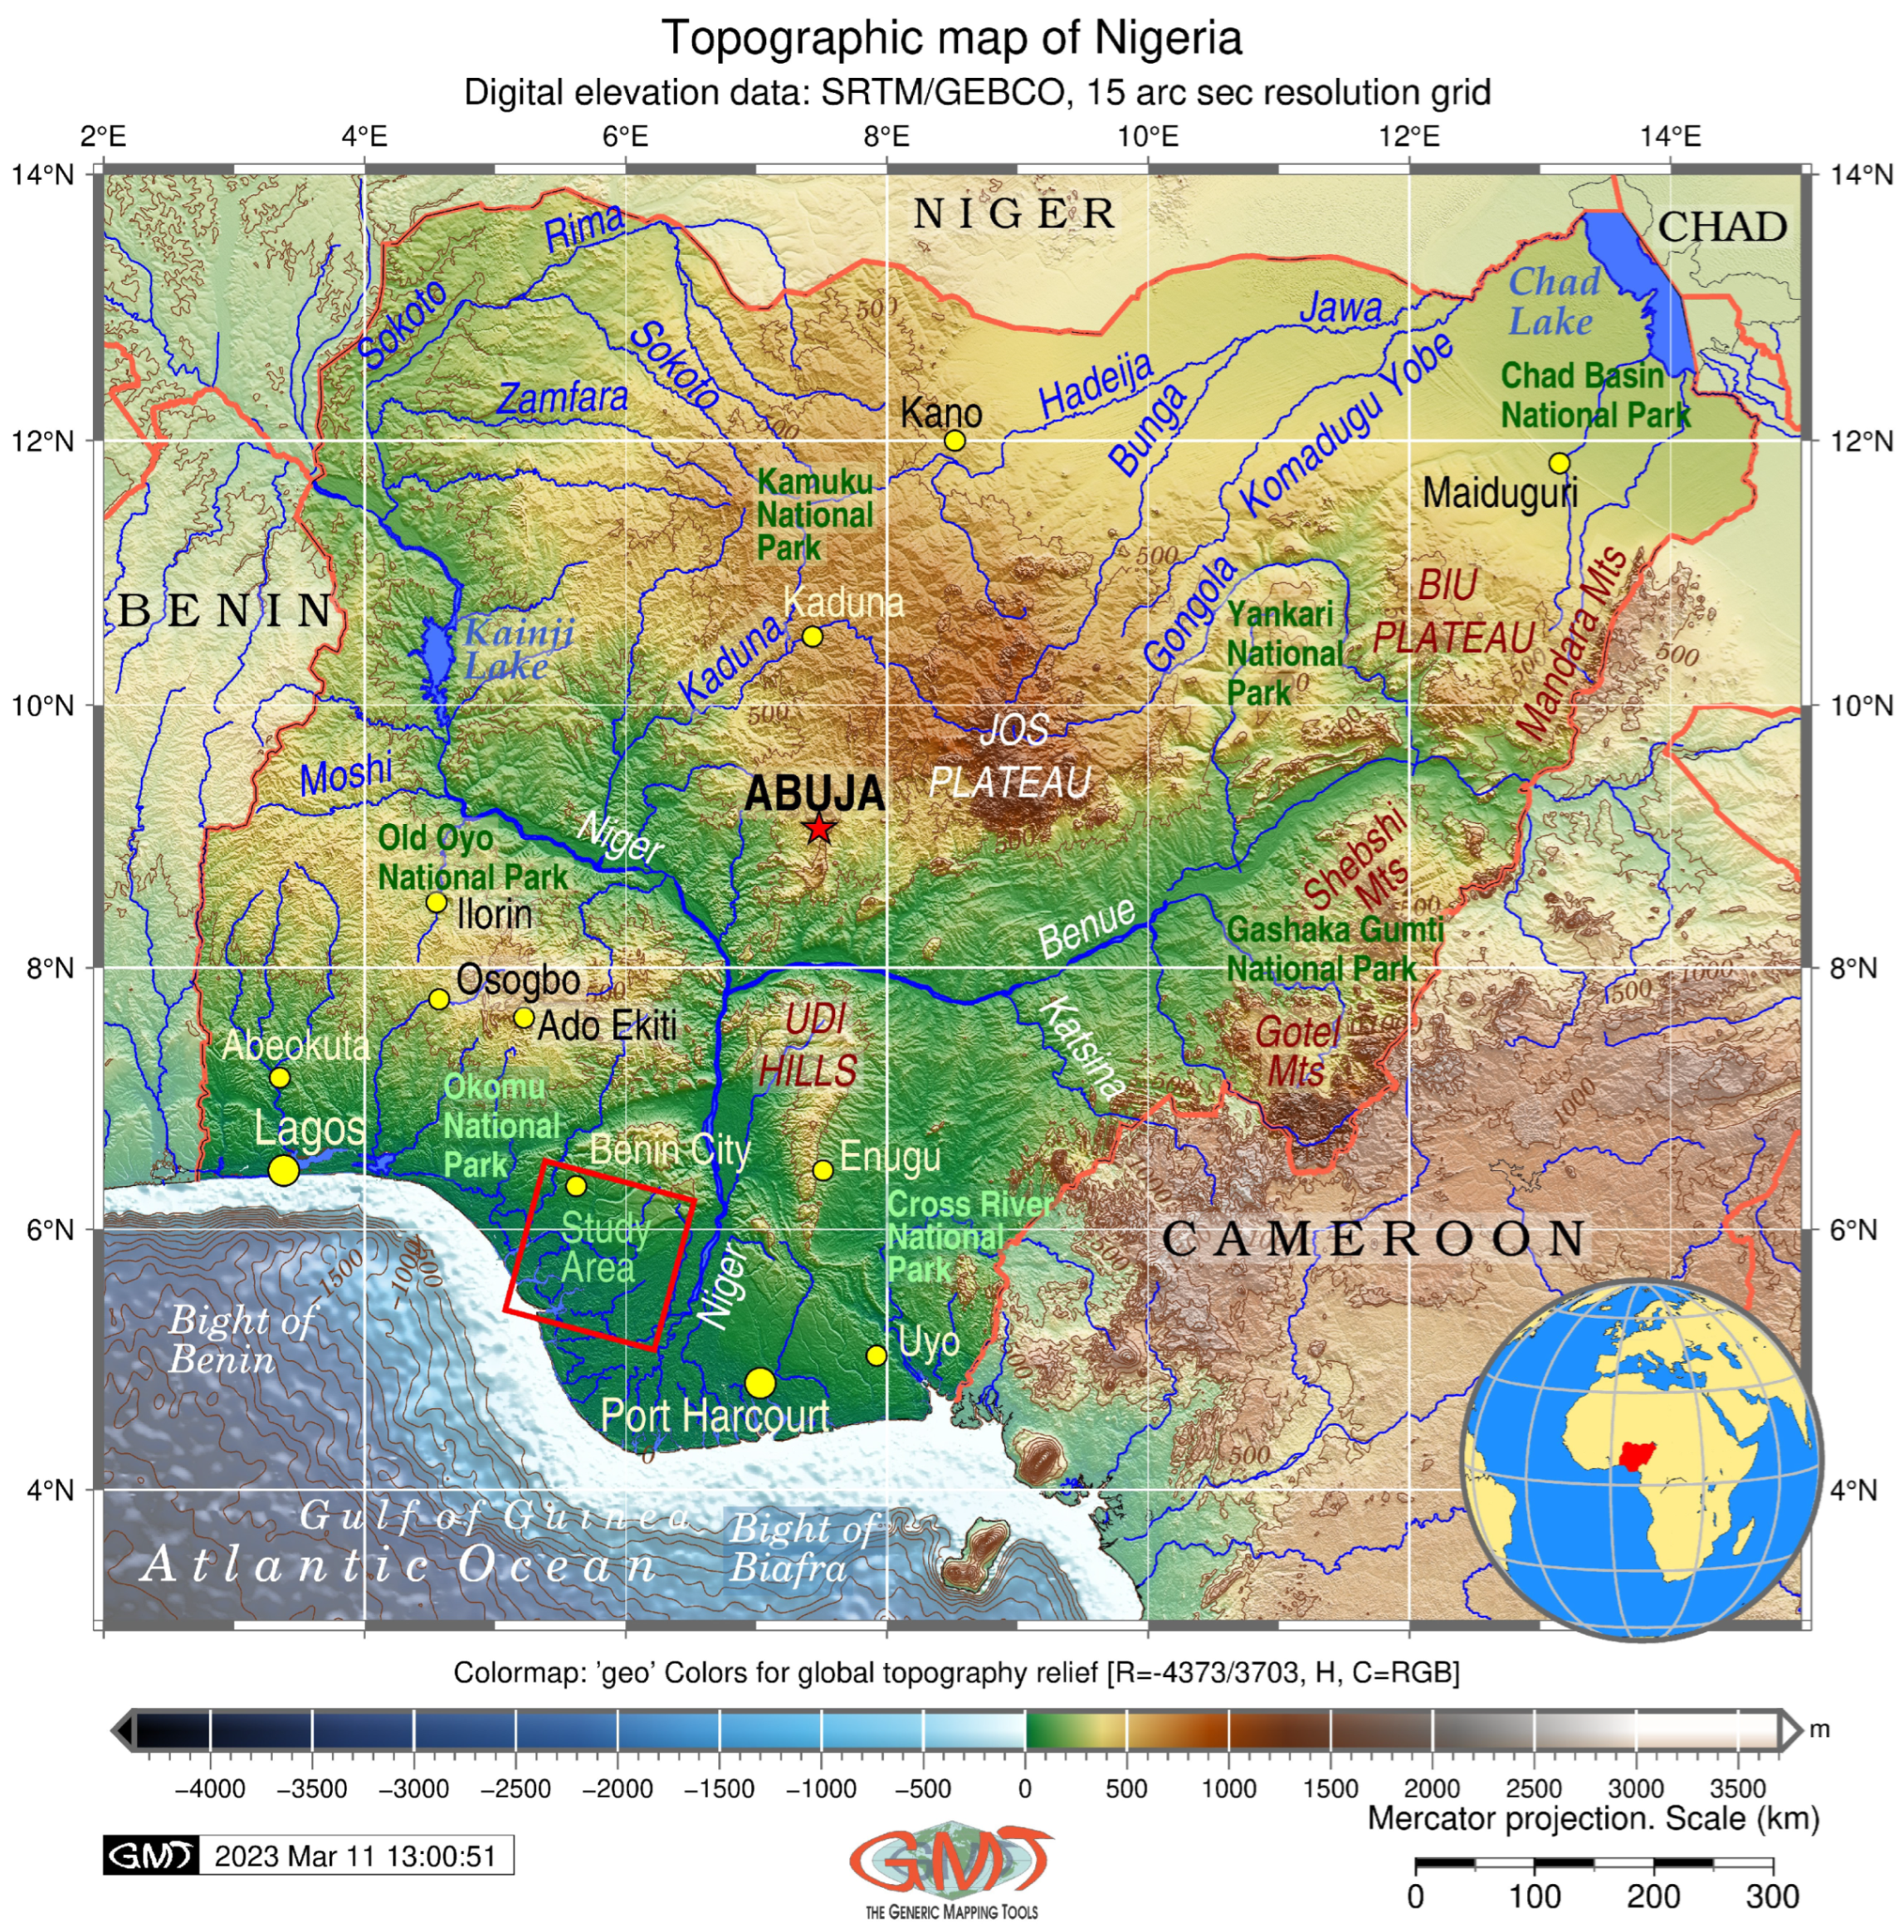
1.2. Study Focus
2. Materials and Methods
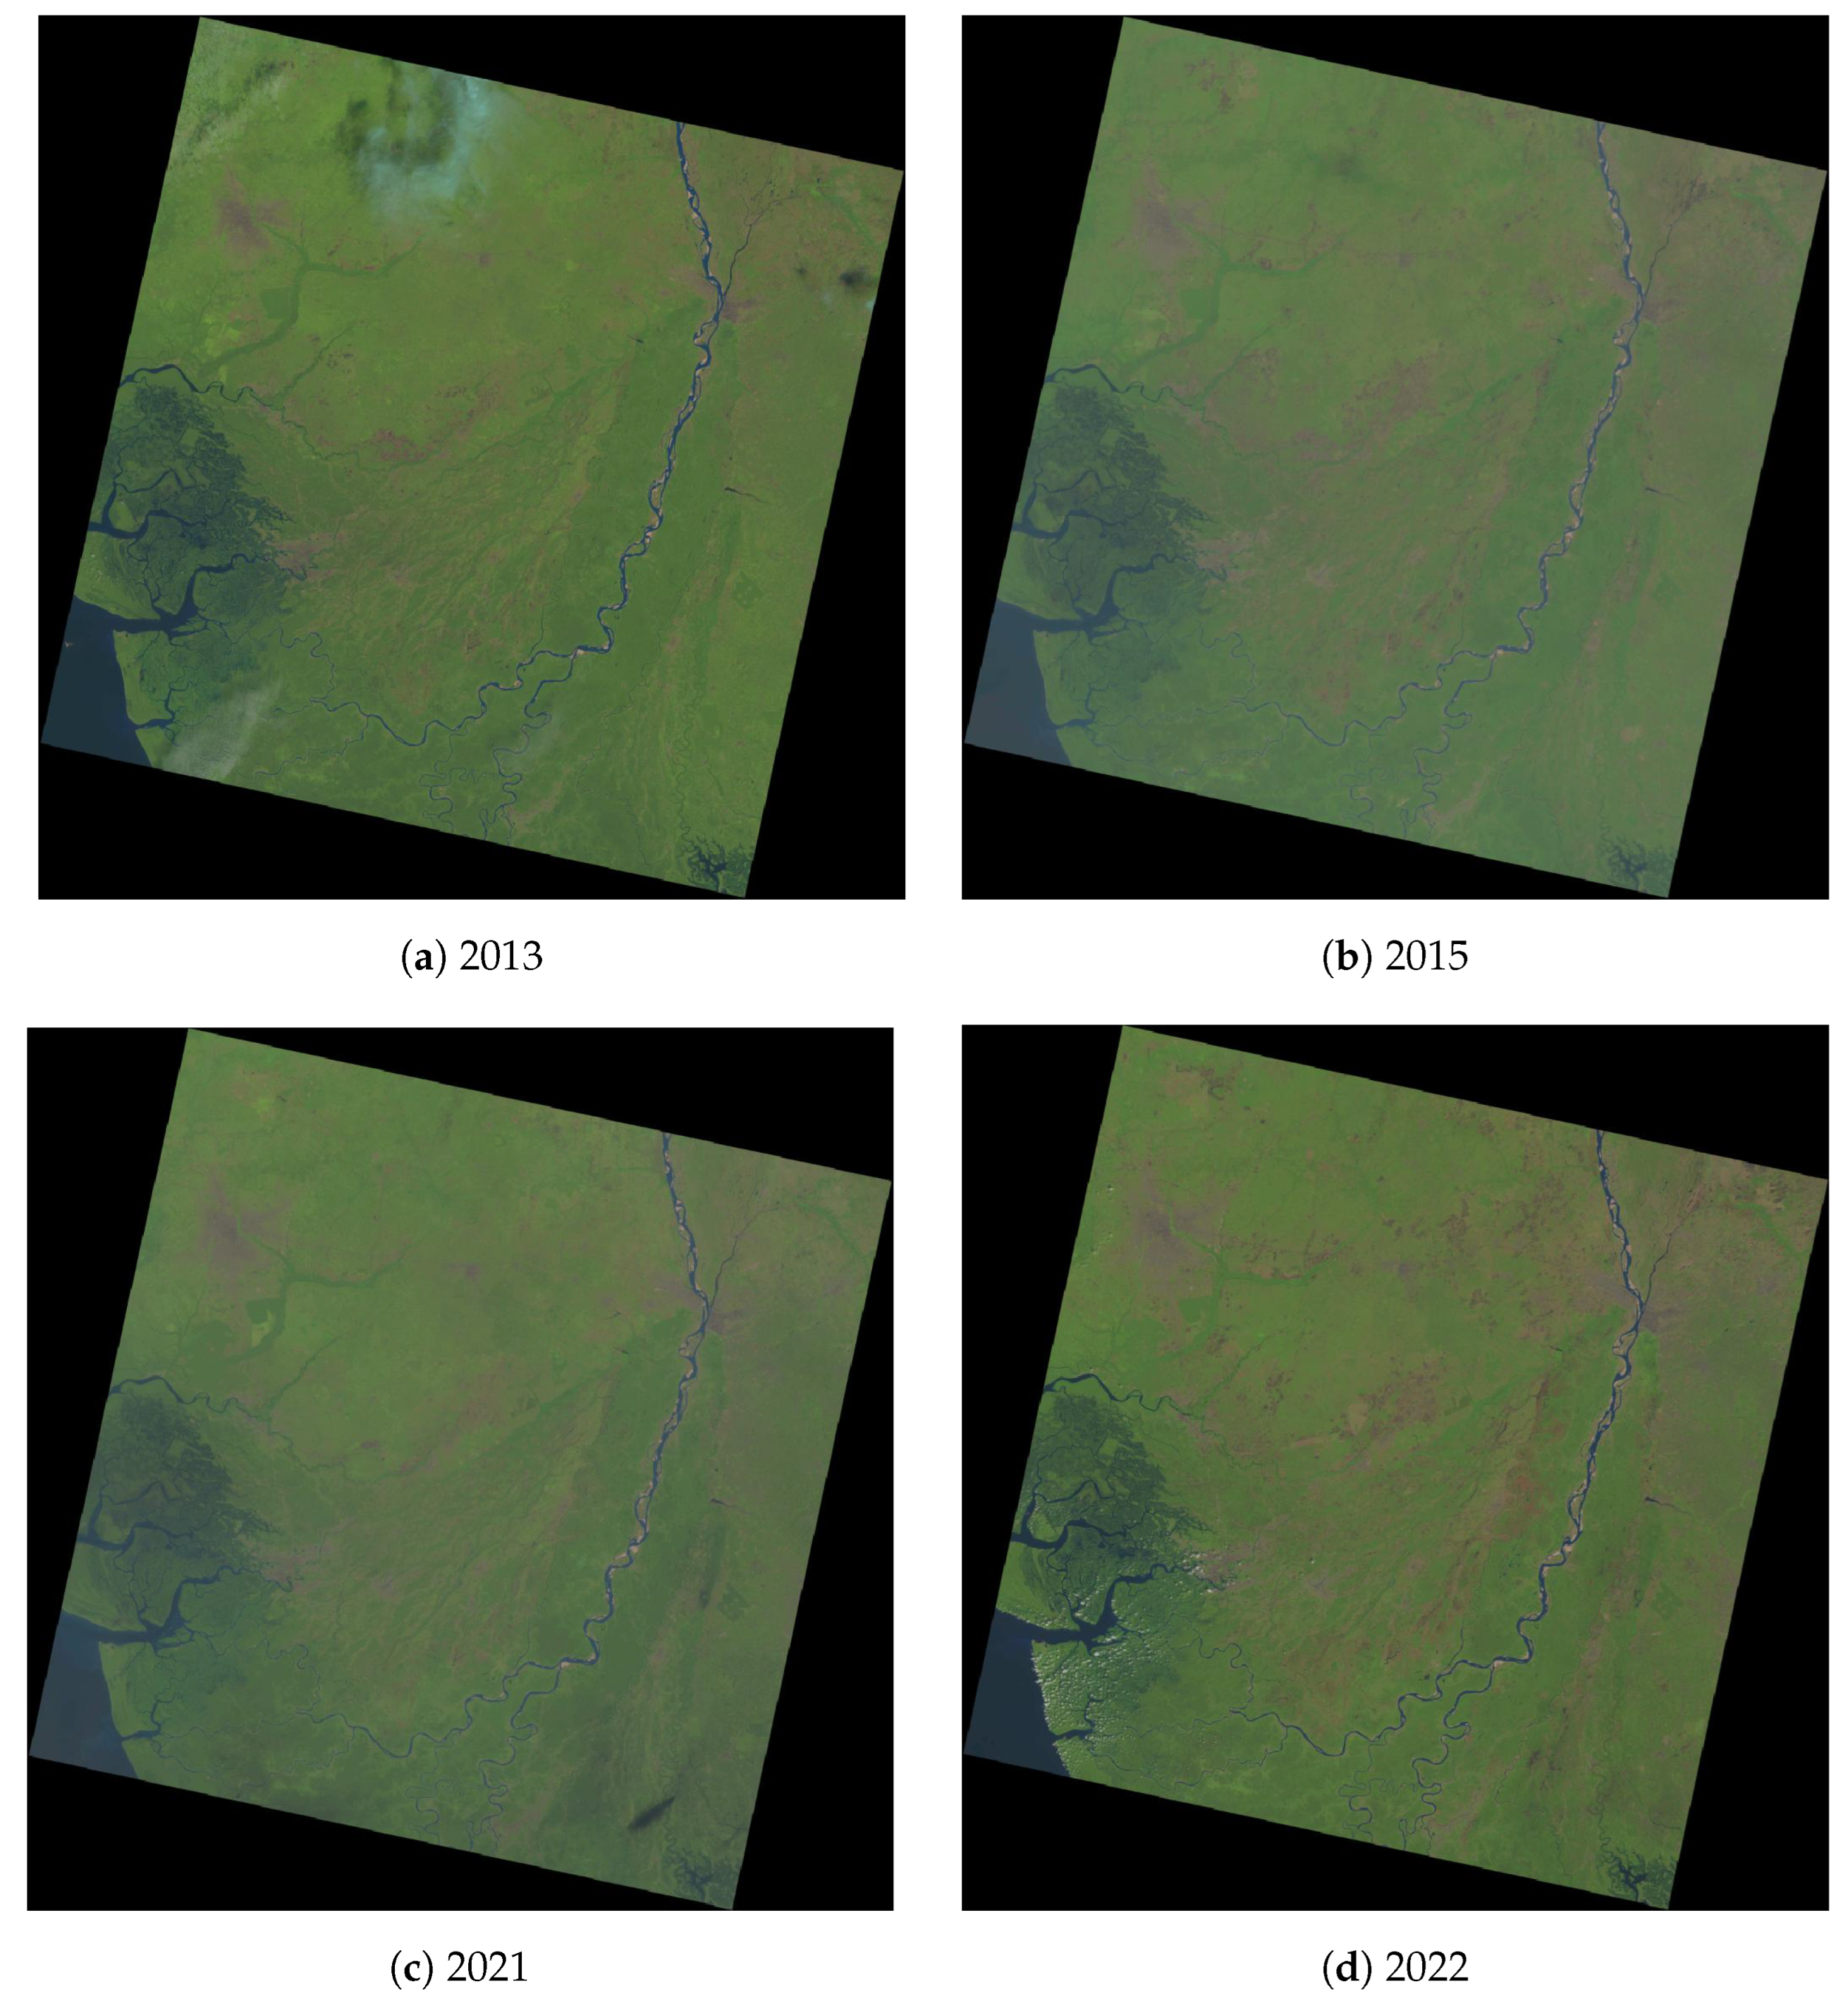
2.1. Data
2.2. Data Preprocessing
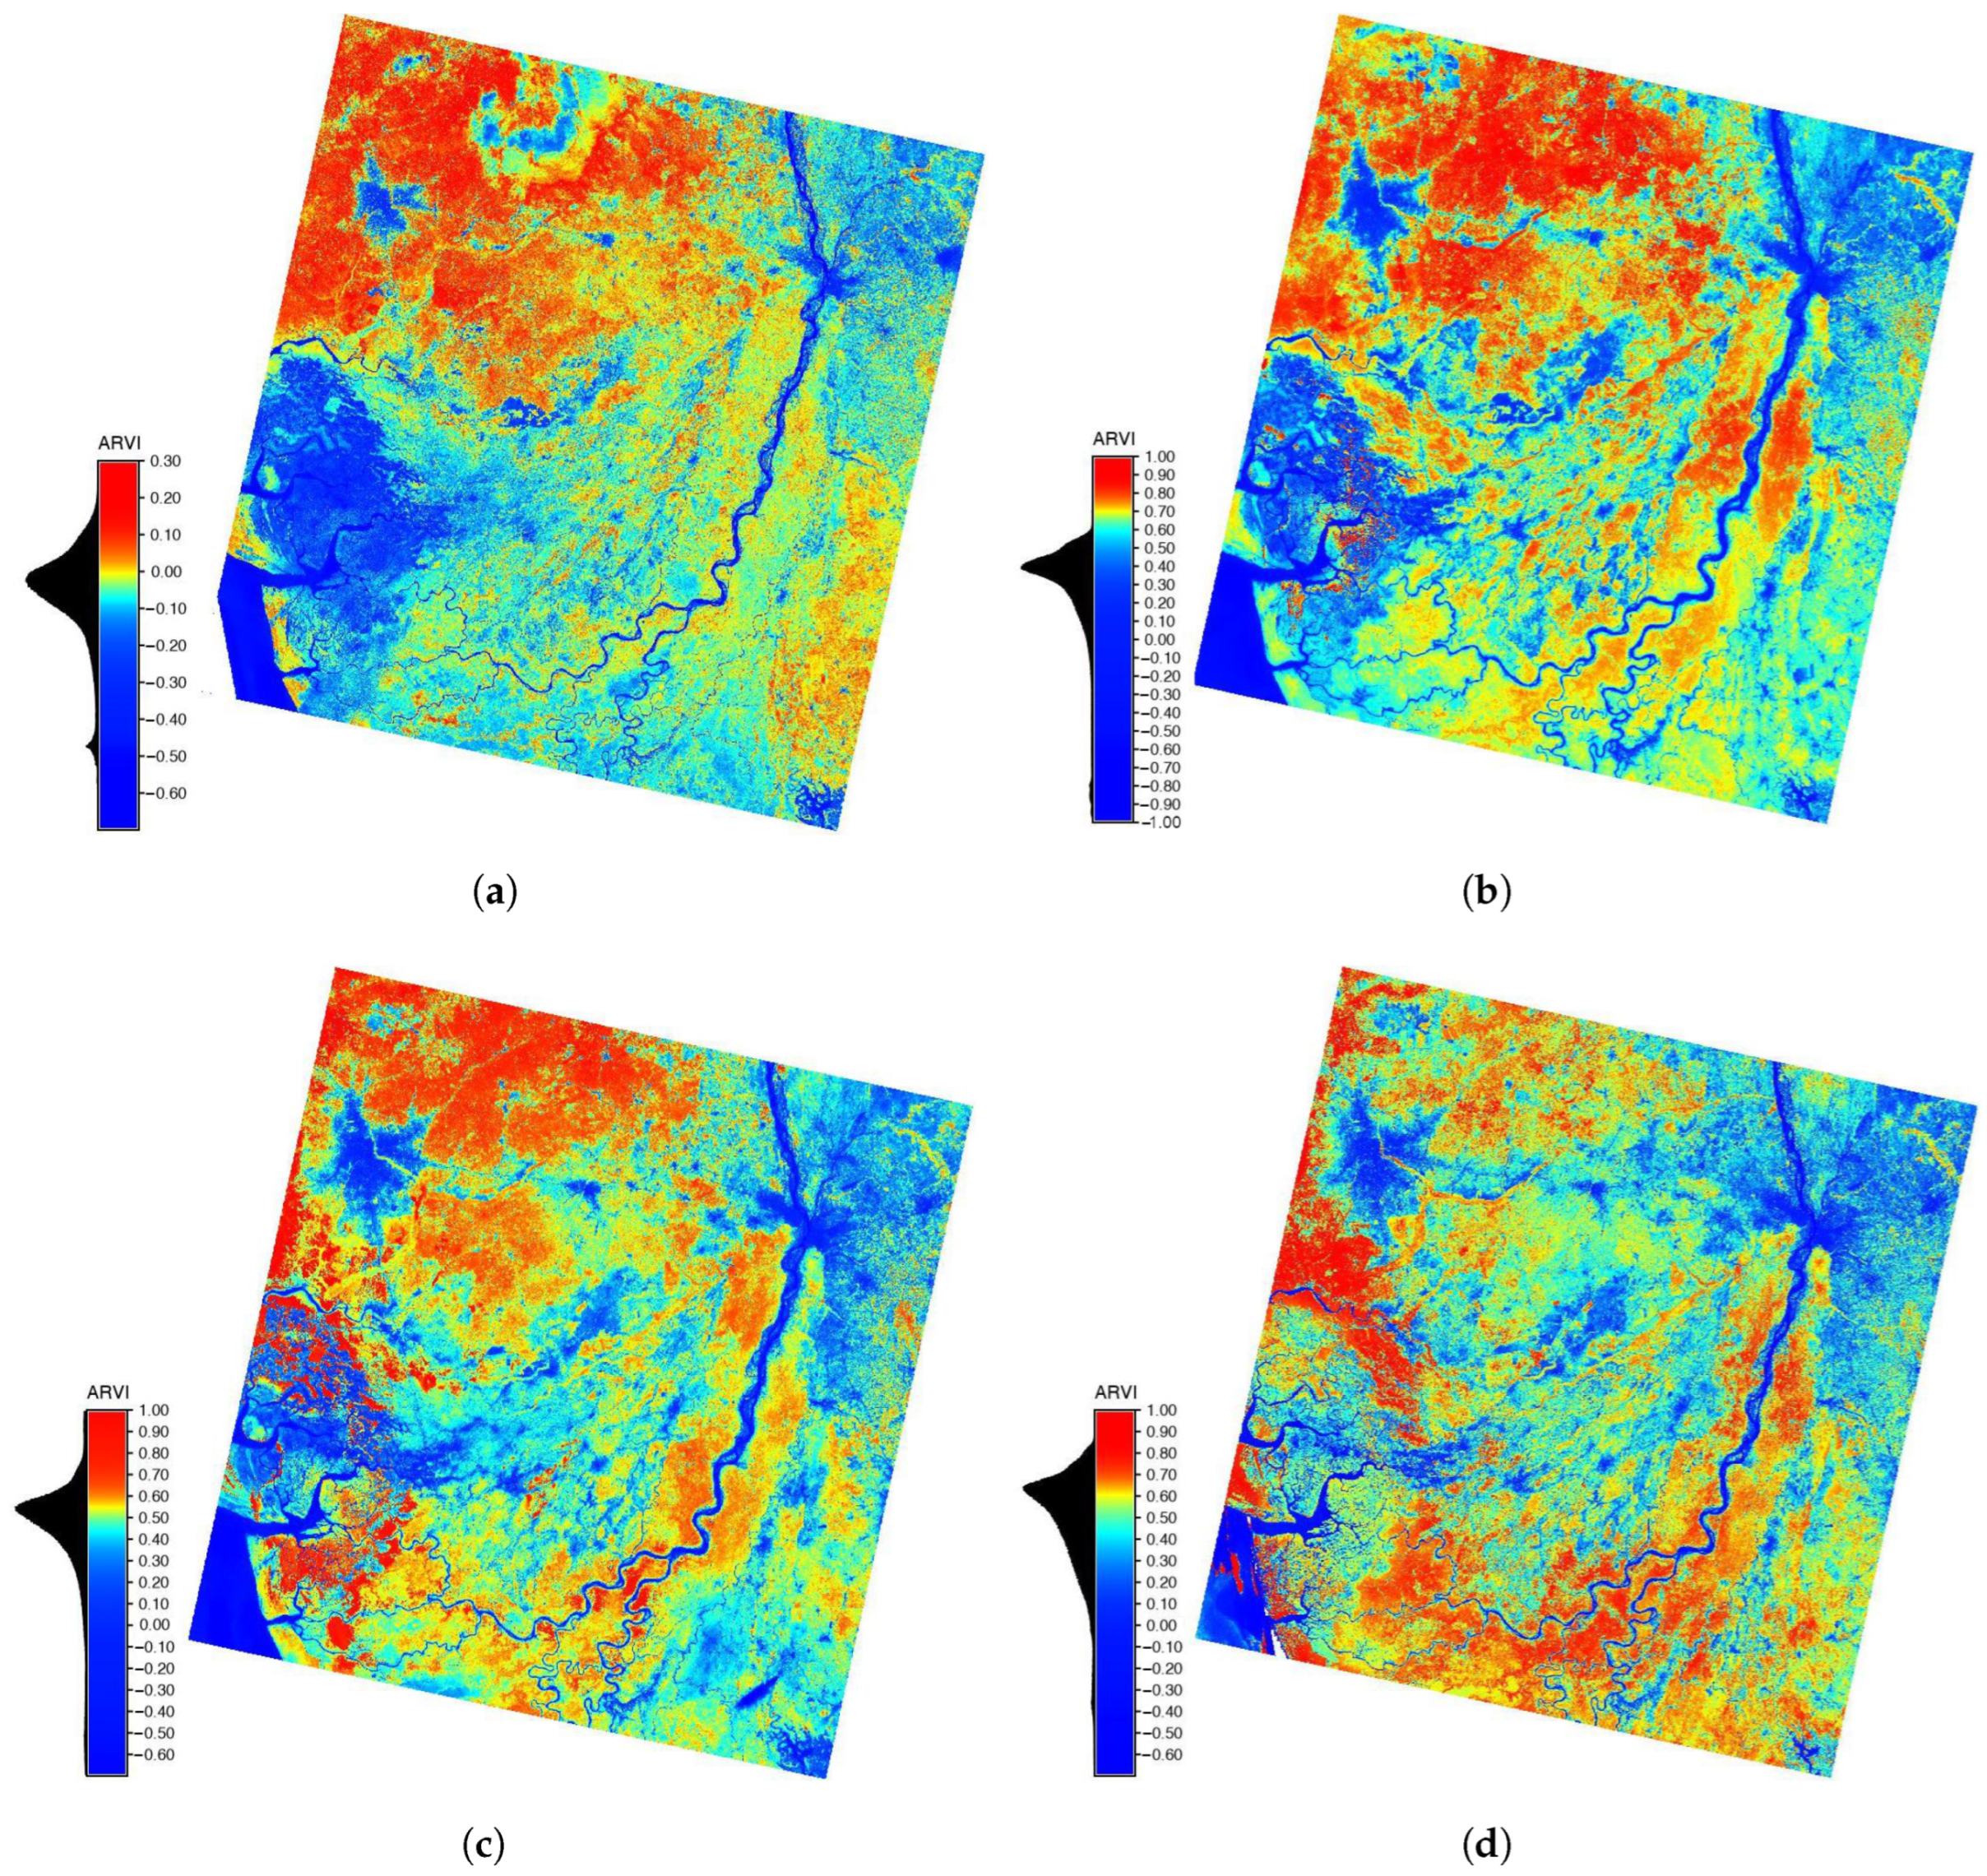
2.3. Atmospherically Resistant Vegetation Index (ARVI)
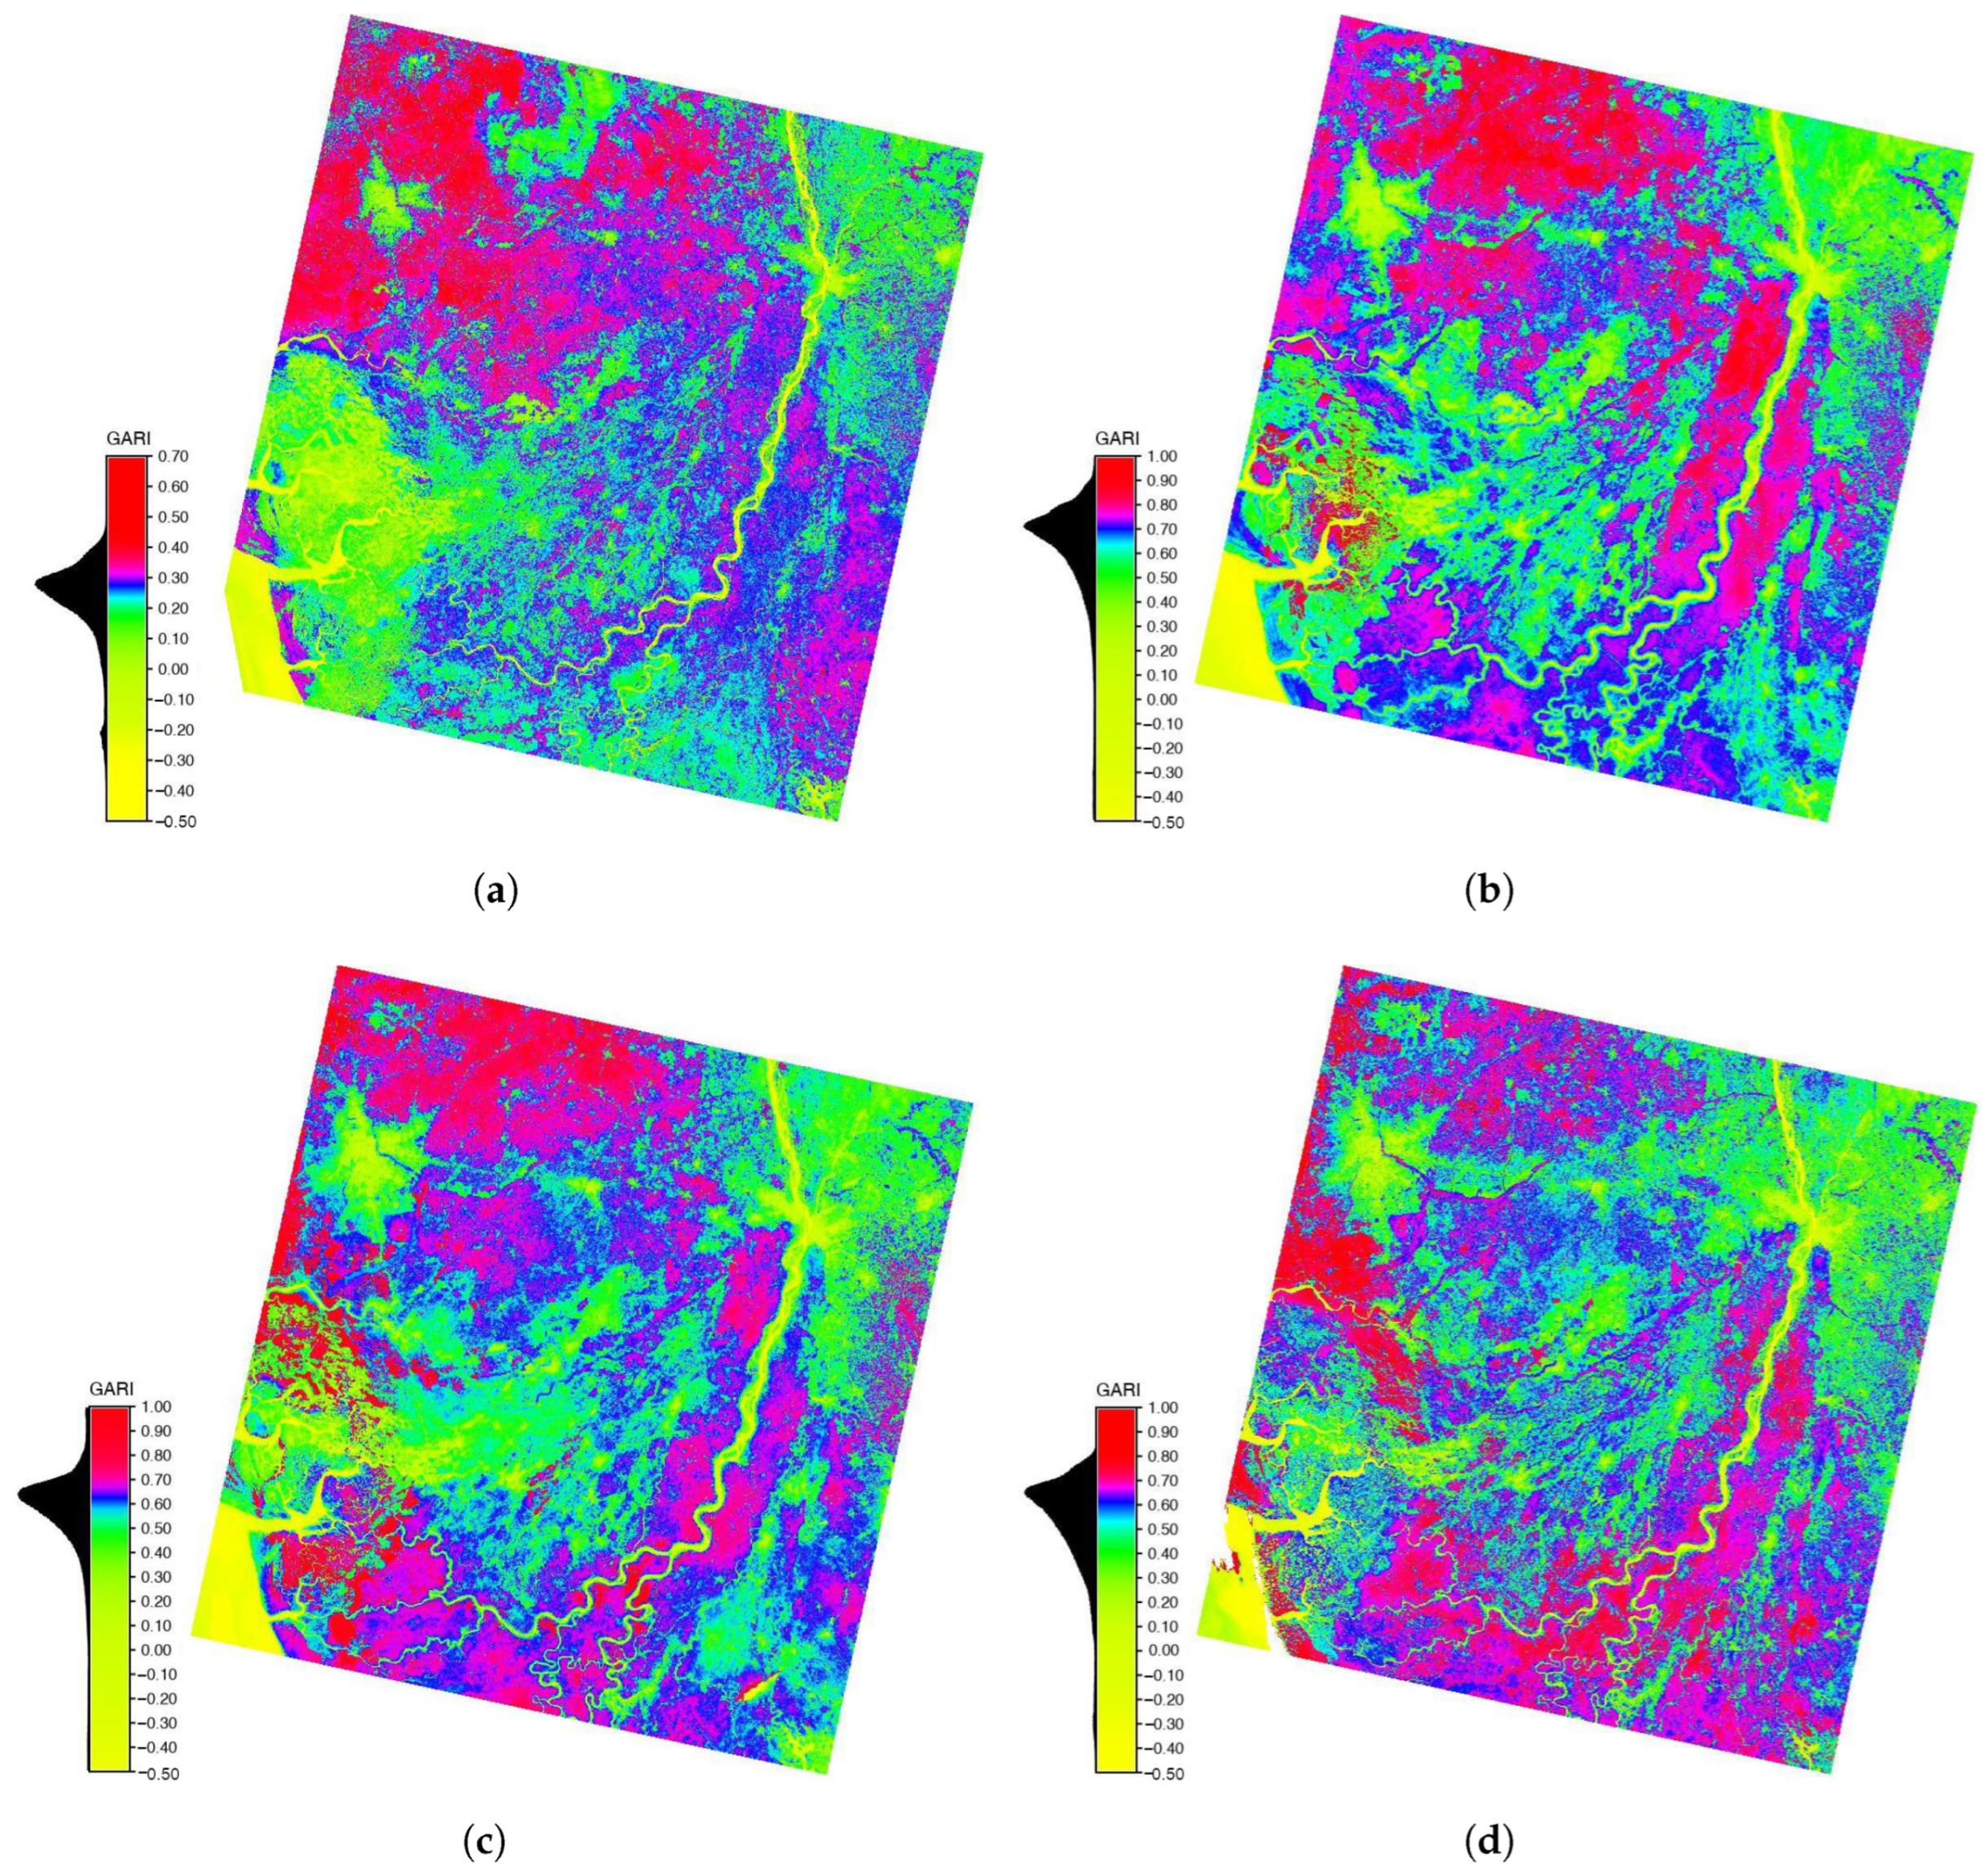
2.4. Green Atmospherically Resistant Vegetation Index (GARI)
2.5. Green Vegetation Index (GVI)
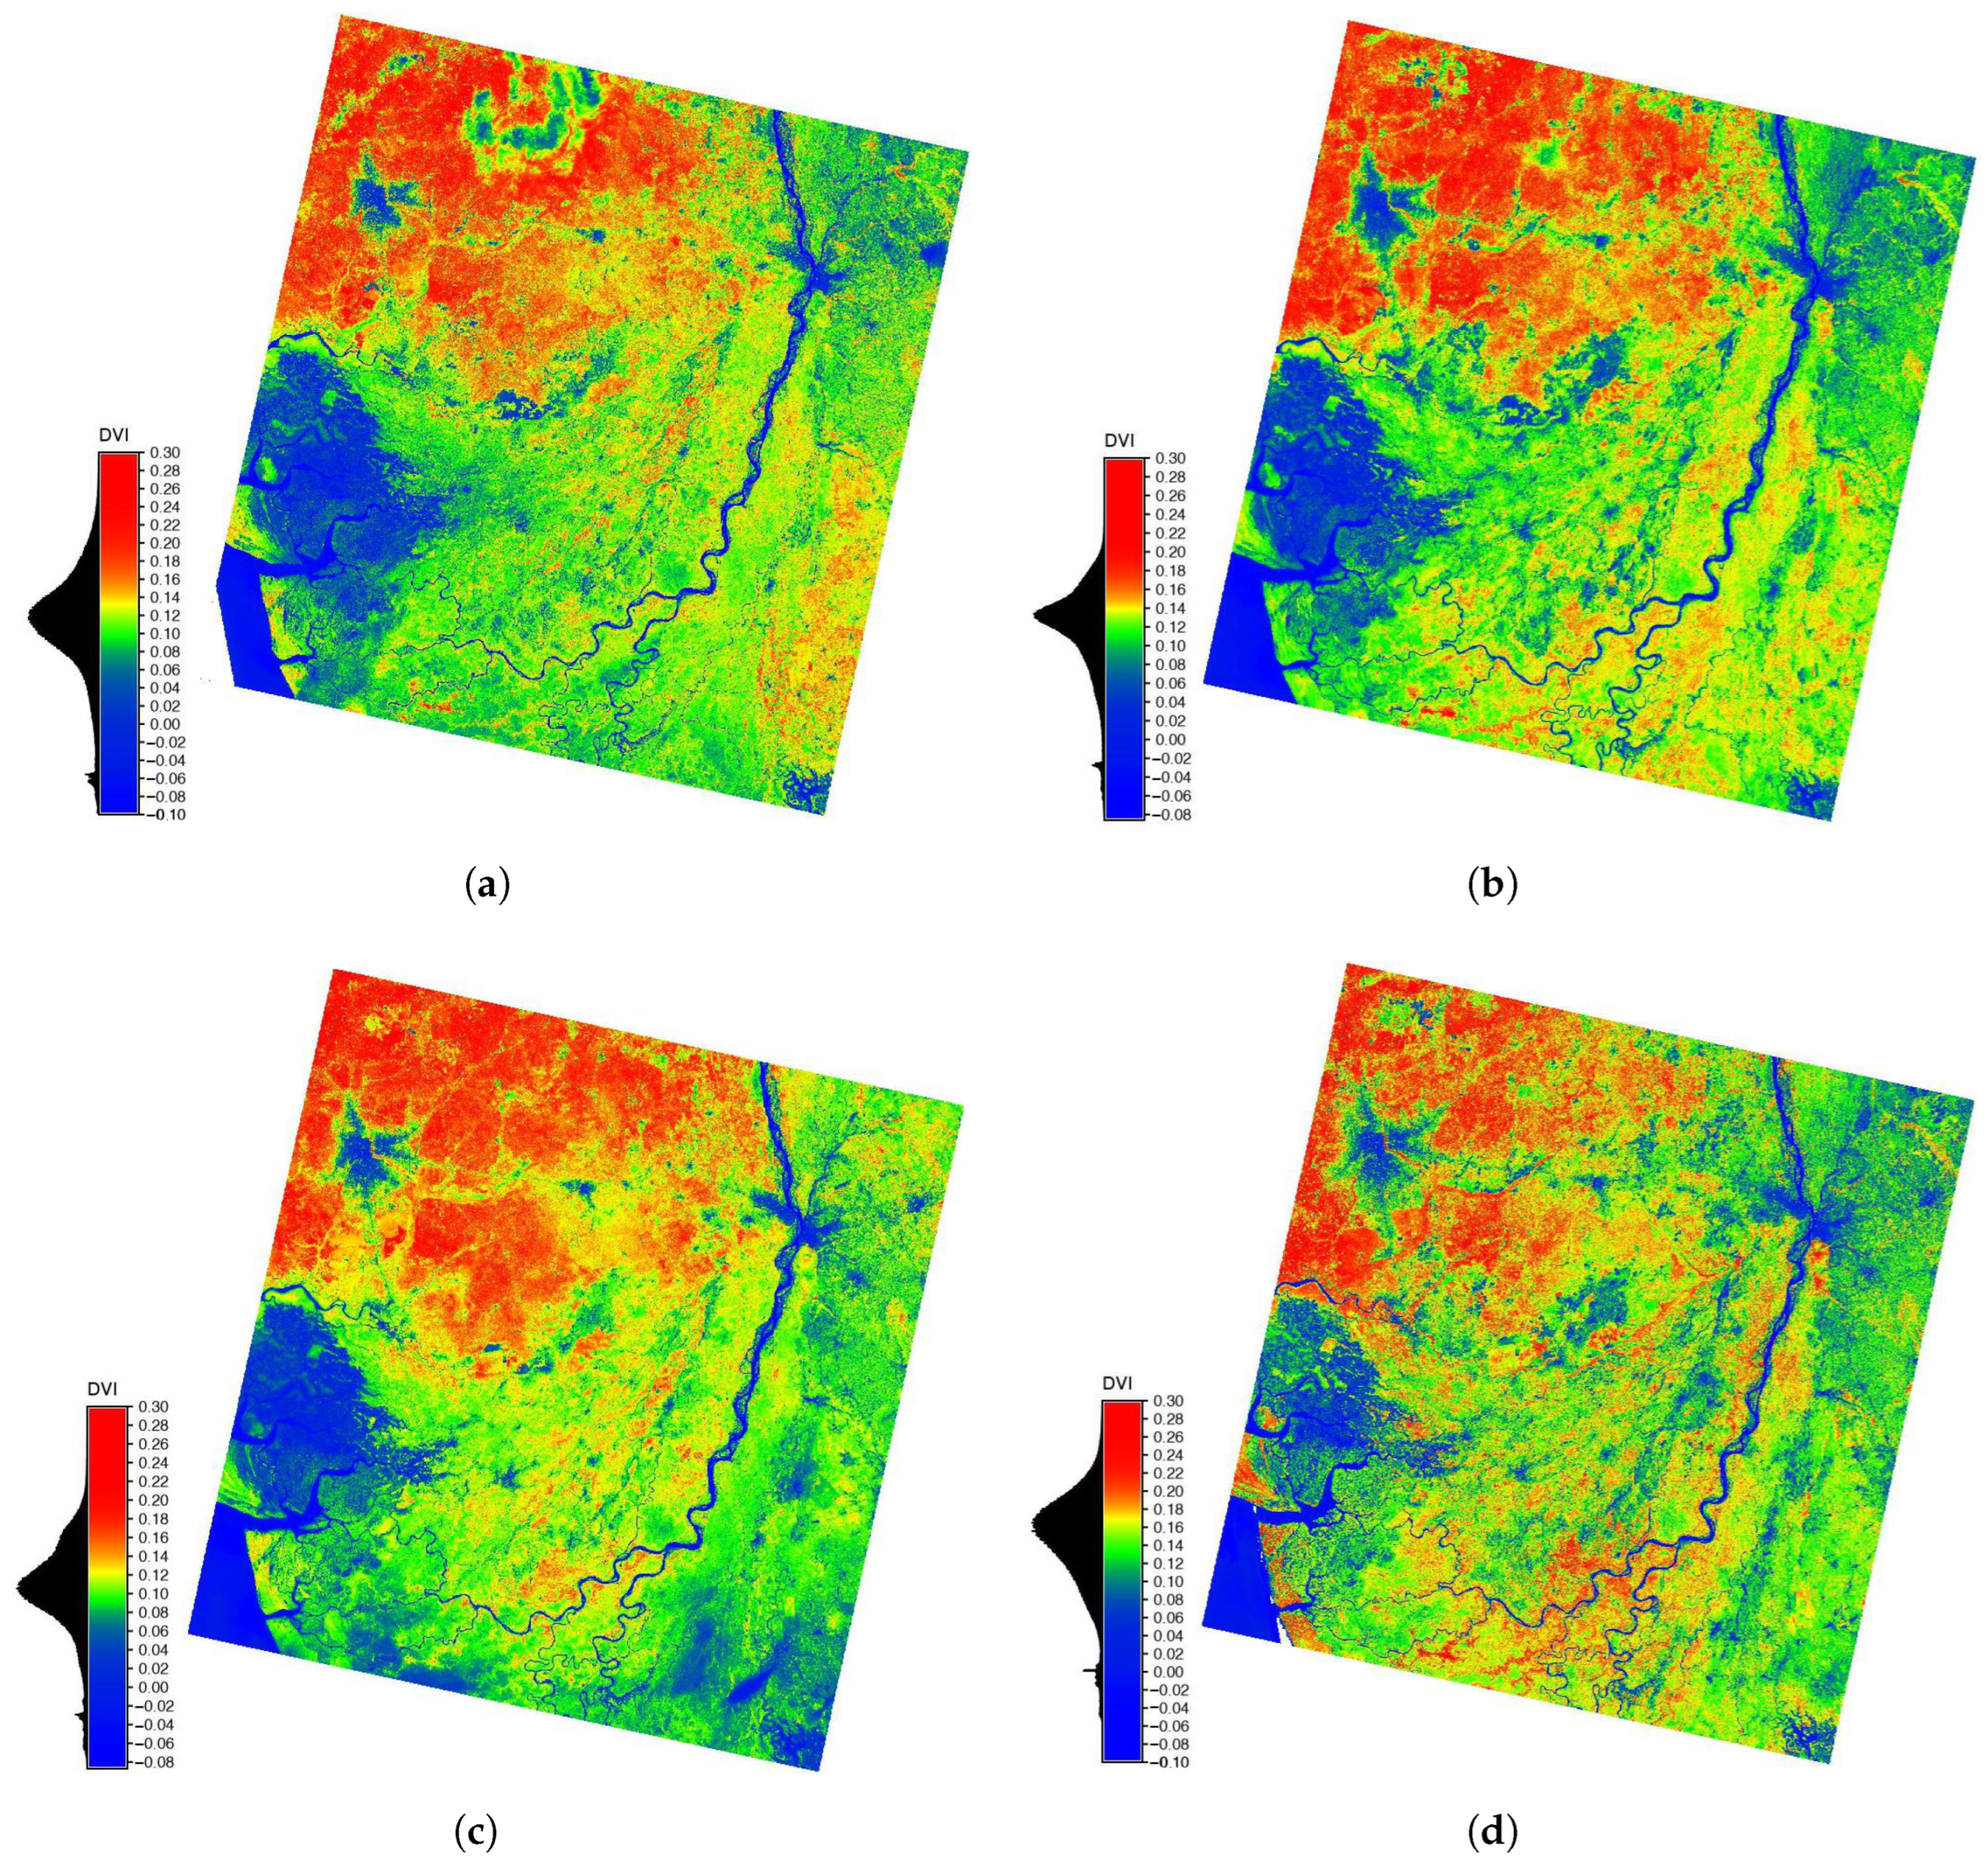
2.6. Difference Vegetation Index (DVI)
2.7. Perpendicular Vegetation Index (PVI)
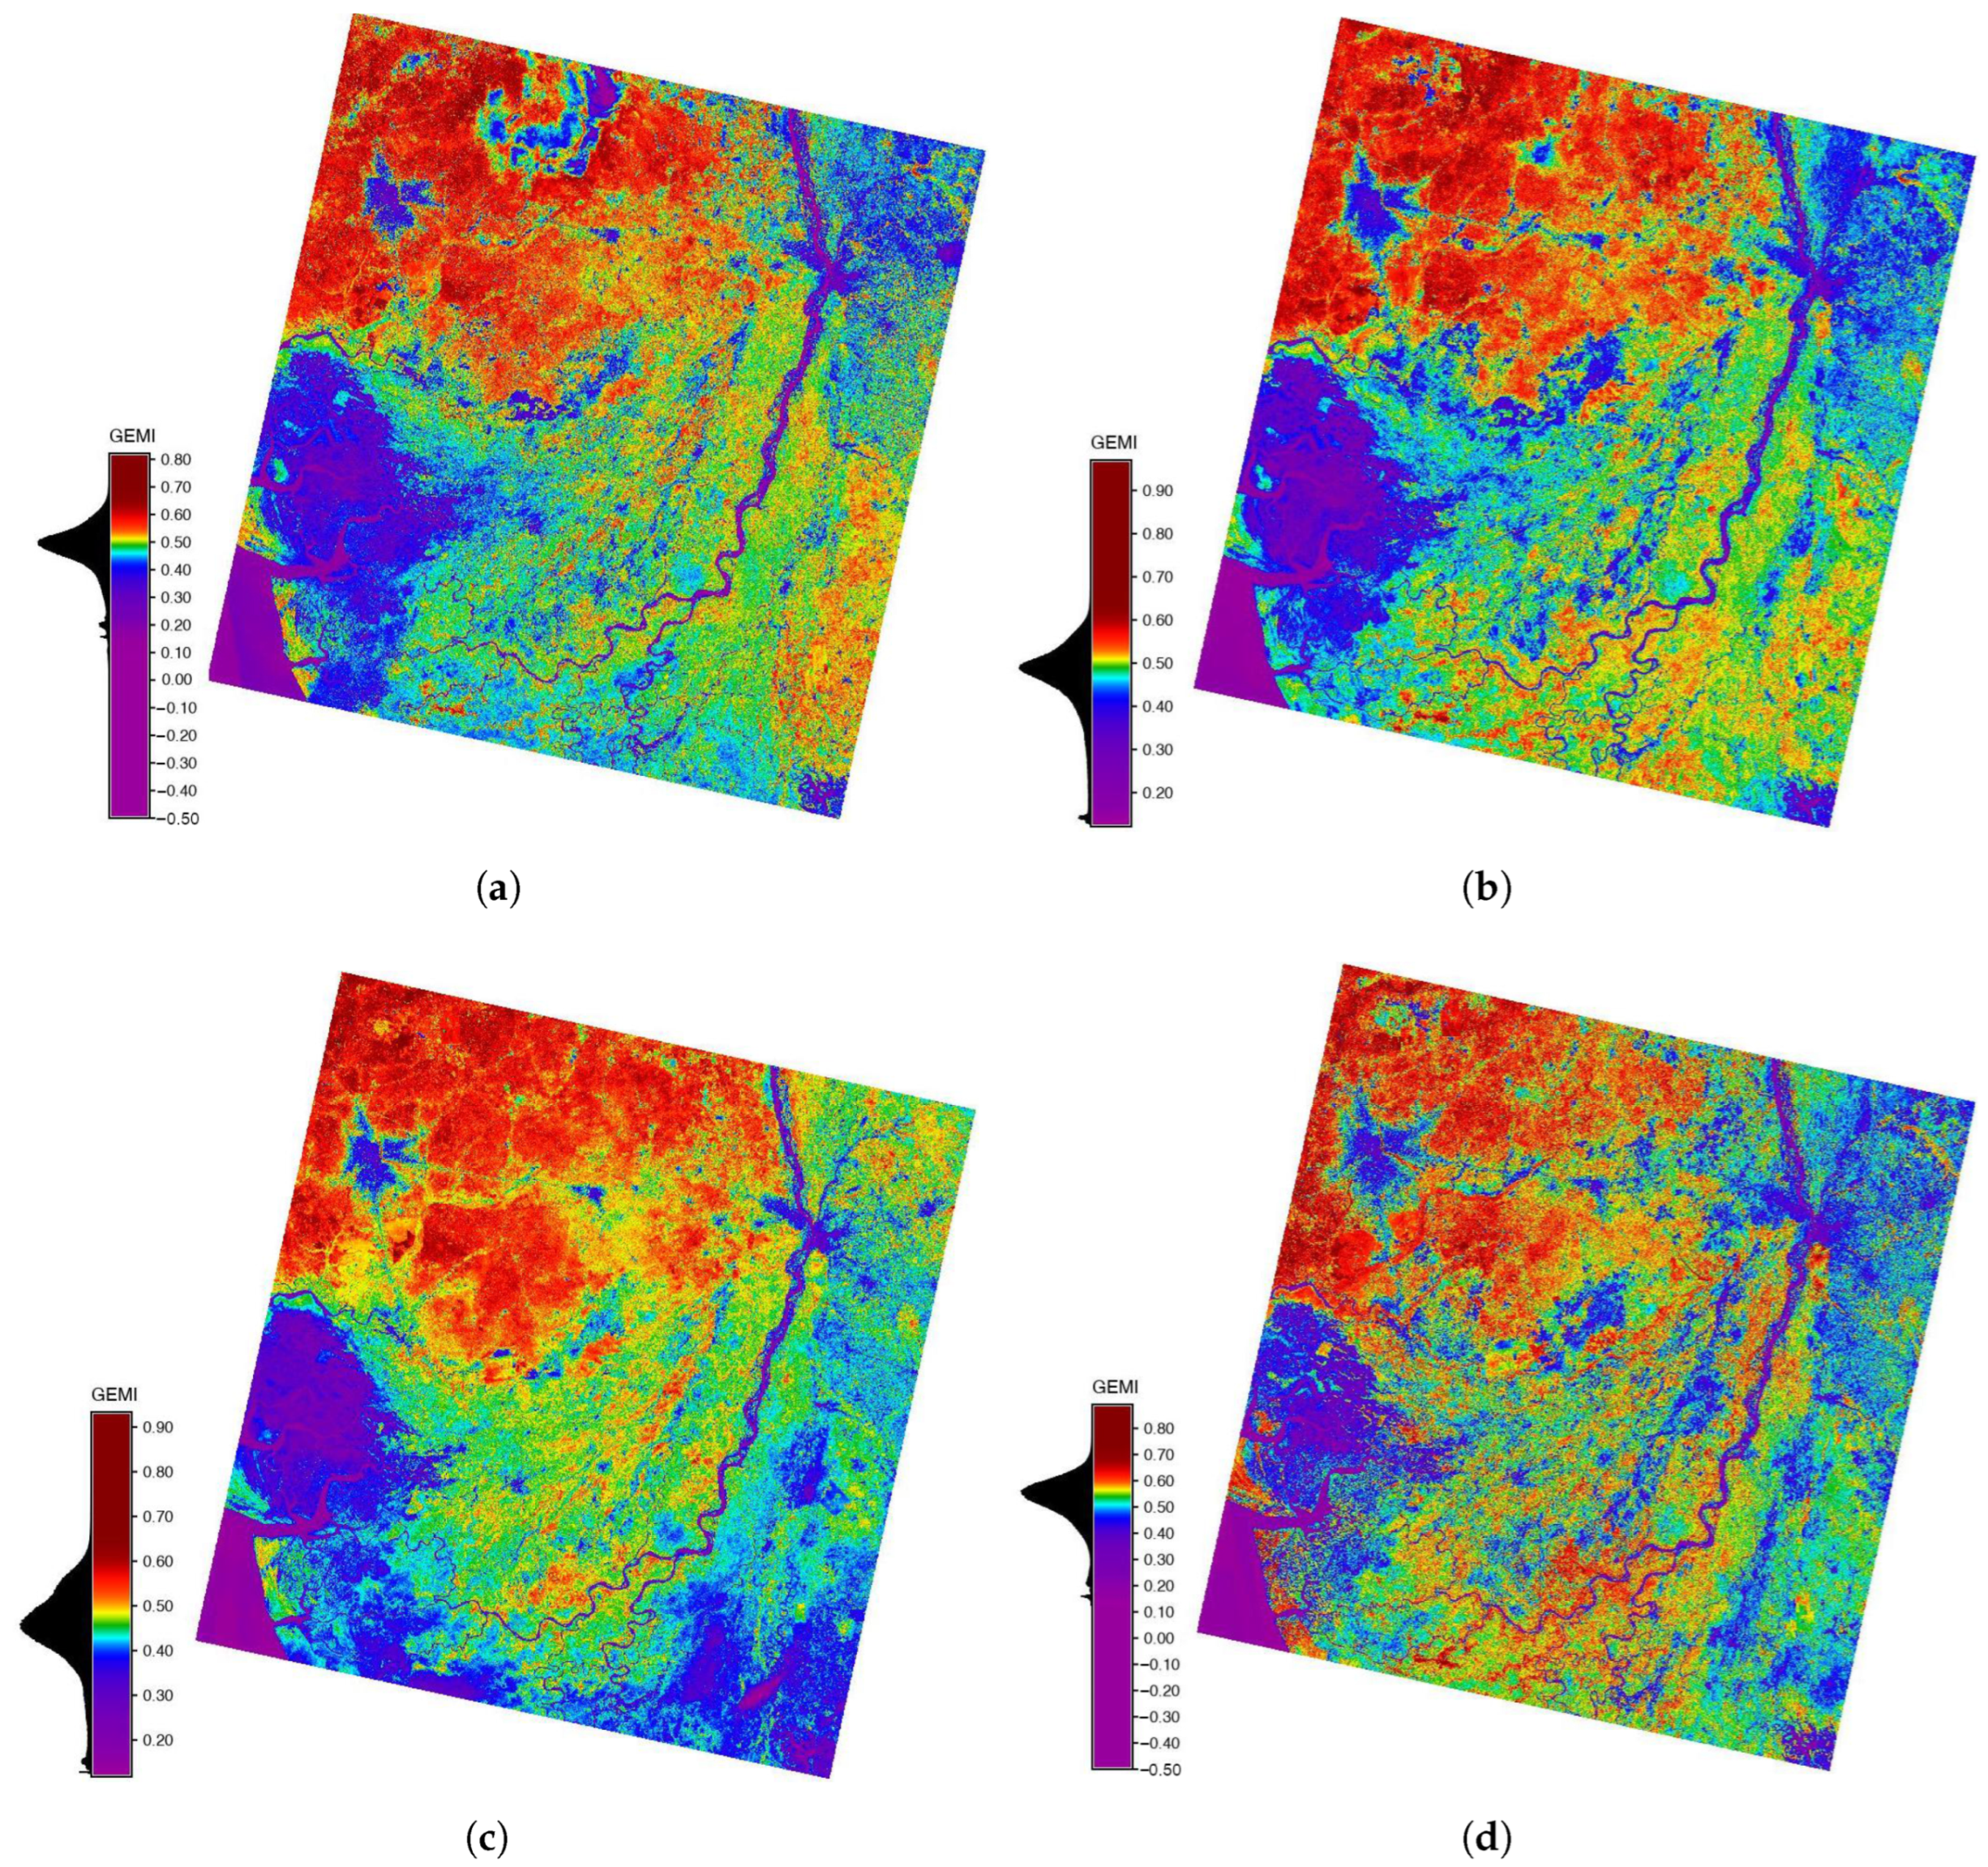
2.8. Global Environmental Monitoring Index (GEMI)
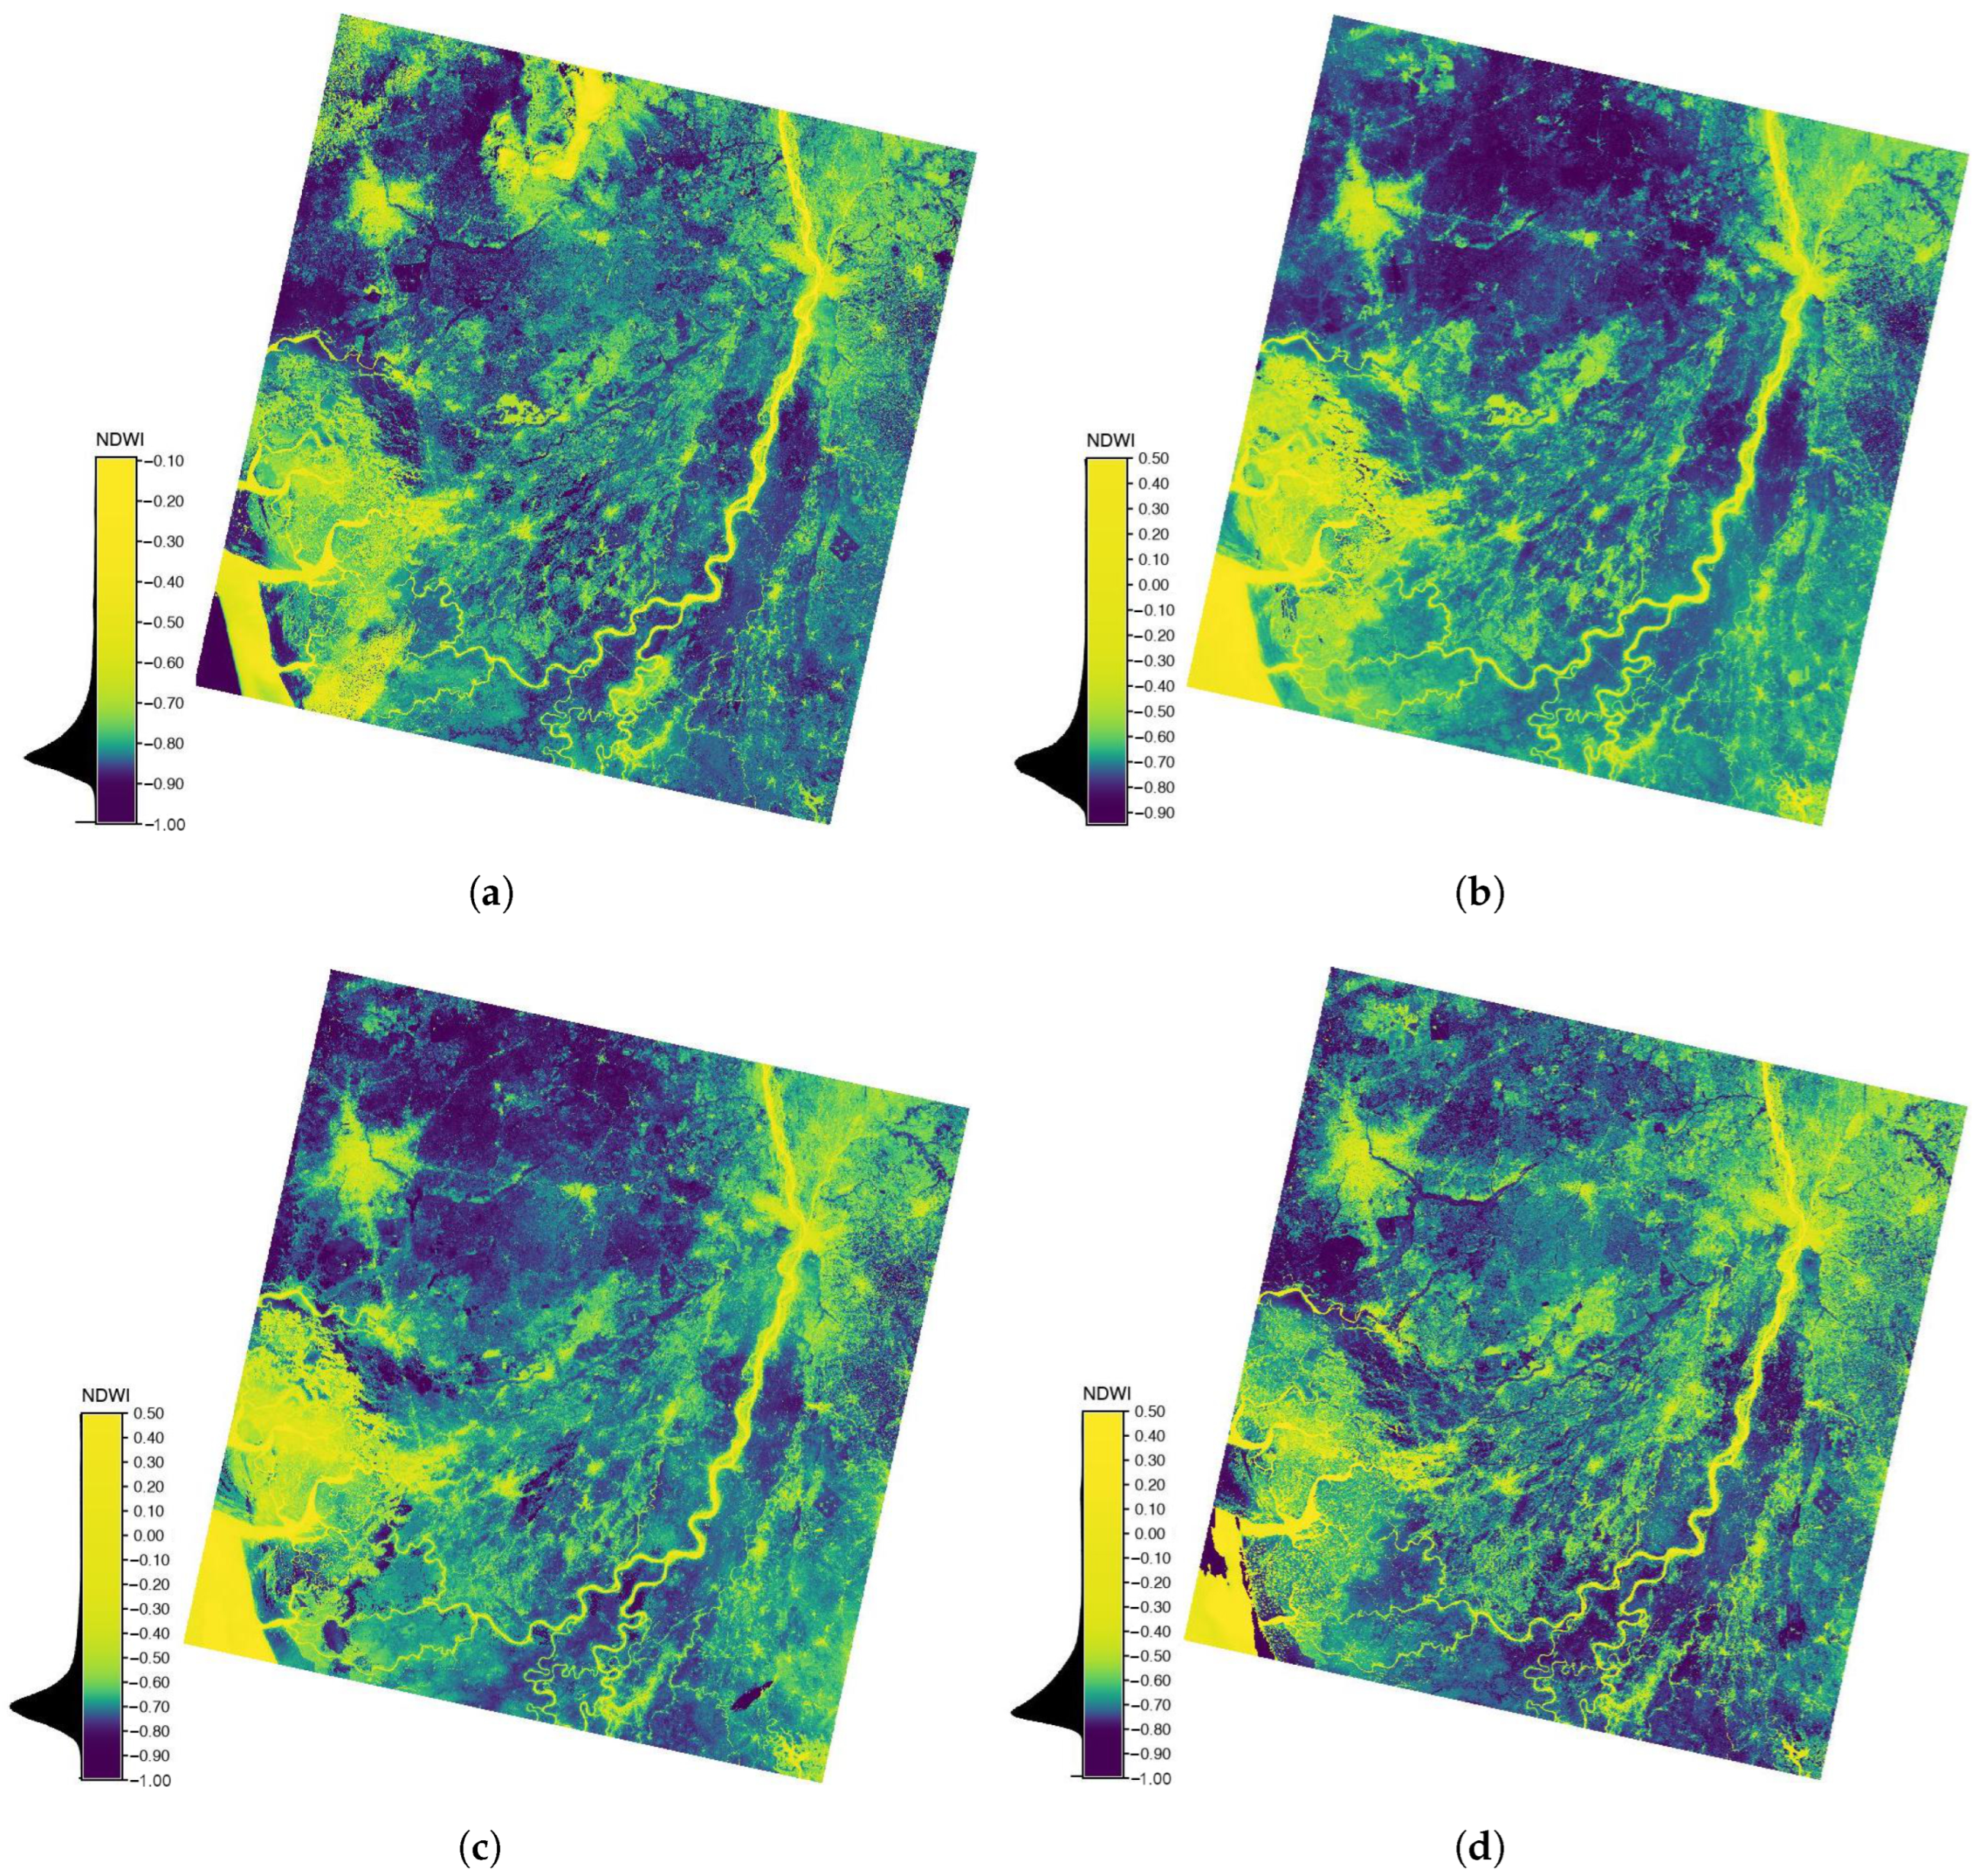
2.9. Normalized Difference Water Index (NDWI)
2.10. Second Modified Soil Adjusted Vegetation Index (MSAVI2)
2.11. Infrared Percentage Vegetation Index (IPVI)
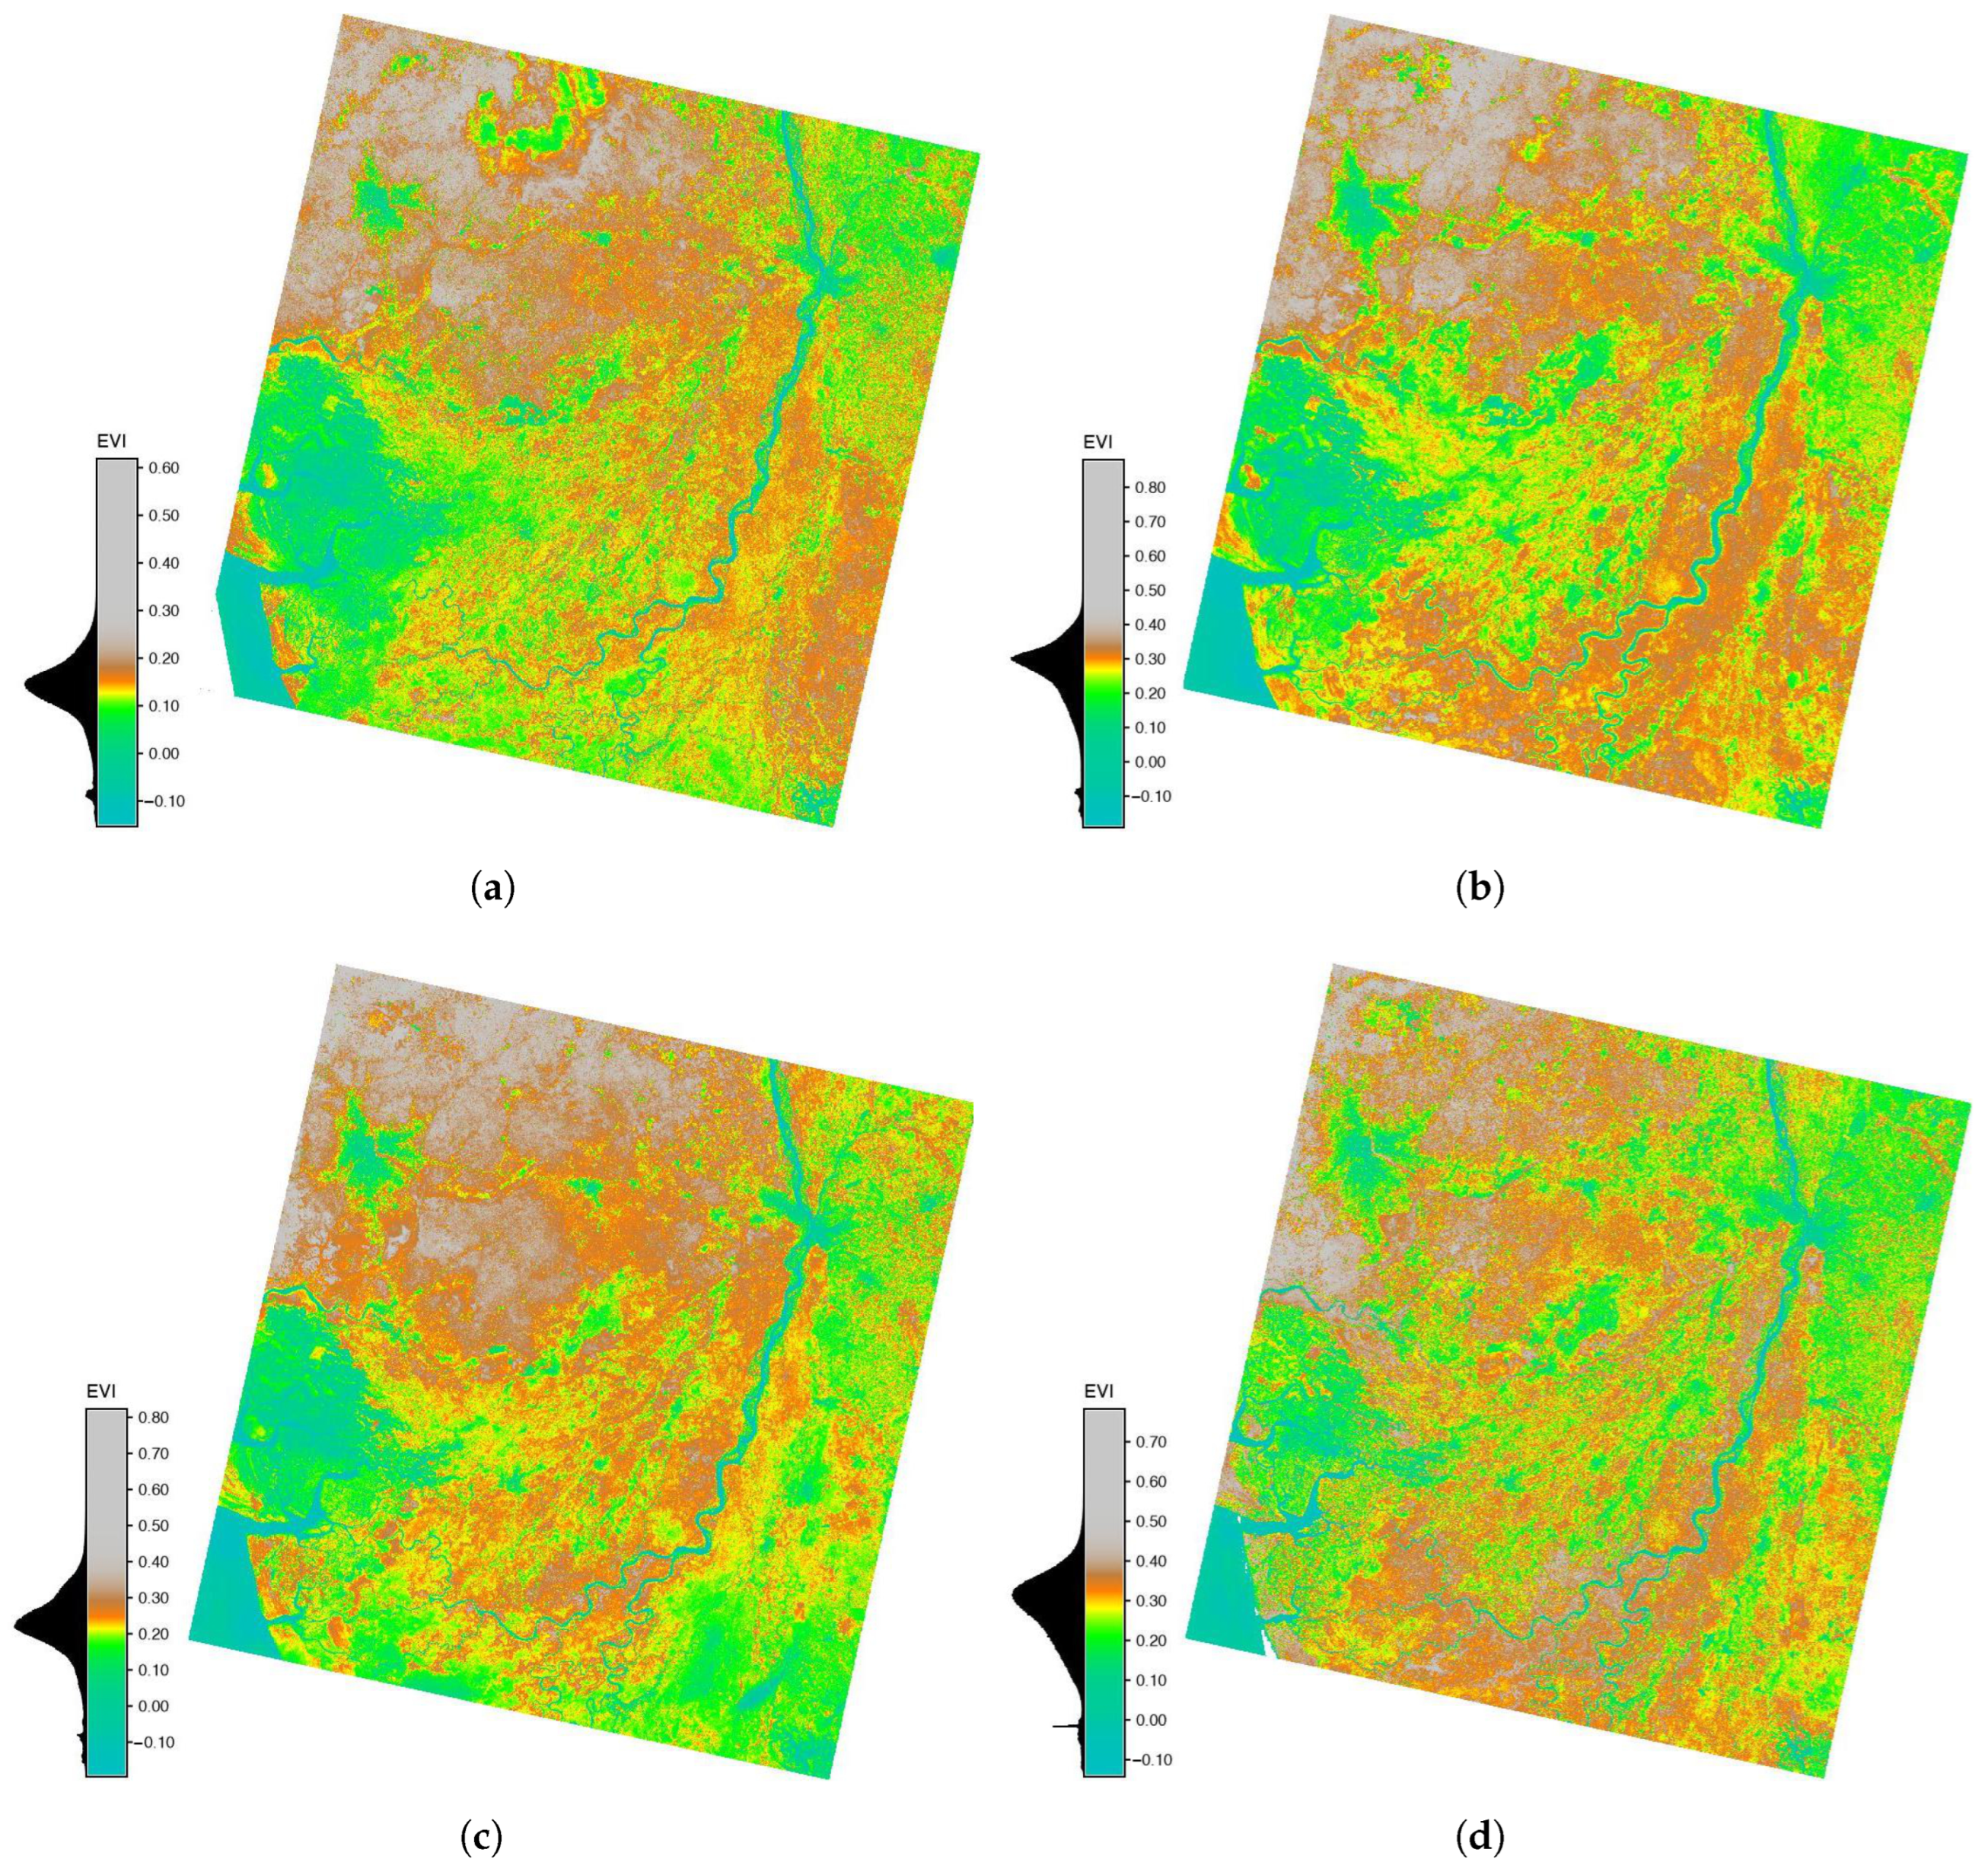
2.12. Enhanced Vegetation Index (EVI)
3. Results
3.1. Difference Vegetation Index (DVI)
3.2. Atmospherically Resistant Vegetation Index (ARVI)
3.3. Green Atmospherically Resistant Vegetation Index (GARI)
3.4. Green Vegetation Index (GVI)
3.5. Perpendicular Vegetation Index (PVI)
3.6. Global Environmental Monitoring Index (GEMI)
3.7. Normalized Difference Water Index (NDWI)
3.8. Second Modified Soil Adjusted Vegetation Index (MSAVI2)
3.9. Infrared Percentage Vegetation Index (IPVI)
3.10. Enhanced Vegetation Index (EVI)
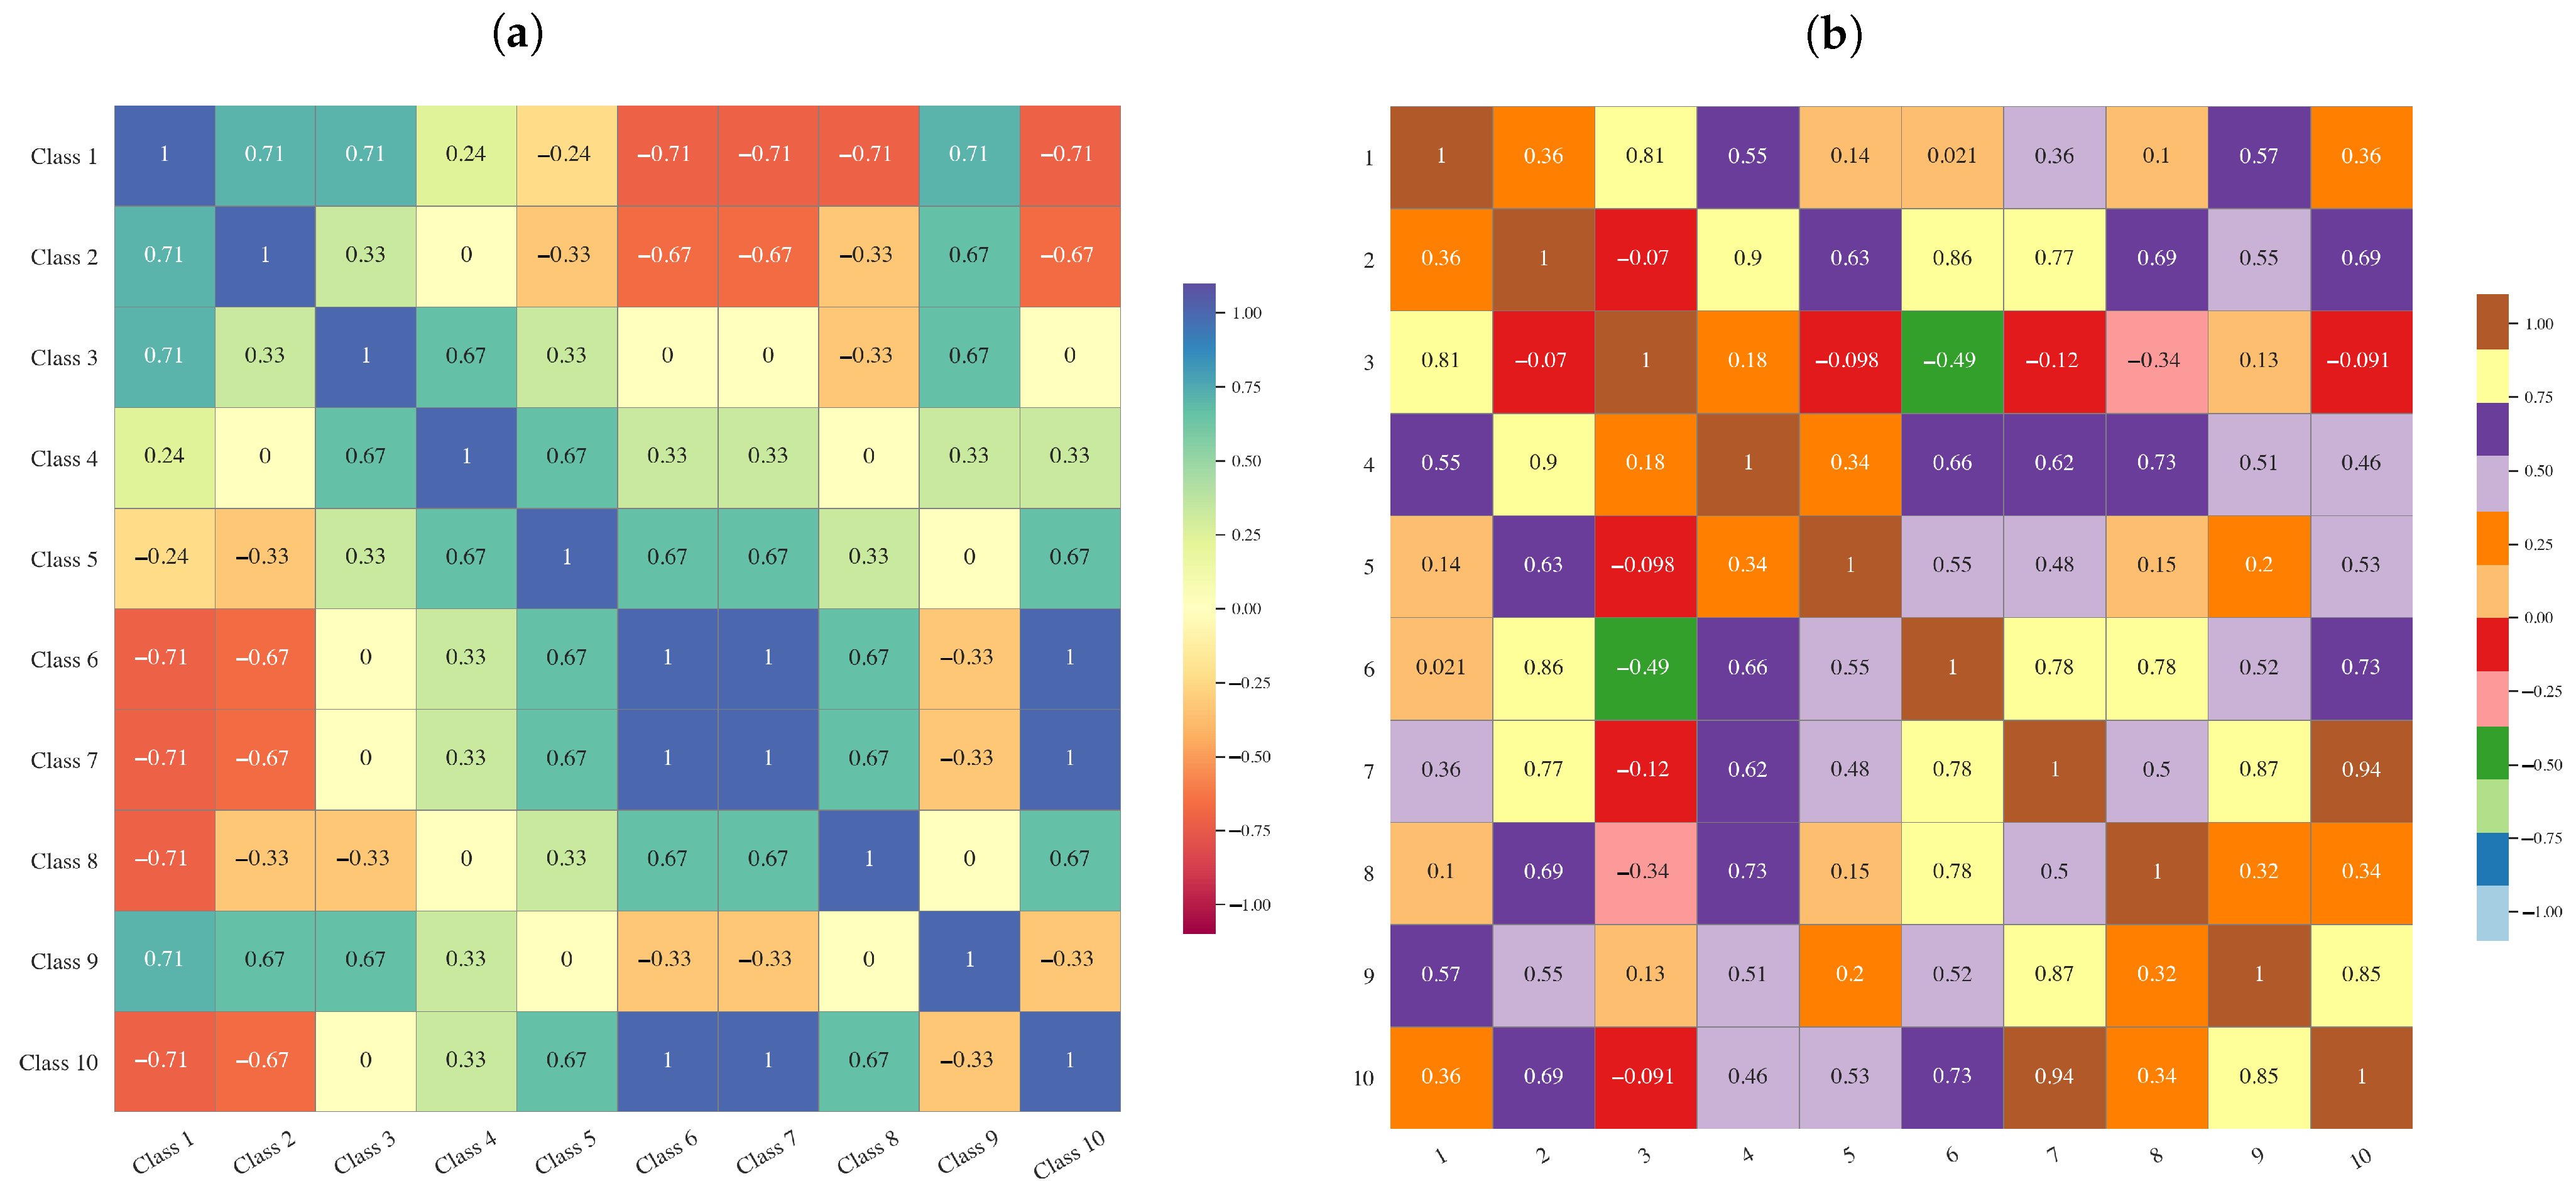
3.11. Statistical Analysis
4. Discussion
5. Conclusions
Author Contributions
Funding
Institutional Review Board Statement
Informed Consent Statement
Data Availability Statement
Acknowledgments
Conflicts of Interest
Abbreviations
| ARVI | Atmospherically Resistant Vegetation Index |
| DN | Digital Number |
| DVI | Difference Vegetation Index |
| EOS | Earth Observing System |
| EVI | Enhanced Vegetation Index |
| GARI | Green Atmospherically Resistant Vegetation Index |
| GDAL | Geospatial Data Abstraction Library |
| GEMI | Global Environmental Monitoring Index |
| GIS | Geographic Information System |
| GMT | Generic Mapping Tools |
| GRASS GIS | Geographic Resources Analysis Support System GIS |
| GVI | Green Vegetation Index |
| IPVI | Infrared Percentage Vegetation Index |
| Landsat 8-9 OLI/TIRS | Landsat 8-9 Operational Land Imager and Thermal Infrared |
| LAI | Leaf Area Index |
| MODIS | Moderate Resolution Imaging Spectroradiometer |
| MSAVI2 | Second Modified Soil Adjusted Vegetation Index |
| NDVI | Normalized Difference Vegetation Index |
| NDWI | Normalized Difference Water Index |
| NIR | Near Infrared |
| PVI | Perpendicular Vegetation Index |
| SAVI | Soil Adjusted Vegetation Index |
Appendix A. GRASS GIS Scripts Used for Computing and Plotting the Vegetation Indices
Appendix A.1. GRASS GIS Script for Correction of the Top-of-Atmosphere Radiance
| Listing A1. GRASS GIS script for converting the DN pixel values to reflectance for correction of the top-of-atmosphere radiance |
  |
Appendix A.2. GRASS GIS Script for Computing the ARVI
| Listing A2. GRASS GIS script for computing the ARVI |
 |
Appendix A.3. GRASS GIS Script for Computing the GARI
| Listing A3. GRASS GIS script for computing the GARI. |
 |
Appendix A.4. GRASS GIS Script for Computing the GVI
| Listing A4. GRASS GIS script for computing the GVI. |
 |
Appendix A.5. GRASS GIS Script for Computing the DVI
| Listing A5. GRASS GIS script for computing the DVI. |
  |
Appendix A.6. GRASS GIS Script for Computing the PVI
| Listing A6. GRASS GIS script for computing the PVI. |
 |
Appendix A.7. GRASS GIS Script for Computing the GEMI
| Listing A7. GRASS GIS script for computing the GEMI. |
 |
Appendix A.8. GRASS GIS Script for Computing the NDWI
| Listing A8. GRASS GIS script for computing the NDWI. |
 |
Appendix A.9. GRASS GIS Script for Computing the MSAVI2
| Listing A9. GRASS GIS script for computing the MSAVI2. |
  |
Appendix A.10. GRASS GIS Script for Computing the IPVI
| Listing A10. GRASS GIS script for computing the IPVI. |
 |
Appendix A.11. GRASS GIS Script for Computing the EVI
| Listing A11. GRASS GIS script for computing the EVI. |
 |
References
- James, G.K.; Adegoke, J.O.; Saba, E.; Nwilo, P.; Akinyede, J.; Osagie, S. Economic Valuation of Mangroves in the Niger Delta. In World Fisheries; John Wiley & Sons, Ltd.: Hoboken, NJ, USA, 2011; Chapter 15; pp. 265–280. [Google Scholar] [CrossRef]
- Akanni, A.; Onwuteaka, J.; Uwagbae, M.; Mulwa, R.; Elegbede, I.O. The Values of Mangrove Ecosystem Services in the Niger Delta Region of Nigeria. In The Political Ecology of Oil and Gas Activities in the Nigerian Aquatic Ecosystem; Ndimele, P.E., Ed.; Academic Press: Cambridge, MA, USA, 2018; Chapter 25; pp. 387–437. [Google Scholar] [CrossRef]
- Enaruvbe, G.O.; Atafo, O.P. Analysis of deforestation pattern in the Niger Delta region of Nigeria. J. Land Use Sci. 2016, 11, 113–130. [Google Scholar] [CrossRef]
- Numbere, A.O. Natural seedling recruitment and regeneration in deforested and sand-filled Mangrove forest at Eagle Island, Niger Delta, Nigeria. Ecol. Evol. 2021, 11, 3148–3158. [Google Scholar] [CrossRef] [PubMed]
- Osuji, L.; Erondu, E.; Ogali, R. Upstream Petroleum Degradation of Mangroves and Intertidal Shores: The Niger Delta Experience. Chem. Biodivers. 2010, 7, 116–128. [Google Scholar] [CrossRef] [PubMed]
- Fasona, M.; Omojola, A. Land cover change and land degradation in parts of the southwest coast of Nigeria. Afr. J. Ecol. 2009, 47, 30–38. [Google Scholar] [CrossRef]
- Hati, J.P.; Chaube, N.R.; Hazra, S.; Goswami, S.; Pramanick, N.; Samanta, S.; Chanda, A.; Mitra, D.; Mukhopadhyay, A. Mangrove monitoring in Lothian Island using airborne hyperspectral AVIRIS-NG data. Adv. Space Res. 2022. In Press, Corrected Proof. [Google Scholar] [CrossRef]
- Alatorre, L.C.; Sánchez-Carrillo, S.; Miramontes-Beltrán, S.; Medina, R.J.; Torres-Olave, M.E.; Bravo, L.C.; Wiebe, L.C.; Granados, A.; Adams, D.K.; Sánchez, E.; et al. Temporal changes of NDVI for qualitative environmental assessment of mangroves: Shrimp farming impact on the health decline of the arid mangroves in the Gulf of California (1990–2010). J. Arid Environ. 2016, 125, 98–109. [Google Scholar] [CrossRef]
- Sathish, C.; Nakhawa, A.; Bharti, V.S.; Jaiswar, A.; Deshmukhe, G. Estimation of extent of the mangrove defoliation caused by insect Hyblaea puera (Cramer, 1777) around Dharamtar creek, India using Sentinel 2 images. Reg. Stud. Mar. Sci. 2021, 48, 102054. [Google Scholar] [CrossRef]
- Hu, L.; Li, W.; Xu, B. The role of remote sensing on studying mangrove forest extent change. Int. J. Remote Sens. 2018, 39, 6440–6462. [Google Scholar] [CrossRef]
- Chopade, M.R.; Mahajan, S.; Chaube, N. Assessment of land use, land cover change in the mangrove forest of Ghogha area, Gulf of Khambhat, Gujarat. Expert Syst. Appl. 2023, 212, 118839. [Google Scholar] [CrossRef]
- Gitau, P.N.; Duvail, S.; Verschuren, D. Evaluating the combined impacts of hydrological change, coastal dynamics and human activity on mangrove cover and health in the Tana River delta, Kenya. Reg. Stud. Mar. Sci. 2023, 61, 102898. [Google Scholar] [CrossRef]
- Mishra, M.; Acharyya, T.; Santos, C.A.G.; da Silva, R.M.; Kar, D.; Mustafa Kamal, A.H.; Raulo, S. Geo-ecological impact assessment of severe cyclonic storm Amphan on Sundarban mangrove forest using geospatial technology. Estuar. Coast. Shelf Sci. 2021, 260, 107486. [Google Scholar] [CrossRef]
- Ochege, F.U.; George, R.T.; Dike, E.C.; Okpala-Okaka, C. Geospatial assessment of vegetation status in Sagbama oilfield environment in the Niger Delta region, Nigeria. Egypt. J. Remote Sens. Space Sci. 2017, 20, 211–221. [Google Scholar] [CrossRef]
- Lemenkova, P.; Debeir, O. R Libraries for Remote Sensing Data Classification by k-means Clustering and NDVI Computation in Congo River Basin, DRC. Appl. Sci. 2022, 12, 12554. [Google Scholar] [CrossRef]
- Alademomi, A.S.; Okolie, C.J.; Daramola, O.E.; Agboola, R.O.; Salami, T.J. Assessing the relationship of LST, NDVI and EVI with land cover changes in the Lagos Lagoon environment. Quaest. Geogr. 2020, 39, 111–123. [Google Scholar] [CrossRef]
- Nse, O.U.; Okolie, C.J.; Nse, V.O. Dynamics of land cover, land surface temperature and NDVI in Uyo City, Nigeria. Sci. Afr. 2020, 10, e00599. [Google Scholar] [CrossRef]
- Adamu, B.; Tansey, K.; Ogutu, B. Using vegetation spectral indices to detect oil pollution in the Niger Delta. Remote Sens. Lett. 2015, 6, 145–154. [Google Scholar] [CrossRef]
- Onyia, N.N.; Balzter, H.; Berrio, J.C. Normalized Difference Vegetation Vigour Index: A New Remote Sensing Approach to Biodiversity Monitoring in Oil Polluted Regions. Remote Sens. 2018, 10, 897. [Google Scholar] [CrossRef]
- Numbere, A.O. Application of GIS and remote sensing towards forest resource management in mangrove forest of Niger Delta. In Natural Resources Conservation and Advances for Sustainability; Jhariya, M.K., Meena, R.S., Banerjee, A., Meena, S.N., Eds.; Elsevier: Amsterdam, The Netherlands, 2022; Chapter 20; pp. 433–459. [Google Scholar] [CrossRef]
- Fashae, O.A.; Tijani, M.N.; Adekoya, A.E.; Tijani, S.A.; Adagbasa, E.G.; Aladejana, J.A. Comparative Assessment of the Changing Pattern of Land cover along the Southwestern Coast of Nigeria using GIS and Remote Sensing techniques. Sci. Afr. 2022, 17, e01286. [Google Scholar] [CrossRef]
- Olorunfemi, I.E.; Fasinmirin, J.; Olufayo, A.A.; Komolafe, A.A. GIS and remote sensing-based analysis of the impacts of land use/land cover change (LULCC) on the environmental sustainability of Ekiti State, southwestern Nigeria. Environ. Dev. Sustain. 2020, 22, 661–692. [Google Scholar] [CrossRef]
- Fagbeja, M.; Hill, J.L.; Chatterton, T.J.; Longhurst, J.W.S.; Akpokodje, J.E.; Agbaje, G.I.; Halilu, S.A. Challenges and opportunities in the design and construction of a GIS-based emission inventory infrastructure for the Niger Delta region of Nigeria. Environ. Sci. Pollut. Res. 2017, 24, 7788–7808. [Google Scholar] [CrossRef]
- Enaruvbe, G.O.; Ige-Olumide, O. Geospatial analysis of land-use change processes in a densely populated coastal city: The case of Port Harcourt, south-east Nigeria. Geocarto Int. 2015, 30, 441–456. [Google Scholar] [CrossRef]
- Cuartero, A.; Paoletti, M.E.; Presas, A.R.; Haut, J.M. Bi-Dimensional Vector Data Analysis of Positional Accuracy of Landsat-8 Image with Pycircularstats. In Proceedings of the IGARSS 2022—2022 IEEE International Geoscience and Remote Sensing Symposium, Kuala Lumpur, Malaysia, 17–22 July 2022; pp. 2442–2445. [Google Scholar] [CrossRef]
- Lemenkova, P.; Debeir, O. Satellite Image Processing by Python and R Using Landsat 9 OLI/TIRS and SRTM DEM Data on Côte d’Ivoire, West Africa. J. Imaging 2022, 8, 317. [Google Scholar] [CrossRef] [PubMed]
- Adugna, T.; Xu, W.; Haitao, J.; Fan, J. Comparison of FY-3C VIRR and MODIS Time-Series Composite Data for Regional Land Cover Mapping of a Part of Africa. In Proceedings of the IGARSS 2022—2022 IEEE International Geoscience and Remote Sensing Symposium, Kuala Lumpur, Malaysia, 17–22 July 2022; pp. 3163–3166. [Google Scholar] [CrossRef]
- Lemenkova, P.; Debeir, O. Satellite Altimetry and Gravimetry Data for Mapping Marine Geodetic and Geophysical Setting of the Seychelles and the Somali Sea, Indian Ocean. J. Appl. Eng. Sci. 2022, 12, 191–202. [Google Scholar] [CrossRef]
- Yadav, A.; Saraswat, S.; Faujdar, N. Geological Information Extraction from Satellite Imagery Using Machine Learning. In Proceedings of the 2022 10th International Conference on Reliability, Infocom Technologies and Optimization (Trends and Future Directions) (ICRITO), Noida, India, 13–14 October 2022; pp. 1–5. [Google Scholar] [CrossRef]
- Lemenkova, P.; Debeir, O. GDAL and PROJ Libraries Integrated with GRASS GIS for Terrain Modelling of the Georeferenced Raster Image. Technologies 2023, 11, 46. [Google Scholar] [CrossRef]
- Numbere, A.O.; Camilo, G.R. Mangrove leaf litter decomposition under mangrove forest stands with different levels of pollution in the Niger River Delta, Nigeria. Afr. J. Ecol. 2017, 55, 162–167. [Google Scholar] [CrossRef]
- Kinako, P.D. Conserving the mangrove forest of the Niger Delta. Biol. Conserv. 1977, 11, 35–39. [Google Scholar] [CrossRef]
- Zabbey, N.; Kpaniku, N.; Sam, K.; Nwipie, G.; Okoro, O.; Zabbey, F.; Babatunde, B. Could community science drive environmental management in Nigeria’s degrading coastal Niger delta? Prospects and challenges. Environ. Dev. 2021, 37, 100571. [Google Scholar] [CrossRef]
- Ukpong, I.E. The performance and distribution of species along soil salinity gradients of mangrove swamps in southeastern Nigeria. Vegetatio 1991, 95, 63–70. [Google Scholar] [CrossRef]
- Akpovwovwo, U.E.; Gbadegesin, A. Species composition and distribution patterns of the Mangrove forests of the Western Niger Delta, Nigeria. Afr. Geogr. Rev. 2022, 41, 468–482. [Google Scholar] [CrossRef]
- Akpovwovwo, U.E. Mangrove growth dynamics and sediment relations in South Western Nigeria. J. Nat. Resour. Environ. Manag. 2020, 10, 688–698. [Google Scholar] [CrossRef]
- Amadi, A. A comparative ecology of estuaries in Nigeria. Hydrobiologia 1990, 208, 27–38. [Google Scholar] [CrossRef]
- Okafor, L.I.; Olojede-Nelson, S.O. Salinity changes of tidal irrigation water of mangrove swamp at Warri, Nigeria. Plant Soil 1985, 84, 23–27. [Google Scholar] [CrossRef]
- Ukpong, I.E. Vegetation and its relation to soil nutrient and salinity in the Calabar mangrove swamp, Nigeria. Mangroves Salt Marshes 1997, 1, 211–218. [Google Scholar] [CrossRef]
- Ajao, E.A. Coastal Aquatic Ecosystems, Conservation and Management Strategies in Nigeria. South. Afr. J. Aquat. Sci. 1994, 20, 3–22. [Google Scholar] [CrossRef]
- Whitmore, T. Tropical Rain Forests of the Far East, 2nd ed.; Clarendon Press: Oxford, UK, 1984; 352p. [Google Scholar]
- Wessel, P.; Luis, J.F.; Uieda, L.; Scharroo, R.; Wobbe, F.; Smith, W.H.F.; Tian, D. The Generic Mapping Tools Version 6. Geochem. Geophys. Geosyst. 2019, 20, 5556–5564. [Google Scholar] [CrossRef]
- GEBCO Compilation Group. GEBCO_2022 Grid. 2022. Available online: https://www.gebco.net/data_and_products/gridded_bathymetry_data/gebco_2022/ (accessed on 7 March 2023).
- NASA JPL. NASA Shuttle Radar Topography Mission Global 3 Arc Second. Data Set. NASA EOSDIS Land Processes DAAC. 2013. Available online: https://lpdaac.usgs.gov/products/srtmgl3v003/ (accessed on 10 March 2023).
- Adefolalu, D.O. Rainfall trends in Nigeria. Theor. Appl. Climatol. 1986, 37, 205–219. [Google Scholar] [CrossRef]
- Areola, M.; Fasona, M. Sensitivity of vegetation to annual rainfall variations over Nigeria. Remote Sens. Appl. Soc. Environ. 2018, 10, 153–162. [Google Scholar] [CrossRef]
- Hassan, I.; Kalin, R.M.; White, C.J.; Aladejana, J.A. Selection of CMIP5 GCM Ensemble for the Projection of Spatio-Temporal Changes in Precipitation and Temperature over the Niger Delta, Nigeria. Water 2020, 12, 385. [Google Scholar] [CrossRef]
- Balogun, V.S.; Onokerhoraye, A.G. Climate change vulnerability mapping across ecological zones in Delta State, Niger Delta Region of Nigeria. Clim. Serv. 2022, 27, 100304. [Google Scholar] [CrossRef]
- Hassan, I.; Kalin, R.M.; Aladejana, J.A.; White, C.J. Potential Impacts of Climate Change on Extreme Weather Events in the Niger Delta Part of Nigeria. Hydrology 2020, 7, 19. [Google Scholar] [CrossRef]
- Akintuyi, A.O.; Fasona, M.J.; Ayeni, A.O.; Soneye, A.S. Land use/land cover and climate change interaction in the derived savannah region of Nigeria. Environ. Monit. Assess. 2021, 193, 848. [Google Scholar] [CrossRef]
- Khadijat, A.; Anthony, T.; Ganiyu, O.; Bolarinwa, S. Forest cover change in Onigambari reserve, Ibadan, Nigeria: Application of vegetation index and Markov chain techniques. Egypt. J. Remote Sens. Space Sci. 2021, 24, 983–990. [Google Scholar] [CrossRef]
- Ukpong, I. Mangrove swamp at a saline/fresh water interface near Creek Town, Southeastern Nigeria. CATENA 1997, 29, 61–71. [Google Scholar] [CrossRef]
- Daramola, S.; Li, H.; Otoo, E.; Idowu, T.; Gong, Z. Coastal evolution assessment and prediction using remotely sensed front vegetation line along the Nigerian Transgressive Mahin mud coast. Reg. Stud. Mar. Sci. 2022, 50, 102167. [Google Scholar] [CrossRef]
- Osinowo, A.A.; Popoola, S.O. Long-term spatio-temporal trends in extreme wave events in the Niger delta coastlines. Cont. Shelf Res. 2021, 224, 104471. [Google Scholar] [CrossRef]
- Ansah, C.E.; Abu, I.O.; Kleemann, J.; Mahmoud, M.I.; Thiel, M. Environmental Contamination of a Biodiversity Hotspot—Action Needed for Nature Conservation in the Niger Delta, Nigeria. Sustainability 2022, 14, 14256. [Google Scholar] [CrossRef]
- Obida, C.B.; Blackburn, G.A.; Whyatt, J.D.; Semple, K.T. Counting the cost of the Niger Delta’s largest oil spills: Satellite remote sensing reveals extensive environmental damage with >1million people in the impact zone. Sci. Total Environ. 2021, 775, 145854. [Google Scholar] [CrossRef]
- Eyankware, M.; Aleke, C.; Selemo, A.; Nnabo, P. Hydrogeochemical studies and suitability assessment of groundwater quality for irrigation at Warri and environs., Niger delta basin, Nigeria. Groundw. Sustain. Dev. 2020, 10, 100293. [Google Scholar] [CrossRef]
- Echendu, A.J.; Okafor, H.F.; Iyiola, O. Air Pollution, Climate Change and Ecosystem Health in the Niger Delta. Soc. Sci. 2022, 11, 525. [Google Scholar] [CrossRef]
- Sojinu, O.S.; Sonibare, O.O.; Zeng, E. Polycyclic Aromatic Hydrocarbons (PAHs) in Sediments from the Ologe Lagoon, Nigeria. Energy Sources Part A Recovery Util. Environ. Eff. 2013, 35, 1524–1531. [Google Scholar] [CrossRef]
- Munasinghe, D.; Cohen, S.; Gadiraju, K.A. Review of Satellite Remote Sensing Techniques of River Delta Morphology Change. Remote Sens. Earth Syst. Sci. 2021, 4, 44–75. [Google Scholar] [CrossRef]
- George, C.F.; Macdonald, D.I.; Spagnolo, M. Deltaic sedimentary environments in the Niger Delta, Nigeria. J. Afr. Earth Sci. 2019, 160, 103592. [Google Scholar] [CrossRef]
- Kamalu, O.; Isirimah, N.; Ugwa, I.; Orimoloye, J. Evaluating the Characteristics of the Meander Belt Soils of the Niger Delta, Southeastern Nigeria. Singap. J. Trop. Geogr. 2002, 23, 207–216. [Google Scholar] [CrossRef]
- Howard, I.C.; Okpara, K.E.; Techato, K. Toxicity and Risks Assessment of Polycyclic Aromatic Hydrocarbons in River Bed Sediments of an Artisanal Crude Oil Refining Area in the Niger Delta, Nigeria. Water 2021, 13, 3295. [Google Scholar] [CrossRef]
- Chris, D.I.; Anyanwu, B.O. Pollution and Potential Ecological Risk Evaluation Associated with Toxic Metals in an Impacted Mangrove Swamp in Niger Delta, Nigeria. Toxics 2023, 11, 6. [Google Scholar] [CrossRef] [PubMed]
- Ukhurebor, K.E.; Athar, H.; Adetunji, C.O.; Aigbe, U.O.; Onyancha, R.B.; Abifarin, O. Environmental implications of petroleum spillages in the Niger Delta region of Nigeria: A review. J. Environ. Manag. 2021, 293, 112872. [Google Scholar] [CrossRef] [PubMed]
- Amusan, A.A.; Adeniyi, I.F. Characterization and Heavy Metal Retention Capacity of Soils in Mangrove Forest of the Niger Delta, Nigeria. Commun. Soil Sci. Plant Anal. 2005, 36, 2033–2045. [Google Scholar] [CrossRef]
- Okoye, E.A.; Ezejiofor, A.N.; Nwaogazie, I.L.; Frazzoli, C.; Orisakwe, O.E. Heavy metals and arsenic in soil and vegetation of Niger Delta, Nigeria: Ecological risk assessment. Case Stud. Chem. Environ. Eng. 2022, 6, 100222. [Google Scholar] [CrossRef]
- Okoye, E.A.; Bocca, B.; Ruggieri, F.; Ezejiofor, A.N.; Nwaogazie, I.L.; Domingo, J.L.; Rovira, J.; Frazzoli, C.; Orisakwe, O.E. Metal pollution of soil, plants, feed and food in the Niger Delta, Nigeria: Health risk assessment through meat and fish consumption. Environ. Res. 2021, 198, 111273. [Google Scholar] [CrossRef]
- Onyia, N.N.; Balzter, H.; Berrío, J.C. 19—Evaluating the performance of vegetation indices for detecting oil pollution effects on vegetation using hyperspectral (Hyperion EO-1) and multispectral (Sentinel-2A) data in the Niger Delta. In Hyperspectral Remote Sensing; Pandey, P.C., Srivastava, P.K., Balzter, H., Bhattacharya, B., Petropoulos, G.P., Eds.; Earth Observation; Elsevier: Amsterdam, The Netherlands, 2020; pp. 377–399. [Google Scholar] [CrossRef]
- Odisu, T.; Okieimen, C.; Ogbeide, S. Oil spill model development and application for predicting vertical transport of non-volatile aliphatic hydrocarbons in stagnant water: Case of Nigerian Niger Delta mangrove swamps. Mar. Pollut. Bull. 2021, 164, 111993. [Google Scholar] [CrossRef]
- Zabbey, N.; Uyi, H. Community responses of intertidal soft-bottom macrozoobenthos to oil pollution in a tropical mangrove ecosystem, Niger Delta, Nigeria. Mar. Pollut. Bull. 2014, 82, 167–174. [Google Scholar] [CrossRef] [PubMed]
- Zabbey, N.; Ekpenyong, I.; Nwipie, G.; Davies, I.; Sam, K. Effects of fragmented mangroves on macrozoobenthos: A case study of mangrove clearance for powerline right-of-way at Oproama Creek, Niger Delta, Nigeria. Afr. J. Aquat. Sci. 2021, 46, 185–195. [Google Scholar] [CrossRef]
- Omiunu, F.G. The port factor in the growth and decline of Warri and Sapele townships in the western Niger Delta region of Nigeria. Appl. Geogr. 1989, 9, 57–69. [Google Scholar] [CrossRef]
- James, G.K.; Adegoke, J.O.; Osagie, S.; Ekechukwu, S.; Nwilo, P.; Akinyede, J. Social valuation of mangroves in the Niger Delta region of Nigeria. Int. J. Biodivers. Sci. Ecosyst. Serv. Manag. 2013, 9, 311–323. [Google Scholar] [CrossRef]
- Goldberg, L.; Lagomasino, D.; Thomas, N.; Fatoyinbo, T. Global declines in human-driven mangrove loss. Glob. Chang. Biol. 2020, 26, 5844–5855. [Google Scholar] [CrossRef] [PubMed]
- Onyenekwe, C.S.; Okpara, U.T.; Opata, P.I.; Egyir, I.S.; Sarpong, D.B. The Triple Challenge: Food Security and Vulnerabilities of Fishing and Farming Households in Situations Characterized by Increasing Conflict, Climate Shock, and Environmental Degradation. Land 2022, 11, 1982. [Google Scholar] [CrossRef]
- Ebhuoma, E.E.; Simatele, M.D.; Leonard, L.; Ebhuoma, O.O.; Donkor, F.K.; Tantoh, H.B. Theorising Indigenous Farmers’ Utilisation of Climate Services: Lessons from the Oil-Rich Niger Delta. Sustainability 2020, 12, 7349. [Google Scholar] [CrossRef]
- Babanyara, Y.; Usman, H.; Saleh, U. An Overview of Urban Poverty and Environmental Problems in Nigeria. J. Hum. Ecol. 2010, 31, 135–143. [Google Scholar] [CrossRef]
- Feka, N.Z.; Ajonina, G.N. Drivers causing decline of mangrove in West-Central Africa: A review. Int. J. Biodivers. Sci. Ecosyst. Serv. Manag. 2011, 7, 217–230. [Google Scholar] [CrossRef]
- Orijemie, E.A. Holocene Mangrove Dynamics and Environmental Changes in the Coastal region of South Western Nigeria. Quat. Int. 2012, 279–280, 360–361. [Google Scholar] [CrossRef]
- Roy, D.; Kovalskyy, V.; Zhang, H.; Vermote, E.; Yan, L.; Kumar, S.; Egorov, A. Characterization of Landsat-7 to Landsat-8 reflective wavelength and normalized difference vegetation index continuity. Remote Sens. Environ. 2016, 185, 57–70. [Google Scholar] [CrossRef] [PubMed]
- Ozigis, M.S.; Kaduk, J.D.; Jarvis, C. Mapping terrestrial oil spill impact using machine learning random forest and Landsat 8 OLI imagery: A case site within the Niger Delta region of Nigeria. Environ. Sci. Pollut. Res. 2019, 26, 3621–3635. [Google Scholar] [CrossRef] [PubMed]
- Gundlach, E.R.; Bonte, M.; Story, N.I.; Iroakasi, O. Using high-resolution imagery from 2013 and 2020 to establish baseline vegetation in oil-damaged mangrove habitat prior to large-scale post-remediation planting in Bodo, Eastern Niger Delta, Nigeria. Remote Sens. Appl. Soc. Environ. 2022, 28, 100831. [Google Scholar] [CrossRef]
- Sobande, A.A. Remote Sensing Applications to Evaluating Patterns of Coastal Erosion around the Niger River Delta, West Africa. Environ. Geosci. 1997, 4, 133–136. [Google Scholar] [CrossRef]
- Twumasi, Y.A.; Merem, E.C. GIS and Remote Sensing Applications in the Assessment of Change within a Coastal Environment in the Niger Delta Region of Nigeria. Int. J. Environ. Res. Public Health 2006, 3, 98–106. [Google Scholar] [CrossRef]
- Lemenkova, P.; Debeir, O. Seismotectonics of Shallow-Focus Earthquakes in Venezuela with Links to Gravity Anomalies and Geologic Heterogeneity Mapped by a GMT Scripting Language. Sustainability 2022, 14, 15966. [Google Scholar] [CrossRef]
- Lemenkova, P.; Debeir, O. Quantitative Morphometric 3D Terrain Analysis of Japan Using Scripts of GMT and R. Land 2023, 12, 261. [Google Scholar] [CrossRef]
- Kaufman, Y.; Tanre, D. Atmospherically resistant vegetation index (ARVI) for EOS-MODIS. IEEE Trans. Geosci. Remote Sens. 1992, 30, 261–270. [Google Scholar] [CrossRef]
- Huete, A.; Liu, H.; Batchily, K.; van Leeuwen, W. A comparison of vegetation indices over a global set of TM images for EOS-MODIS. Remote Sens. Environ. 1997, 59, 440–451. [Google Scholar] [CrossRef]
- Gitelson, A.A.; Kaufman, Y.J.; Merzlyak, M.N. Use of a green channel in remote sensing of global vegetation from EOS-MODIS. Remote Sens. Environ. 1996, 58, 289–298. [Google Scholar] [CrossRef]
- Kauth, R.J.; Thomas, G.S. The Tasselled Cap—A Graphic Description of the Spectral-Temporal Development of Agricultural Crops as Seen by LANDSAT. In Proceedings of the Symposium on Machine Processing of Remotely Sensed Data, West Lafayette, IN, USA, 29 June–1 July 1976; pp. 1–13. [Google Scholar]
- Huang, C.; Wylie, B.; Yang, L.; Homer, C.; Zylstra, G. Derivation of a tasselled cap transformation based on Landsat 7 at-satellite reflectance. Int. J. Remote Sens. 2002, 23, 1741–1748. [Google Scholar] [CrossRef]
- Crist, E.P.; Cicone, R.C. A Physically-Based Transformation of Thematic Mapper Data—The TM Tasseled Cap. IEEE Trans. Geosci. Remote Sens. 1984, GE-22, 256–263. [Google Scholar] [CrossRef]
- Tucker, C.J. Red and photographic infrared linear combinations for monitoring vegetation. Remote Sens. Environ. 1979, 8, 127–150. [Google Scholar] [CrossRef]
- Naji, T.A.H. Study of vegetation cover distribution using DVI, PVI, WDVI indices with 2D-space plot. J. Phys. Conf. Ser. 2018, 1003, 012083. [Google Scholar] [CrossRef]
- Tucker, C.; Elgin, J.; McMurtrey, J.; Fan, C. Monitoring corn and soybean crop development with hand-held radiometer spectral data. Remote Sens. Environ. 1979, 8, 237–248. [Google Scholar] [CrossRef]
- Rondeaux, G.; Steven, M.; Baret, F. Optimization of soil-adjusted vegetation indices. Remote Sens. Environ. 1996, 55, 95–107. [Google Scholar] [CrossRef]
- Datt, B. Remote Sensing of Chlorophyll a, Chlorophyll b, Chlorophyll a+b, and Total Carotenoid Content in Eucalyptus Leaves. Remote Sens. Environ. 1998, 66, 111–121. [Google Scholar] [CrossRef]
- Richardson, A.J.; Wiegand, C.L. Distinguishing Vegetation from Soil Background Information. Photogramm. Eng. Remote Sens. 1977, 43, 1541–1552. [Google Scholar]
- Perry, C.R.; Lautenschlager, L.F. Functional equivalence of spectral vegetation indices. Remote Sens. Environ. 1984, 14, 169–182. [Google Scholar] [CrossRef]
- Pinty, B.; Verstraete, M.M. GEMI: A non-linear index to monitor global vegetation from satellites. Plant Ecol. 1992, 101, 15–20. [Google Scholar] [CrossRef]
- McFeeters, S.K. The use of the Normalized Difference Water Index (NDWI) in the delineation of open water features. Int. J. Remote Sens. 1996, 17, 1425–1432. [Google Scholar] [CrossRef]
- Gao, B. NDWI—A normalized difference water index for remote sensing of vegetation liquid water from space. Remote Sens. Environ. 1996, 58, 257–266. [Google Scholar] [CrossRef]
- Qi, J.; Chehbouni, A.; Huete, A.; Kerr, Y.; Sorooshian, S. A modified soil adjusted vegetation index. Remote Sens. Environ. 1994, 48, 119–126. [Google Scholar] [CrossRef]
- Qi, J.; Kerr, Y.H.; Chehbouni, A. External factor consideration in vegetation index development. In Proceedings of the Physical Measurements and Signatures in Remote Sensing ISPRS, Val d’Isère, France, 17–21 January 1994; pp. 723–730. [Google Scholar]
- Fabijańczyk, P.; Zawadzki, J. Spatial correlations of NDVI and MSAVI2 indices of green and forested areas of urban agglomeration, case study Warsaw, Poland. Remote Sens. Appl. Soc. Environ. 2022, 26, 100721. [Google Scholar] [CrossRef]
- Crippen, R.E. Calculating the vegetation index faster. Remote Sens. Environ. 1990, 34, 71–73. [Google Scholar] [CrossRef]
- Huete, A.; Didan, K.; Miura, T.; Rodriguez, E.; Gao, X.; Ferreira, L. Overview of the radiometric and biophysical performance of the MODIS vegetation indices. Remote Sens. Environ. 2002, 83, 195–213. [Google Scholar] [CrossRef]
- Nababa, I.I.; Symeonakis, E.; Koukoulas, S.; Higginbottom, T.P.; Cavan, G.; Marsden, S. Land Cover Dynamics and Mangrove Degradation in the Niger Delta Region. Remote Sens. 2020, 12, 3619. [Google Scholar] [CrossRef]
- Musa, Z.N.; Popescu, I.; Mynett, A. The Niger Delta’s vulnerability to river floods due to sea level rise. Nat. Hazards Earth Syst. Sci. 2014, 14, 3317–3329. [Google Scholar] [CrossRef]
- Eyoh, A.; Okwuashi, O. Spatial and Temporal Evaluation of Land Use/Land Cover Change of the Niger Delta Region of Nigeria from 1986-2016. SSRG Int. J. Geoinform. Geol. Sci. 2017, 4, 20–28. [Google Scholar] [CrossRef]
- Udoka, U.P.; Opara, A.I.; Nwankwor, G.I.; Ebhuoma, O.O. Mapping Land Use and Land Cover in parts of the Niger Delta for Effective Planning and Administration. Int. J. Sci. Eng. Res. 2015, 6, 274–281. [Google Scholar]
- Bamidele, S.; Erameh, N.I. Environmental degradation and sustainable peace dialogue in the Niger delta region of Nigeria. Resour. Policy 2023, 80, 103274. [Google Scholar] [CrossRef]
- Tobore, A.; Bamidele, S. Wetland change prediction of Ogun-River Basin, Nigeria: Application of cellular automata Markov and remote sensing techniques. Watershed Ecol. Environ. 2022, 4, 158–168. [Google Scholar] [CrossRef]
- James, G.K.; Adegoke, J.O.; Saba, E.; Nwilo, P.; Akinyede, J. Satellite-Based Assessment of the Extent and Changes in the Mangrove Ecosystem of the Niger Delta. Mar. Geod. 2007, 30, 249–267. [Google Scholar] [CrossRef]
- Ayanlade, A.; Drake, N. Forest loss in different ecological zones of the Niger Delta, Nigeria: Evidence from remote sensing. GeoJournal 2016, 81, 717–735. [Google Scholar] [CrossRef]
- Edegbene, A.O.; Akamagwuna, F.C.; Odume, O.N.; Arimoro, F.O.; Edegbene Ovie, T.T.; Akumabor, E.C.; Ogidiaka, E.; Kaine, E.A.; Nwaka, K.H. A Macroinvertebrate-Based Multimetric Index for Assessing Ecological Condition of Forested Stream Sites Draining Nigerian Urbanizing Landscapes. Sustainability 2022, 14, 11289. [Google Scholar] [CrossRef]
- Adegun, O.B.; Ikudayisi, A.E.; Morakinyo, T.E.; Olusoga, O.O. Urban green infrastructure in Nigeria: A review. Sci. Afr. 2021, 14, e01044. [Google Scholar] [CrossRef]
- Onyena, A.P.; Sam, K. A review of the threat of oil exploitation to mangrove ecosystem: Insights from Niger Delta, Nigeria. Glob. Ecol. Conserv. 2020, 22, e00961. [Google Scholar] [CrossRef]


| Date | Spacecraft | Landsat Product ID | Scene ID | Cloudiness |
|---|---|---|---|---|
| 20 December 2013 | Landsat 8 | LC08_L1TP_189056_20131220_20200912_02_T1 | LC81890562013354LGN01 | 6.46 |
| 26 December 2015 | Landsat 8 | LC08_L1TP_189056_20151226_20200908_02_T1 | LC81890562015360LGN01 | 17.54 |
| 18 December 2021 | Landsat 8 | LC09_L1TP_189056_20211218_20220121_02_T1 | LC91890562021352LGN01 | 32.32 |
| 29 December 2022 | Landsat 9 | LC08_L1TP_189056_20221229_20230104_02_T1 | LC81890562022363LGN00 | 0.59 |
| Class | 2013 | 2015 | 2021 | 2021 | ||||
|---|---|---|---|---|---|---|---|---|
| ID | nr. of pixels | cluster size | nr. of pixels | cluster size | nr. of pixels | cluster size | nr. of pixels | cluster size |
| 1 | 0.0 | 1 | 99,304.0 | 2 | 0.0 | 1 | 0.0 | 1 |
| 2 | 24,202.5 | 2 | 793,875.9 | 3 | 179,803.3 | 3 | 324,638.7 | 1 |
| 3 | 535,828.3 | 4 | 768,423.9 | 3 | 249,647.7 | 6 | 367,419.8 | 3 |
| 4 | 686,438.4 | 8 | 432,318.7 | 4 | 305,940.8 | 11 | 416,219.5 | 6 |
| 5 | 740,729.6 | 9 | 426,391.2 | 8 | 408,108.2 | 11 | 556,665.7 | 9 |
| 6 | 783,803.7 | 9 | 291,778.8 | 10 | 603,527.3 | 12 | 647,066.0 | 9 |
| 7 | 906,337.9 | 10 | 263,588.5 | 14 | 628,916.8 | 12 | 750,900.1 | 12 |
| 8 | 915,597.2 | 16 | 259,272.9 | 16 | 629,041.5 | 13 | 984,741.4 | 13 |
| 9 | 999,878.2 | 18 | 1,483,831.7 | 20 | 645,075.3 | 14 | 1,162,375.3 | 18 |
| 10 | 2,292,524.5 | 23 | 1,094,319.1 | 20 | 1,372,956.2 | 17 | 1,516,837.6 | 18 |
| Class | 2013 | 2018 | 2021 | 2022 | ||||||||
|---|---|---|---|---|---|---|---|---|---|---|---|---|
| ID | B4 | B3 | B2 | B4 | B3 | B2 | B4 | B3 | B2 | B4 | B3 | B2 |
| 1 | 9362.333 | 9803.222 | 8742.333 | 10,352.65 | 10,539.35 | 8699.400 | 9150.500 | 9643.167 | 8150.667 | 11,409.333 | 11,031.333 | 9693.000 |
| 2 | 9631.111 | 9699.000 | 8448.778 | 10,848.50 | 11,077.50 | 9607.300 | 11,394.000 | 11,449.667 | 9541.667 | 9672.556 | 9612.056 | 8631.333 |
| 3 | 12,549.750 | 12,197.500 | 10,335.750 | 10,879.55 | 10,833.90 | 8936.950 | 9900.929 | 10,211.571 | 8387.929 | 23,552.000 | 22,211.000 | 18,896.000 |
| 4 | 8920.261 | 9311.826 | 8221.783 | 9816.75 | 10,058.75 | 8333.625 | 10,262.692 | 10,408.692 | 8676.462 | 10,117.556 | 9809.111 | 8729.111 |
| 5 | 10,144.625 | 10,144.875 | 8946.250 | 9825.25 | 10,284.50 | 8776.500 | 9463.333 | 9956.667 | 8546.000 | 8466.667 | 8940.750 | 8148.417 |
| 6 | 8151.000 | 9824.000 | 8126.500 | 10,372.43 | 10,680.93 | 9107.500 | 10,811.182 | 10,739.182 | 8965.091 | 8179.333 | 8705.333 | 7906.833 |
| 7 | 8658.938 | 9129.000 | 8067.750 | 11,872.33 | 11,513.67 | 9631.333 | 9408.917 | 9741.917 | 8132.583 | 8887.889 | 9152.389 | 8166.667 |
| 8 | 8276.889 | 8930.222 | 8045.611 | 10,080.38 | 10,360.25 | 8400.188 | 15,769.000 | 14,325.000 | 12,446.000 | 9110.308 | 9375.154 | 8483.538 |
| 9 | 8939.500 | 9494.900 | 8524.100 | 11,897.50 | 11,900.00 | 10,818.000 | 9763.182 | 10,158.000 | 8879.636 | 10,554.909 | 10,198.455 | 9056.000 |
| 10 | 9217.000 | 10,015.000 | 5465.000 | 13,052.00 | 12,427.00 | 10,482.333 | 9559.706 | 9997.765 | 8030.059 | 9374.222 | 9420.889 | 8187.556 |
Disclaimer/Publisher’s Note: The statements, opinions and data contained in all publications are solely those of the individual author(s) and contributor(s) and not of MDPI and/or the editor(s). MDPI and/or the editor(s) disclaim responsibility for any injury to people or property resulting from any ideas, methods, instructions or products referred to in the content. |
© 2023 by the authors. Licensee MDPI, Basel, Switzerland. This article is an open access article distributed under the terms and conditions of the Creative Commons Attribution (CC BY) license (https://creativecommons.org/licenses/by/4.0/).
Share and Cite
Lemenkova, P.; Debeir, O. Computing Vegetation Indices from the Satellite Images Using GRASS GIS Scripts for Monitoring Mangrove Forests in the Coastal Landscapes of Niger Delta, Nigeria. J. Mar. Sci. Eng. 2023, 11, 871. https://doi.org/10.3390/jmse11040871
Lemenkova P, Debeir O. Computing Vegetation Indices from the Satellite Images Using GRASS GIS Scripts for Monitoring Mangrove Forests in the Coastal Landscapes of Niger Delta, Nigeria. Journal of Marine Science and Engineering. 2023; 11(4):871. https://doi.org/10.3390/jmse11040871
Chicago/Turabian StyleLemenkova, Polina, and Olivier Debeir. 2023. "Computing Vegetation Indices from the Satellite Images Using GRASS GIS Scripts for Monitoring Mangrove Forests in the Coastal Landscapes of Niger Delta, Nigeria" Journal of Marine Science and Engineering 11, no. 4: 871. https://doi.org/10.3390/jmse11040871