Article

Mechanism of Phase-Locked Ice Crushing against Offshore Structures

1
Key Laboratory of Far-Shore Wind Power Technology of Zhejiang Province, Hangzhou 311122, China
2
Powerchina Huadong Engineering Corporation Limited, Hangzhou 311122, China
3
School of Marine Science and Engineering, International Campus, South China University of Technology, Guangzhou 511442, China
4
Naval Arichitecture and Ocean Engineering College, Dalian Maritime University, Dalian 116026, China
*
Author to whom correspondence should be addressed.
J. Mar. Sci. Eng. 2023, 11(4), 868; https://doi.org/10.3390/jmse11040868
Submission received: 23 February 2023 / Revised: 3 April 2023 / Accepted: 4 April 2023 / Published: 20 April 2023
(This article belongs to the Special Issue Ice-Structure Interaction in Marine Engineering)

Abstract

:
This paper addresses a detailed analysis of the ice–structure interaction process of the phase-locked ice crushing (PLC) against offshore structures. Directly measured ice load, structure response data, and in situ observation from the field measurements on the Molikpaq lighthouse and jacket platform were used in the study. This paper summarizes a new ductile damage-collapse (DDC) failure mechanism for the PLC process. The DDC mechanism shows that the ice failure is a discrete ductile crushing process rather than a ductile–brittle transition process. The analysis identifies that the ice has a failure length in PLC and this failure length plays an important role in understanding the interaction. It reveals that PLC can occur on most vertical-sided offshore structures when the velocity of the ice sheet falls within the range of the failure length divided by the natural period of the structure. This paper proposes that this relationship between ice failure length and the natural period of the structure can be used as one of the PLC occurrence conditions. The DDC failure mechanism provides a basis for another technical route to solve the PLC problem.

1. Introduction

The crushing failure of ice against vertical structures is sensitive to the ice-drift speed. The failure modes change from creep to intermittent crushing to continuous brittle crushing as the speed increases from a few mm/s to more than 10 cm/s. Among these failure modes, the crushing failure at low ice-drift velocity, typically lower than 10 cm/s, is critical for the structures. This is because it causes high static ice load as well as a violent dynamic response from the structure. Different specialists have used various terms to describe this failure mode, such as intermittent crushing, frequency lock-in crushing and phase-locked loading [1,2,3]. To avoid confusion in this paper, PLC is adopted to denote the ice crushing at low-drift velocity.
The PLC load scenario can affect most existing vertical-sided structures. For narrow structures such as channel markers, jacket platforms, and lighthouses, many researchers have reported lock-in vibrations [2,3,4,5,6,7,8]. For wide structures such as the Molikpaq caisson platform, Jefferies [9] and Jordaan et al. [10] have reported dynamic responses induced by phase-locked loading. Several theoretical models have been developed to analyze the dynamic ice action effect in PLC [11,12,13,14,15]. These models are based on different explanations of the ice failure process. Some models assume that the ice failure is inherently periodic and that the lock-in between the frequency of ice failure and the natural frequency of the structure causes the frequency lock-in between the ice load and the structure response [11,12]. Other models consider that the intermittent crushing is due to the descending dependence of the ice’s strength on the indentation rate in a certain interval of indentation rates. The ice failure transitions from ductile to brittle crushing mode and causes fluctuations of ice forces and self-excited vibration [2,5,6,13,14,15]. For wide structures, Gagnon [16] presents a system resonant capped spalling and erratic spalling model and illustrates the process as the resonance of the platform and the ice sheet system.
However, the industry still lacks a well-accepted method for this analysis. ISO 19906 adopted a simplified method that uses a saw teeth load function to analyze the response. This method neglects the fact that ice load is coupled with structure response. Moreover, it is difficult to define the ice load for wide structures because the ice load frequency does not lock-in with the natural frequency of the structure.
This paper adopts ductile damage-collapse (DDC) as the ice failure mechanism for PLC based on a summary of field measurement results [17]. The DDC process is considered as an inherent failure mechanism of ice under a low loading rate. The failure is a discrete process coupled with structure displacement, and in each failure cycle, the ice sheet fails in a limited depth. The ice failure length is the key parameter in this process, and it is used as one of the occurrence conditions of PLC along with the natural period of the structure.

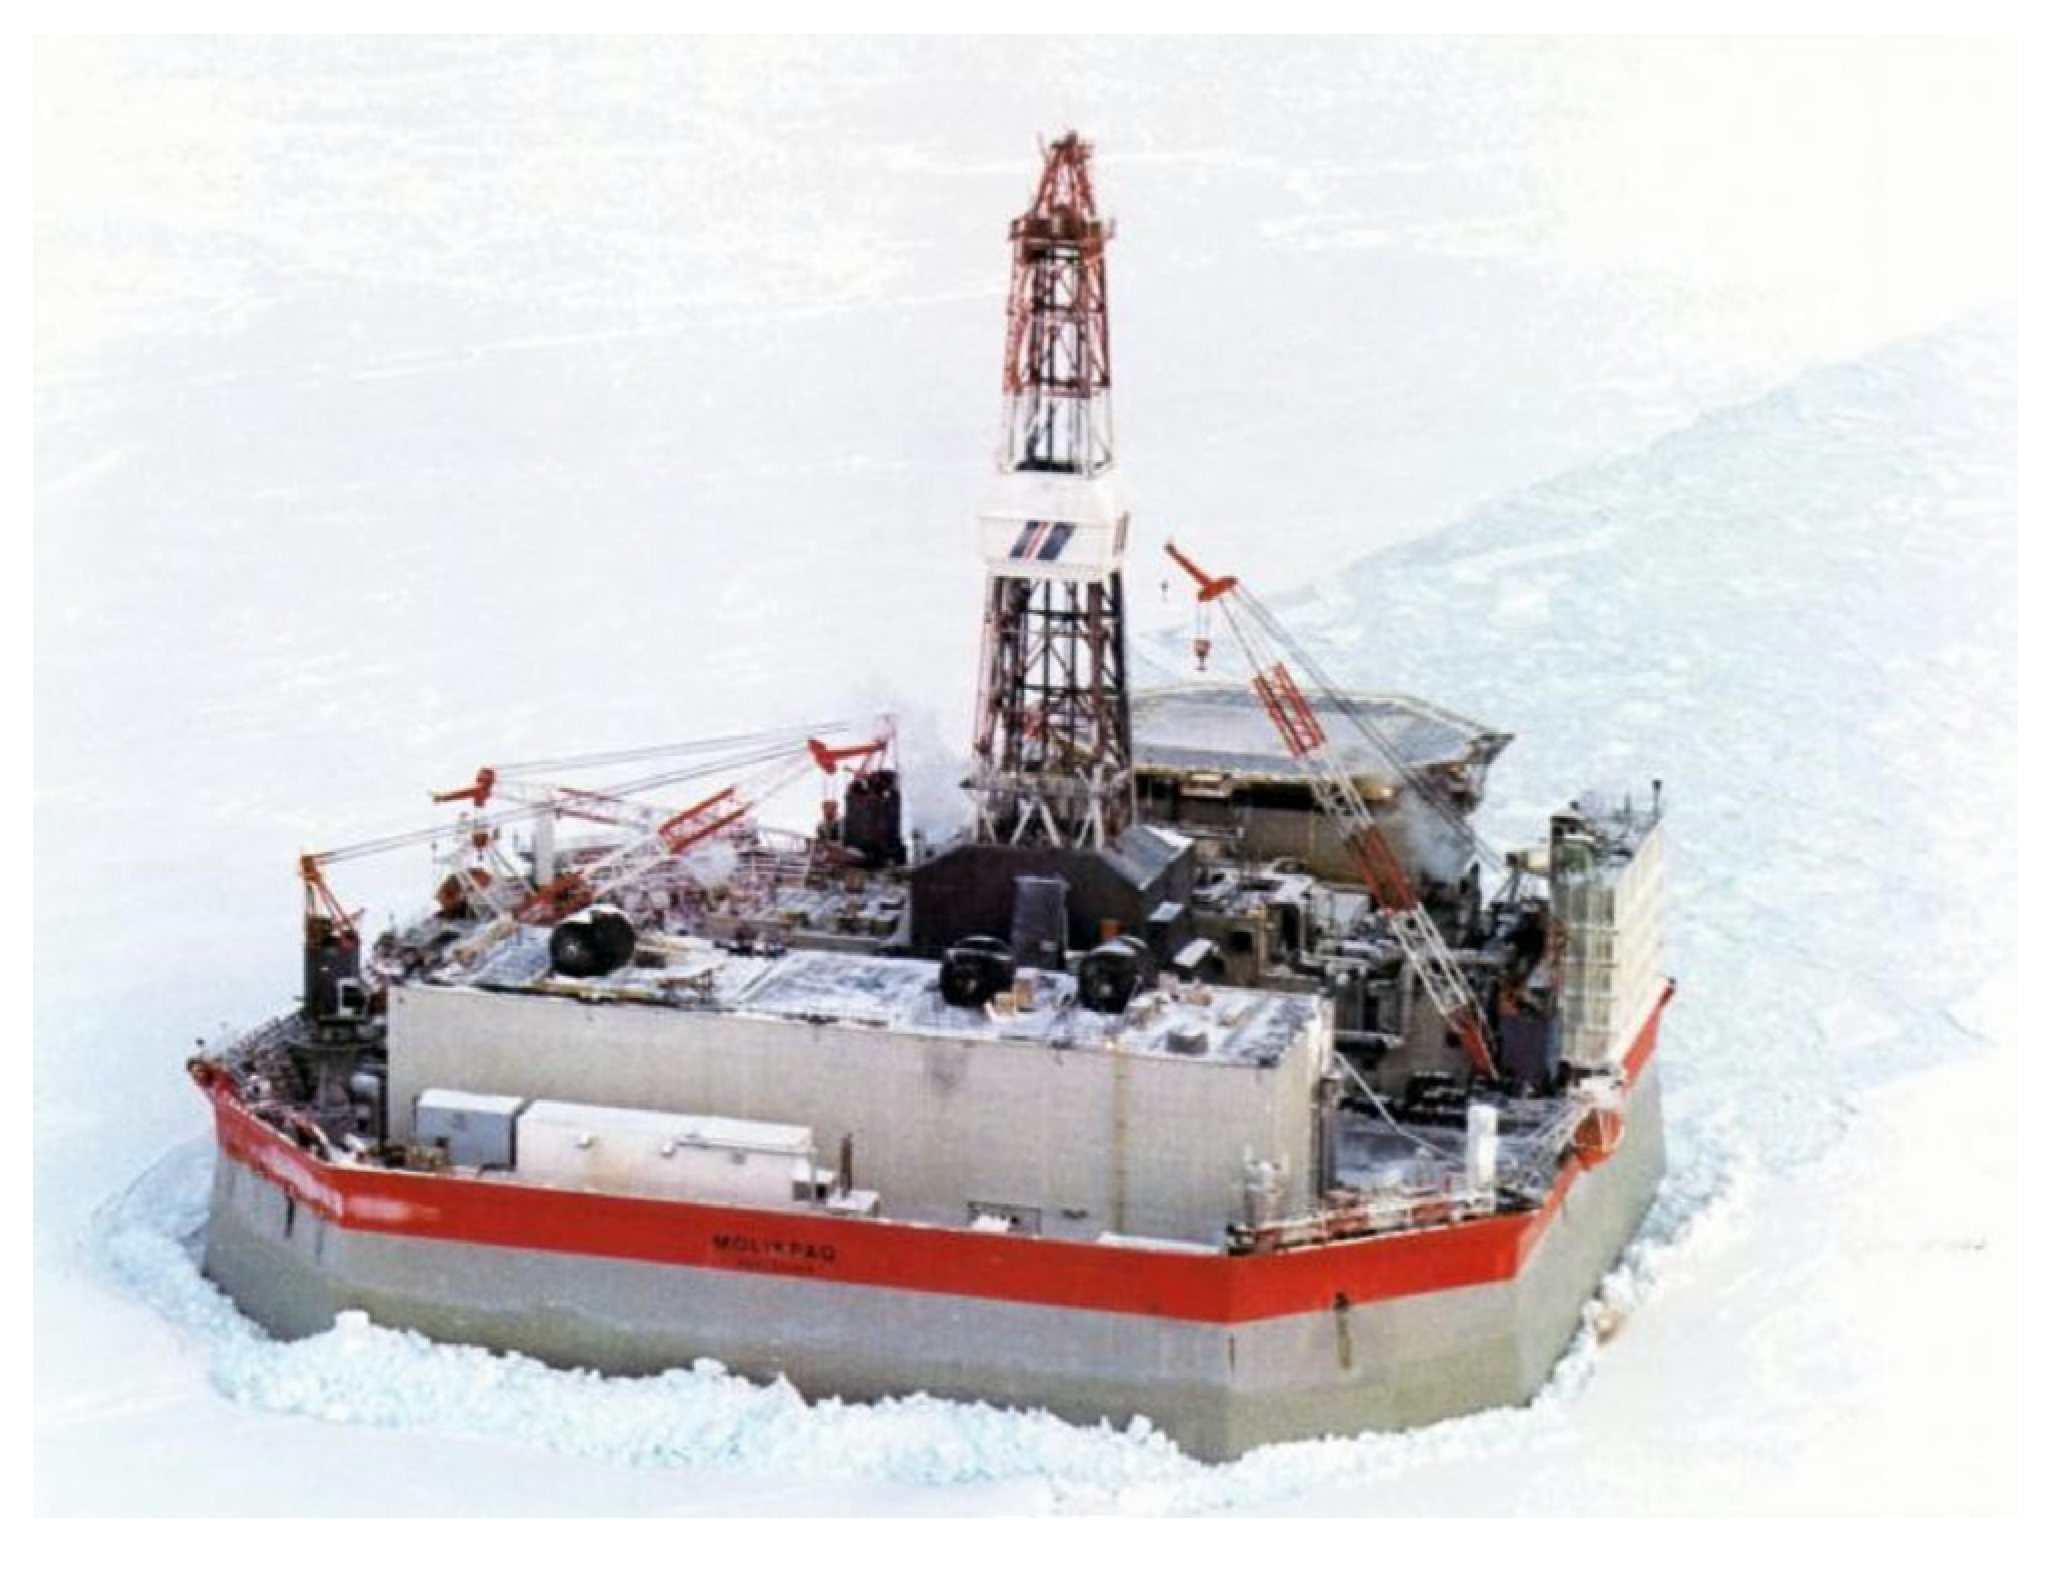
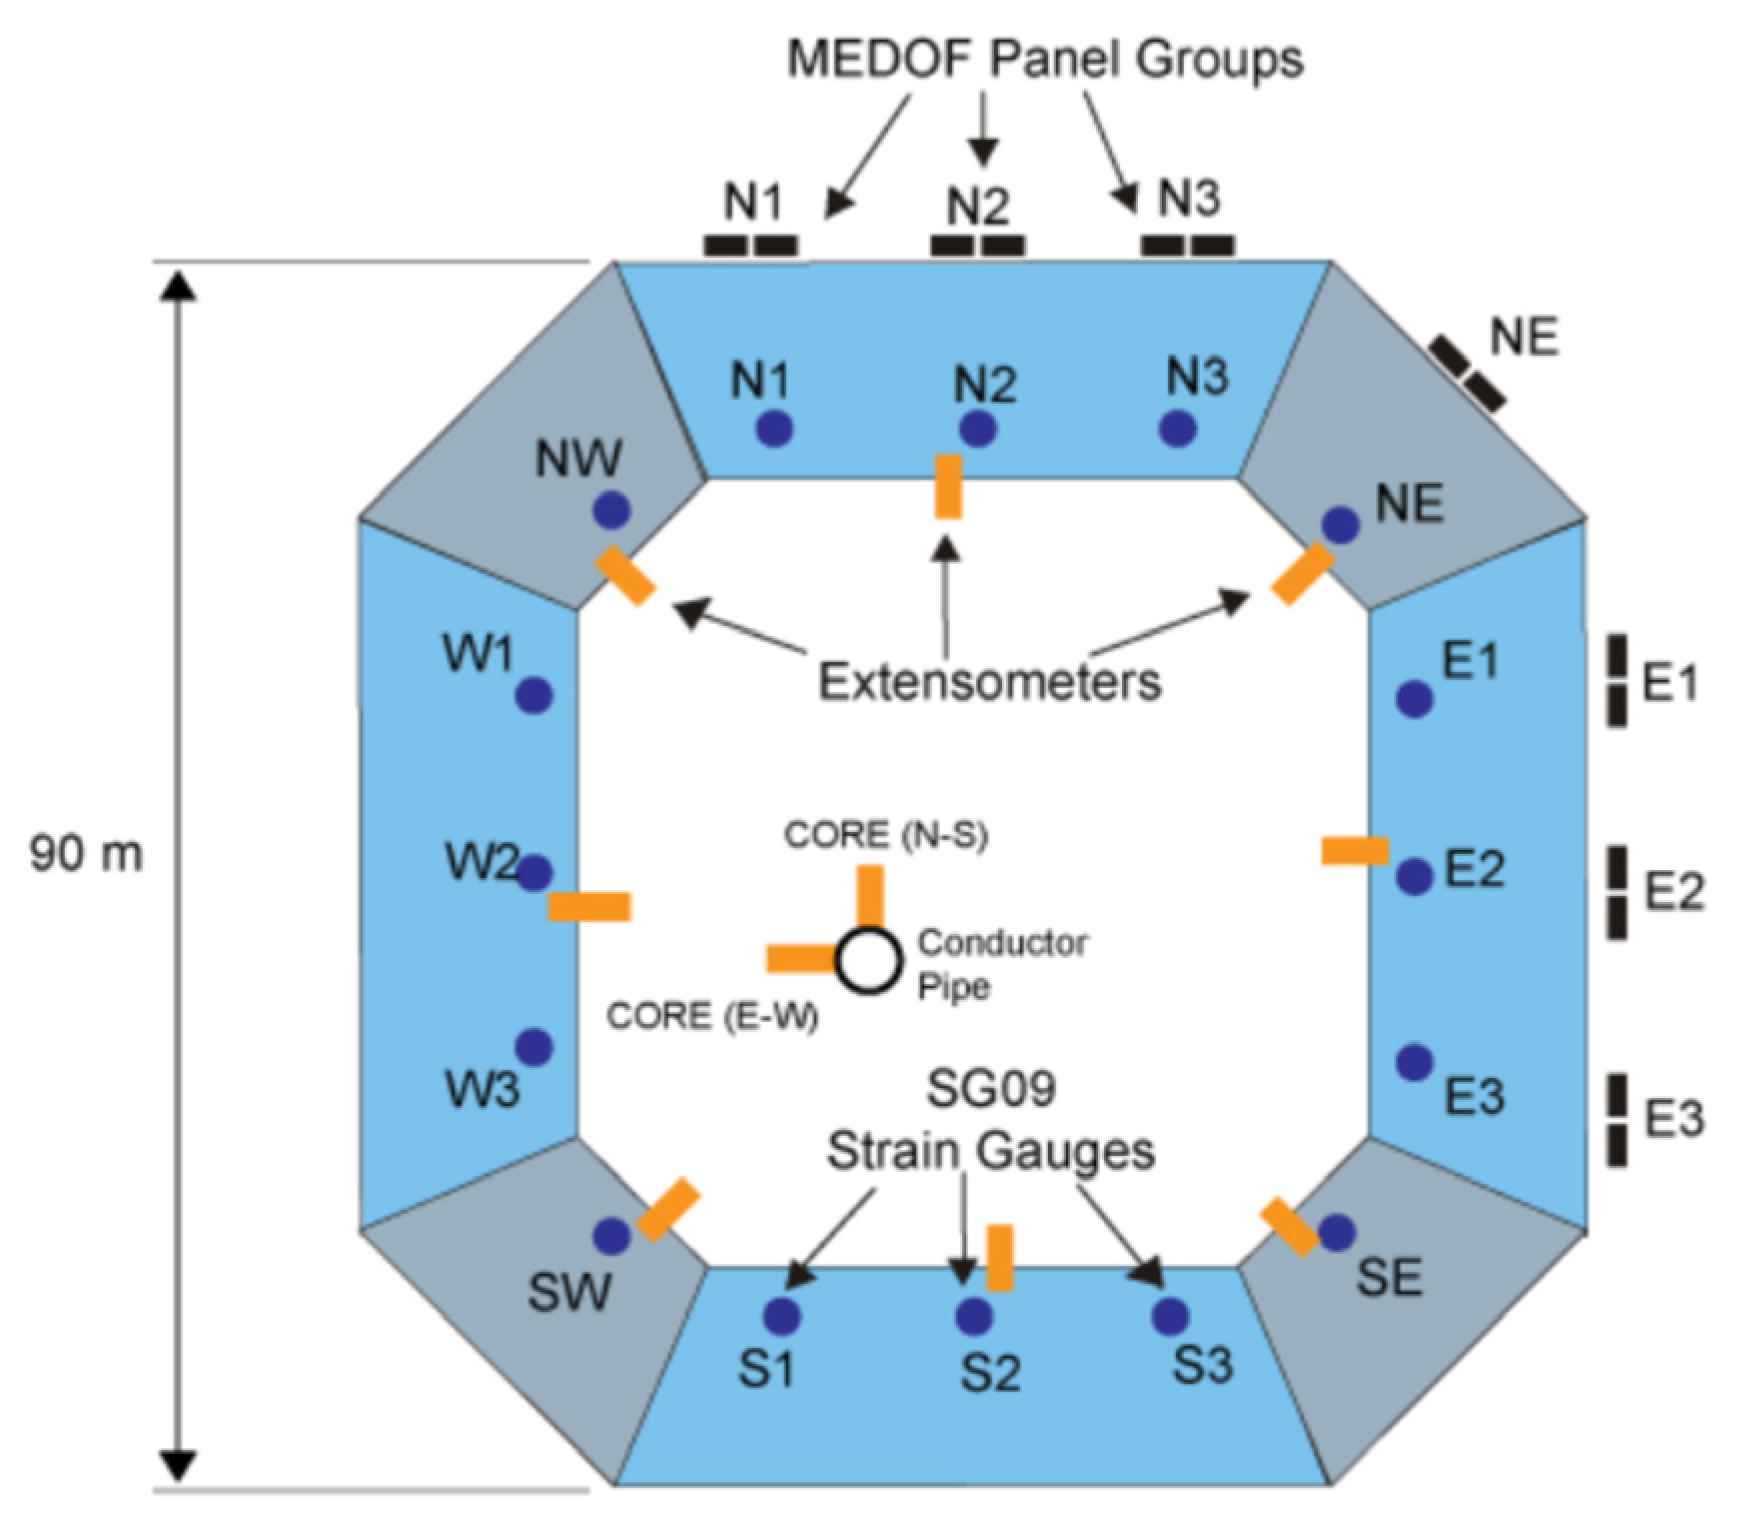
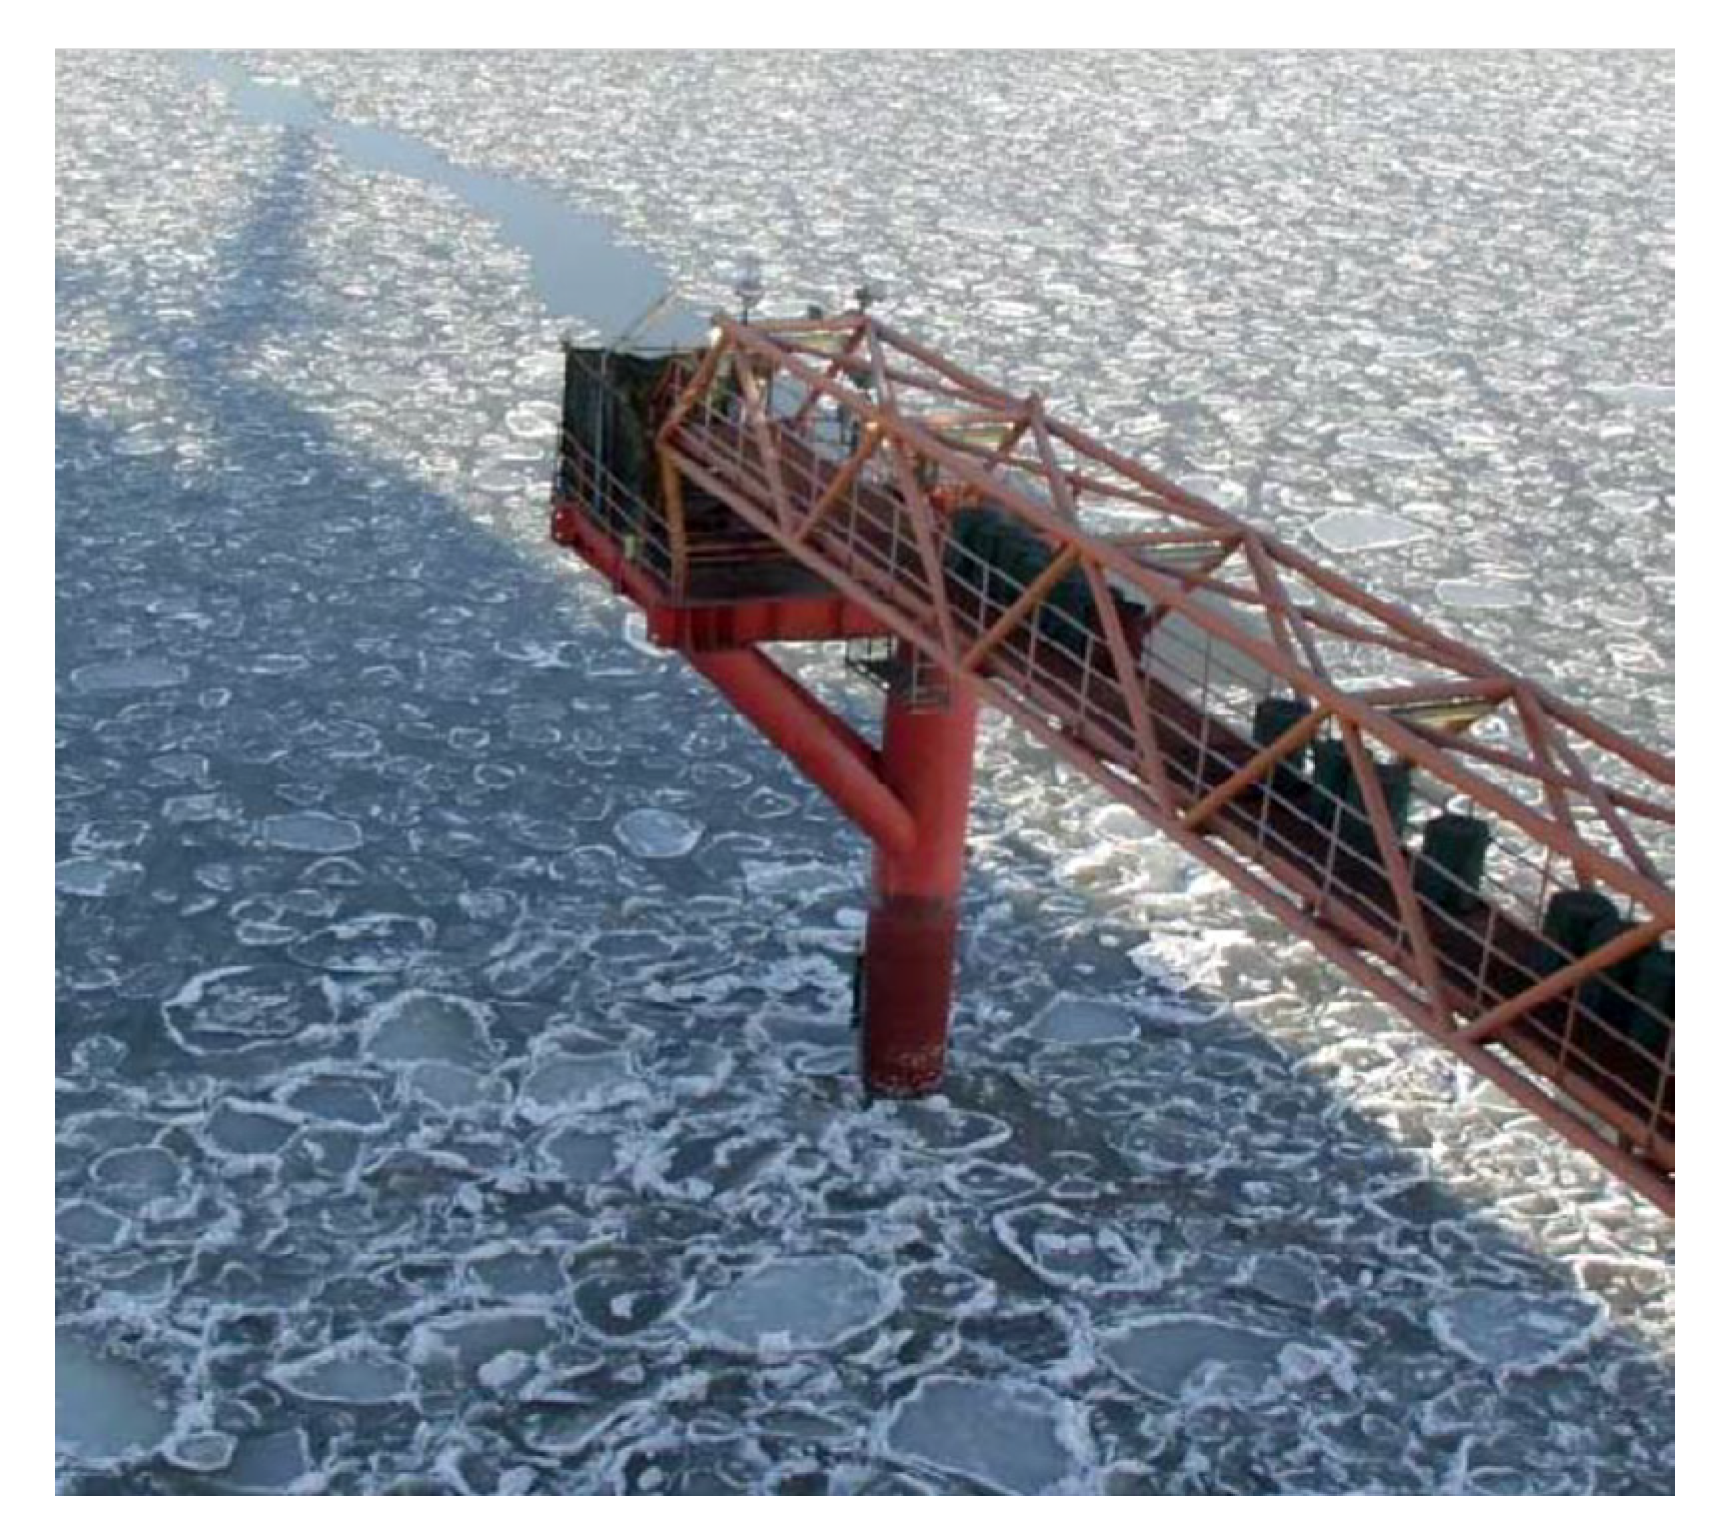
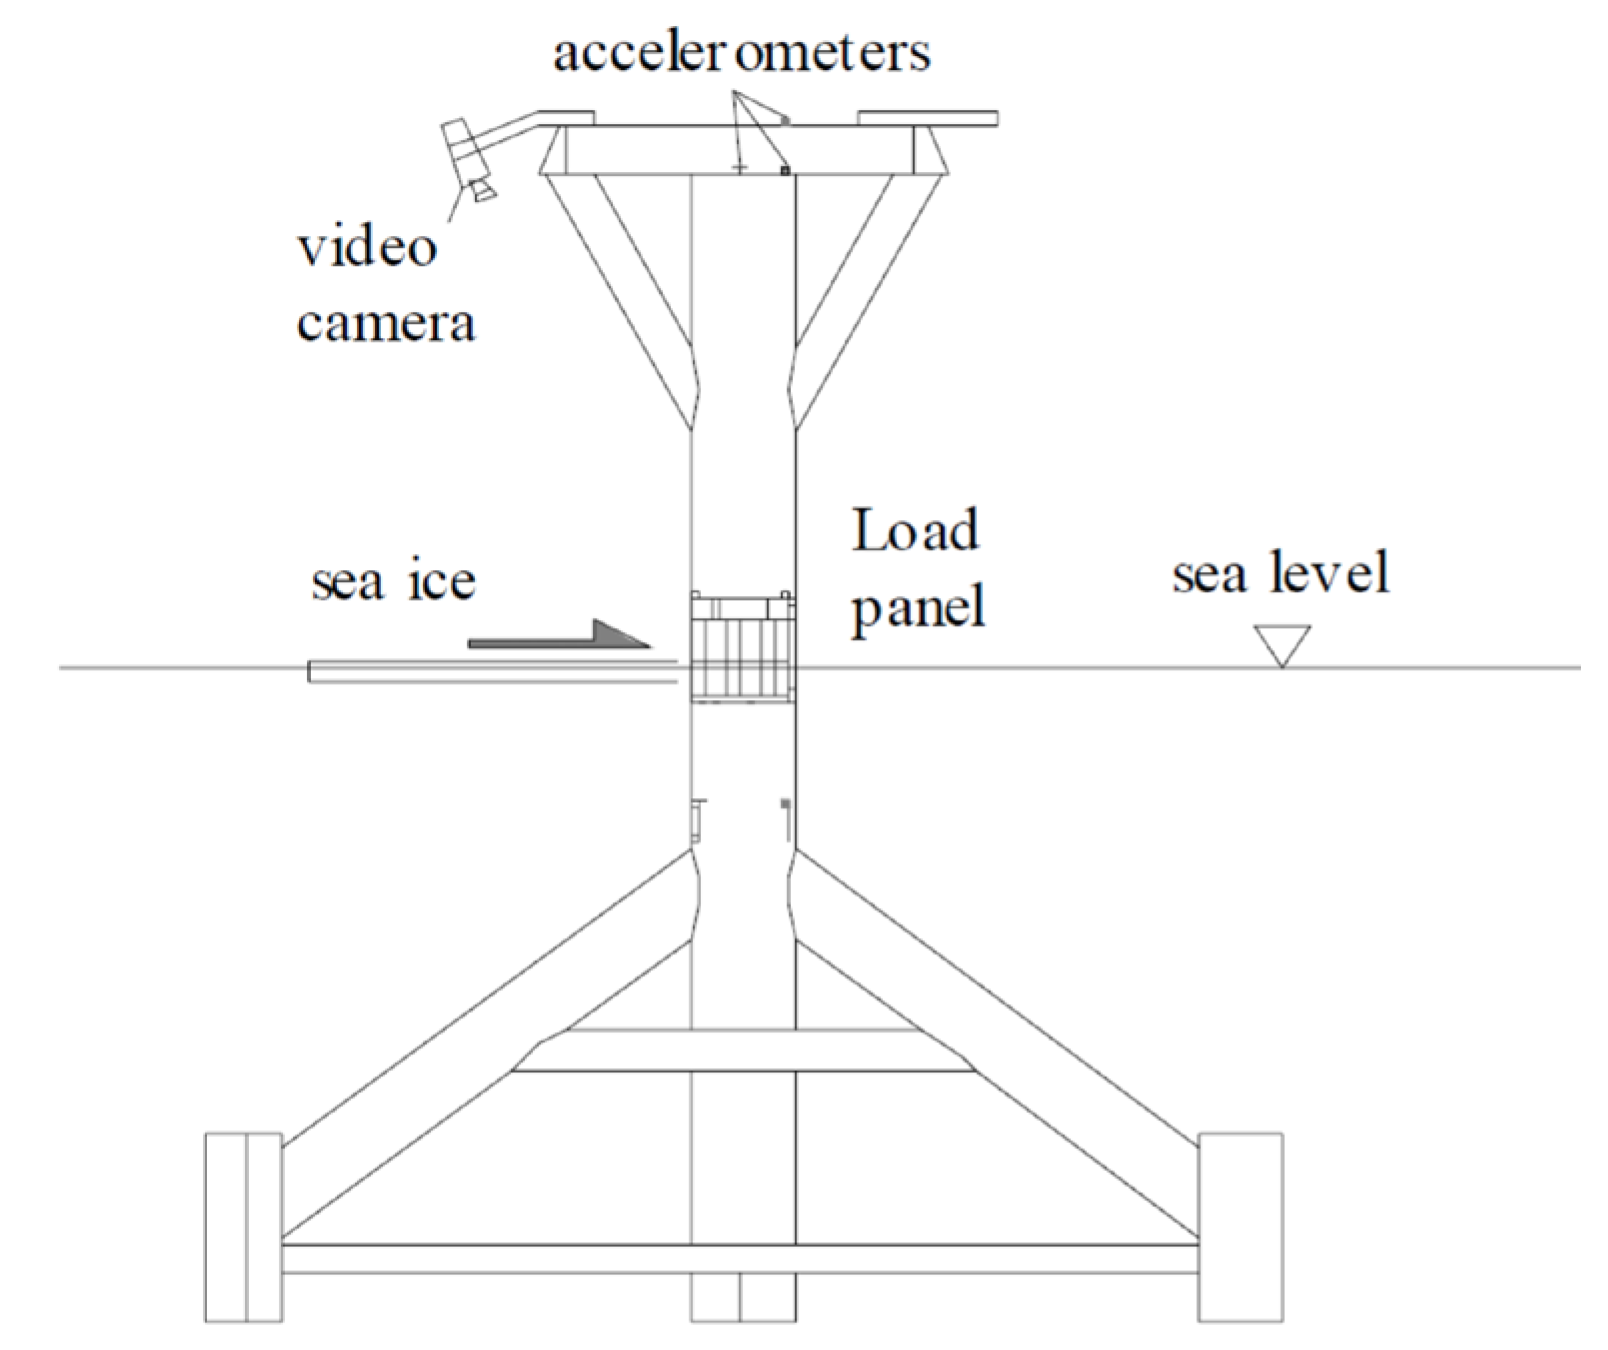
2. PLC Measured on Offshore Structures

PLC has been found to be the most violent ice loading regime for offshore structures in full-scale measurements. The measurements on jacket oil platforms in Cook Inlet of Alaska, Bohai Bay in China, Norstromsgrund Lighthouse in the Baltic Sea, and the Molikpaq platform have shown that PLC causes large static load, a strong dynamic response of the structure, and even structural damage. The data collected in these measurements have been widely used as the basis for industry codes. Additionally, the directly measured ice load played an important role for understanding the ice action.
The ice load in the PLC process on the Molikpaq platform was measured in the winter season of 1985–1986. The Molikpaq platform is a wide annular steel caisson with a width of 90 m at the water line, as shown in Figure 1. The platform was used as a drilling platform in the Beaufort Sea. To study the ice action on the platform, it was equipped with MEDOF panels, strain gauges, extensometers, tiltmeters, and accelerometers, as shown in Figure 2 [18].
Thirty-one MEDOF panels were installed on the north, northeast, and east faces of the caisson to measure ice load. The load panel had a width of 1.135 m and a height of 2.715 m. The panels were arranged in seven clusters of four or five panels each. The center-to-center spacing between different clusters was 19.5 m or 17 m.
The Molikpaq encountered severe ice conditions in the winter of 1985/1986 and four events were identified as PLC based on the dynamic response and the phase-locked signatures of the platform–ice interaction [19].
PLC ice action has also been observed on most jacket offshore oil and gas infrastructures in Bohai Bay, China. It has occurred on jacket platforms with three or four legs or monoleg mooring piles. It has caused strong lock-in vibrations with a magnitude of up to 2 g/s2 and a costly duration of more than 20 min. Ice breaking cones were added on most of the platforms after the frequency lock-in vibration damaged the gas pipe on the topside. The ice load during the PLC process was measured by load panels that covered about 170 degrees of the jacket leg surface with a diameter of 1.5 to 2 m. The dimensions of each load panel were 62 cm in height and 27 cm in width. Along with the load data, the structure response was measured by accelerometers. The ice failure process against the structure was recorded by video cameras and in situ observations. Figure 3 and Figure 4 show the structures and measurement system on the mooring pole of JZ9-3 oil field.
The analysis of the PLC events from the Bohai Sea indicates that the slender steel structures are prone to PLC failure and it occurs in conditions where the ice speed is less than 0.04 m/s.
The Norstromsgrund Lighthouse in the Baltic Sea, shown in Figure 5, was equipped with ice load panels, accelerometers, and video cameras to measure the ice action. Many PLC events were measured in the 1980s and 2000s. The lighthouse has a diameter of about 7.5 m at the water line and a total height of 42.3 m. Nine sets of load panels, each with an area of 1.2 m by 1.6 m, covered about 162 degrees of the structure’s surface at the waterline. Figure 6 shows the load panels used on the lighthouse, which were larger than those used on the jacket platforms in Bohai Bay.
Nord et al. [20] analyzed full-scale measurements of the lighthouse from 1979 to 1988 and from 2001 to 2003. They identified 61 events of ice-induced vibrations as resonant vibrations between 2001 and 2003. These events were characterized by response oscillations with a dominant frequency component ranging from 2 to 2.7 Hz, with most between 2.2 and 2.4 Hz. The events involved level ice, rafted ice, and ridges, with ice thicknesses and ice velocities varying from 0.26 to 1.9 m and from 0.023 to 0.075 m s−1, respectively.
Table 1 summarizes the structural configuration and occurrence conditions of the above-mentioned PLC events. It shows that the structures had different types from different regions. The ice thickness ranged from a few centimeters to 1–2 m. This suggests that PLC can occur on various types of vertical-sided structures in different sea ice regions.
Figure 7 and Figure 8 show the typical phase relationship between the ice load and the response of the structures from the oil platform and lighthouse. Although the structures have different types and sizes of load panels, which may affect the magnitude and frequency of the ice load, the measured load and response exhibited similar characteristics. The first characteristic is that the vibration resembles a sinusoidal curve rather than random vibrations caused by continuous brittle crushing. The second is that the ice load appears to have a saw tooth shape on both small- and large-load panels. The last is that the ice force and structure response have a fixed phase relationship. The ice forces decrease when the structure moves back from its maximum displacement position and increase again when the structure reaches the equilibrium position.
The ice–structure interaction process experienced by the Molikpaq platform in 1986 was studied by Jefferies, M. and Spencer, P. [9] and Jefferies [19]. Based on the analysis of the ice load and acceleration data shown in Figure 9 and Figure 10, they suggested that although the ice load was dynamic, the system was not in an oscillation mode. This implies that dynamic unloading in a highly damped situation would be a more accurate description of ‘dynamic ice loading’.
The field data show that the response of the Molikpaq to dynamic ice load differs from the lock-in vibration of lighthouse and jacket structures. The difference is that the Molikpaq platform is a caisson on a sand core, which creates large damping. The system is close to an overdamped or critically damped system which returns to the equilibrium position after unloading without oscillating. The inertia force of the platform causes small or even no negative displacement against the ice-movement direction after unloading.
Two phenomena observed in the field measurements can be highlighted as features of the PLC process. One is the stop and run movement of ice during the PLC process, and the other is the simultaneous saw tooth ice forces measured by the load panels. The stop and run phenomenon means that the ice movement before the structure looks like it suddenly stops and runs. The reason behind this is that when PLC occurs, the ice moves at a low velocity that is close to the structure’s velocity. When the structure moves in the same direction as the ice, it seems there is no relative motion between the ice and the structure and no obvious ice failure can be observed. The ice appears to stop before the structure. When the structure moves opposite to the ice, the ice collapses and extrudes. It appears that the ice runs before the structure.
The ice load data measured by different load panels plotted in Figure 11 and Figure 12 show the simultaneous phenomenon of saw tooth ice loads during PLC. In Figure 11, from 6700 s to 6705 s, the ice load has a saw tooth shape, which indicates PLC happened. Due to the direction of the ice acting on the structure, only load panels No. 7, 8, and 9 were under ice action in this event. The load data recorded by these three load panels all have the same phase change during the locking-in vibration. It should be noted that the width of each load panel is 1.2 m in the lighthouse measurement. This implies that the ice sheet breaks simultaneously throughout the contact surface.
Figure 12 displays the ice load data recorded by the load panels on the Molikpaq platform. The forces have the same simultaneous characteristic even though the load panels are 30 m apart from each other. Based on this observation, Jefferies, M.G. and Wright, W.H. [9] identified the following features of the PLC ice–structure interaction on the Molikpaq:
  • The ice–structure interaction process does not affect ice motion. The structure’s response is coupled with ice failure and extrusion.
  • Ice crushing occurs simultaneously across the contact surface and the ice sheet is crushed into powder.
  • The structure’s response is a steady vibration rather than a stochastic process.
  • The platform’s response appears to be partially uncoupled from the ice loading function.
These features indicate that despite different responses of structures to ice failure, the ice sheet undergoes the same simultaneous failure process. For the lighthouse, the width of the synchronized ice crushing area is 7 m; for the oil platform in Bohai Bay, it is about 1.5 m; and for the Molikpaq, it is more than 80 m. Unlike continuous brittle ice crushing at high speed, in which the ice load and ice crushing are random and non-simultaneous, the ice failure during PLC exhibits typical ductile characteristics.

3. Ice Structure Interaction during PLC

To illustrate the ice failure process in PLC, the ice load and structure response data in two cycles of interaction were plotted in Figure 13.
In the figure, the interaction in one cycle can be characterized by three points F1 to F3. The stage between F1 and F2 is the loading phase and F2 to F3 is the unloading phase. The ice failure, ice load, and structure’s status in the two stages are listed in Table 2 and illustrated in Figure 14. It is assumed that the ice moves toward x+ direction at velocity Vice, the magnitude of the vibration is A, and the velocity of the structure at the waterline is Vs.
The failure process, as illustrated in Table 2, has the following features:
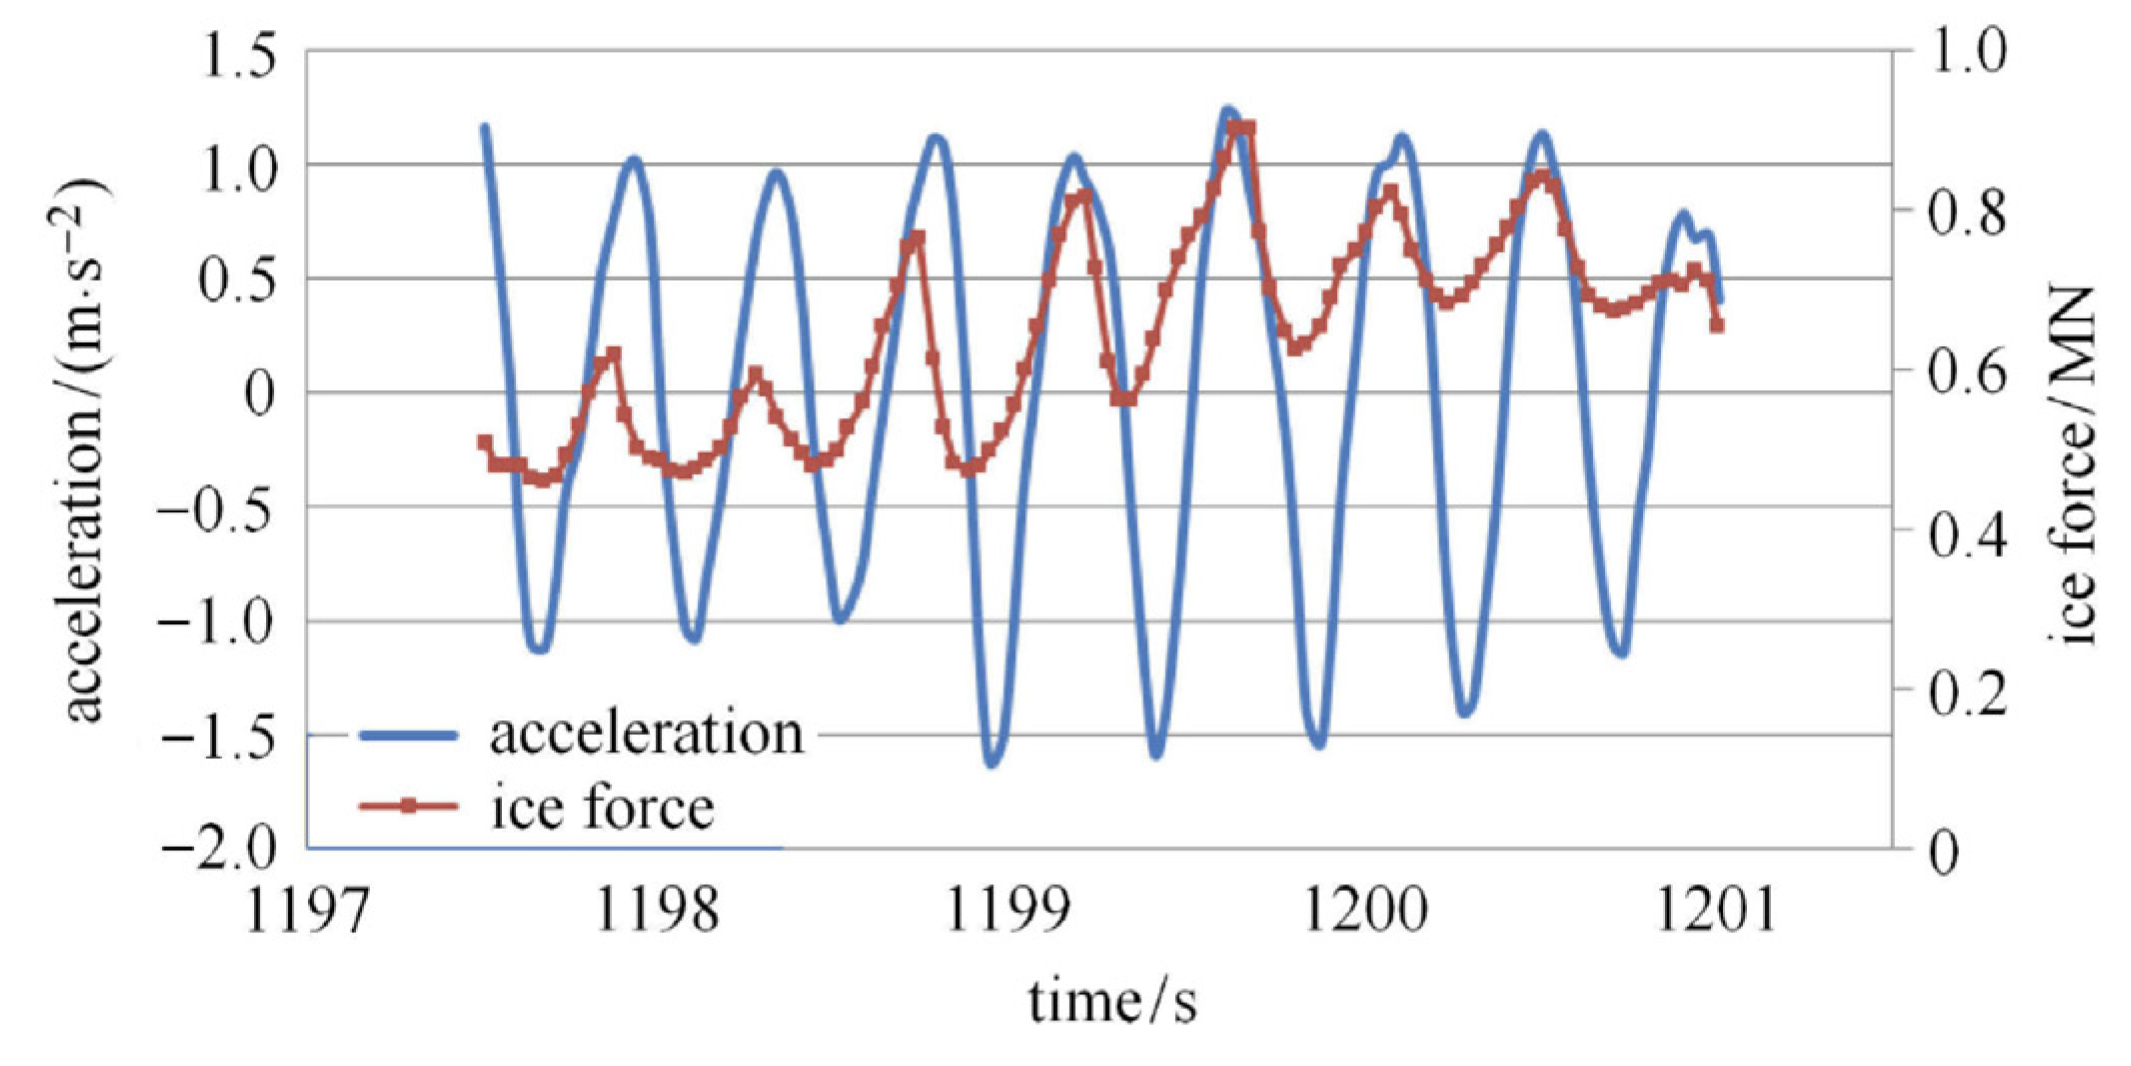
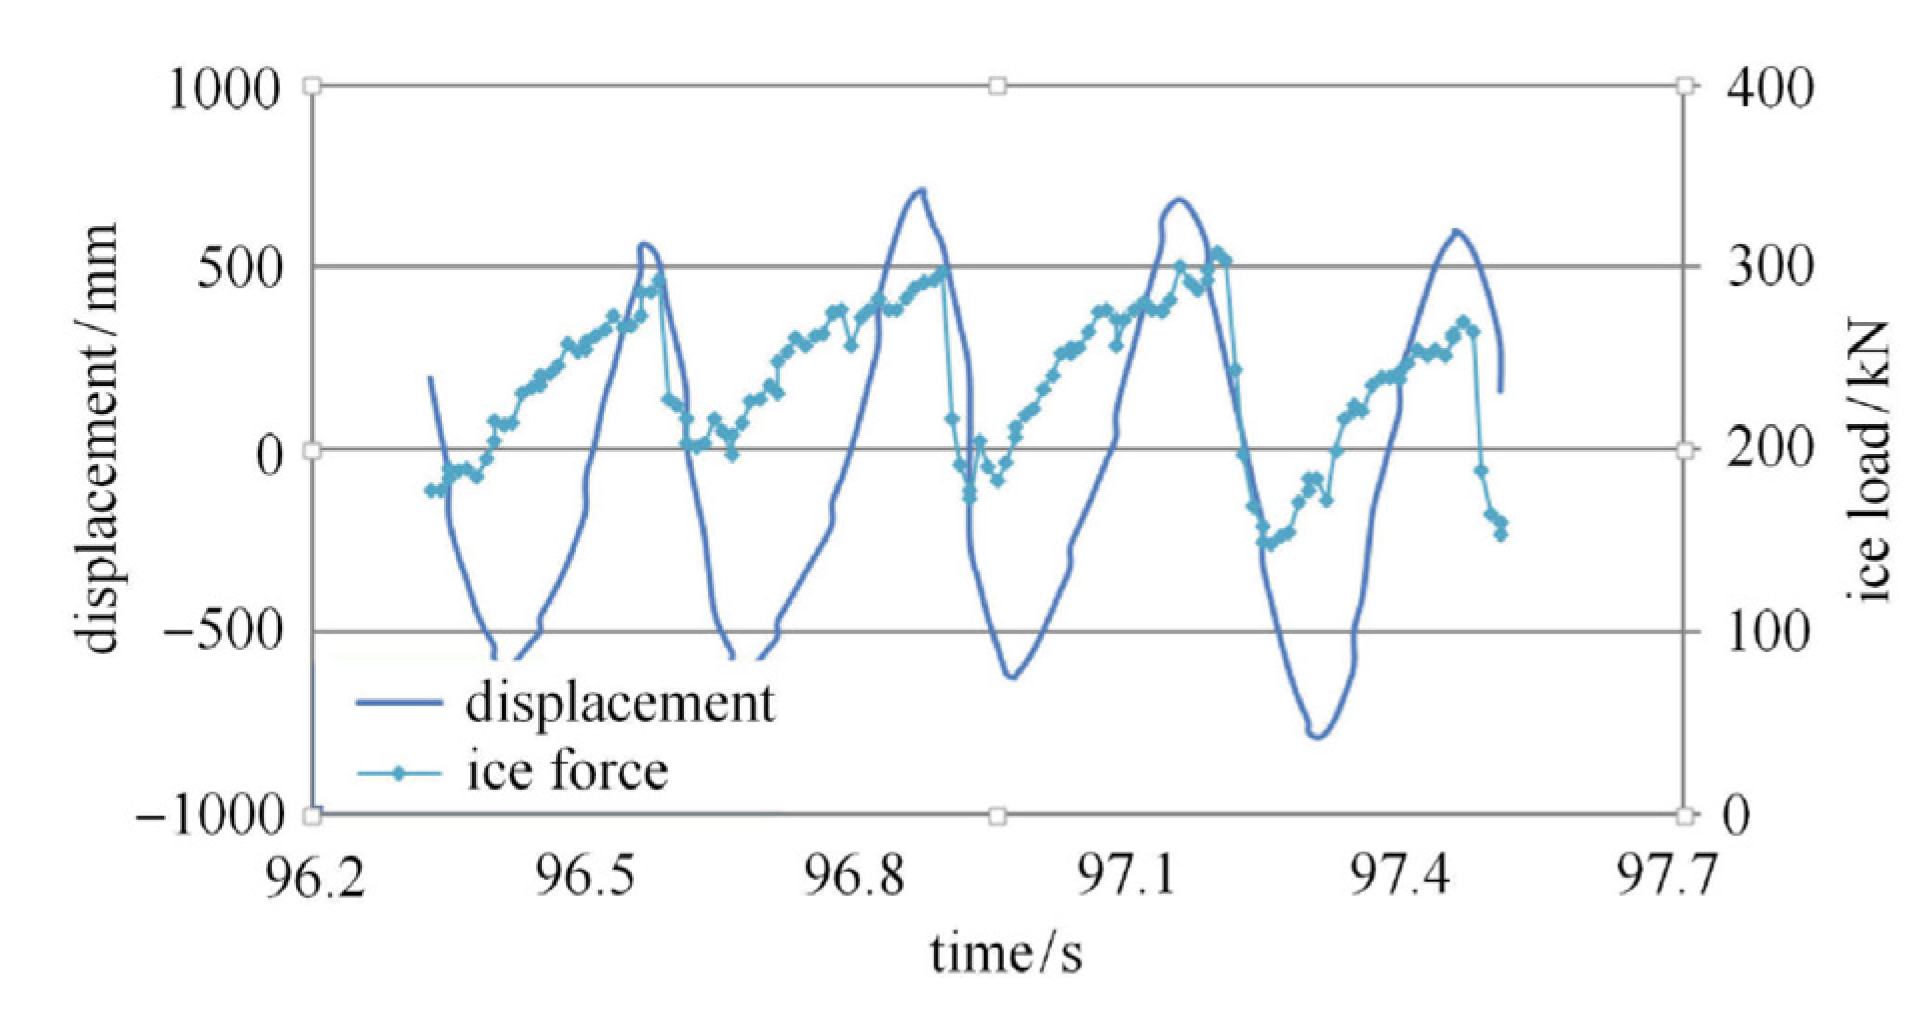
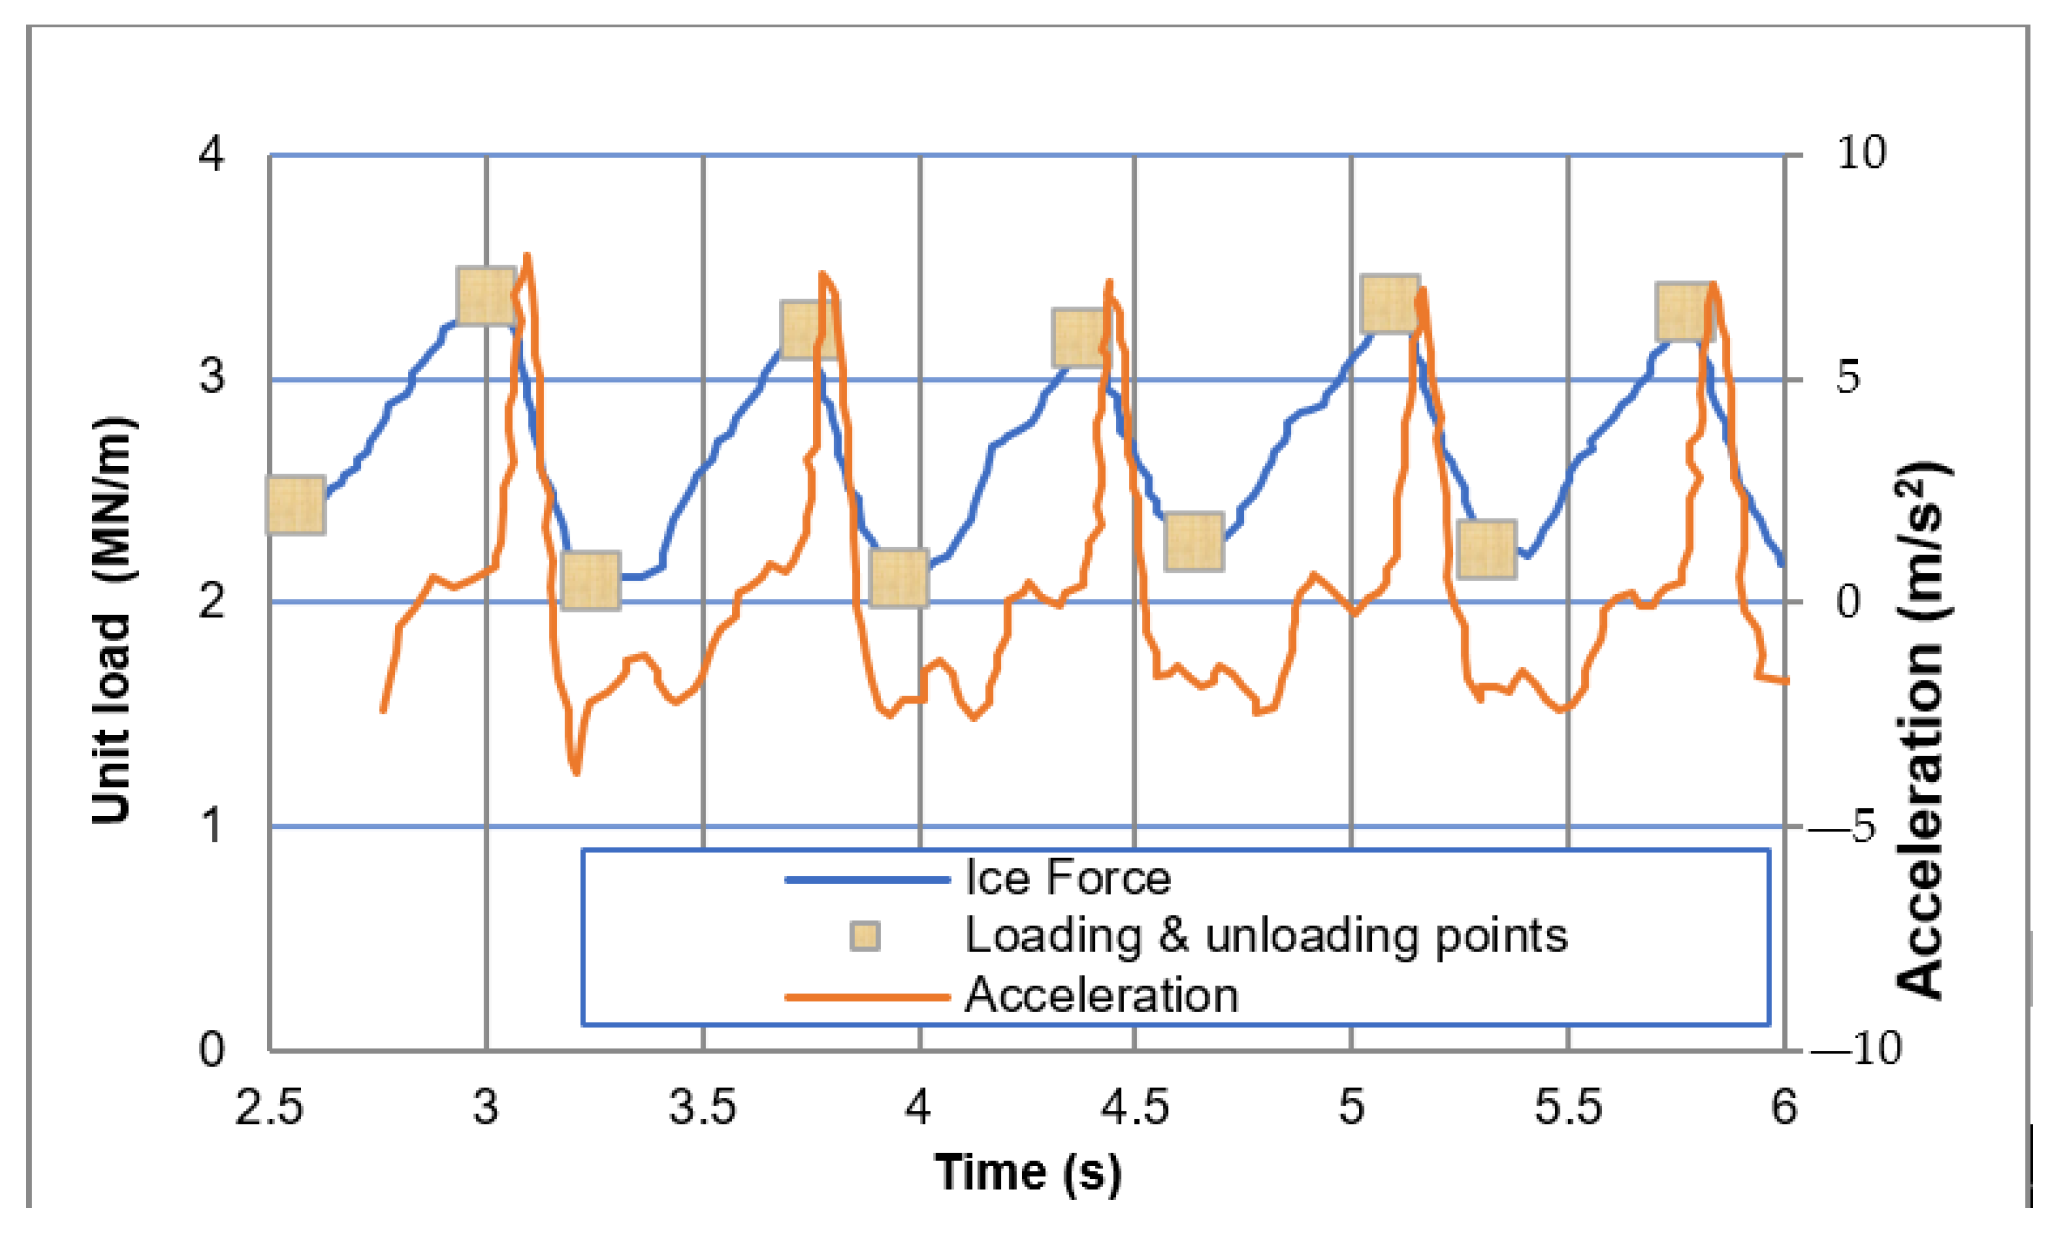
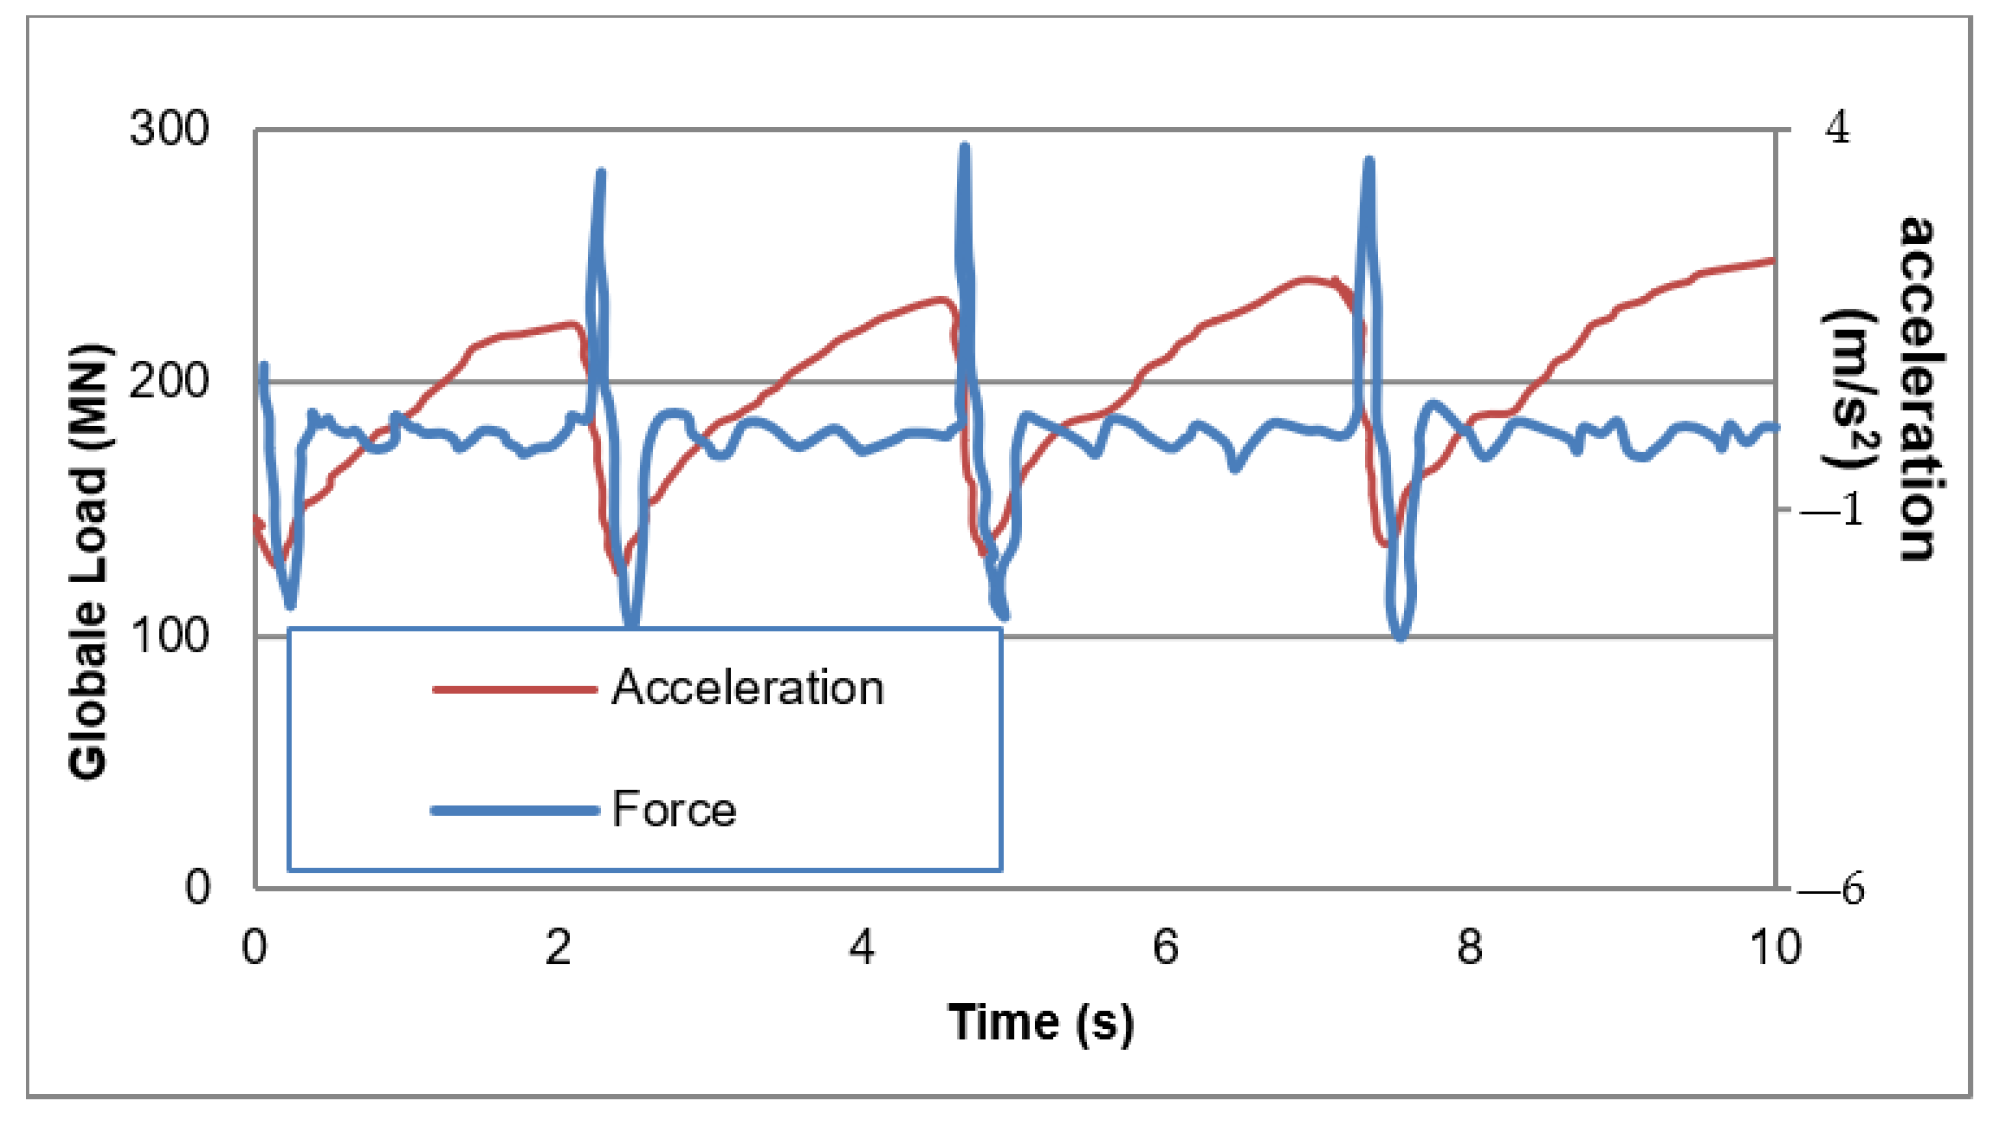
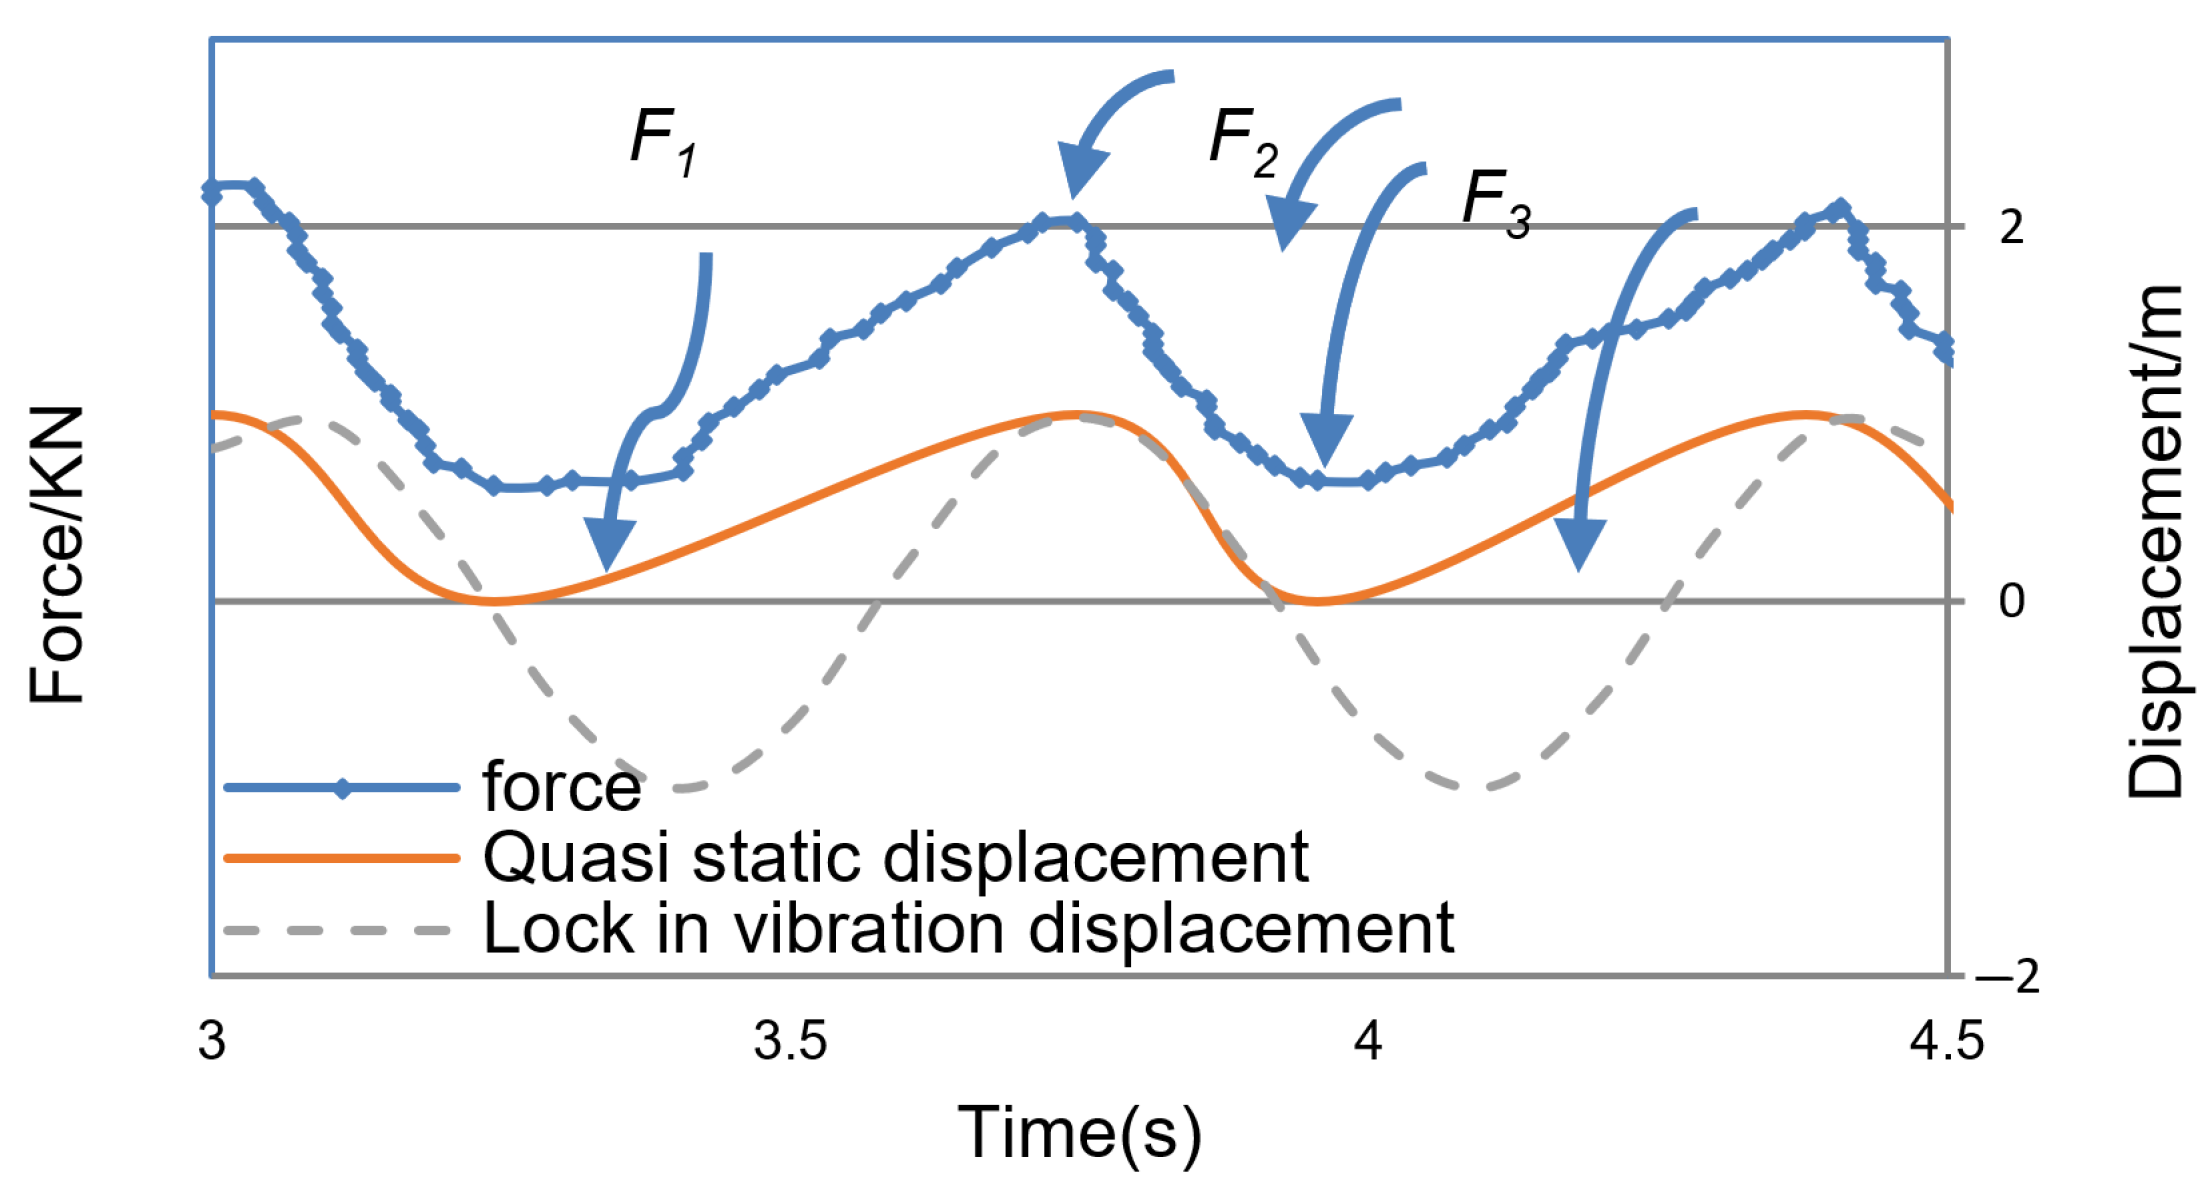
  • The ice crushing is an intermittent process rather than a continuous one. It consists of two phases: damage and collapse.
  • In the damage phase, the ice does not break and the ice forces increase. In the collapse phase, the ice collapses and the ice forces decrease. The damage phase corresponds to the loading phase, and the collapse phase corresponds to the unloading phase.
  • The collapsed ice extrudes out of the ice–structure interface in each collapse phase. The next process begins with intact ice acting on the structure again.
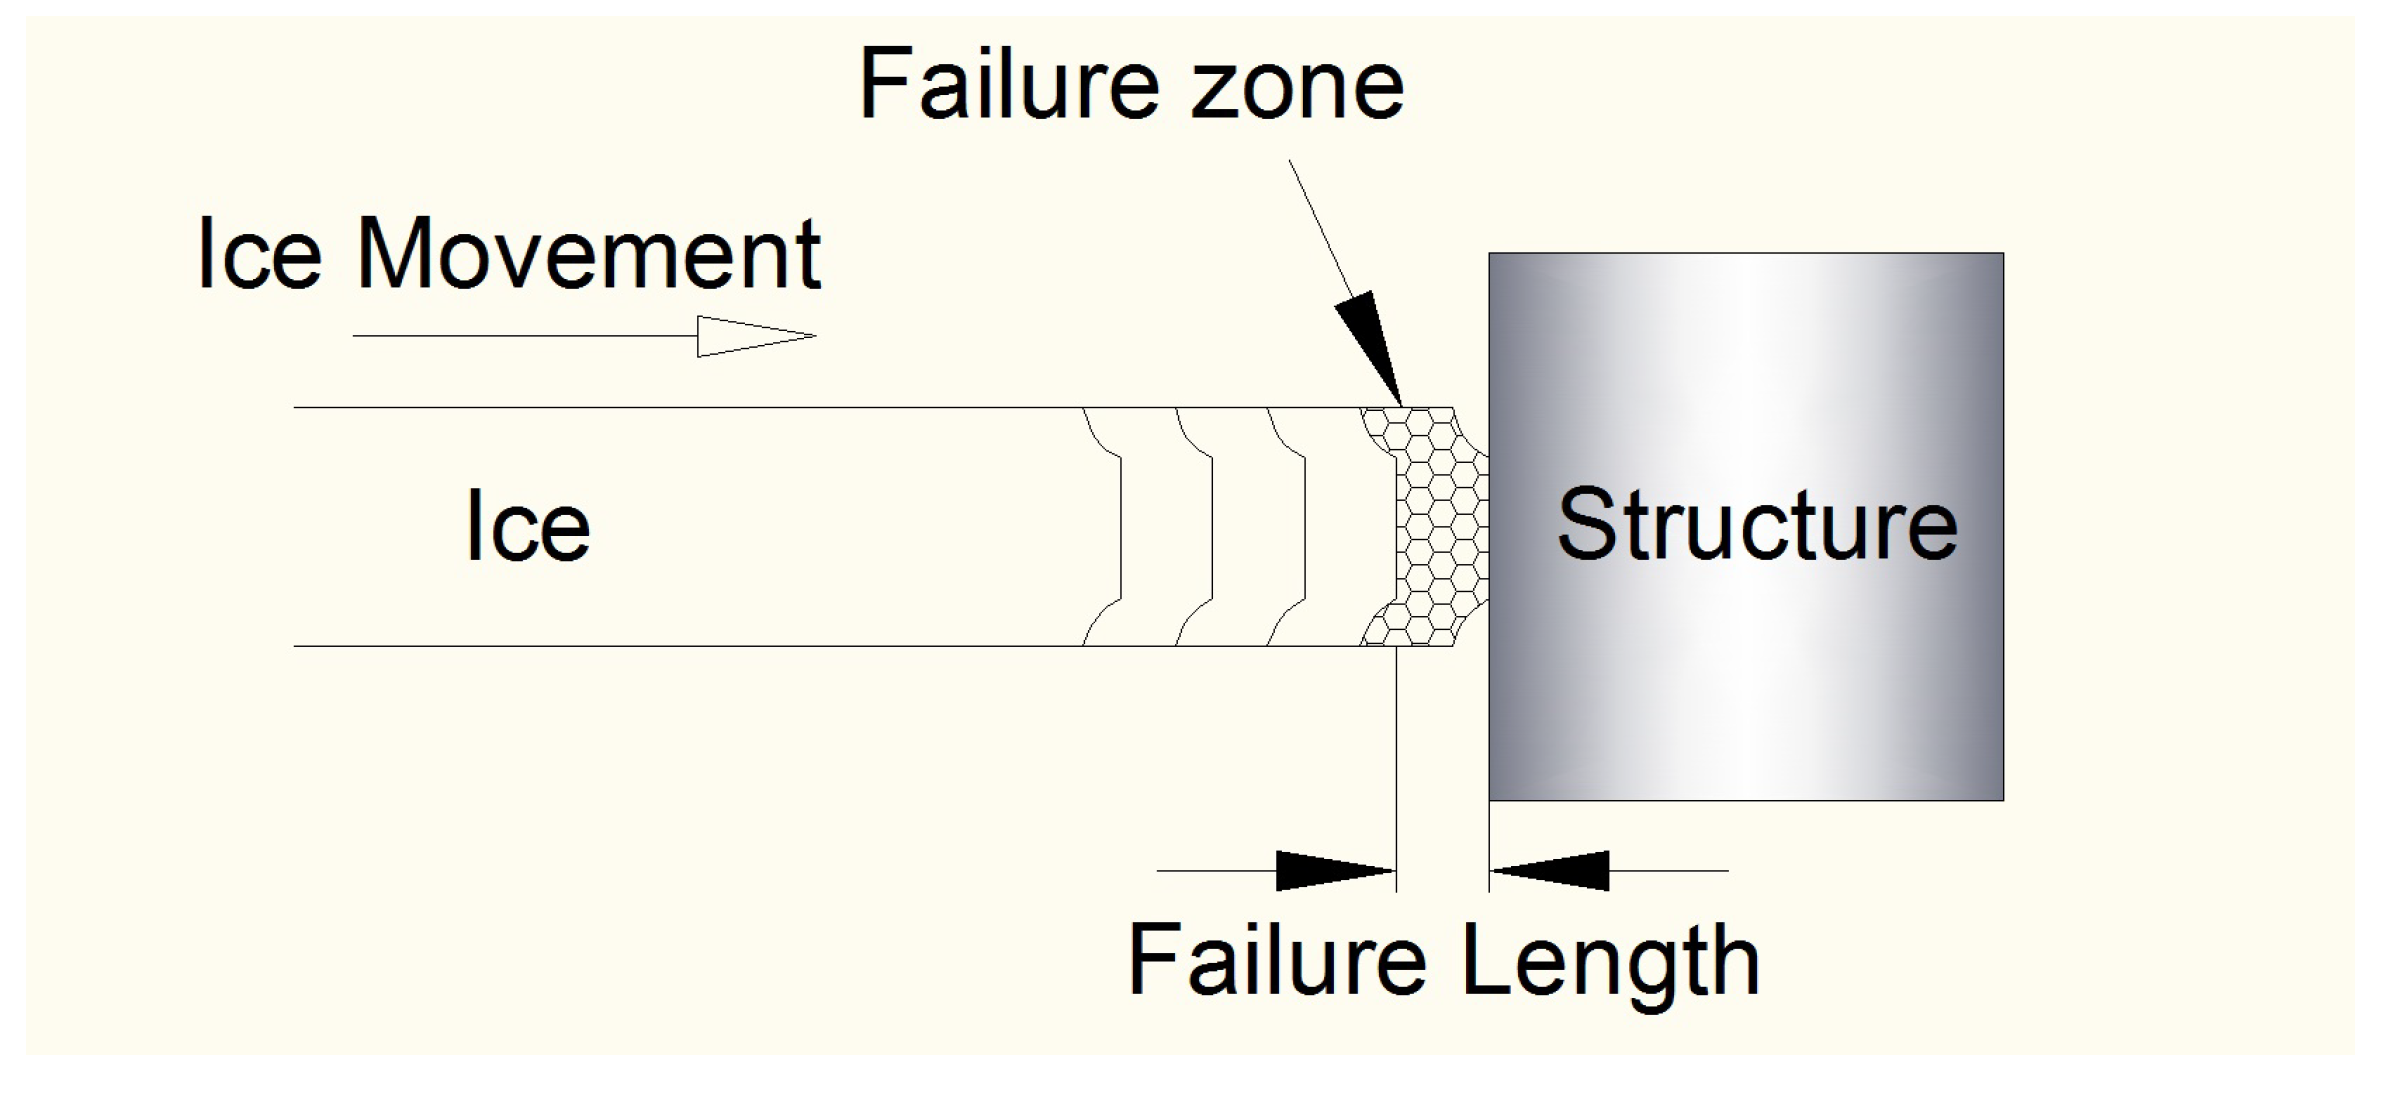
  • The DDC failure occurs once in each cycle of vibration. Ice in a failure zone is pulverized into powder in each failure.
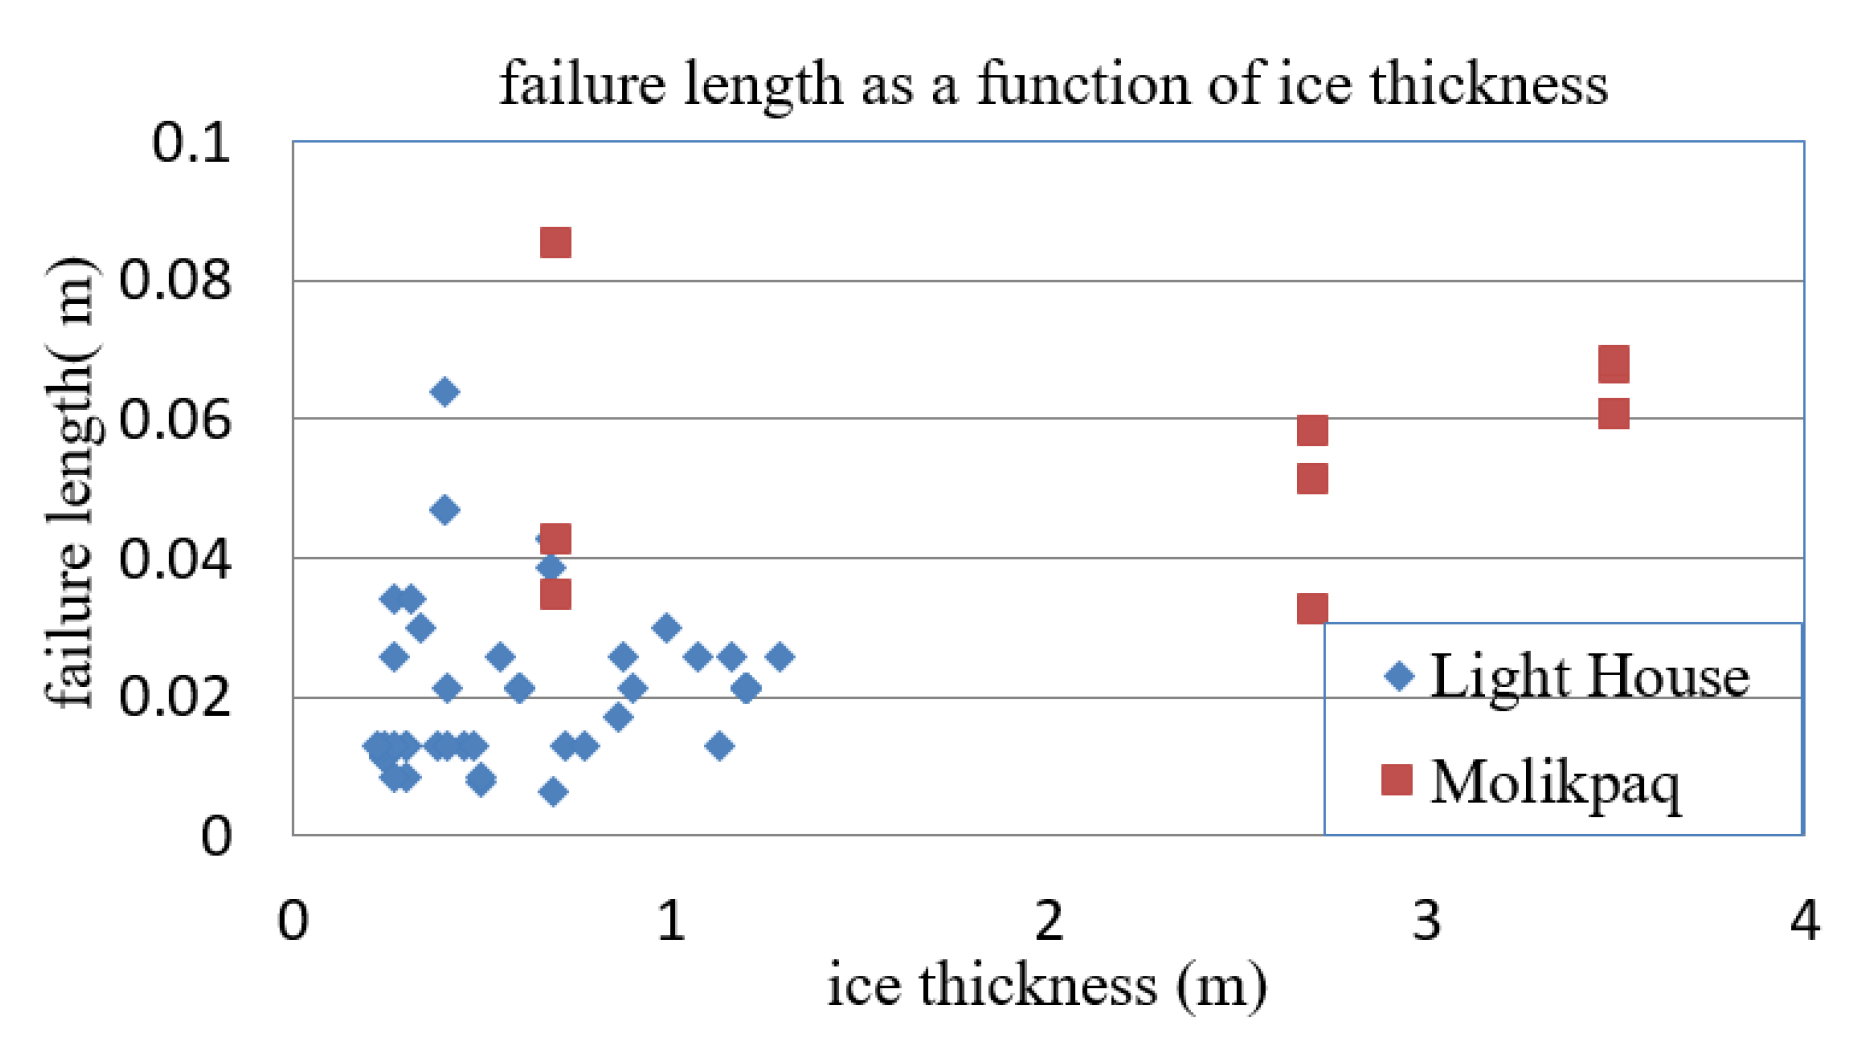
  • The ice has a specific failure length, which is the depth of the failure zone in each failure cycle.
The ice failure process in PLC has been regarded as a ductile–brittle transition crushing failure mode by many researchers. They explained that due to the change in relative velocity, ice experiences a change in loading rate from the ductile to brittle zone and the ice breaks in a ductile–brittle transition manner. This failure causes a negative damping effect on the system and induces self-excited vibration. However, the facts observed from the field measurement indicate that the failure process is a ductile one. The ice load fluctuation in one cycle results from the development of one fracture process, rather than the continuous alternation of ductile and brittle failures. Moreover, the failure is a ductile process rather than a mixture of ductile and brittle processes. The schematic of the ice sheet failure can be illustrated in the Figure 15 below.

4. Occurence of The PLC Process

This paper discussed that ice failures against vertical structures with saw teeth shape ice load may all belong to the DDC failure mode. Considering the lab test results as well, we can conclude that DDC is a typical failure mechanism when an ice sheet acts on vertical structures at low velocity. As Jefferies, M.G. and Wright, W.H. [9] indicated, ‘there is nothing special with Molikpaq’, the DDC failure mode is likely to occur on most vertical structures.
The DDC failure mechanism reveals that the failure length is an inherent characteristic of the ice sheet in the PLC process and it is the key parameter to analyze the interaction between ice and structure. For a compliant system such as a lighthouse, a jacket platform, or an offshore wind turbine, the ice drift velocity needs to be in a range close to
Vi = Lib/T
where T is the natural period of the structure and Lib is the ice failure length. For an overdamped system, the DDC failure does not resonate with the vibration of the structure. Therefore, the occurrence of failure is not related to the natural period of the system. The failure is likely to occur at a low ice-drift velocity of less than 10 cm/s.
For the dynamic response and fatigue damage, it is interesting to know how the occurrence of DDC is related to the ice condition and structures. Equation (1) shows that two factors affect the occurrence of PLC. The first one is the failure length of the ice sheet. Unfortunately, this parameter has not received enough attention and it is still unknown how it is influenced by ice parameters. Figure 16 shows the ice failure length estimated from full-scale measurements as a function of ice thickness. It shows that the failure length ranges from 1 to 10 cm and concentrates in 1 to 4 cm and does not have a clear dependence on ice thickness. However, due to the limited data available from full-scale measurements, the result needs further validation. At present, we may assume that the failure length is an inherent parameter of the ice sheet that is not affected by the structure. The second factor is the natural period of the structure, which implies that PLC occurrence is affected by structures. Structures with larger natural periods enter PLC mode at a lower ice velocity.
By observing the FLI phenomenon on the jacket platform in the Bohai Sea, Yue and Guo [14] found that FLI occurs at ice velocities of 2 cm/s to 4 cm/s. Combined with the platform’s natural period of 0.5 s, the failure length of the structure is 1–2 cm. Assuming that the failure length is not affected by the structure, the ice failure length is also 1–2 cm when the wind turbine experiences PLC in the Bohai Sea. Assuming that the wind turbine FLI occurs at the 1st and 2nd mode and the frequency is about 0.27 Hz, then we can obtain the ice speed for the PLC occurrence on the offshore wind turbine as 0.27~0.54 cm/s. Compared with the ice speed of 2–4 cm/s for jacket structures, the ice speed for the wind turbine is much lower because the structure is more compliant.
The ice velocity limit can be used to estimate the probability of PLC occurrence. The results of ice velocity monitoring in the Bohai Sea showed that the ice velocity and ice direction follow the Rayleigh distribution when their probability distributions are considered separately [21]. The σ values of the ice velocity Rayleigh distributions vary for different seas and monitoring times, and the specific parameters for the Bohai Sea are shown in Table 3.
The fixed wind turbine proposed in this paper experiences FLI when the sea ice speed ranges from 0.24 cm/s to 0.54 cm/s. The corresponding probability of this event in the Bohai Sea can be derived from the probability distribution function of the sea ice speed, which is presented in Table 4.
As shown in Table 4, the probability of PLC occurrence for fixed offshore wind turbines in the Bohai Sea is less than 0.05%, based on the ice speed factor alone. However, other factors such as ice thickness and ice type also affect the occurrence of PLC. Taking into account the random distribution of these factors would further reduce the probability. The range of ice speed (0.24–0.54 cm/s) that causes PLC on the fixed offshore wind turbine in this paper is much narrower than the 5 cm/s or 10 cm/s assumed by related studies, and its probability is also much lower than the 1.25% calculated by Wang Shuaifei et al. [22]. This result demonstrates that the DDC failure mechanism can distinguish PLC occurrence on different structures.

5. Conclusions

This paper defines the ice failure that occurs during the PLC process as DDC failure mode by studying the field measurement data of frequency lock-in vibration of the jacket and lighthouse structures and phase-locked loading on the caisson structure. The DDC failure mechanism provides a different explanation for the PLC process. The key feature of the DDC mechanism is that the failure is a discrete process and each time the ice breaks with a limited length. The failure length is an important parameter for understanding and analyzing the PLC process; the ice failure length has not been intensively investigated in the past because the failure process has not been clearly recognized. The field measurement indicates that the failure length is less than 5 cm and does not depend on the ice thickness. Supposing the failure length is an inherent feature of the PLC process, the PLC will occur when ice speed close to the ratio between the structure natural period and the ice failure length. That will provide a much narrower ice-condition window for PLC occurrence for wind turbine structures compared with the results obtained from other mechanisms.

Author Contributions

Conceptualization, Y.Q.; methodology, Y.Q.; software, H.Y. and Z.C.; validation, Y.Q.; formal analysis, Y.Q.; investigation, Y.Q. and H.Y.; resources, Y.Q.; data curation, Y.Q.; writing—original draft preparation, Y.Q. and H.Y.; writing—review and editing, Y.Q., H.Y., B.W. and S.G.; visualization, Y.Q.; supervision, B.W. and S.G.; project administration, Y.Q. and S.G.; funding acquisition, B.W., S.G. and Y.Q. All authors have read and agreed to the published version of the manuscript.

Funding

The authors gratefully acknowledge the financial support of the National Natural Science Foundation of China (Nos. 52071301, 41976195, 52101333, 51939002) and the Open Fund of Key Laboratory of Far-shore Wind Power Technology of Zhejiang Province (ZOE2020003), Zhejiang Provincial Natural Science Foundation of China (LQ21E090009).

Institutional Review Board Statement

Not applicable.

Informed Consent Statement

Not applicable.

Data Availability Statement

Not applicable.

Conflicts of Interest

The authors declare no conflict of interest.

References

  1. Basack, S.; Goswami, G.; Khabbaz, H.; Karakouzian, M. Flow Characteristics through Granular Soil Influenced by Saline Water Intrusion: A Laboratory Investigation. Civ. Eng. J. 2022, 8, 863–878. [Google Scholar] [CrossRef]
  2. Blenkarn, K. Measurement and analysis of ice forces on Cook Inlet structures. In Proceedings of the Offshore Technology Conference, Houston, TX, USA, 21–23 April 1970. [Google Scholar]
  3. Engelbrektson, A.; Janson, J.E. Field observations of ice action on concrete structures in the Baltic Sea. Concr. Int. 1985, 7, 48–52. [Google Scholar]
  4. Kärnä, T. Steady-state vibrations of offshore structures. Hydrotech. Constr. 1994, 28, 446–453. [Google Scholar] [CrossRef]
  5. Määttänen, M. On Conditions for the Rise of Self-Excited Ice-Induced Autonomous Oscillations in Slender Marine Pile Structures; Winter Navigation Research Board: Helsinki, Finland, 1978. [Google Scholar]
  6. Määttänen, M.; Reddy, D.; Arockiasamy, M.; Cheema, P.S. Ice-Structure Interaction Studied on a Lighthouse in the Gulf of Bothnia Using Response Spectrum and Power Spectral Density Function Analyses. In Proceedings of the 4th International Conference Port Ocean Engineering Arctic Engineering, St. John’s, NL, Canada, 26–30 September 1977; pp. 321–334. [Google Scholar]
  7. Peyton, H. Sea Ice strength, University of Alaska, Geophysical Institute. Final Report for the Navy Office of Naval Research. Contract 1966, 1. [Google Scholar]
  8. Yue, Q.; Bi, X.; Sun, B.; Zhang, T.; Chen, X. Full scale force measurement on JZ20-2 platform. In Proceedings of the Proc. IAHR Ice Symp.(IAHR’96), Beijing, China, 27–30 August 1996; 1996; pp. 282–289. [Google Scholar]
  9. Jefferies, M.A. Dynamic response of “Molikpaq” to ice-structure interaction. In Proceedings of the 7th OMAE, Houston, TX, USA, 7–12 February 1988; Volume 4, pp. 201–220. [Google Scholar]
  10. Jordaan, I.J.; Timco, G.W. Dynamics of the ice-crushing process. J. Glaciol. 1988, 34, 318–326. [Google Scholar] [CrossRef]
  11. Huang, G.; Liu, P. A dynamic model for ice-induced vibration of structures. J. Offshore Mech. Arct. Eng. 2009, 131, 011501. [Google Scholar] [CrossRef]
  12. Matlock, H.; Dawkins, W.P.; Panak, J.J. A modal for the prediction of ice-structure internation. In Proceedings of the Offshore Technology Conference, Houston, TX, USA, 17–20 May 1969; p. OTC-1066-MS. [Google Scholar]
  13. Bentley, D.L.; Dempsey, J.P.; Sodhi, D.S.; Wei, Y. Fracture of S2 columnar freshwater ice: Floating double cantilever beam tests. In Proceedings of the Ninth IAHR Ice Symposium, Sapporo, Japan, 23–27 August 1988. [Google Scholar]
  14. Yue, Q.; Bi, X. Ice-induced jacket structure vibrations in Bohai Sea. J. Cold Reg. Eng. 2000, 14, 81–92. [Google Scholar] [CrossRef]
  15. Yue, Q.; Guo, F.; Kärnä, T. Dynamic ice forces of slender vertical structures due to ice crushing. Cold Reg. Sci. Technol. 2009, 56, 77–83. [Google Scholar] [CrossRef]
  16. Gagnon, R. An explanation for the Molikpaq May 12, 1986 event. Cold Reg. Sci. Technol. 2012, 82, 75–93. [Google Scholar] [CrossRef]
  17. Yan, Q. A new method for the analysis of ice intermittent crushing induced lock-in vibration. In Proceedings of the The Twenty-third International Offshore and Polar Engineering Conference, Anchorage, AK, USA, 30 June–5 July 2013. [Google Scholar]
  18. Timco, G.; Johnston, M. Ice loads on the Molikpaq in the Canadian Beaufort Sea. Cold Reg. Sci. Technol. 2003, 37, 51–68. [Google Scholar] [CrossRef]
  19. Jefferies, M.; Rogers, B.; Hardy, M.; Wright, B. Ice load measurement on Molikpaq: Methodology and accuracy. In Proceedings of the International Conference on Port and Ocean Engineering under Arctic Conditions, Montreal, QC, Canada, 10–14 July 2011. [Google Scholar]
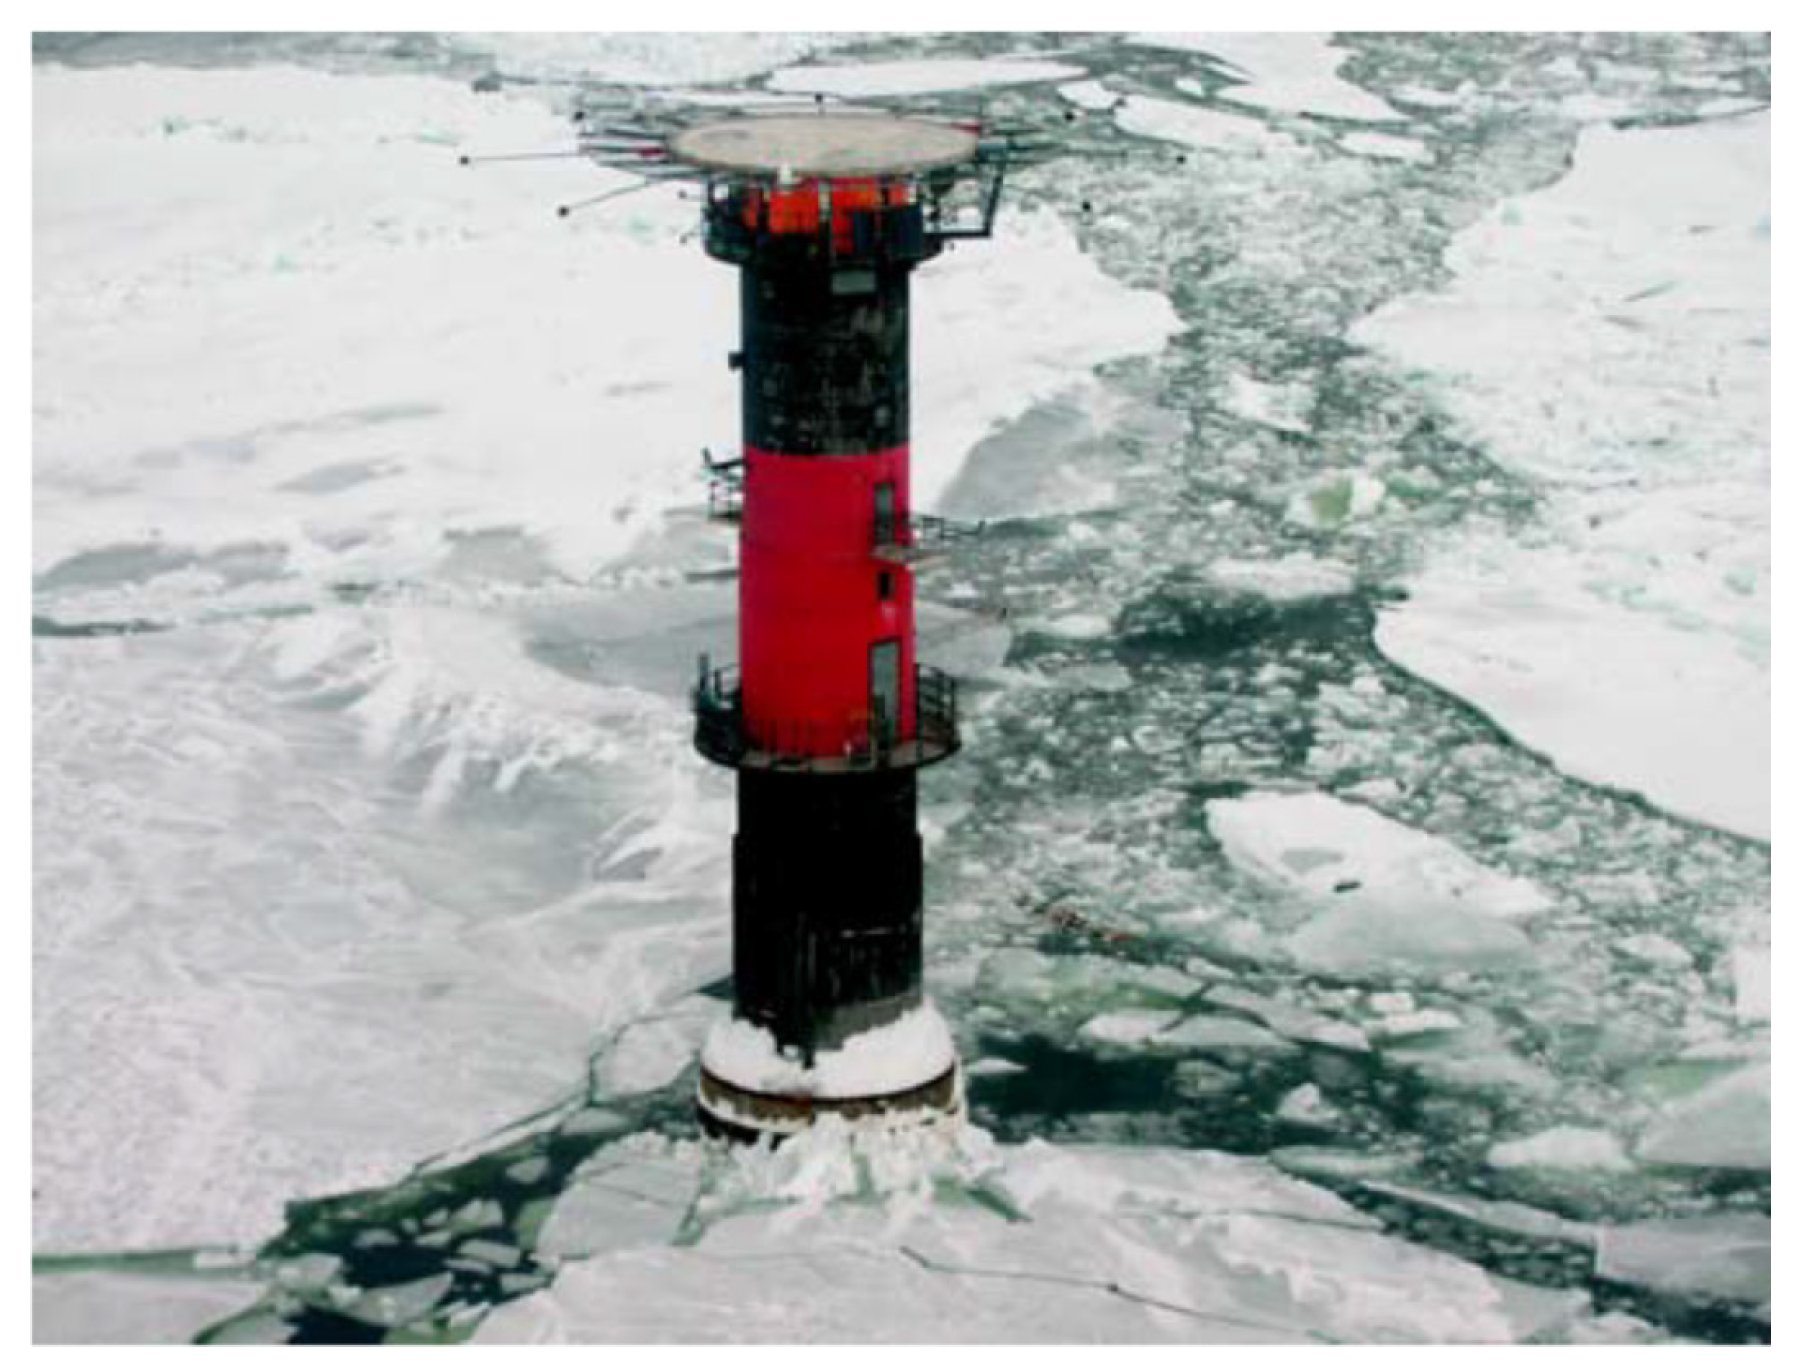
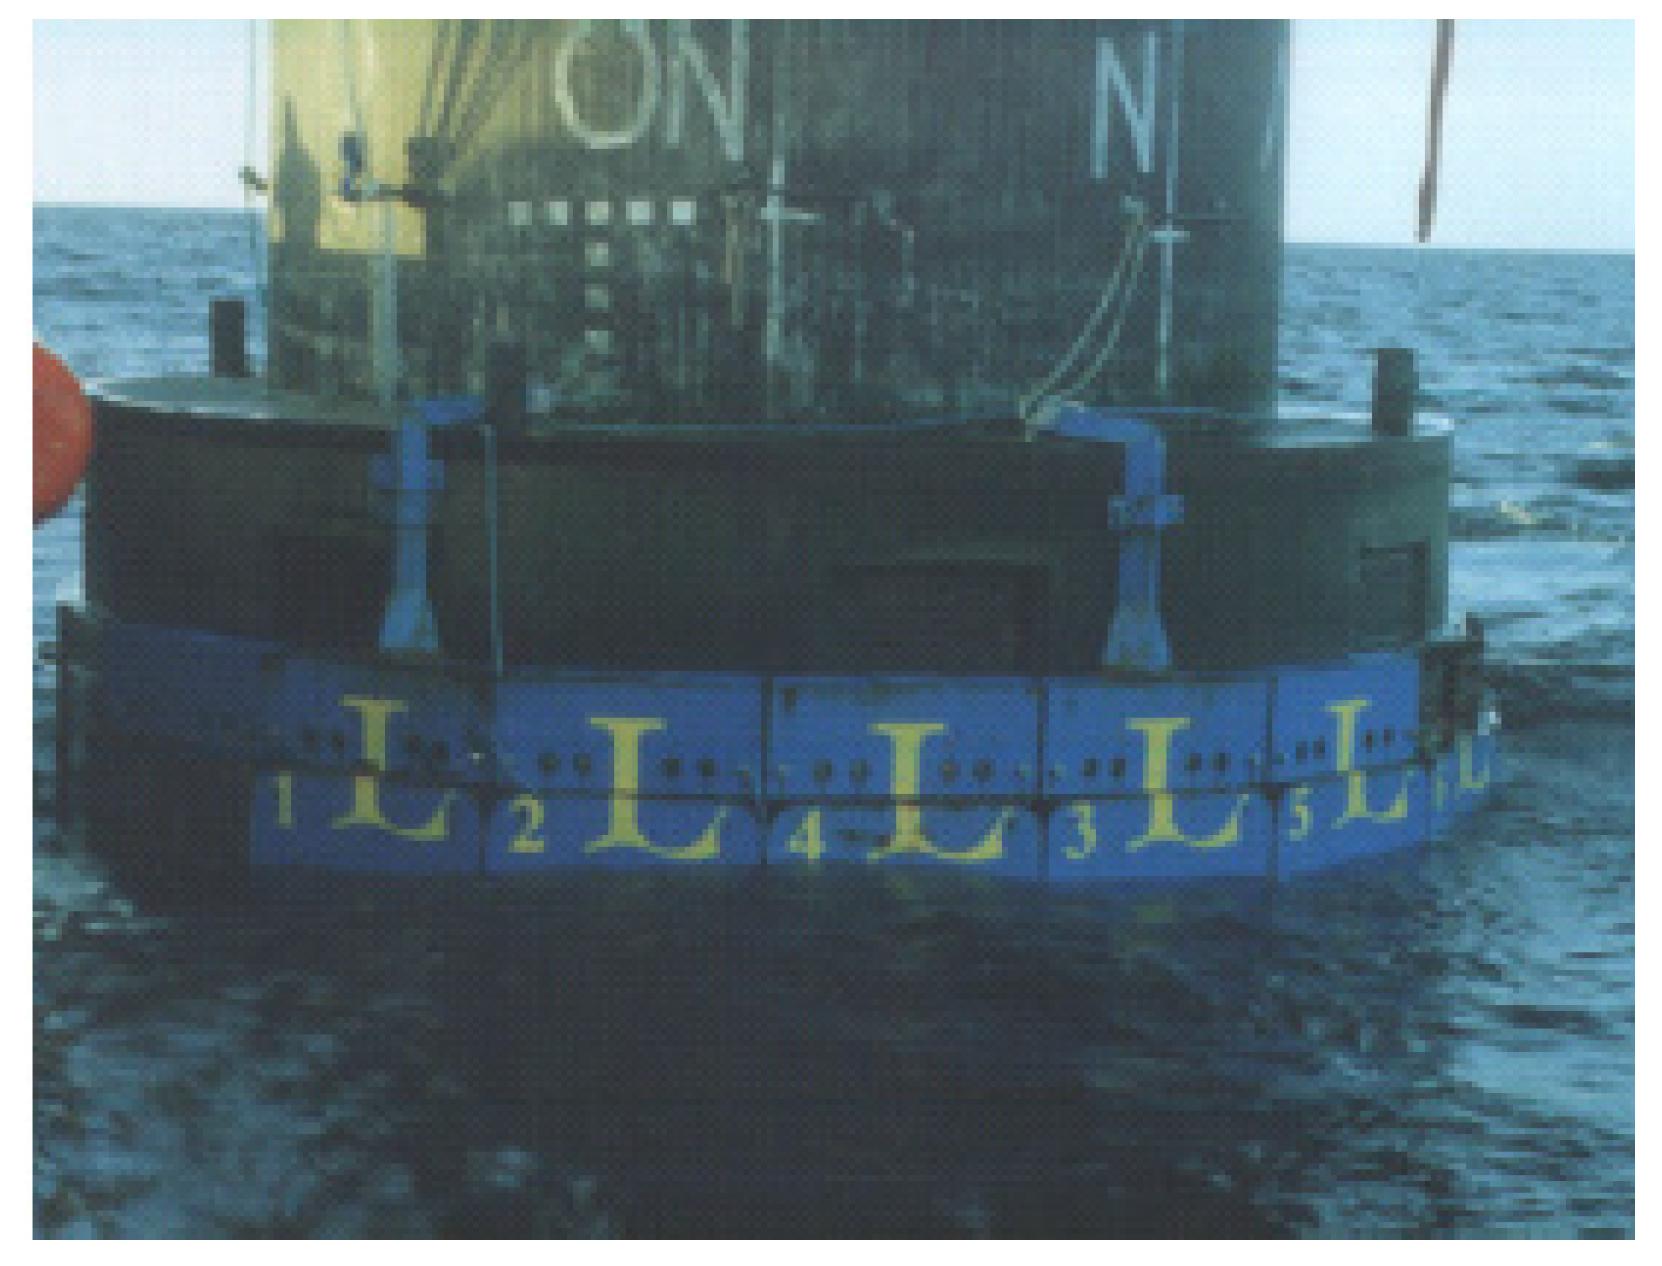
  20. Nord, T.S.; Samardžija, I.; Hendrikse, H.; Bjerkås, M.; Høyland, K.V.; Li, H. Ice-induced vibrations of the Norströmsgrund lighthouse. Cold Reg. Sci. Technol. 2018, 155, 237–251. [Google Scholar] [CrossRef]
  21. Ji, S.-Y.; Yue, Q.-J.; Bi, X.-J. Probability distribution of sea ice fatigue parameters in JZ 20-2 sea area of Liaodong Bay. Ocean Eng. 2002, 20, 39–43. [Google Scholar]
  22. Guojun, W.; Dayong, Z.; Chunjuan, L. Vibration analysis of offshore wind turbine foundation in ice zone. Hip Ocean Eng. 2016, 45, 109–113. [Google Scholar]
Figure 1. Molikpaq platform in the Beaufort Sea.
Jmse 11 00868 g001
Figure 2. Instrumentation of the ice load measurement system on Molikpaq platform.
Jmse 11 00868 g002
Figure 3. MDP1 mooring pole of JZ9-3.
Jmse 11 00868 g003
Figure 4. Sketch of the full-scale measurement system on JZ9-3 MDPmooring pole.
Jmse 11 00868 g004
Figure 5. Norstromsgrund Lighthouse in Baltic Sea.
Jmse 11 00868 g005
Figure 6. Load panels on the lighthouse.
Jmse 11 00868 g006
Figure 7. Ice force and structure response of lock-in vibration measured.
Jmse 11 00868 g007
Figure 8. Ice force and structure response of lock-in vibration measured on the monoleg mooring pole in Bohai Bay.
Jmse 11 00868 g008
Figure 9. Intermittent crushing and lock-in crushing of the ice-structure interaction.
Jmse 11 00868 g009
Figure 10. Intermittent crushing and lock-in crushing of the ice–structure interaction.
Jmse 11 00868 g010
Figure 11. Synchronized saw teeth ice load measured by different load panels on Norströmsgrund Lighthouse.
Jmse 11 00868 g011
Figure 12. Synchronized saw teeth ice load measured by different load panels on Molikpaq Platform.
Jmse 11 00868 g012
Figure 13. Ice load and structure response during PLC process on compliant structure and wide rigid structure.
Jmse 11 00868 g013
Figure 14. Ice failure during phase-locked loading and frequency lock-in vibration.
Jmse 11 00868 g014
Figure 15. Ice failure sketch of ductile ice failure in PLC process.
Jmse 11 00868 g015
Figure 16. Ice failure length estimated from full-scale measurements.
Jmse 11 00868 g016
Table 1. Typical PLC conditions measurement on Molikpaq, JZ9-3 MDP, and Norstromsgrund Lighthouse.
StructuresMolikpaqJacket StructuresLighthouse
Ice thickness (m)1–30.1–0.300.26–1.9
Structure Diameter (m)901.57.5
Load panel spacing (m)17 and 190.2751.2
Load panel width Height (m)1.135 × 2.7150.27 × 0.61.2 × 1.6
Natural Frequency (Hz)-2.1–2.32.3–2.7
PLC duration (s)Few seconds100More than 900
Ice velocity (m/s)0–0.06, 0.20.023–0.075<0.04
Table 2. Ice failure process in the PLC process.
IceRelative VelocityCompliant StructureRigid Structure
Ice ForceIce FailurePositionVelocityPositionAcceleration
F1Loading startIntact ice starts to act on the structure, Micro cracks initiate in the ice sheet.Vice + VSmaxClose to the equilibrium position, move towards −x direction.Velocity close to −VSmax.Almost x = 0.Acceleration can be negative due to the last unloading.
F1 To F2Loading phase, ice force increaseIce continuously acting on the structure. Cracks propagate in the ice, but the ice does not break.Change from Vice + VSmax to Vice, to Vice − VSmaxMove from equilibrium position X0 to −Xmax, return to X0, then to Xmax.Change from −VSmax to 0, then increase to VSmax and decrease to 0 again.Move from X0 to Xmax.small
F2Loading complete, unload start. Cracks saturated in the ice. Ice starts to collapse.ViceClose to Xmax position.V = 0Close to Xmax position.small
F2 to F3Unloading process, ice force drops down.Ice collapse. Ice spalls extrude out from contact surface between ice and structure.Change from 0 to Vice + VSmaxMove from Xmax position to equilibrium position X0 in about 1/4 of the vibration period.Velocity change from 0 to −VSmax.Move from Xmax position to equilibrium position X0 very quickly.A large acceleration due to the unloading.
F3Unloading finish. Next cycle start.Ice extrusion ends, intact ice acts on the structure again.Vice + VSmaxStructure returns to the equilibrium position.Velocity close to −VSmax.Structure returns to the equilibrium position.Acceleration can be negative due to the inertia of structure.
Table 3. Rayleigh distribution parameters for ice speeds distribution in different sea areas and at different times.
Monitoring TimesSea Areaσ
2009–2016JZ20-215
2009–2016JZ9-319
Table 4. Probability of FLI occurrence in fixed wind turbine structures in Bohai Sea.
Monitoring TimesSea AreaProbability
2009–2016JZ20-20.05%
2009–2016JZ9-30.03%
Disclaimer/Publisher’s Note: The statements, opinions and data contained in all publications are solely those of the individual author(s) and contributor(s) and not of MDPI and/or the editor(s). MDPI and/or the editor(s) disclaim responsibility for any injury to people or property resulting from any ideas, methods, instructions or products referred to in the content.

