Article

Experimental and Numerical Studies on Bending and Failure Behaviour of Inflated Composite Fabric Membranes for Marine Applications

1
Key Laboratory of High Performance Ship Technology, Wuhan University of Technology, Ministry of Education, Wuhan 430063, China
2
Green & Smart River-Sea-Going Ship, Cruise and Yacht Research Center, Wuhan University of Technology, Wuhan 430063, China
3
School of Naval Architecture, Ocean and Energy Power Engineering, Wuhan University of Technology, Wuhan 430063, China
4
China Automotive Engineering Research Institute Co., Ltd., Chongqing 401122, China
*
Author to whom correspondence should be addressed.
J. Mar. Sci. Eng. 2023, 11(4), 800; https://doi.org/10.3390/jmse11040800
Submission received: 5 March 2023 / Revised: 28 March 2023 / Accepted: 4 April 2023 / Published: 7 April 2023
(This article belongs to the Special Issue Advanced Analysis of Marine Structures)

Abstract

:
Owing to their excellent physical characteristics of lightweightiness, compactness and rapid deployment, the inflated membrane structures satisfy the demands of maritime salvage and military transportation for long-distance delivery and rapid response. Exploring the failure behaviour of inflated membrane structures can greatly contribute to their widespread applications in ocean engineering. In this research, the main objective is to comprehensively investigate the bending and failure behaviour of inflated membrane structures. Thus, the Surface-Based Fluid Cavity method is employed to set up the finite element model (FEM) which is compared to the experimental results to verify its reliability. In parallel, the effects of internal pressure and wrinkles are discussed. An empirical expression of the ultimate bending loading was fitted by face-centred composite designs of the Response Surface Methodology. The results of experiments and FEM show that the bearing capacity of the inflated membrane structure is positively correlated with the internal pressure but decreased obviously with the occurrence and propagation of wrinkles. The deformation behaviour and the stress distribution are similar to those of the traditional four-point bending beam, and the local instability induced by wrinkles will cause structural failure. In addition, the numerical model and the proposed expression showed deviations below 5% in relation to the experimental measures. Therefore, the FEM and proposed expression are high of reliability and have important engineering guiding significance for the application of inflated membrane structures in ocean engineering.

1. Introduction

Inflated membrane structures are commonly fabricated using continuously woven or braided composite fabrics, which are inflated with a sufficient quantity of gas to maintain their shape and structural rigidity [1]. The excellent physical characteristics including lightweightiness, compact transportation volume and rapid deployment widen their application in the civilian and aerospace fields [2]. Additionally, inflated membrane structures also exhibit fail-safe tendencies (reversible wrinkling) which endow them to recover the original shape and loading capacity once the load is removed [3].
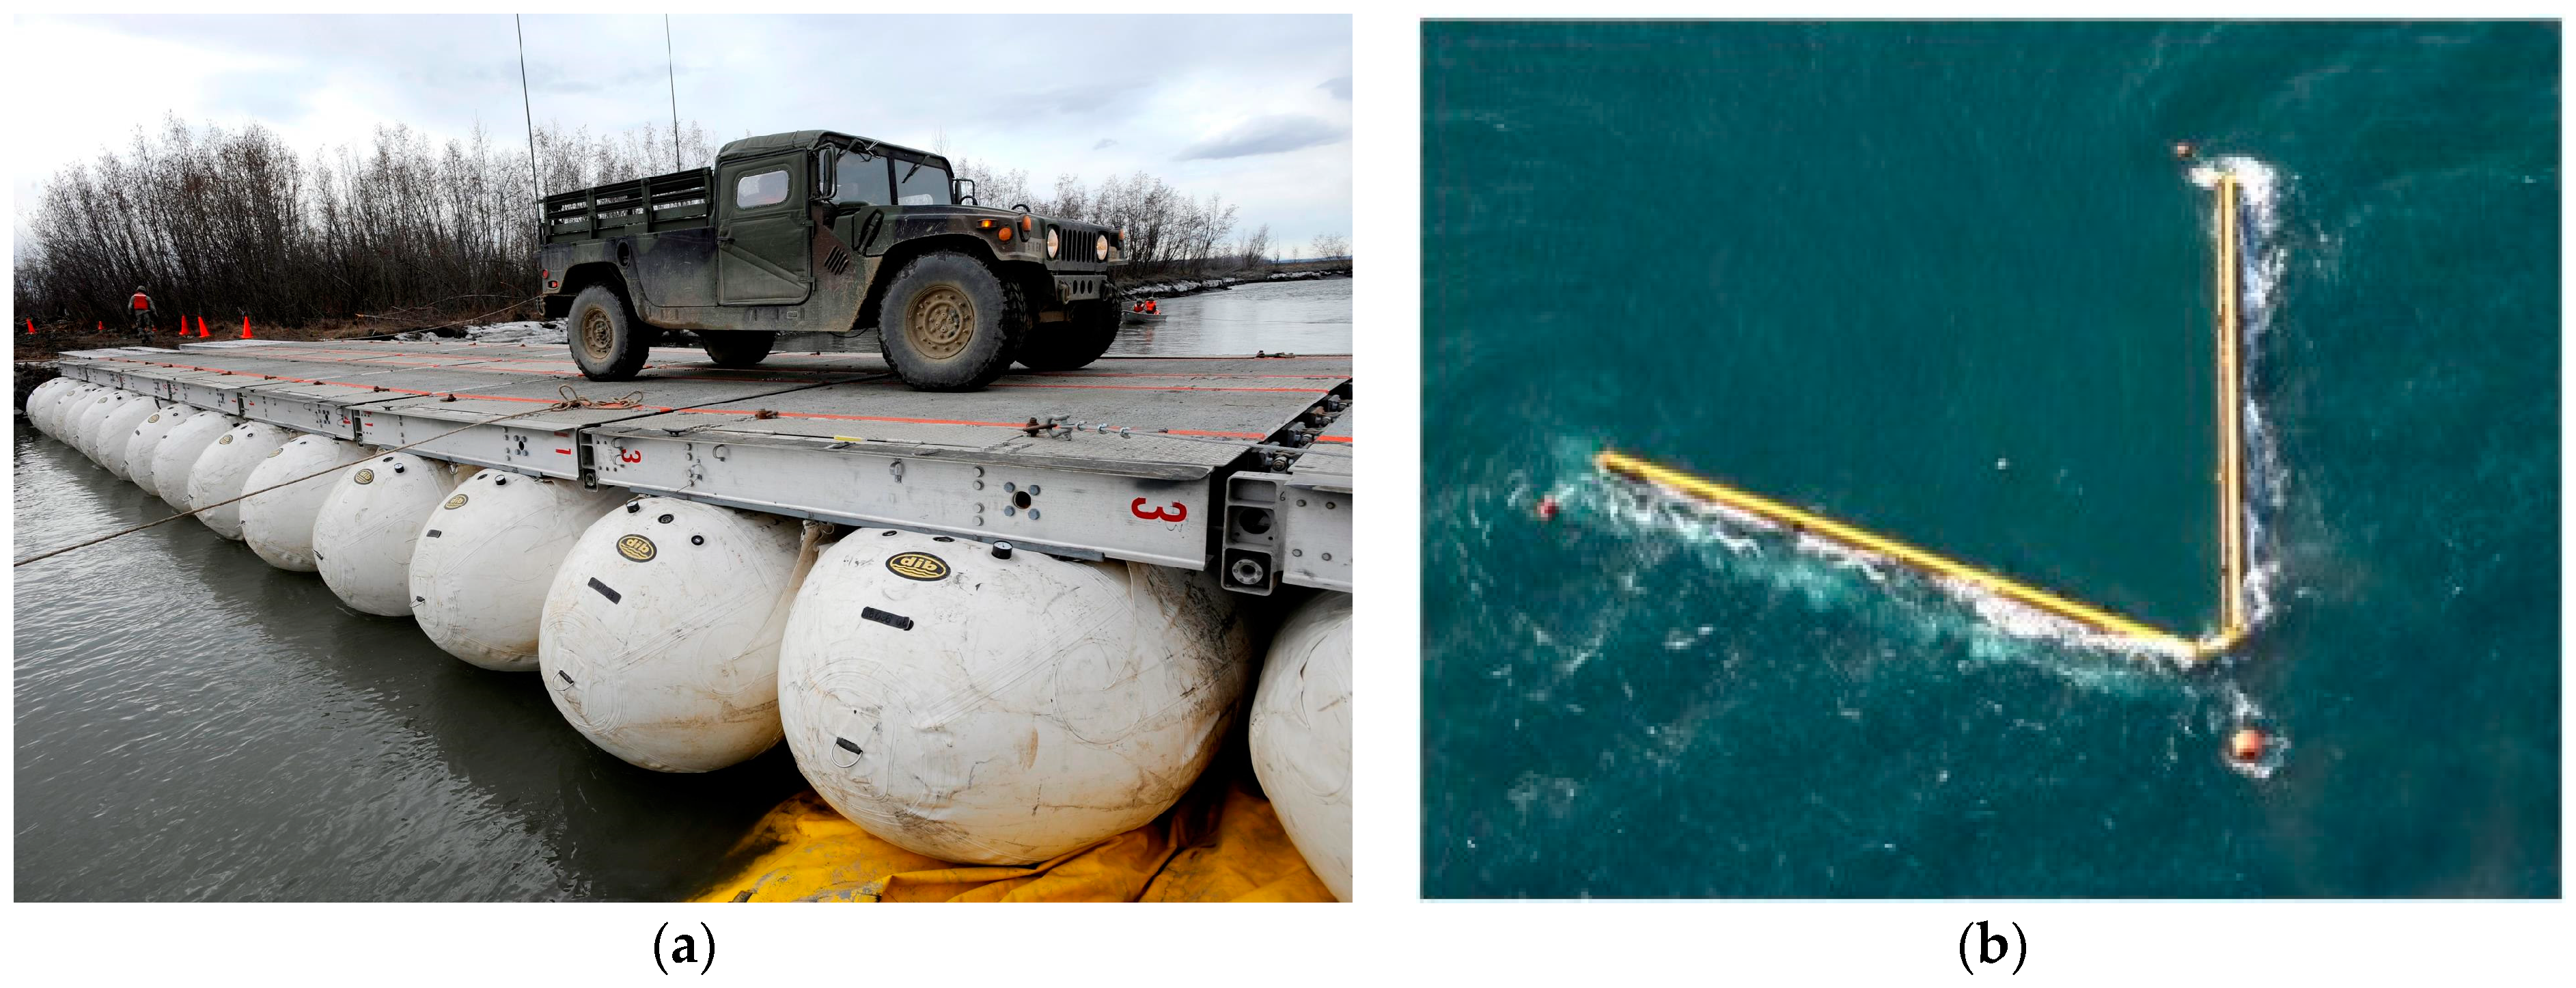
In recent years, due to the requirements of maritime rescue and military logistics for long-distance delivery and rapid response, as shown in Figure 1, the U.S. military took the lead in proposing floating inflated structures including the Lightweight Modular Causeway System (LMCS) [4,5] and the Rapidly Installed Breakwater (RIB) [6]. The inflated structures provide unique solutions for temporary structures in marine engineering. These new-type structures possess significant load-carrying capacities per unit weight and the efficiency of storage, transportation and deployability is improved by the application of inflated bladders. However, nonlinear material characteristics and fluid-structure interactions meet significant challenges in designing these structures. In particular, the difficulty would be enlarged when analyzing the failure behaviour of inflated structures because of their pressure-dependent natural characteristic. Therefore, research on the bearing capacity of the inflated structures is one of the key factors to guide the design, and it also has great significance for promoting the application of the inflated composite fabric membrane structure in marine engineering.
Inflated membrane structures play the role of flexural members in engineering applications; thus, researchers always simplify them as “beams”. Up to now, some researchers have studied inflated beams’ bending behaviour. For instance, Wielgosz and Thomas [7,8] proposed a finite element model of the inflated beam based on the Timoshenko beam theory and simplified the inflated gas pressure as a following force. Apedo et al. [9] proposed a 3D FEM utilizing the virtual work principle to predict the bending deflection of orthotropic braided beams. The accuracy of the method was verified by comparing it with experiments. Subsequently, Nguyen et al. [10] improved Apedo’s model [9] by associating the equation with the state of inflated prestress. Furthermore, Elsabbagh [11] improved the model of Apedo [9] to analyse the effect of the internal pressure and the diameter on the wrinkling load of the inflated beam, and compared the result with the calculation example of Apedo, founding that the deviation in the linear state was satisfied. However, the above methods have not presented satisfying accuracy in the post-wrinkling stage.
Apart from the global bending behaviour, the structural failure induced by local wrinkling has also gained particular interest. Wrinkling refers to the formation of small, localized folds or creases in the fabric of the inflated membrane structure. It could occur as a result of changes in the tension or shape of the fabric [12]. Stein and Hedgepeth [13] proposed the membrane model to predict the wrinkling load, assuming that fabric compressive stresses were not admissible. The wrinkling and failure loads were only dependent on the internal pressure and the mean radius [14]. Furthermore, Veldman [15] developed a thin-shell model and accounted for the material properties to analyse wrinkling loads. Wang et al. [16] improved the thin-shell model of Veldman and proposed the concept of the wrinkling factor to estimate the critical wrinkling load. Then, Ji et al. [17] established a multi-scale wrinkling analysis model to investigate the bending stiffness and load–deflection behaviour of inflated beams subjected to bending loads and validated the accuracy of the prediction model by comparing it with experimental results. Wang et al. [18] conducted a series of experiments to investigate the interaction between gas and membrane, and they found the wrinkling load of the inflated beam was sensitive to the gas-membrane coupling relationship. In the previous works, the coupling effect of internal gas and structures due to the external load of the inflated membranes is ignored. In fact, most of the above-mentioned studies simplified the inflated gas pressure by considering it to be a uniform surface pressure. However, the mechanical characteristics of inflated composite fabric membranes, unlike the traditional composite structure, exhibit high nonlinearity due to internal pressure dependence [19]. Moreover, the internal pressure increases significantly with an increase in the load [20]. In this study, thus, the fluid cavity method is adopted to simulate the coupling effect between internal gas and structure, allowing for an accurate prediction of the structural response under external loads.
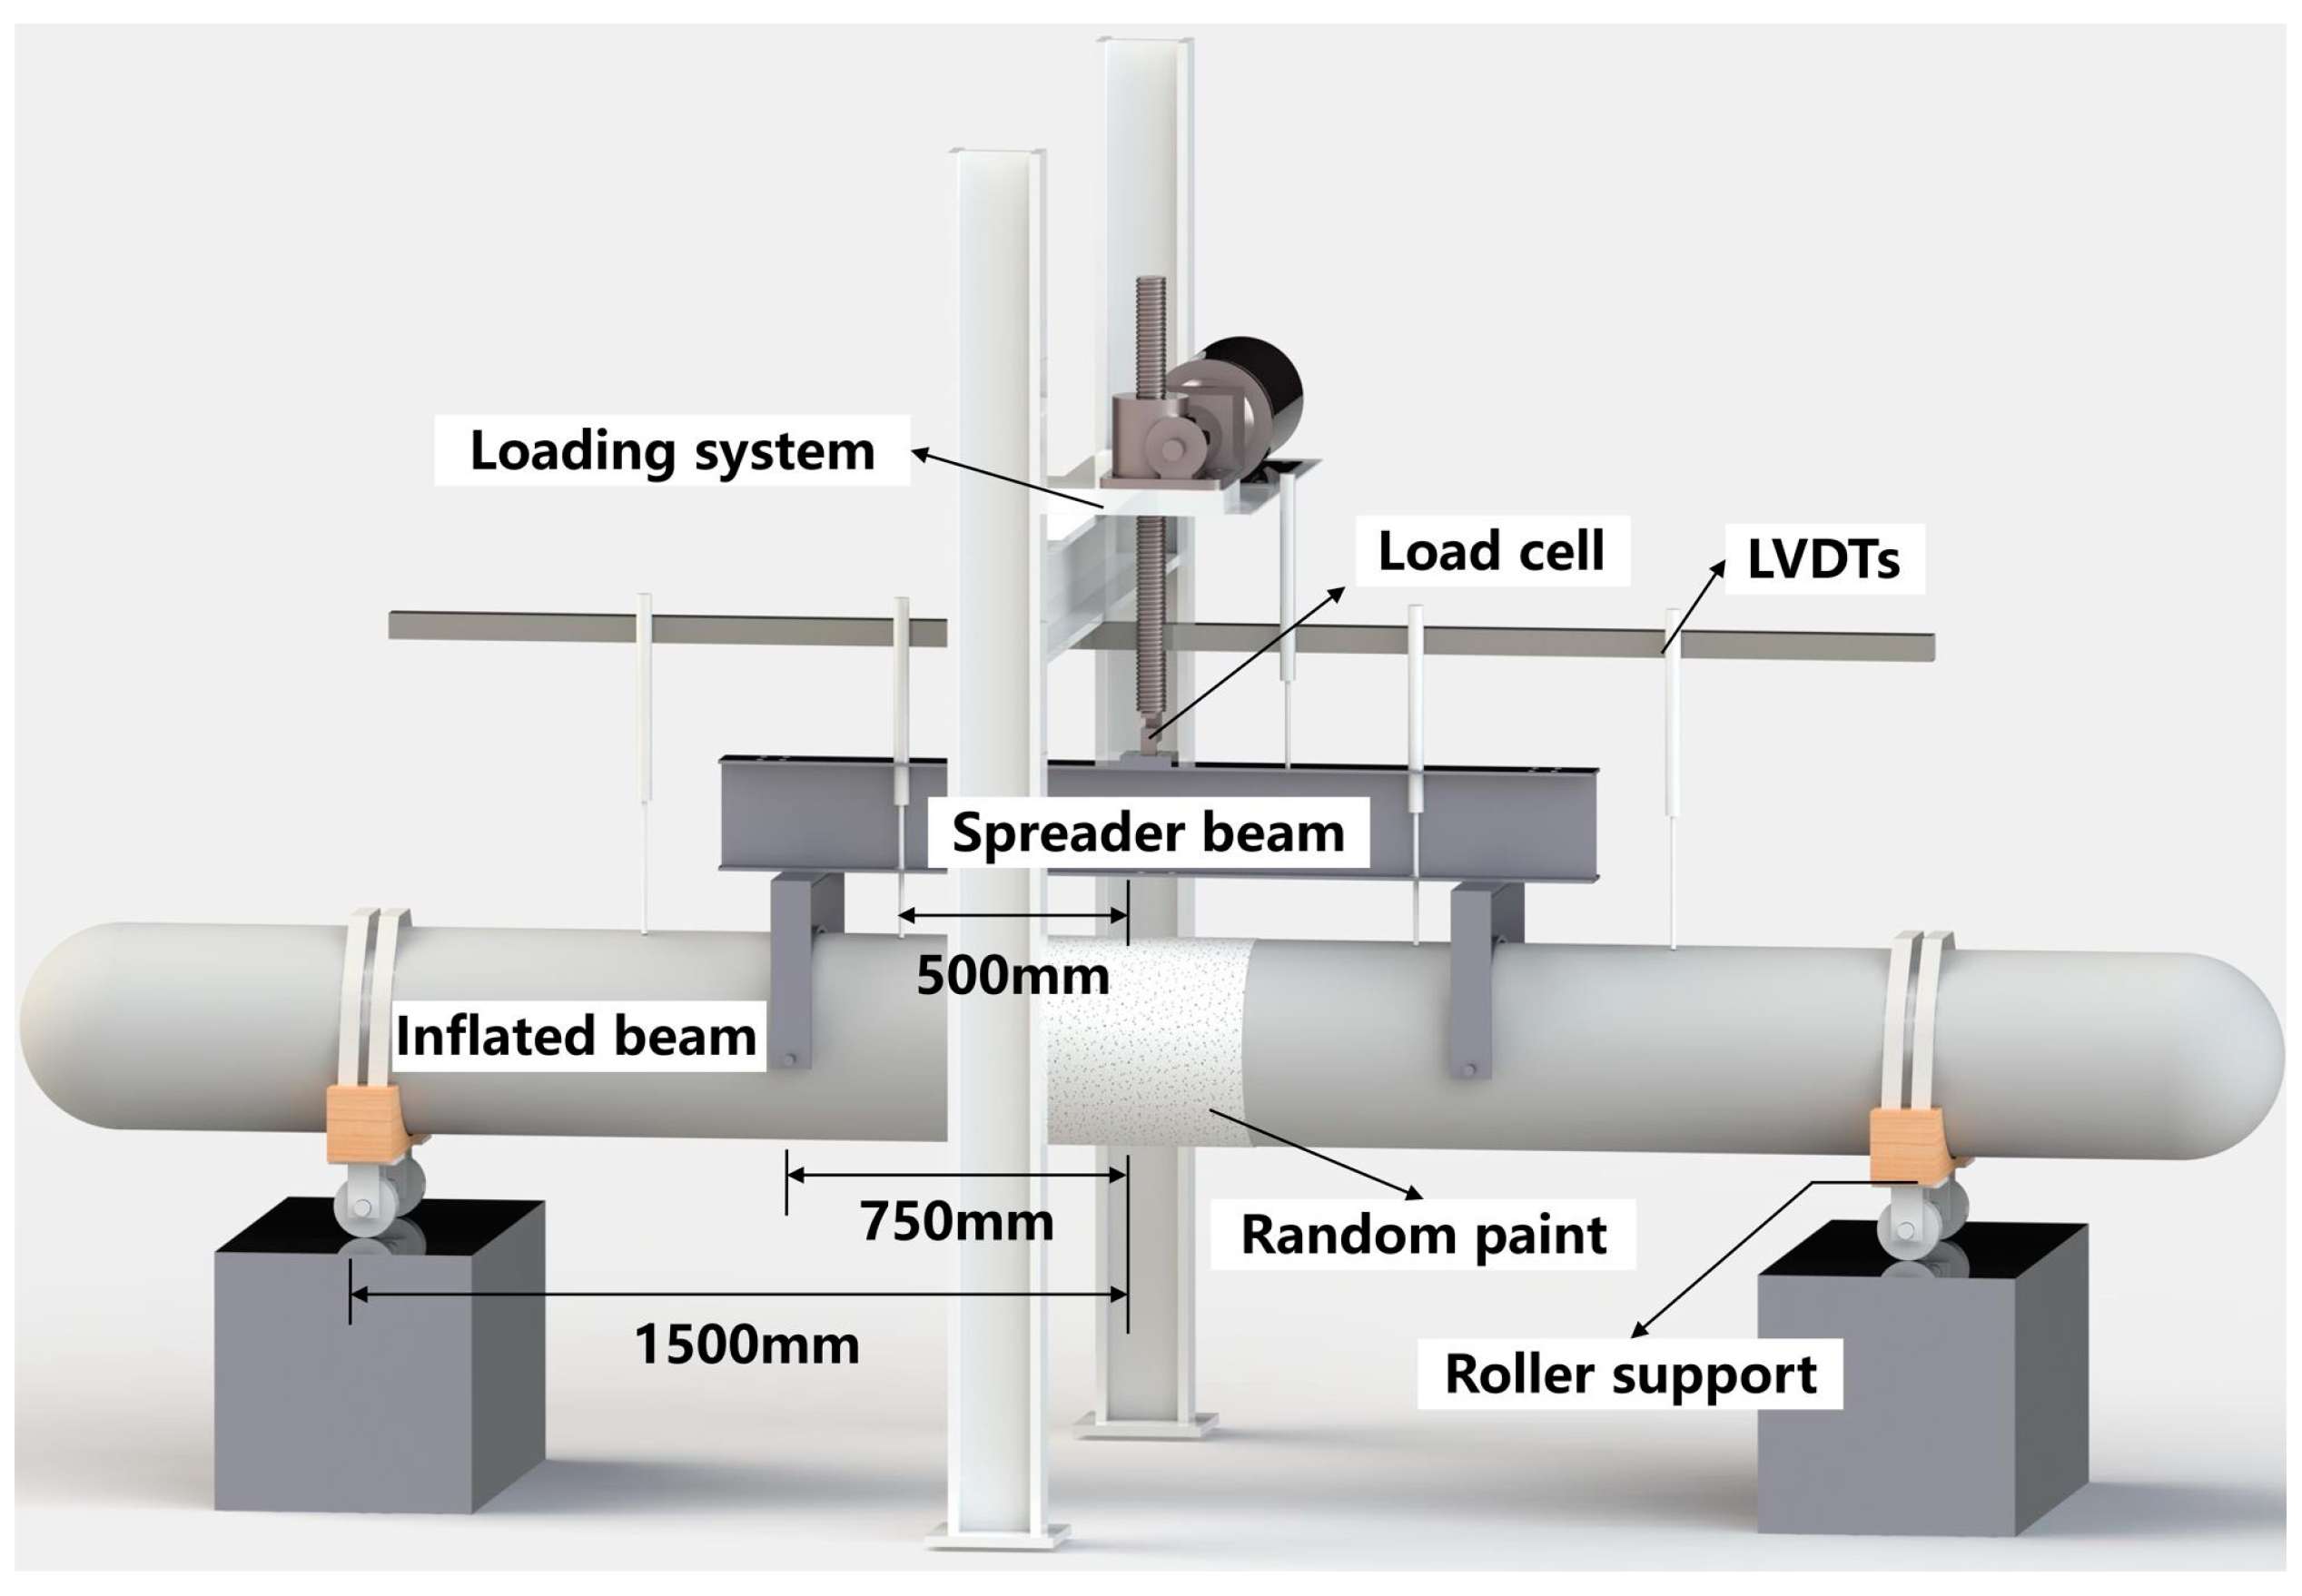
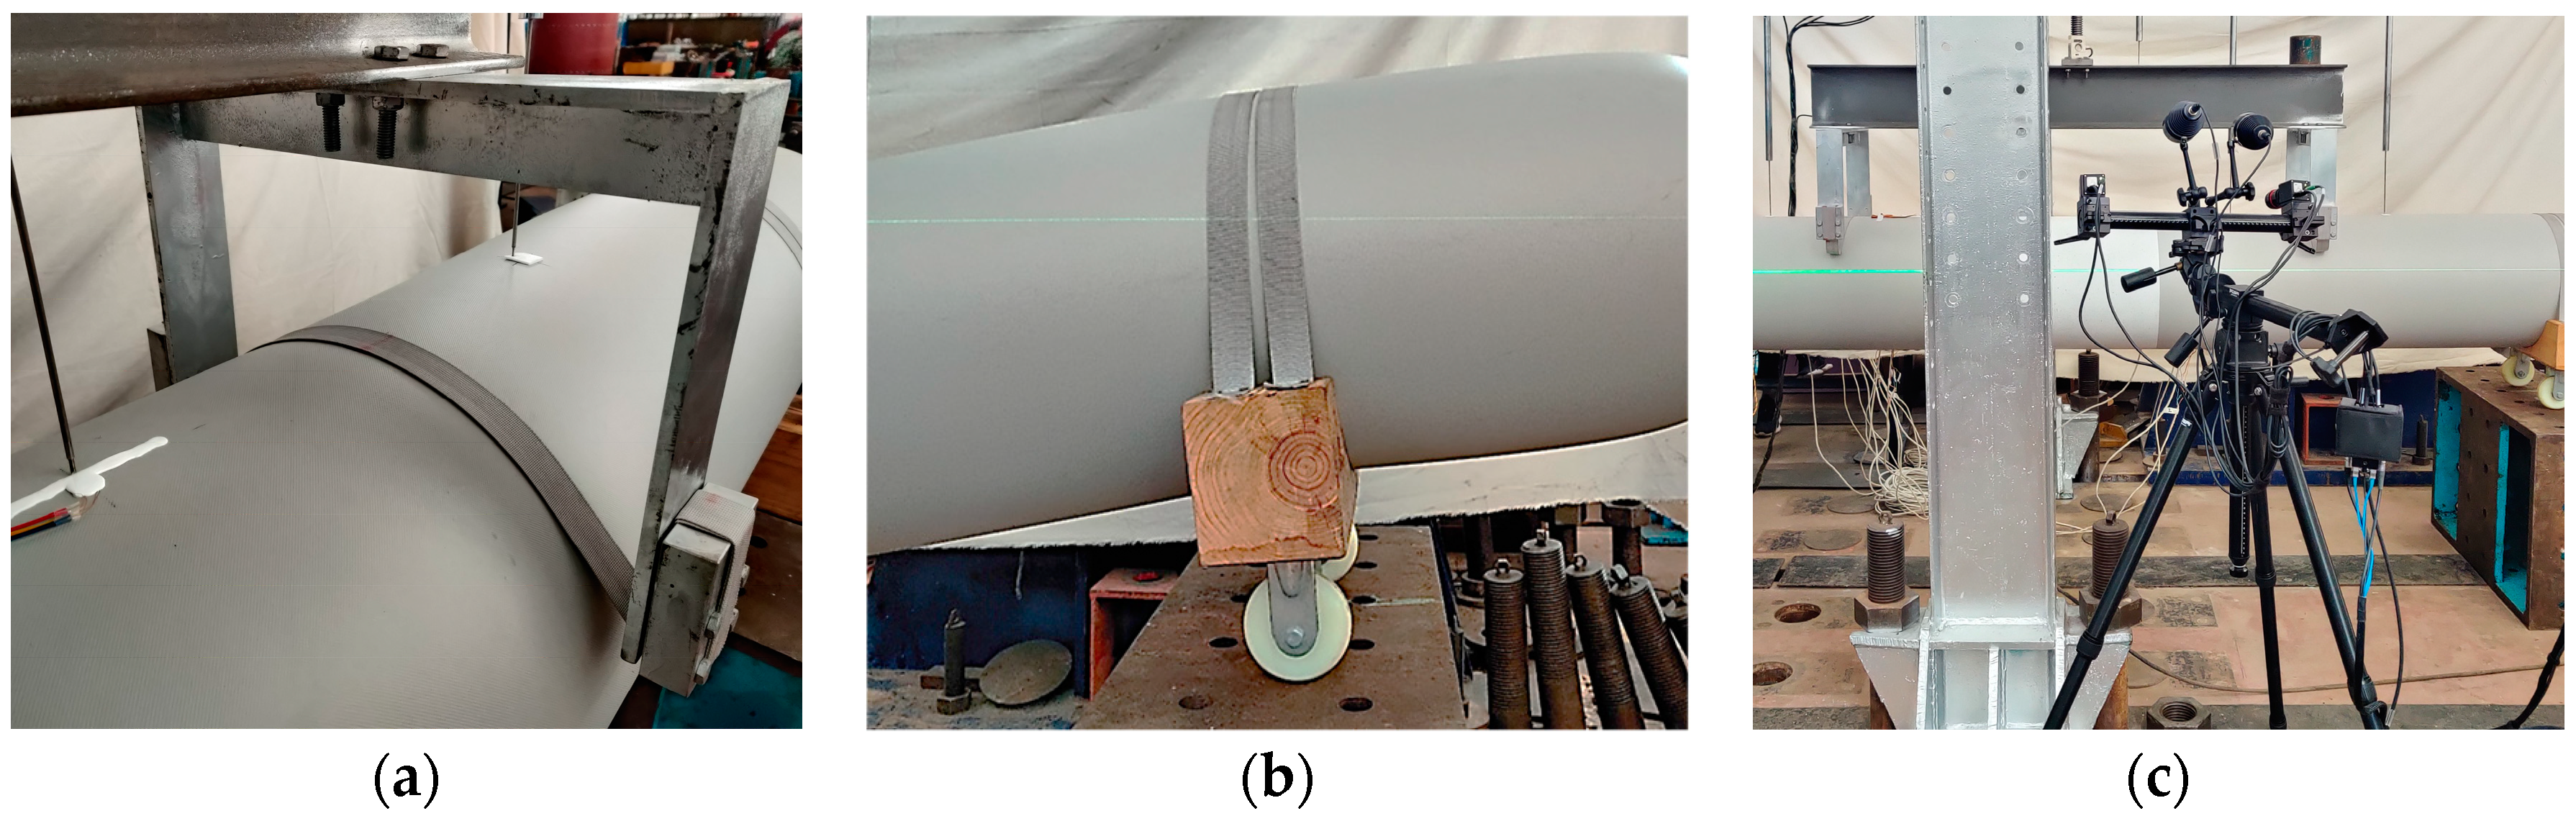
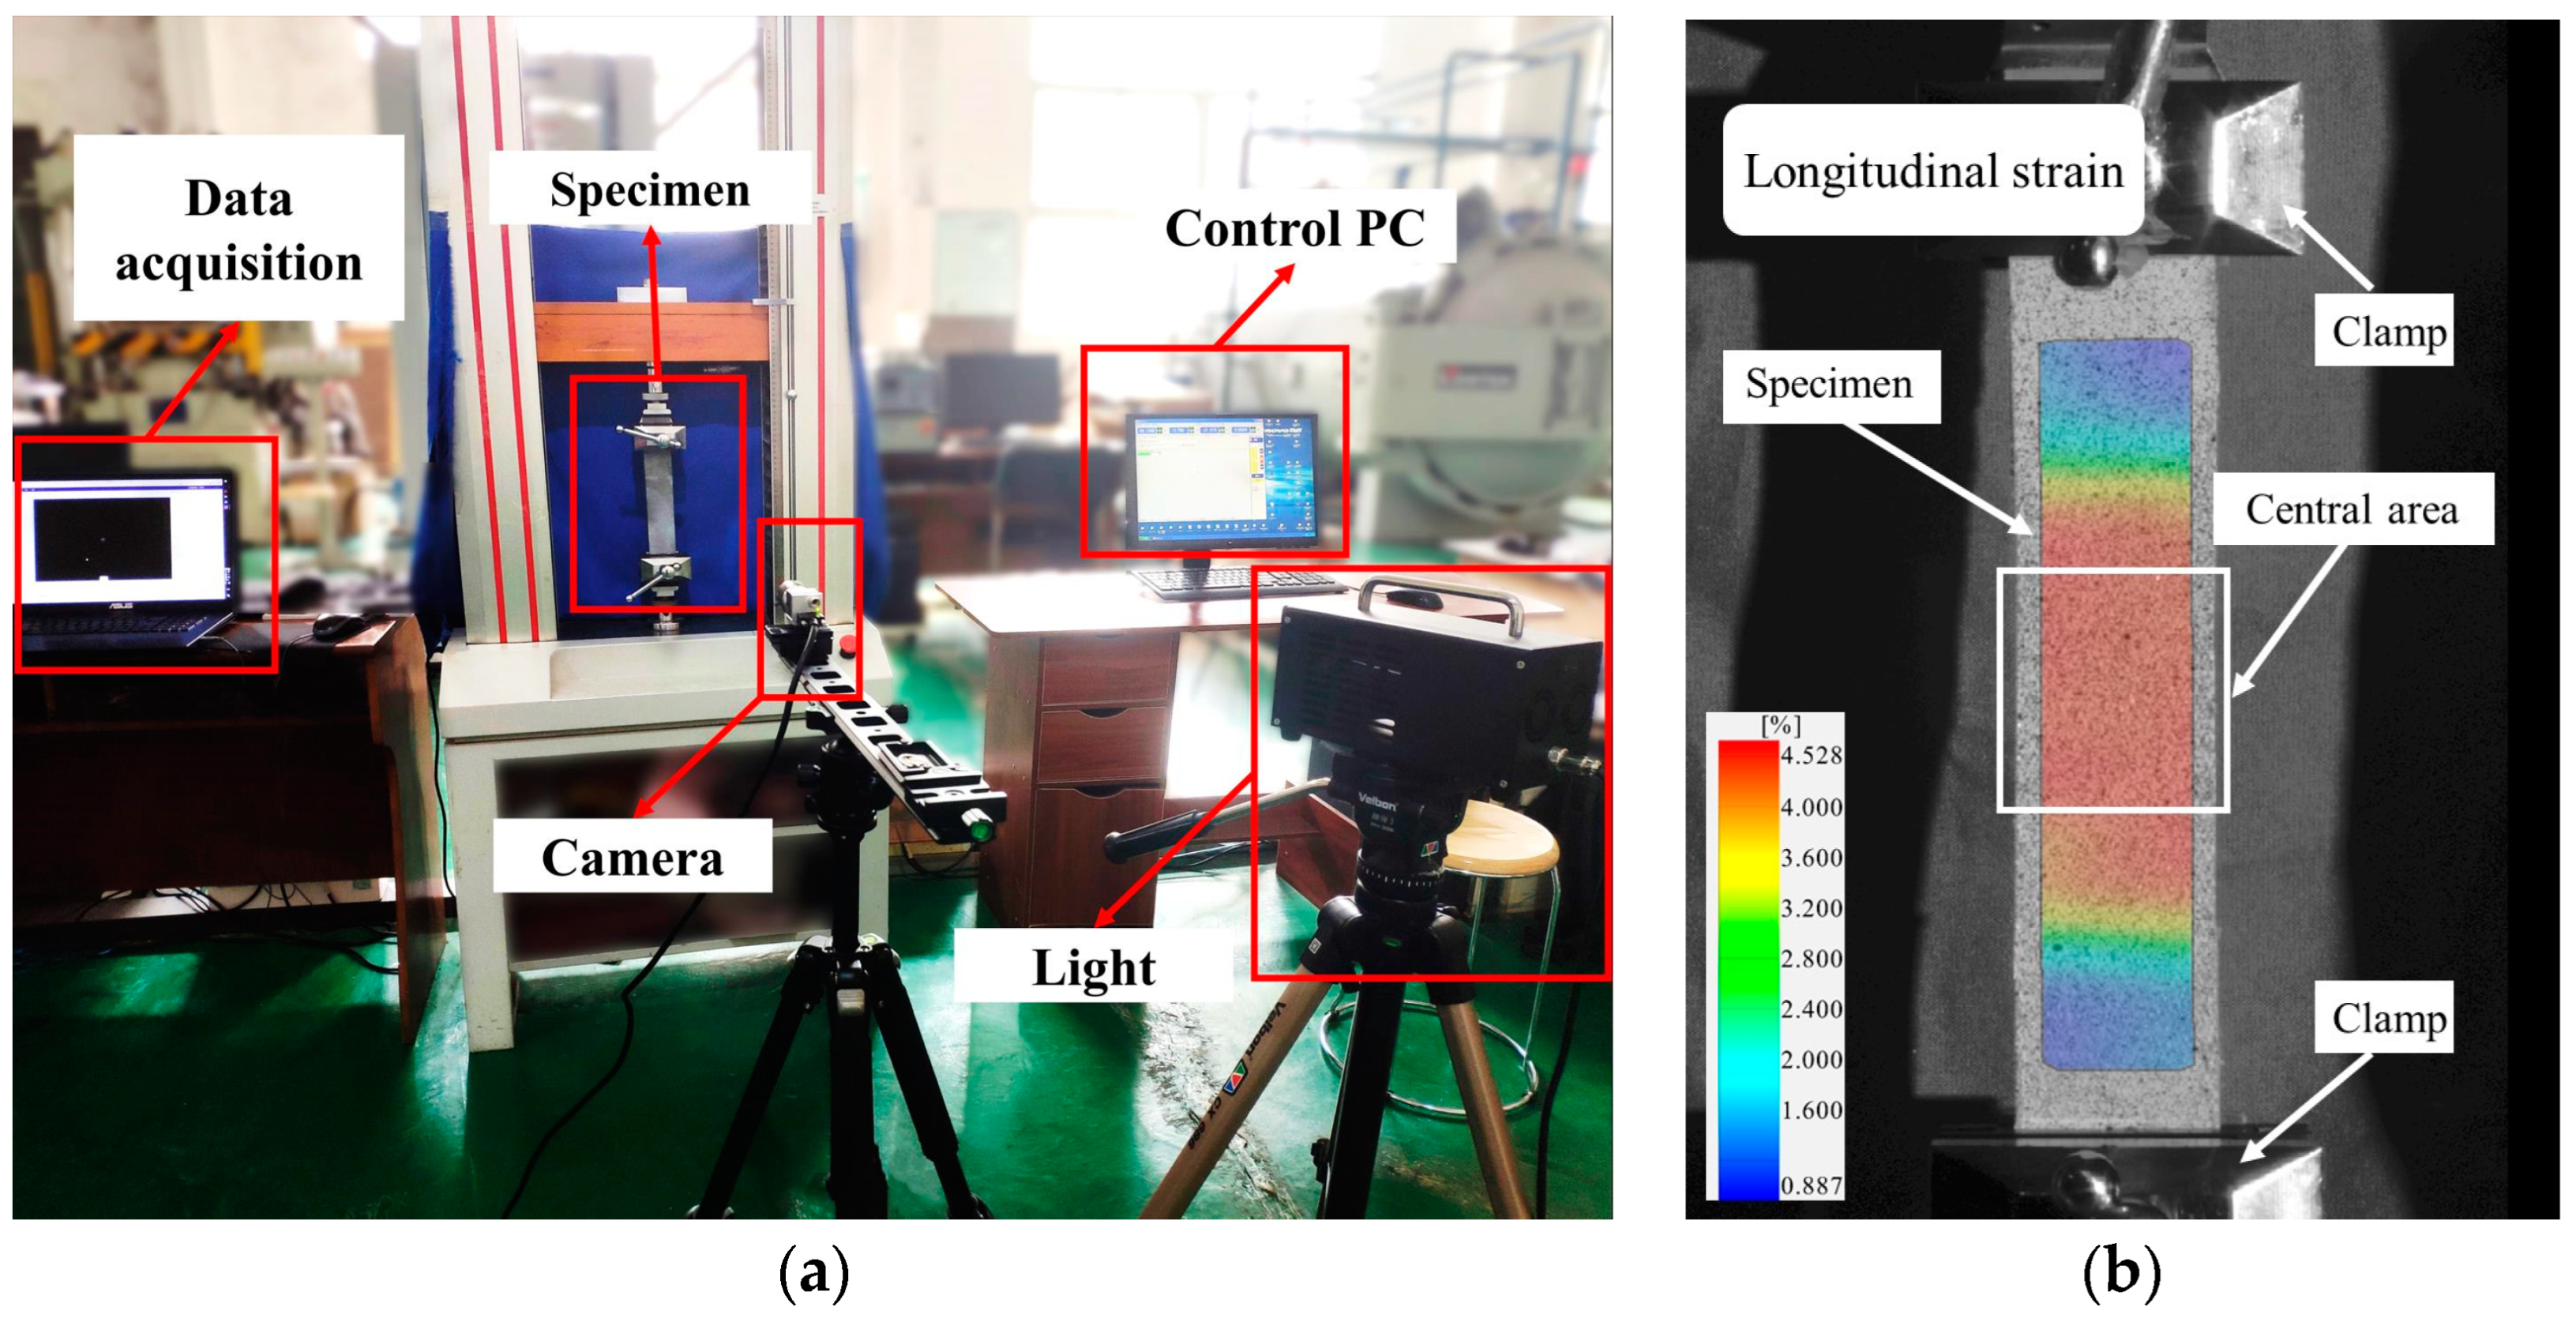
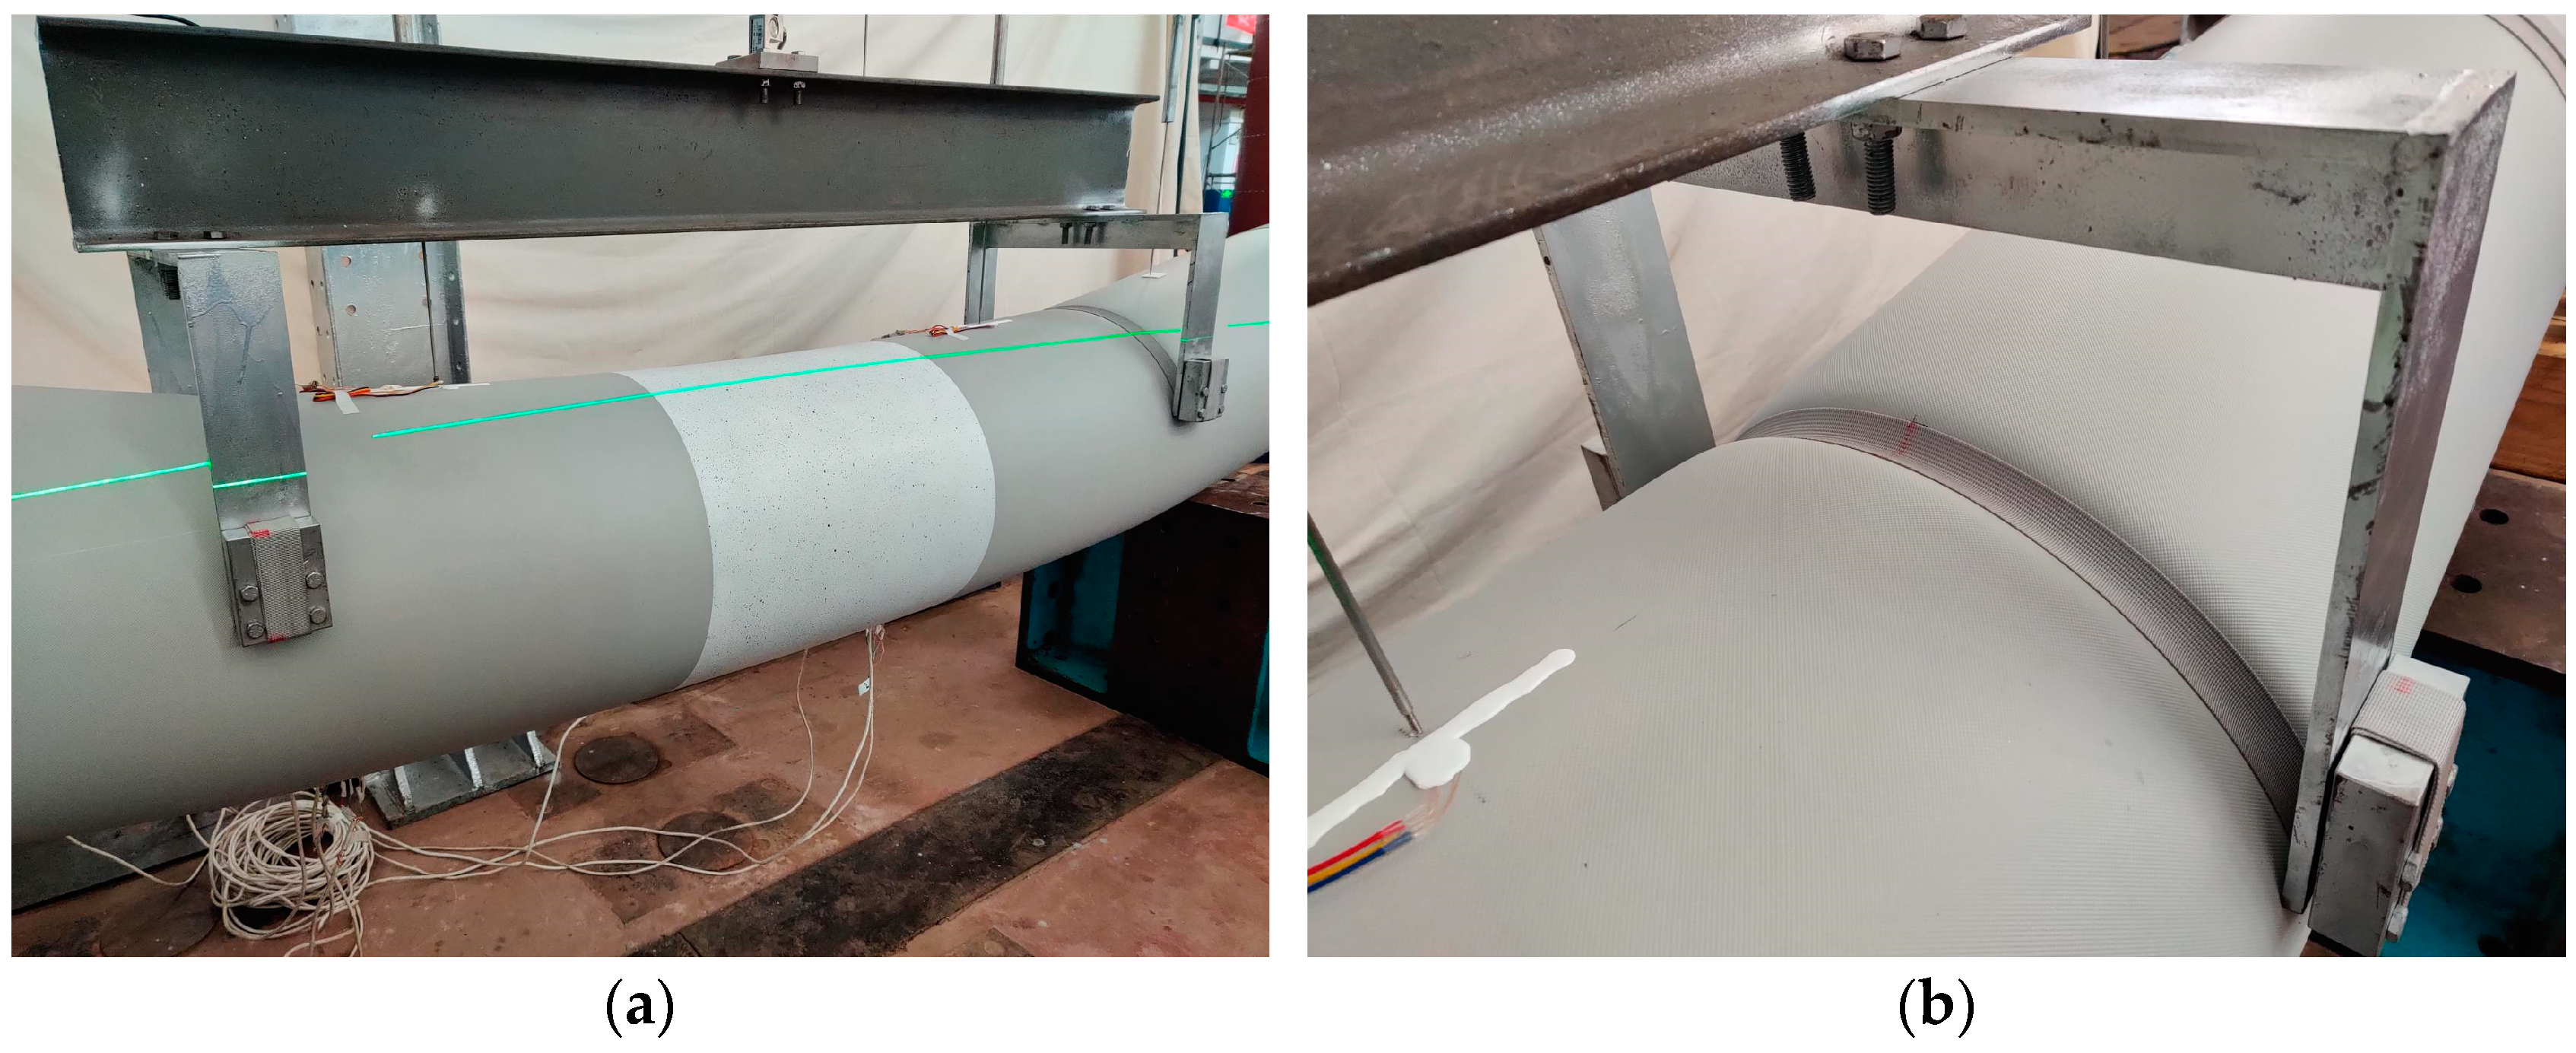
The purpose of this work is to investigate the bending and failure behaviour of inflated composite fabric membranes and to characterize the effect of pressure, membrane material and the coupling effect of internal gas and structures. Thus, four-point bending experiments were conducted to reveal the structural response behaviour of the inflated membranes subjected to bending load. In parallel, the fluid cavity method was adopted to establish a FEM with the material properties determined from the tensile tests. Subsequently, the bending and failure behaviour was analysed by both experiments and FEM, and the effects of the internal pressure and wrinkles were also discussed. Once the FEM reliability has been verified by comparing it with the experimental result, a simulation plan would be designed by design-of-experiment (DoE) to fit an empirical expression of the ultimate bending loading. Finally, the empirical expression was adjusted and compared with numerical predictions to verify its reliability.

2. Materials and Methods

2.1. Methods for Experimental Tests

2.1.1. Experimental Samples

The inflated samples were fabricated from coated composite fabric membranes that exhibit desirable characteristics such as low elastic modulus, exceptional extensibility and high tensile strength. As depicted in Figure 2a, the membrane’s typical configuration consists of substrate and coating [21], where the former serves as the structural layer with commendable mechanical characteristics which is composed of two mutually orthogonal yarn families. The yarn is manufactured from polyester threads. The longitudinal direction of weaving is referred to as the warp (axial) direction, while the transverse direction is termed the weft direction. The warp yarns are straight, while the weft yarns interlace around the warp yarns in an alternating fashion [22]. The coating, made of polyvinyl chloride (PVC), imparts self-cleaning, durability and impermeability to the membrane, and is also referred to as the functional layer. In order to manufacture the PVC membrane, the coating material is sprayed onto the substrate using specialized equipment.
A photograph of the inflated sample was presented in Figure 2b, which was in the form of a straight thin-walled beam. The nominal dimensions of the sample were a length of 4 m and a diameter of 400 mm. However, it would be noteworthy that the actual diameter of the sample underwent variations with changes in internal pressure across all cases. For instance, at an internal pressure of 10 kPa, the real diameter of the sample was measured to be 413.81 mm, while it was 415.75 mm at 20 kPa.

2.1.2. Setup

A four-points bending experimental configuration was designed under simply supported boundary conditions to investigate the bending behaviour of inflated samples. The diagram of the test setup was shown in Figure 3.
The loads were applied using an electric jackscrew and distributed evenly to a pair of load frames through the I-beam. As illustrated in Figure 4a, the load frames, which were 50 mm wide and separated by a distance of 1.5 m, transferred the forces to the samples for testing. The inelastic strap was hinged on the frame to eliminate potential knife-edge effects on the load process and permit follower-type reactions whereby the force vectors were allowed to rotate as the inflated samples deflected. Furthermore, the support consisted of a wooden saddle equipped with two wheels that were designed to match the diameter of the tested samples and provide end support (refer to Figure 4b). To prevent the saddles from tipping, straps were tightly fastened over the top of the sample at each end. This simple support system enabled the sample ends to rotate freely and move horizontally during the test. The span from center to center of rollers was 3 m.
Furthermore, the concentrated force, the internal pressure and the deflection were measured by the pressure transducer, the precise barometer and the linear variable differential transformers (LVDTs), respectively. In addition, to pay attention to examining the response of the midspan region, the Digital Image Correlation system was employed to capture the deflection and strain exactly in this region.

2.2. Numerical Modeling Verification

2.2.1. Calculation Method of Inflated Membrane Structure Based on Fluid Cavity Model

The load–deflection response of the inflated membrane is highly dependent on internal pressure; nevertheless, the volume variation caused by structural response will change the magnitude of internal pressure [1,23]. Thus, one crucial aspect of modeling inflated membrane structures is accurately simulating the variation in internal gas pressure throughout the loading process within the numerical model.
The conventional approach involves approximating the internal gas as uniformly distributed pressure on the surface of the membrane, which fails to describe the complex coupling effect between the gas and the structure. Surface-based Fluid Cavity Modeling [24] can effectively solve the problem of fluid-structure coupling relationships under hydrostatic conditions. For this method, the fluid pressure is calculated by the volume of the fluid cavity, so that the variation of the cavity volume caused by the external load can be considered. It is widely used in the airbag inflation process [25], the airship structural response analysis, and the mechanical property analysis of the inflated string dome structure [26]. The method relies on the principles of the ideal gas theory, and its underlying state equation is presented in Equation (1).
PV = nRT,
where P is the absolute pressure, V is the gas volume, n is the number of internal gas substances, R is the gas constant and T is the thermodynamic temperature.
A typical fluid cavity element F3D4 is demonstrated in Figure 5, which is a 5-node pyramid element. The fluid cavity wall node is located at the bottom of the element, and the top node is the fluid cavity reference node which should be located in the interior of the cavity.

2.2.2. Numerical Model

A nonlinear finite element model was developed by the commercial finite element software Abaqus. The total length and the diameter of the model were 4000 mm and 400 mm respectively. As shown in Figure 6, the bladder was modelled by the 4-node membrane element. Two symmetrical concentrated loads were applied to this model, the loading point was 750 mm away from the midspan and the 4-node shell element was employed to model the loading straps. Moreover, the support saddles were modelled by the 8-node solid element. In order to prevent relative sliding, the contacts between each component were all restrained by bonding.
To simulate simply supported boundary conditions, the X-axial displacement of the right support and Y-axis rotation of the two support ends were released, while other degrees of freedom were constrained.

2.2.3. Material Property

The membrane material was considered as the orthotropic material; thus, the four material parameters E12, E21, υ21, and G12 should be ascertained to define the material properties of the numerical model. The stress-strain relationship is as follows:
ε 12 ε 21 γ 12 = 1 / E 12 υ 12 / E 12 0 υ 12 / E 12 1 / E 21 0 0 0 1 / G 12 σ 11 σ 22 τ 12
The mechanical parameters of the membrane material were obtained by the three-orientation uniaxial tensile test (see Figure 7). The tensile test configuration was devised in accordance with the ASTM D4851 standard [27].

2.3. Methods for Parametric Analysis and Fitting of Design Expression

2.3.1. Simulation Plan

The Response Surface Methodology (RSM) is an analysis method integrating the experiment and FE model, in which the regression analysis is used to establish the mathematical model of design variables and target response values [28,29,30]. Figure 8 showed the simulation scheme that was designed by employing the combination of two face-centred composite designs of experiments (CCF-DoE). Each group of designs included a center point, 2k “corner points” and 2k “star points”. The distances from the project center to the “corner points” were equal to ±2 and ±1 coded units respectively.
In this study, two regression variables (k = 2) were considered, X1: D/t and X2: p, with ranges of 294 ≤ D/t ≤ 882 and 20 kPa ≤ p ≤ 100 kPa, respectively (D was the diameter of the model, t was the thickness of the membrane and p was the internal pressure). Thus, the uncoded and coded values from each regressor level were summarized in Table 1.

2.3.2. Parametric Analysis

To evaluate the contribution of each regressor variable and their interactions, a parametric analysis was conducted utilizing a multiple linear model analysis of variance (ANOVA) which was further optimized using the least-squares method (LSM).

2.3.3. Design Expression

The empirical response surface model of the ultimate loading was established by multiple linear regression which considered k = 2 regressor variables, X1: D/t and X2: p, by the regression coefficients βj (j = 0, 1, ⋯, k).
F ( X j ) = β 0 + j = 1 k β j X j + j = 1 k β j j X j 2 + i < j = 2 k β i j X i X j + j = 1 k β j j j X j 3 + i < j = 2 k β i i j X i 2 X j + i < j = 2 k β i j j X i X j 2 ,
where βj, βjj, βjjj were the expected first-order, second-order and third-order effects in the ultimate loading F(Xj), respectively, from the changes of regression variables Xj when the rest of the variables Xi were constrained. Βij, βiij, βijj represented the interaction between regression variables Xi and Xj.
Substituting the regression variables in Equation (3), the cubical model of ultimate loading F(Xj) was conducted.
F ( D / t , p ) = β 0 + β 1 ( D / t ) + β 2 p + β 3 ( D / t ) p + β 4 ( D / t ) 2 + β 5 p 2 + β 6 ( D / t ) 2 p + β 7 ( D / t ) p 2 + β 8 ( D / t ) 3 + β 9 p 3 ,
The final expression would depend on the result of the parametric analysis, and part terms of Equation (4) would be disregarded as the p-value > 0.01.

3. Results and Discussions

3.1. Experimental Results and Numerical Model Verification

3.1.1. Four-Points Bending Experimental Results

Five measured points’ load–deflection curves for the inflated sample with 30 kPa internal pressure were plotted in Figure 9. The load–deflection curves of the symmetric measured points (e.g., 1/6 spam and 5/6 span or 1/3 spam and 2/3 span) were almost coincident, which proved that the bending load system was symmetric and there was no torsion load during the test process.
The load–deflection curves exhibited an initial linear response, which was succeeded by a softening behaviour. Likewise, the inflated samples presented two typical deflected states with the increase of load. Under the initial load (as shown in Figure 10a), the deflected curve transits smoothly along the axis of the samples which just seemed like a common beam. With the increase of load, the deflection curve developed into the trilinear model (as shown in Figure 10b), loading points were inflection points of the trilinear and the loading section of the inflated sample (between the two loading points) was almost straight. Theoretically, the bending moments in the loading section are equal and gradually decrease from the loading point to the adjacent boundary, which leads mainly to this typical deformation behaviour of the thin-walled inflated beam.
Besides, the inflated samples would not recover when unloaded completely, and the residual deformation increased with the increase of the internal pressure. The reason for the phenomenon was related to the crimp interchange of the woven substrate and the viscoelasticity of the polyester fabrics [31]. The residual deformation would fade away with time or the occurrence of inflating and deflating alternately.
In addition, when the load reached the limit value, the compressive stress caused by the bending moment would counteract the tensile stress induced by internal pressure, which would result in significant local deformation (shown in Figure 11). Especially, it would compress the membrane sheet along the axial direction on the compressive part and trigger the local membrane to generate strangulation or wrinkles. This wrinkling behaviour would lead to buckling which was similar to that of the circular tube subjected to pure bending load [32]. Nevertheless, as a result of the support provided by the internal pressure, the formation of wrinkles did not lead to immediate structural buckling failure but instead degraded the structural stiffness of the inflated beam, which was also validated by Malm’s experiments [33]. This was also reflected in the load–deflection curve, which exhibited a softening effect in the post-wrinkle stage (see Figure 9). The weaker local carrying capacity in the wrinkling region would also enhance the trilinear deflected pattern.

3.1.2. Material Level Test Results

The stress–strain curves for fabric membrane straps were illustrated in Figure 12. The stress–strain curves represented high nonlinearity during the loading process [34]. Nevertheless, stage 1 of the stress–strain curves could cover the range of this study and this part of the curves could be considered linearity; thus, the elastic moduli of warp and weft were obtained by fitting the slopes. The details of the main material parameters were summarized in Table 2.
Where ρ is the density, E12 and E21 are the elastic moduli in the longitudinal and latitudinal directions, respectively, and υ12 is Poisson’s ratio. G12 is the shear modulus obtained from Equation (5) [35]. E45 and υ45 are the elastic moduli and Poisson’s ratio in the 45° direction, respectively.
G 12 = E 45 2 ( 1 + υ 45 ) ,

3.2. Numerical Modeling Verification

3.2.1. Mesh Properties

Figure 13a showed the midspan load–displacement curves of the 60 kPa internal pressure model under the mesh sizes of 40 mm, 30 mm, 20 mm and 15 mm, respectively. It could be seen that the slopes of curves in the linear stage were almost the same under different mesh sizes, which meant that the mesh size within the selected range did not affect the calculation accuracy of the structural bending stiffness. However, the variation in mesh size would change the ultimate bearing capacity. Moreover, a reduction in mesh size to 20 mm resulted in an ultimate loading value that was almost indistinguishable from that obtained with a mesh size of 15 mm. Meanwhile, as shown in Figure 13b, the calculation time of the model with the mesh size of 15 mm had reached 43 h which was the maximum one. Considering the calculation accuracy and efficiency, the mesh size of 20 mm was finally selected.

3.2.2. Deformation Behaviour and Failure Mode Analysis

The typical deformed patterns of the FE model of the inflated membrane structures were shown in Figure 14. In comparison with Figure 10, it was apparent that the overall deformed patterns based on the FEM were consistent with the experimental results.
Besides, it was found that the bearing capacity of inflated structures decreased significantly with the appearance of wrinkles in the experiment. Then, the development of wrinkles would induce a special failure mode of inflated structures which was the structural instability caused by local buckling. This phenomenon had also been verified in the numerical simulation. When the load reached the inflexion point where the load–displacement curve changed from straight to curved, wrinkles occurred on the upper surface of the model in the bending region. As the applied load intensified, the wrinkles underwent a progressive transformation from multiple creases to a singular groove, culminating in the creation of the wrinkling hinge, as shown in Figure 15, the structure lost its bearing capacity at this moment. Therefore, the appearance of wrinkles would weaken the bearing capacity of the inflated membranes, and the further evolution of wrinkle hinges would lead to the failure of this structure [36].
As shown in Figure 16, the FE model results could match the patterns of the experimental load–deflection curves under the internal pressure conditions of 10 kPa, 20 kPa, 30 kPa, 40 kPa and 50 kPa, and they were nearly consistent under the initial stages with the same internal pressure especially. In addition, with the increase of internal pressure, the failure load and the structural stiffness were significantly improved. Therefore, increasing the internal pressure was an effective way to strengthen the bearing capacity of inflated membrane structures.
For quantitative analysis, the ultimate load and the structural stiffness were two important parameters to characterize the load-bearing performance of inflated membrane structures. To quantify the differences between numerical predictions and experimental measurements, the Expression (6) was utilized to determine the deviations.
F d e v = F F E M F E X P 1 K d e v = K F E M K E X P 1
As shown in Table 3, the ultimate load increased with the increase of internal pressure. Nevertheless, the deviations between the FEM and experimental values of the ultimate load in all cases were less than 5%. Furthermore, the initial response of the inflated membrane structures, especially in the pre-wrinkle stage, is of interest because the inflated membrane structures would likely be designed to stay within the linear portion of the load–displacement response on a mission. Thus, the linear stage of the load–deflection curve was fitted and the slope of the fitted line was calculated to present the equivalent structural stiffness in the linear stage. The comparative results of the FEM and the experiment showed that the minimum deviation was less than 3% while the maximum value was not more than 5%. Therefore, the FEM has high reliability for the prediction of the ultimate load and the equivalent stiffness for the inflated membrane structure.

3.2.3. Comparative Analysis of Stress or Strain Response

The stress state of the inflated structure under the bending load was extracted from FEM. The axial tensile stress was basically equal everywhere under the effect of internal pressure load, which was in good agreement with the stress distribution law obtained from net theory [37] (due to geometric variation, the stress had a gradient distribution at both ends of the membranes, which was not within the scope of this study). As the load increased, the tensile stress in the upper part of the model gradually decreased (see Figure 14). Especially, the stress concentration would occur in the local loading region, which would eventually lead to model failure with further development.
In order to verify the strain response of the inflated model under the bending load, the Digital Image Correlation (DIC) system was employed to measure the strain field in the midspan region of the experimental sample. Figure 17a showed the typical strain nephogram of the midspan region under 30 kPa internal pressure. The upper part was compressed with the lower part tensioned, which was proved by the FEM result. The strain data of midspan measuring points t and b were probed to quantify the loading–strain response in the loading process, which were plotted in Figure 17b. It was found that the curves of the FEM results were in good agreement with the experimental ones which meant that the FEM results of the strain response were responsible. Nevertheless, the strain of the measuring point t was followed with the measured values through most of the loading process but then deviated after wrinkles occurred. The reason could be that the membrane element M3D4R without bending stiffness was used for describing the inflated structure behaviour in the FEM, which would lose its bearing capacity immediately when encountering axial compressive stress [19], whereas the actual membrane material had the compressive stiffness which could withstand a certain axial compressive stress. Thus, the bearing capacity of the inflated structure in the FEM was smaller than that of the actual structure in the post-wrinkling stage; it also led to a smaller FEM compressive strain value than the test result after the wrinkle occurred.

3.3. Parametric Analysis and Fitting of Design Expression Results

Based on the CCF-DoE design method, 17 groups of experiments were designed, and the ultimate load was calculated using the fluid cavity simulation method. Some results were shown in Table 4.
The ANOVA results of the cubic model were shown in Table A1. The Model F-value of 4580.94 presented the model was significant and there was only a 0.01% chance that an F-value this large could occur due to noise.
Besides, in this case, X1, X2, X1X2, X12 and X12X2 were significant model terms due to their p-values of less than 0.01. Moreover, p-values greater than 0.10 indicated the model terms were not significant; thus, these terms, including X22, X1X22, X13, and X23, could be reduced to improve the prediction model. Table A2 showed the results of the reduction cubic (RC) model, the Model F-value of 10921.12 and the p-values of all the terms less than 0.0001 presented the model was significant.
Furthermore, the Predicted R2 of 0.9997 was in reasonable agreement with the Adjusted R2 of 0.997, and they were all significantly closer to 1. The signal-to-noise ratio of 377.96 far greater than the specified value 4 was desirable. These all indicated that the regression model had an adequate signal. The final expression of ultimate load F(D/t, p) was denoted by the RC model,
F ( D / t , p ) = 339.990 0.748 ( D / t ) + 35.325 p 0.2484 ( D / t ) p 1.96 × 1 0 4 ( D / t ) 2 + 5.09 × 1 0 4 ( D / t ) 2 p ,
where 294 ≤ D/t ≤ 882 and 20 kPa ≤ p ≤ 100 kPa.
Additionally, cubic and RC model predictions for the F values were plotted in Figure 18. All of the predicted points were close to the actual line and there was no further deviation of the RC results from the cubic ones. Thus, the RC model was applicable to represent the response surface of the ultimate load F(D/t, p).
Figure 19 presented the response surface of the ultimate load for the RC model. The oval isoheights from the contour plot (Figure 19a) represented that the interaction between the regression variables D/t and p were significant. Additionally, from the three-dimensional response surface hyperplane (Figure 19b), it was found that the design points sat basically on the response surface, which indicated that the predicted values of the regression model were in good agreement with the actual values. The deviation values for the RC model and FEM of each design point (Table 4) were less than 5%, which indicated that the RC model was highly authentic. Therefore, the proposed design expression had the potential to serve as a feasible alternative to the FEM for assessing the ultimate loading of the inflated composite membrane structure within the interesting range.

4. Conclusions

In this research, the bending and failure behaviour that the inflated composite membrane structure represents is investigated by experimental and numerical methods used in marine engineering. The reliability of the numerical model was verified by comparing it with the experimental result, then a simulation plan was designed by design-of-experiment (DoE) to develop an empirical expression for the ultimate bending load. The main conclusions are obtained as follows:
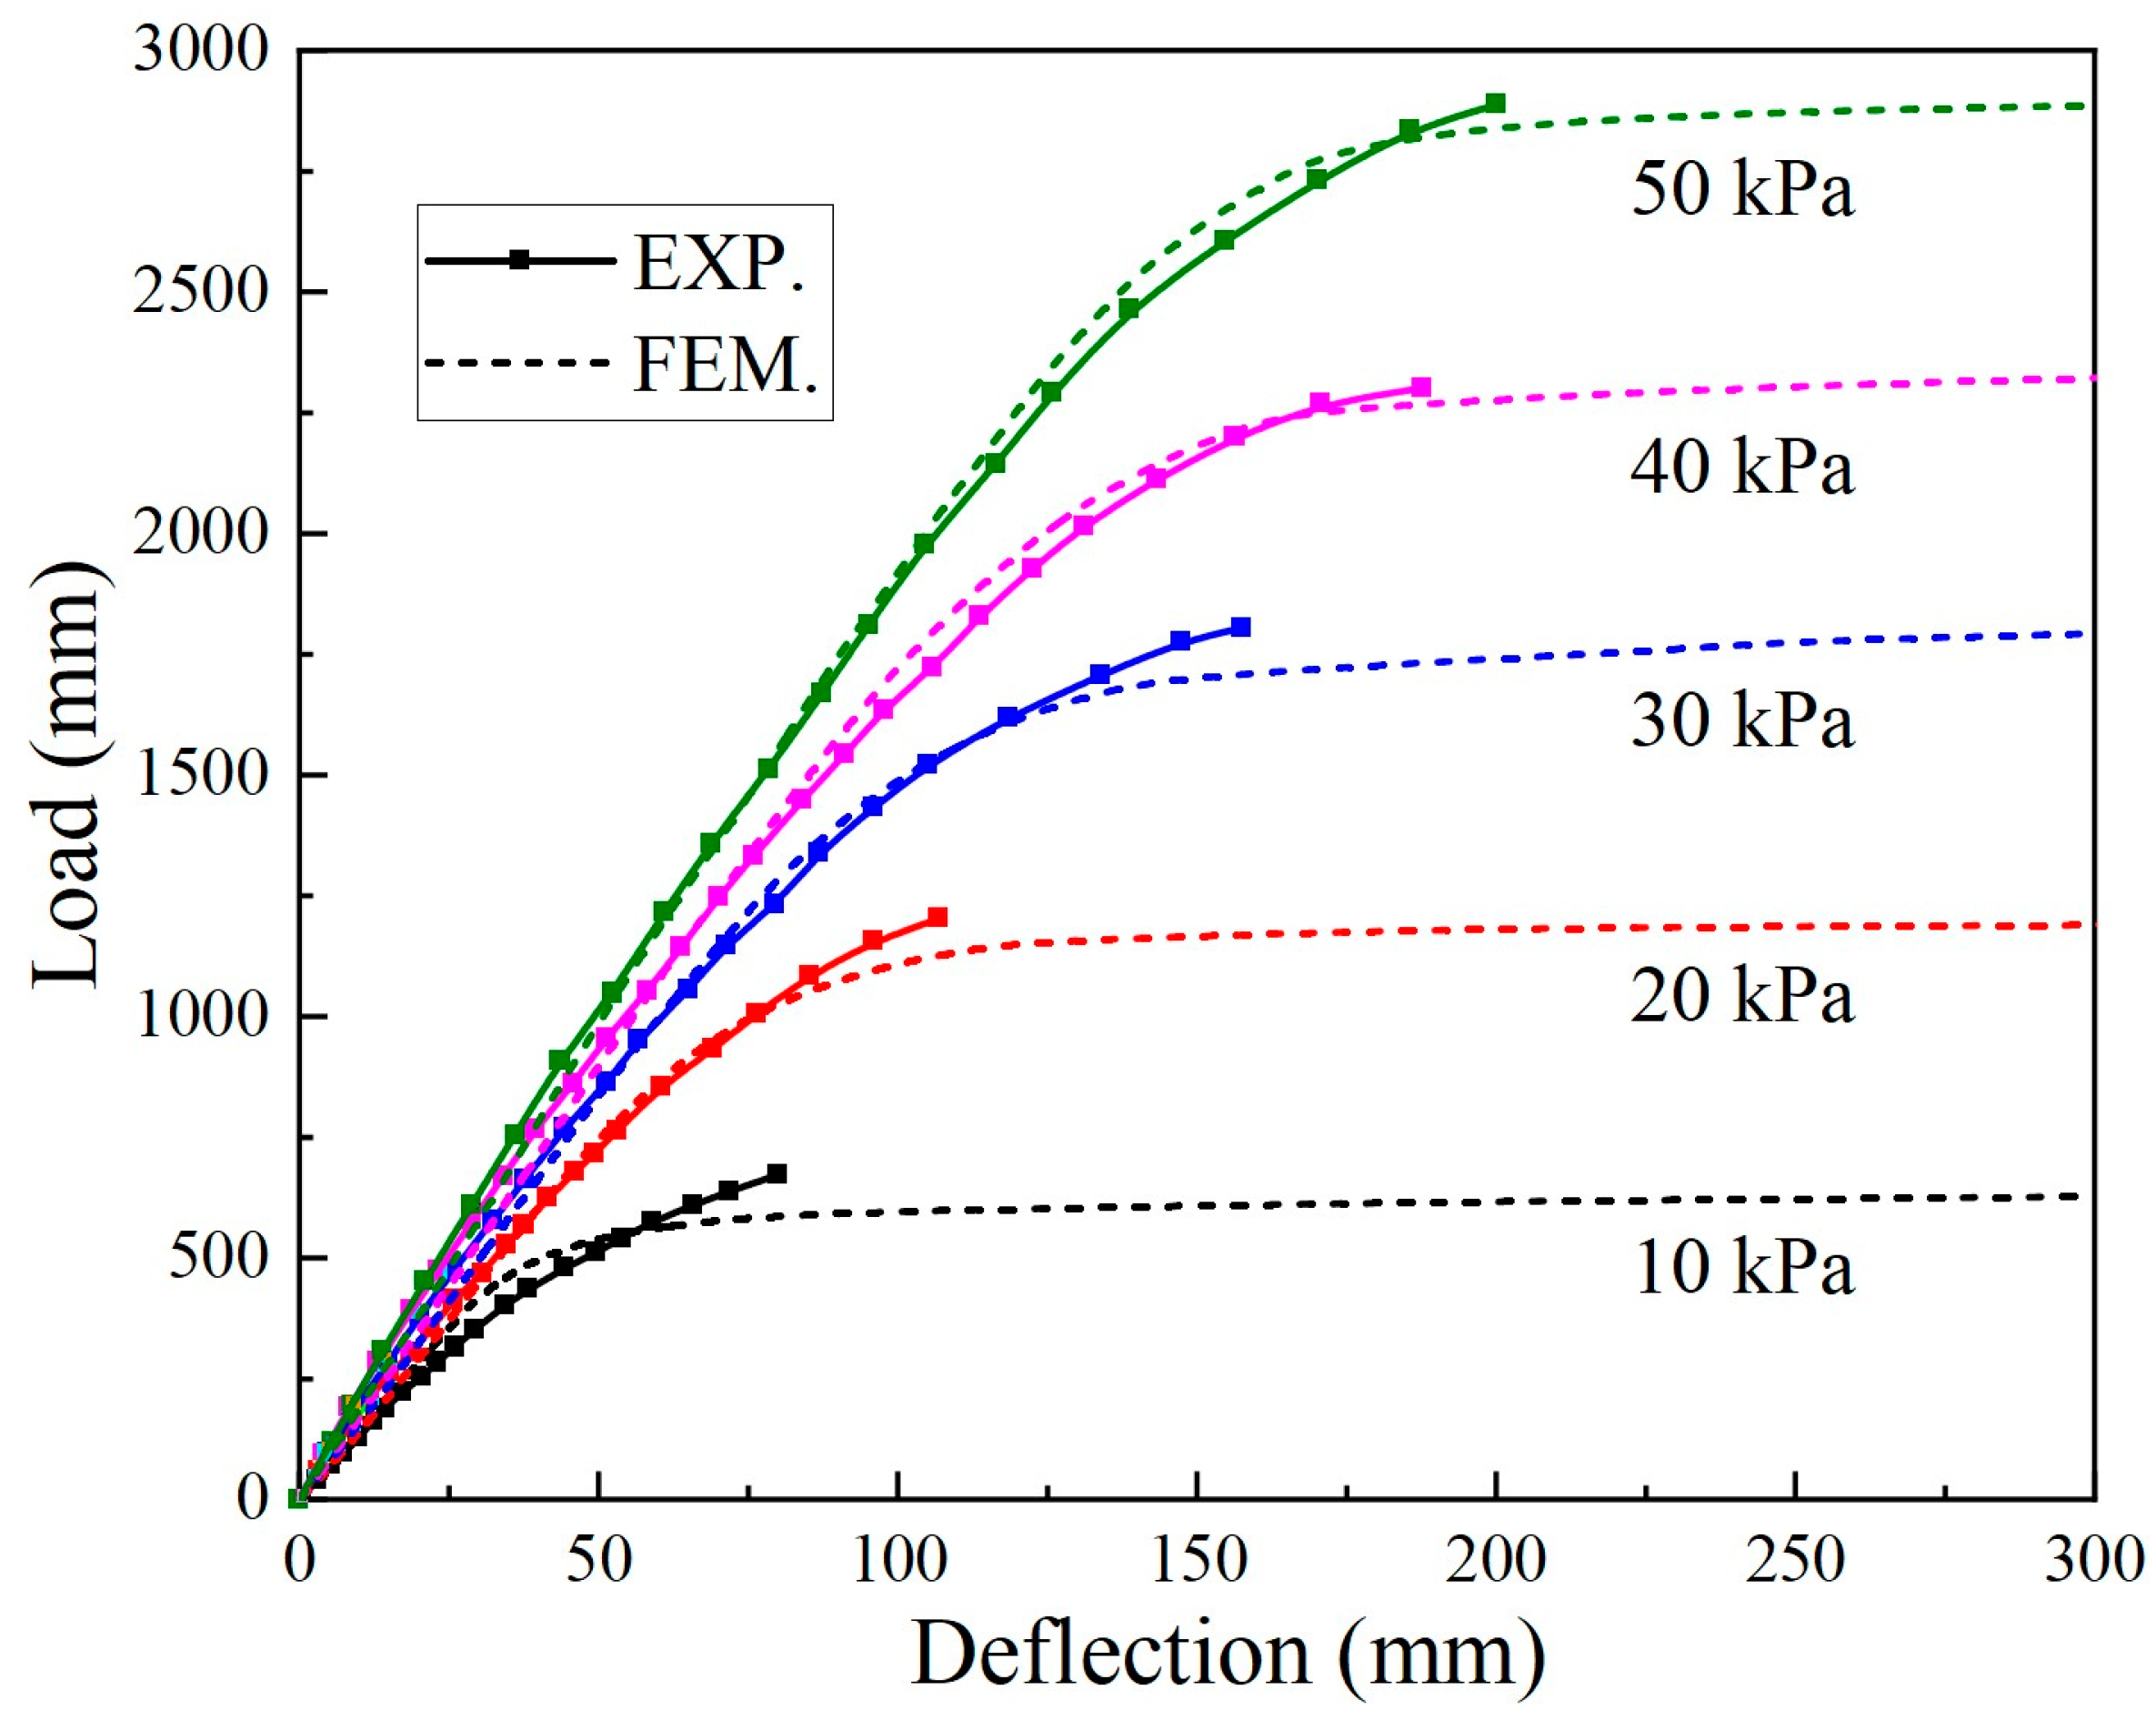
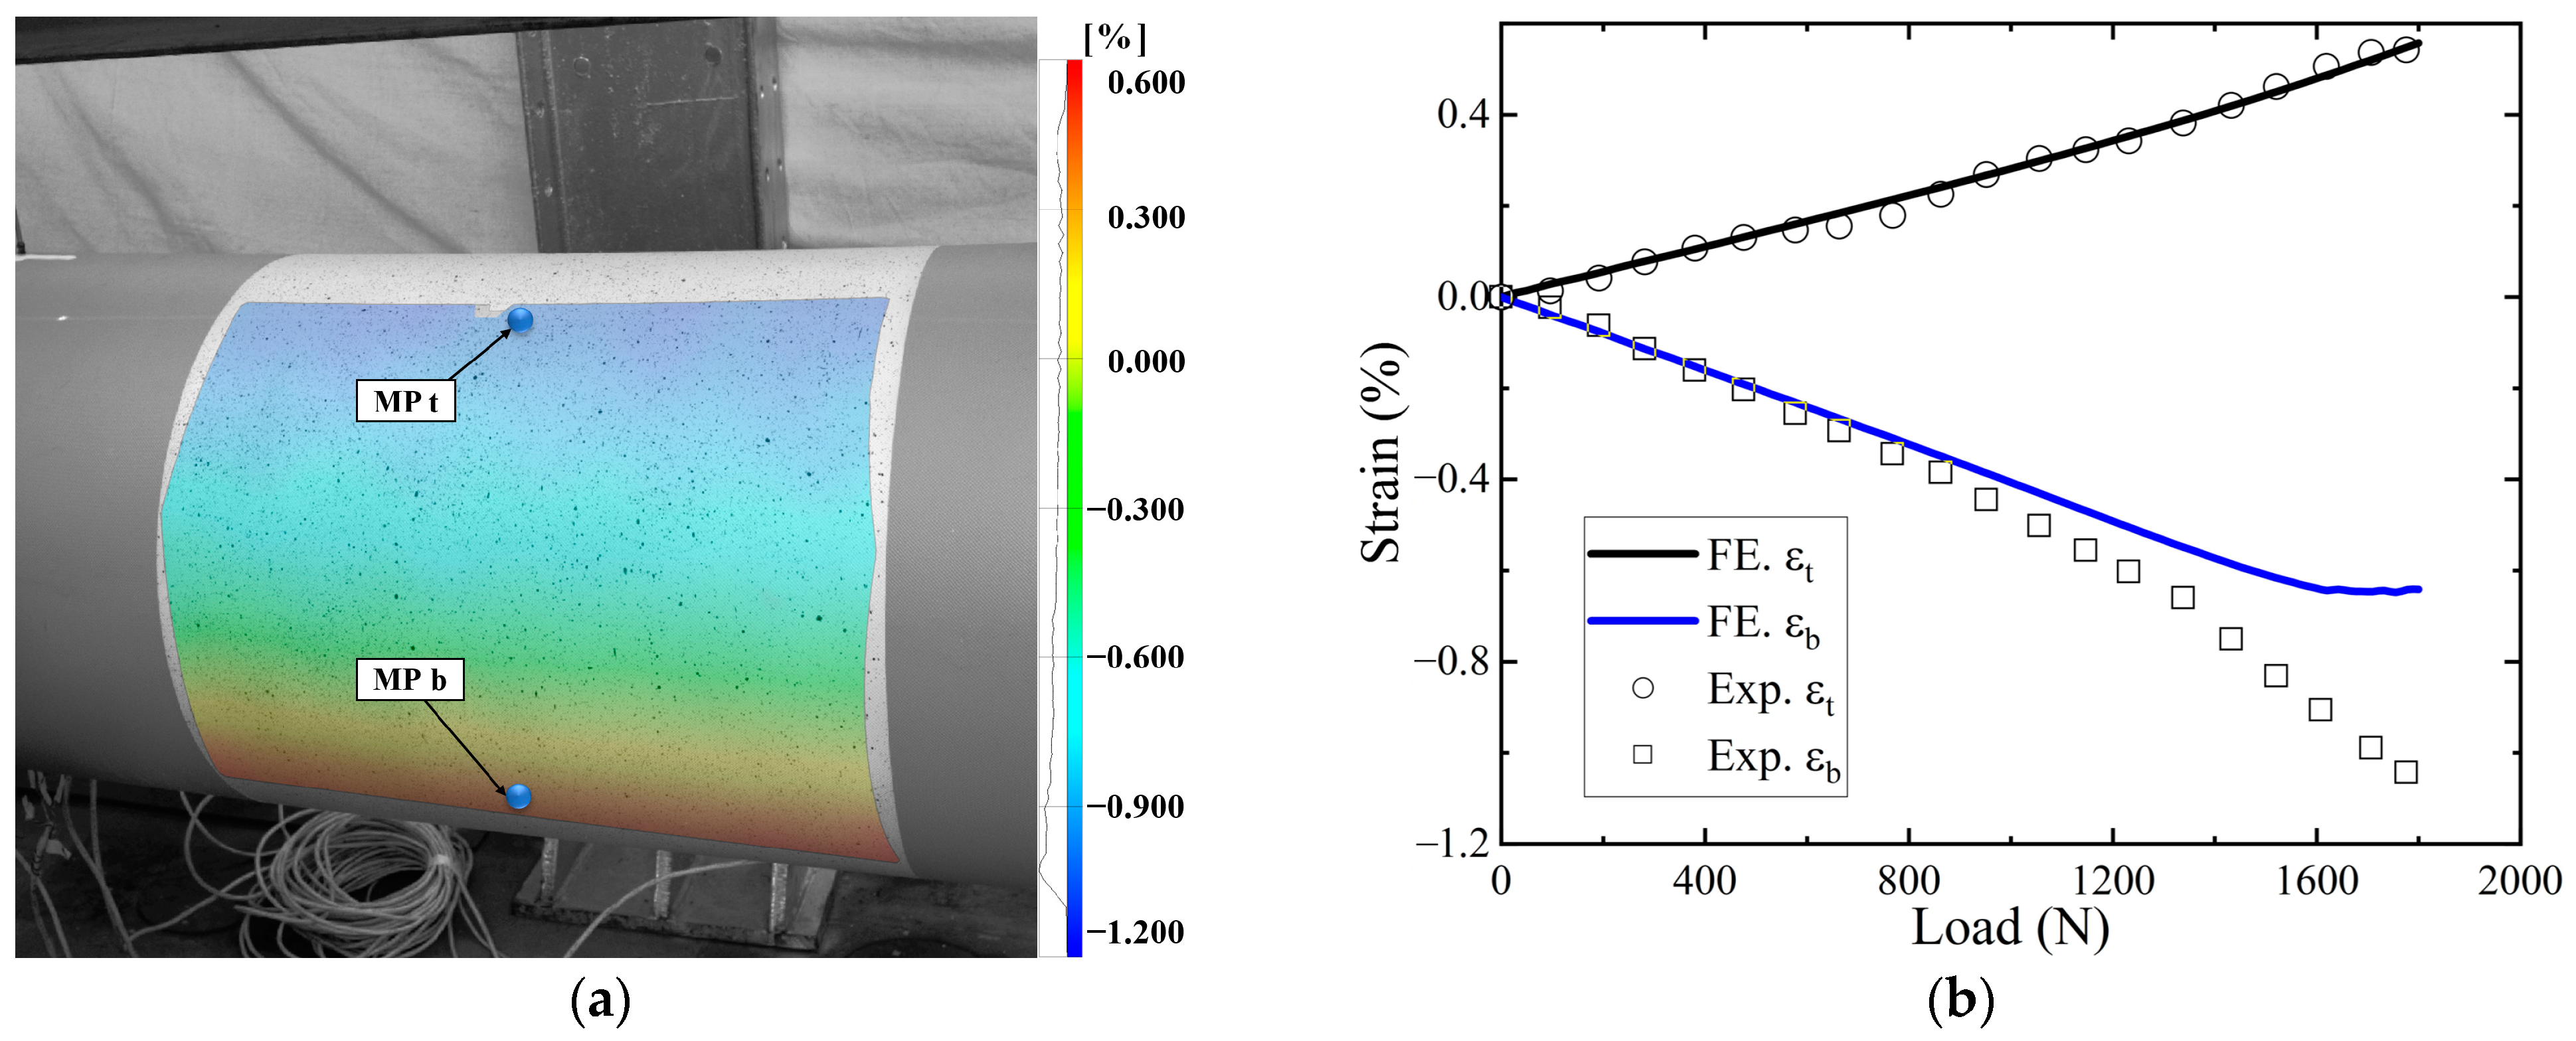
(1) Strong agreement was achieved between numerical results and experimental measurements for both global and local analyses. The FEM exhibited remarkable precision in characterizing the response of the inflated composite membrane structure under bending loads, with ultimate loads and equivalent structural stiffness of deviation ranging from 1.65% to 4.57% and 1.81% to 4.83%, respectively, relative to the experimental measurements.
(2) The bending mode was described from different stages observed during the loading process. Under the initial load, the deflected curve transited smoothly along the axis of the inflated sample, which shifted into the trilinear model with the load increasing to the wrinkling load. In parallel, the bearing capacity of inflated structures decreased significantly with the appearance of wrinkles, and the evolution of wrinkles would induce a special failure mode of inflated structures: that was, the instability of the structure caused by local buckling. This behaviour was also verified in the load–deflection curves which exhibited an initial linear response followed by softening behaviour.
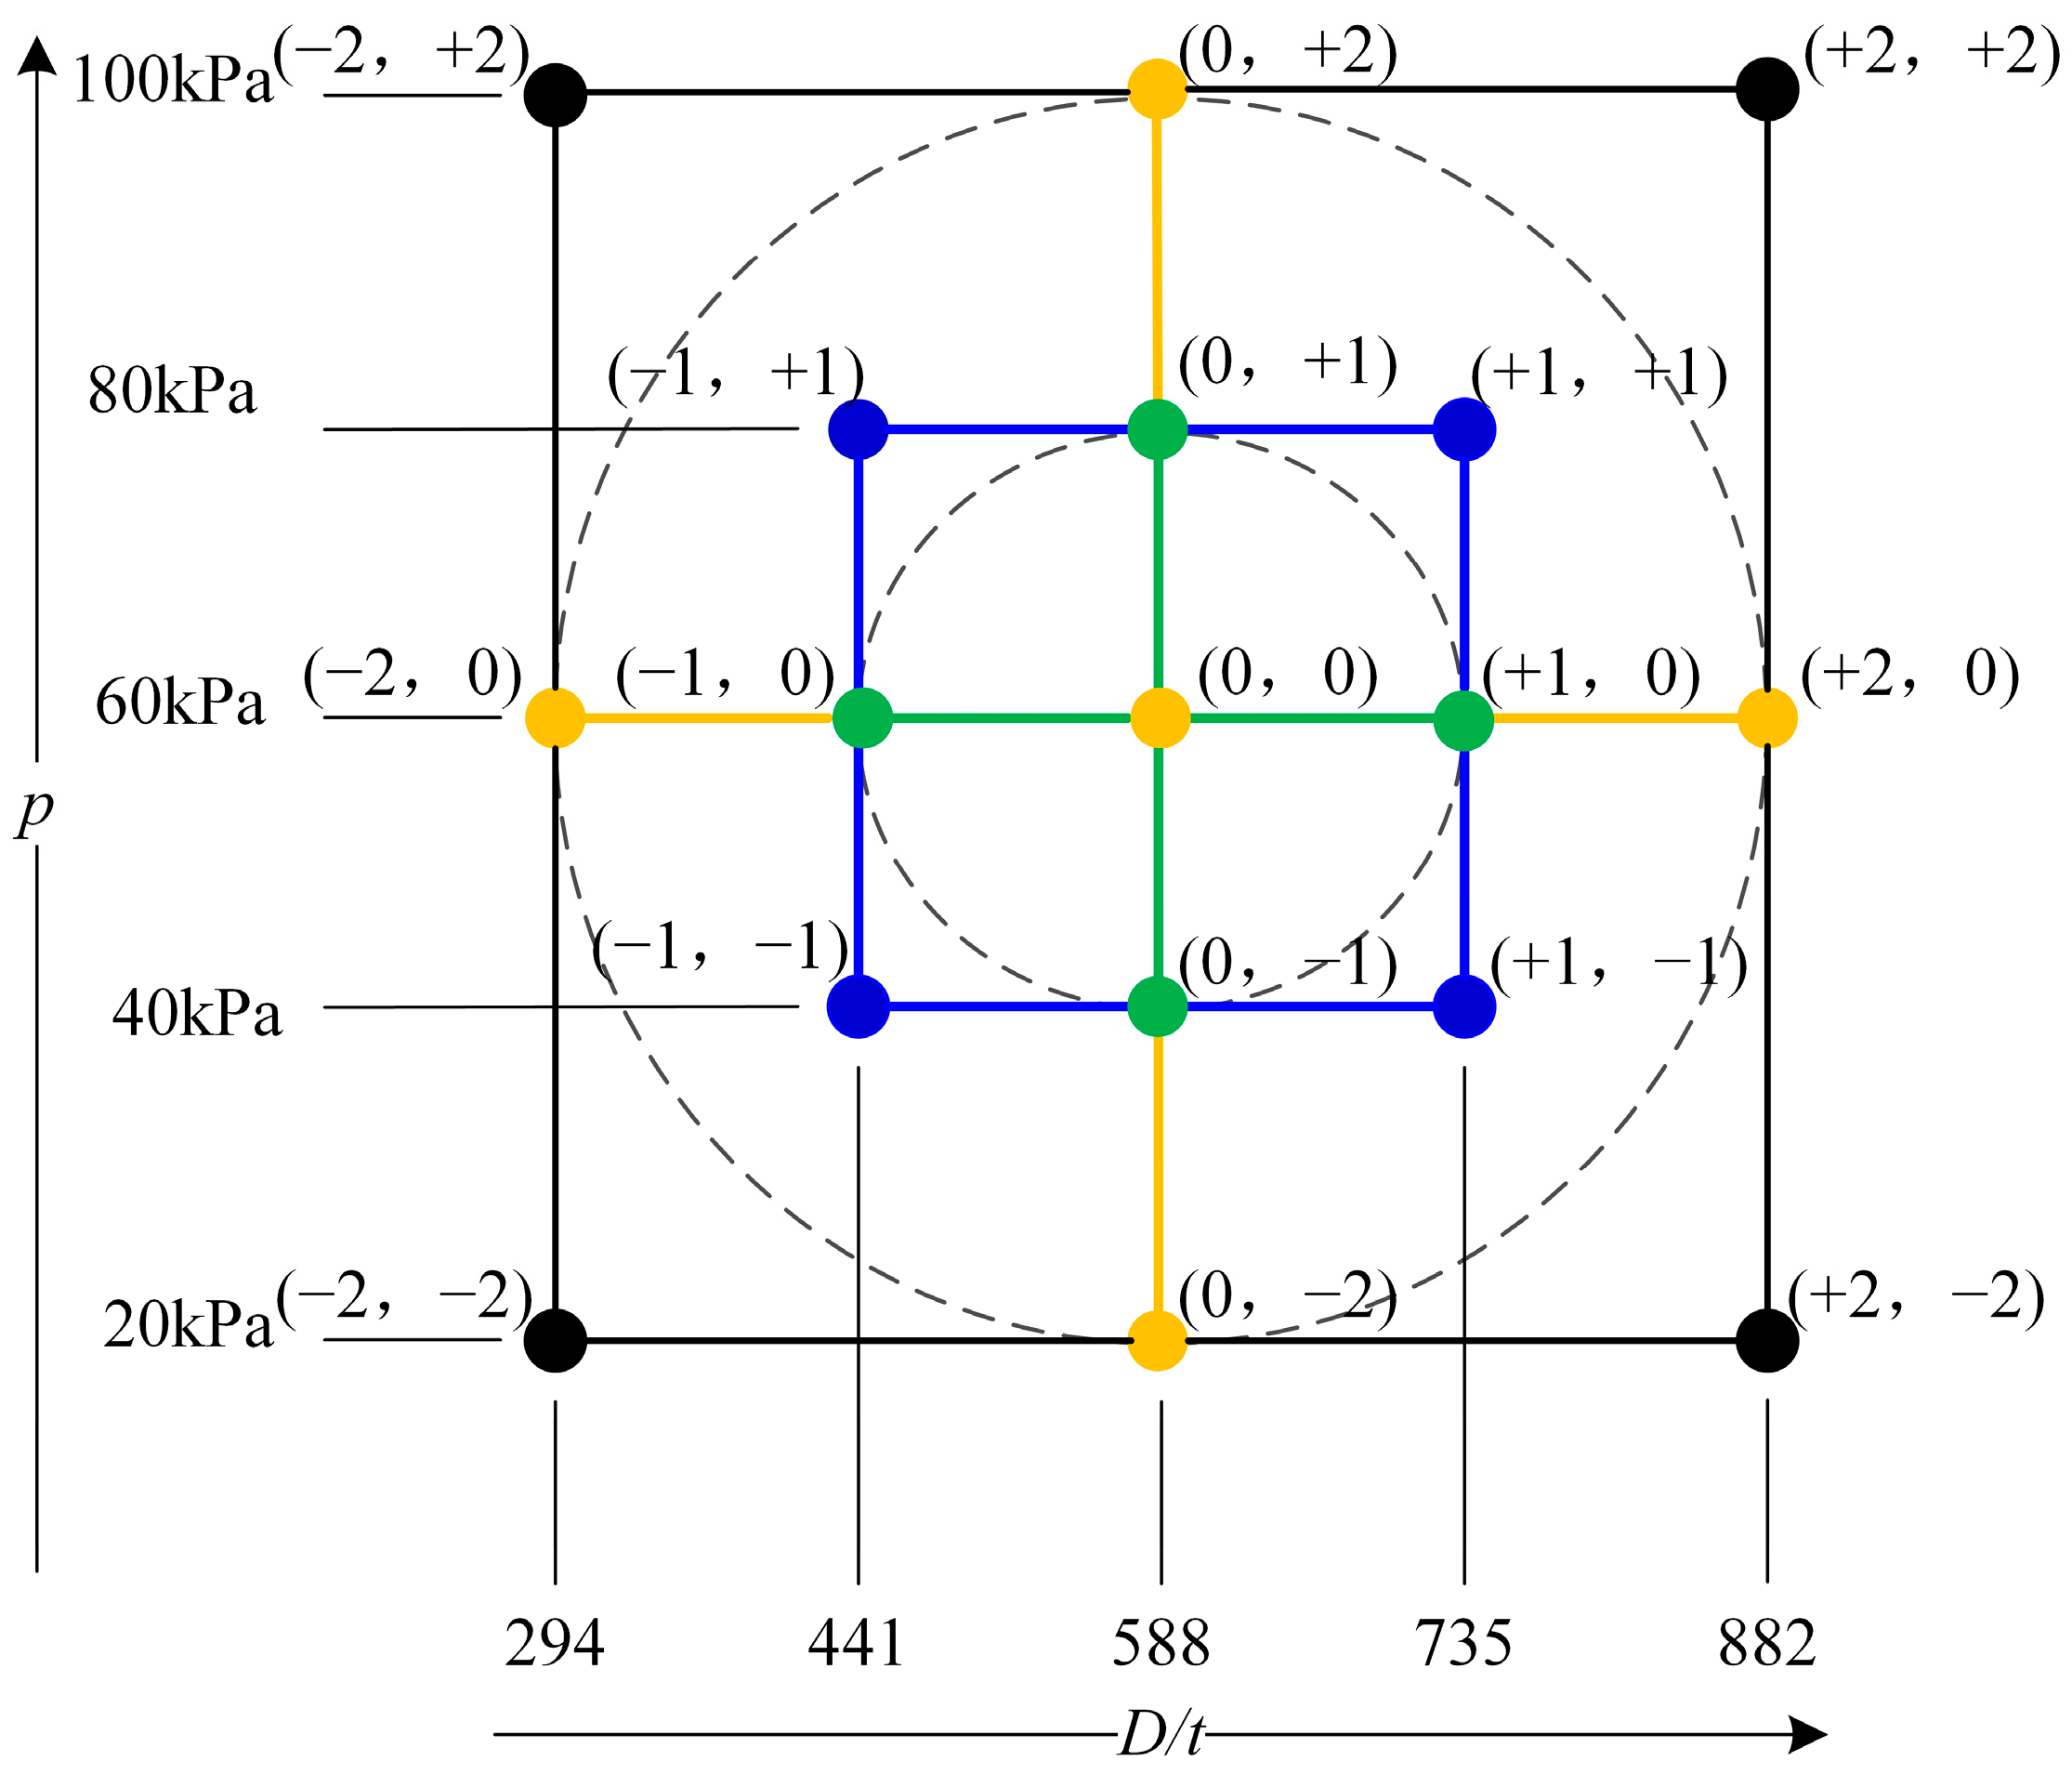
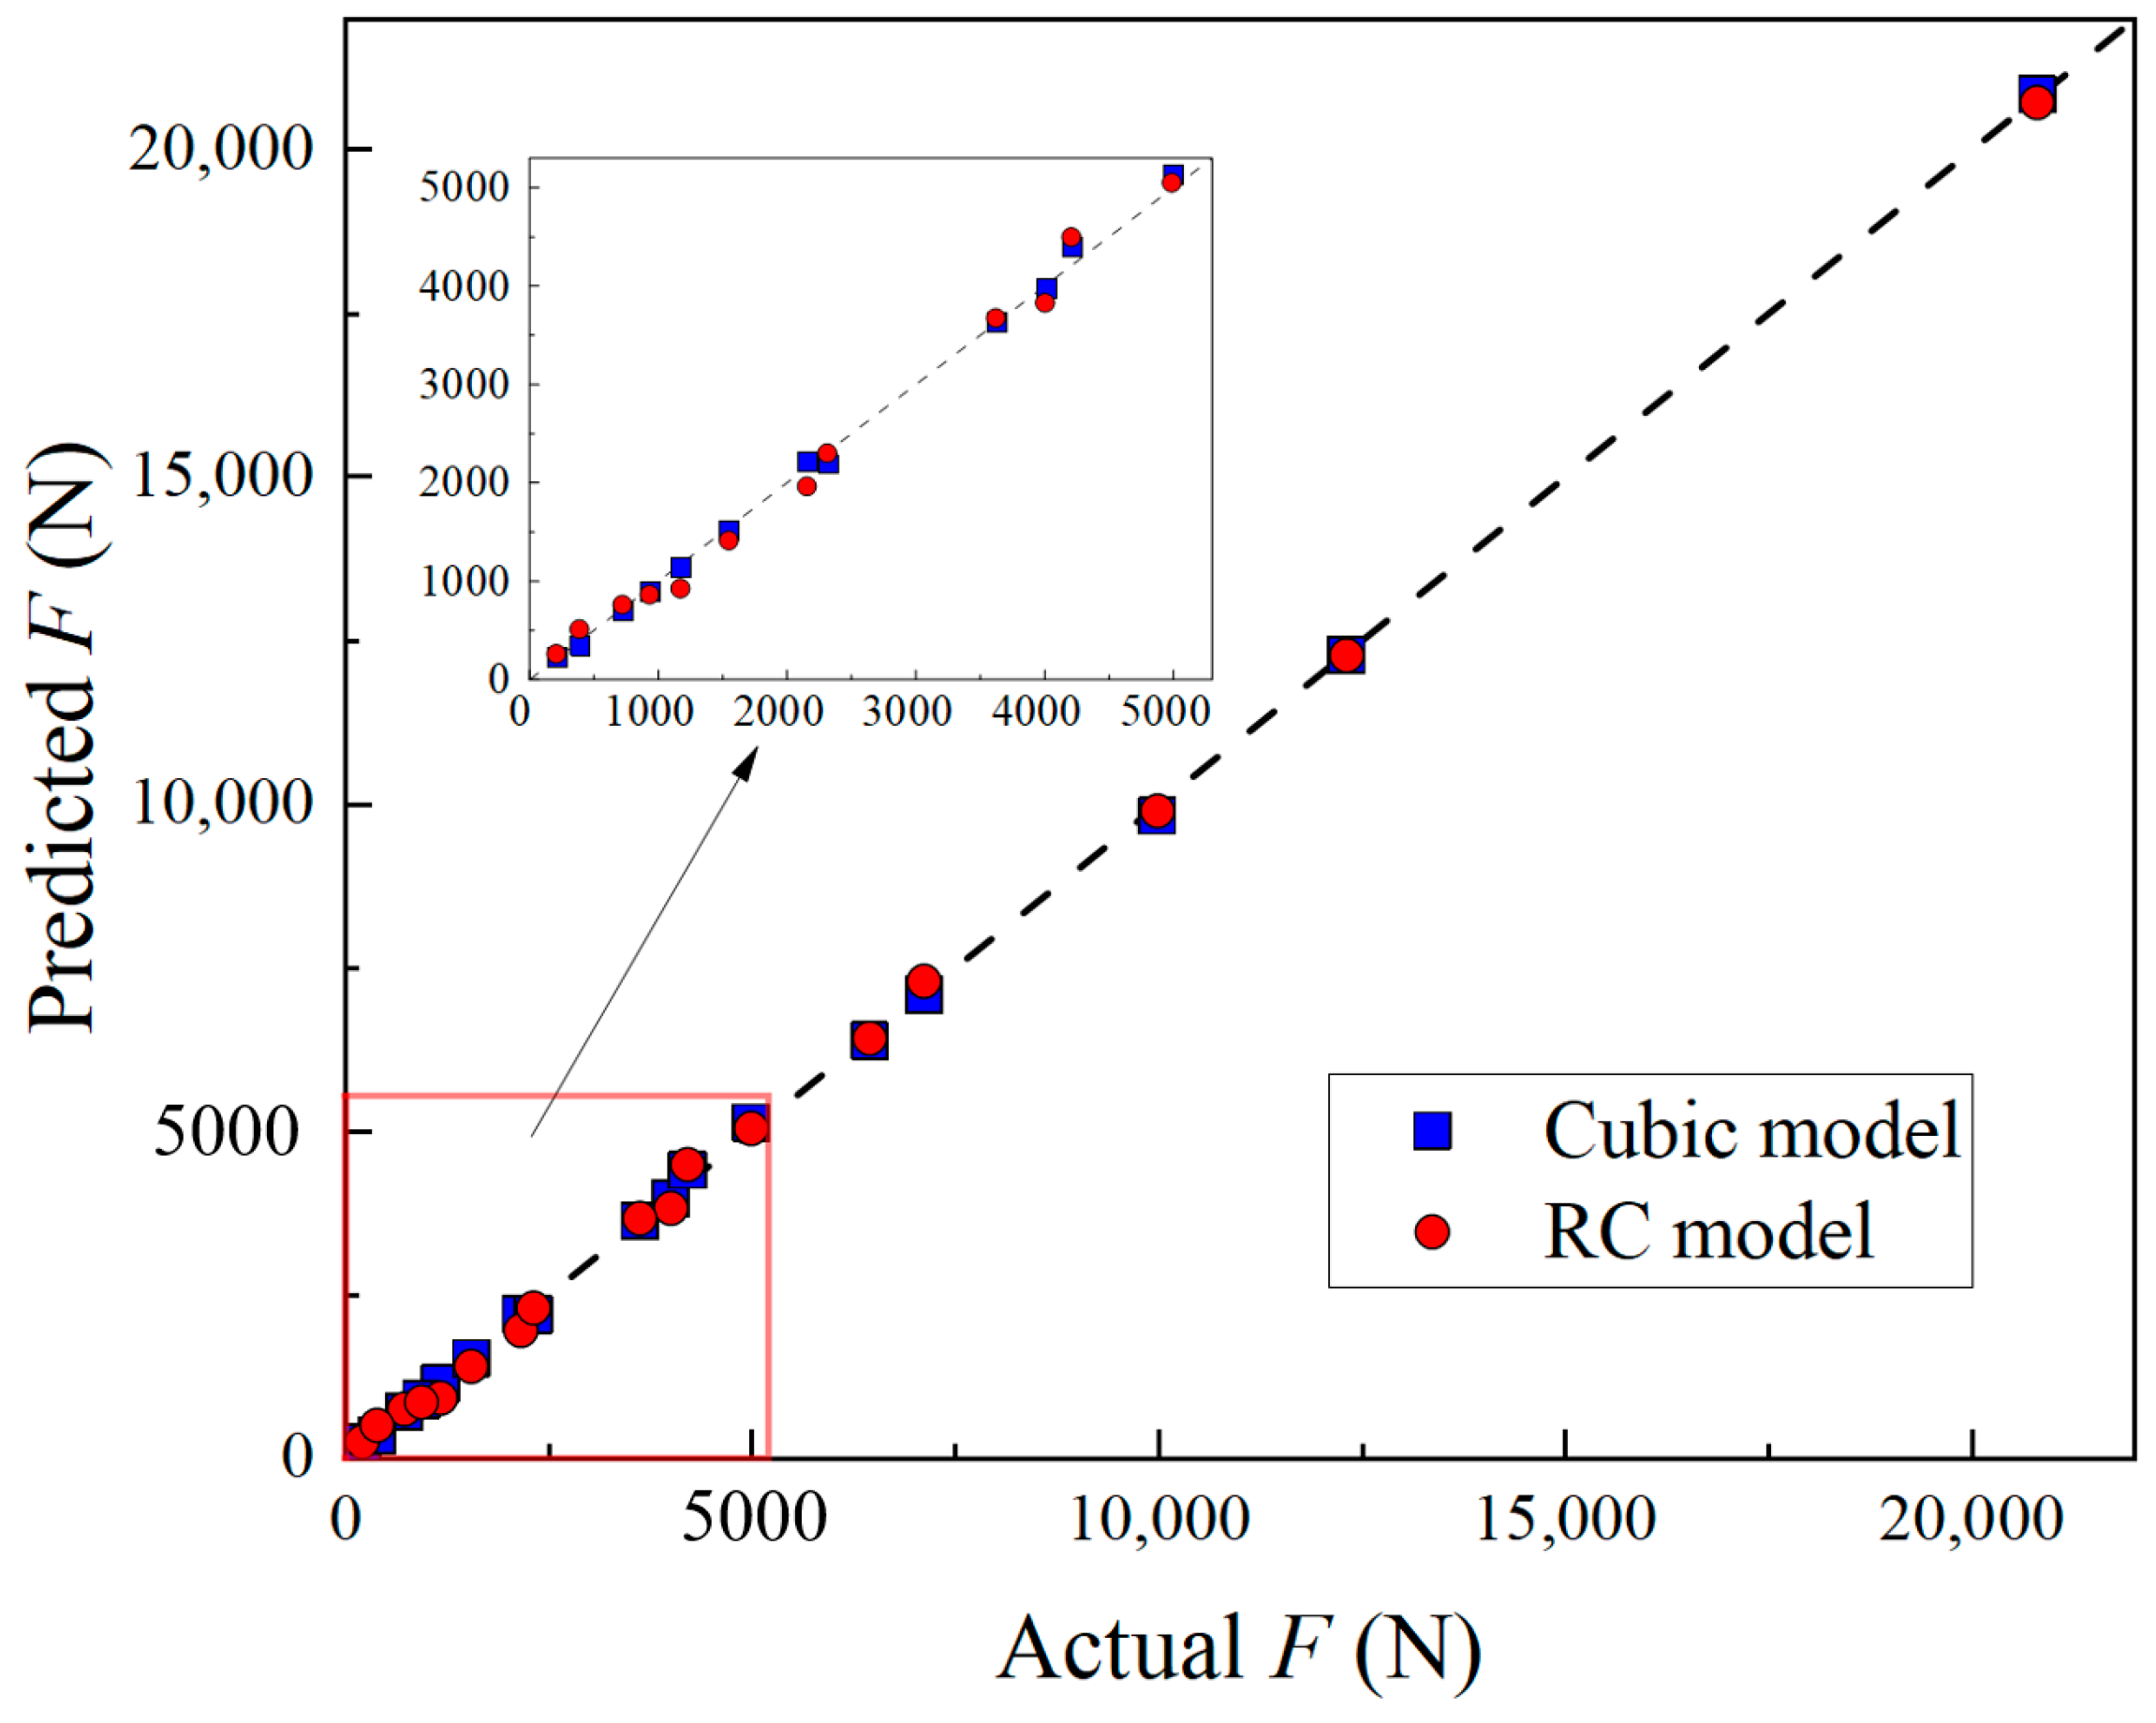
(3) The conducted parametric analysis was based on the ANOVA of responses recovered from a CCF-DoE plan of simulations for ultimate load, which adjusted the expected model to a reduction cubic model by eliminating part of insignificant interaction terms. The deviation values between ultimate loads in the RMSE and those obtained from FEM were less than 5%. Therefore, the proposed design expression presented a viable alternative to the FEM for evaluating the ultimate loading of the inflated composite membrane structure for the interesting range.
In this study, we have solely focused on the ideal four-points bending conditions. However, due to the application of inflated membrane structures in complex marine engineering environments, diverse boundary and loading conditions require further investigation. Therefore, it is important to conduct further research on this matter to address the challenges faced by these structures when subjected to real engineering conditions.

Author Contributions

Conceptualization, Y.Y. and J.G.; methodology, Y.Y.; software, Z.Z. and X.R.; validation, H.L. and Q.G.; formal analysis, H.L. and Z.G.; investigation, H.L. and Z.G.; resources, J.G. and H.L.; data curation, Q.G.; writing—original draft preparation, Y.Y.; writing—review and editing, H.L.; visualization, Y.Y. and Z.G.; supervision, H.L.; project administration, H.L.; funding acquisition, J.G. All authors have read and agreed to the published version of the manuscript.

Funding

This research was funded by the Fundamental Research Funds for the Central Universities (WUT: 2022CG005 and 223373003).

Institutional Review Board Statement

Not applicable.

Informed Consent Statement

Not applicable.

Data Availability Statement

Not applicable.

Acknowledgments

The authors would like to thank funding body for the grant.

Conflicts of Interest

The authors declare no conflict of interest.

Appendix A. ANOVA Results Tables for Regression Models

Table A1. ANOVA results of the cubic model.
SourceSum of SquaresdfMean SquareF-Valuep-Value
Regression4.58 × 10895.08 × 1074580.94<0.0001
X12.82 × 10712.82 × 1072539.59<0.0001
X25.64 × 10615.64 × 106507.79<0.0001
X1X27.23 × 10717.23 × 1076514.61<0.0001
X121.89 × 10711.89 × 1071701.57<0.0001
X228979.0218979.020.8090.3983
X12X24.18 × 10614.18 × 106376.48<0.0001
X1X22168.541168.540.01520.9054
X133540.2813540.280.3190.5899
X23170.541170.540.01540.9048
Residual77,690.91711,098.7
R-squared0.9998
FactorCoefficient EstimateStandard Error95% CI Low95% CI HighVIF
β0-Intercept3739.941.613641.523838.28
β1D/t5824.75115.585551.446098.069.03
β2p2604.58115.582331.262877.899.03
β3–(D/t)p4124.6451.14003.84245.481
β4–(D/t)22607.6663.222458.182757.141.1
β5p256.8663.22−92.62206.341.1
β6–(D/t)2p1756.690.531542.521970.673
β7–(D/t)p211.1690.53−202.92225.233
β8–(D/t)2380.04141.72−255.08415.1611.03
β9p317.57141.72−317.55352.6911.03
Table A2. ANOVA results of the reduction-cubic model.
SourceSum of SquaresdfMean SquareF-Valuep-Value
Regression4.58 × 10859.15 × 10710,921.12<0.0001
X12.61 × 10812.61 × 10831,146.93<0.0001
X22.09 × 10712.09 × 1072495.57<0.0001
X1X27.23 × 10717.23 × 1078628.63<0.0001
X122.11 × 10712.11 × 1072521.59<0.0001
X12X25.13 × 10615.13 × 106612.44<0.0001
Residual92,174.63118379.51
R-squared0.9998
FactorCoefficient EstimateStandard Error95% CI Low95% CI HighVIF
β0-Intercept3757.2832.013686.823827.74
β1D/t5899.1133.435825.545972.681
β2p2616.852.382501.512732.092.46
β3–(D/t)p4124.6444.44026.914222.371
β4–(D/t)22625.1152.282510.052740.171
β5–(D/t)2p1761.3771.171604.721918.032.46

References

  1. Davids, W.G.; Zhang, H. Beam finite element for nonlinear analysis of pressurized fabric beam–columns. Eng. Struct. 2008, 30, 1969–1980. [Google Scholar] [CrossRef]
  2. Turner, A.; Kabche, J.; Peterson, M.; Davids, W. Tension/torsion testing of inflatable fabric tubes. Exp. Tech. 2008, 32, 47–52. [Google Scholar] [CrossRef]
  3. Hulton, A.W.; Cavallaro, P.V.; Hart, C.J. Modal analysis and experimental testing of air-inflated drop-stitch fabric structures used in marine applications. In Proceedings of the ASME International Mechanical Engineering Congress and Exposition, Tampa, FL, USA, 3–9 November 2017; p. V009T012A030. [Google Scholar]
  4. Fowler, J.E.; Resio, D.T.; Pratt, J.N.; Boc, S.J.; Sargent, F.E. Innovations for Future Gap Crossing Operations; Engineer Research and Development Center Vicksburg: Vicksburg, MS, USA, 2006. [Google Scholar]
  5. Russell, B.R.; Thrall, A.P.; Padula, J.A.; Fowler, J.E. Reconceptualization and Optimization of a Rapidly Deployable Floating Causeway. J. Bridge Eng. 2014, 19, 04013013. [Google Scholar] [CrossRef]
  6. Fowler, J.; Pollock, C.; Resio, D.; Turk, G. Development of a rapidly installed breakwater (RIB) system. Oceanogr. Lit. Rev. 1998, 3, 580. [Google Scholar]
  7. Wielgosz, C.; Thomas, J.-C. Deflections of inflatable fabric panels at high pressure. Thin-Walled Struct. 2002, 40, 523–536. [Google Scholar] [CrossRef] [Green Version]
  8. Thomas, J.C.; Wielgosz, C. Deflections of highly inflated fabric tubes. Thin-Walled Struct. 2004, 42, 1049–1066. [Google Scholar] [CrossRef] [Green Version]
  9. Apedo, K.L.; Ronel, S.; Jacquelin, E.; Bennani, A.; Massenzio, M. Nonlinear finite element analysis of inflatable beams made from orthotropic woven fabric. Int. J. Solids Struct. 2010, 47, 2017–2033. [Google Scholar] [CrossRef]
  10. Nguyen, Q.-T.; Thomas, J.-C.; Le van, A. Inflation and bending of an orthotropic inflatable beam. Thin-Walled Struct. 2015, 88, 129–144. [Google Scholar] [CrossRef] [Green Version]
  11. Elsabbagh, A. Nonlinear finite element model for the analysis of axisymmetric inflatable beams. Thin-Walled Struct. 2015, 96, 307–313. [Google Scholar] [CrossRef]
  12. Zhang, L.; Dong, K.; Lu, M.; Zhang, H. A wrinkling model for pneumatic membranes and the complementarity computational framework. Comput. Mech. 2020, 65, 119–134. [Google Scholar] [CrossRef]
  13. Stein, M.; Hedgepeth, J.M. Analysis of Partly Wrinkled Membranes; National Aeronautics and Space Administration: Washington, DC, USA, 1961. [Google Scholar]
  14. Haughton, D.; McKay, B. Wrinkling of inflated elastic cylindrical membranes under flexure. Int. J. Eng. Sci. 1996, 34, 1531–1550. [Google Scholar] [CrossRef]
  15. Veldman, S. Wrinkling prediction of cylindrical and conical inflated cantilever beams under torsion and bending. Thin-Walled Struct. 2006, 44, 211–215. [Google Scholar] [CrossRef]
  16. Wang, C.; Du, Z.; Tan, H. Initial wrinkling and its evolution of membrane inflated cone in bending. Thin-Walled Struct. 2012, 59, 97–102. [Google Scholar] [CrossRef]
  17. Ji, Q.X.; Wang, C.G.; Tan, H.F. Multi-scale wrinkling analysis of the inflated beam under bending. Int. J. Mech. Sci. 2017, 126, 1–11. [Google Scholar] [CrossRef]
  18. Wang, X.; Fu, H.; Law, S.-s.; Yang, Q.; Yang, N. Experimental study on the interaction between inner air and enveloping membrane of inflated membrane tubes. Eng. Struct. 2020, 219, 110892. [Google Scholar] [CrossRef]
  19. Cavallaro, P.V.; Johnson, M.E.; Sadegh, A.M. Mechanics of plain-woven fabrics for inflated structures. Compos. Struct. 2003, 61, 375–393. [Google Scholar] [CrossRef]
  20. Liu, P.; Yue, M.; Feng, S.Z.; Ngamkhanong, C. Structural behaviour of air-inflated beams. Structures 2023, 47, 1613–1623. [Google Scholar] [CrossRef]
  21. Yingying, Z.; Junhao, X.; Qilin, Z. Advances in mechanical properties of coated fabrics in civil engineering. J. Ind. Text. 2016, 48, 255–271. [Google Scholar] [CrossRef] [Green Version]
  22. Jekel, C.F.; Venter, G.; Venter, M.P. Modeling PVC-coated polyester as a hypoelastic non-linear orthotropic material. Compos. Struct. 2017, 161, 51–64. [Google Scholar] [CrossRef]
  23. Kabche, J.P.; Peterson, M.L.; Davids, W.G. Effect of inflation pressure on the constitutive response of coated woven fabrics used in airbeams. Compos. Part B Eng. 2011, 42, 526–537. [Google Scholar] [CrossRef]
  24. Dassault Systèmes Simulia Corp. SIMULIA User Assistance 2020. 2019. Available online: https://www.3ds.com/support/documentation/users-guides/ (accessed on 28 March 2023).
  25. Sosa, E.M.; Wong, J.C.-S.; Adumitroaie, A.; Barbero, E.J.; Thompson, G.J. Finite element simulation of deployment of large-scale confined inflatable structures. Thin-Walled Struct. 2016, 104, 152–167. [Google Scholar] [CrossRef]
  26. Cao, Z.; Wan, Z.; Yan, J.; Fan, F. Static behaviour and simplified design method of a Tensairity truss with a spindle-shaped airbeam. J. Constr. Steel Res. 2018, 145, 244–253. [Google Scholar] [CrossRef]
  27. ASTM D4851-07(2019)e1; Standard Test Methods for Coated and Laminated Fabrics for Architectural Use. ASTM International: West Conshohocken, PA, USA, 2019. [CrossRef]
  28. Myers, R.H.; Montgomery, D.C.; Anderson-Cook, C.M. Response Surface Methodology: Process and Product Optimization Using Designed Experiments; John Wiley & Sons: Hoboken, NJ, USA, 2016. [Google Scholar]
  29. Jalani, M.A.; Saad, M.R.; Abdullah, M.F.; Md Naiem, M.A.; Razali, M.N.; Zainal Abidin, N.; Abdul Rahman, M.R. A Statistical Analysis for Optimisation of a Hybrid BBDB-PA in Mantanani Island, Sabah. J. Mar. Sci. Eng. 2023, 11, 386. [Google Scholar] [CrossRef]
  30. Yin, P.; Wang, K.; Chen, L.; Zhang, Y.; Yang, K.; Wang, J. Horizontal Bearing Capacity and Reliability of Piles in Coastal Soft Soil Considering the Time-Varying Characteristics. J. Mar. Sci. Eng. 2023, 11, 247. [Google Scholar] [CrossRef]
  31. Chen, J.; Chen, W.; Wang, M.; Ding, Y.; Zhou, H.; Zhao, B.; Fan, J. Mechanical behaviors and elastic parameters of laminated fabric URETEK3216LV subjected to uniaxial and biaxial loading. Appl. Compos. Mater. 2017, 24, 1107–1136. [Google Scholar] [CrossRef]
  32. Wood, J.D. The flexure of a uniformly pressurized, circular, cylindrical shell. J. Appl. Mech. 1958, 25, 453–458. [Google Scholar] [CrossRef]
  33. Malm, C.G.; Davids, W.G.; Peterson, M.L.; Turner, A.W. Experimental characterization and finite element analysis of inflated fabric beams. Constr. Build. Mater. 2009, 23, 2027–2034. [Google Scholar] [CrossRef]
  34. Xu, J.; Zhang, Y.; Wu, M.; Zhao, Y. Experimental analysis of off-axis mechanical behaviors of PVC coated fabrics subjected to cyclic loading. Polym. Test. 2019, 80, 106090. [Google Scholar] [CrossRef]
  35. Chen, S.; Ding, X.; Yi, H. On the anisotropic tensile behaviors of flexible polyvinyl chloride-coated fabrics. Text. Res. J. 2007, 77, 369–374. [Google Scholar] [CrossRef]
  36. Wang, C.G.; Liu, M.X.; Kang, J.T.; Xue, Z.M.; Tan, H.F. Bending wrinkling and kink behaviors of inflated beam under local uniform loadings. Int. J. Mech. Sci. 2017, 120, 136–148. [Google Scholar] [CrossRef]
  37. Clapp, J.D.; Young, A.C.; Davids, W.G.; Goupee, A.J. Bending response of reinforced, inflated, tubular braided fabric structural members. Thin-Walled Struct. 2016, 107, 415–426. [Google Scholar] [CrossRef]
Figure 1. New-type floating inflated structures: (a) LMCS prototype; (b) RIB.
Jmse 11 00800 g001
Figure 2. (a) Typical configuration of the fabric membrane; (b) Photo of the inflated sample.
Jmse 11 00800 g002
Figure 3. Four-points bend test setup diagram.
Jmse 11 00800 g003
Figure 4. Four-points bend test setup configuration: (a) loading frame; (b) roller support; (c) Digital Image Correlation measure system; (d) air pressure gauge; (e) s-type load cell; (f) LVDT.
Jmse 11 00800 g004aJmse 11 00800 g004b
Figure 5. F3D4 element.
Jmse 11 00800 g005
Figure 6. Numerical modeling.
Jmse 11 00800 g006
Figure 7. Uniaxial tensile test of the fabric membrane: (a) schematic diagram of samples (b) longitudinal strain contours of the samples.
Jmse 11 00800 g007
Figure 8. Coded scheme of the design of the experiment for the plan of simulations.
Jmse 11 00800 g008
Figure 9. Load–deflection curves for the inflated sample with 30 kPa internal pressure.
Jmse 11 00800 g009
Figure 10. Deflected process of the inflated sample: (a) initial loading; (b) close to ultimate load.
Jmse 11 00800 g010
Figure 11. The local deformed pattern of the inflated sample close to ultimate load: (a) bending region; (b) loading point.
Jmse 11 00800 g011
Figure 12. Stress–strain curves for fabric membrane strap.
Jmse 11 00800 g012
Figure 13. The effect of mesh size on the accuracy and efficiency: (a) Load–deflection curves with different mesh sizes (b) Calculation vs mesh size.
Jmse 11 00800 g013
Figure 14. The deformed patterns of the FE model: (a) initial loading; (b) close to ultimate load.
Jmse 11 00800 g014
Figure 15. The local wrinkle under ultimate loading.
Jmse 11 00800 g015
Figure 16. Numerical and experimental comparison for the load–deflection response of midspan of inflated structures.
Jmse 11 00800 g016
Figure 17. The axial strain–loading response of the midspan region: (a) the strain nephogram from the DIC; (b) the loading–strain curves.
Jmse 11 00800 g017
Figure 18. Cubic and RC models predictions for the F values.
Jmse 11 00800 g018
Figure 19. Response surface of the ultimate load for RC model: (a) contour plot related to the CCF-DoE design points; (b) 3D hyperplane of F about the design points within regressor variables space domain.
Jmse 11 00800 g019
Table 1. Design of experiments for the parametric analysis plan of simulations.
BlockTypeX1X2 (kPa)D/tp (kPa)
12k−2−229420
12k+2+2882100
12k−2+2294100
12k+2−288220
2(*)−2029460
2(*)0−258820
2(*)+2088260
2(*)0+2588100
2(*)0058860
32k−1−144140
32k+1+173580
32k−1+144180
32k+1−173540
4(*)−1044160
4(*)0−158840
4(*)+1073560
4(*)0+158880
Nomenclature type: 2k—Corner point; (*)—Star point.
Table 2. Main material parameters of fabric membranes.
PropertiesValues
Base fabric materialPolyester
Type of coatingPVC
Thickness (mm)0.68
Density (kg/m3)1650
Tensile strength (warp/weft/45°) (N/50 mm)4116/3453/3126
Breaking elongation (warp/weft/45°) (%)22.27/35.80/70.11
Elastic modulus (warp E12/ weft E21) (MPa)1019/232
Shear modulus G12 (MPa)19.29
Poisson’s ratio υ120.81
Table 3. Values and deviations for numerical and experimental results of the ultimate load and the equivalent structural stiffness.
Internal Pressure (kPa)Ultimate Load (N)Equivalent Structural Stiffness (N/mm)
Exp.FEMDeviationExp.FEMDeviation
10651.99622.224.57%12.0012.584.83%
201201.731184.441.44%14.5315.274.75%
301803.551748.003.08%16.2116.562.16%
402320.452282.221.65%17.3217.953.64%
502887.522808.892.72%18.1918.521.81%
Table 4. Results of the ultimate load from RSM and FEM.
OrderX1X2 (kPa)D/tp (kPa)FFEM (N)FRSM (N/m)Error (%)
1−2−229420230.22229.75−0.20
2+2+288210020,800.0020,784.32−0.08
3−2+2294100730.40736.820.88
4+2−2882203802.003778.69−0.61
14−10441601445.671464.011.27
150−1588402512.222448.88−2.52
16+10735607111.117363.113.54
170+1588804987.005065.681.58
Disclaimer/Publisher’s Note: The statements, opinions and data contained in all publications are solely those of the individual author(s) and contributor(s) and not of MDPI and/or the editor(s). MDPI and/or the editor(s) disclaim responsibility for any injury to people or property resulting from any ideas, methods, instructions or products referred to in the content.

