Article

Experimental Study on the Bonding Performance of HIRA-Type Material Anchor Solids Considering Time Variation

1
Shandong Provincial Key Laboratory of Marine Environment and Geological Engineering, Ocean University of China, Qingdao 266100, China
2
College of Civil Engineering, Anhui Jianzhu University, Hefei 230009, China
3
Shanghai Survey, Design and Research Institute (Group) Co., Ltd., Qingdao 266100, China
4
Qingdao National Laboratory of Marine Science and Technology, Qingdao 266100, China
*
Authors to whom correspondence should be addressed.
J. Mar. Sci. Eng. 2023, 11(4), 798; https://doi.org/10.3390/jmse11040798
Submission received: 10 March 2023 / Revised: 27 March 2023 / Accepted: 3 April 2023 / Published: 7 April 2023
(This article belongs to the Special Issue Advances in Marine Engineering: Geological Environment and Hazards II)

Abstract

:
In order to reveal the evolution of bonding performance of HIRA (High Intensity and Rapid Agent) anchor solids with maintenance time, the evolution characteristics of bond strength and stress distribution at the interface between HIRA-based anchor solids and a geotechnical body under different maintenance times and the fine damage pattern of anchor solids were studied by an indoor pull-out test of anchor solids. The comparative analysis was performed with 42.5 grade ordinary Portland cement (hereinafter referred to as P.O 42.5). The results show that the early strength and rapid setting characteristics of HIRA type material are obvious, and the difference between its average peak bond strength and that of cement is 10.45 times. The shear stress distribution has obvious stress concentration characteristics, and the peak value will appear and shift with the increase in load, and the peak shift of the HIRA anchor solid occurs earlier than that of cement. Due to different stress levels, the damage of the HIRA anchor solid after being pulled out increases with the increase in maintenance time, while that of cement gradually becomes more severe. The overall damage of the HIRA material is generally lower than that of cement in the same period.

1. Introduction

With the implementation of China’s strategy of strengthening transportation, more and more cities have accelerated the construction of rail transit [1], and the submarine tunnel has become one of the solutions to the subway planning problems in coastal cities along the river. Among the tunnel support methods, anchorage support makes up a high proportion, and anchor solids play a major role in the whole anchorage support system [2,3]. The material properties of anchor solids directly affect their mechanical properties [4,5,6], which, in turn, are related to the safe and efficient construction of marine projects [7]. The grouting material commonly used in the current anchorage support method of submarine tunnels is cement mortar, and there is less application and research on new, fast-setting, high-strength grouting materials [8,9].
Anchor cables are widely used in pit engineering and tunneling [10], and are divided into two main categories according to force characteristics: tension anchor cables and pressure anchor cables, both of which have different anchoring mechanisms, resulting in different force characteristics of anchor solids [11]. Pressure anchor cables have many advantages over the traditional tension anchor cables [12]. The theoretical analysis of the force in the anchorage section of pressure-type anchor cables is based on nonlinear slip relations [13,14,15], which can derive the theoretical solutions for the distribution of shear stress and axial force in the anchorage section. For the experimental studies, there are mainly scaled-down model tests and full-scale field tests [16,17,18]. The pressure-type anchor has good displacement ductility, and the shear stress increases with the increase in the load at locations farther away from the bearing plate. The compressive strength of the anchor solid increases significantly under the joint action of lateral pressure and surface shear stress [19]. A summary of typical previous studies is presented in Table 1. The anchor solid material in existing experimental studies is commonly cement mortar with a fixed maintenance time, but, for the construction of submarine tunnels, the special stratigraphic conditions [20,21] and complex physical and chemical fields [22,23] are a great challenge for conventional grouting materials.
Currently, the existing research on pressure type anchor solids tends to be theoretical analysis, and the existing experimental research focuses more on the macroscopic failure mechanism during the tensioning process of the anchor system. The mesoscopic failure mode of the anchor solids needs to be further studied. In this study, for a new type of HIRA material, the influence law of different maintenance times on the evolution of tension load, bond strength, and stress distribution of anchor solids was studied by anchor solid pull-out tests, under the premise of comparative analysis, using P.O 42.5 material. The fine-scale damage mode of anchor solids was analyzed, aiming to provide a reference for anchorage engineering in sub-sea tunnels.

2. Materials and Methods

2.1. Test Materials

The test substrate is granite, and the basic physical property index is shown in Table 2. The specimen size is 150 mm × 150 mm × 180 mm with drilling in the center of the upper surface. The drilling diameter is 30 mm and the depth is 130 mm. The test tendon body, with the upper and lower extrusion sets of steel strand structure, is similar to the pressure anchor cable. The strand specifications for 7 × ⌀5 mm are: nominal tensile strength of 1860 MPa, and the maximum force of the whole strand is greater than or equal to 260 kN.
The grouting material used is HIRA-type material, and P.O 42.5 material is used as a comparison. HIRA material is a new type of fast-setting, early-strength, mineral-based grouting material, which is a light grayish-yellow powder at room temperature. The particle size distribution curves of both are shown in Figure 1, from which it can be seen that the average particle size of HIRA is about three times that of P.O 42.5.
The relevant performance indicators of HIRA-type materials and P.O 42.5-type materials are shown in Table 3. HIRA-type material proportioning mainly includes main materials and auxiliary materials, where the main materials are sulfur aluminate cement, early strength silicate cement, fine sand, calcium sulfate, calcium carbonate, etc., and auxiliary materials are magnesium oxide, silica micronized powder, Cai system water reducing agent, boric acid, etc. P.O 42.5-type material is mainly composed of tricalcium silicate, dicalcium silicate, tricalcium aluminate, gypsum, etc.

2.2. Testing Instruments

The test loading device is a WAW-1000B microcomputer-controlled electro-hydraulic servo universal testing machine with a maximum range of 1000 kN. The test loading method is set to the displacement control with a control value of 5 mm/min, and the broken type judgment is set to be invalid so that the testing machine can continue tensioning after the anchor solid slips and breaks. The strain gauges were made of foil-type non-welded strain gauges with a nominal resistance of 120 Ω, a sensitive grid length of 3 mm, and a sensitive grid structure of AA. The XL2118B static strain gauges were used for data acquisition, and the wiring method was 1/4 bridge. The test machine loading and strain gauge data recording were carried out simultaneously.

2.3. Test Method and Procedure

The test set a total of two variables of maintenance time and material. The water-cement ratio was 0.5, and the specific parameters of the specimens are shown in Table 4. As the water-cement ratio of P.O 42.5 material was 0.5 in previous studies and actual projects, the water-cement ratio of HIRA-type material was finally determined to be 0.5 in order to compare better with P.O 42.5 material and to integrate the results of pre-experiments. The average peak bond strength was calculated by the peak load of the testing machine in the tensioning process, as in Equation (1).
τ mA = F m π d l
where τmA denotes the average peak bond strength; Fm denotes the ultimate load; d denotes anchor solid diameter; and l denotes the anchor solid length.
Synthesizing previous studies, it is assumed that the stress–strain relationship in the test is linear elastic, and the axial stress σi at each measurement point of the anchor solid under different test loads can be calculated according to Equation (2). The shear stress τi is calculated from the equilibrium equation of the two adjacent measurement points of the anchor solid, which is shown in Equation (3).
σ i = ε i · E
τ i = F i F i + 1 π d L = ( σ i σ i + 1 ) π d 2 4 π d L = ( σ i σ i + 1 ) d 4 L
where σi denotes the axial stress at the measurement point i; εi denotes the microstrain at the measurement point i; E denotes the modulus of elasticity of the material; the HIRA material is taken as 28 GPa, and the P.O 42.5 material is taken as 33 GPa; τi denotes the average shear stress between the measurement point i and the measurement point i + 1; Fi denotes the axial force at the measurement point i; d denotes the diameter of the anchor solid; L denotes the distance between two measurement points.
The correspondences between each measurement point and the axial stress and shear stress are shown in Figure 2. There are 5 measurement points, and each measurement point is spaced 25 mm apart. To avoid damage to the strain gauges by boundary effects, measurement point 1 is located about 5 mm to the right of point 0, and measurement point 5 is located about 95 mm to the left of 100 mm. The axial stress location corresponds to the location of the measurement points, and the shear stress symbol is located at the center of the two adjacent measurement points.

3. Results

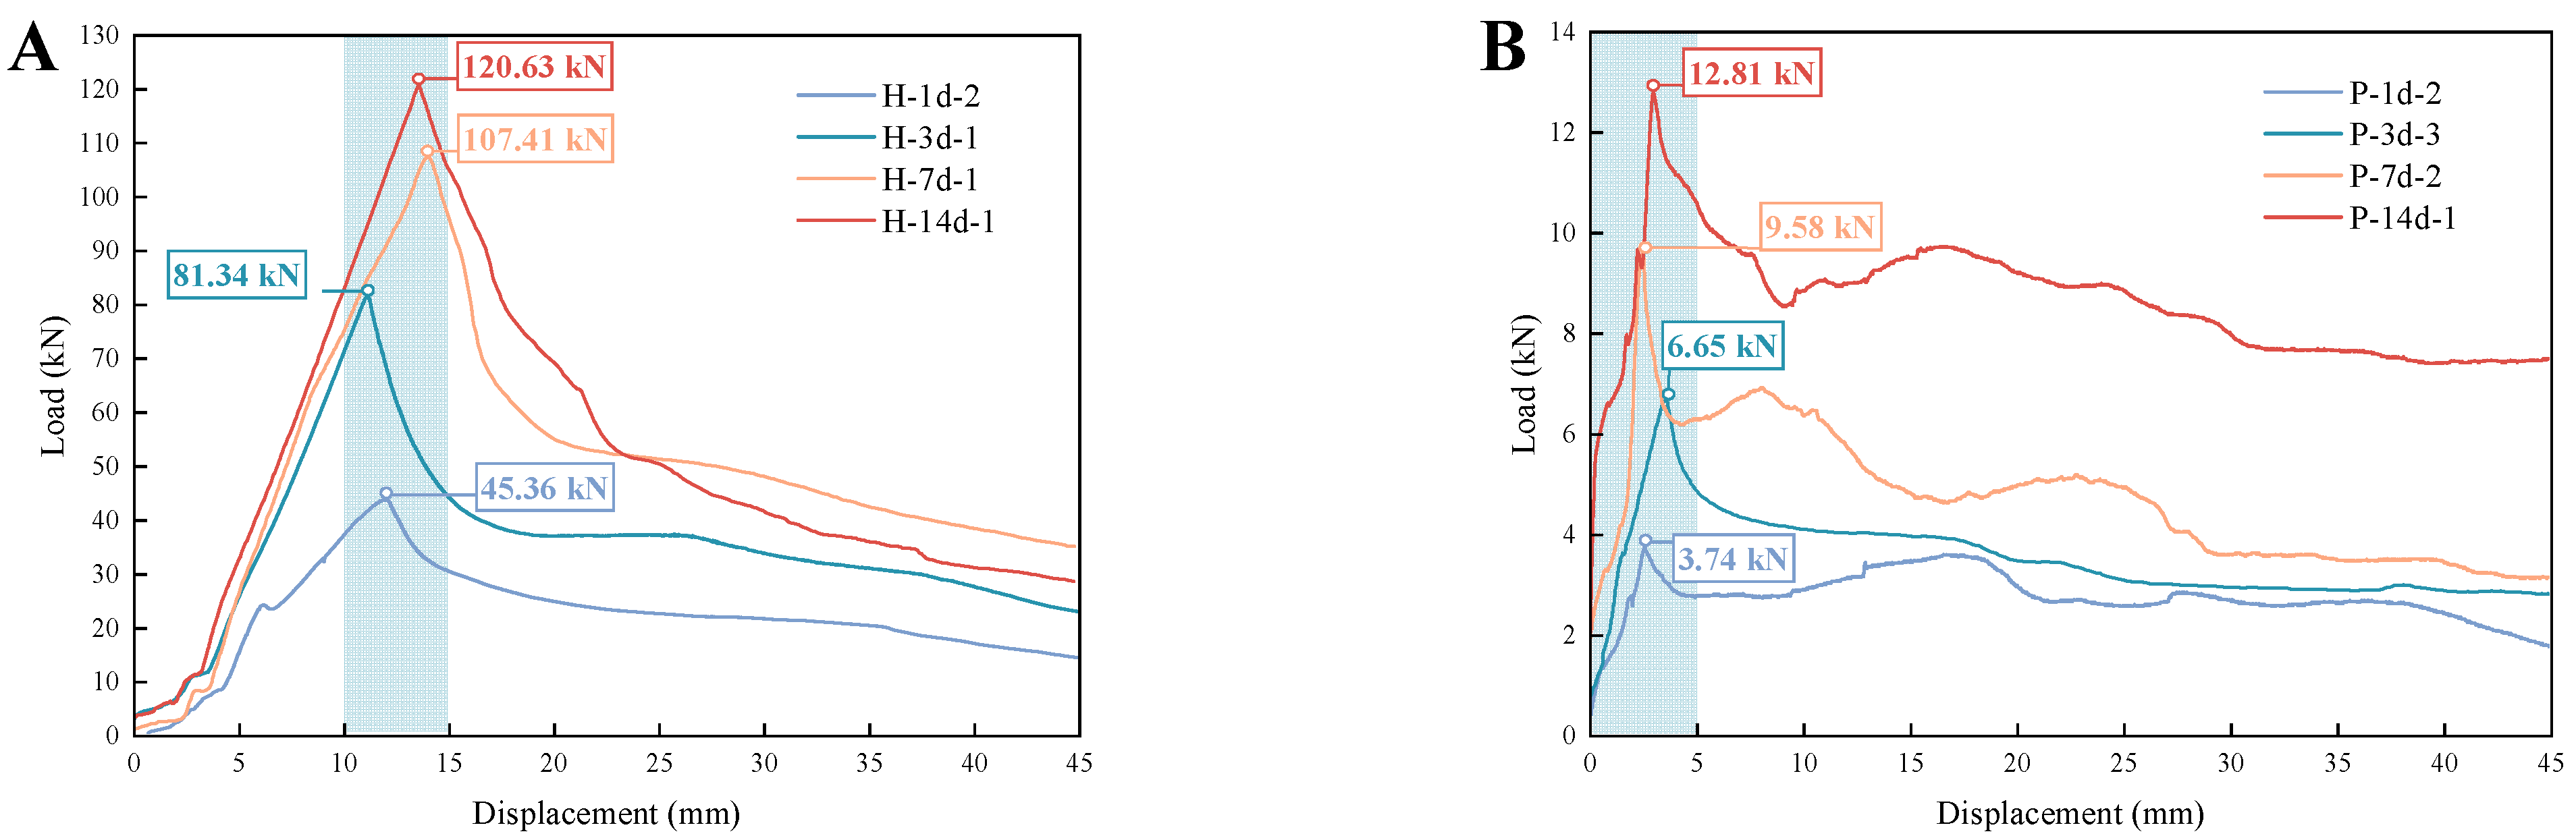
3.1. Load Displacement Relationship

In order to better describe the changing trend between variables, only typical specimens in the same group are selected in this paper to describe the load–displacement relationship. the load–displacement relationship of HIRA-type anchor solids under different maintenance times is shown in Figure 3A, where load is the value of loading force of the testing machine, and displacement is the displacement of the testing machine collet. From the figure, it can be seen that all the four sets of curves are slowly rising at first, then, with the increase in displacement, the load value rises sharply, reaches the peak, and then falls back to the non-linear change law. The displacement of the 4 sets of curves corresponding to the peak load is 10–15 mm. With the increase in the number of maintenance days, the peak load also increases. The curves grew slowly before reaching the peak load at 1 day of maintenance, and grew rapidly at 3 days and later. The reason for this trend was that the anchor solid strength was not fully formed at 1 day, and the bond between the anchor solid and the rock was not yet complete.
Figure 3B shows the load displacement curves of P.O 42.5 anchor solids under different maintenance times. From the figure, it can be seen that the four sets of curves all show a non-linear change pattern of rapid rise first, followed by a slow fall after reaching the peak, and the displacement of the four sets of curves corresponding to the peak load is within 5 mm and increases with the increase in maintenance days. The curves were similar in form at 1 and 3 days of maintenance, and more similar at 7 and 14 days. It can be seen that, in the anchor solid formed by cement slurry, the cumulative stage of bond strength development is located before 7 days, and the strength is basically formed after 7 days [2]. At the same time, after reaching the peak load damage, the residual strength of the 7-day and 14-day specimens decreased more slowly with the increase in the displacement of the testing machine, and the strength rebounded. The reason for this phenomenon is that when the bond slip of the anchor solid started to occur, the upper end anchor solid cracked, which directly caused the rapid decrease in bond strength. At this time, the testing machine continued to tension, and, after the cracked part of the anchor solid was slowly pulled out, the uncracked part of the anchor solid started to function, which caused the temporary rebound of strength. However, since the overall anchor solid had already undergone slip damage, the bond strength would eventually decrease with displacement increases and decreases.

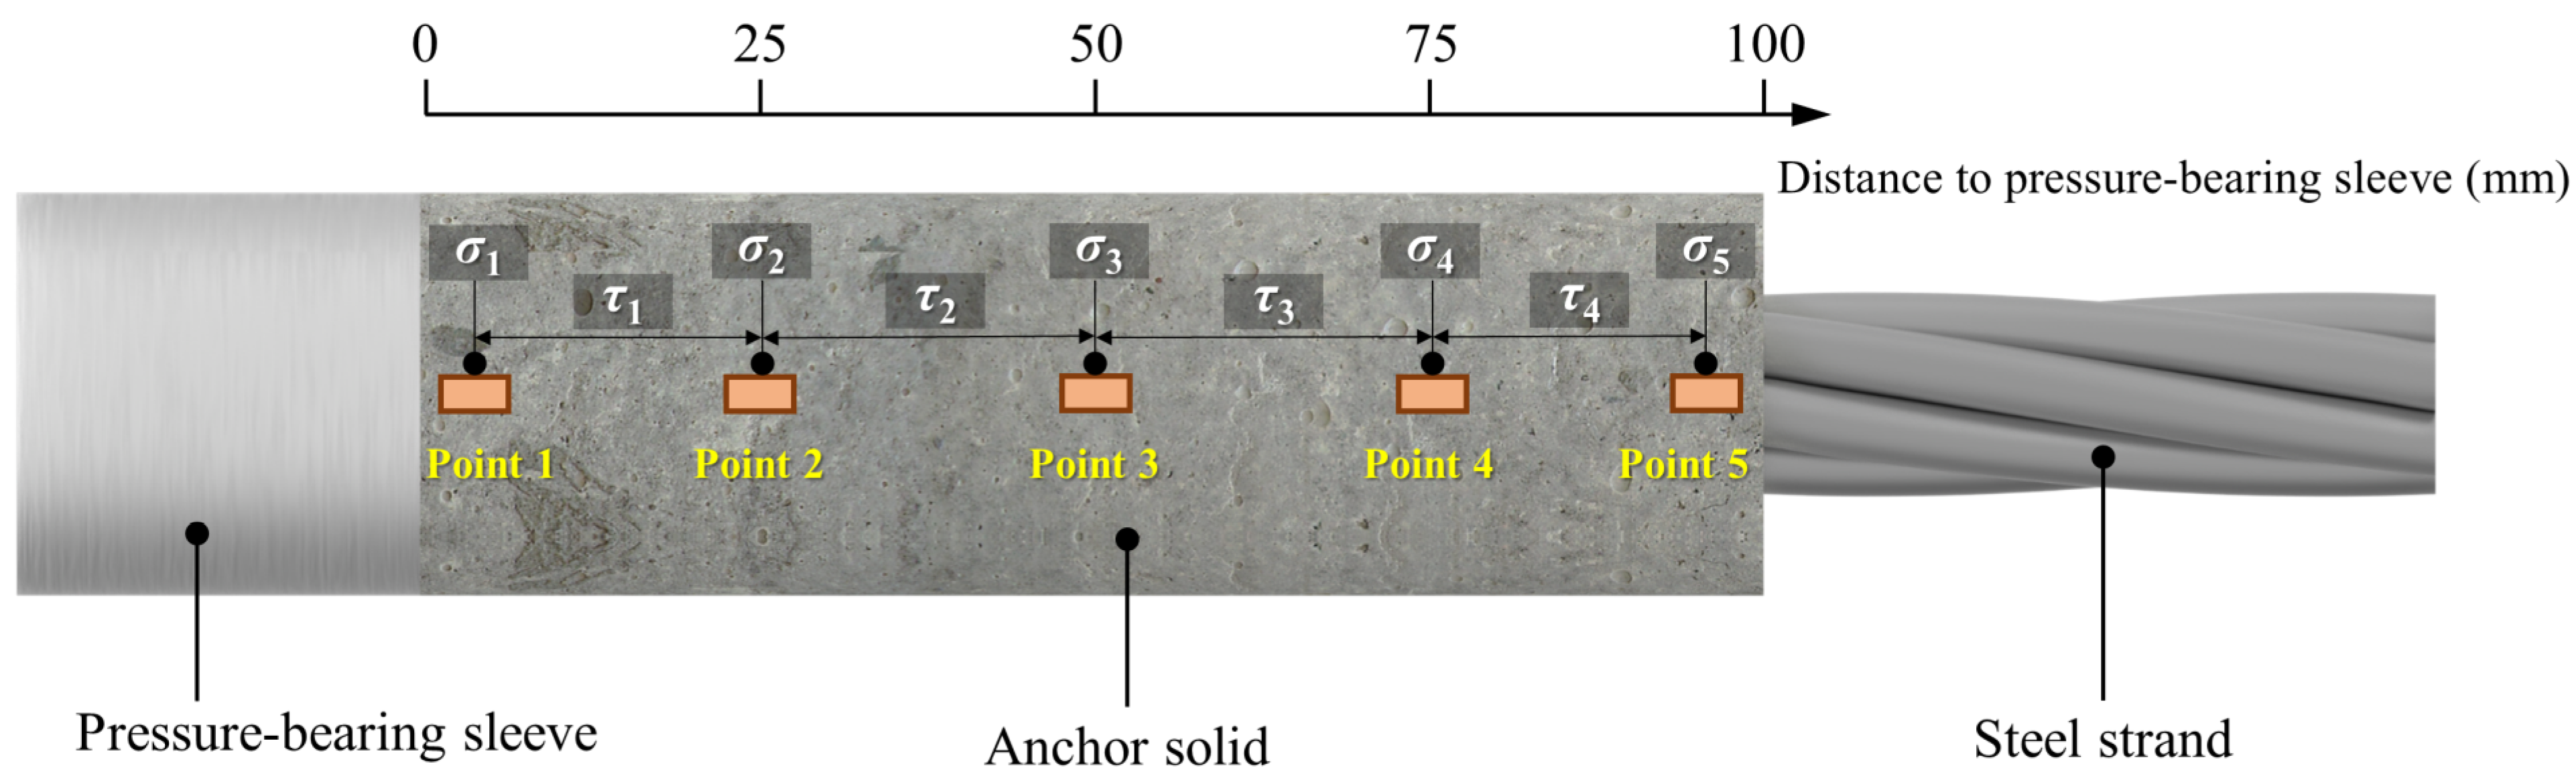
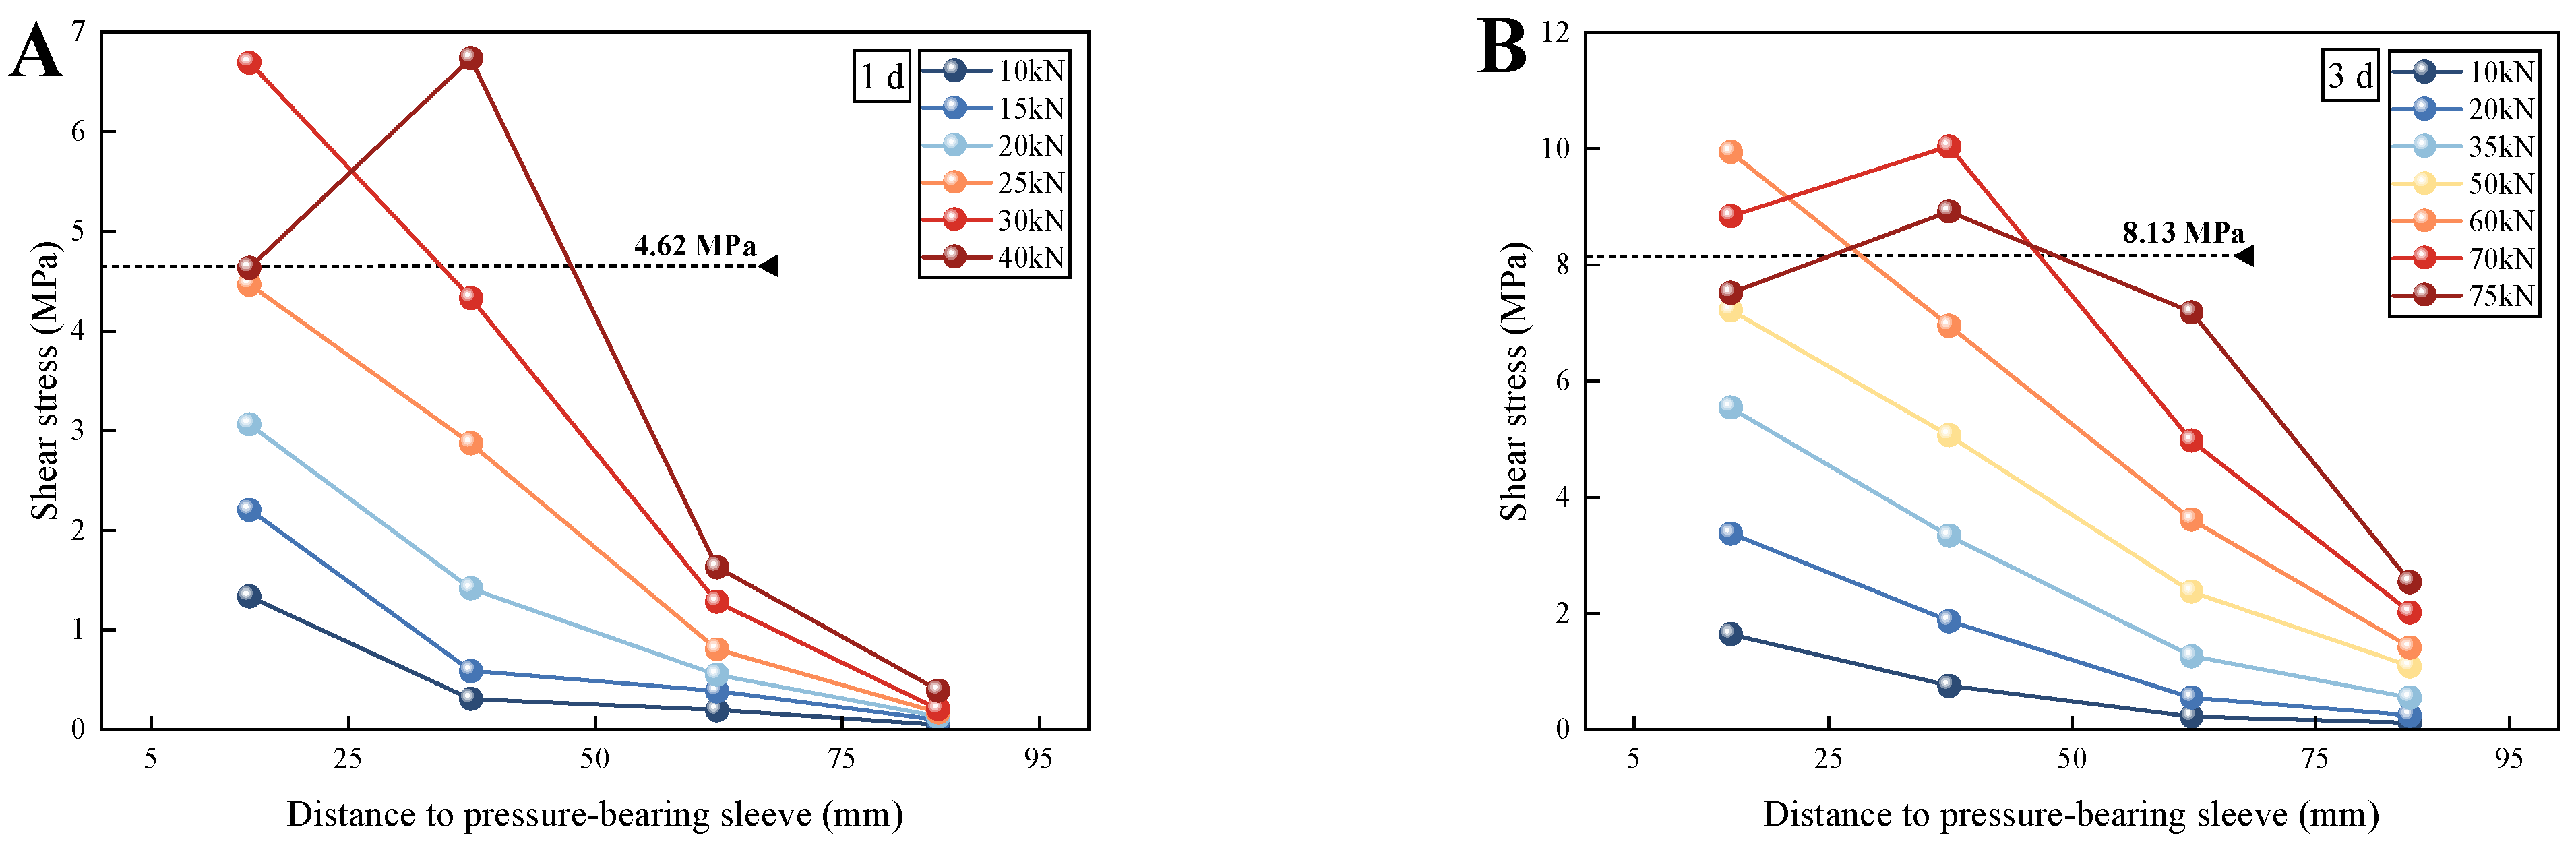
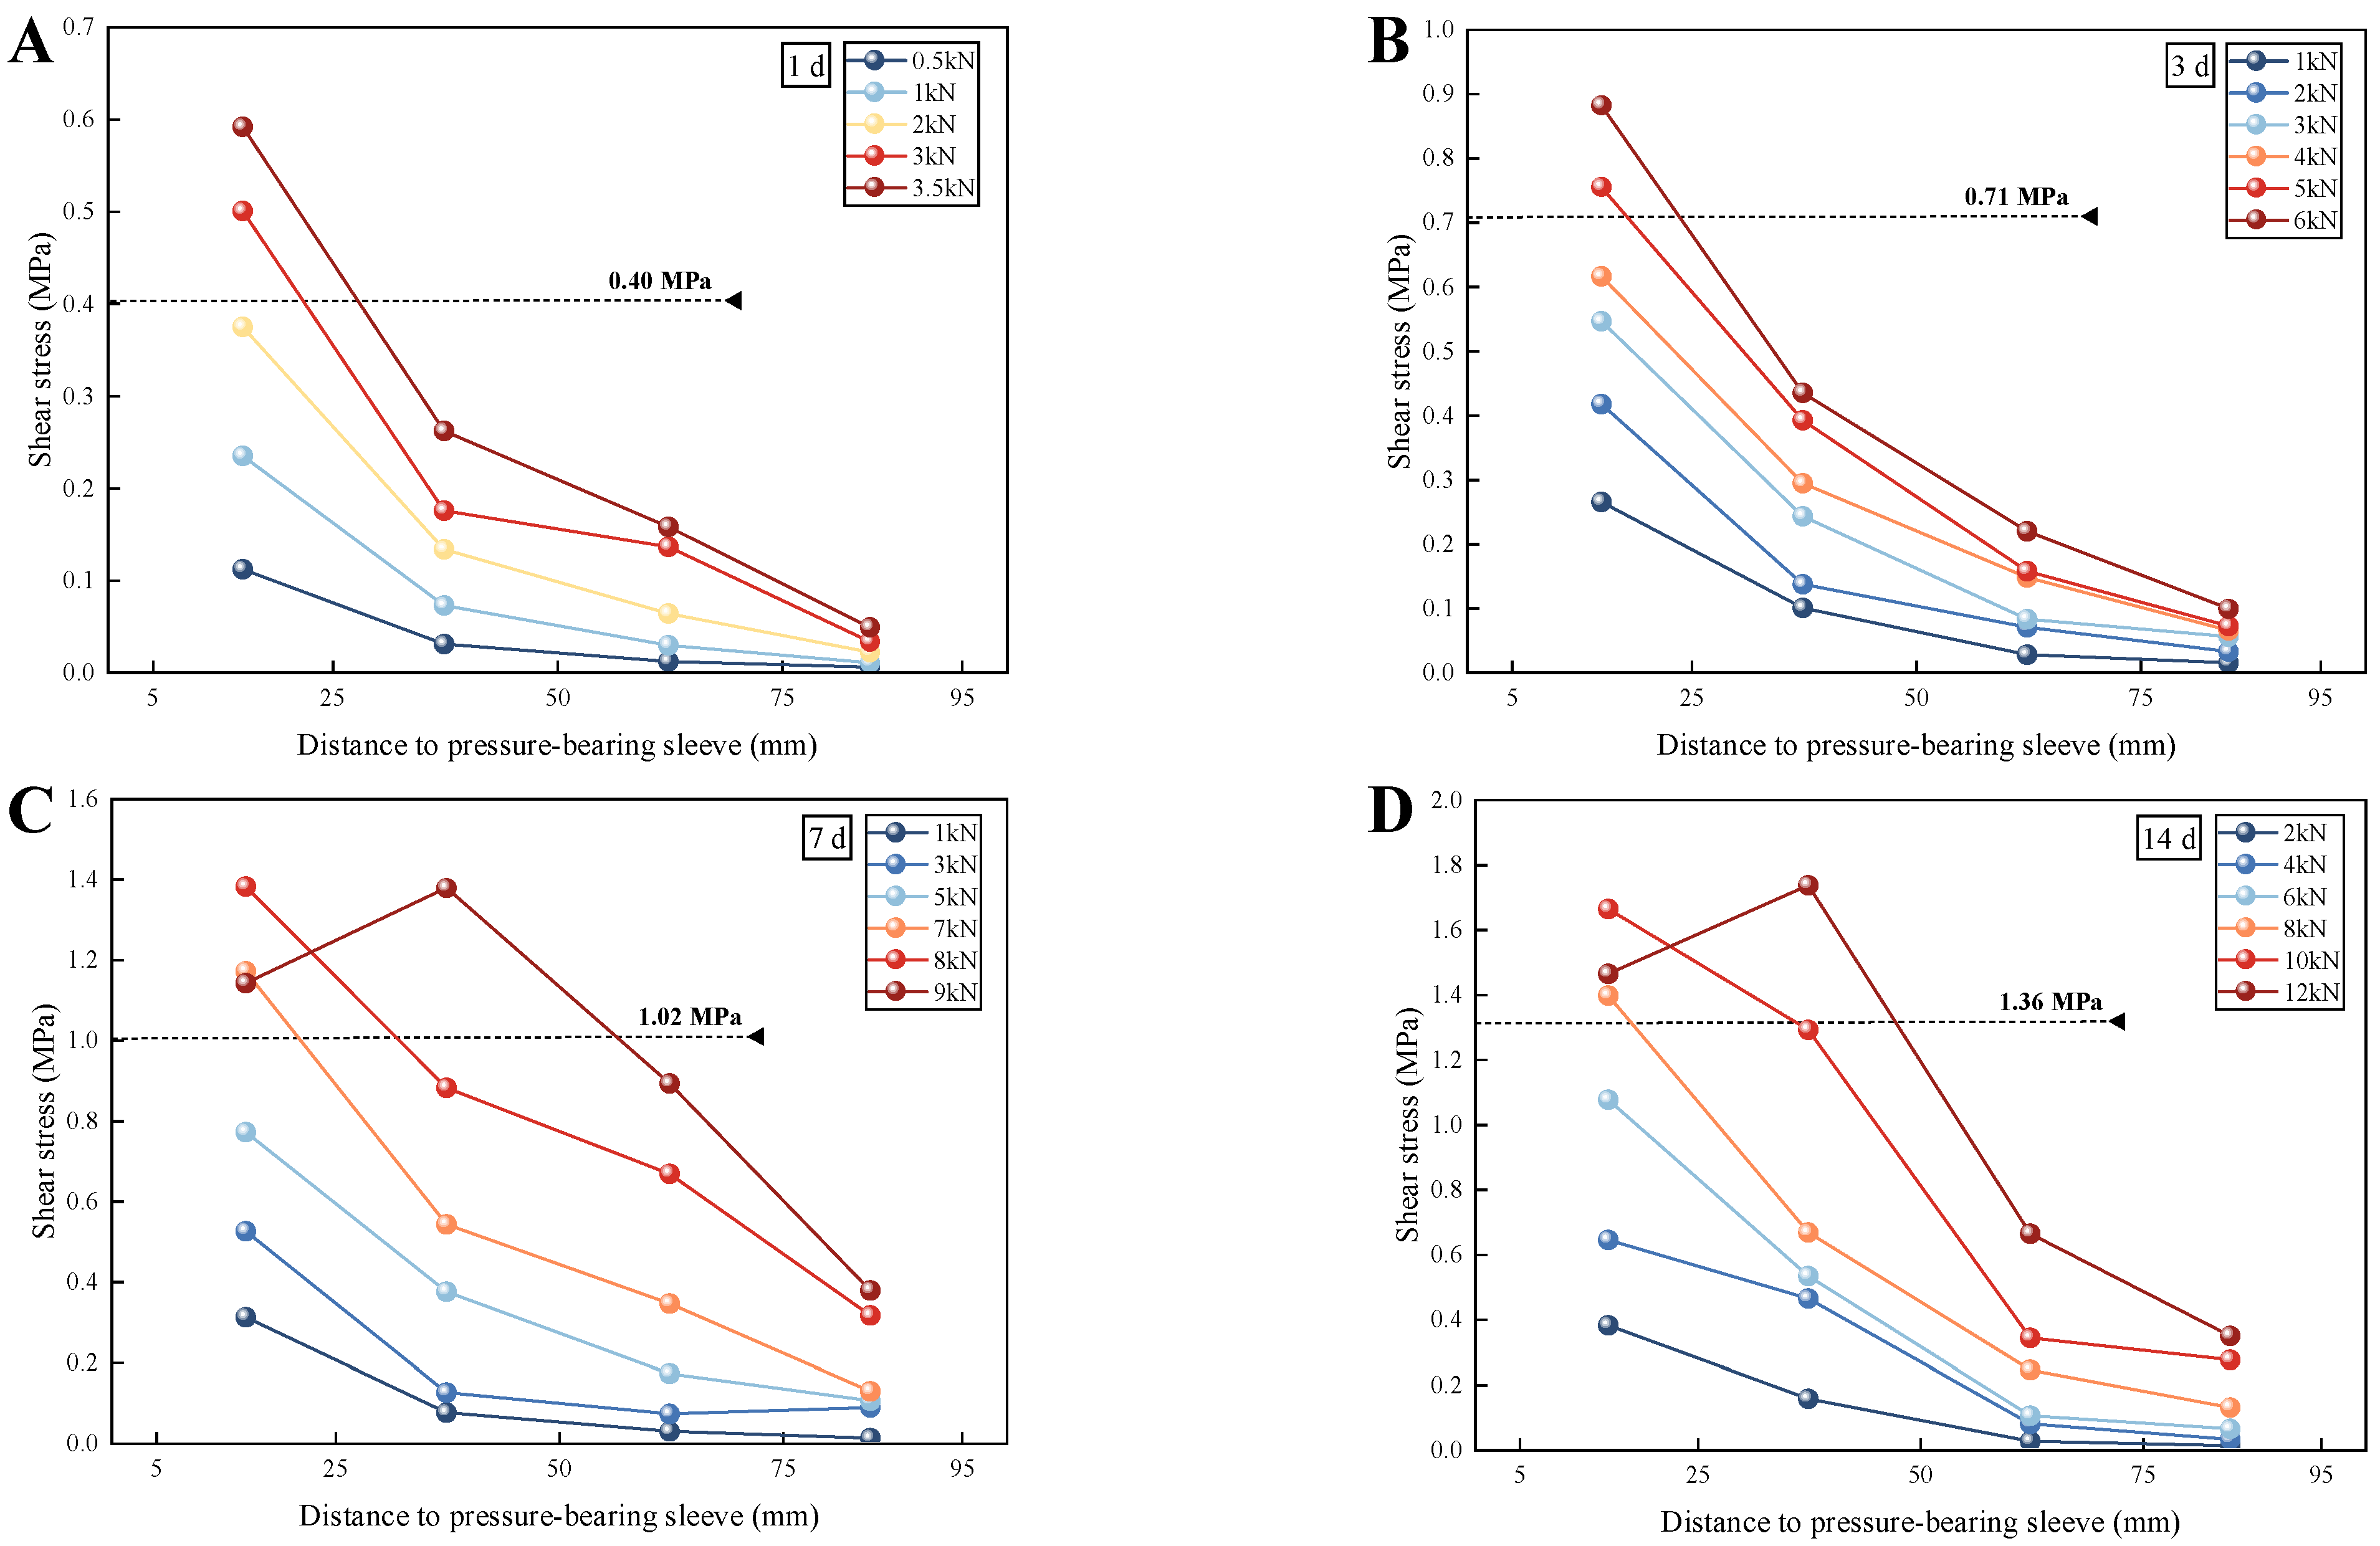
3.2. Stress Distribution
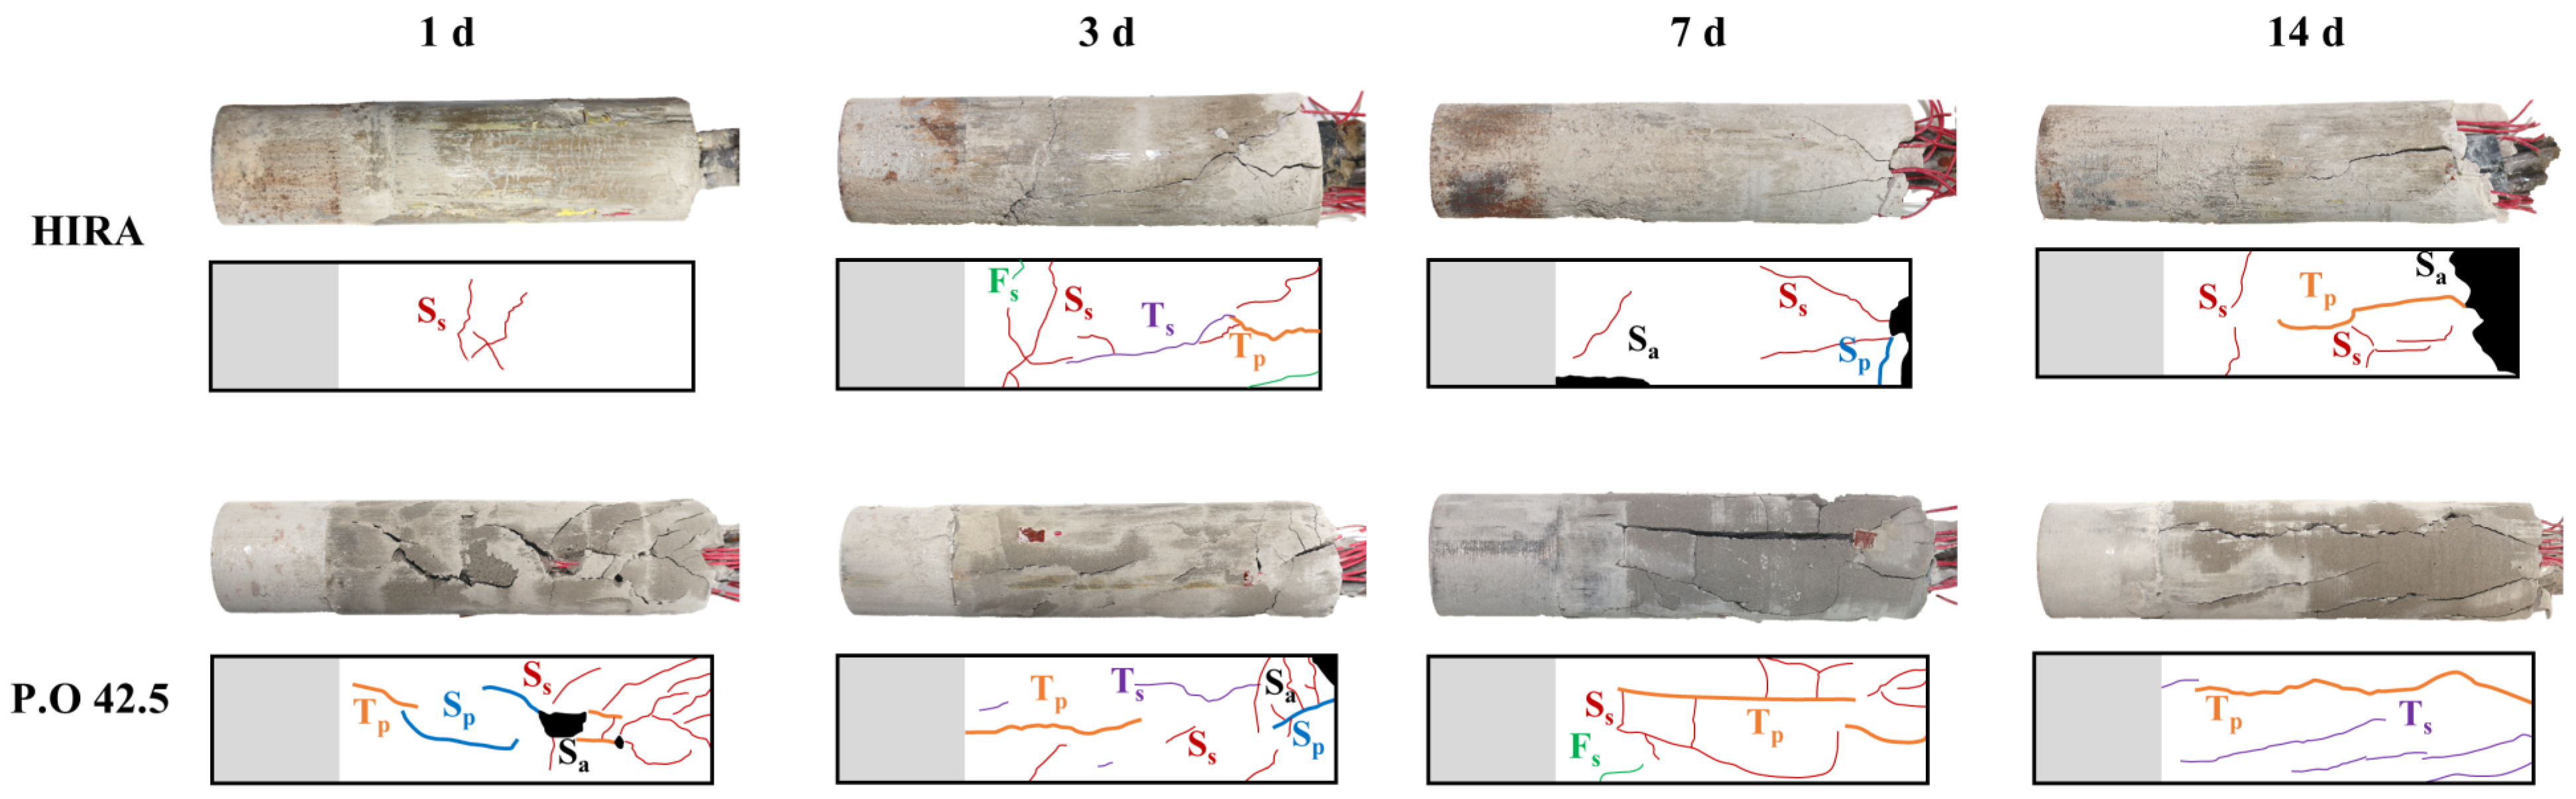
Using the strain data obtained from the five measurement points, the shear stresses of the anchor solid under different loads can be obtained according to Equations (2) and (3). The specimens used in this section are the same as those used in the previous section. Since the tension test in this paper is a destructive test, and all strain gauges fail when the anchor solid is damaged by slip, the axial stress and shear stress analyzed in this section are the data before the maximum tension load with strain records.
The distribution curves of shear stress along the length of the HIRA anchor solid at different maintenance times are shown in Figure 4. The value at the dotted line is the average peak bond strength calculated for the corresponding specimen according to Equation (1). The distribution of shear stress in the four sets of curves is not uniform, showing a non-linear form of decreasing shear stress along the length of the anchor solid at lower load levels and a single peak curve at higher load levels [24]. The stress is more concentrated at the location near the bearing sleeve and is generally lower at the location near the hole at the outer anchor end; as the load increases, the shear stress affects the range of the anchor solid, and the peak value no longer increases with the load, but shifts along the anchor solid to the outer anchor end [25,26,27]. As the load increases, the stress effect range increases, and the peak shear stress appears. The peak no longer increases with the load growth, but shifts along the anchor solid to the outer anchor end. The peak transfer of the shear stress curve along the anchorage section is accompanied by a decrease in the shear stress level at the previously peaked measurement points, which indicates that the effective range of shear stress influence is limited [28,29]. The black dashed line in the figure shows the average ultimate bond strength calculated from the peak loads of the corresponding specimens by Equation (1) (similarly hereinafter), and it can be seen that the peak shear stresses in all four groups of specimens are greater than their average ultimate bond strengths.
After the load grew to 40 kN at 1 day of maintenance, the peak shear stress appeared to be flattened backward, while the peak shear stress stopped growing and was transferred from the shear stress τ1 between measurement points 1 and 2 to the shear stress τ2 between measurement points 2 and 3, and the value of τ1 started to decrease from the peak while the peak shear stress was transferred. At 3 days, when the load value was 75 kN, the peak shear stress at this time was lower than the peak at 70 kN because the shear stress near measurement point 3 at this time cannot be calculated to obtain a specific value. However, according to the phenomenon that τ1 continues to decrease, τ2 starts to fall back from the peak at 70 kN, and τ3 and τ4 continue to increase during the increase in the load from 70 kN to 75 kN. It can be judged that the peak shear stress at 75 kN is located near measurement point 3. At 3 days, when the anchor solid was pulled out, τ3 did not reach its peak, but, at 7 days, τ3 reached its peak before the anchor solid slipped and broke, which indicates that the peak shear stress kept increasing with the growth of maintenance time, while the peak shear stress kept moving toward the outer anchor section of the anchor body with the increase in the load level. The trend of peak shear stress transfer at 14 days of maintenance was similar to that at 3 days.
The distribution curve of shear stress along the length of the P.O 42.5 anchor solid under different maintenance times is shown in Figure 5, from which it can be seen that the distribution characteristics of shear stress are basically similar to those of the HIRA type, but the difference is that the shear stress presents a non-linear form of decreasing along the length of anchor solid in the early maintenance period, and the single-peak curve appears only after 7 days of maintenance, i.e., the peak shift occurs [30]. As with the HIRA material, the value at the dotted line is the average ultimate bond strength calculated for the corresponding specimen according to Equation (1). When the maintenance time increased to 7 days, the peak shear stress shifted along the length of the anchor solid with the increase in the load level, while the value of τ1 started to decrease from the peak; when the maintenance was 14 days, the peak shear stress shifted after the load increased to 10 kN, and, in addition, the overall τ3 was lower at 14 days compared with 7 days, and τ4 was basically unchanged, which was due to the fact that the second half of the anchor section of the 14-day specimens were cracked and dropped in different degrees, which was the direct cause of the low values of τ3 and τ4 at 14 days.

3.3. Failure Mode

The failure mode in this study is mainly reflected in the evolutionary pattern of the type and number of cracks on the anchor solid. To facilitate analysis and in conjunction with existing studies [31,32,33], typical cracks in anchor solids in the tests were defined as six types: primary tensile crack Tp, secondary tensile crack Ts, primary shear crack Sp, secondary shear crack Ss, far-field shear crack Fs, and spalling region Sa. Figure 6 shows the typical damage patterns of HIRA and P.O 42.5 anchor solids after pull-out for different maintenance times, and the redrawing of each anchor solid crack is also shown in Figure 6. The gray area in the redrawing is the pressure-bearing sleeve. A clear trend in the figure is that with increasing maintenance time, the damage of the HIRA-type anchor solid after pull-out gradually increases, while the P.O 42.5-type gradually becomes smaller, as shown below.
At 1 day of maintenance, the cracks of the HIRA anchor solid were mainly secondary shear cracks Ss (hereinafter referred to as Ss cracks and other cracks as well), with a small number of cracks. When the maintenance time increased to 3 days, it evolved into a combination of multiple cracks, and the number of cracks increased. At 7 days, it changed to a combination of two kinds of cracks, and, at the same time, spalling started to appear at the end of the anchor solid. At 14 days, it was still a combination of both types of cracks, but the spalling area increased further and the damage intensified. It can be seen that the most types and numbers of cracks in the HIRA-type anchor solids after pulling out occurred at 3 days of maintenance, after which the spalling area starts to appear and the area gradually expands as the maintenance time increases.
The most types and numbers of cracks were found in P.O 42.5 anchor solids at 1 day of maintenance. There were mainly three crack combinations of Tp cracks, Ss cracks, and Sp cracks, with a high number of cracks and spalling areas. At 3 days of maintenance, there were still three crack combinations, but the spalling areas were reduced compared with those at 1 day. At 7 days of maintenance, it changed to a combination of two cracks, with no spalling areas. At 14 days, there were still two crack combinations, but the spalling areas were reduced compared with those at 1 day. The number of cracks was further reduced at 14 days, but still in the form of two crack combinations. Unlike HIRA, the type and number of cracks in the P.O 42.5 anchor solids after pull-out gradually decreased with increasing maintenance time.

4. Discussion

4.1. Bond Strength

The peak load of each group of specimens of the HIRA type was brought into Equation (1), and the average peak bond strength was calculated to obtain its variation curve with the maintenance time, as shown in Figure 7A. The average peak bond strength increases with increasing maintenance time, with 4.26 MPa, 9.57 MPa, 10.37 MPa, and 12.80 MPa. It is noteworthy that the 3-day strength increases by 125% compared to the 1-day strength, the largest increase, which is also reflected in Figure 3A, followed by 8.4% and 23.4% increases in strength, in that order. Using the 14-day strength as the final strength, the anchor solid bond strength at 3 days has reached 74.8% of the 14-day strength, which fully reflects the early strength and rapid setting characteristics of the HIRA-type material. The measured values of bond strength at 1 day are more discrete, probably due to the different degrees of material setting at 1 day or the uneven distribution of large particles, such as fine sand, in the three specimens during grouting, resulting in large differences in strength limit values [34].
As with the peak load treatment of the HIRA type, the peak load of each group of specimens of P.O 42.5 type was brought into Equation (1), and the average peak bond strength was calculated to obtain its variation curve with the maintenance time, as shown in Figure 7B. The average peak bond strength increases with the increase in the maintenance time [35], to 0.56 MPa, 0.67 MPa, 1.04 MPa, and 1.27 MPa. The increase in the strength from 3 to 7 days is larger, 55.2%, which corresponds to the change of the form of the 3–7 days curve in Figure 4. The strength increased by 19.6% from 1 to 3 days and 22.1% from 7 to 14 days. Using the 14-day strength as the final strength, the 1-day, 3-day, and 7-day anchor solid bond strengths reached 44.1%, 52.8%, and 81.9% of the 14-day strength, respectively.
It can also be found from Figure 7 that the difference between the ultimate average bond strength of HIRA-type material and P.O 42.5-type material is 10.45 times, on average, at each maintenance time point; for example, the ultimate average bond strength of HIRA-type material is 10.37 MPa at 7 days of maintenance, which is 9.97 times higher than that of P.O 42.5-type material at 1.04 MPa.

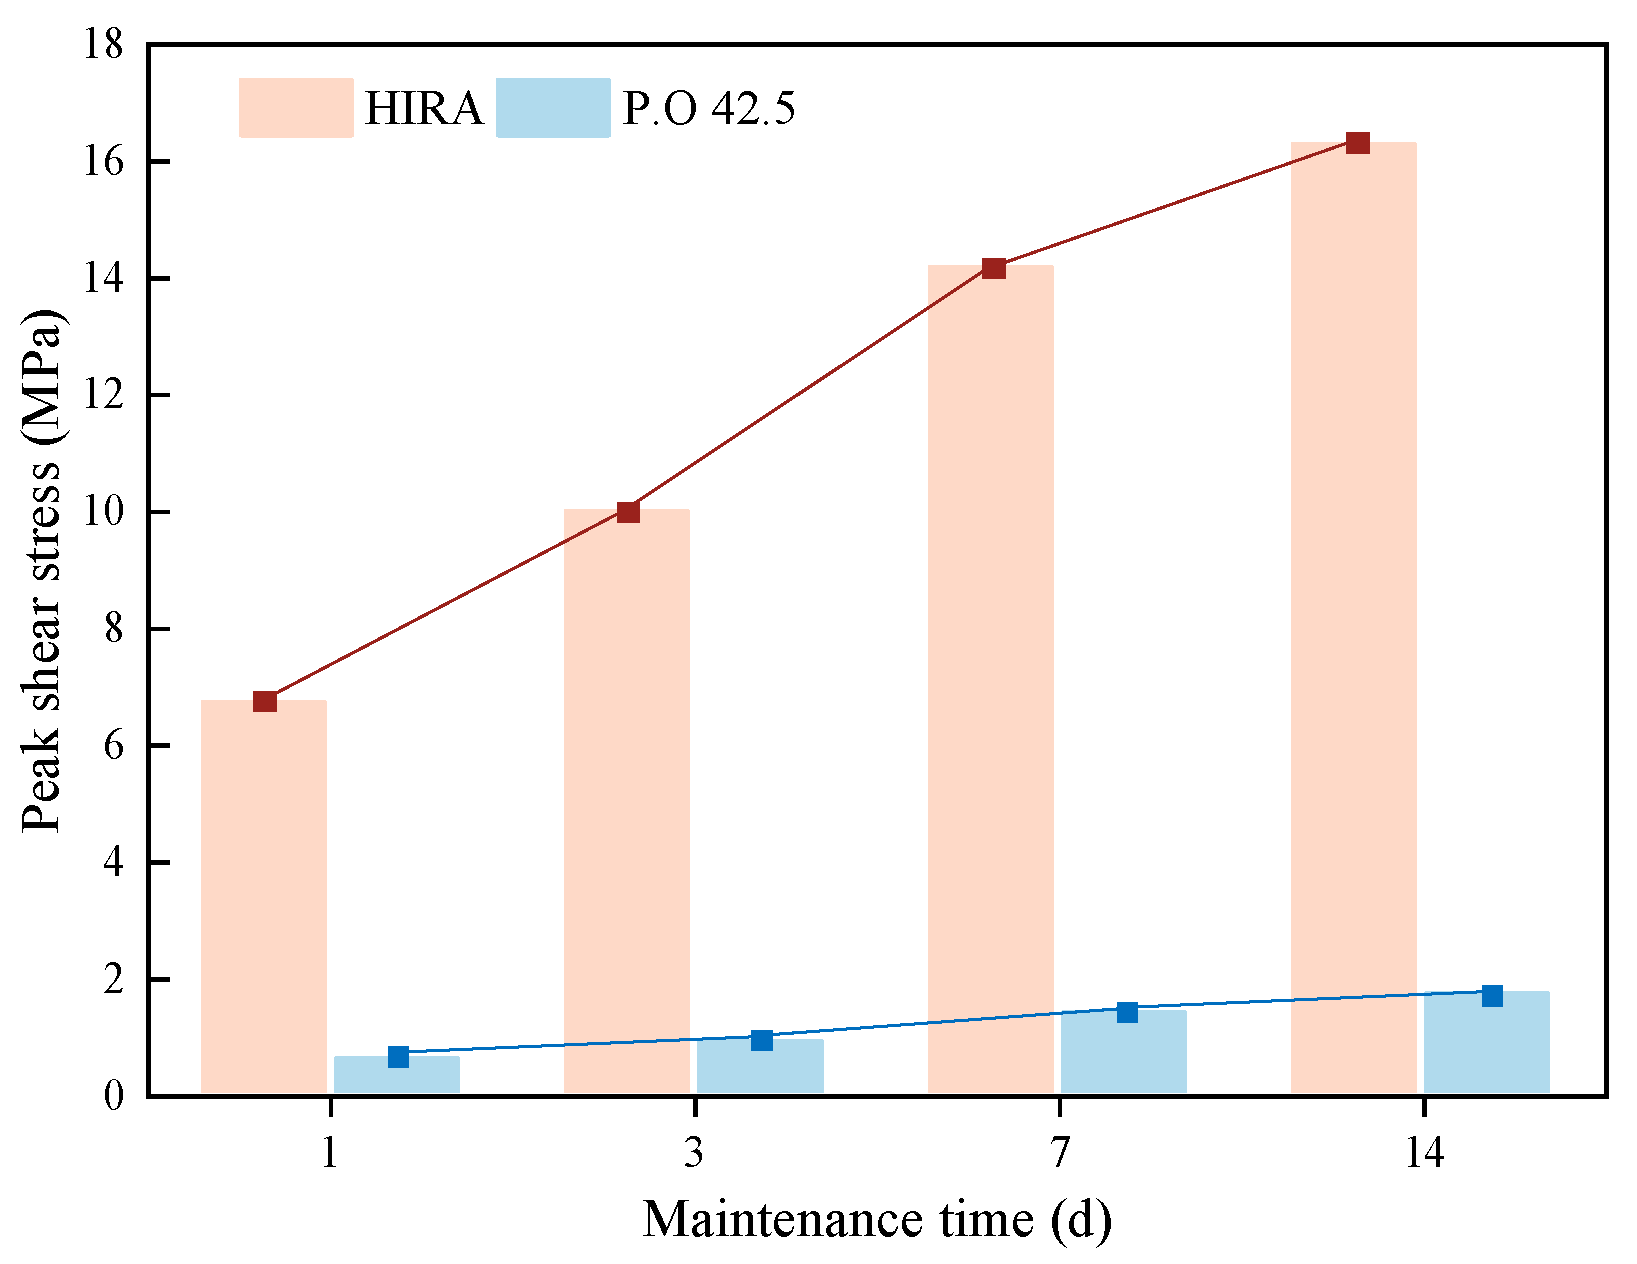
4.2. Shear Stress Peak Evolution Characteristics

The peak shear stresses of the HIRA and P.O 42.5 anchor solids in Section 3.2 were collapsed to obtain Figure 8. It can be seen from the figure that the peak shear stresses of both increased with time, and the peak shear stresses of HIRA anchor solids increased in decreasing order, that is, 48.7%, 42.1%, and 14.9%. The peak shear stresses of P.O 42.5 anchor solids increased the most in 3–7 days, by 56.8%. This indicates that the bond strength of the HIRA material accumulates fastest when the maintenance time is short, and the strength increase is small in the late maintenance period, which is consistent with the analysis of Figure 3A and Figure 4. Meanwhile, the initial strength of the P.O 42.5 material is available only at 7 days of maintenance, and its strength accumulation is slow, which is consistent with the analysis of Figure 3B, and the analysis of Figure 5C also proves that the peak transfer phenomenon of shear stress begins to appear at this time [36,37,38]. Under the same maintenance time, the peak shear stress of HIRA type anchor solid is about 10 times higher than that of the P.O 42.5 type. The peak shear stress of the former is 10.2 times higher than that of the latter when maintained for 7 days.

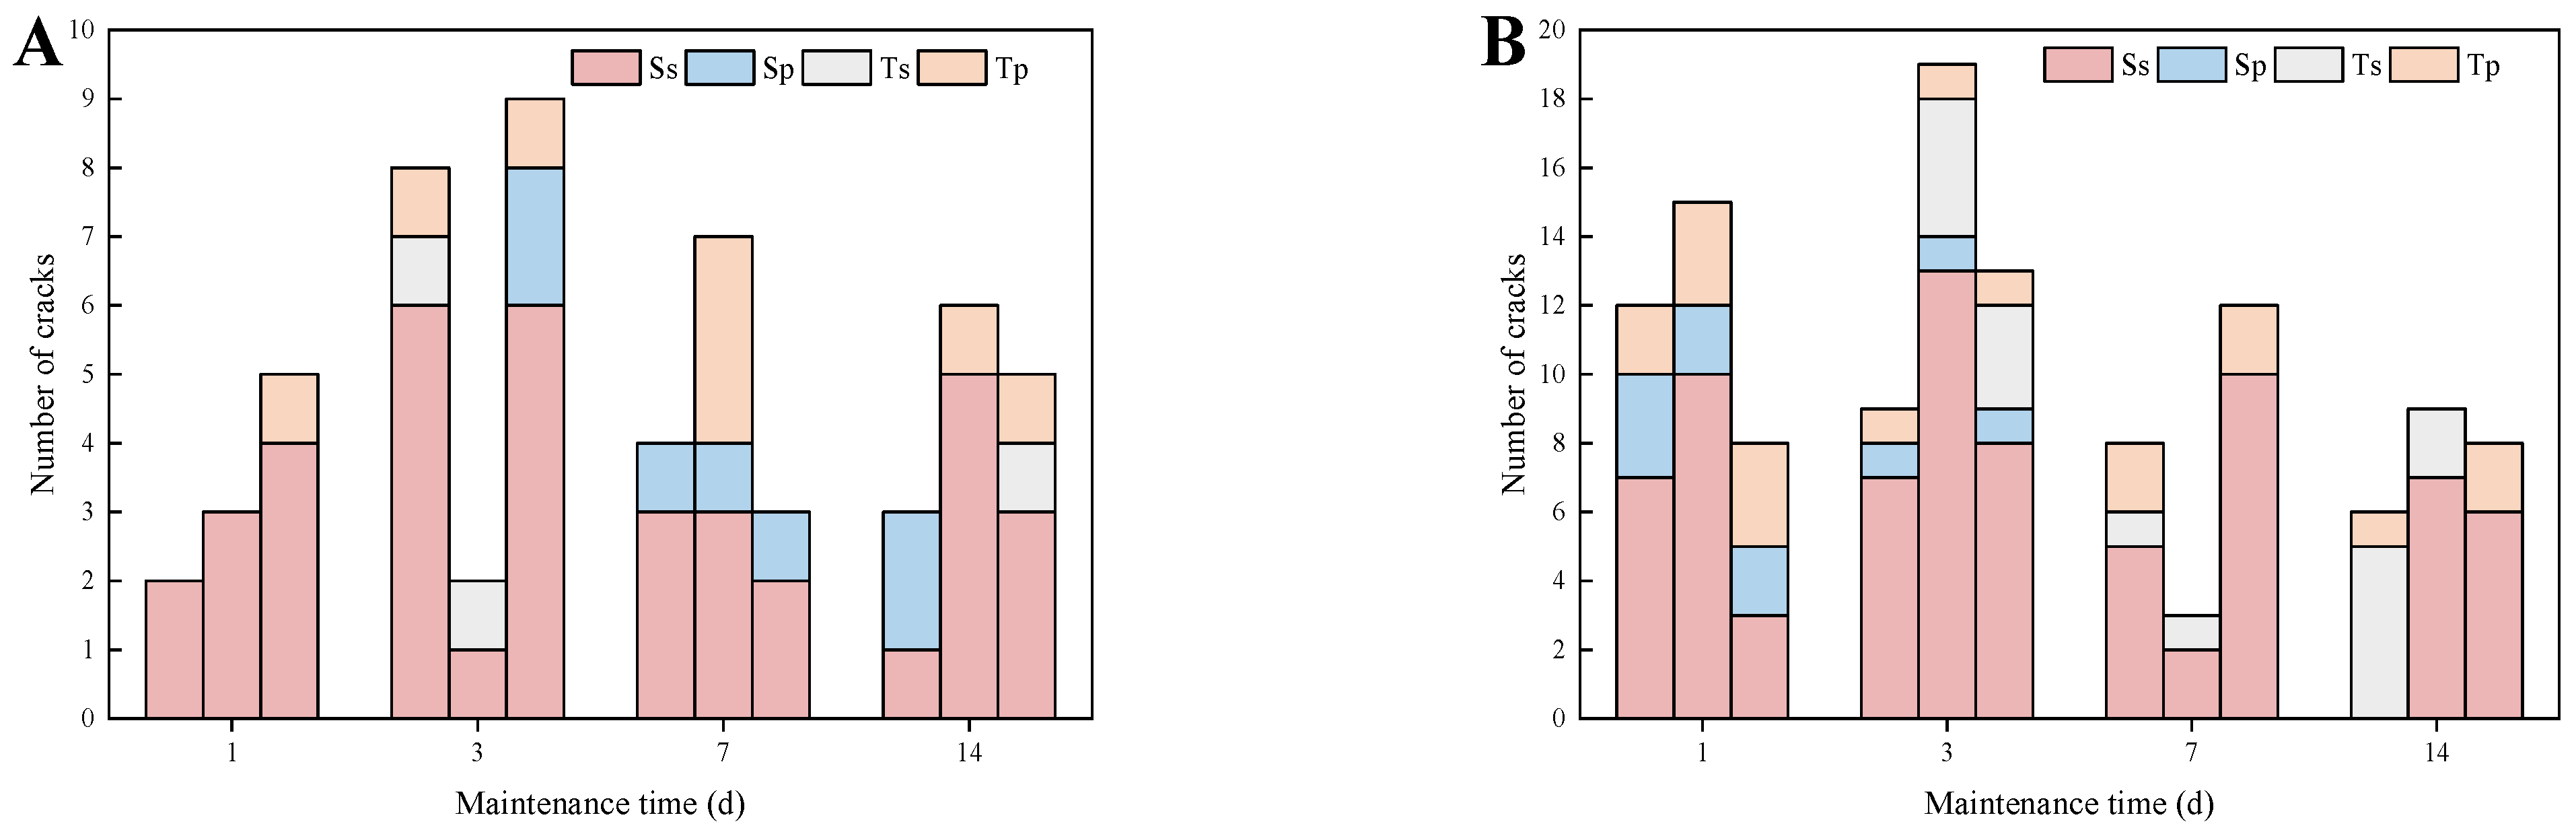
4.3. Association between the Number of Cracks and the Damage Pattern

The number of cracks after pulling out the anchor solids of HIRA and P.O 42.5 were counted, as shown in Figure 9, with three columns corresponding to three parallel samples at each maintenance time. It can be seen from the figure that Ss cracks are predominant for both materials at each maintenance time. After the damage from the anchor solid pullout at the early maintenance time, the HIRA-type material is dominated by Ss cracks, while the P.O 42.5-type material shows a combination of three kinds of cracks, and the number of cracks is more than that of the HIRA type material [39].
With the increase in the maintenance time, the combination of Ss cracks and other cracks became the main damage form of the HIRA-type material, and the overall number of cracks showed a trend of first increasing and then decreasing. According to the aforementioned analysis, the bond strength between the anchor solid and the rock body has reached a high level at 3 days, but, due to the short maintenance time, the anchor solid itself is not fully formed, resulting in more types and numbers of cracks [40]. Later, as the maintenance days become longer, the anchor solid is formed, but, due to the high stress level, the cracks are transformed into spalling areas, resulting in a smaller number of cracks and more severe damage to the anchor solid [41].
The damage form of the P.O 42.5 anchor solid gradually changed to a combination of Ss cracks and Ts cracks as the maintenance time became longer, and its overall number of cracks showed a gradually decreasing trend. Due to the slow solidification of P.O 42.5 material in the early stage, the anchor solid strength was low, and although the stress level was also low at this time. The anchor solid was still severely damaged, and the bond stress increased with the longer maintenance time in the later stage, but the level was always low, and the anchor solid strength was gradually formed, which led to the gradual reduction of the number of cracks in the later stages and the lowest number of cracks at 14 days [42].
Combining the above analysis results, it is easy to find that the characteristics of the HIRA-type material with high strength throughout and fast setting and forming are further verified, while the degree of pull-out damage under four different maintenance times is generally lower than that of the P.O 42.5 material of the same period.

5. Conclusions

(1)
The average peak bond strength of anchor solids increases with the increase in maintenance time, and the early strength and rapid setting characteristics of HIRA-type materials are obvious, while cement requires 7 days to reach an approximate proportion of anchor solid bond strength. The difference between the ultimate average bond strength of HIRA-type materials and P.O 42.5-type materials at each maintenance stage is 10.45 times on average. HIRA materials are superior to cement materials commonly used in subsea tunnels in terms of early strength properties.
(2)
The shear stress distribution shows a concentration of stress near the bearing sleeve and a lower stress level near the outer anchor end. As the load increases, the range of stress influence increases, and the peak shear stress appears and shifts, accompanied by a decrease in the shear stress level at the previously peaked measurement points. The peak transfer occurs earlier in the HIRA-type anchor solid than in the P.O 42.5 material, which indicates that the overall strength of the HIRA material is higher.
(3)
With the increase in maintenance time, the type and number of cracks in HIRA-type anchor solids after extraction first increased and then decreased. The spalling area gradually increased, and the damage degree gradually increased. The type, number and spalling area of P.O 42.5-type anchor solids gradually decreased and the damage degree gradually became smaller. The extraction damage degree of the HIRA-type material was generally lower than that of the P.O 42.5 material in the same period. This proves that the stiffness of HIRA material is lower than that of P.O. 42.5 material.

Author Contributions

Data curation, K.W. and H.P.; funding acquisition, Y.Z. and T.L.; investigation, H.P.; methodology, Q.M. and H.P.; project administration, Q.M., Y.Z. and T.L.; writing—original draft, K.W.; writing—review and editing, Q.M., Y.Z. and T.L. All authors contributed to the article and approved the submitted version. All authors have read and agreed to the published version of the manuscript.

Funding

This work was funded by the National Natural Science Foundation of China (U2006213), the National Natural Science Foundation of China (42277139), the China Postdoctoral Science Foundation (2022M712989), and the Natural Science Foundation of Shandong Province (ZR2022QD103).

Institutional Review Board Statement

Not applicable.

Informed Consent Statement

Not applicable.

Data Availability Statement

The data used to support the findings of this study are included within the article.

Acknowledgments

We appreciate the reviewers for their valuable comments, which are crucial to shaping our manuscript. At the same time, we are also grateful for the financial support provided by the above-mentioned funds.

Conflicts of Interest

The authors declare that the research was conducted in the absence of any commercial or financial relationships that could be construed as a potential conflict of interest.

References

  1. China Association of Metros. 2022. Available online: https://www.camet.org.cn/xyxw/11484 (accessed on 6 March 2023).
  2. Chen, C.; Liang, G.; Tang, Y.; Xu, Y. Anchoring solid-soil interface behavior using a novel laboratory testing technique. Chin. J. Geotech. Eng. 2015, 37, 1115–1122. [Google Scholar]
  3. Ding, W.; Liu, J.; Zhang, L. Analysis on interaction of rock-bolts in anchorage support structure of subsea tunnel at different corrosion levels. J. Cent. South Univ. 2014, 45, 1642–1652. [Google Scholar]
  4. Liu, X.; Li, Z.; Tai, P.; Chen, R.; Fu, W. In-situ Experimental Investigation on Stress Distribution of Grout Body of Tension-type Ground Anchor. Chin. J. Undergr. Space Eng. 2021, 17, 63–70. [Google Scholar]
  5. Forbes, B.; Vlachopoulos, N.; Diederichs, M.S.; Aubertin, J. Augmenting the in-situ rock bolt pull test with distributed optical fiber strain sensing. Int. J. Rock Mech. Min. Sci. 2020, 126, 104202. [Google Scholar] [CrossRef]
  6. Martin, L.B.; Tijani, M.; Hadj-Hassen, F.; Noiret, A. Assessment of the bolt-grout interface behaviour of fully grouted rockbolts from laboratory experiments under axial loads. Int. J. Rock Mech. Min. Sci. 2013, 63, 50–61. [Google Scholar] [CrossRef]
  7. Guo, X.; Stoesser, T.; Zheng, D.; Luo, Q.; Liu, X.; Nian, T. A methodology to predict the run-out distance of submarine landslides. Comput. Geotech. 2023, 153, 105073. [Google Scholar] [CrossRef]
  8. Shi, M.; Xia, W.; Wang, F.; Liu, H.; Pan, Y. Experimental study on bond performance between polymer anchorage body and silt. Chin. J. Geotech. Eng. 2014, 36, 724–730. [Google Scholar]
  9. Han, F.; Liu, J.; Liu, J.; Ma, B.; Sha, J.; Wang, X. Study on Anchorage Behavior of Steel Bar in Ultra-high Performance Concrete. Mater. Rep. 2019, 33, 244–248. [Google Scholar]
  10. Zhang, L.; Wang, R. Research on status quo of anchorage theory of rock and soil. Rock Soil Mech. 2002, 23, 627–631. [Google Scholar] [CrossRef]
  11. Yang, Q.; Zhu, X.; Ruan, M. Analysis of stress Distribution and Influential Parameters of Anchorage Segment of Pressure-Type Cable. Chin. J. Rock Mech. Eng. 2006, 25, 4065–4070. [Google Scholar]
  12. Lu, L.; Zhang, Y.; Wu, S. Distribution of stresses on bonded length of compression type rock bolt. Rock Soil Mech. 2008, 29, 1517–1520. [Google Scholar] [CrossRef]
  13. You, C. Mechanical analysis on anchorage segment of pressure-type cable. Chin. J. Geotech. Eng. 2004, 26, 828–831. [Google Scholar]
  14. Benmokrane, B.; Chennouf, A.; Mitri, H.S. Laboratory Evaluation of Cement-Based Grouts and Grouted Rock Anchors. Int. J. Rock Mech. Min. Sci. Geomech. Abstr. 1995, 32, 633–642. [Google Scholar] [CrossRef]
  15. Liao, J.; Tu, B. A Determination Method of Anchorage Length of Compression Anchor. J. Civ. Archit. Environ. Eng. 2013, 35, 9–14. [Google Scholar]
  16. Zhang, Y.; Lu, L.; Rao, X.; Li, J. Model test research on mechanical behavior of compression type rock bolt. Rock Soil Mech. 2010, 31, 2045–2050. [Google Scholar] [CrossRef]
  17. Lu, L.; Zhang, Y.; Zhang, S.; Wu, S. Stress Distribution in Fixed Anchor Length of Compression Type Anchor in Soft Rock Mass. J. Civ. Archit. Environ. Eng. 2011, 33, 69–74. [Google Scholar]
  18. Shen, J.; Gu, J.; Zhang, X.; Chen, A.; Ming, Z. Field Pull-Out Test Research on Tension and Pressrue Unbonded Anchor Cables. Chin. J. Rock Mech. Eng. 2012, 31, 3291–3297. [Google Scholar]
  19. Lu, L.; Li, L.; Deng, Y.; Hu, T.; Li, X. Failure mechanism of mortar in front of bearing plate of compression type anchor cables. Chin. J. Geotech. Eng. 2013, 35, 2110–2116. [Google Scholar]
  20. Guo, X.; Liu, Z.; Zheng, J.; Luo, Q.; Liu, X. Bearing capacity factors of T-bar from surficial to stable penetration into deep-sea sediments. Soil Dyn. Earthq. Eng. 2023, 165, 107671. [Google Scholar] [CrossRef]
  21. Zhang, Y.; Wang, H.; Liu, T.; Liu, H.; Deng, S. Interpretation of pore pressure dissipation of CPTu in intermediate soil considering partial drainage effect. Ocean Eng. 2022, 266, 112956. [Google Scholar] [CrossRef]
  22. Zhang, Y.; Feng, X.; Ding, C.; Liu, Y.; Liu, T. Study of cone penetration rate effects in the Yellow River Delta silty soils with different clay contents and state parameters. Ocean Eng. 2022, 250, 110982. [Google Scholar] [CrossRef]
  23. Guo, X.; Nian, T.; Fu, C.; Zheng, D. Numerical Investigation of the Landslide Cover Thickness Effect on the Drag Forces Acting on Submarine Pipelines. J. Waterw. Port Coast. Ocean Eng. 2023, 149, 04022032. [Google Scholar] [CrossRef]
  24. Bi, D.; You, Z.; Liu, Q.; Wang, C.; Shi, J. Soil anchor solid composite interface element form and mechanical effects. Rock Soil Mech. 2017, 38, 277–283. [Google Scholar] [CrossRef]
  25. Zhou, B.; Wang, B.; Liang, C.; Wang, Y. Study on load transfer characteristics of wholly grouted bolt. Chin. J. Rock Mech. Eng. 2017, 36, 3774–3780. [Google Scholar] [CrossRef]
  26. Zhang, X.; Chen, S. Analytical solution for load transfer along anchored section of prestressed anchor cable. Rock Soil Mech. 2015, 36, 1667–1675. [Google Scholar] [CrossRef]
  27. You, Z.; Fu, H.; You, C.; Zhang, J.; Shao, H.; Bi, D.; Shi, J. Stress transfer mechanism of soil anchor body. Rock Soil Mech. 2018, 39, 85–92+102. [Google Scholar] [CrossRef]
  28. Huang, M.; Li, J.; Zhao, M.; Chen, C. Nonlinear Analysis on Load Transfer Mechanism of Bolts in Layered Ground. China J. Highw. Transp. 2019, 32, 12–20+56. [Google Scholar] [CrossRef]
  29. Hoien, A.H.; Li, C.C.; Zhang, N. Pull-out and Critical Embedment Length of Grouted Rebar Rock Bolts-Mechanisms When Approaching and Reaching the Ultimate Load. Rock Mech. Rock Eng. 2021, 54, 1431–1447. [Google Scholar] [CrossRef]
  30. Chen, J.; Chen, X. Analysis of whole process of bolt pulling based on wavelet function. Rock Soil Mech. 2019, 40, 4590–4596. [Google Scholar] [CrossRef]
  31. Li, B.; Liang, Q.; Zhou, Y.; Zhao, C.; Wu, F. Research on crack propagation law of granite based on CT-GBM reconstruction method. Chin. J. Rock Mech. Eng. 2022, 41, 1114–1125. [Google Scholar] [CrossRef]
  32. Li, B.; Zhu, Q.; Zhang, F.; Zhao, C.; Wu, F. Study on crack propagation of heterogeneous rocks with double flaws based on grain based. Chin. J. Rock Mech. Eng. 2021, 40, 1119–1131. [Google Scholar] [CrossRef]
  33. Hu, X.; Bian, K.; Liu, J.; Li, B.; Chen, M. Discrete element simulation study on the influence of microstructure heterogeneity on the creep characteristics of granite. Chin. J. Rock Mech. Eng. 2019, 38, 2069–2083. [Google Scholar] [CrossRef]
  34. Salcher, M.; Bertuzzi, R. Results of pull tests of rock bolts and cable bolts in Sydney sandstone and shale. Tunn. Undergr. Space Technol. 2018, 74, 60–70. [Google Scholar] [CrossRef]
  35. Upadhyaya, P.; Kumar, S. Pull-out capacity of adhesive anchors: An analytical solution. Int. J. Adhes. Adhes. 2015, 60, 54–62. [Google Scholar] [CrossRef]
  36. Xia, Y.; Ye, H.; Liu, X.; Chen, J. Analysis of shear stress along pressure-type anchorage cable in weathered rock mass. Rock Soil Mech. 2010, 31, 3861–3866. [Google Scholar] [CrossRef]
  37. Luo, Y.; Shi, S.; Yan, Z. Shear interaction of anchorage body and rock and soil interface under the action of uplift load. J. China Coal Soc. 2015, 40, 58–64. [Google Scholar] [CrossRef]
  38. Huang, M.; Zhou, Z.; Ou, J. Nonlinear Full-Range Analysis of Load Transfer in Fixed Segment of Tensile Anchors. Chin. J. Rock Mech. Eng. 2014, 33, 2190–2199. [Google Scholar] [CrossRef]
  39. Li, X.F.; Zhang, Q.B.; Li, H.B.; Zhao, J. Grain-Based Discrete Element Method (GB-DEM) Modelling of Multi-scale Fracturing in Rocks Under Dynamic Loading. Rock Mech. Rock Eng. 2018, 51, 3785–3817. [Google Scholar] [CrossRef]
  40. Zhang, X.-P.; Ji, P.-Q.; Peng, J.; Wu, S.-C.; Zhang, Q. A grain-based model considering pre-existing cracks for modelling mechanical properties of crystalline rock. Comput. Geotech. 2020, 127, 103776. [Google Scholar] [CrossRef]
  41. Zhang, Y.; Wong, L.N.Y.; Chan, K.K. An Extended Grain-Based Model Accounting for Microstructures in Rock Deformation. J. Geophys. Res. Solid Earth 2019, 124, 125–148. [Google Scholar] [CrossRef]
  42. Li, X.F.; Li, H.B.; Liu, L.W.; Liu, Y.Q.; Ju, M.H.; Zhao, J. Investigating the crack initiation and propagation mechanism in brittle rocks using grain-based finite-discrete element method. Int. J. Rock Mech. Min. Sci. 2020, 127, 104219. [Google Scholar] [CrossRef]
Figure 1. Particle size distribution curve of HIRA (A) and P.O 42.5 (B).
Jmse 11 00798 g001
Figure 2. Corresponding relationship between stress and measuring points. The colored square represents the strain gauge, and the “Point” is the measuring point.
Jmse 11 00798 g002
Figure 3. Load–displacement curve of HIRA (A) and P.O 42.5 (B) anchor solids under different maintenance times.
Jmse 11 00798 g003
Figure 4. Distribution curve of shear stress along the length of HIRA type anchor solids after 1 (A), 3 (B), 7 (C), and 14 (D) days of maintenance time.
Jmse 11 00798 g004aJmse 11 00798 g004b
Figure 5. Distribution curve of shear stress along the length of P.O 42.5 anchor solids after 1 (A), 3 (B), 7 (C), and 14 (D) days of maintenance time.
Jmse 11 00798 g005
Figure 6. Schematic diagram of typical failure form after anchor solids are pulled out under different maintenance times.
Jmse 11 00798 g006
Figure 7. Variation of average peak bond strength of HIRA (A) and P.O 42.5 (B) anchor solids with maintenance time.
Jmse 11 00798 g007
Figure 8. Variation of peak shear stress with maintenance time.
Jmse 11 00798 g008
Figure 9. Statistical diagram of crack quantity of HIRA (A) and P.O 42.5 (B) anchor solids.
Jmse 11 00798 g009
Table 1. Summary of typical previous studies.
Analytical MethodsMaterialAnchor TypeAuthors
Nonlinear slip relations/Pressure type[13,14,15]
Elastoplastic relationship/Pressure type[11]
Kelvin solution/Pressure type[12]
Model testCement mortarPressure type[16]
Field testCement mortarPressure type[17]
Field testCement mortarPressure type[18]
Indoor testCement mortarPressure type[19]
Field testHigh polymerTensile type[8]
Indoor testHigh concreteTensile type[9]
Table 2. Basic physical property indexes of granite used in the test.
Volume Density
(g/cm3)
Water Absorption
(%)
Bending Strength
(MPa)
Compression Strength
(MPa)
Antifreeze Coefficient
(%)
2.870.85328.6383.2783.27
Table 3. Performance indicators for HIRA type materials and P.O 42.5 type materials.
CategoryTechnical RequirementsItemUnitMeasured Value
HIRACoagulation timeInitial condensationmin55
Final condensationmin219
Compressive strength1 dMPa31.2
3 dMPa49.3
P.O 42.5Coagulation timeInitial condensationmin131
Final condensationmin314
Compressive strength1 dMPa16.7
3 dMPa25.4
Table 4. Sample parameters.
Grouting MaterialsSpecimenMaintenance Time (d)Grouting Length (mm)Quantity
HIRAH-1d11003
H-3d31003
H-7d71003
H-14d141003
P.O 42.5P-1d11003
P-3d31003
P-7d71003
P-14d141003
Disclaimer/Publisher’s Note: The statements, opinions and data contained in all publications are solely those of the individual author(s) and contributor(s) and not of MDPI and/or the editor(s). MDPI and/or the editor(s) disclaim responsibility for any injury to people or property resulting from any ideas, methods, instructions or products referred to in the content.

