

Risk Assessment of Bauxite Maritime Logistics Based on Improved FMECA and Fuzzy Bayesian Network

1
School of Transportation and Logistics Engineering, Wuhan University of Technology, Wuhan 430063, China
2
National Engineering Research Center for Water Transport Safety, Wuhan University of Technology, Wuhan 430063, China
*
Author to whom correspondence should be addressed.
†
These authors contributed equally to this work.
J. Mar. Sci. Eng. 2023, 11(4), 755; https://doi.org/10.3390/jmse11040755
Submission received: 16 March 2023
/
Revised: 29 March 2023
/
Accepted: 29 March 2023
/
Published: 31 March 2023
(This article belongs to the Special Issue Maritime Security and Risk Assessments)
Abstract
:Because of the many limitations of the traditional failure mode effect and criticality analysis (FMECA), an integrated risk assessment model with improved FMECA, fuzzy Bayesian networks (FBN), and improved evidence reasoning (ER) is proposed. A new risk characterization parameter system is constructed in the model. A fuzzy rule base system based on the confidence structure is constructed by combining fuzzy set theory with expert knowledge, and BN reasoning technology is used to realize the importance ranking of the hazard degree of maritime logistics risk events. The improved ER based on weight distribution and matrix analysis can effectively integrate the results of risk event assessment and realize the hazard evaluation of the maritime logistics system from the overall perspective. The effectiveness and feasibility of the model are verified by carrying out a risk assessment on the maritime logistics of importing bauxite to China. The research results show that the priority of risk events in the maritime logistics of bauxite are “pirates or terrorist attacks” and “workers’ riots or strikes” in sequence. In addition, the bauxite maritime logistics system is at a medium- to high-risk level as a whole. The proposed model is expected to provide a systematic risk assessment model and framework for the engineering field.
1. Introduction
As a raw material for many industrial products, the demand for bauxite in China has shown a rising trend in recent years. Due to the shrinking of domestic bauxite resources and the impact of environmental protection policies, China needs to import a large amount of bauxite from abroad every year to meet the demand, and the degree of foreign dependence is continuously increasing. According to Chinese national customs statistics, in 2019 alone, China’s bauxite imports reached 101 million tons, accounting for 72.4% of the global bauxite seaborne trade volume. Among them, the imported bauxite mainly comes from countries with rich bauxite resources such as Guinea and Australia.
As one of the key links in the import of bauxite, maritime logistics have the characteristics of long distances, numerous transit nodes, and a complex sea environment. There are many potential unsafe factors. In addition, bauxite has the characteristic of easy fluidization, which further interferes with the robustness and reliability of maritime logistics links. Therefore, it is necessary to evaluate the risks of China’s imported bauxite shipping logistics to minimize the impact of potential risk factors in shipping logistics on the stable and continuous imports of China’s bauxite, and to ensure the orderly and healthy development of China’s aluminum industry.
The failure mode effect and criticality analysis (FMECA) is widely used in the field of risk assessment and reliability analysis. However, the traditional FMECA method has many limitations, which are mainly reflected in the incompleteness of risk characterization parameters, the lack of parameter importance differences, and the limited discrimination of risk priority number (RPN) values [1,2]. In response to the above problems, scholars at home and abroad have carried out a lot of research.
Based on the characteristics of plastic production, Gul, Yucesan, and Gelik [1] proposed an improved FMEA combined with the fuzzy Bayesian network (FBN) to evaluate failures in plastic production. The risk characterization parameters were reconstructed in the model and weighted by the fuzzy best-worst method. Similarly, Wan et al. [3] combined the fuzzy belief rule method with Bayesian networks to establish a new maritime supply chain wind assessment model. In the model, three sub-parameters were introduced to characterize the consequences of the failure event, and then a more complete risk characterization parameter system was constructed, and the parameters were weighted through the analytic hierarchy process (AHP) method. In view of the advantages of the Bayesian network (BN) in dealing with uncertainty, Ma et al. [4] proposed a Bayesian network construction method that combined FMEA and a fault tree analysis (FTA) for the system security assessment. Liu et al. [5] proposed a new risk priority model based on the D number and gray correlation to optimize FMEA and then conduct a risk assessment.
Considering that there is a large amount of uncertain information in the evaluation process, fuzzy set theory has been widely used due to its flexibility, reliability, and strong operability in handling uncertain information. Lee et al. [2] proposed a new fuzzy comprehensive evaluation method using structural importance and fuzzy theory, which effectively dealt with subjective ambiguity under uncertain conditions. In addition, Renjith, Kumar, and Madhavan [6] proposed a fuzzy RPN method to prioritize system failures. This method evaluated risk parameters through fuzzy language variables, and through the IF-THEN rule library to connect the language variables to the fuzzy RPN, which effectively overcomes the shortcomings of the traditional RPN method. Alyami et al. [7] introduced Bayesian networks based on fuzzy rules and developed an advanced failure mode and effect analysis (FMEA) method to assess the criticality of dangerous events in container terminals.
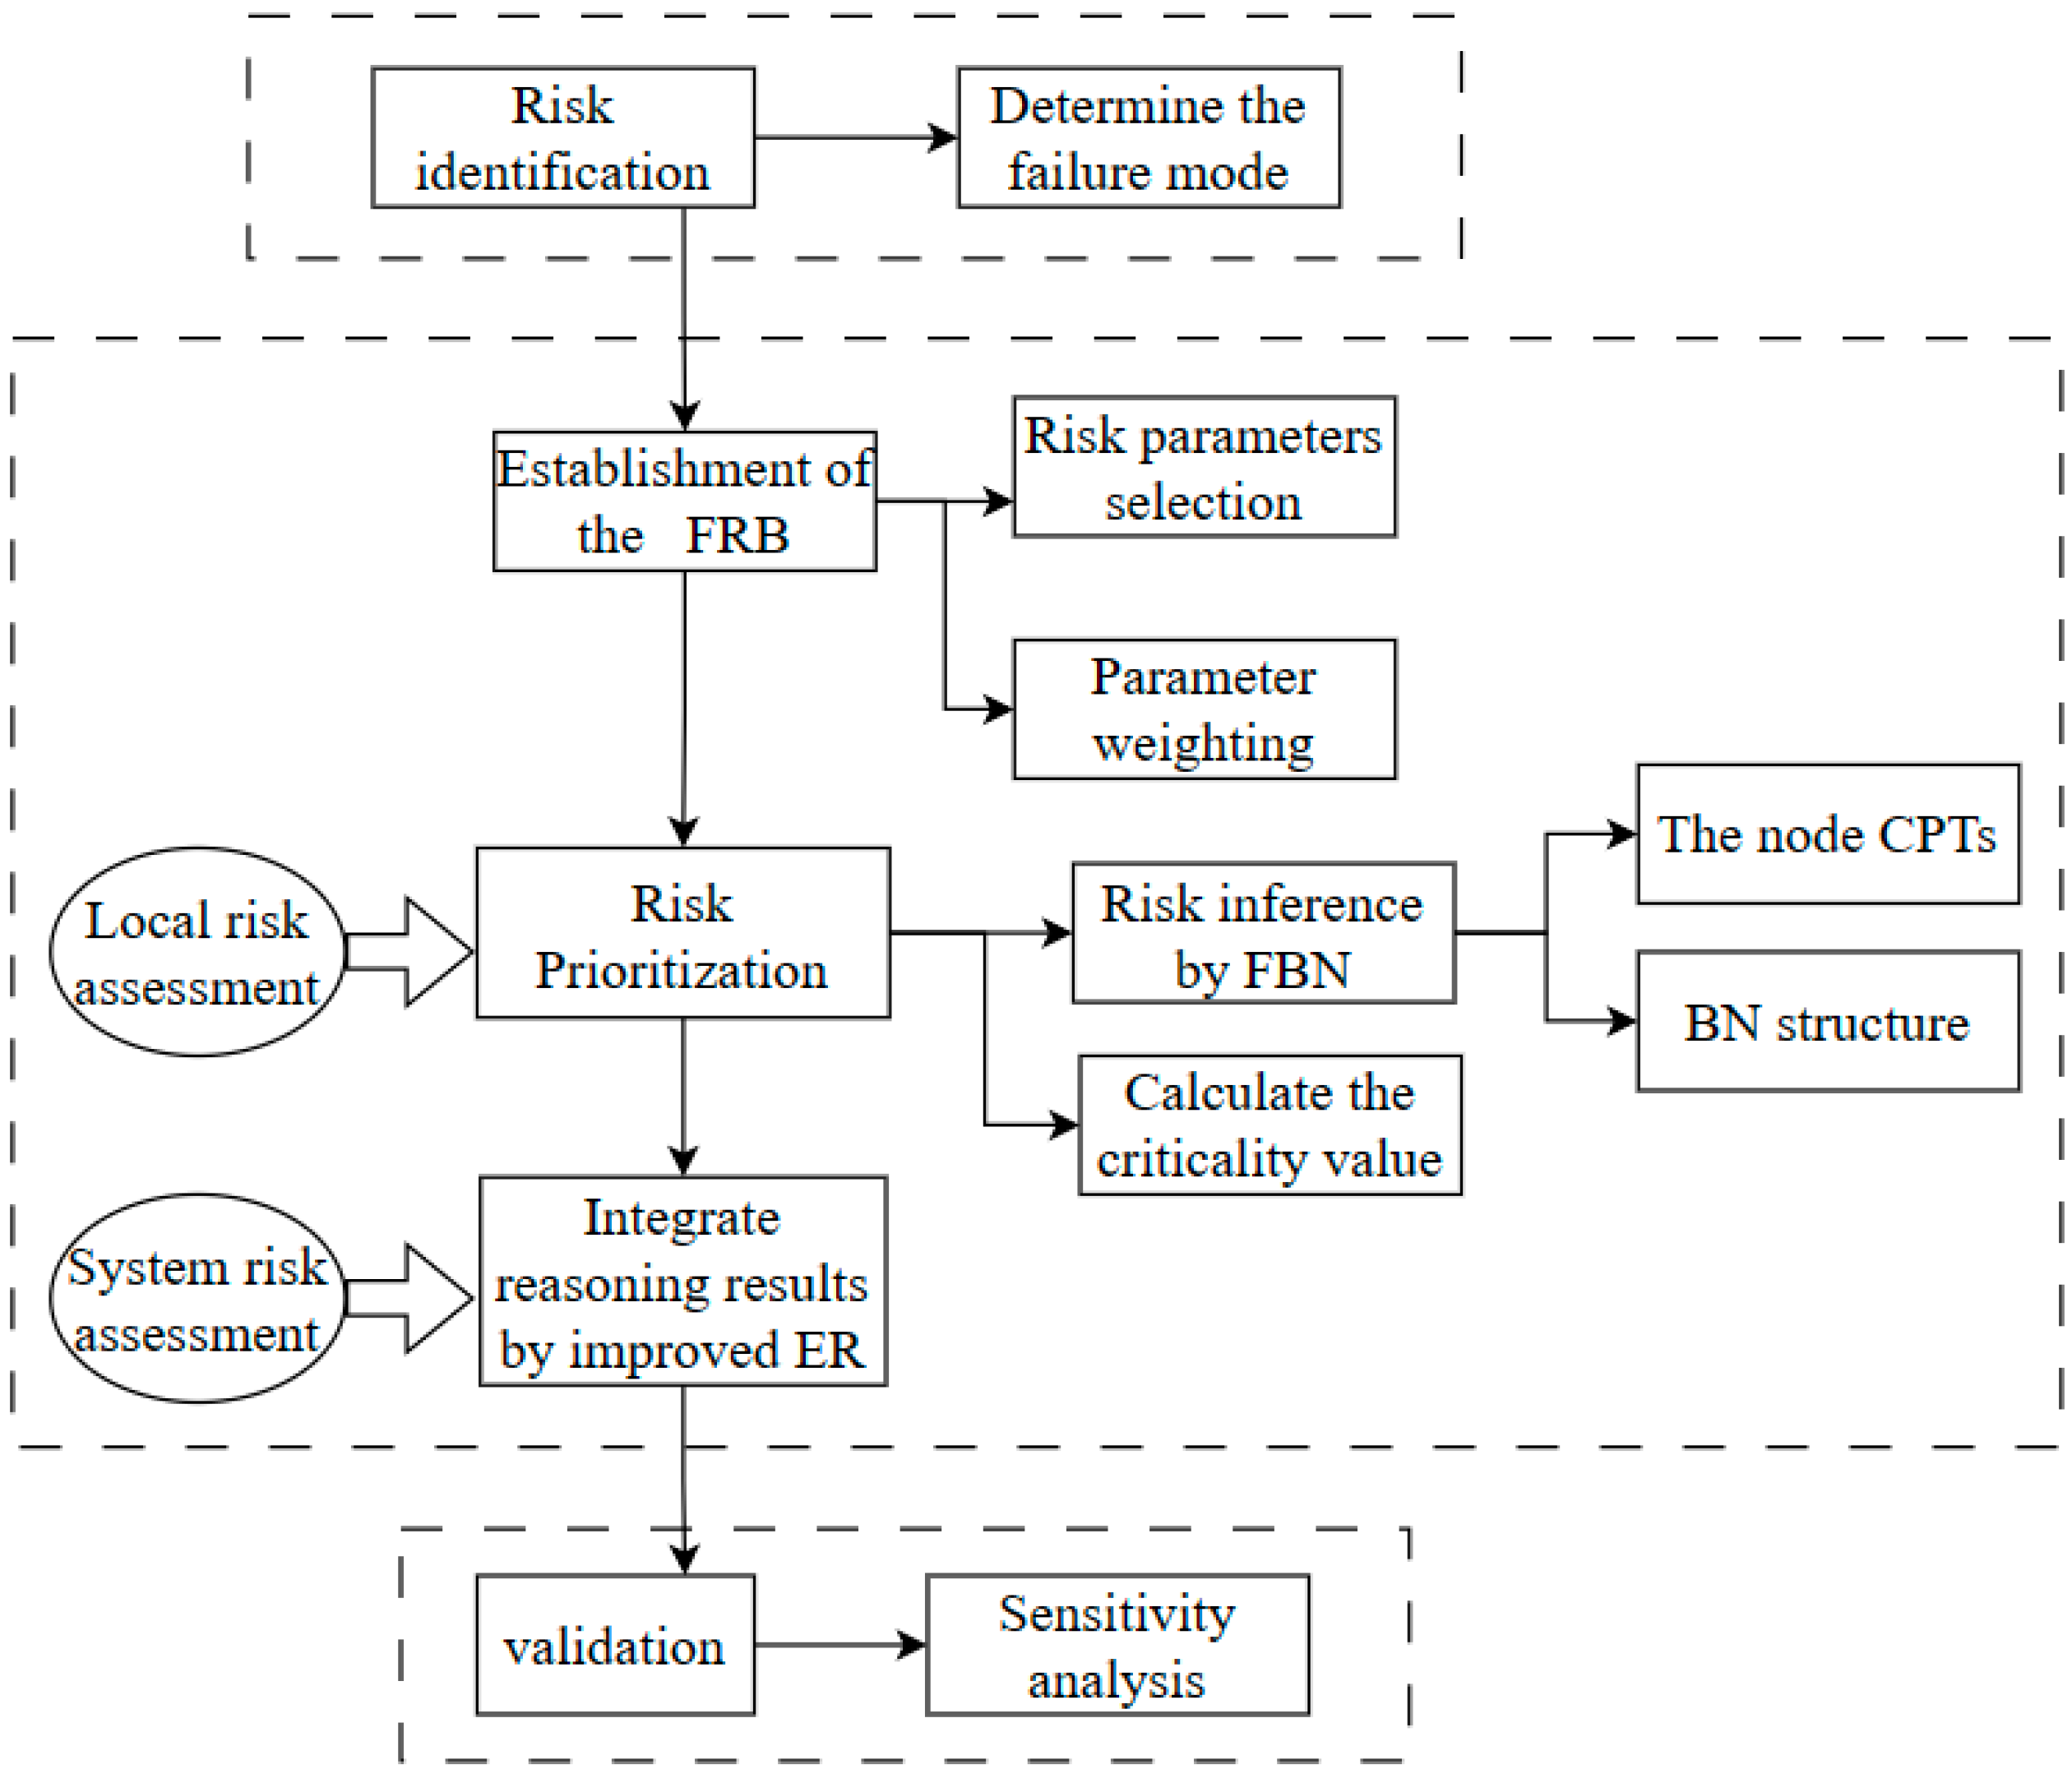
Based on the above research, this paper proposes a systemic risk assessment model combining FBN and improved ER theory based on the improved FMECA (see Figure 1). In this model, a new risk characterization parameter system is constructed, and the parameters are weighted through appropriate methods, while the fuzzy set theory is used to deal with the uncertainty in the expert scoring process. This is accomplished by creating a fuzzy rule-based on the confidence structure, and making full use of Bayesian network reasoning technology, which can effectively obtain an accurate evaluation and clear rating of failure modes. The improved evidence reasoning theory (ER) can effectively integrate the results of fuzzy BN inference to realize the assessment of the system risk.
2. Literature Review
Maritime logistics play an increasingly important service sector role to support the fast development of domestic and international trade. Efficiency and effectiveness are the two critical concerns in logistics management [8]. Efficiency means less spending to achieve more output, while effectiveness means reaching the goal in an uncertain situation. Such goal achievement could make the operations leaner and more efficient, but simultaneously make the logistics vulnerable [9]. Therefore, maritime logistics are exposed to various natural and man-made risks [10]. How to make this a safe operation becomes a more critical issue considering various risk factors and attracting more attention from researchers and practitioners. Research addressing container maritime logistics has grown significantly in recent years. There is little research addressing bulk cargo maritime logistics [11], e.g., nickel mineral, bauxite, grain, etc. This study takes references from broader areas in maritime research.
- (1)
- Maritime Logistics Risk.
Risk is a major influencing factor that could be interpreted as the probability that an event or action may adversely affect the anticipated goal in maritime transportation [12]. Risk identification, analysis, assessment, and mitigation construct the cycle of risk management. Maritime logistics risk management is a decision-making process to minimize the adverse effects of accidental losses based on risk assessment [13]. Compared to traditional risk management, maritime logistics risk management aims to identify and mitigate risks from the perspective of the entire supply chain [14].
Some research focuses on risks related to shipping activities. Siqi Wang et al. [15] identified the risk factors of the dry bulk maritime transportation system from the aspects of people, ships, and cargo, and used the Markov method and the multi-state system method to integrate the probability model of the maritime traffic safety risk state. Jiang, M et al. [16] took the Maritime Silk Road as the research object, and concluded that ship factors are the main factors affecting the occurrence of accidents through an accident data analysis. Øyvind Berle et al. [17] analyzed the failure factors of the dry bulk shipping supply chain from the aspects of supply, capital flow, transportation, communication, internal operation/capacity, and human resources.
There is some research focusing on the risks resulting from the cargo itself. For example, Delyan Shterev [18] studied the safety of liquefiable bulk cargo by sea and pointed out that the relationship between the combined system of ships, cargo, and people can be used to reduce the accidents of liquefiable cargo by sea. Munro and Mohajerani [19] analyzed seven cases of a ship capsizing from the views of cargo fluidization and concluded that the main reason was the excessive moisture of cargo. Ju et al. [11] developed a discrete element method (DEM) to simulate the whole process of liquefaction of fine particle cargo, and identify the key parameters that lead to the liquefaction. Lee [20] analyzed a marine accident caused by nickel ore liquefaction and indicated reducing the risk by changing homogeneous loading into alternate loading through experiments. Daoud, Said, Ennour, and Bouassida [21] combined physical experiments and numerical methods to improve the understanding of cargo liquefaction mechanisms and security in maritime transportation.
- (2)
- Risk Assessment Methods in Maritime Logistics.
Methods developed and applied in maritime logistics risk management can be divided into qualitative and quantitative. Some research highlights managing the uncertainties in assessing the risks in maritime logistics [3,22,23]. Khan et al. [24] proposed an object-oriented Bayesian network to predict the ship–ice collision probability. Wan et al. [3] established a model combined with a belief rule base and Bayesian network to assess the risk of the maritime supply chain considering the data collected were highly uncertain.
Some literature analyzes and assesses the risk in the maritime supply chain from the perspective of visibility, robustness, and vulnerability. For example, because of the fuzziness and uncertainty of the risk assessment by experts, Emre Akyuz et al. [25] adopted the fuzzy number and bow-tie method to carry out a quantitative comprehensive risk analysis on the liquefaction risk of dry bulk carriers. Liu et al. [26] combined a multi-centrality model and robustness analysis model to analyze the vulnerability of the maritime supply chain, and verified the feasibility of the model through the Maersk shipping line in its Asia–Europe route. Zavitsas, Zis, and Bell [27] analyzed the link between the environment and resilience performance of the maritime supply chain and built a framework to reduce operating costs and risks that may disrupt the maritime supply chain. Vilko et al. [28] identified and assessed the risk of multi-modal maritime supply chains from the perspective of visibility and control. Lam and Bai [10] used the quality function deployment approach to improve the resilience of the maritime supply chain.
Much literature related to risk focuses on the specific risk in the container supply chain, especially after the 911 terrorist attacks in 2001 [13,23,29]. With the development of IT technology, more information could be visible on the official website of a shipping company. Cyber-attack has become one of the risk sources; Polatidis, Pavlidis, and Mouratidis [30] proposed a highly parameterized cyber-attack path discovery method to evaluate the risk of dynamic supply chain maritime risk management. This method is more efficient than the traditional method because it can output the most probable paths instead of all paths.
- (3)
- Research Gap.
The above discussion indicates that the risks in a maritime logistics context have aroused academic attention, but still are under research, especially in the bulk cargo maritime logistics risk analysis and assessment. More importantly, most literature focuses on the container supply chain [12,13,22,23] or some specific risk in the container supply chain [13,31]. However, some mineral cargo belongs to fluidization cargo that needs to pay more attention to the water percentage in the cargo, such as bauxite, nickel mineral, etc. Some of them need to ventilate and grain. These kinds of maritime logistics are very different from how the container supply chain lies in the fluidization of cargo to become free surface effect or solid–liquid two separate flow layers while in maritime transportation easily. During maritime transportation, the permeability of cargo is low, owing to human error or bad ventilation, resulting in the water percentage in the cargo being up to the limit value or out of the limit, which could further form a free surface effect. If it happened with bad sea conditions or other natural and man-made disasters, it would be easy to make the ship capsize.
Consequently, this paper aims to develop a systemic risk assessment model combining FBN and improved ER theory based on the improved FMECA and improve the safety of bauxite maritime logistics. To start with, the identification of potential failure modes obtained by the failure mode and effects analysis (FMEA), based on the failure relationships embedded in the failure modes, the Bayesian network construction, and the probability parameter defined are discussed.
3. Construction of Risk Assessment Model for Bauxite Maritime Supply Chain Based on FBN
3.1. Determination of Risk Characterization Parameters
3.1.1. Construction of Risk Characterization Parameter System
Risk characterization parameters are important indicators used to characterize and describe the hazards of failure events. A scientific, reasonable, and complete construction of a risk characterization parameter system is conducive to a more comprehensive and accurate grasp of the characteristics of risk factors and improves the accuracy and reliability of the risk assessment results. Traditional FMECA uses the three parameters of occurrence, the severity of consequences, and detection to characterize risk factors [32]. Given the characteristics of maritime logistics, this paper re-introduces three sub-parameters based on the above three parameters to measure and distinguish the severity parameter S after the occurrence of the risk. Based on this, a relatively complete structure is constructed in the form of a risk parameter index hierarchical structure (risk characterization parameter system (see Figure 2)).
When maritime logistics are affected by an uncertain event, it usually manifests as the normal transportation of ocean logistics being disturbed and the transportation time being delayed. In serious cases, the maritime logistics chain may even be disconnected. For bauxite maritime logistics, it reduces the reliability of maritime logistics services. For time- and temperature-sensitive goods, the consequences of time delays are often more serious than for ordinary goods. Additional costs refer to the increase in a series of additional expenses/costs that are affected by risk factors, such as additional management costs or expenses incurred by risk drivers. Safety and security losses refer to the damage to the physical elements participating in or constituting the maritime logistics after being affected by the failure event, such as personal injury, damage to transported goods, and damage to port infrastructure or ships. To a certain extent, the impact of a risk event on the system can be summarized by the increase in additional costs. This paper aims to measure the consequences’ parameters more comprehensively and in detail from different perspectives such as the physical elements of the system, time, and currency to avoid the unclear description caused by the unified overview.
3.1.2. Risk Parameter Weighting Based on AHP-Entropy Weight Method
Given the obvious hierarchical structure relationships and differences in importance between the constructed risk parameter systems, this paper uses appropriate weight coefficients to quantify the relative importance of different parameters.
- (1)
- AHP
According to the established risk parameter characterization system, the parameters of the same layer are compared in pairs, and a judgment matrix is constructed to express the comparison of the relative importance of the parameters of this layer concerning the parameters of the upper layer. After passing the consistency check, the parameter weight vector is determined by calculating the weight vectors of different experts for the parameters of the same layer, using the arithmetic average method to gather the evaluation results of the experts on the parameters of the same layer to determine the final weight vector of the parameters of the layer. Finally, the weight value of the parameter of the same layer and the weight value of the upper layer parameter to which it belongs are weighted to calculate the comprehensive weight value of the risk parameter in the entire system.
- (2)
- Entropy method
Entropy is a concept derived from thermodynamics and mainly reflects the degree of chaos in the system. The entropy value in information theory reflects the degree of information carried by an indicator. The smaller the entropy value, the greater the degree of dissociation between the data covered by the indicator, the more information the indicator carries, and the greater the corresponding weight value. When using the entropy method to determine the parameter weight vector, it is necessary to combine expert experience to score these parameters. The score is between 1 and 10. The higher the score, the greater the importance of the risk parameter. The steps for calculating the parameter weight vector using the entropy method are as follows [33].
(i) Construction of evaluation matrix
Assuming that m experts evaluate and score n risk parameters, the original evaluation matrix can be formed .
Among them, refers to the evaluation value of the jth risk parameter by the ith expert, .
(ii) Initial matrix normalization
Standardizing the evaluation matrix can ensure the correctness and simplicity of the calculation results. The standardization process is as follows:
The evaluation matrix obtained after standardization is the standard value of the jth risk parameter on the ith expert.
(iii) Calculate the proportion of points
To calculate accurate information entropy, it is necessary to calculate the proportion of points assigned by the ith expert to this parameter under the jth risk parameter.
(iv) Calculate information entropy
The formula for calculating the entropy value of the index is:
The information utility value can be obtained according to the value of information entropy.
(v) Calculate the entropy weight of risk parameters
The larger the information utility value, the more important the parameter, and the greater the weight should be when the parameter is weighted. The formula for calculating the entropy weight of risk parameters is:
- (3)
- Determine the overall weight
The risk parameter weights obtained by the AHP technique can show the importance that decision-makers place on different parameters. The entropy measure can more objectively reflect the information contained in the risk parameter itself when calculating the weight vector. Hence, by combining these two methods to achieve the purpose of effectively combining the advantages of the two, a more scientific and reasonable parameter weight vector can be obtained. The formula for determining the comprehensive weight of parameters using the AHP-entropy weight method is [32]
where and , respectively, represent the parameter weight values obtained according to the AHP and entropy weight method, in which is the preference coefficients, and . Considering that the entropy measure can reduce the deviation caused by human factors to a certain extent, and then combined with the opinions of the expert group, this paper defines the preference coefficient as 0.6. From this, the comprehensive weight vector can be obtained . By issuing questionnaires to domain experts (see Table 1 for expert details), after excluding invalid samples, a total of four valid questionnaires were received. Based on the survey results, a judgment matrix can be further obtained. Then, we conducted a consistency check on the judgment matrix, and the low inconsistency ratios (<0.1) of all pairwise comparisons verified the rationality of the results. It turns out that the calculated weights are consistent. Afterwards, the entropy weight method and AHP were combined to obtain the weight of each risk characterization parameter (as shown in Table 2).
3.2. Determining the Magnitude of Risk Index Based on Fuzzy Logic
3.2.1. Fuzzy Rating Indication
When using the established risk characterization parameter system to assess the hazard of potential risk events in maritime logistics, due to the lack of historical data in the engineering field and the particularity of the risk parameters themselves, in practice, failures are usually evaluated using predetermined scores, thus making a judgment on the event’s severity in a certain aspect. The classification of the characteristic parameters of dangerous events is often a vague concept, usually relying on expert experience to give low, relatively low, high, relatively high, and other vague language judgments, and determining the corresponding evaluation level based on the vague language. Therefore, the fuzzy set theory is introduced into the determination of parameter levels that rely on expert ratings to ensure that the quantitative results of risk parameters are more accurate and in line with the actual situation. Experts give an evaluation level to the parameters according to the pre-defined fuzzy rating set and then construct the fuzzy number according to the membership function. Common membership functions include triangles and trapezoids.
According to the relevant literature, the shape of the membership function has a significant impact on the outcomes of fuzzy operations, and triangular and trapezoidal fuzzy numbers are thought to be more efficient [34]. Among them, trapezoidal fuzzy numbers can be turned into crisp values, interval numbers, and triangular fuzzy numbers by adjusting parameters, which can intuitively explain fuzzy variables [35]. Hence, the trapezoidal membership function is more scalable and widely applicable in the decision-making of complex problems [36]. Since the trapezoidal membership function is more in line with the objective evaluation situation, the trapezoidal fuzzy number is used to deal with the linguistic variables of the expert evaluation.
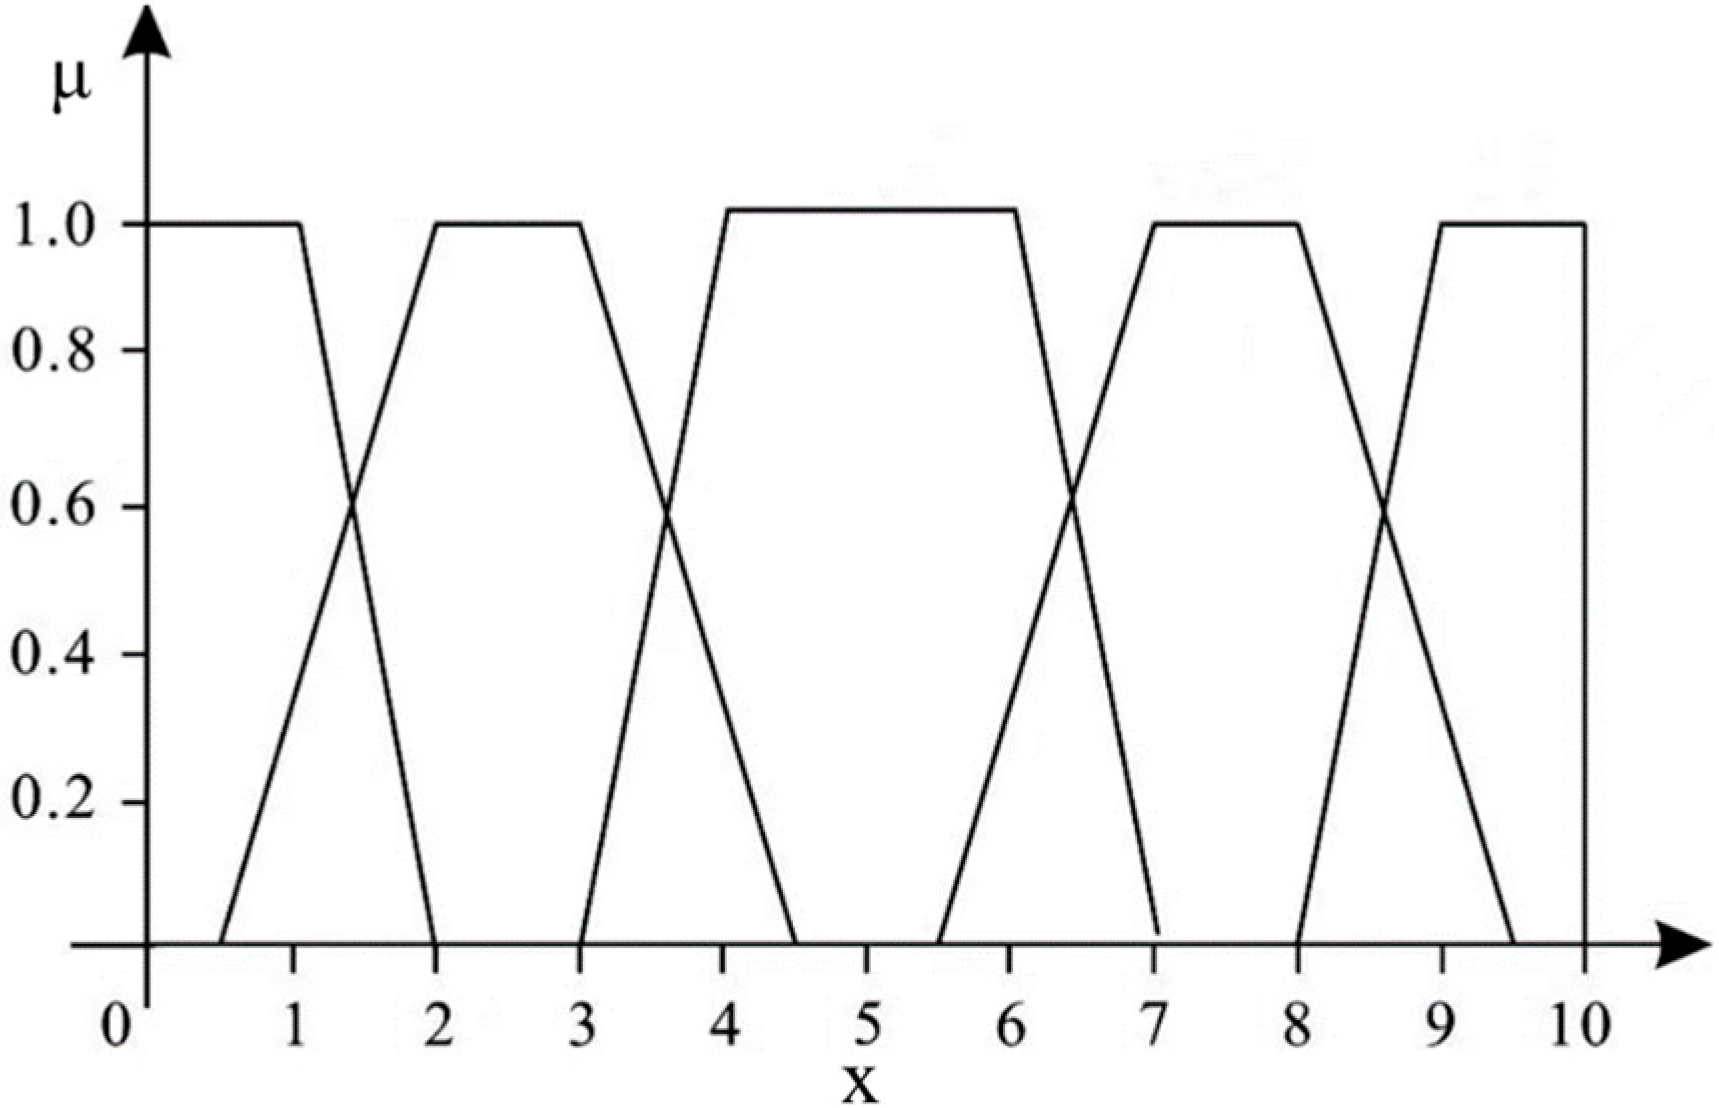
Assuming that real numbers a, b, c, and d (a < b = c < d) form the four endpoints of the trapezoidal fuzzy number, then its membership function μ (x) can be defined as follows:
Before the expert rating, it is necessary to define the fuzzy rating set with the attribute level and the corresponding membership function. This paper divides the constructed risk characterization parameter variables into five levels. The different level attributes of the corresponding parameters, linguistic variables, and corresponding fuzzy numbers are shown in Table 3, Table 4, Table 5, Table 6 and Table 7. The rating variables of these five parameters are represented by trapezoidal fuzzy numbers. Among them, the probability of the occurrence of failure, the degree of detection, and the variables that characterize the consequences of time delay, additional cost, and safety and security loss corresponding to the rating standard belong to the membership function as shown in Figure 3.
3.2.2. Fuzzy Rating Result Calculation
After obtaining the evaluation value given by the expert in the form of a trapezoidal fuzzy number (see Table 1 for expert details), the evaluation information among different experts is integrated with the help of an uncertain ordered weighted averaging (UOWA) operator. This method determines the weight of the experts by comparing the degree of difference between the fuzzy number of the evaluation value given by each expert and the average fuzzy number obtained by combining the opinions of different experts. The specific calculation method is as follows.
There is an expert group composed of n experts to evaluate a certain type of failure mode, and convert the evaluation level of the Kth expert to the ith parameter variable into the j trapezoidal fuzzy number as , among, . j = (1, 2, 3, 4, 5), K = (1, 2 … n). The following uses the UOWA operator to synthesize the fuzzy number of the evaluation opinions of the experts.
- (1)
- Calculate the arithmetic mean of the trapezoidal fuzzy numbers as , among:
- (2)
- Calculate and measure the distance between .
- (3)
- Calculate the similarity between and . For trapezoidal fuzzy numbers , if is their mean value, thenis the similarity between the trapezoidal fuzzy number and the arithmetic mean of the trapezoidal fuzzy array
- (4)
- Fuzzy number assembly.
The aggregation method of UOWA operators can synthesize the fuzzy number of different expert evaluation values to obtain the final result.
Among them, is defined as the weight coefficient.
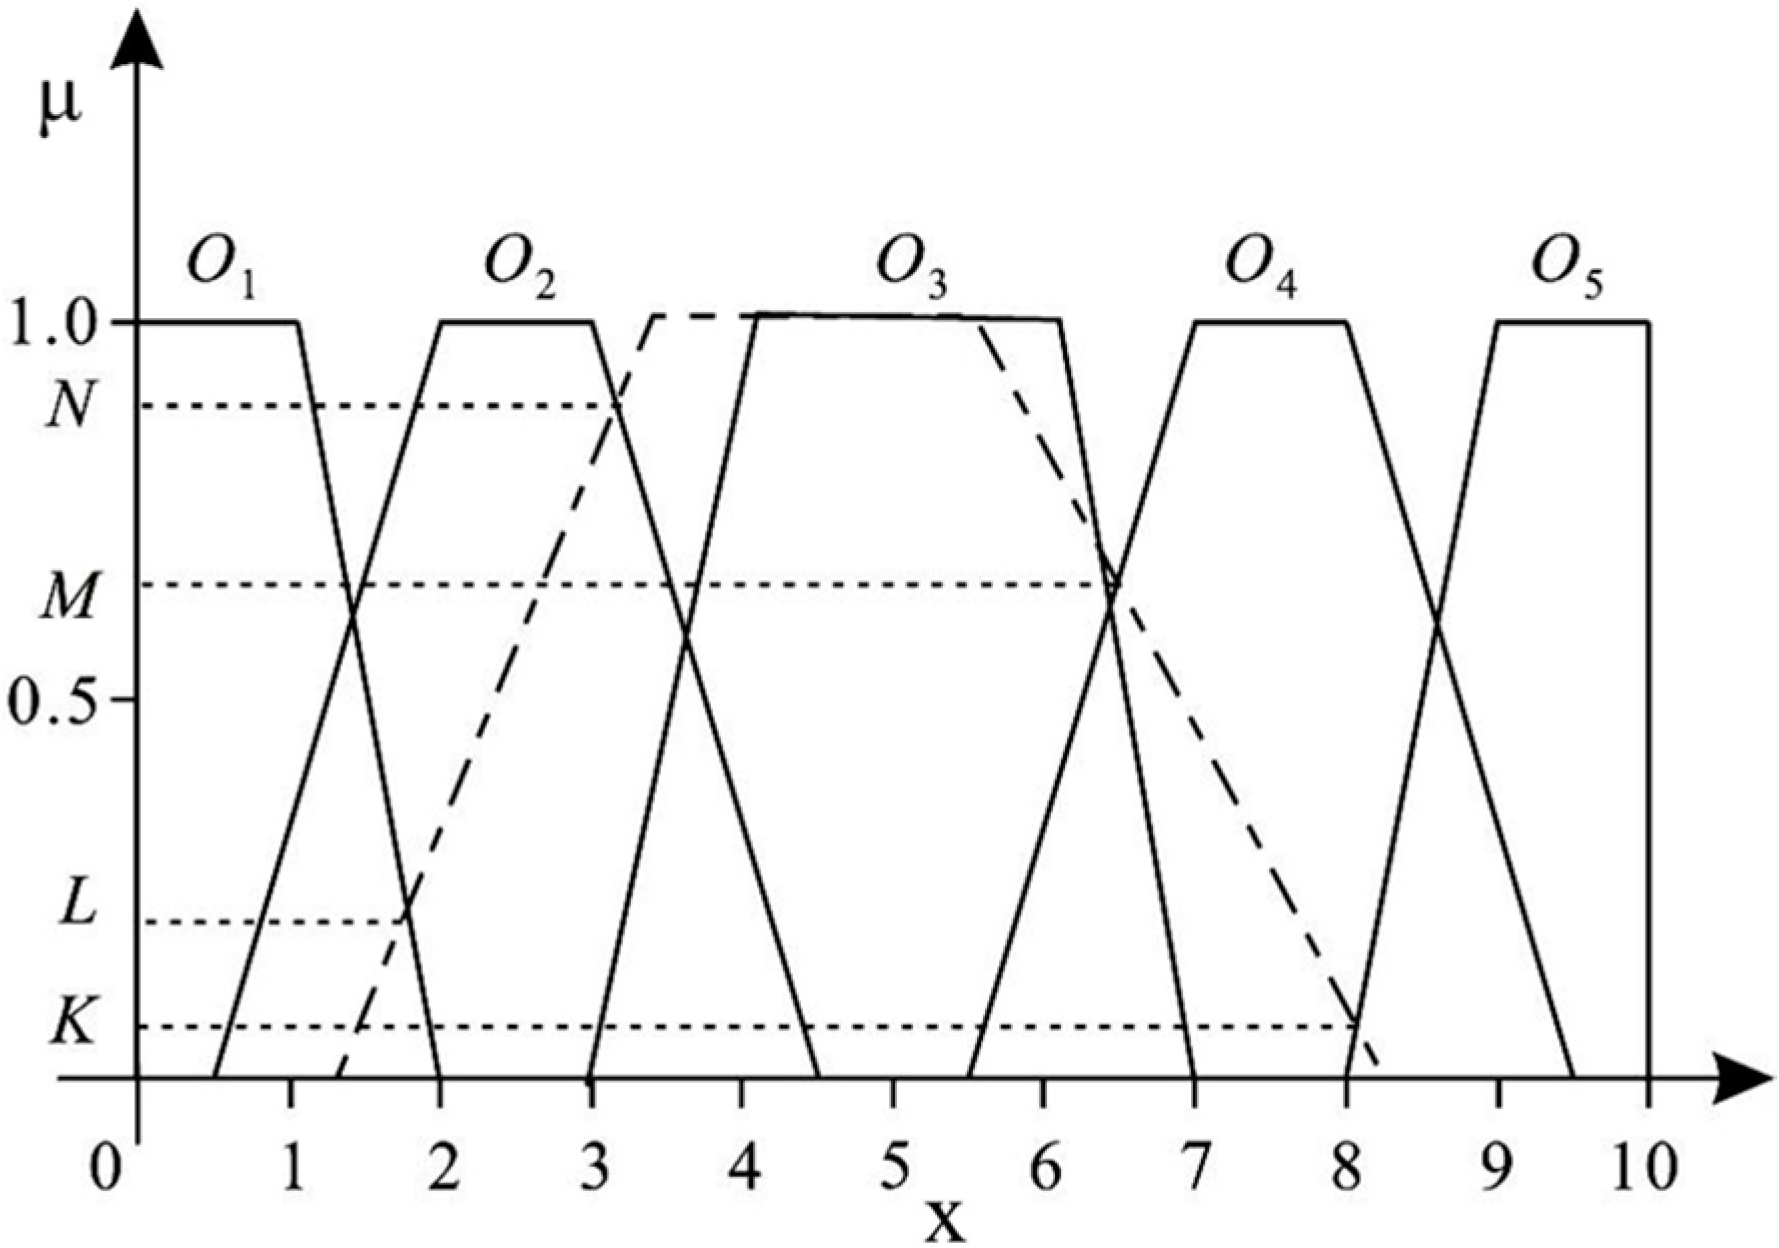
After using the UOWA operator to gather expert evaluation opinions, the result obtained is still a trapezoidal fuzzy number. By combining it with the membership function, the fuzzy evaluation results of different parameters under a specific failure mode after comprehensive expert opinions can be obtained. The specific conversion process is shown in Figure 4.
By combining the fuzzy number of the fuzzy rating evaluated by the expert group with the membership function of each attribute rating, the membership degree corresponding to the highest point is obtained, and finally, the fuzzy parameter variable set of the corresponding attribute evaluation is obtained. According to this method, the fuzzy set of each risk attribute parameter can be obtained, respectively. As shown in Figure 4, the dotted line represents the trapezoidal fuzzy number obtained after gathering expert opinions. The fuzzy number intersects with the figure , and the abscissas of the highest intersection point are , respectively. The fuzzy set for the occurrence probability level O formed by this is:
Which can also be expressed as , and among them, . By normalizing the set of fuzzy membership degrees, the prior probability evaluation value of the risk factor under specific parameters can be obtained.
3.3. Identification of Failure Mode of Bauxite Ocean Maritime Logistics
Bauxite maritime logistics refer to the entire logistics process of goods transported by sea from the port of departure to the port of destination. From the perspective of transportation elements, it can be divided into transportation nodes and transportation routes. Transportation nodes include bauxite export ports, hub trans-shipment ports, and destination ports. The risk of ships at port nodes is mainly due to subjective human factors. Transportation routes refer to specific transportation processes other than non-transport nodes. Ships will suffer risks due to interference from the external environment, cargo status, the ship’s operating conditions, and crews during the voyage. To ensure the scientificity, objectivity, and rationality of the selected risk factors, this paper consults with experienced experts in the industry field and consults relevant materials to obtain the main potential risk factors of China’s imported bauxite maritime logistics (see Table 8).
Among these failure modes, the first one is related to bauxite transit reliability. Guinea has been China’s largest source of imported bauxite in recent years. However, the domestic political situation in Guinea is unstable, and worker riots or port strikes have occurred from time to time. For example, in September 2017, riots broke out in the Bokeh bauxite area of Guinea. Protesters exchanged fire with the police, and bauxite production activities were severely hindered. This kind of failure mode can cause injuries or damage to cargo and equipment, delaying ships, and causing severe production standstills and supply disruptions.
The second failure mode is related to the port’s loading and unloading capacity and the arrival of ships. Once the port is congested, it will inevitably lead to a delay in the transportation of bauxite, which will lead to an increase in transportation costs; the third failure mode is related to the transport personnel, i.e., the crew themselves. In general, operational errors caused by a lack of safety awareness or lack of emergency response skills, and the crew’s mental health problems caused by long-term sea voyages will all have a certain impact on maritime transportation.
The fourth failure mode occurs during the transportation of goods. On China’s bauxite import route from Guinea in West Africa to Yantai in Shandong, the Gulf of Guinea and the Strait of Malacca are almost the only way to go. However, pirate attacks often occur in these areas. This kind of situation is bound to bring huge property losses and casualties. The fifth failure mode is related to the natural environment. Bad sea conditions (such as heavy rain, typhoon, tsunami, etc.) will have a huge impact on the normal navigation of the ship. In severe cases, the ship will capsize, and the safety of the crew will be threatened.
The sixth failure mode is related to the cargo itself. Since the bauxite contains a certain amount of water during the actual transportation, it is easy to fluidize during the bumpy transportation at sea to form a free surface effect, thereby reducing the stability of the ship and causing the loss of cargo or the hull of the ship to capsize. The seventh failure mode is caused by the transport ship. The performance of the ship is degraded due to the aging of the ship’s operating facilities or equipment or the hidden danger of the ship’s hull structure and integrity, which make it easy to cause failures in the process of cargo transportation and to capsize.
3.4. Constructing a Fuzzy Rule Database System Based on a Confidence Structure
In the process of establishing the traditional fuzzy rule base, IF-THEN rules are used to express the association between the attribute of the premise and the attribute of the conclusion. A basic fuzzy rule base consists of a series of simple IF-THEN rules. Although the established fuzzy rule base can express the fuzzy situation, it is difficult to reflect the slight change of the premise attributes in the conclusion part. Moreover, due to insufficient expert experience and evidence, it is difficult to maintain a completely deterministic relationship between the attributes of the premise and the conclusion. Therefore, the fuzzy rule base form based on the confidence structure is adopted, and the confidence degree is used to express the degree of trust in the conclusion part under the given preconditions. represents the first category of the jth antecedent attribute in the created Kth fuzzy rule, M represents the total number of antecedent attributes, L represents the total number of rules in the fuzzy rule base, indicates the type of i conclusion, and its corresponding confidence is . Under the condition of entering the a priori attribute, if , it indicates that the Kth rule created is complete, if , it means that the input condition attribute cannot be judged.
According to the characteristics of the constructed FBN, it is necessary to construct a fuzzy rule base based on the confidence structure of the risk parameters C and S, respectively. This paper takes the fuzzy rule base of creating C parameters as an example to introduce the process of creating the rule base. In the process of creating the rule base, the parameters O, S, and D are used as the antecedent attributes, taking the criticality of the failure C as the conclusion attribute to create a fuzzy rule base based on the confidence structure. , among them, the variables are used to estimate the criticality of failure modes, and , are expressed as “low, relatively low, medium, relatively high, and high”.
The determination of the confidence level in the rule base can be based on the accumulated knowledge of past events or subjective experience from domain experts. The former method often requires a large amount of objective data to support, and the knowledge of domain experts is used to reasonably determine all the rules in the rule base. Confidence is often subjective and difficult, especially when faced with a large rule base. Given this situation [7], a proportional method is proposed to ensure the rationalization of the confidence distribution in the rule base. However, the main drawback of this method is that it does not consider the impact of parameter weights. When building the confidence of the rule base, this paper uses the proportional method to determine the confidence distribution based on the importance of each risk parameter. In the process of creating this rule base, all the attribute parameters in the IF part and the THEN part are described by five grade variables. Therefore, the confidence of a certain grade variable in the conclusion attribute parameter can be determined by making the antecedent attributes’ variables belong to the same normalized weights of the risk parameters of the grade variables that are summed. Since the antecedent attribute contains three five-valued risk parameters, the constructed fuzzy rule library based on the confidence structure has a total of 125 rules. Due to space limitations, only some of the rules in the rule base are listed in Table 9.
3.5. Bayesian Network Construction
Because the Bayesian network has a good ability to describe the uncertain non-linear relationship between events, it can handle the fuzzy rule base system based on the confidence structure well, and it has efficient reasoning ability. Therefore, this paper will use Bayesian network inference technology to describe and implement the fuzzy rules based on the confidence structure.
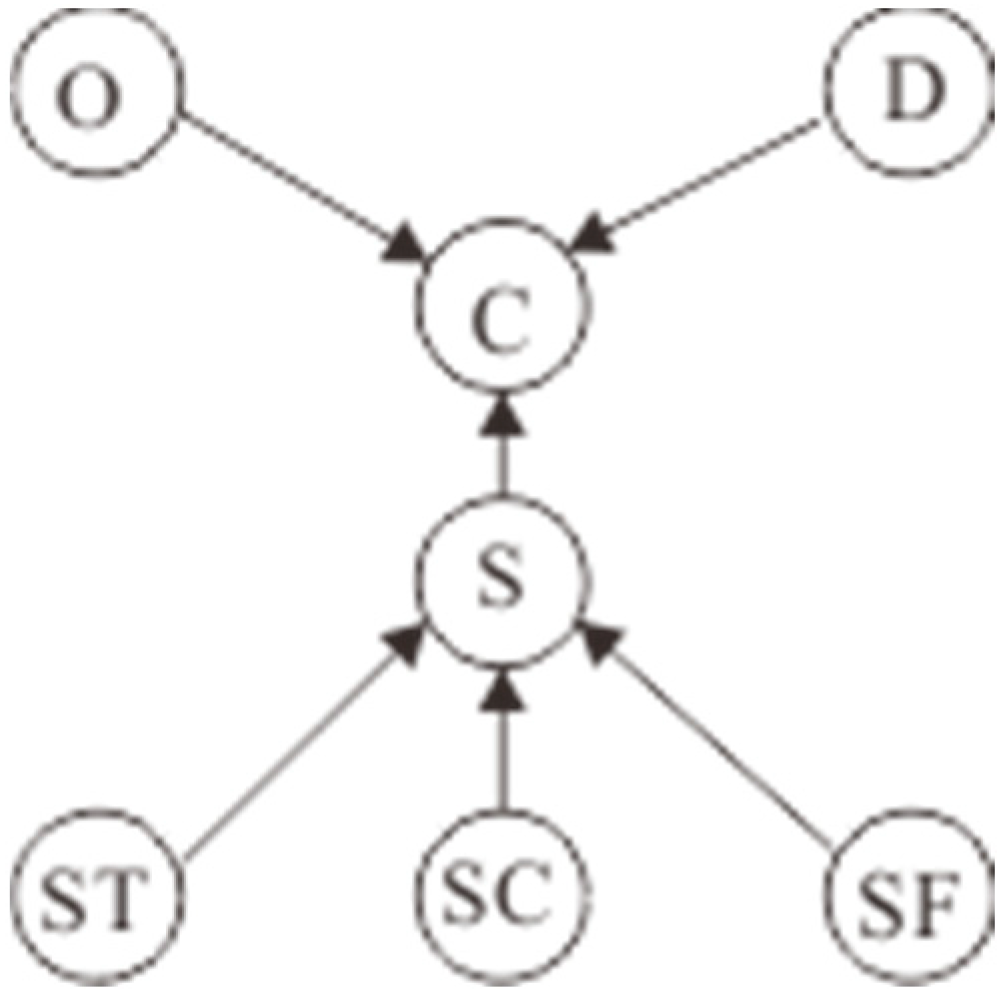
Based on the relationship between the characteristic attributes of the failure mode, combined with the constructed risk parameter characterization system, the definition takes the failure occurrence degree O, the detection degree D, and the parameter time delay ST, additional cost SC, and safety and security cost SF that characterize the degree of risk consequence as the root node, taking the consequence severity S as the intermediate node, and the failure mode criticality C as the leaf node to construct the topology model shown in Figure 5.
To make better use of BN for reasoning, the fuzzy rule library based on the confidence structure needs to be transformed into the form of a conditional probability table. Taking rule 2 in Table 10 as an example, the following transformation can be carried out. That is, given O1, S1, and D2, the probability of child node is , or it can be expressed as . Therefore, the fuzzy rule library of the confidence structure can be transformed into the form of the conditional probability distribution.
After the rule base is transformed into the created BN to describe the conditional probability distribution of the correlation degree between nodes, the analysis of the criticality of the failure mode is transformed into the calculation of the edge probability of the child node C. According to the method in Section 2, the expert evaluation opinions are represented in the form of trapezoidal fuzzy numbers and processed and transformed. The parameter variables can be assigned to different linguistic variables in the form of membership degrees, and finally discrete fuzzy subset forms, O, D, ST, SC, and SF. In the BN reasoning process, the sum of the probability values of different states of all nodes must meet the condition equal to 1; therefore, the membership degrees of the different states of the root node need to be normalized, and the formula is as follows.
Among them, is the confidence value of the state of the ith node parameter before normalization, and n is the total number of node parameter states. After normalization, the prior probability values of the different state variables of the root node parameters can be obtained, from which the probability distribution of the intermediate nodes can be calculated, . Next, the edge probability of node NC can be obtained, .
3.6. Use the Utility Function to Sort the Criticality
To determine the criticality level of each failure mode, it is necessary to sort the criticality of each failure mode and clarify the criticality between different failure modes to help managers quickly and accurately make differentiated management strategies. The criticality of each failure mode obtained by using FBN reasoning is given in the form of fuzzy subsets. Therefore, it is necessary to convert the multi-index risk status value of each risk factor into a clear value for sorting. Therefore, we need to use an appropriate utility function vector to quantify the degree of difference between different risk states, to achieve the overall judgment of the criticality level of the failure mode. Using the utility function U to clarify the criticality of the failure mode is as follows.
This paper takes the utility function vector .
3.7. Maritime Logistics System Risk Assessment
The use of FBN can only evaluate the criticality from the failure mode itself, and it cannot effectively evaluate the system risk level. Based on this, the improved ER theory is used to fuse the evaluation results of the hazard degree of each failure mode, and the linguistic variables represented by the confidence structure are used as the input value of the ER to calculate the maritime logistics system risk, and to achieve the purpose of evaluating the maritime logistics system risk from an overall perspective.
ER is an important uncertainty reasoning method, which is widely used in information fusion, expert systems, fault diagnosis, and the military. It can better represent uncertain information and synthesize expert opinions. However, the traditional ER theory has the problems of “conflict of evidence” and “robustness”. Therefore, we use the DS synthesis algorithm based on the weight assignment and matrix analysis to overcome the limitations of traditional ER to merge the results of each failure mode inferred by FBN [37]. Assuming that the evaluation results of three risk factors are integrated, the evaluation level is above the five levels, and the identification framework , the evaluation results of the three risk factors are shown in Table 11.
- (1)
- The steps of the DS evidence fusion method based on weight distribution and the matrix analysis are as follows: assuming that the matrix , multiply A by B, transpose of the matrix, and obtain the matrix M1.
- (2)
- In the matrix M1, the sum of the non-main diagonal elements is the degree of conflict between the risk factors A and B.
The column matrix formed by the main diagonal elements of M1 should be multiplied with matrix C to obtain matrix M2.
Then, the conflict degree K of the three types of risk factors is the sum of all non-main diagonal elements of the matrix M1 and M2. Following the same steps, a limited number of remaining risk factors can be merged, and the conflict degree K of all risk factors can be obtained.
- (3)
- Use the improved synthetic formula for weight distribution to calculate the following.
3.8. Sensitivity Analysis
When a new model is proposed and constructed, it needs to go through rigorous testing to verify the reliability and rationality of the proposed model. Especially when it involves a subjective judgment belief structure, the validity of the model is more necessary. A sensitivity analysis is used to study the sensitivity of input to output variables. The input variables can be either parameters or variables. In this research, the confidence parameter corresponding to the root node variable of FBN is used as the input part, and the focus is on the input parameters and the degree to which the change in confidence affects the confidence level of the failure mode. If the constructed FBN is reasonable, the sensitivity analysis should at least satisfy the following two axioms [7].
Axiom 1.
A slight increase/decrease in the prior subjective probability of each input node should result in a relative increase/decrease in the posterior probability value of the output node.
Axiom 2.
The total magnitude of the influence of the combination probability change from the x attribute (evidence) on the risk priority value should always be greater than the influence from the attribute (sub-evidence) set.
4. Risk Assessment of Bauxite Maritime Logistics
4.1. Failure Mode Criticality Assessment
To obtain the prior probability of risk events more accurately, this paper uses expert judgment to issue questionnaires to four business managers and researchers who have been engaged in bauxite transportation for a long time. In the questionnaire, these experts need to separately evaluate the identified failure modes. The content of the assessment includes five risk parameters and their fuzzy language variable rating levels. Taking the risk factor “worker riot or strike” as an example, Table 12 shows the evaluation of the failure mode by four experts under the five risk parameters. Using the evaluation result of the UOWA operator comprehensive expert group to obtain the assembled trapezoidal fuzzy number, according to the membership function graph of the risk parameter level, the ordinate of the highest point intersected by the trapezoid corresponding to each parameter level is obtained. After normalization, the prior probability distribution of the failure mode under different risk parameters can be obtained. Similarly, the prior probability distributions of all failure modes concerning each parameter can be obtained.
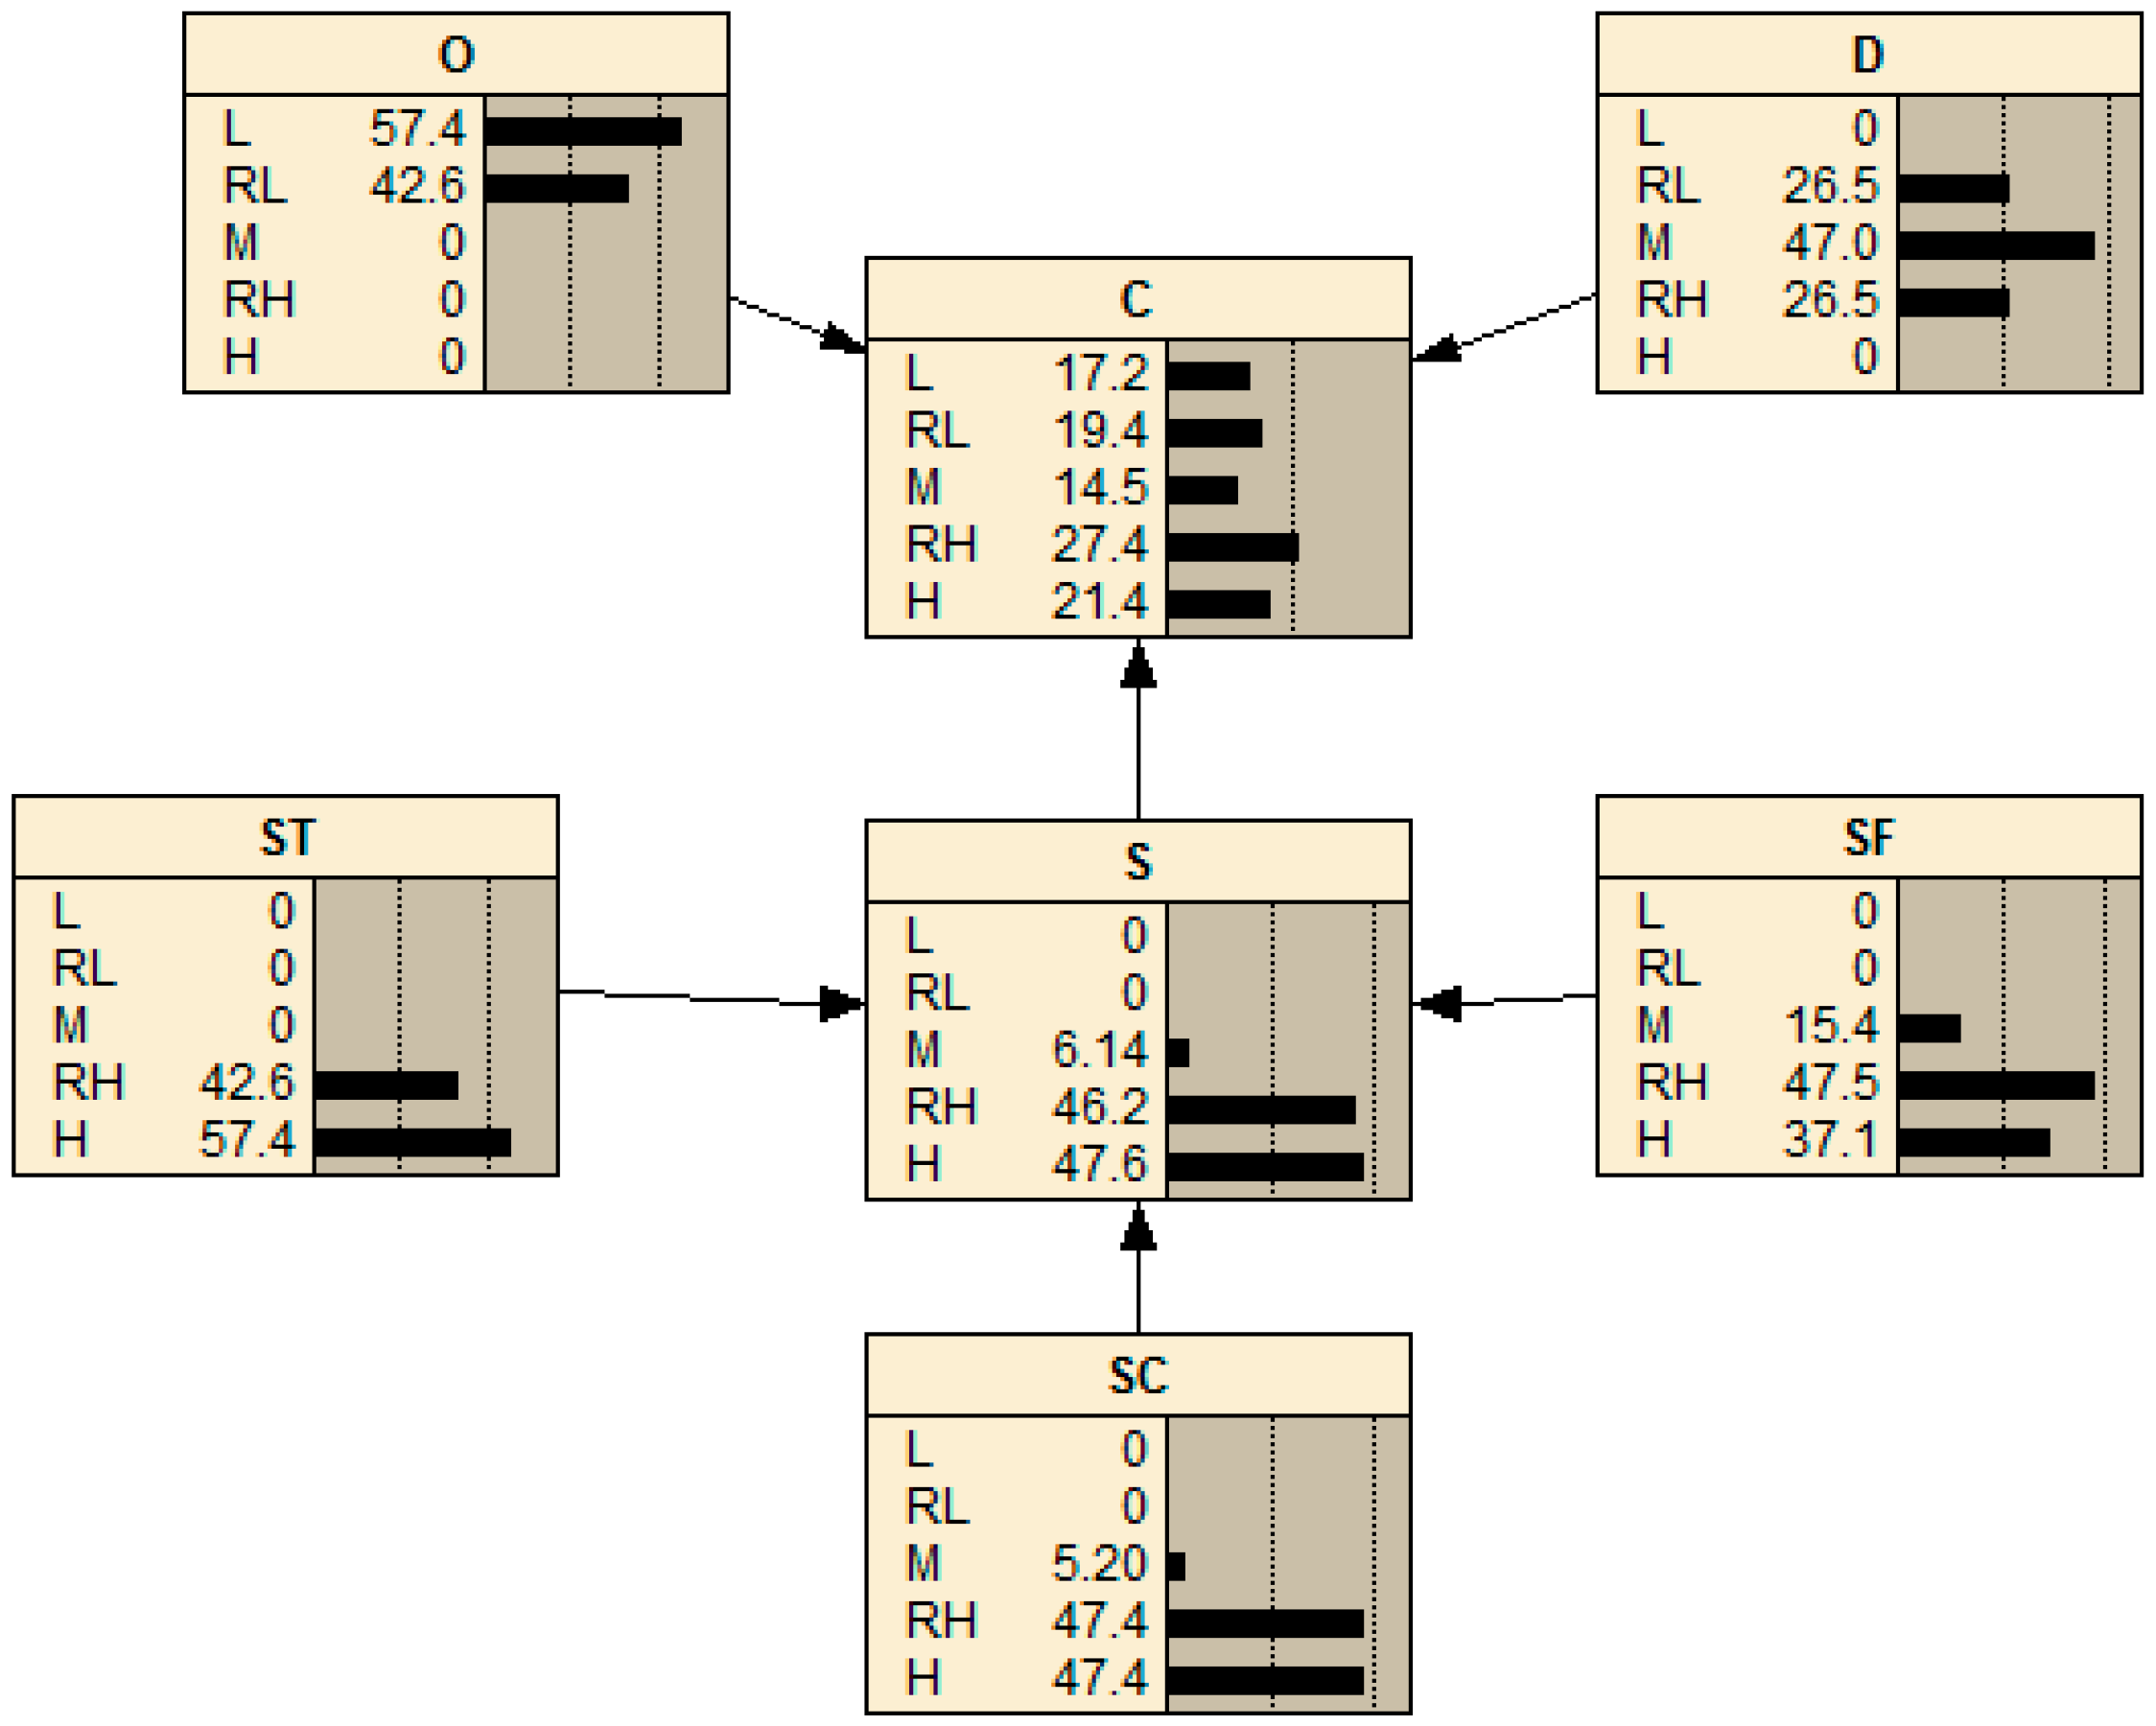
After obtaining the prior probability of the root node of the FBN topology structure under different failure modes, combined with the established fuzzy rule base system, the criticality assessment result of the failure mode can be calculated using Equation (13). The specific calculation can be operated by the software Netica. Figure 6 shows the evaluation result of the risk factor “worker riot or strike” using the software for risk reasoning, and the risk status of the risk factor . That is, the confidence level of the “low” risk status is 17.2%, the “relatively low” confidence is 19.4%, the “medium” confidence is 14.5%, the “relatively high” confidence is 27.4%, and the “high” confidence is 21.4%. In the software, any risk input modification related to the five risk parameters can trigger the change of the node state, which helps to automatically conduct a real-time risk assessment of any target risk factor in the bauxite maritime logistics link.
The risk status of the risk factors expressed in language variables needs to be further clarified by utility functions to prioritize the risks. The risk assessment value of the risk factor “worker riots” can be expressed as the utility function vector calculation in Section 3.4 . Similarly, the values of other risk factors’ CI can be obtained, and the results obtained according to the constructed risk assessment model are shown in Table 13. In the bauxite maritime supply chain, the hazard level of risk factors is ranked in order . It can be analyzed from the CI value that “pirate or terrorist attacks” and “worker riots” are the most harmful, and they are the key risk factors affecting the reliability of bauxite maritime logistics links.
4.2. Risk Assessment of Bauxite Maritime Logistics System
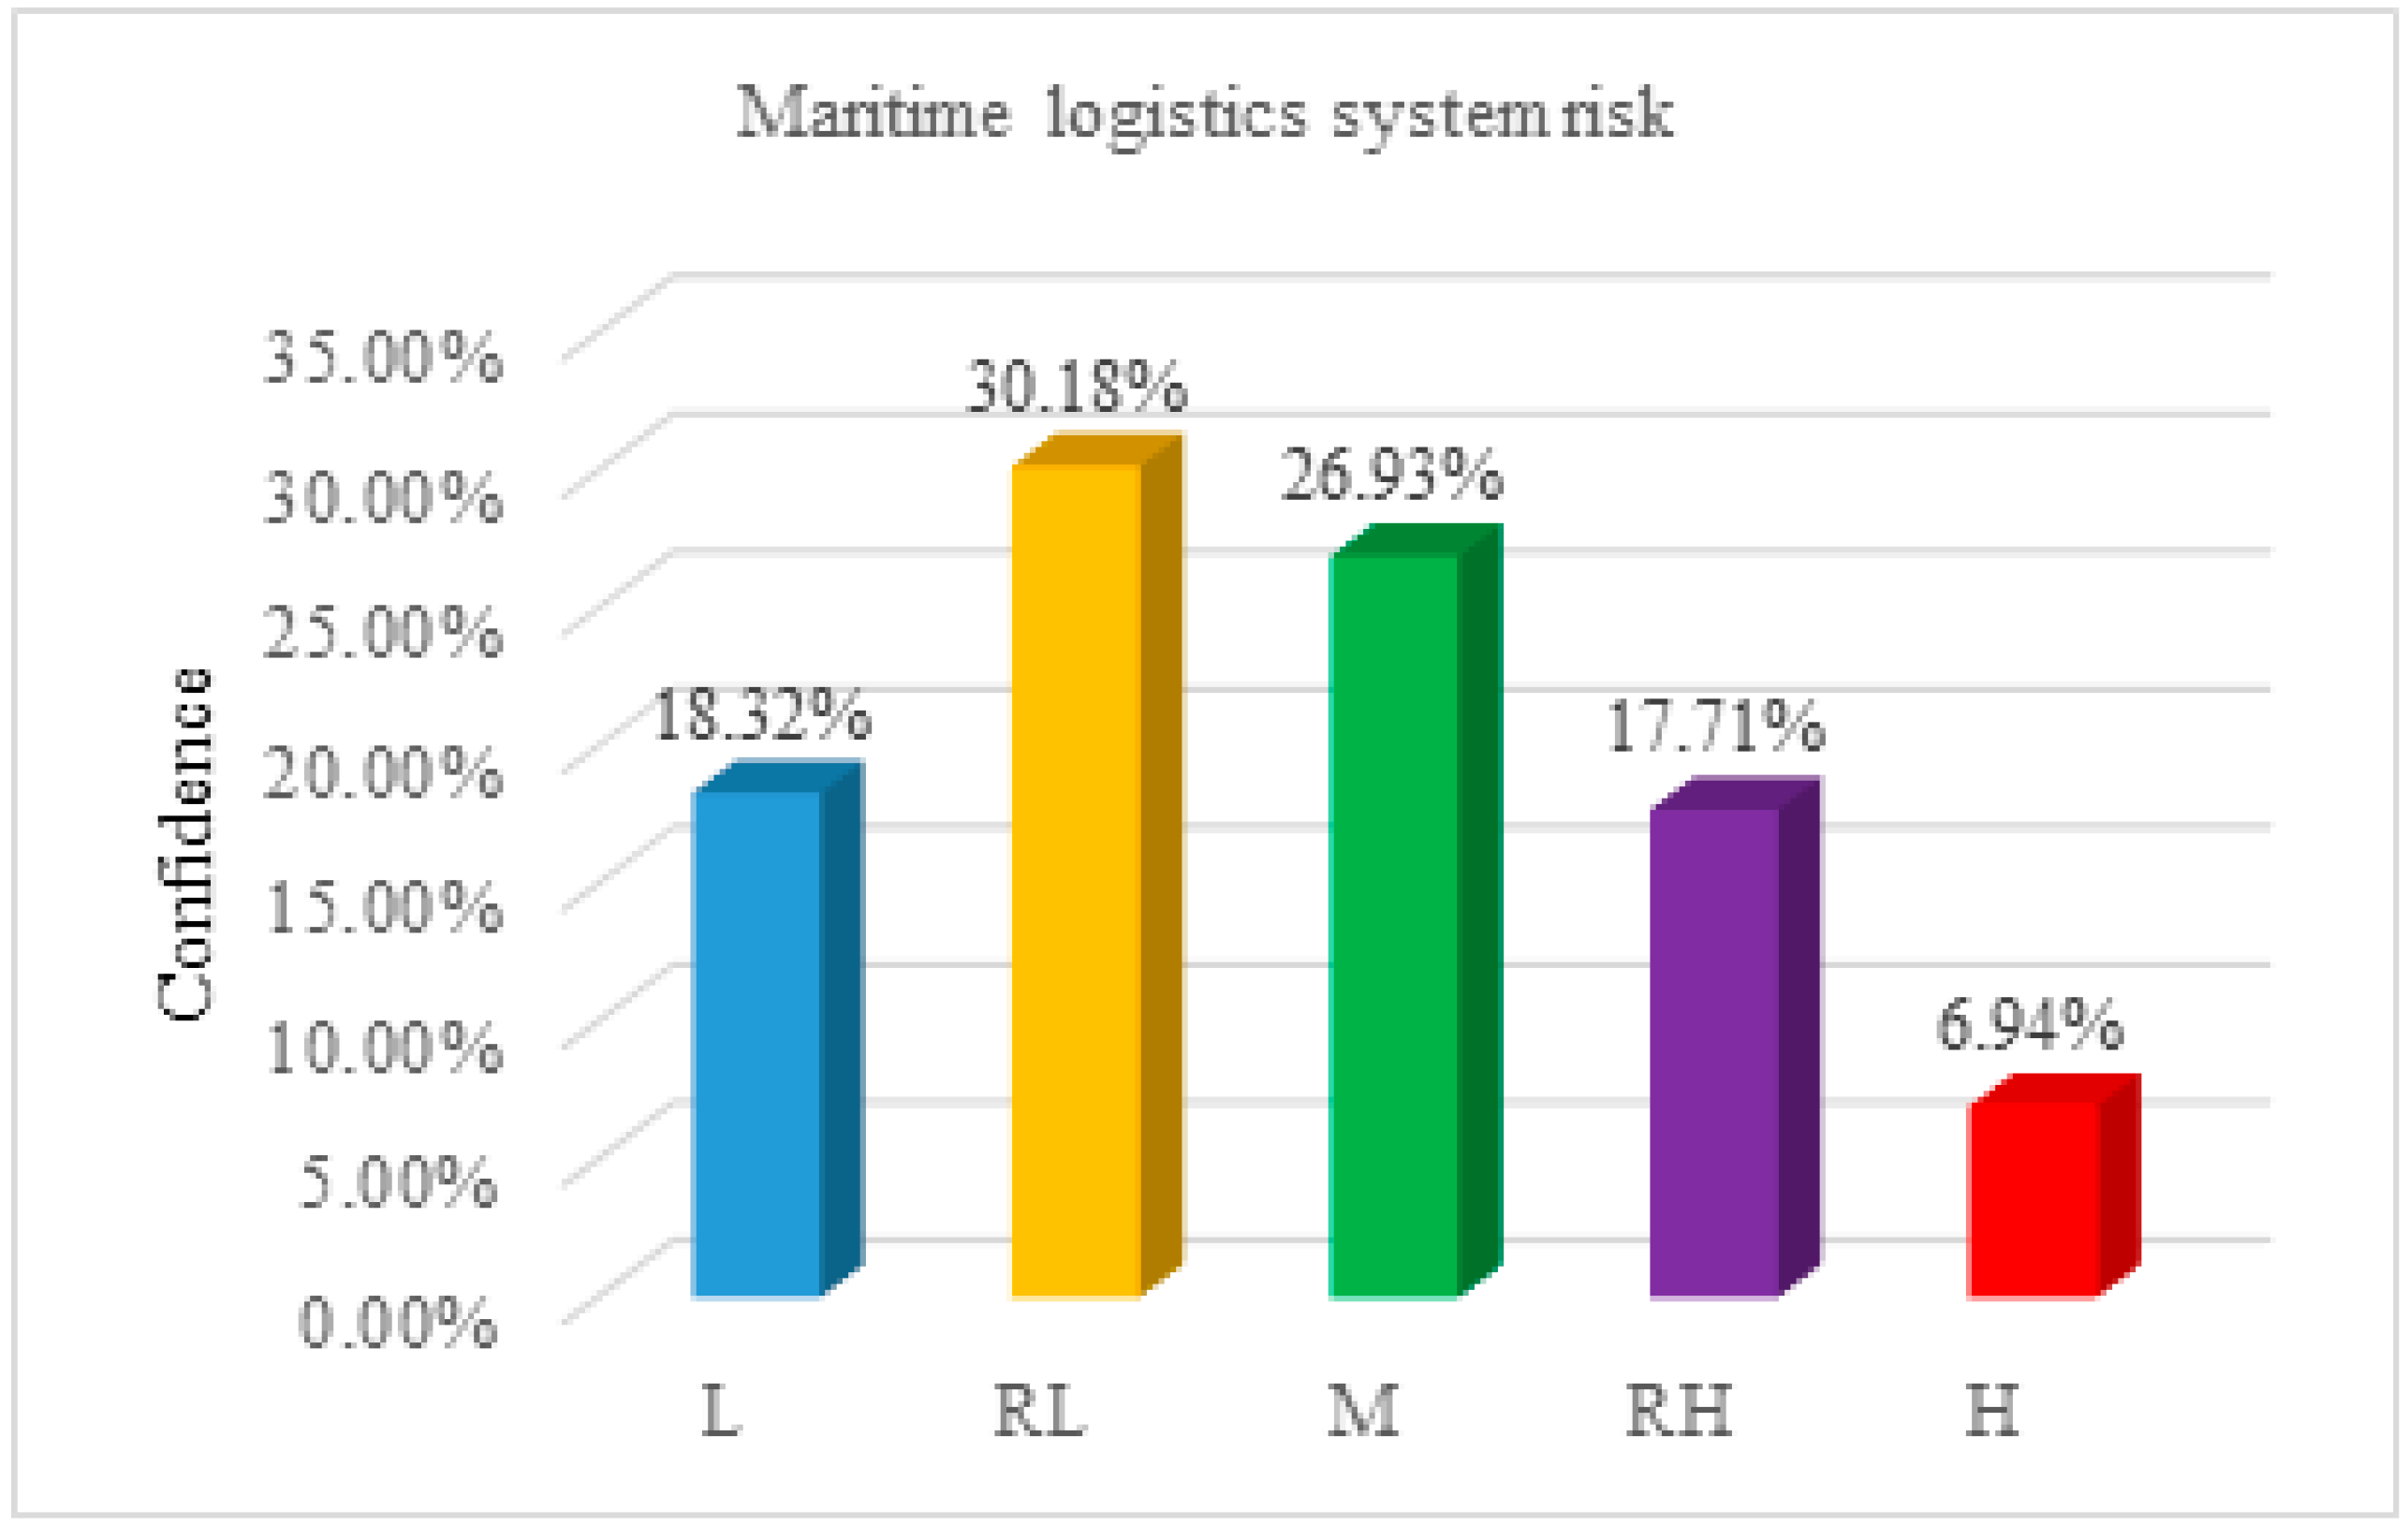
After obtaining the hazard level of each failure mode of maritime logistics, an improved synthetic algorithm based on weight distribution and the matrix analysis is used to fuse the assessment results of individual risk factors to obtain the risk status of the bauxite shipping supply chain system. The fusion results are shown in Figure 7. China’s studied imported bauxite shipping supply chain system risk index is described as 18.32% low, 30.18% relatively low, 26.93% medium, 17.71% relatively high, and 6.94% high. The system risk value is 41.419 calculated by using the utility function vector. The confidence that the maritime logistics system is at a medium- to high-risk level reaches 51.58%, indicating that the overall system risk is relatively high.
4.3. Sensitivity Analysis Results
According to the axioms introduced in Section 3.8, the sensitivity analysis is carried out to test the validity and reliability of the Bayesian network based on the fuzzy rule base system. The linguistic variables of all risk parameters should be positively correlated with the CI value, that is, when the language variable of each risk parameter slightly increases or decreases, the value of the risk assessment result’s CI value should also become higher or lower. Next, the subjective probability of 10% is re-assigned to the different language variables of each parameter and makes the CI value change in an incremental direction. If the constructed model is reasonable, then the CI value should increase accordingly. Taking “worker riots” as an example, in a single risk parameter and various risk parameter combinations, we raise the value of each language variable belonging to "H" by 10%, and the current minimum language of the modified risk parameter. The prior probability of the variable is reduced by 10% to keep the total confidence constant, and then axiom 1 and axiom 2 are tested. The results are shown in Table 14. When the prior probability that the language variable belongs to “H” in a single-risk parameter increases by 10%, the final risk assessment result CI value also increases to varying degrees. For example, when the confidence that the risk parameter “O” is in the “H” state increases by 10%, the CI value increases by 2.97. When the confidence that the risk parameter “D” is in the “H” state increases by 10%, the CI value increases by 1.875, and axiom 1 is verified. In addition, when the risk parameters adopt different numbers of combination types, as the number of combinations increases, the risk assessment CI value also keeps changing in ascending order. For example, when the different combination types of risk parameters are “O”, “O D”, “O D ST”, “O D ST SC”, and “O D ST SC SF”, the risk assessment values have changed to “2.97”, “4.845”, “5.47”, “5.72”, and “6.22”, respectively. Therefore, axiom 2 is verified in this model.
5. Conclusions
The supply network for bauxite shipping is becoming more intricate in the highly competitive and unstable global bauxite market. China is a large consumer and importer of bauxite. Under the influence of many un-certain risks, it is crucial to ensure the smooth operation of the maritime logistics of imported bauxite. Therefore, it is essential to develop a reliable and adaptable technique to evaluate the risk associated with bauxite maritime logistics. In the face of traditional FMECA methods, there are problems such as incomplete risk-characterization parameters, failure to reflect the difference in parameter importance, and a limited discrimination of RPN values. This research suggests a systemic risk assessment model combining the FBN and improved ER theory based on the improved FMECA. To accomplish the goal of describing the risk factors more thoroughly and accurately, the improved FMECA adds three sub-parameters to the consequence parameter. It also uses the AHP-entropy technique to weigh the risk parameters. Additionally, a fuzzy rule base system based on the confidence structure is created by fusing the fuzzy set theory and expert knowledge. BN reasoning technology is then used to realize the risk inference of complex systems in uncertain environments, and the weighted utility function vector is used to calculate a variety of risk status indicators. The clusters are converted into numerical values, and then the risk factors are sorted. The improved ER theory is used to aggregate individual risk events to realize the overall judgment of the bauxite maritime logistics system risk. The results show that in the bauxite shipping supply chain, “pirate or terrorist attack” is the most important risk factor, followed by “worker riots”, “ship facilities and equipment failures”, “port congestion”, “bad sea conditions”, “bauxite free surface effect”, and “improper operation by the crew”. Therefore, from a controllable point of view, in the process of importing bauxite in China, the protection of ships on the route should be increased, the ships should be regularly maintained and repaired, and the ship operation skills and emergency response capabilities should be improved. At the same time, full attention should be paid to the free liquid surface effect of bauxite, the water content of bauxite should be reduced as much as possible, and effective measures should be taken to stabilize the goods and reduce the bumps during the transportation of the goods. In addition, China’s imported bauxite maritime logistics system is at a medium- to high-risk level as a whole. In summary, the main contributions of this paper are as follows:
- (1)
- A systematic risk assessment model is proposed, which can carry out a risk assessment of the system from the local and overall dimensions and can effectively improve the scientificity and accuracy of the risk assessment of the system in an uncertain environment.
- (2)
- The improved FMECA can effectively overcome the limitations of the traditional FMECA method, making it more suitable for the field of risk analysis, and improving the reliability and rationality of the risk assessment.
- (3)
- The improved ER theory is used to realize the assessment of the overall system risk of maritime logistics, which provides a new perspective for the field of risk assessment.
- (4)
- The proportional method combined with parameter weights is applied to construct the fuzzy rule base, and to rationalize the confidence distribution in the fuzzy rule base.
However, the bauxite supply chain is faced with various risk challenges. This paper mainly focuses on the sea transportation of bauxite, while risk assessments in other aspects, such as mining, land transportation, and processing need to be further explored in the future.
Author Contributions
Conceptualization, H.W.; methodology, J.S. and H.W.; software, J.S.; validation, H.W., J.S. and M.W.; formal analysis, J.S.; investigation, H.W. and M.W.; data curation, J.S. and M.W.; writing—original draft preparation, J.S.; writing—review and editing, H.W.; visualization, J.S. and M.W.; supervision, H.W.; funding acquisition, H.W. All authors have read and agreed to the published version of the manuscript.
Funding
This research was funded by the National Natural Science Foundation of China, grant number 51909202.
Institutional Review Board Statement
Not applicable.
Informed Consent Statement
Not applicable.
Data Availability Statement
Not applicable.
Acknowledgments
The authors would like to thank the anonymous reviewers for their valuable comments and the editors’ help with this article. The authors also appreciate the valuable contribution of the participating experts in the paper.
Conflicts of Interest
The authors declare no conflict of interest.
References
- Gul, M.; Yucesan, M.; Celik, E. A manufacturing failure mode and effect analysis based on fuzzy and probabilistic risk analysis. Appl. Soft Comput. 2020, 96, 106689. [Google Scholar] [CrossRef]
- Lee, Y.-S.; Kim, D.-J.; Kim, J.-O.; Kim, H. New FMECA methodology using structural importance and fuzzy theory. IEEE Trans. Power Syst. 2011, 26, 2364–2370. [Google Scholar] [CrossRef]
- Wan, C.; Yan, X.; Zhang, D.; Qu, Z.; Yang, Z. An advanced fuzzy Bayesian-based FMEA approach for assessing maritime supply chain risks. Transp. Res. Part E Logist. Transp. Rev. 2019, 125, 222–240. [Google Scholar] [CrossRef]
- Ma, D.; Zhou, Z.; Jiang, Y.; Ding, W. Constructing Bayesian network by integrating FMEA with FTA. In Proceedings of the 2014 Fourth International Conference on Instrumentation and Meassurement, Computer, Communication and Control, Harbin, China, 18–20 September 2014; IEEE: Piscataway, NJ, USA, 2014; pp. 696–700. [Google Scholar]
- Liu, H.-C.; You, J.-X.; Fan, X.-J.; Lin, Q.-L. Failure mode and effects analysis using D numbers and grey relational projection method. Expert Syst. Appl. 2014, 41, 4670–4679. [Google Scholar] [CrossRef]
- Renjith, V.; Kumar, P.H.; Madhavan, D. Fuzzy FMECA (failure mode effect and criticality analysis) of LNG storage facility. J. Loss Prev. Process Ind. 2018, 56, 537–547. [Google Scholar] [CrossRef]
- Alyami, H.; Lee, P.T.-W.; Yang, Z.; Riahi, R.; Bonsall, S.; Wang, J. An advanced risk analysis approach for container port safety evaluation. Marit. Policy Manag. 2014, 41, 634–650. [Google Scholar] [CrossRef]
- Heckmann, I.; Comes, T.; Nickel, S. A critical review on supply chain risk–Definition, measure and modeling. Omega 2015, 52, 119–132. [Google Scholar] [CrossRef] [Green Version]
- Wagner, S.M.; Bode, C. An empirical examination of supply chain performance along several dimensions of risk. J. Bus. Logist. 2008, 29, 307–325. [Google Scholar] [CrossRef]
- Lam, J.S.L.; Bai, X. A quality function deployment approach to improve maritime supply chain resilience. Transp. Res. Part E Logist. Transp. Rev. 2016, 92, 16–27. [Google Scholar] [CrossRef]
- Ju, L.; Vassalos, D.; Wang, Q.; Wang, Y.; Liu, Y. Numerical investigation of solid bulk cargo liquefaction. Ocean Eng. 2018, 159, 333–347. [Google Scholar] [CrossRef]
- Nguyen, S.; Wang, H. Prioritizing operational risks in container shipping systems by using cognitive assessment technique. Marit. Bus. Rev. 2018, 3, 185–206. [Google Scholar] [CrossRef] [Green Version]
- Yang, Y.-C. Risk management of Taiwan’s maritime supply chain security. Saf. Sci. 2011, 49, 382–393. [Google Scholar] [CrossRef]
- Thun, J.-H.; Hoenig, D. An empirical analysis of supply chain risk management in the German automotive industry. Int. J. Prod. Econ. 2011, 131, 242–249. [Google Scholar] [CrossRef]
- Wang, S.; Yin, J.; Khan, R.U. The multi-state maritime transportation system risk assessment and safety analysis. Sustainability 2020, 12, 5728. [Google Scholar] [CrossRef]
- Jiang, M.; Lu, J.; Yang, Z.; Li, J. Risk analysis of maritime accidents along the main route of the Maritime Silk Road: A Bayesian network approach. Marit. Policy Manag. 2020, 47, 815–832. [Google Scholar] [CrossRef]
- Berle, Ø.; Asbjørnslett, B.E.; Rice, J.B.J.R.E.; Safety, S. Formal vulnerability assessment of a maritime transportation system. Reliab. Eng. Syst. Saf. 2011, 96, 696–705. [Google Scholar] [CrossRef] [Green Version]
- Shterev, D. Safety problems in maritime transport of cargoes which are able to liquefy. Trans Motauto World 2021, 6, 27–29. [Google Scholar]
- Munro, M.C.; Mohajerani, A. Liquefaction incidents of mineral cargoes on board bulk carriers. Adv. Mater. Sci. Eng. 2016, 2016, 5219474. [Google Scholar] [CrossRef] [Green Version]
- Lee, H.L. Nickel ore bulk liquefaction a handymax incident and response. Ocean Eng. 2017, 139, 65–73. [Google Scholar] [CrossRef]
- Daoud, S.; Said, I.; Ennour, S.; Bouassida, M. Numerical analysis of cargo liquefaction mechanism under the swell motion. Mar. Struct. 2018, 57, 52–71. [Google Scholar] [CrossRef]
- Yang, Z.; Bonsall, S.; Wang, J. Facilitating uncertainty treatment in the risk assessment of container supply chains. J. Mar. Eng. Technol. 2010, 9, 23–36. [Google Scholar] [CrossRef] [Green Version]
- Nguyen, S.; Chen, P.S.-L.; Du, Y.; Shi, W. A quantitative risk analysis model with integrated deliberative Delphi platform for container shipping operational risks. Transp. Res. Part E Logist. Transp. Rev. 2019, 129, 203–227. [Google Scholar] [CrossRef]
- Khan, B.; Khan, F.; Veitch, B.; Yang, M. An operational risk analysis tool to analyze marine transportation in Arctic waters. Reliab. Eng. Syst. Saf. 2018, 169, 485–502. [Google Scholar] [CrossRef]
- Akyuz, E.; Arslan, O.; Turan, O. Application of fuzzy logic to fault tree and event tree analysis of the risk for cargo liquefaction on board ship. Appl. Ocean Res. 2020, 101, 102238. [Google Scholar] [CrossRef]
- Liu, H.; Tian, Z.; Huang, A.; Yang, Z. Analysis of vulnerabilities in maritime supply chains. Reliab. Eng. Syst. Saf. 2018, 169, 475–484. [Google Scholar] [CrossRef]
- Zavitsas, K.; Zis, T.; Bell, M.G. The impact of flexible environmental policy on maritime supply chain resilience. Transp. Policy 2018, 72, 116–128. [Google Scholar] [CrossRef] [Green Version]
- Vilko, J.; Ritala, P.; Hallikas, J. Risk management abilities in multimodal maritime supply chains: Visibility and control perspectives. Accid. Anal. Prev. 2019, 123, 469–481. [Google Scholar] [CrossRef] [PubMed]
- Fan, L.; Wilson, W.W.; Dahl, B. Risk analysis in port competition for containerized imports. Eur. J. Oper. Res. 2015, 245, 743–753. [Google Scholar] [CrossRef]
- Polatidis, N.; Pavlidis, M.; Mouratidis, H. Cyber-attack path discovery in a dynamic supply chain maritime risk management system. Comput. Stand. Interfaces 2018, 56, 74–82. [Google Scholar] [CrossRef] [Green Version]
- John, A.; Paraskevadakis, D.; Bury, A.; Yang, Z.; Riahi, R.; Wang, J. An integrated fuzzy risk assessment for seaport operations. Saf. Sci. 2014, 68, 180–194. [Google Scholar] [CrossRef] [Green Version]
- Bowles, J.B.; Peláez, C.E. Fuzzy logic prioritization of failures in a system failure mode, effects and criticality analysis. Reliab. Eng. Syst. Saf. 1995, 50, 203–213. [Google Scholar] [CrossRef]
- Oluah, C.; Akinlabi, E.; Njoku, H.O. Selection of phase change material for improved performance of Trombe wall systems using the entropy weight and TOPSIS methodology. Energy Build. 2020, 217, 109967. [Google Scholar] [CrossRef]
- Nieto-Morote, A.; Ruz-Vila, F. A fuzzy approach to construction project risk assessment. Int. J. Proj. Manag. 2011, 29, 220–231. [Google Scholar] [CrossRef] [Green Version]
- Lyu, H.-M.; Shen, S.-L.; Zhou, A.; Yang, J. Risk assessment of mega-city infrastructures related to land subsidence using improved trapezoidal FAHP. Sci. Total Environ. 2020, 717, 135310. [Google Scholar] [CrossRef] [PubMed]
- Wang, G.; Liu, L.; Shi, P.; Zhang, G.; Liu, J. Flood risk assessment of metro system using improved trapezoidal fuzzy AHP: A case study of Guangzhou. Remote Sens. 2021, 13, 5154. [Google Scholar] [CrossRef]
- Zhao, G.; Chen, A.; Lu, G.; Liu, W. Data fusion algorithm based on fuzzy sets and DS theory of evidence. Tsinghua Sci. Technol. 2019, 25, 12–19. [Google Scholar] [CrossRef]
Figure 1.
Maritime logistics risk assessment model.

Figure 2.
Risk parameter characterization system.

Figure 3.
Membership function of a parametric variable.

Figure 4.
Schematic diagram of level evaluation of failure occurrence.

Figure 5.
BN topology model.

Figure 6.
Results of risk assessment of FM1 using Netica software.

Figure 7.
Maritime logistics system risk assessment.


Table 1.
Experts’ knowledge and experience.
| Experts | Position | Company | Working Experience |
|---|---|---|---|
| 1 | A professor, head of port management studies | A university in China | Involved in maritime transport safety management and maritime supply chain management |
| 2 | Senior operational managers | A leading port in China | Involved in port safety and operational services |
| 3 | A qualified master mariner | A shipping company in China | Involved in bauxite international transportation |
| 4 | Senior security officers | A bauxite company in China | Involved in bauxite customs and transport security |
Table 2.
Risk parameters’ weight.
| Risk Parameter | Local Weight | Overall Weight | ||
|---|---|---|---|---|
| Occurrence likelihood (O) | 0.30 | 0.30 | ||
| Difficulty of detection (D) | 0.25 | 0.25 | ||
| Severity of consequences (S) | Time delay/disruption (ST) | 0.45 | 0.25 | 0.11 |
| Additional cost (SC) | 0.53 | 0.24 | ||
| Safety and security loss (SF) | 0.22 | 0.10 | ||
Table 3.
Probability of risk O fuzzy rating.
| Grade | Linguistic Variables | Definition | Fuzzy Number |
|---|---|---|---|
| O1 | Low | Occurs less than once a year | (0, 0, 1, 2) |
| O2 | Relatively low | Expected to happen every few months | (0.5, 2, 3, 4.5) |
| O3 | Medium | Expected at least once a month | (3, 4, 6, 7) |
| O4 | Relatively high | Expected at least once a week | (5.5, 7, 8, 9.5) |
| O5 | High | Expected at least once a day | (8, 9, 10, 10) |
Table 4.
Fuzzy rating of risk detection degree D.
| Grade | Linguistic Variables | Definition | Fuzzy Number |
|---|---|---|---|
| D1 | Easy | Can be easily found through risk inspection | (0, 0, 1, 2) |
| D2 | Relatively easy | Can be detected through regular risk inspection | (0.5, 2, 3, 4.5) |
| D3 | Medium | Not easily detected by regular risk inspection | (3, 4, 6, 7) |
| D4 | Relatively hard | May be detected through rigorous risk inspection | (5.5, 7, 8, 9.5) |
| D5 | Difficult | Unable or difficult to pass rigorous risk inspections | (8, 9, 10, 10) |
Table 5.
Time delay ST fuzzy rating.
| Grade | Linguistic Variables | Definition | Fuzzy Number |
|---|---|---|---|
| ST1 | Short | Delay time less than 6 h | (0, 0, 1, 2) |
| ST2 | Relatively short | The delay time does not exceed 5% of the planned transportation time | (0.5, 2, 3, 4.5) |
| ST3 | Medium | The delay time exceeds the planned transportation time by 5–20% | (3, 4, 6, 7) |
| ST4 | Relatively long | The delay time exceeds the planned transportation time by 20–40% | (5.5, 7, 8, 9.5) |
| ST5 | Long | The delay time exceeds 40% of the planned transportation time | (8, 9, 10, 10) |
Table 6.
Extra cost SC fuzzy rating.
| Grade | Linguistic Variables | Definition | Fuzzy Number |
|---|---|---|---|
| SC1 | Few | No more than 1% of the total cost | (0, 0, 1, 2) |
| SC2 | Relatively few | 2–5% over the total cost | (0.5, 2, 3, 4.5) |
| SC3 | Medium | Over 6–20% of the total cost | (3, 4, 6, 7) |
| SC4 | Relatively many | 21–40% over the total cost | (5.5, 7, 8, 9.5) |
| SC5 | Much | More than 40% of the total cost | (8, 9, 10, 10) |
Table 7.
Safety and security loss SF fuzzy assessment level.
| Grade | Linguistic Variables | Definition | Fuzzy Number |
|---|---|---|---|
| SF1 | Light | The goods, equipment, or system are slightly damaged, but the functions are complete, and the maintenance is convenient and fast; the number of minor injuries does not exceed 2 | (0, 0, 1, 2) |
| SF2 | Relatively light | The equipment or system is slightly damaged, and the maintenance is more convenient; the damage rate of the goods is 1–5%; three people or more have been slightly injured | (0.5, 2, 3, 4.5) |
| SF3 | Medium | Equipment or system is medium-damaged, and maintenance is not convenient; the proportion of cargo damage reaches 5–10%; 1–2 people are medium-injured | (3, 4, 6, 7) |
| SF4 | Relatively serious | The equipment or system is seriously damaged and inconvenient to maintain; the damage rate of goods reaches 10–20%; 1–2 people are seriously injured | (5.5, 7, 8, 9.5) |
| SF5 | Severe | The equipment or system is seriously damaged, and transportation cannot be carried out; the proportion of goods damaged is more than 20%; personnel deaths occur | (8, 9, 10, 10) |
Table 8.
List of failure modes of bauxite maritime logistics.
| Symbol | Failure Mode |
|---|---|
| FM1 | Worker riots |
| FM2 | Port congestion |
| FM3 | Improper operation by the crew |
| FM4 | Piracy or terrorist attack |
| FM5 | Terrible sea conditions |
| FM6 | Bauxite-free surface effect |
| FM7 | Ship facilities and equipment failure |
Table 9.
Fuzzy rule base based on confidence structure.
| Rules | Antecedent Attributes (Input) | Criticality C (Output) | ||||||
|---|---|---|---|---|---|---|---|---|
| O | S | D | Low | Relatively Low | Medium | Relatively High | High | |
| 1 | Low | Light | Easy | 1 | 0 | 0 | 0 | 0 |
| 2 | Low | Light | Relatively easy | 0.75 | 0.25 | 0 | 0 | 0 |
| 3 | Low | Light | Medium | 0.75 | 0 | 0.25 | 0 | 0 |
| 4 | Low | Light | Relatively difficult | 0.75 | 0 | 0 | 0.25 | 0 |
| 5 | Low | Light | Difficult | 0.75 | 0 | 0 | 0.25 | |
| 6 | Low | Relatively light | Easy | 0.55 | 0.45 | 0 | 0 | 0 |
| … | … | … | … | … | … | … | … | … |
| 123 | High | Severe | Medium | 0 | 0 | 0.25 | 0 | 0.75 |
| 124 | High | Severe | Relatively difficult | 0 | 0 | 0 | 0.25 | 0.75 |
| 125 | High | Severe | Difficult | 0 | 0 | 0 | 0 | 1 |
Table 10.
BN conditional probability distribution.
| C | O1 | … | O5 | ||||||||||
|---|---|---|---|---|---|---|---|---|---|---|---|---|---|
| S1 | … | S5 | … | S5 | |||||||||
| D1 | D2 | … | D5 | … | D1 | … | D5 | … | D1 | D2 | … | D5 | |
| C1 | 1 | 0.75 | … | 0.75 | … | 0.55 | … | 0.3 | … | 0.25 | 0 | … | 0 |
| C2 | 0 | 0.25 | … | 0 | … | 0 | … | 0 | … | 0 | 0.25 | … | 0 |
| C3 | 0 | 0 | … | 0 | … | 0 | … | 0 | … | 0 | 0 | … | 0 |
| C4 | 0 | 0 | … | 0 | … | 0 | … | 0 | … | 0 | 0 | … | 0 |
| C5 | 0 | 0 | … | 0.25 | … | 0.45 | … | 0.7 | … | 0.75 | 0.75 | … | 1 |
Table 11.
Evaluation results of three types of risk factors.
| Risk Factor | Identification Framework | ||||
|---|---|---|---|---|---|
| L | RL | M | RH | H | |
| FM1 | a1 | a2 | a3 | a4 | a5 |
| FM2 | b1 | b2 | b3 | b4 | b5 |
| FM3 | c1 | c2 | c3 | c4 | c5 |
Table 12.
“Worker riots” expert assessment results.
| Risk Parameter | Linguistic Variables | Trapezoidal Fuzzy Number | Prior Probability Distribution |
|---|---|---|---|
| O | L, RL, L, L | (0.083, 0.333, 1.333, 2.417) | (0, 0, 0.285, 0.460, 0.255) |
| D | M, RL, M, RH | (3, 4.175, 5.825, 7) | (0, 0.265, 0.471, 0.265, 0) |
| ST | H, RH, H, H | (7.583, 8.667, 9.667, 9.917) | (0, 0, 0, 0.426, 0.574) |
| SC | H, RH, RH, H | (6.75, 8, 9, 9.75) | (0, 0, 0.053, 0.474, 0.474) |
| SF | H, RH, M, H | (6.3, 7.455, 8.64, 9.29) | (0, 0, 0.154, 0.475, 0.371) |
Table 13.
Failure mode risk assessment result.
| Failure Mode | Criticality Assessment Fuzzy Subset | CI Value | Rank | ||||
|---|---|---|---|---|---|---|---|
| Low (%) | Relatively Low (%) | Medium (%) | Relatively High (%) | High (%) | |||
| FM1 | 17.20 | 19.40 | 14.50 | 27.40 | 21.40 | 54.222 | 2 |
| FM2 | 21.60 | 32.30 | 24.30 | 14.30 | 7.65 | 38.816 | 4 |
| FM3 | 39.10 | 34.90 | 13.40 | 11.30 | 1.27 | 25.561 | 7 |
| FM4 | 14.20 | 14.60 | 21.30 | 32.90 | 17.00 | 56.117 | 1 |
| FM5 | 10.70 | 41.00 | 40.40 | 7.96 | 0 | 36.527 | 5 |
| FM6 | 21.90 | 34.90 | 29.10 | 12.90 | 1.27 | 34.439 | 6 |
| FM7 | 3.48 | 34.00 | 45.40 | 17.20 | 0 | 44.135 | 3 |
Table 14.
Sensitivity analysis of different combinations of risk parameters.
| Number | Combination | CI Value | Change Value | Serial Number | Combination | CI Value | Change Value |
|---|---|---|---|---|---|---|---|
| 1 | Initial | 54.222 | - | 17 | O D ST | 59.692 | 5.47 |
| 2 | O | 57.192 | 2.97 | 18 | O D SC | 59.917 | 5.695 |
| 3 | D | 56.097 | 1.875 | 19 | O D SF | 59.817 | 5.595 |
| 4 | ST | 54.597 | 0.375 | 20 | O ST SC | 58.317 | 4.095 |
| 5 | SC | 54.822 | 0.6 | 21 | O ST SF | 58.217 | 3.995 |
| 6 | SF | 54.722 | 0.5 | 22 | O SC SF | 58.292 | 4.07 |
| 7 | O D | 59.067 | 4.845 | 23 | D ST SC | 56.972 | 2.75 |
| 8 | O ST | 57.567 | 3.345 | 24 | D ST SF | 56.972 | 2.75 |
| 9 | O SC | 57.792 | 3.57 | 25 | D SC SF | 57.197 | 2.975 |
| 10 | O SF | 57.692 | 3.47 | 26 | ST SC SF | 55.597 | 1.375 |
| 11 | D ST | 56.472 | 2.25 | 27 | O D ST SC | 59.942 | 5.72 |
| 12 | D SC | 56.697 | 2.475 | 28 | O D ST SF | 59.942 | 5.72 |
| 13 | D SF | 56.597 | 2.375 | 29 | O D SC SF | 60.167 | 5.945 |
| 14 | ST SC | 55.097 | 0.875 | 30 | O ST SC SF | 58.567 | 4.345 |
| 15 | ST SF | 55.097 | 0.875 | 31 | D ST SC SF | 57.472 | 3.25 |
| 16 | SC SF | 55.572 | 1.35 | 32 | O D ST SC SF | 60.442 | 6.22 |
Disclaimer/Publisher’s Note: The statements, opinions and data contained in all publications are solely those of the individual author(s) and contributor(s) and not of MDPI and/or the editor(s). MDPI and/or the editor(s) disclaim responsibility for any injury to people or property resulting from any ideas, methods, instructions or products referred to in the content. |
© 2023 by the authors. Licensee MDPI, Basel, Switzerland. This article is an open access article distributed under the terms and conditions of the Creative Commons Attribution (CC BY) license (https://creativecommons.org/licenses/by/4.0/).
Share and Cite
MDPI and ACS Style
Sun, J.; Wang, H.; Wang, M. Risk Assessment of Bauxite Maritime Logistics Based on Improved FMECA and Fuzzy Bayesian Network. J. Mar. Sci. Eng. 2023, 11, 755. https://doi.org/10.3390/jmse11040755
AMA Style
Sun J, Wang H, Wang M. Risk Assessment of Bauxite Maritime Logistics Based on Improved FMECA and Fuzzy Bayesian Network. Journal of Marine Science and Engineering. 2023; 11(4):755. https://doi.org/10.3390/jmse11040755
Chicago/Turabian StyleSun, Jiachen, Haiyan Wang, and Mengmeng Wang. 2023. "Risk Assessment of Bauxite Maritime Logistics Based on Improved FMECA and Fuzzy Bayesian Network" Journal of Marine Science and Engineering 11, no. 4: 755. https://doi.org/10.3390/jmse11040755
Note that from the first issue of 2016, this journal uses article numbers instead of page numbers. See further details here.