
Pre- and Post-Liquefaction Behaviors of Manufactured Sand Considering the Particle Shape and Stress History Effects

Abstract
:1. Introduction
2. Materials and Methods
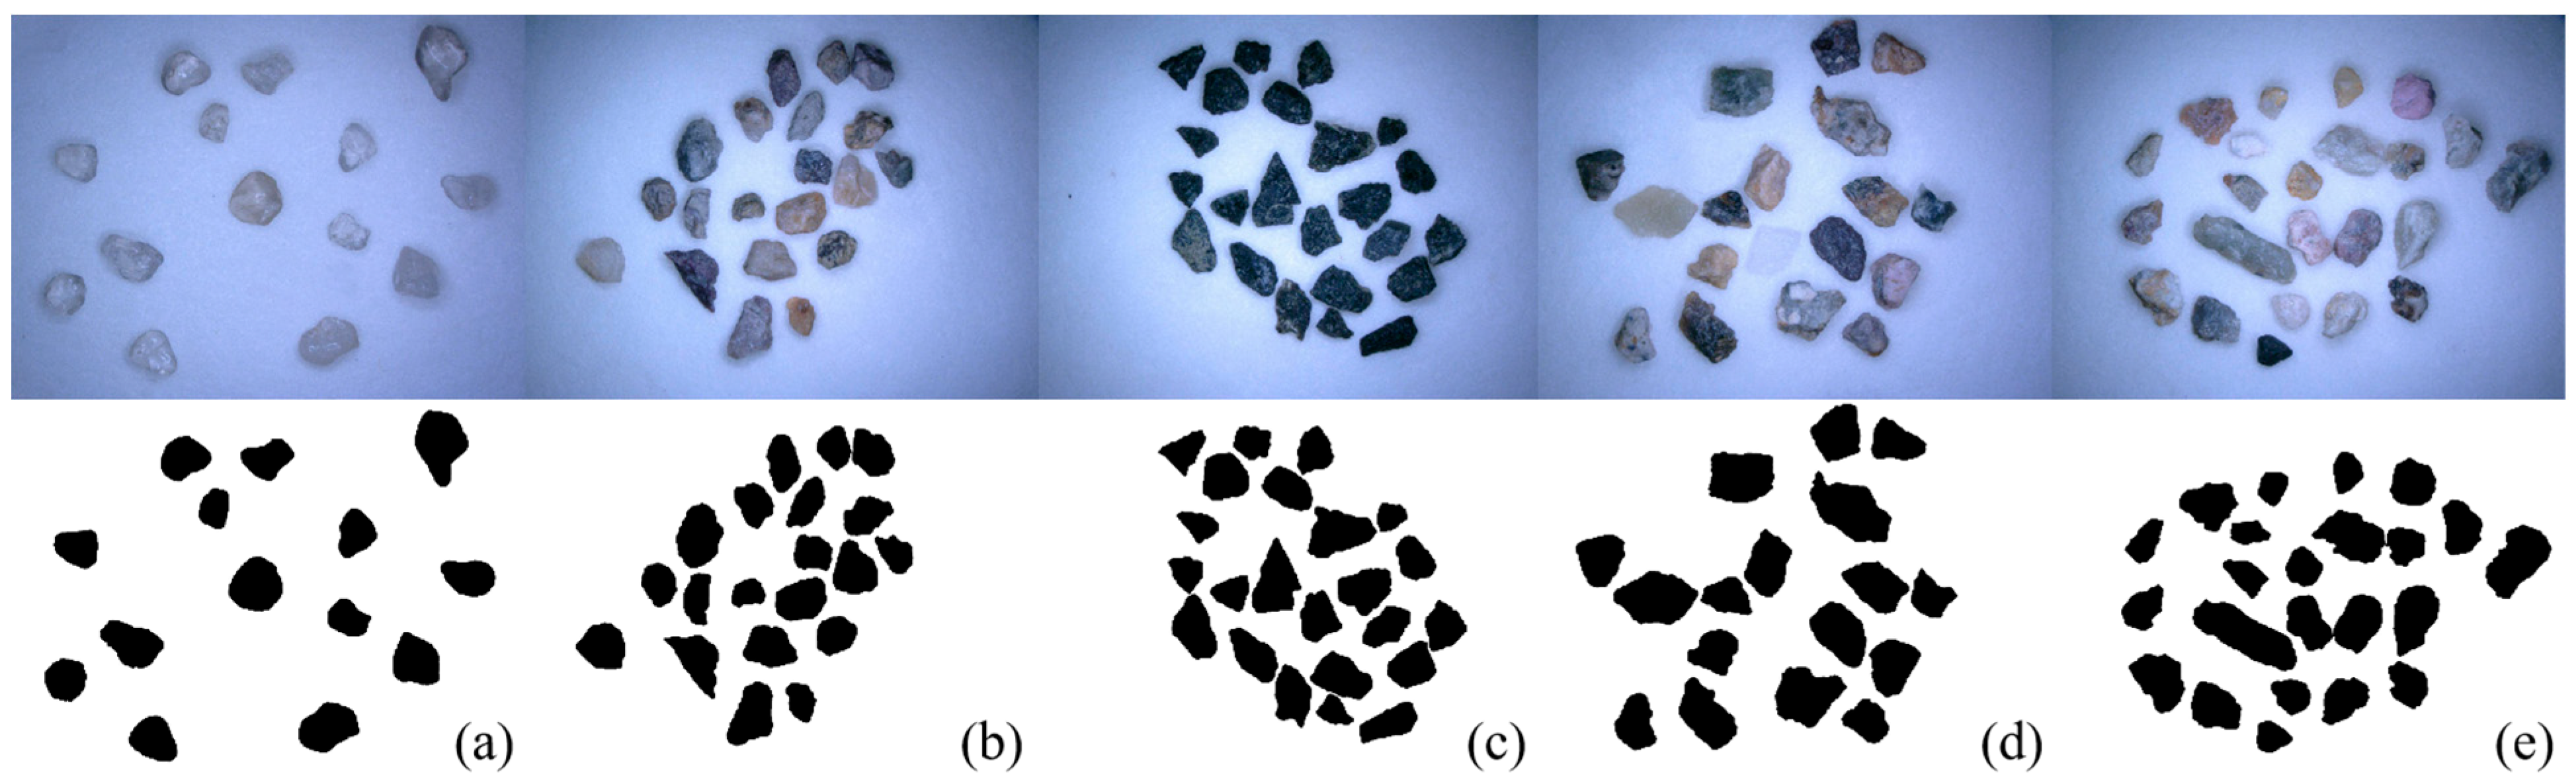
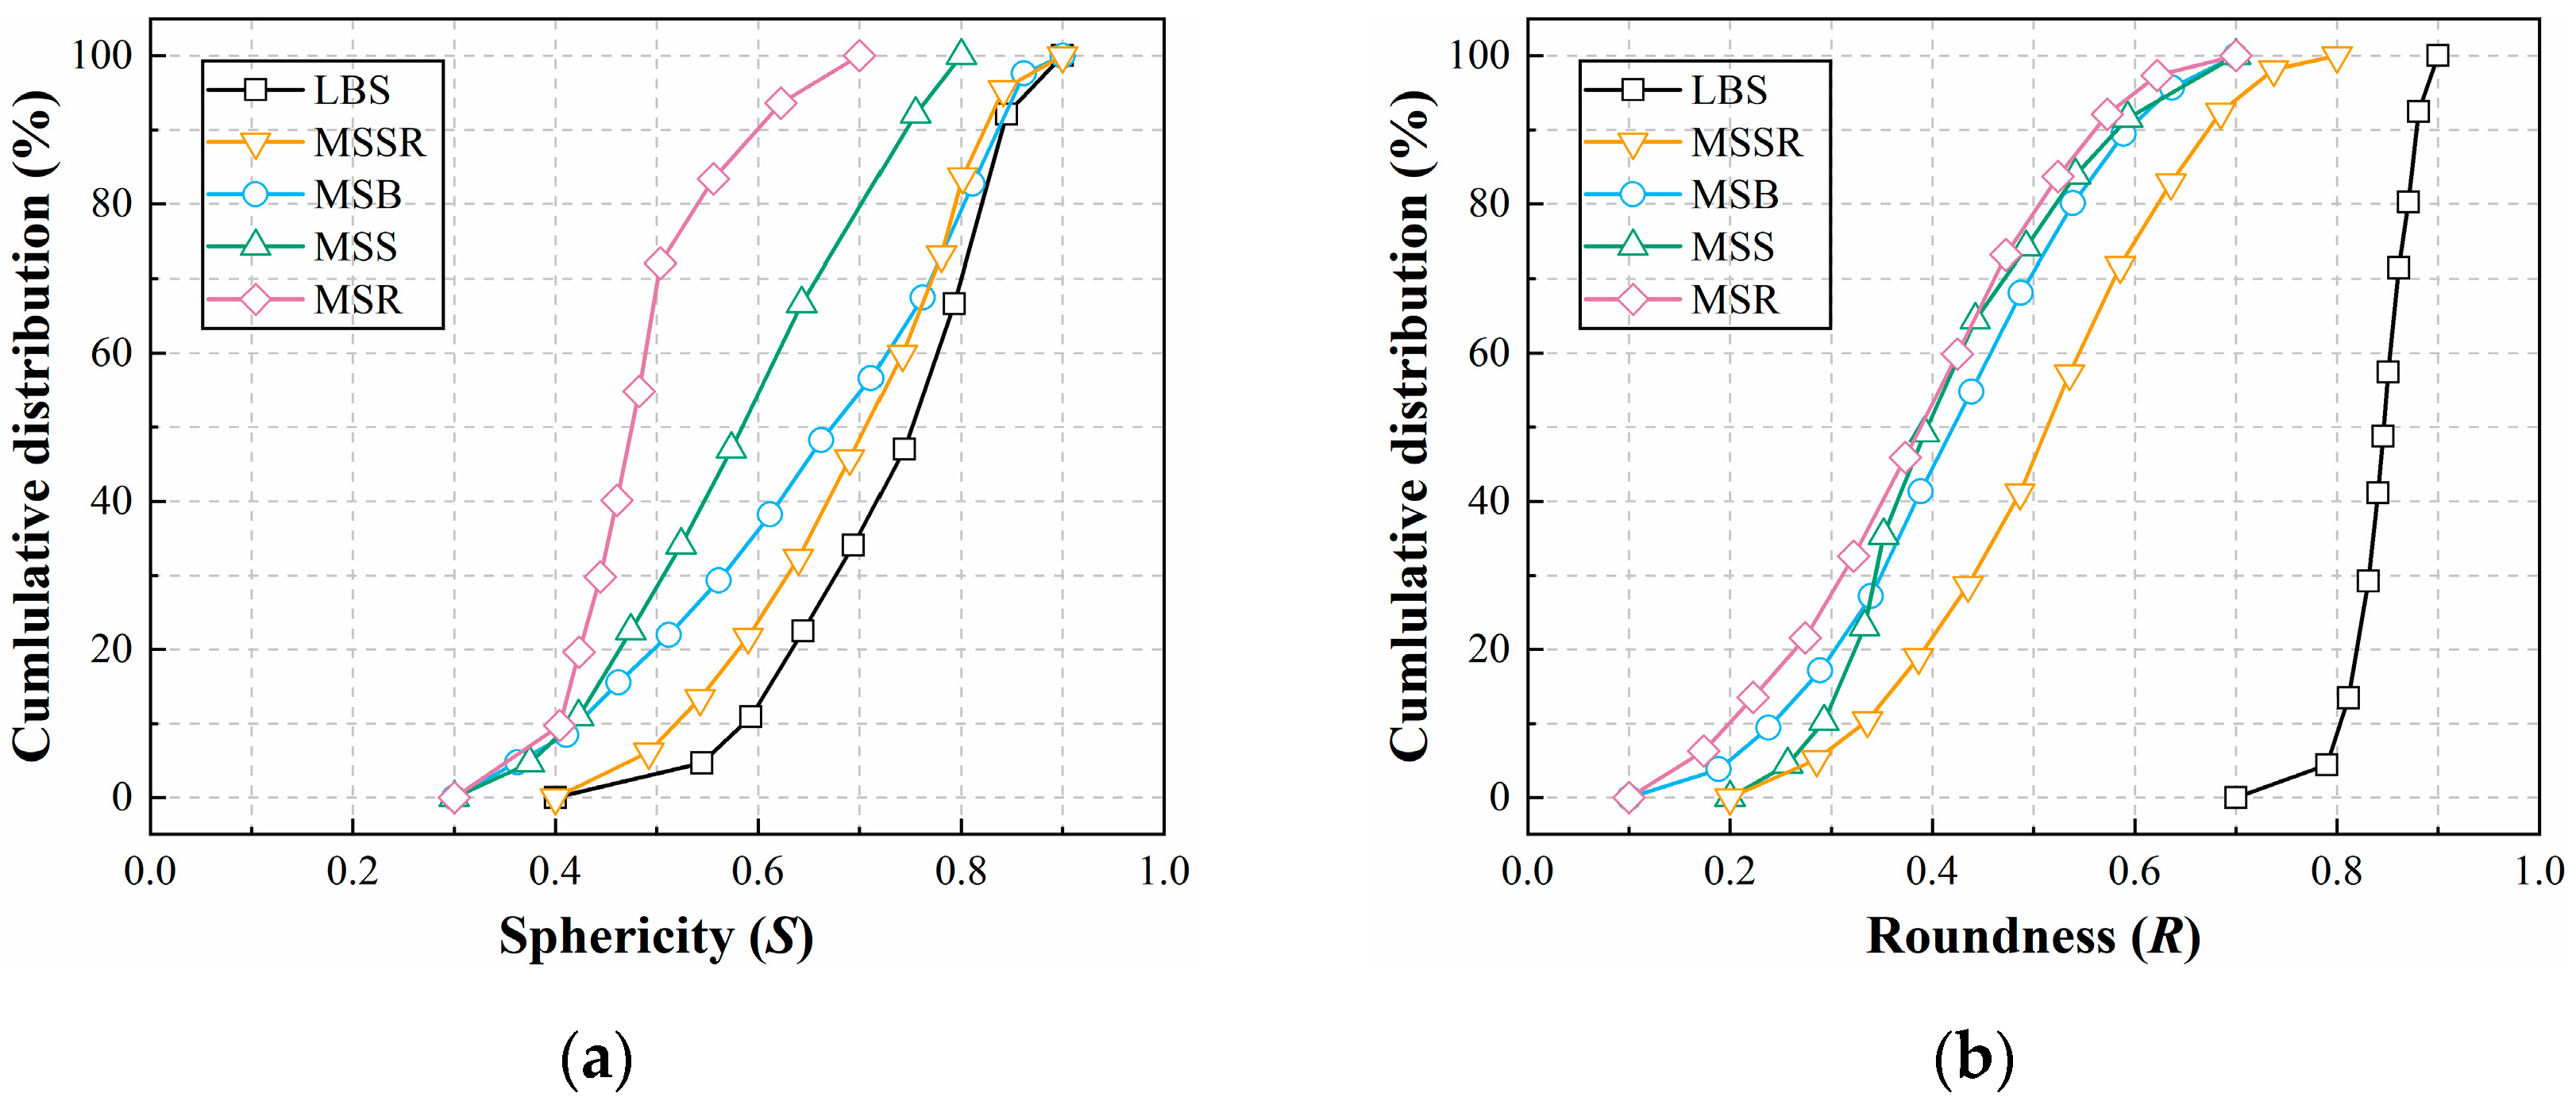
2.1. Particle Shape Evaluation
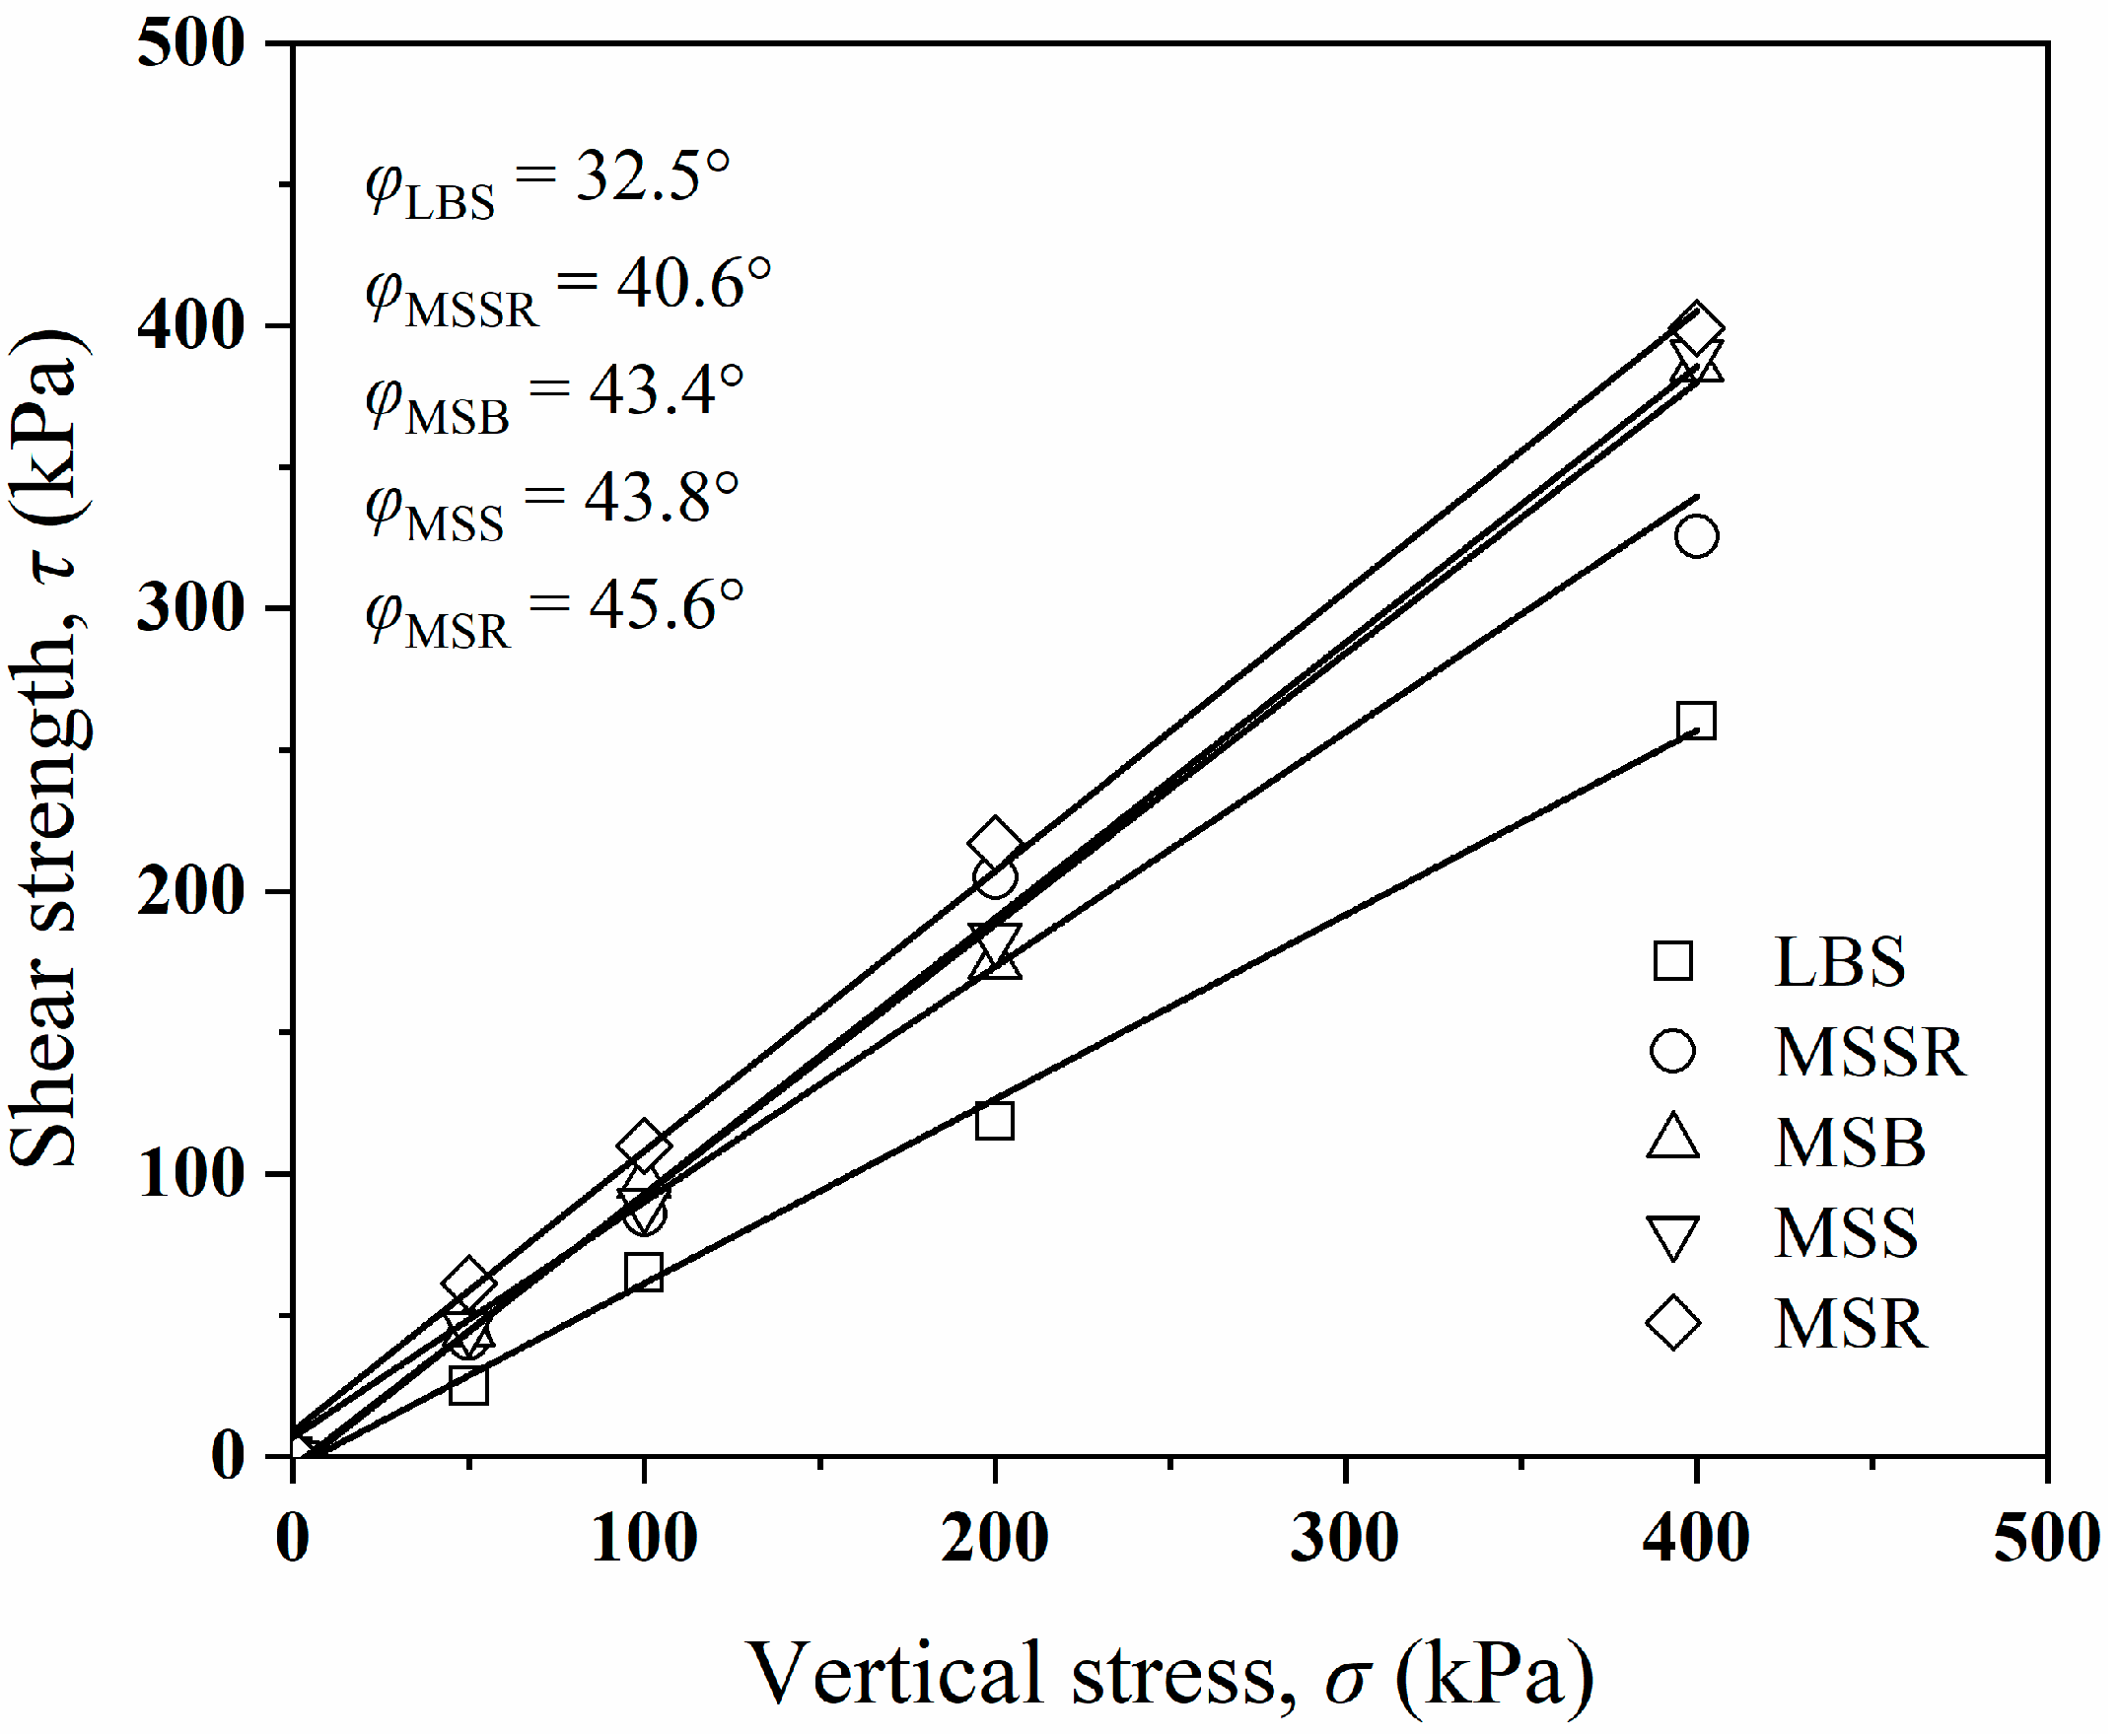
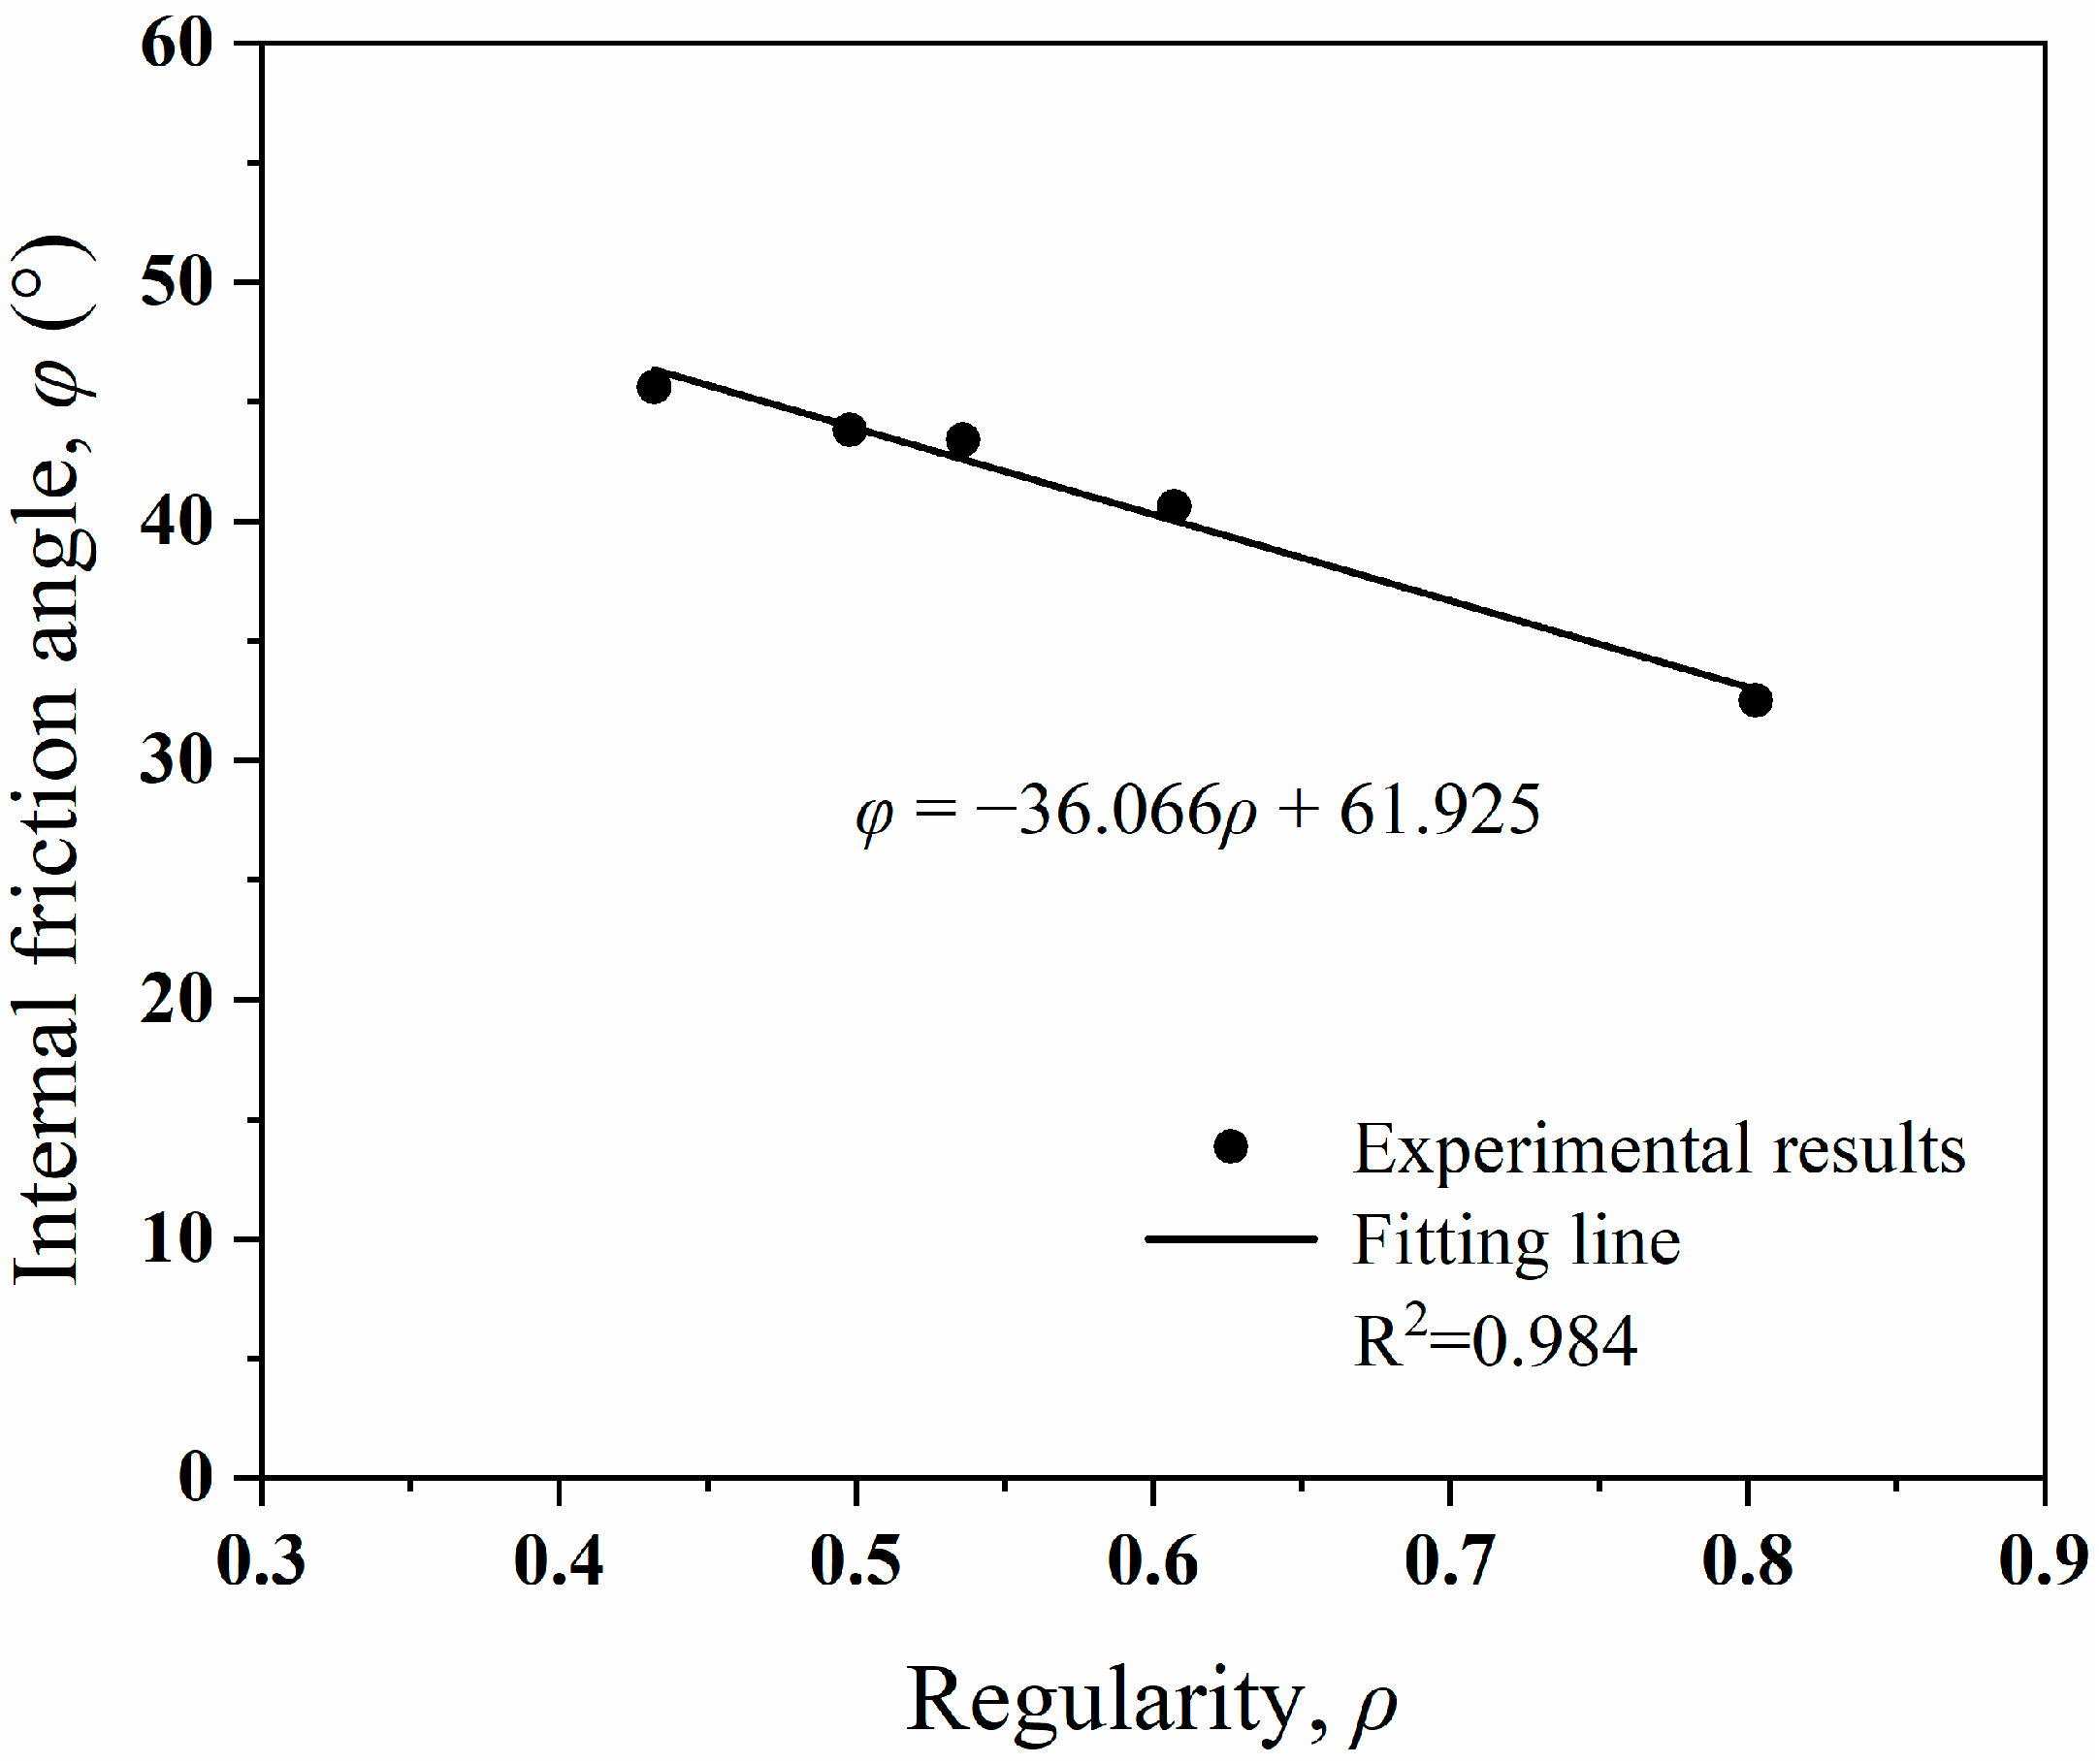
2.2. Relationships between the Particle Shape and Friction Angle
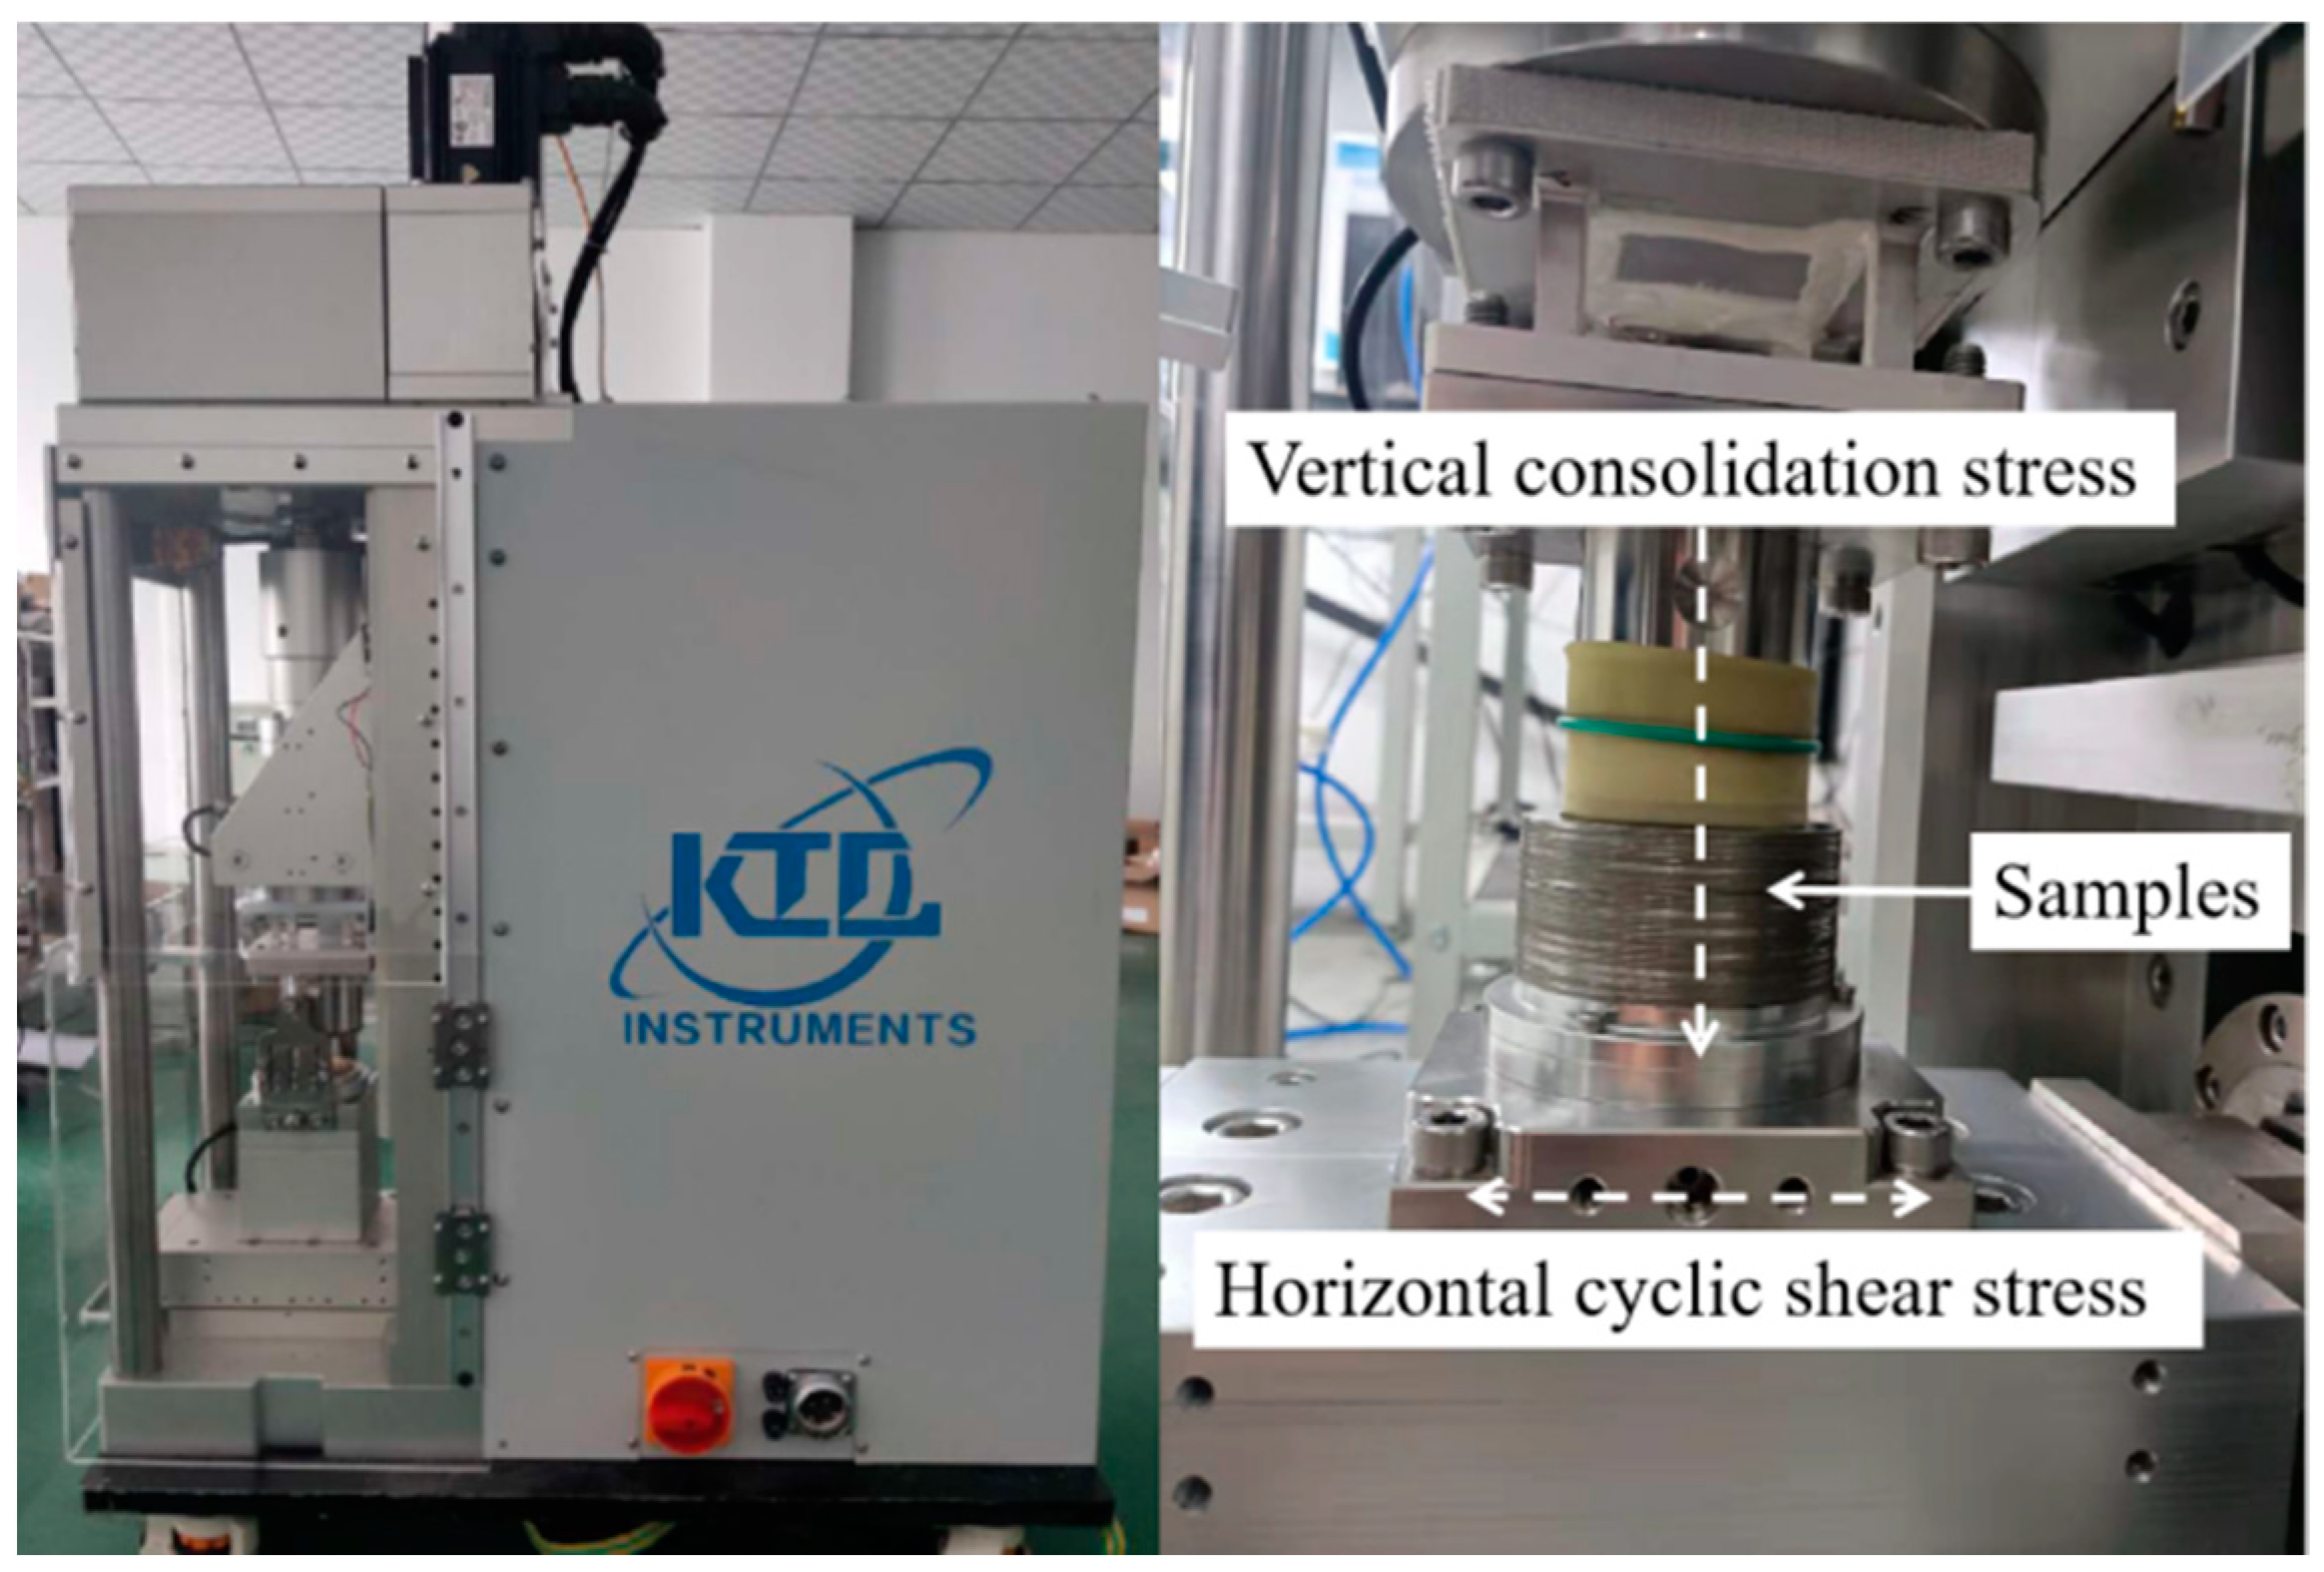
3. Experimental Apparatus and Methods
4. Results and Discussion
4.1. Pre-Liquefaction Behaviors
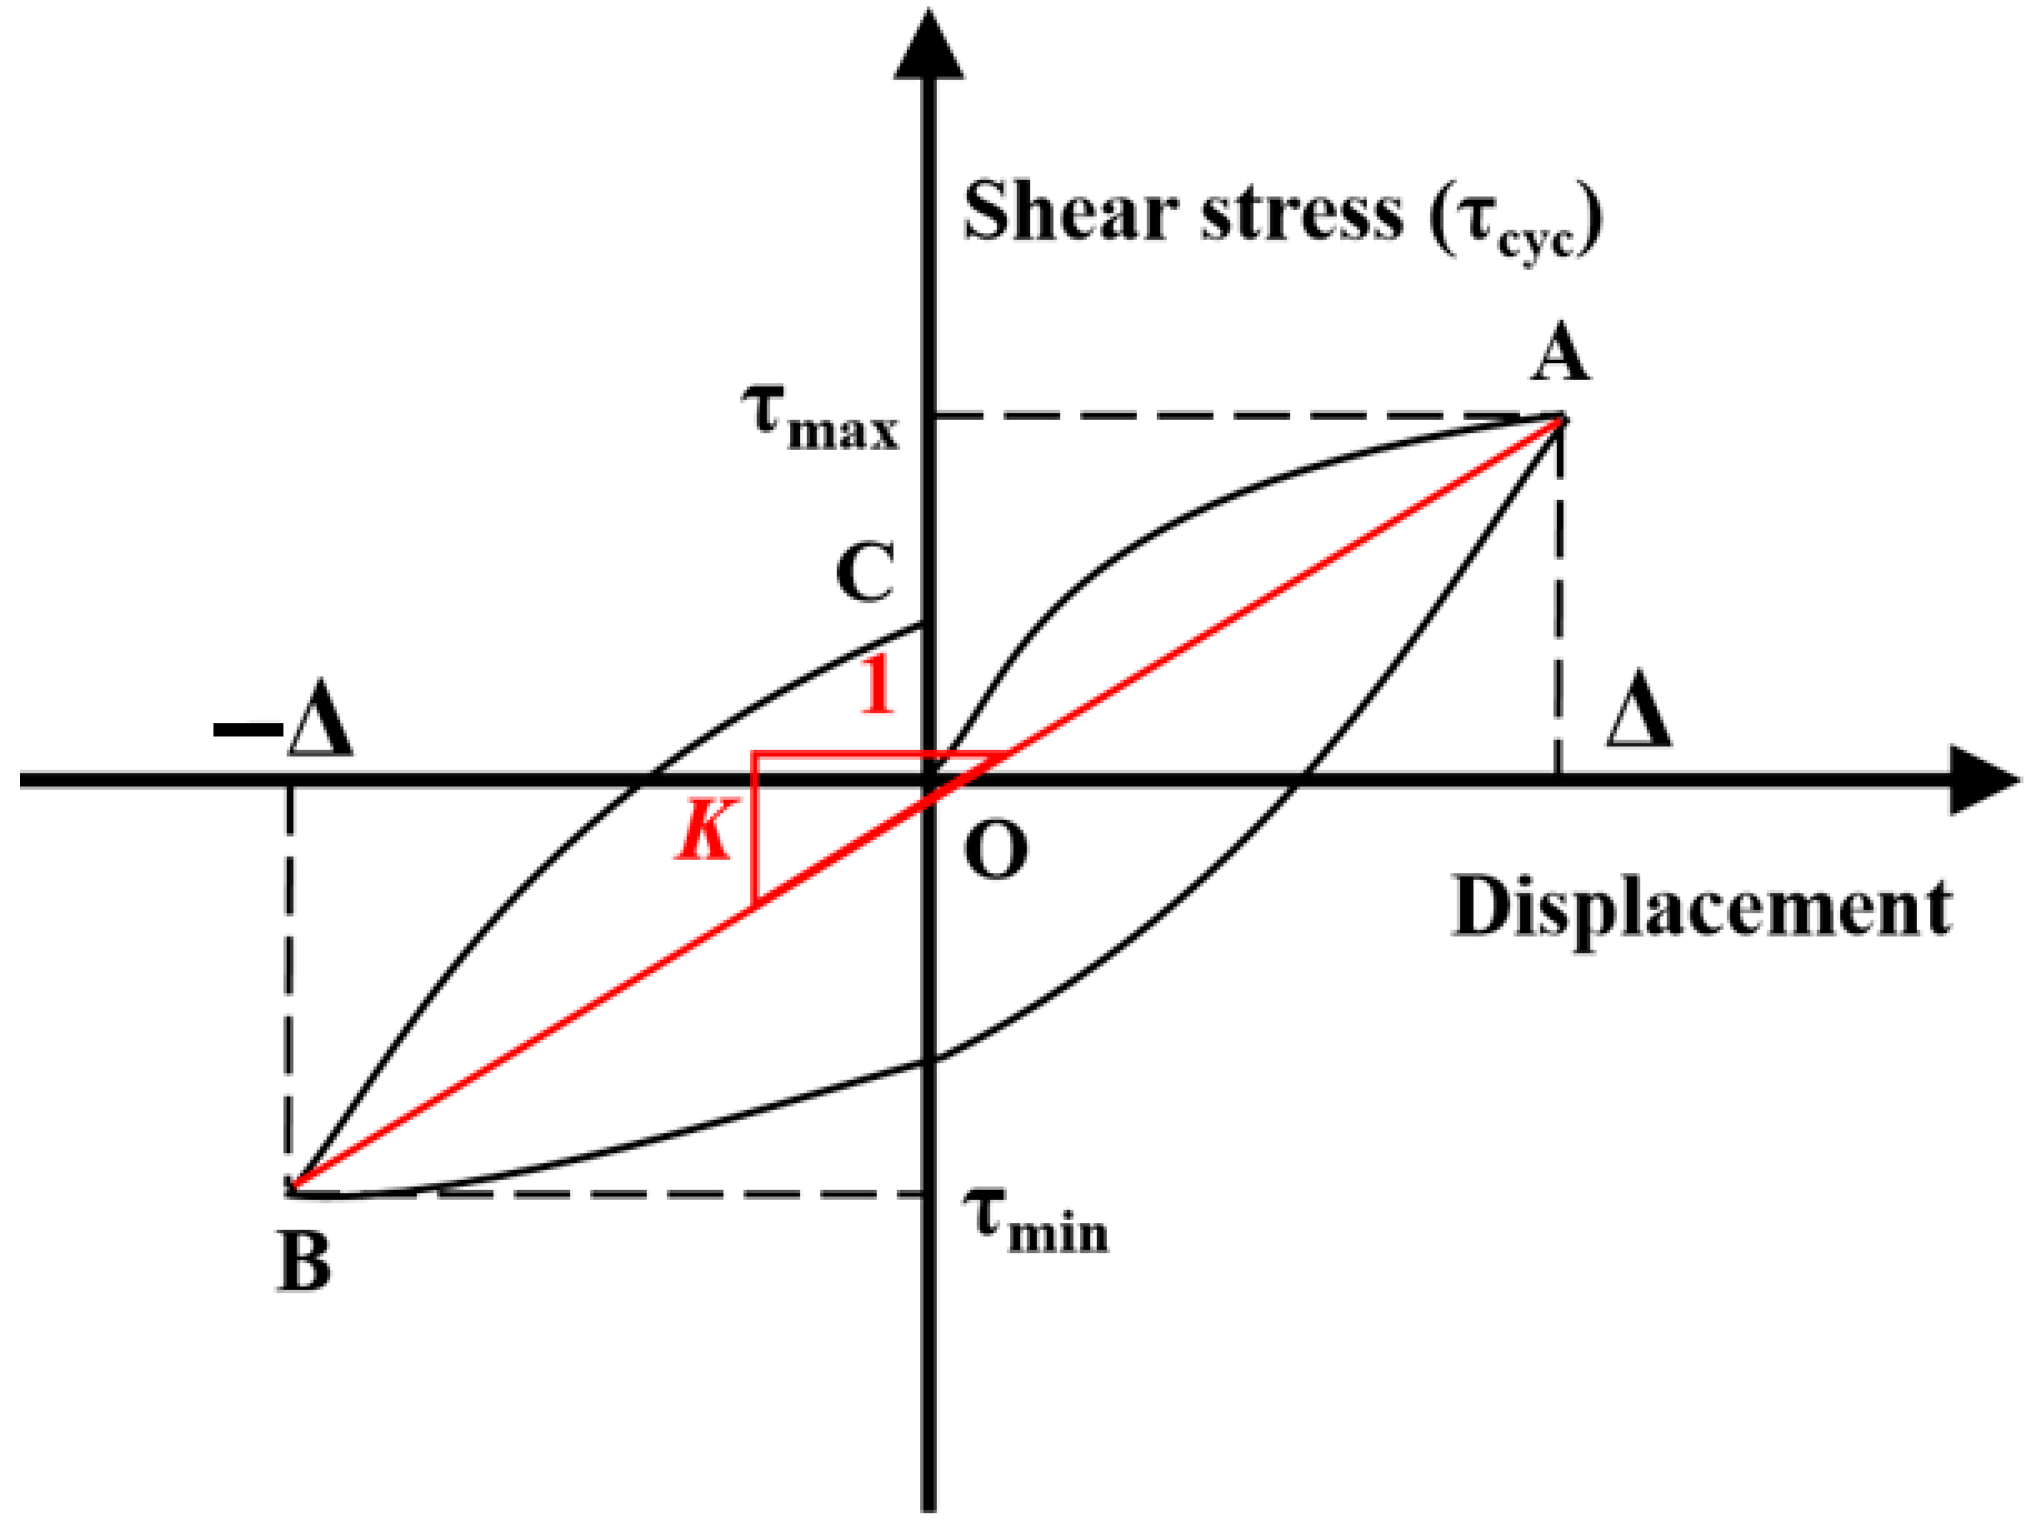
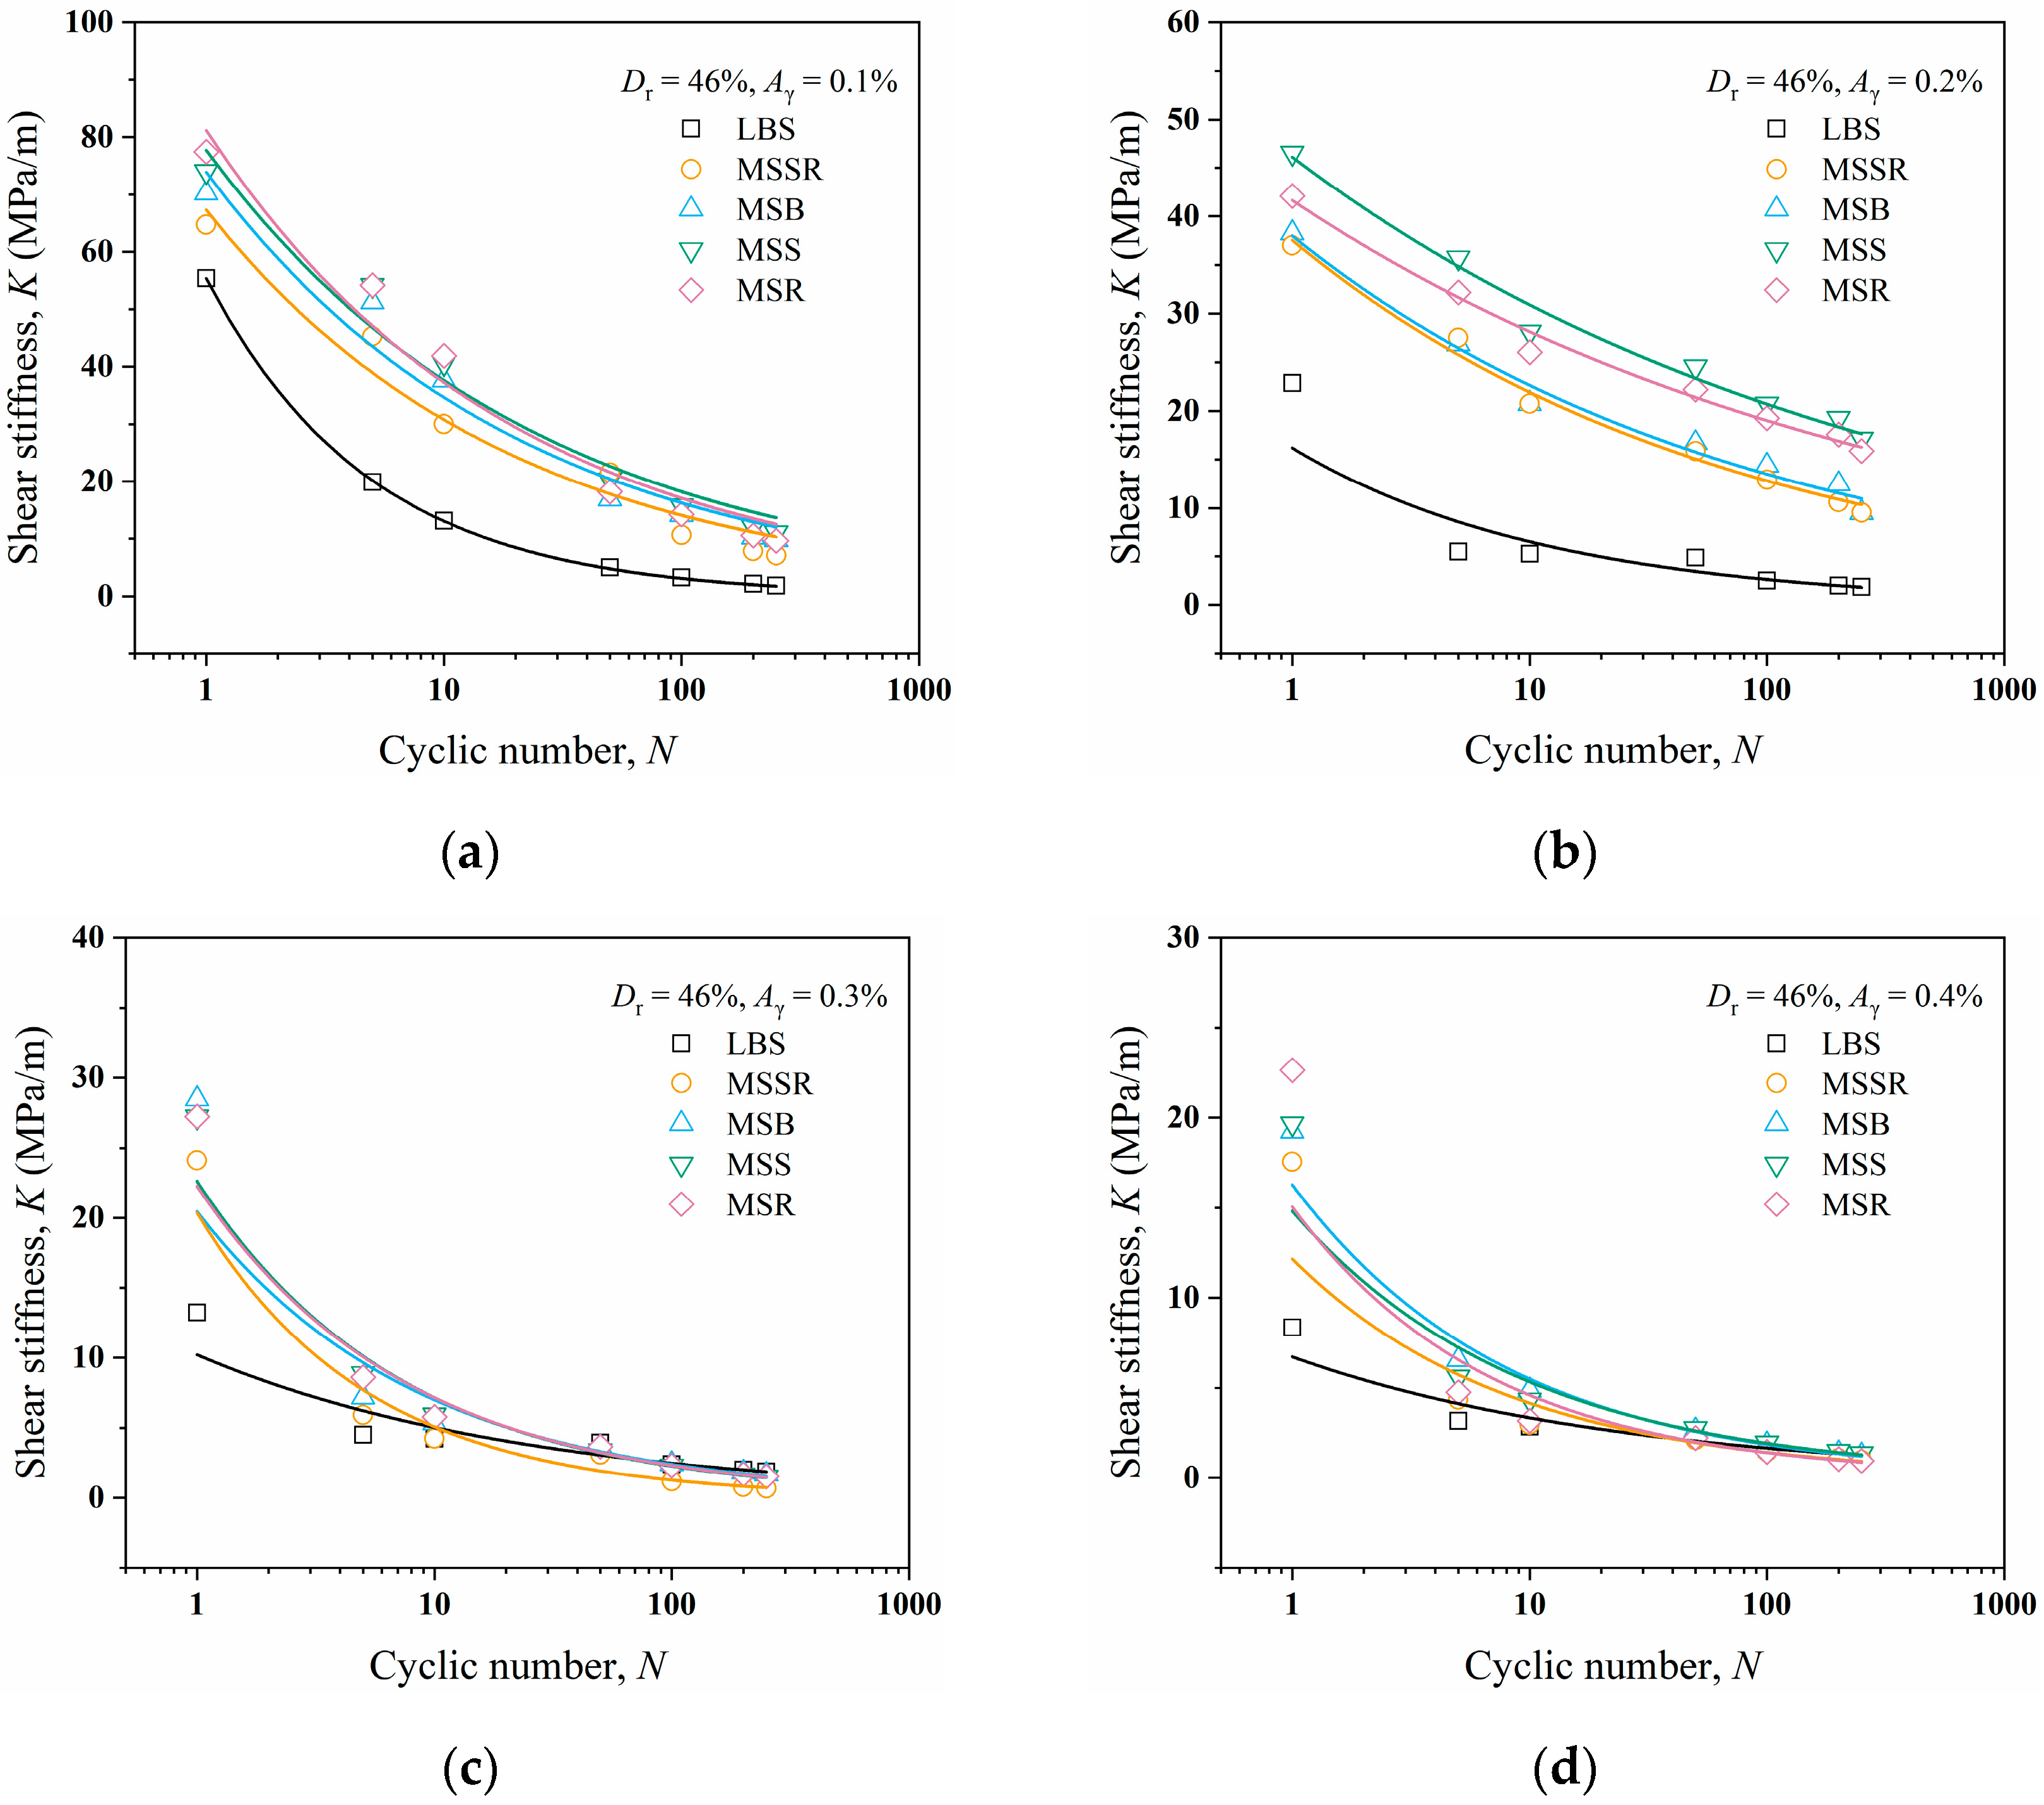
4.1.1. Relationships between the Shear Stiffness, Particle Shape, and Cyclic Number
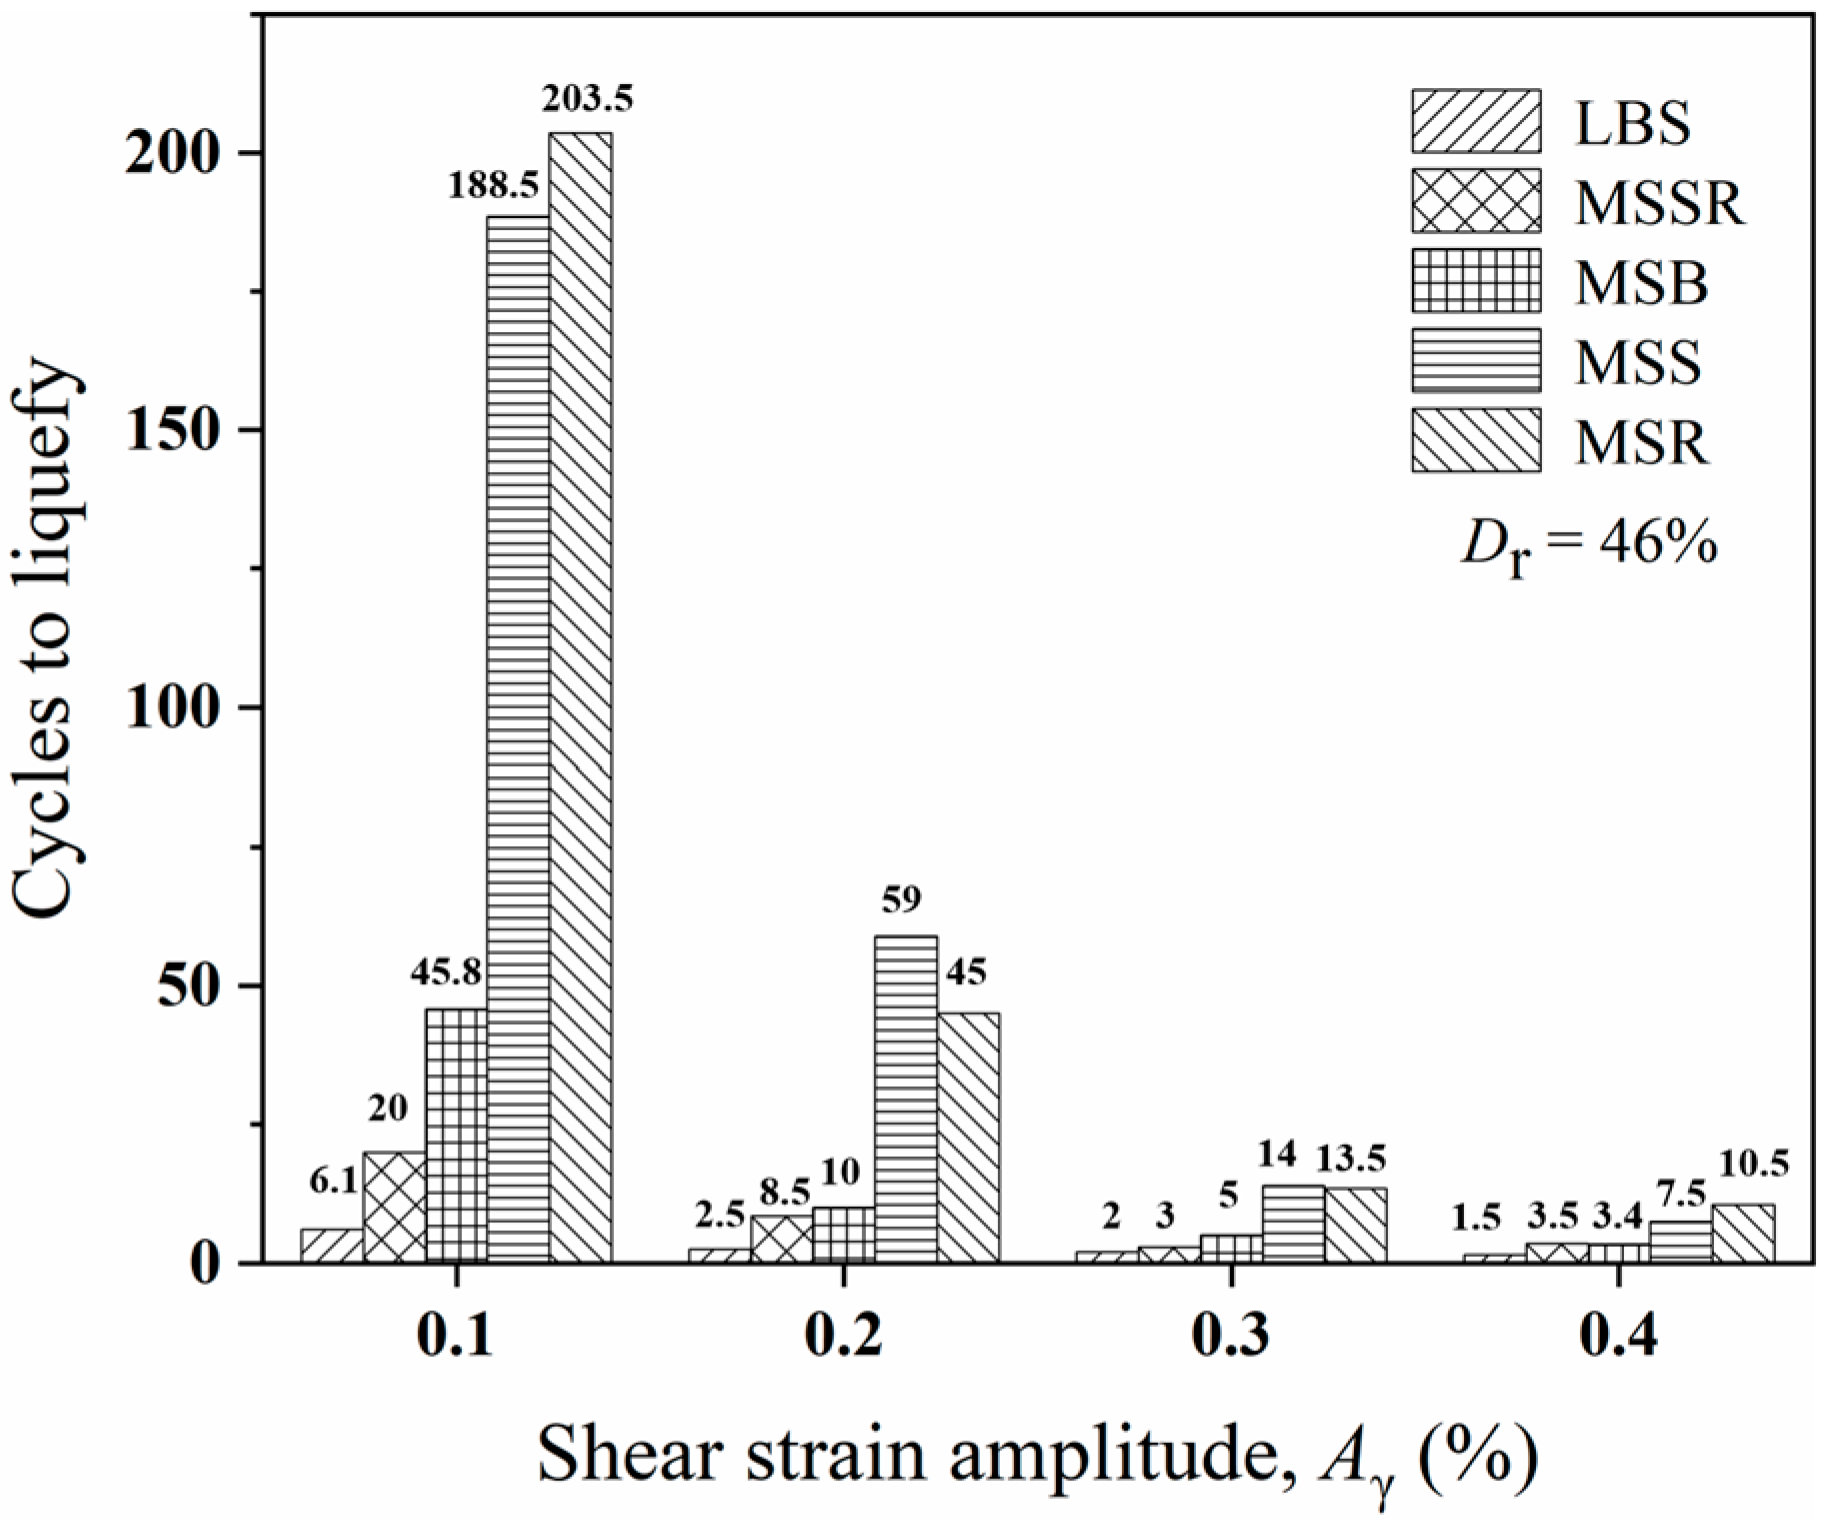
4.1.2. Liquefaction Resistance
4.2. Post-Liquefaction Behaviors
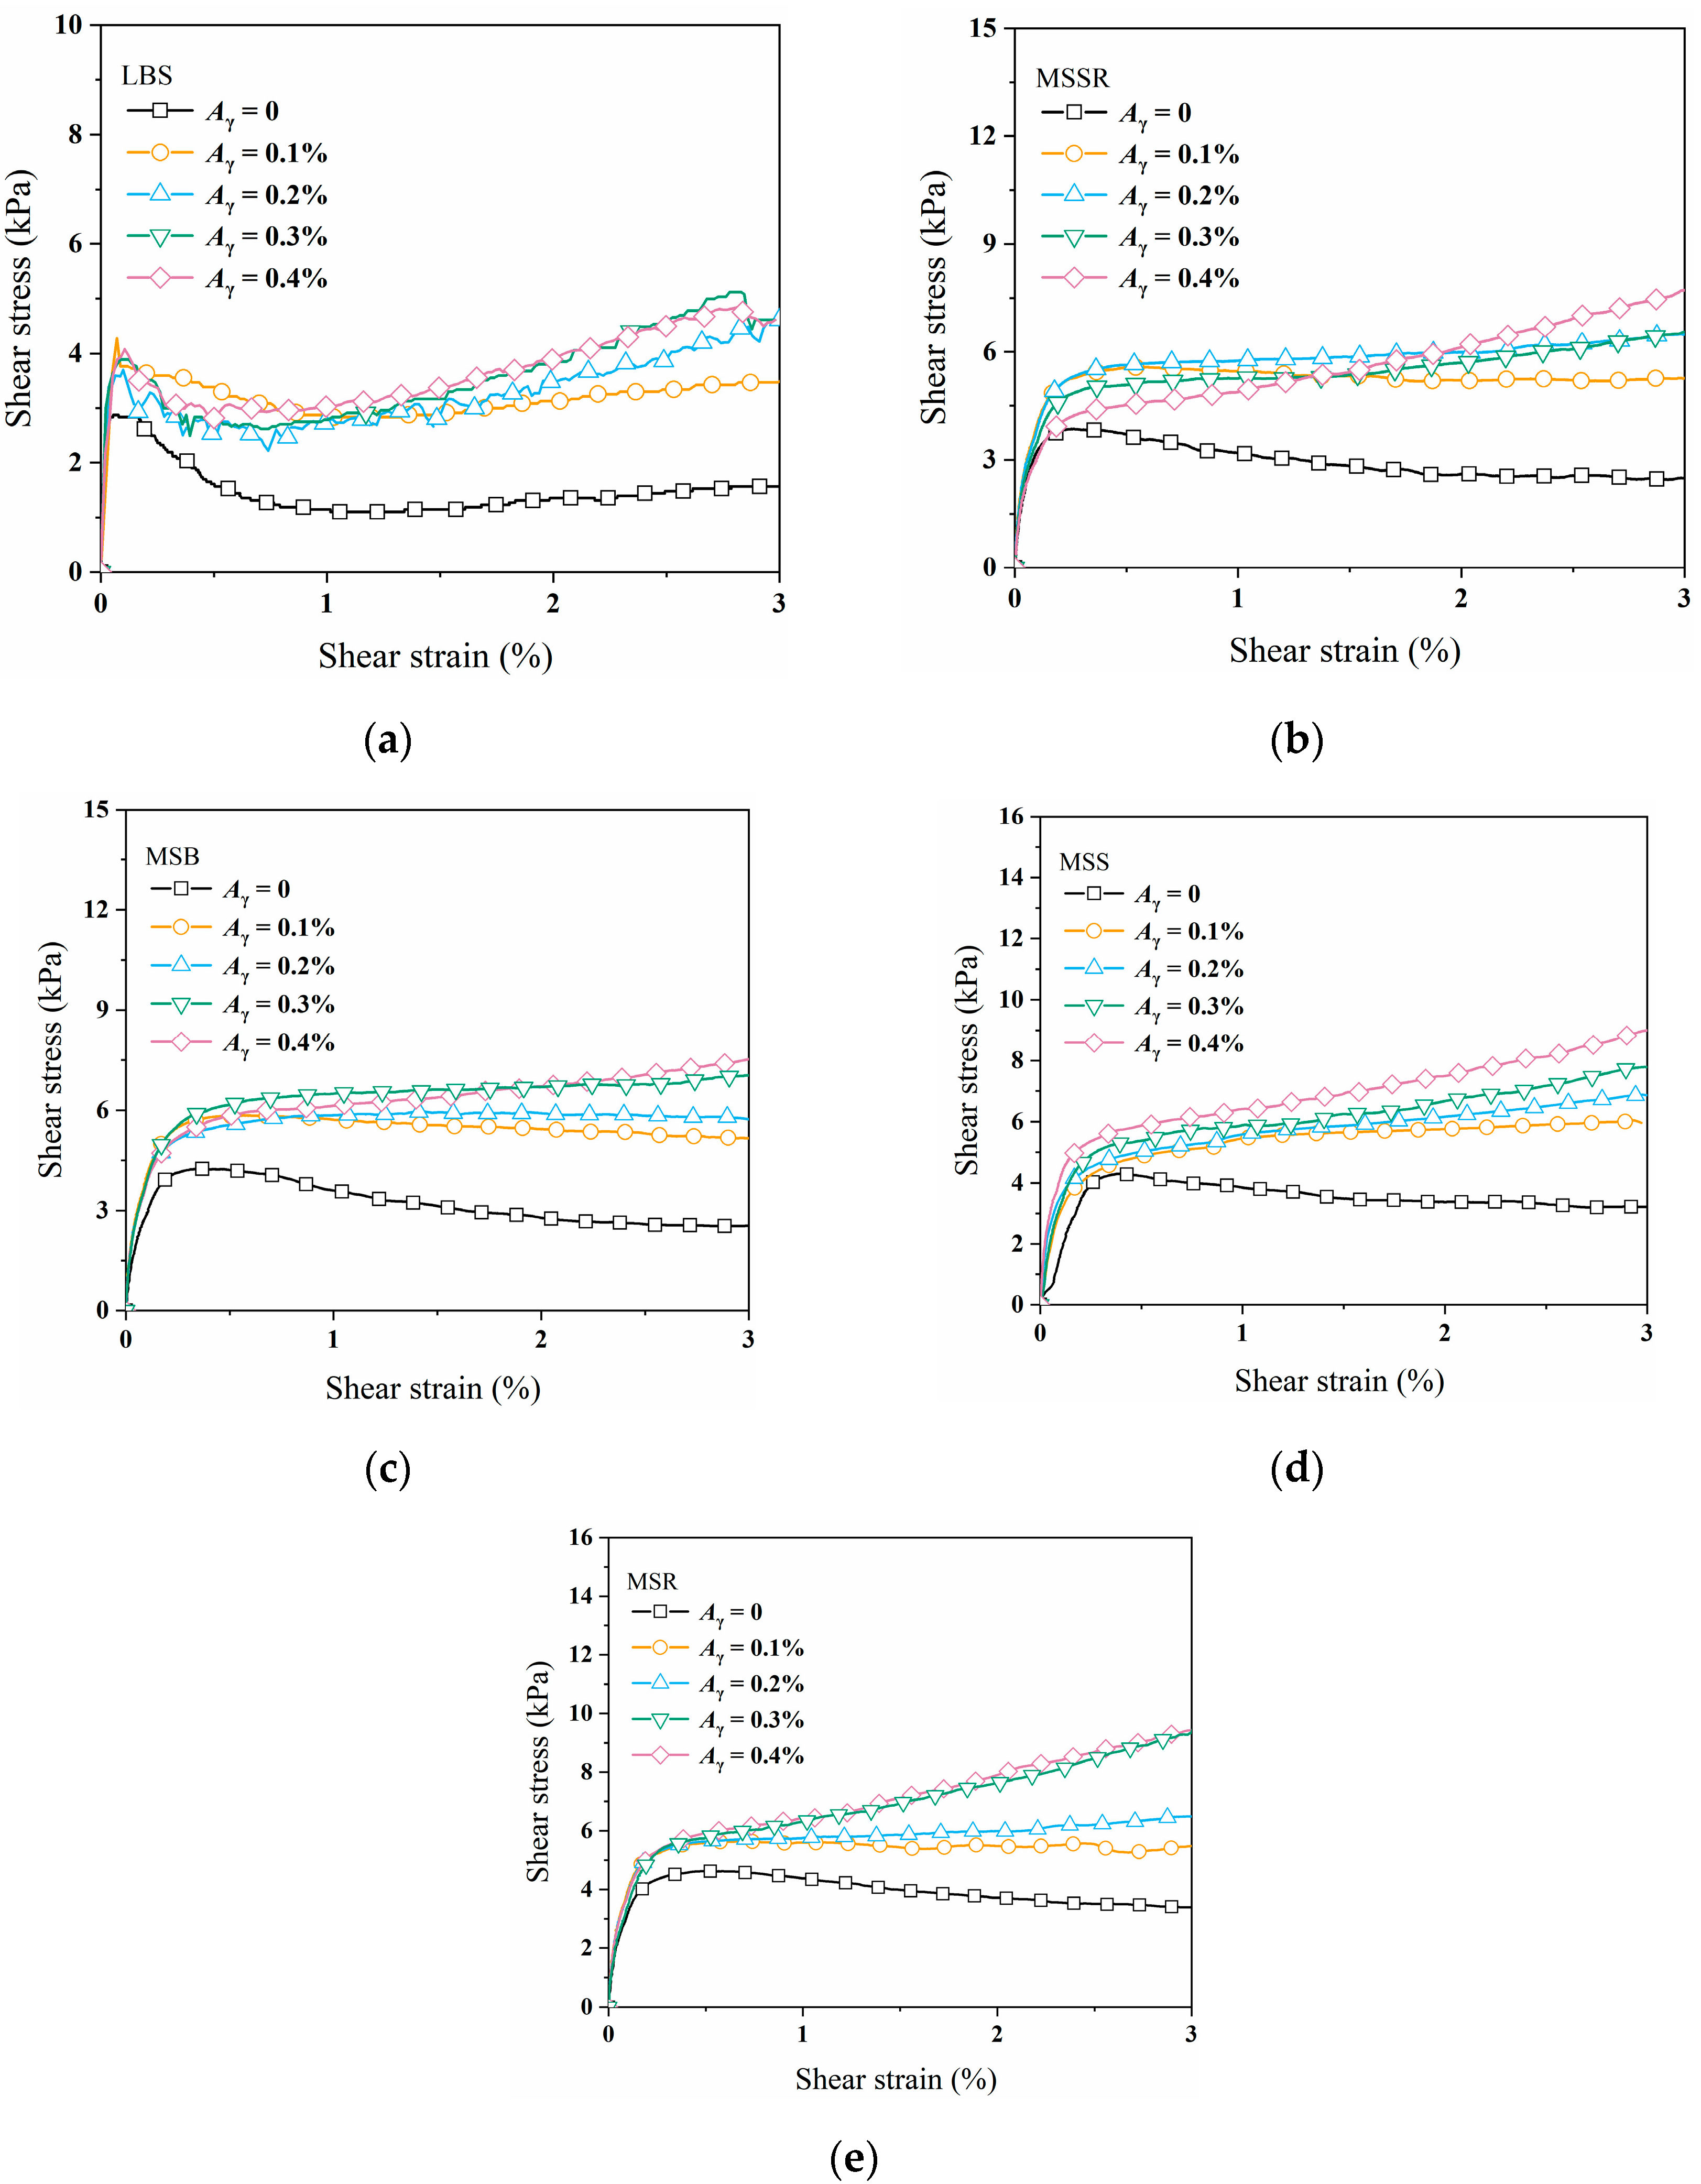
4.2.1. Effects of Particle Shape on Maximum Shear Stress under Various Cyclic Shear Histories
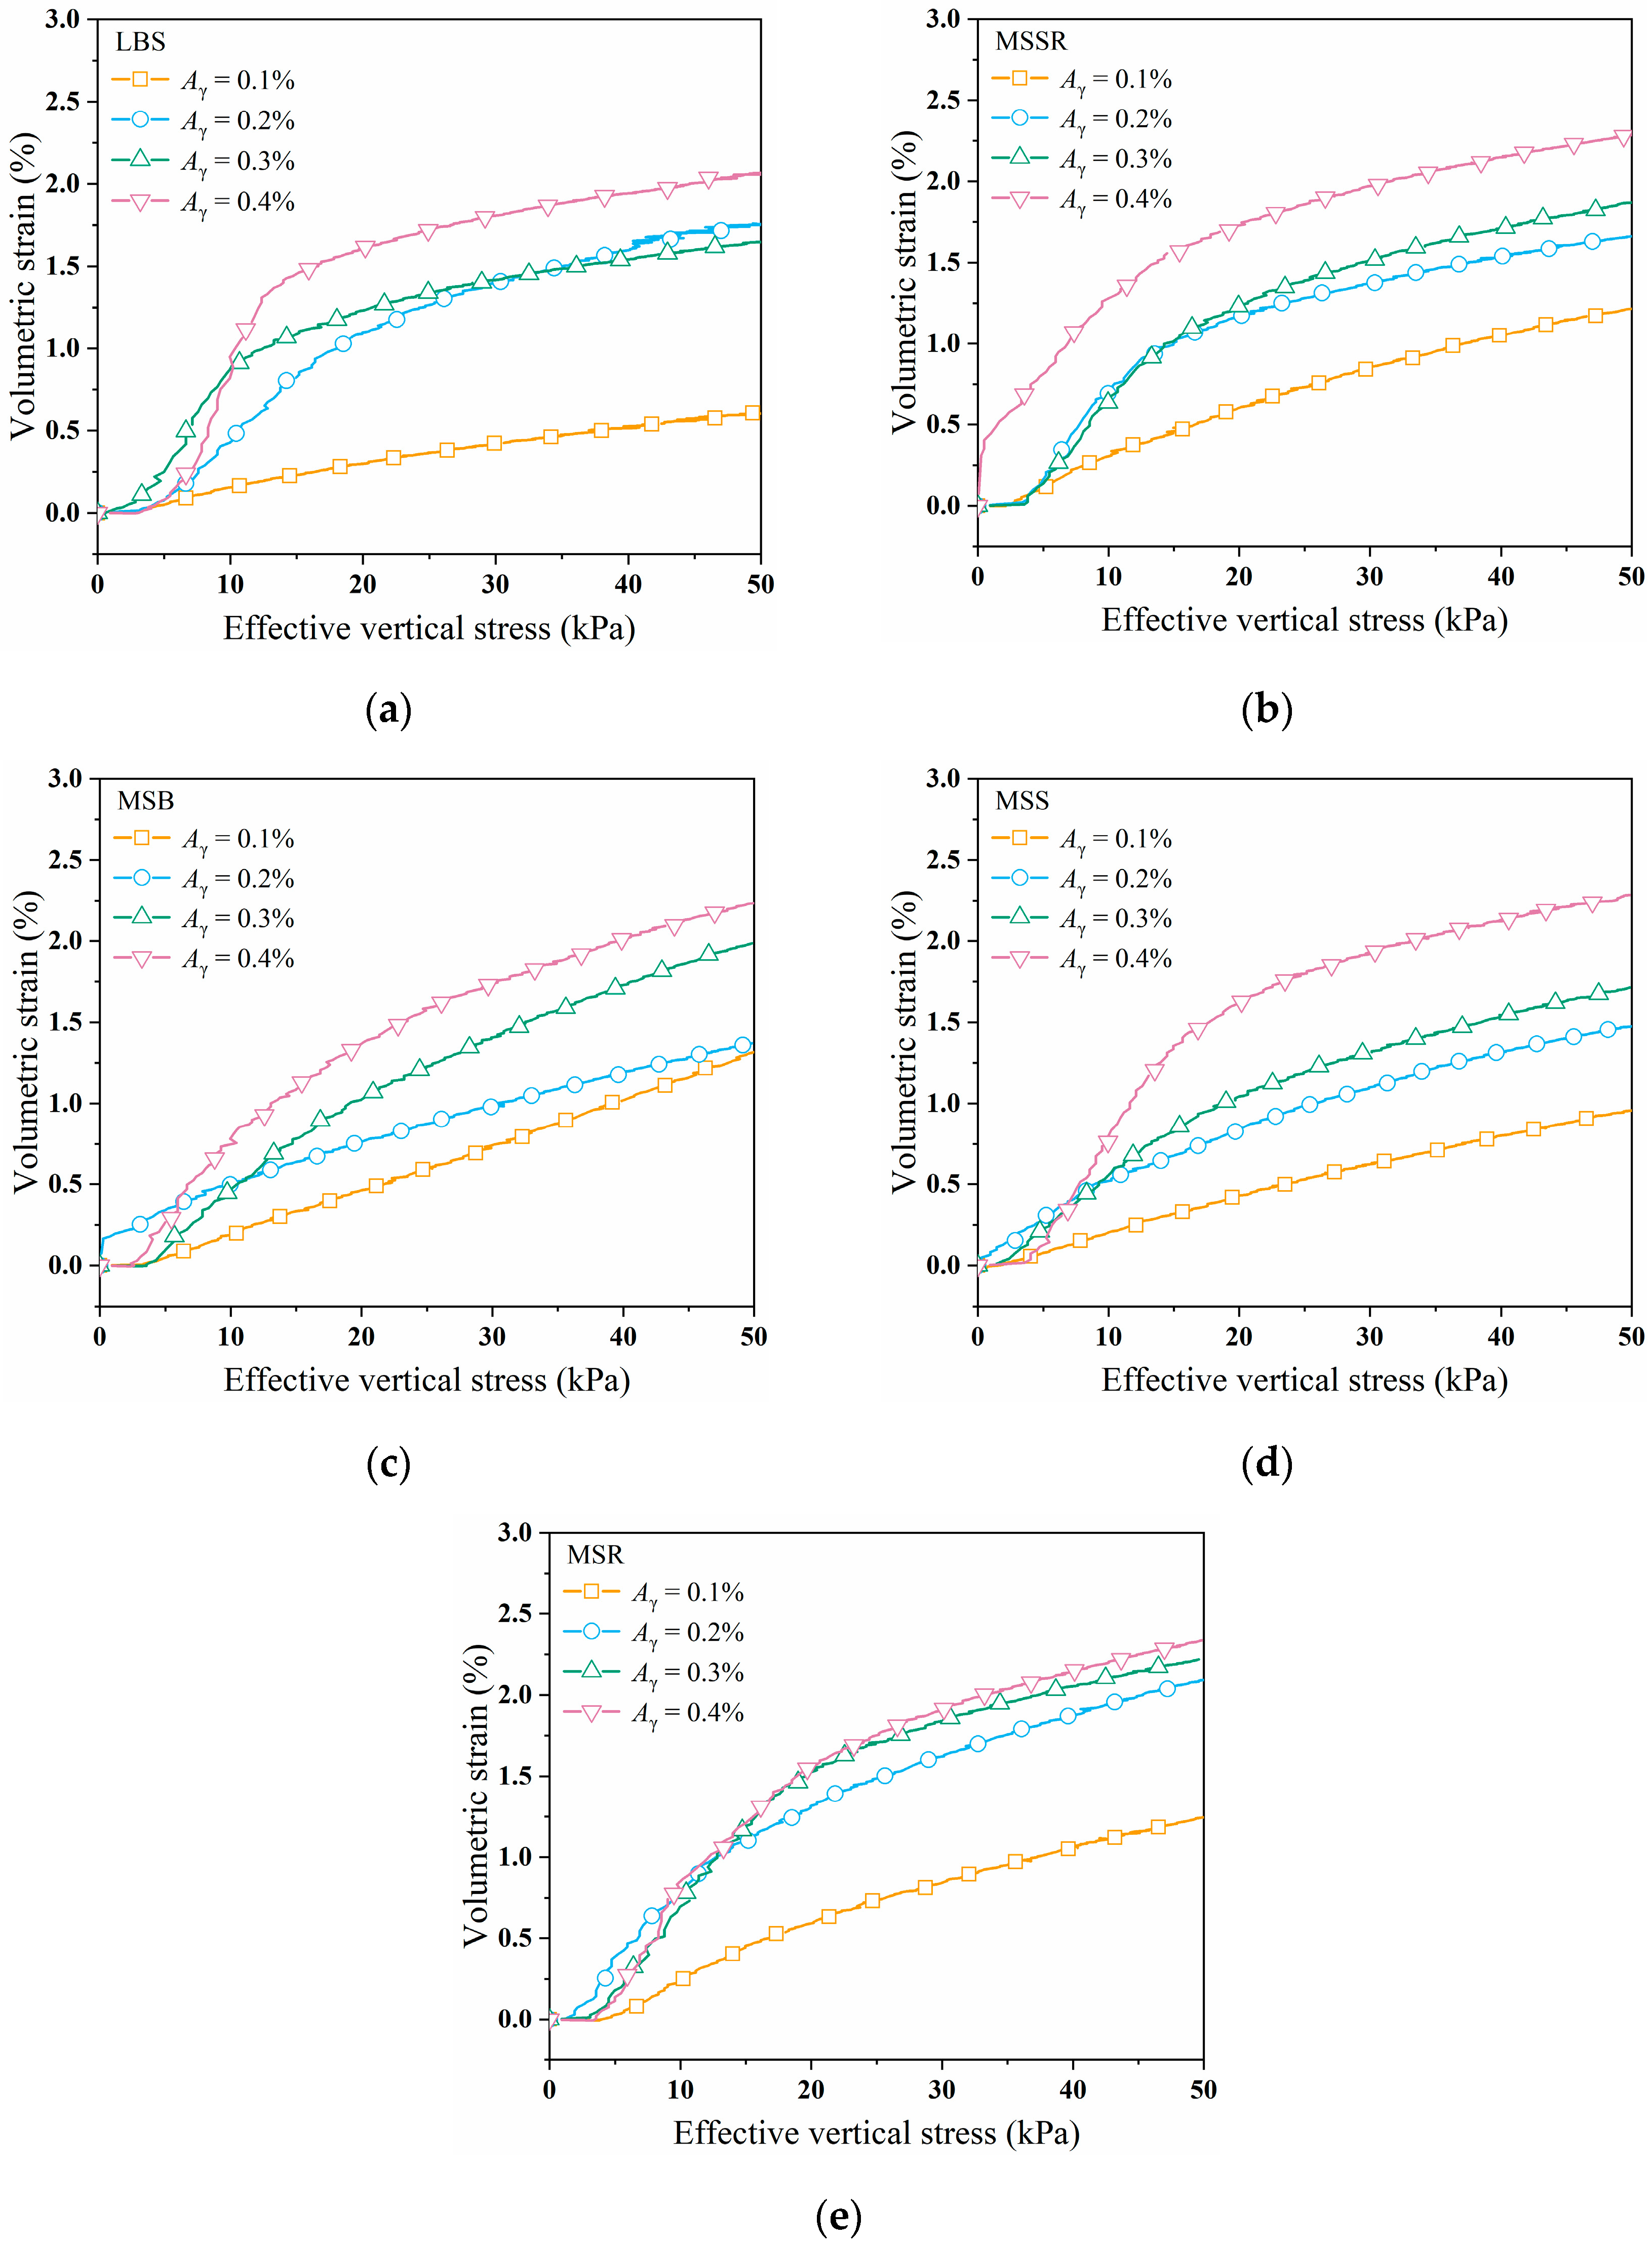
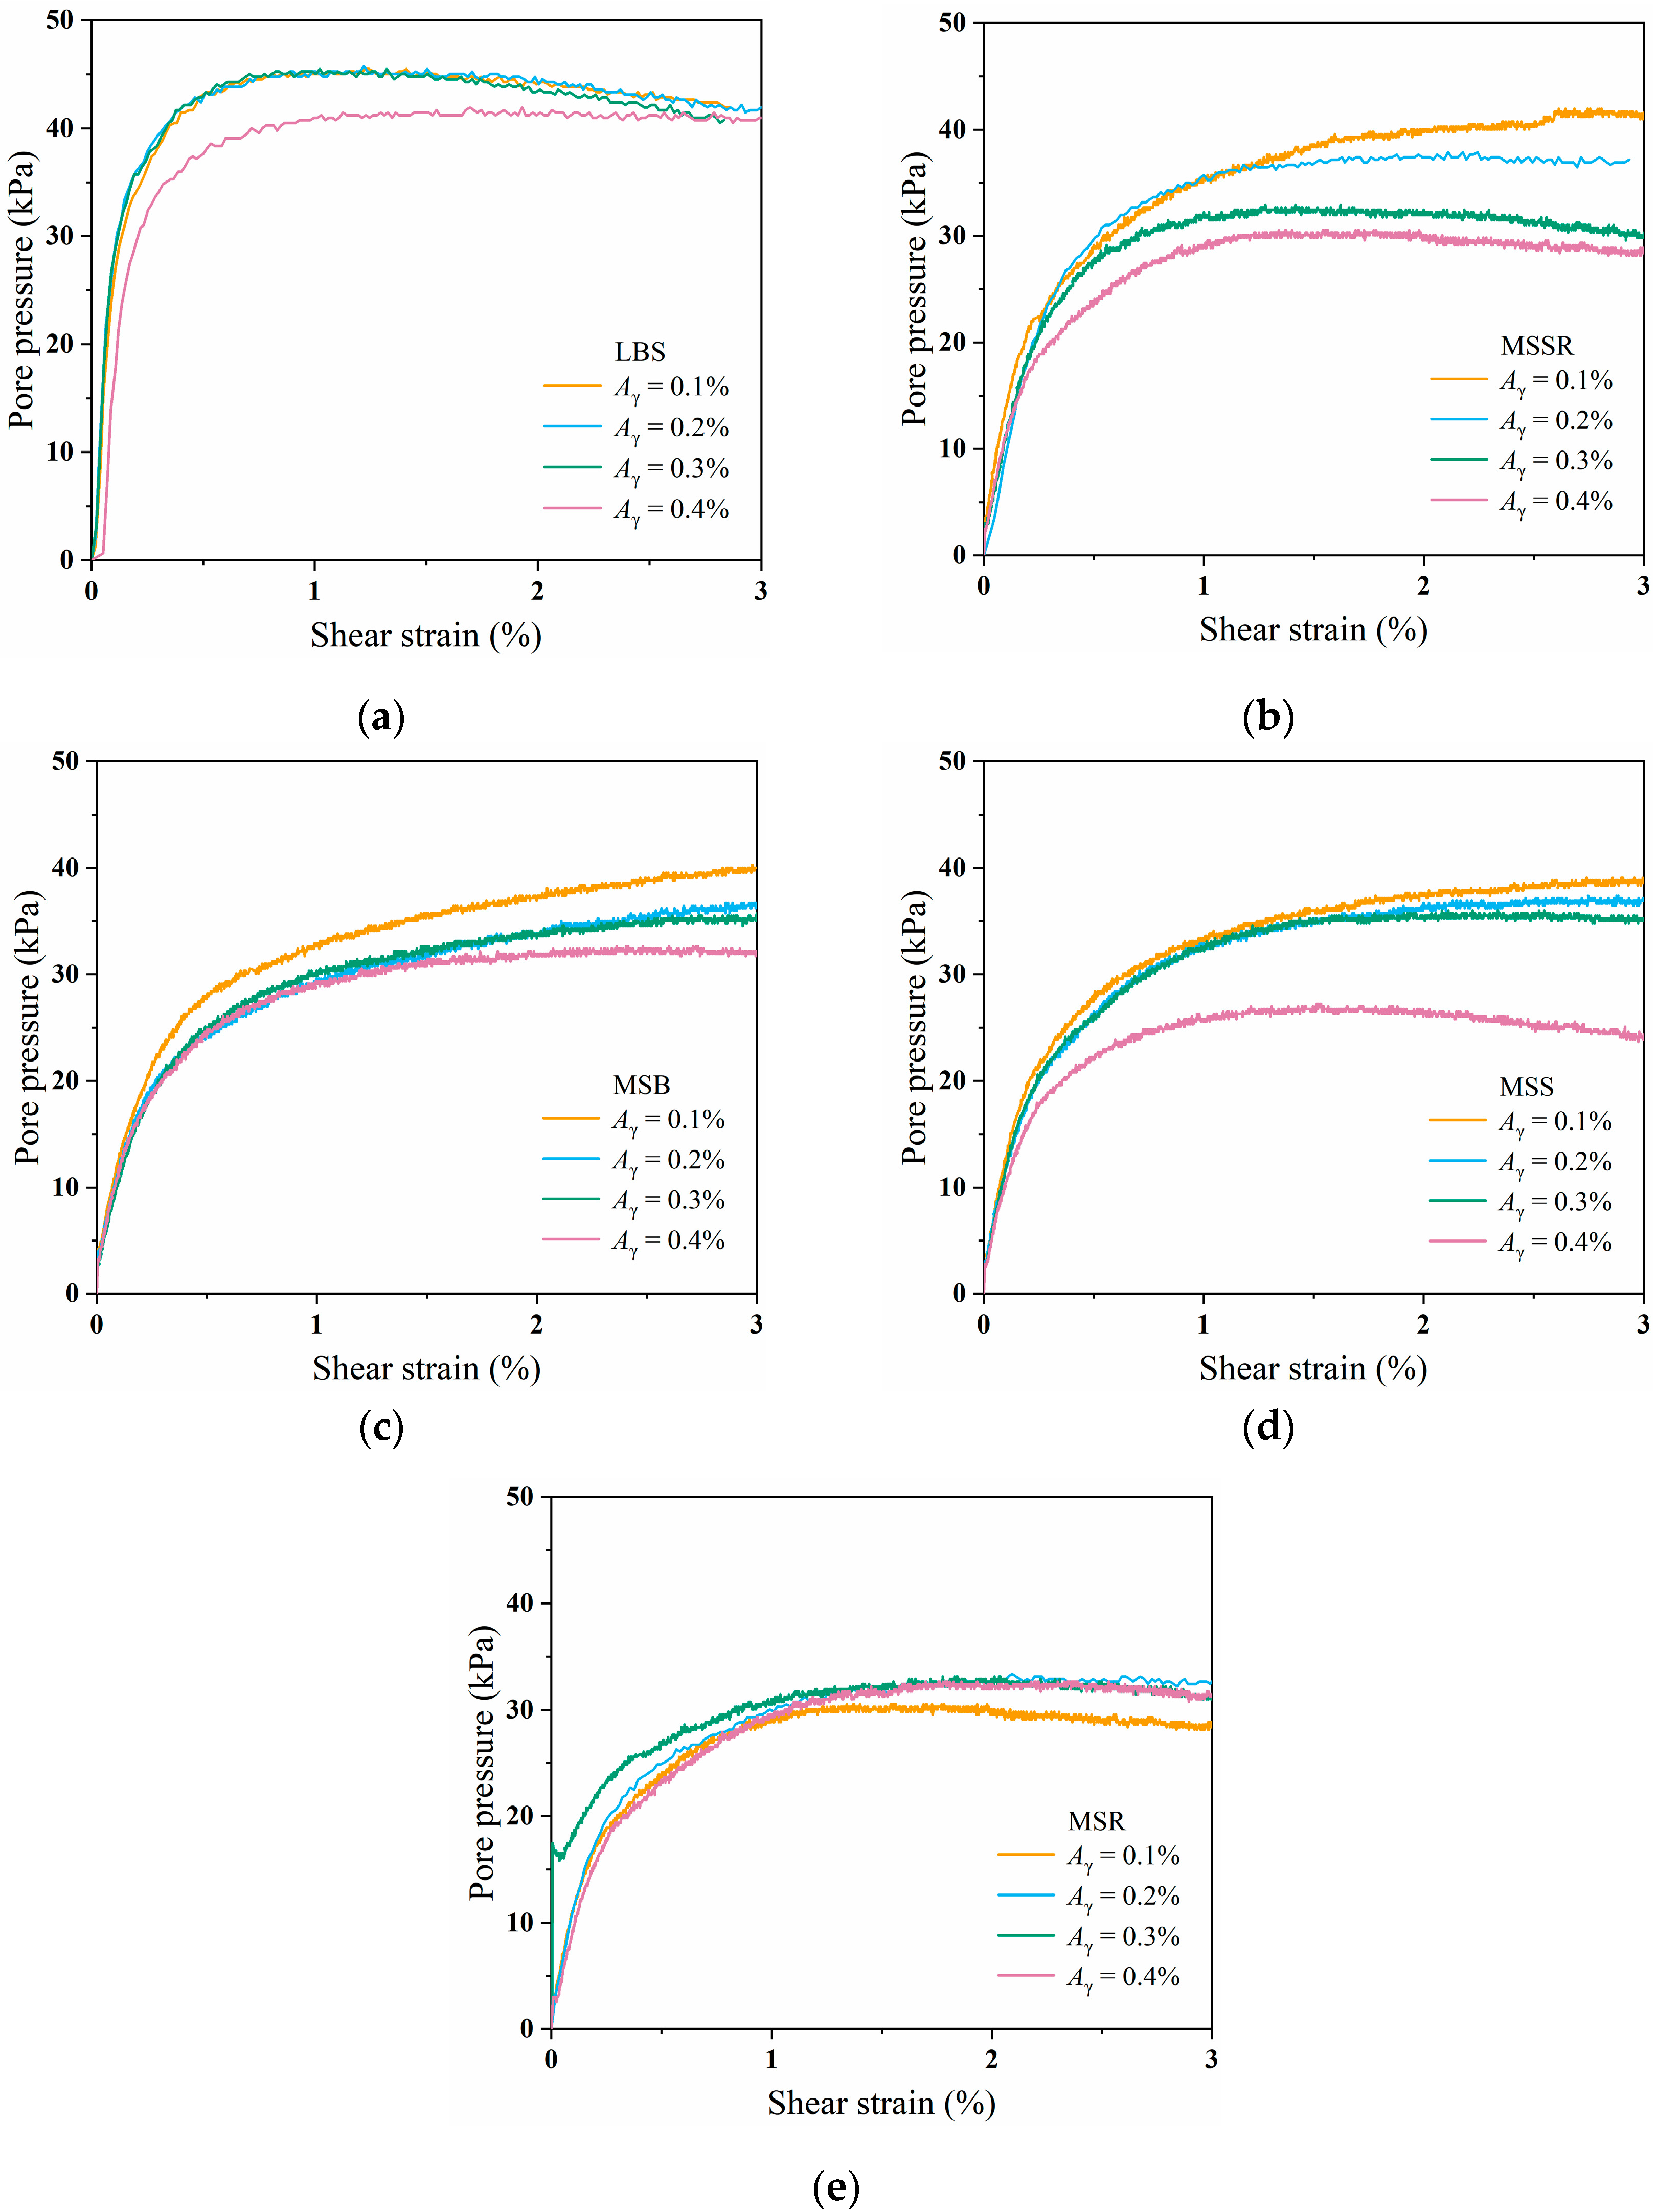
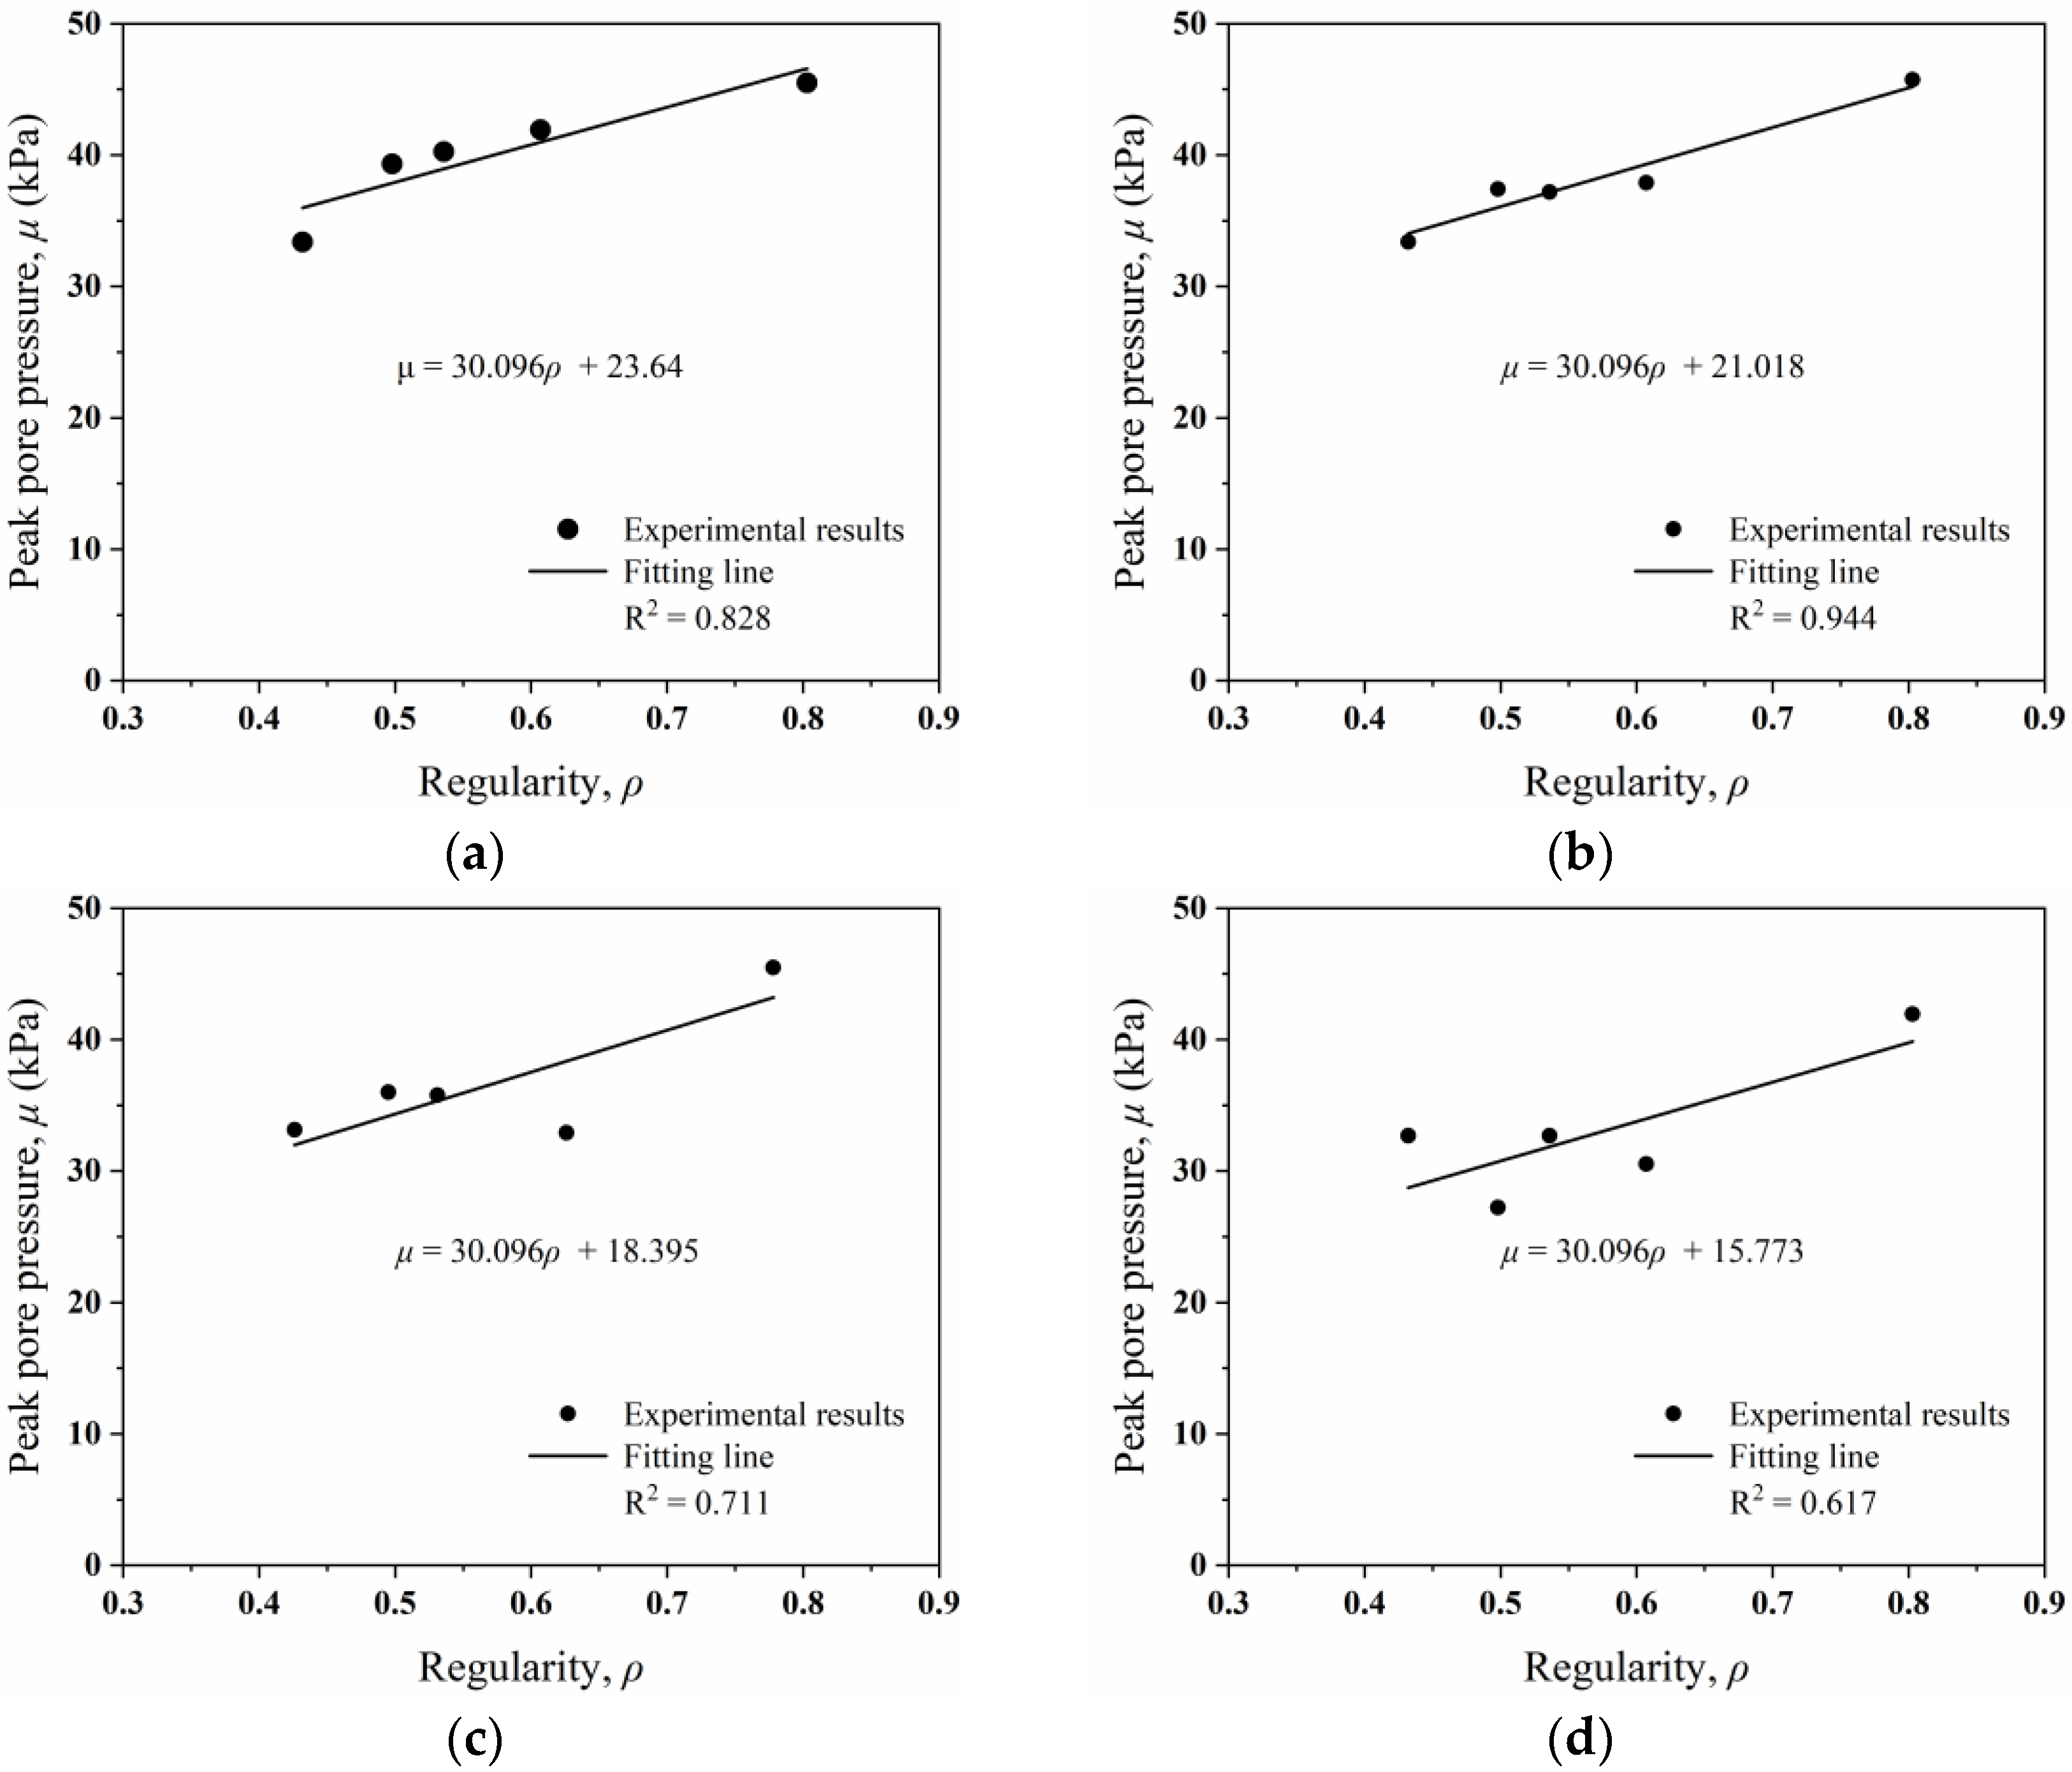
4.2.2. Influences of Particle Shape and Shear History on the Pore Pressure
5. Conclusions
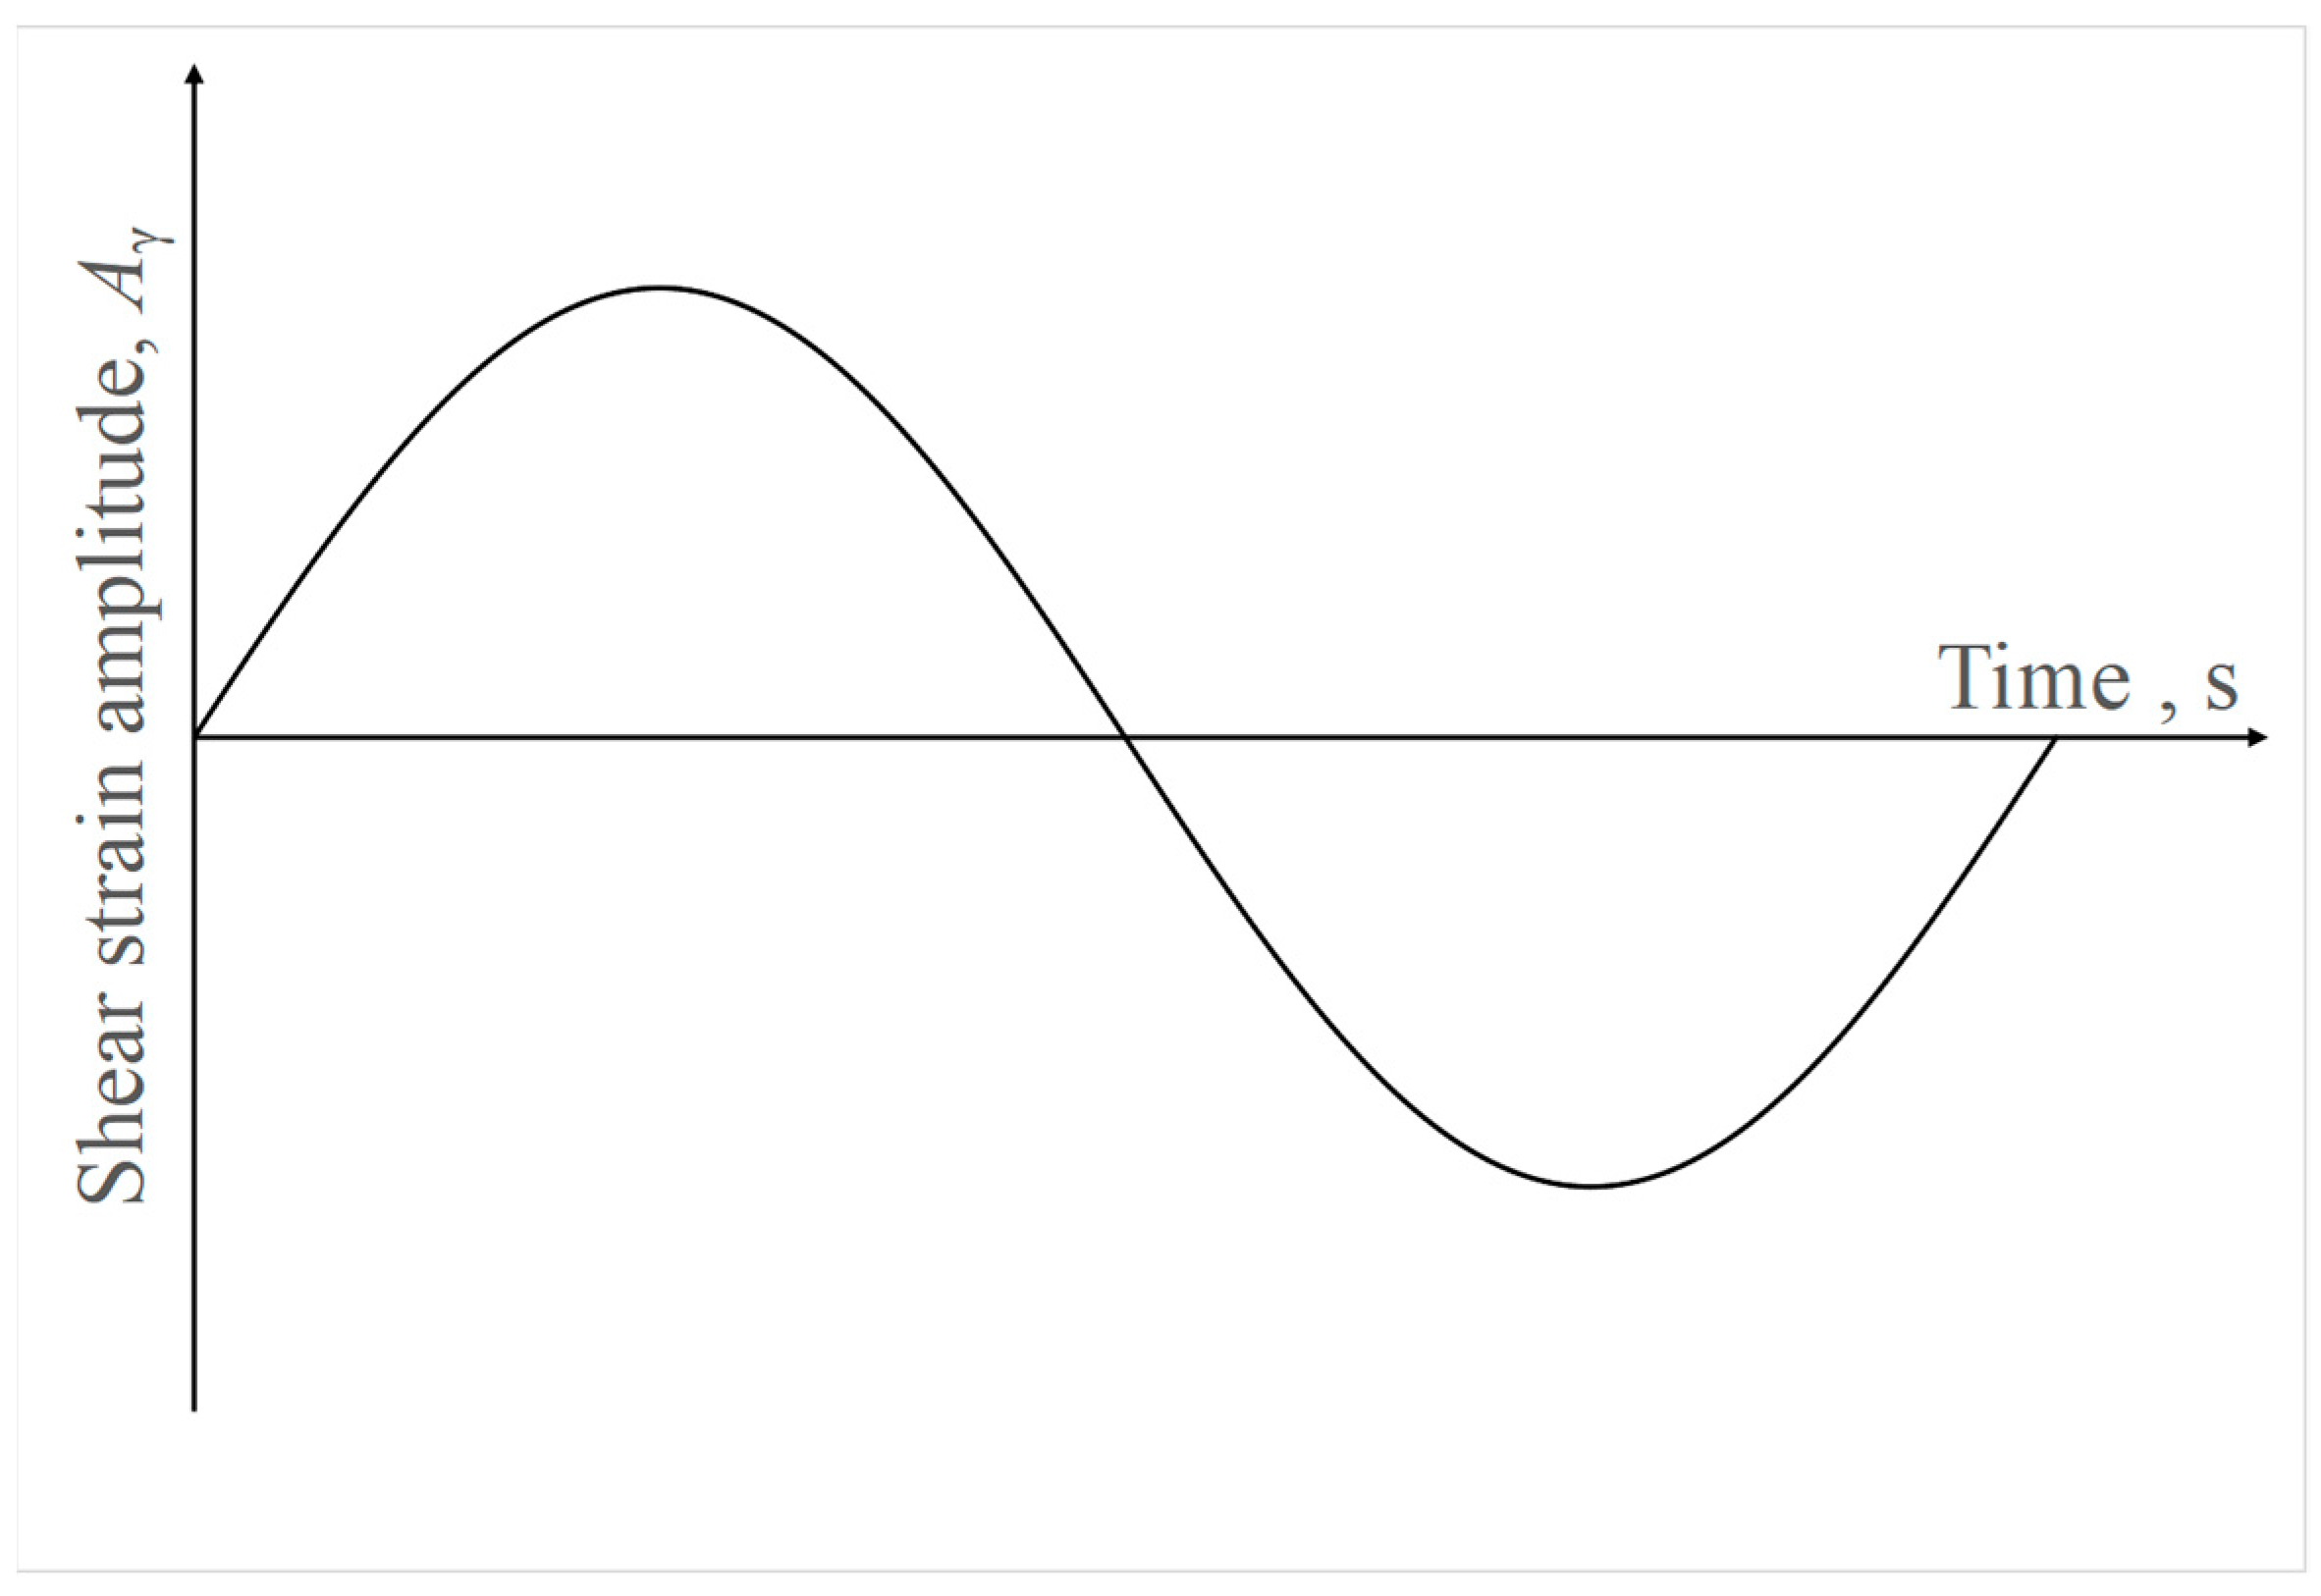
- It was found that irregular shapes not only increase the friction angles, but also enhance the shear stability of the MS samples. In the undrained CSS tests, the samples with irregular particles showed better shear performance and required more cycles to reach liquefaction. A power correlation between shear stiffness and loading cycles was proposed to describe the decrease in shear stiffness. For a given shear amplitude, particle regularity has a noticeable effect on the cyclic shear resistance as the irregular shapes strengthen the interlocking of particles and make them more difficult to dislocate, thus enhancing the cyclic shear resistance of MS.
- In PMS tests, the samples that had undergone cyclic shearing were strengthened and their shear strength was higher than those that did not go through CSS tests. Moreover, the shear strength of the samples improved as the cyclic shear amplitude increased or the regularity of the particles decreased. The relationship between the shear amplitude and peak shear stress under monotonic shearing is proposed. Therefore, although the samples were tested in the same conditions, the MS samples had larger shear strength because the irregularity of the MS samples was generally higher than that of the LBS samples.
- The pore pressure of the samples in the post-liquefaction phase reached the maximum value and then decreased gradually under the monotonic shear. The liner regression between the peak pore pressure and particle regularity was established, which could serve as a reference for the prediction of the pore pressure and shear strength in geotechnical engineering.
- The test results indicated that, generally, MS has a higher friction angle and better mechanical response compared with natural quartz sand. Therefore, MS could serve as the replacement of natural sand in backfilling projects. The relationships discovered in this paper between the shear performance and particle regularity could support the application and selection of MS in offshore and geotechnical engineering.
Author Contributions
Funding
Institutional Review Board Statement
Informed Consent Statement
Data Availability Statement
Conflicts of Interest
References
- Celik, T.; Marar, K. Effects of crushed stone dust on some properties of concrete. Cem. Concr. Res. 1996, 26, 1121–1130. [Google Scholar] [CrossRef]
- Bhoopathy, V.; Subramanian, S.S. The way forward to sustain environmental quality through sustainable sand mining and the use of manufactured sand as an alternative to natural sand. Environ. Sci. Pollut. Res. 2022, 29, 30793–30801. [Google Scholar] [CrossRef] [PubMed]
- Skare, E.L.; Sheiati, S.; Cepuritis, R.; Mørtsell, E.; Smeplass, S.; Spangenberg, J.; Jacobsen, S. Rheology modelling of cement paste with manufactured sand and silica fume: Comparing suspension models with artificial neural network predictions. Constr. Build. Mater. 2022, 317, 126114. [Google Scholar] [CrossRef]
- China Aggregates Association. Super Engineering. 1.1 Billion Tons of Sand and Stone Demand! The State Council Approved that the Expansion and Reclamation of Macao International Airport is Coming. Available online: https://www.sohu.com/a/602752180_99894134 (accessed on 15 January 2023).
- China Aggregates Association. The Reclamation Project Costs more than 115 Billion Yuan and Uses about 250 Million to 300 Million Tons of Manufactured Sand and Construction Waste! This is just One of the Projects. Available online: http://www.zgss.org.cn/gongqiuxinxi/2021/12883.html (accessed on 15 January 2023).
- Shen, W.; Yang, Z.; Cao, L.; Cao, L.; Liu, Y.; Yang, H.; Lu, Z.; Bai, J. Characterization of manufactured sand: Particle shape, surface texture and behavior in concrete. Constr. Build. Mater. 2016, 114, 595–601. [Google Scholar] [CrossRef]
- Yang, J.; Yu, W.; Fang, H.Y.; Huang, X.Y.; Chen, S.J. Detection of size of manufactured sand particles based on digital image processing. PLoS ONE 2018, 13, e0206135. [Google Scholar] [CrossRef]
- Yang, R.; Yu, R.; Shui, Z.; Guo, C.; Wu, S.; Gao, X.; Peng, S. The physical and chemical impact of manufactured sand as a partial replacement material in Ultra-High Performance Concrete (UHPC). Cem. Concr. Compos. 2019, 99, 203–213. [Google Scholar] [CrossRef]
- Zhu, J.; Liu, J.; Khayat, K.H.; Shu, X.; Ran, Q.; Li, Z. Mechanisms affecting viscosity of cement paste made with microfines of manufactured sand. Cem. Concr. Res. 2022, 156, 106757. [Google Scholar] [CrossRef]
- Altuhafi, F.; O’Sullivan, C.; Cavarretta, I. Analysis of an image-based method to quantify the size and shape of sand particles. J. Geotech. Geoenvironmental Eng. 2013, 139, 1290–1307. [Google Scholar] [CrossRef]
- Yang, J.; Luo, X.D. Exploring the relationship between critical state and particle shape for granular materials. J. Mech. Phys. Solids 2015, 84, 196–213. [Google Scholar] [CrossRef]
- de Bono, J.; McDowell, G. The effects of particle shape on the yielding behaviour of crushable sand. Soils Found. 2020, 60, 520–532. [Google Scholar] [CrossRef]
- Seo, D.; Sohn, C.; Cil, M.B.; Buscarnera, G. Evolution of particle morphology and mode of fracture during the oedometric compression of sand. Geotechnique 2021, 71, 853–865. [Google Scholar] [CrossRef]
- Yang, J.; Luo, X.D. The critical state friction angle of granular materials: Does it depend on grading? Acta Geotech. 2018, 13, 535–547. [Google Scholar] [CrossRef]
- Yang, J.; Wei, L.M. Collapse of loose sand with the addition of fines: The role of particle shape. Geotechnique 2012, 62, 1111–1125. [Google Scholar] [CrossRef] [Green Version]
- Maeda, K.; Sakai, H.; Kondo, A.; Yamaguchi, T.; Nukudani, E. Stress-chain based micromechanics of sand with grain shape effect. Granul. Matter. 2010, 12, 499–505. [Google Scholar] [CrossRef]
- Altuhafi, F.N.; Coop, M.R.; Georgiannou, V.N. Effect of particle shape on the mechanical behavior of natural sands. J. Geotech. Geoenvironmental Eng. 2016, 142, 04016071. [Google Scholar] [CrossRef]
- Seed, H.B.; Lee, K.L.; Idriss, I.M.; Makdisi, F.I. The slides in the San Fernando dams during the earthquake of February 9, 1971. J. Geotech. Eng. Div. 1975, 101, 651–688. [Google Scholar] [CrossRef]
- Shamoto, Y.; Zhang, J.-M.; Goto, S. Mechanism of large post-liquefaction deformation in saturated sand. Soils Found. 1997, 37, 71–80. [Google Scholar] [CrossRef] [Green Version]
- Aguirre, J.; Irikura, K. Nonlinearity, liquefaction, and velocity variation of soft soil layers in Port Island, Kobe, during the Hyogo-ken Nanbu earthquake. Bull. Seismol. Soc. Am. 1997, 87, 1244–1258. [Google Scholar] [CrossRef]
- Kokusho, T.; Hara, T.; Hiraoka, R. Undrained shear strength of granular soils with different particle gradations. J. Geotech. Geoenvironmental Eng. 2004, 130, 621–629. [Google Scholar] [CrossRef]
- Sato, K.; Kokusho, T.; Matsumoto, M.; Yamada, E. Nonlinear seismic response and soil property during strong motion. Soils Found. 1996, 36, 41–52. [Google Scholar] [CrossRef] [Green Version]
- Rabeti Moghadam, M.; Alielahi, H.; Sadeghi Abdollahi, A. Numerical evaluation of liquefaction-induced damages in composite breakwaters and its application for performance-based improvement design. Mar. Georesources Geotechnol. 2017, 35, 376–396. [Google Scholar] [CrossRef]
- Hu, A.F.; Fu, P.; Xia, C.Q.; Xie, K.H. Lateral dynamic response of a partially embedded pile subjected to combined loads in saturated soil. Mar. Georesources Geotechnol. 2017, 35, 788–798. [Google Scholar] [CrossRef]
- Hachey, J.; Been, K.; Jefferies, M.G. The critical state of sands. Geotechnique 1991, 41, 365–381. [Google Scholar]
- Silver, M.L.; Bolton, S.H. Volume Changes in Sands during Cyclic Loading. J. Soil Mech. Found. Div. 1971, 97, 1171–1182. [Google Scholar] [CrossRef]
- Leslie, Y.T. Compaction of Sands by Repeated Shear Straining. J. Soil Mech. Found. Div. 1972, 98, 709–725. [Google Scholar]
- Polito, C.P.; Martin, J.R., II. Effects of nonplastic fines on the liquefaction resistance of sands. J. Geotech. Geoenvironmental Eng. 2001, 127, 408–415. [Google Scholar] [CrossRef]
- Shamoto, Y.; Zhang, J.-M. Evaluation of Seismic Settlement Potential of Saturated Sandy Ground Based On Concept of Relative Compression. Soils Found. 1998, 38, 57–68. [Google Scholar] [CrossRef] [Green Version]
- Zhang, H.; Yang, Y.; Yu, H.S. Liquefaction and post-liquefaction of granular material under multi-directional cyclic loading. Mar. Georesources Geotechnol. 2021, 39, 1261–1272. [Google Scholar] [CrossRef]
- Ahn, I.S.; Cheng, L. Tire derived aggregate for retaining wall backfill under earthquake loading. Constr. Build. Mater. 2014, 57, 105–116. [Google Scholar] [CrossRef]
- Moghaddas Tafreshi, S.N.; Norouzi, A.H. Bearing capacity of a square model footing on sand reinforced with shredded tire - An experimental investigation. Constr. Build. Mater. 2012, 35, 547–556. [Google Scholar] [CrossRef]
- Shariatmadari, N.; Norouzi, M.; Rezvani, R. Stress–strain behavior of marine calcareous soil-tire mixtures. Mar. Georesources Geotechnol. 2021, 40, 739–750. [Google Scholar] [CrossRef]
- McKelvey, D.; Sivakumar, V.; Bell, A.; McLaverty, G. Shear strength of recycled construction materials intended for use in vibro ground improvement. Ground Improv. 2002, 6, 59–68. [Google Scholar] [CrossRef]
- Li, B.; Wang, Y.; Jin, Q.; Chen, H. Liquefaction characteristics of recycled concrete aggregates. Soil Dyn. Earthq. Eng. 2019, 120, 85–96. [Google Scholar] [CrossRef]
- Herrador, R.; Pérez, P.; Garach, L.; Ordóñez, J. Use of Recycled Construction and Demolition Waste Aggregate for Road Course Surfacing. J. Transp. Eng. 2011, 138, 182–190. [Google Scholar] [CrossRef]
- Huang, Y.; Wang, J.; Ying, M.; Ni, J.; Li, M. Effect of particle-size gradation on cyclic shear properties of recycled concrete aggregate. Constr. Build. Mater. 2021, 301, 124143. [Google Scholar] [CrossRef]
- Jiménez, J.R.; Ayuso, J.; Agrela, F.; López, M.; Galvín, A.P. Utilisation of unbound recycled aggregates from selected CDW in unpaved rural roads. Resour. Conserv. Recycl. 2012, 58, 88–97. [Google Scholar] [CrossRef]
- Maduabuchukwu Nwakaire, C.; Poh Yap, S.; Chuen Onn, C.; Wah Yuen, C.; Adebayo Ibrahim, H. Utilisation of recycled concrete aggregates for sustainable highway pavement applications: A review. Constr. Build. Mater. 2020, 235, 117444. [Google Scholar] [CrossRef]
- Saberian, M.; Li, J.; Nguyen, B.; Wang, G. Permanent deformation behaviour of pavement base and subbase containing recycle concrete aggregate, coarse and fine crumb rubber. Constr. Build. Mater. 2018, 178, 51–58. [Google Scholar] [CrossRef]
- ASTM D4253; Standard Test Methods for Maximum Index Density and Unit Weight of Soils Using a Vibratory Table. ASTM International: West Conshohocken, PA, USA, 2016.
- ASTM D4254; Standard Test Method for Minimum Index Density and Unit Weight of Soils and Calculation of Relative Density. ASTM International: West Conshohocken, PA, USA, 2016.
- Wadell, H. Volume, Shape, and Roundness of Rock Particles. J. Geol. 1932, 40, 443–451. [Google Scholar] [CrossRef]
- Krumbein, W.C. Measurement and Geological Significance of Shape and Roundness of Sedimentary Particles. SEPM J. Sediment. Res. 1941, 11, 64–72. [Google Scholar] [CrossRef]
- Cho, G.C.; Dodds, J.; Santamarina, J.C. Closure to “Particle shape effects on packing density, stiffness, and strength: Natural and crushed sands” by Gye-Chun Cho, Jake Dodds, and J. Carlos Santamarina. J. Geotech. Geoenvironmental Eng. 2007, 133, 1474. [Google Scholar] [CrossRef]
- Suh, H.S.; Kim, K.Y.; Lee, J.; Yun, T.S. Quantification of bulk form and angularity of particle with correlation of shear strength and packing density in sands. Eng. Geol. 2017, 220, 256–265. [Google Scholar] [CrossRef]
- Xiao, Y.; Long, L.; Evans, T.M.; Zhou, H.; Liu, H.; Stuedlein, A.W. Effect of particle shape on stress-dilatancy responses of medium-dense sands. J. Geotech. Geoenvironmental Eng. 2019, 145, 04018105. [Google Scholar] [CrossRef]
- He, Z.; Shen, A.; Wu, H.; Wang, W.; Wang, L.; Guo, Y. Properties and mechanisms of brick-concrete recycled aggregate strengthened by compound modification treatment. Constr. Build. Mater. 2022, 315, 125678. [Google Scholar] [CrossRef]
- Ying, M.; Liu, F.; Wang, J.; Wang, C.; Li, M. Coupling effects of particle shape and cyclic shear history on shear properties of coarse-grained soil–geogrid interface. Transp. Geotech. 2021, 27, 100504. [Google Scholar] [CrossRef]
- Zheng, J.; Hryciw, R.D. Traditional soil particle sphericity, roundness and surface roughness by computational geometry. Geotechnique 2015, 65, 494–506. [Google Scholar] [CrossRef]
- Zheng, J.; Hryciw, R.D. Index void ratios of sands from their intrinsic properties. J. Geotech. Geoenvironmental Eng. 2016, 142, 06016019. [Google Scholar] [CrossRef]
- ASTM D8296-19; Standard Test Method for Consolidated Undrained Cyclic Direct Simple Shear Test under Constant Volume with Load Control or Displacement Control. ASTM International: West Conshohocken, PA, USA, 2019.
- Chiaro, G.; Koseki, J.; Sato, T. Effects of initial static shear on liquefaction and large deformation properties of loose saturated Toyoura sand in undrained cyclic torsional shear tests. Soils Found. 2012, 52, 498–510. [Google Scholar] [CrossRef] [Green Version]
- Della, N.; Belkhatir, M.; Arab, A.; Canou, J.; Dupla, J.C. Undrained Monotonic Response and Instability of Medium-Dense Sandy Soil. Mar. Georesources Geotechnol. 2015, 33, 487–495. [Google Scholar] [CrossRef]
- Wang, Y.; Gao, Y.; Guo, L.; Cai, Y.; Li, B.; Qiu, Y.; Mahfouz, A.H. Cyclic response of natural soft marine clay under principal stress rotation as induced by wave loads. Ocean. Eng. 2017, 129, 191–202. [Google Scholar] [CrossRef]
- Dyvik, R.; Berre, T.; Lacasse, S.; Raadim, B. Comparison of truly undrained and constant volume direct simple shear tests. Geotechnique 1987, 37, 3–10. [Google Scholar] [CrossRef]
- Wang, Z.; Yang, Y.; Li, Y.; Liu, S.; Zhou, P. Numerical simulation of cyclic shear tests considering the fabric change and principal stress rotation effects. Int. J. Numer. Anal. Methods Geomech. 2022, 46, 1409–1432. [Google Scholar] [CrossRef]
- Keramatikerman, M.; Chegenizadeh, A. Effect of Particle Shape on Monotonic Liquefaction: Natural and Crushed Sand. Exp. Mech. 2017, 57, 1341–1348. [Google Scholar] [CrossRef]
- Rui, S.; Guo, Z.; Si, T.; Li, Y. Effect of particle shape on the liquefaction resistance of calcareous sands. Soil Dyn. Earthq. Eng. 2020, 137, 106302. [Google Scholar] [CrossRef]


| Material | LBS | MSSR | MSB | MSS | MSR |
|---|---|---|---|---|---|
| Specific gravity Gs (g/cm3) | 2.65 | 2.65 | 2.65 | 2.60 | 2.70 |
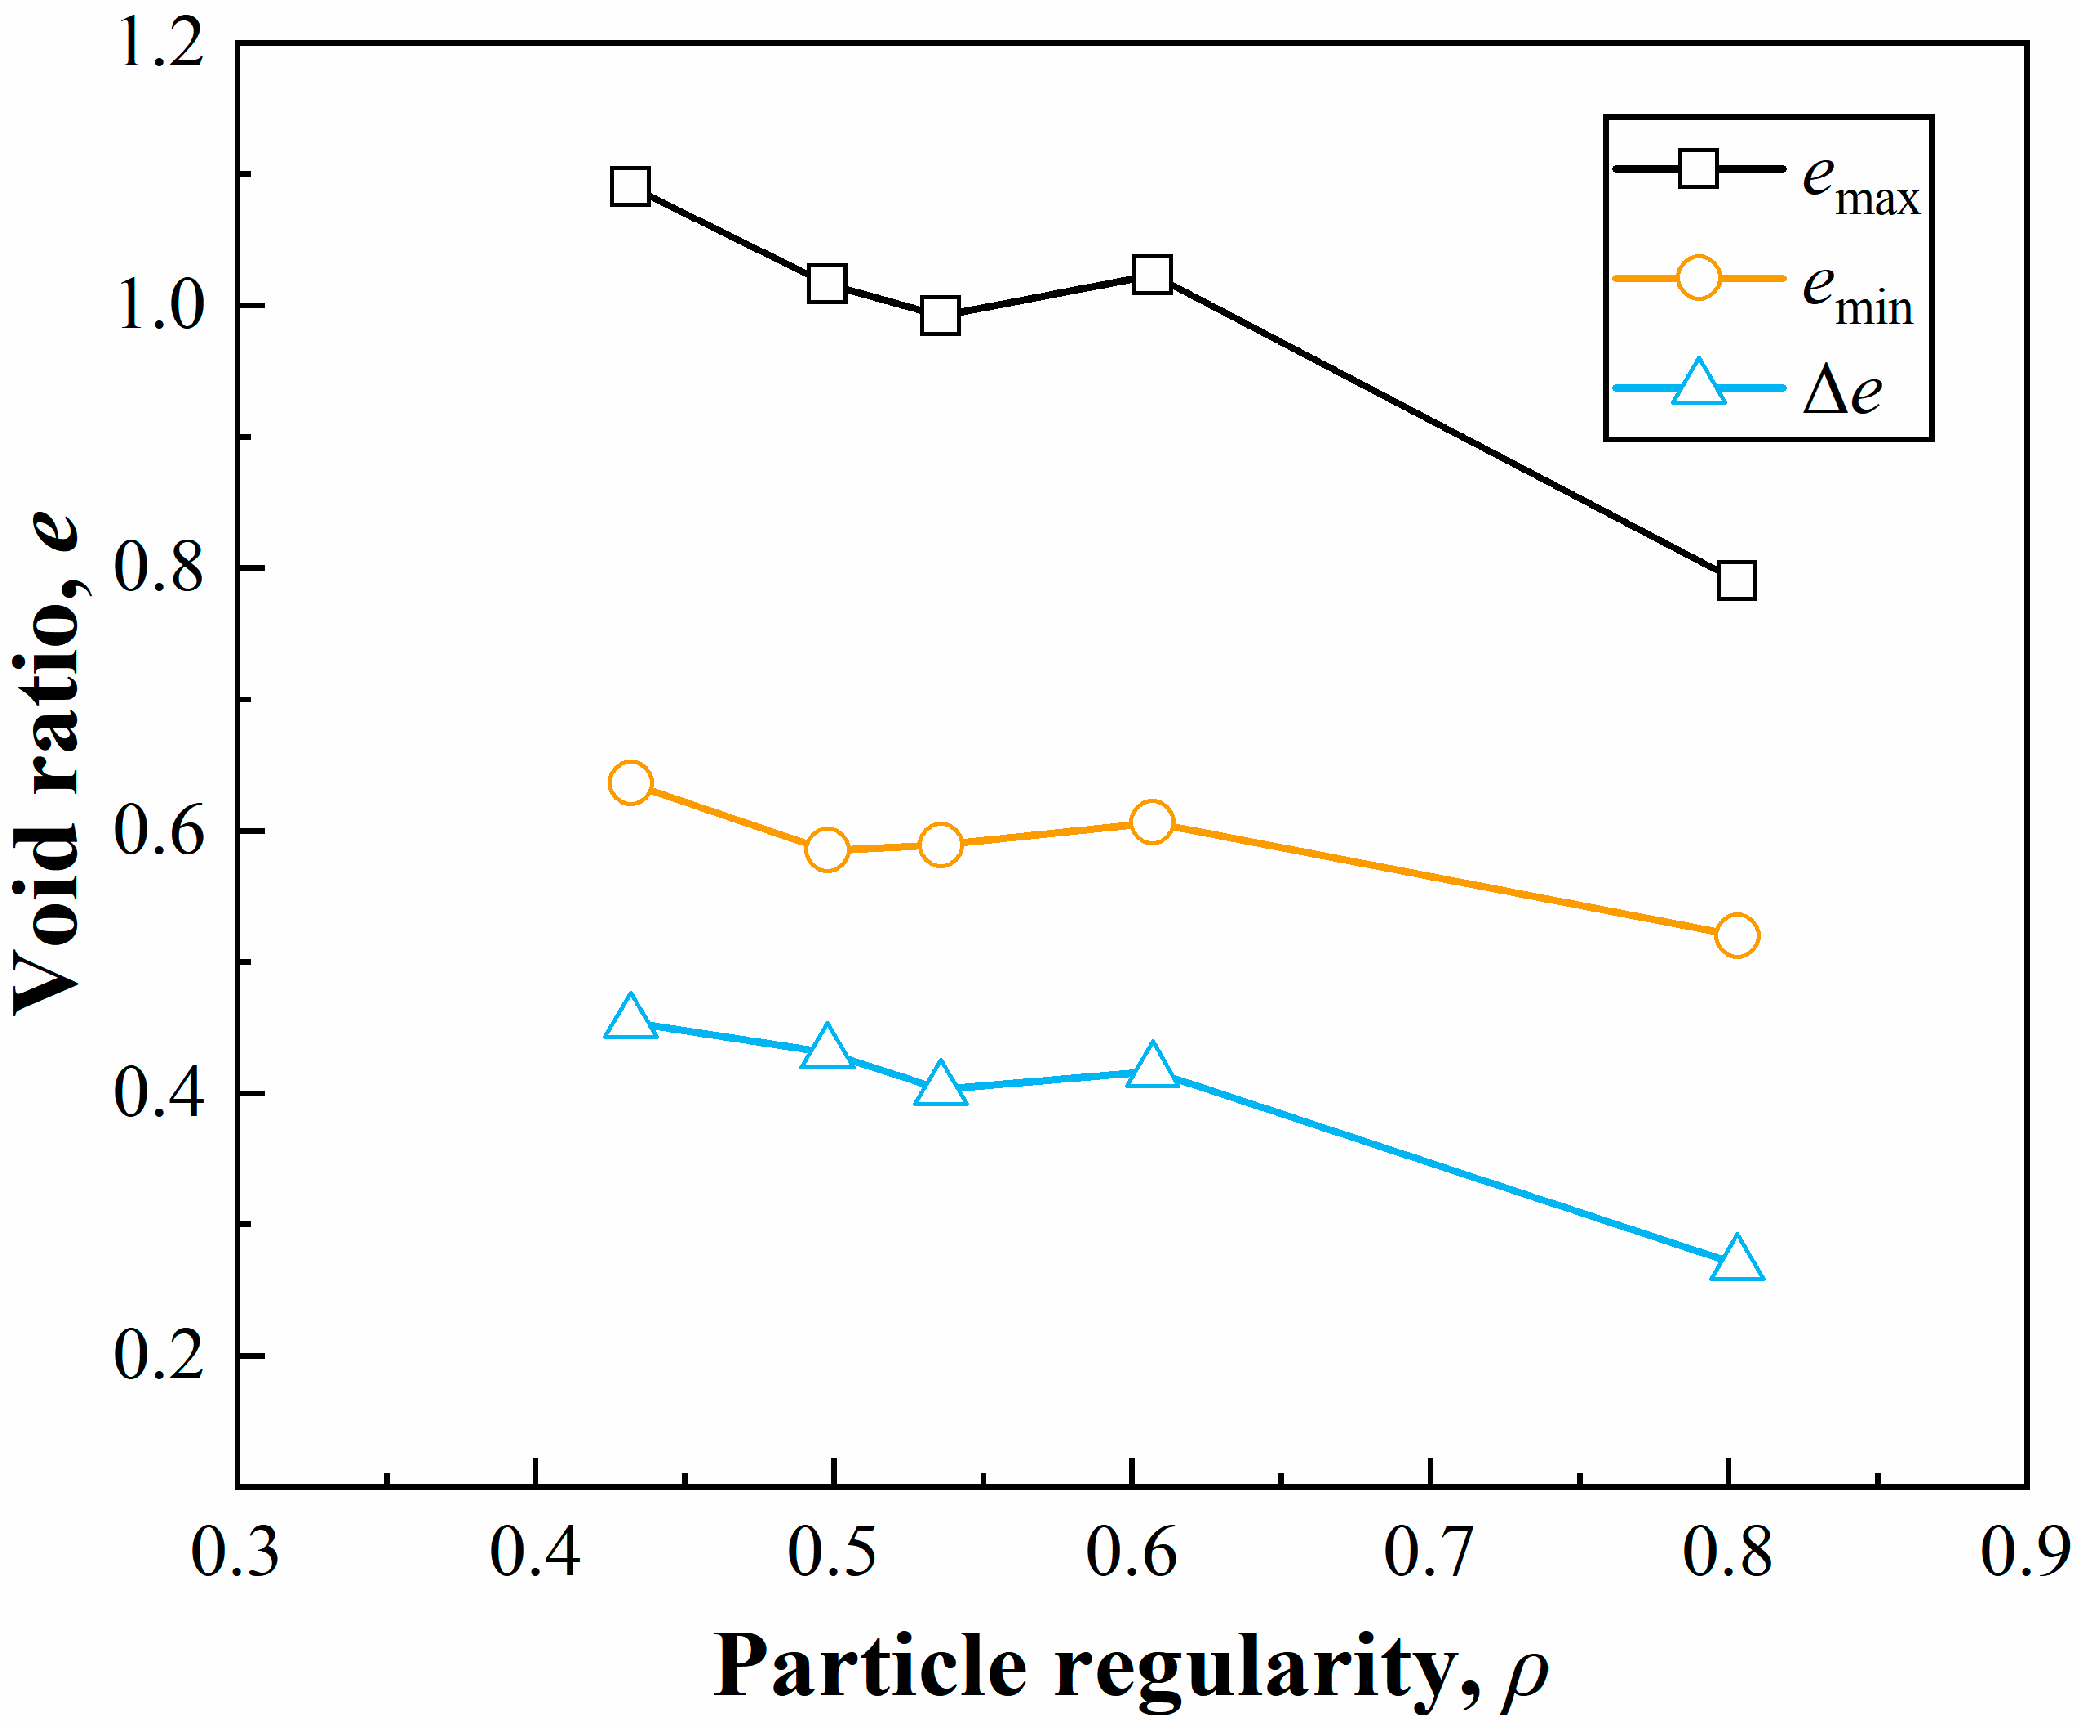
| Maximum void ratio emax | 0.79 | 1.023 | 0.992 | 1.016 | 1.09 |
| Minimum void ratio emin | 0.52 | 0.606 | 0.589 | 0.585 | 0.636 |
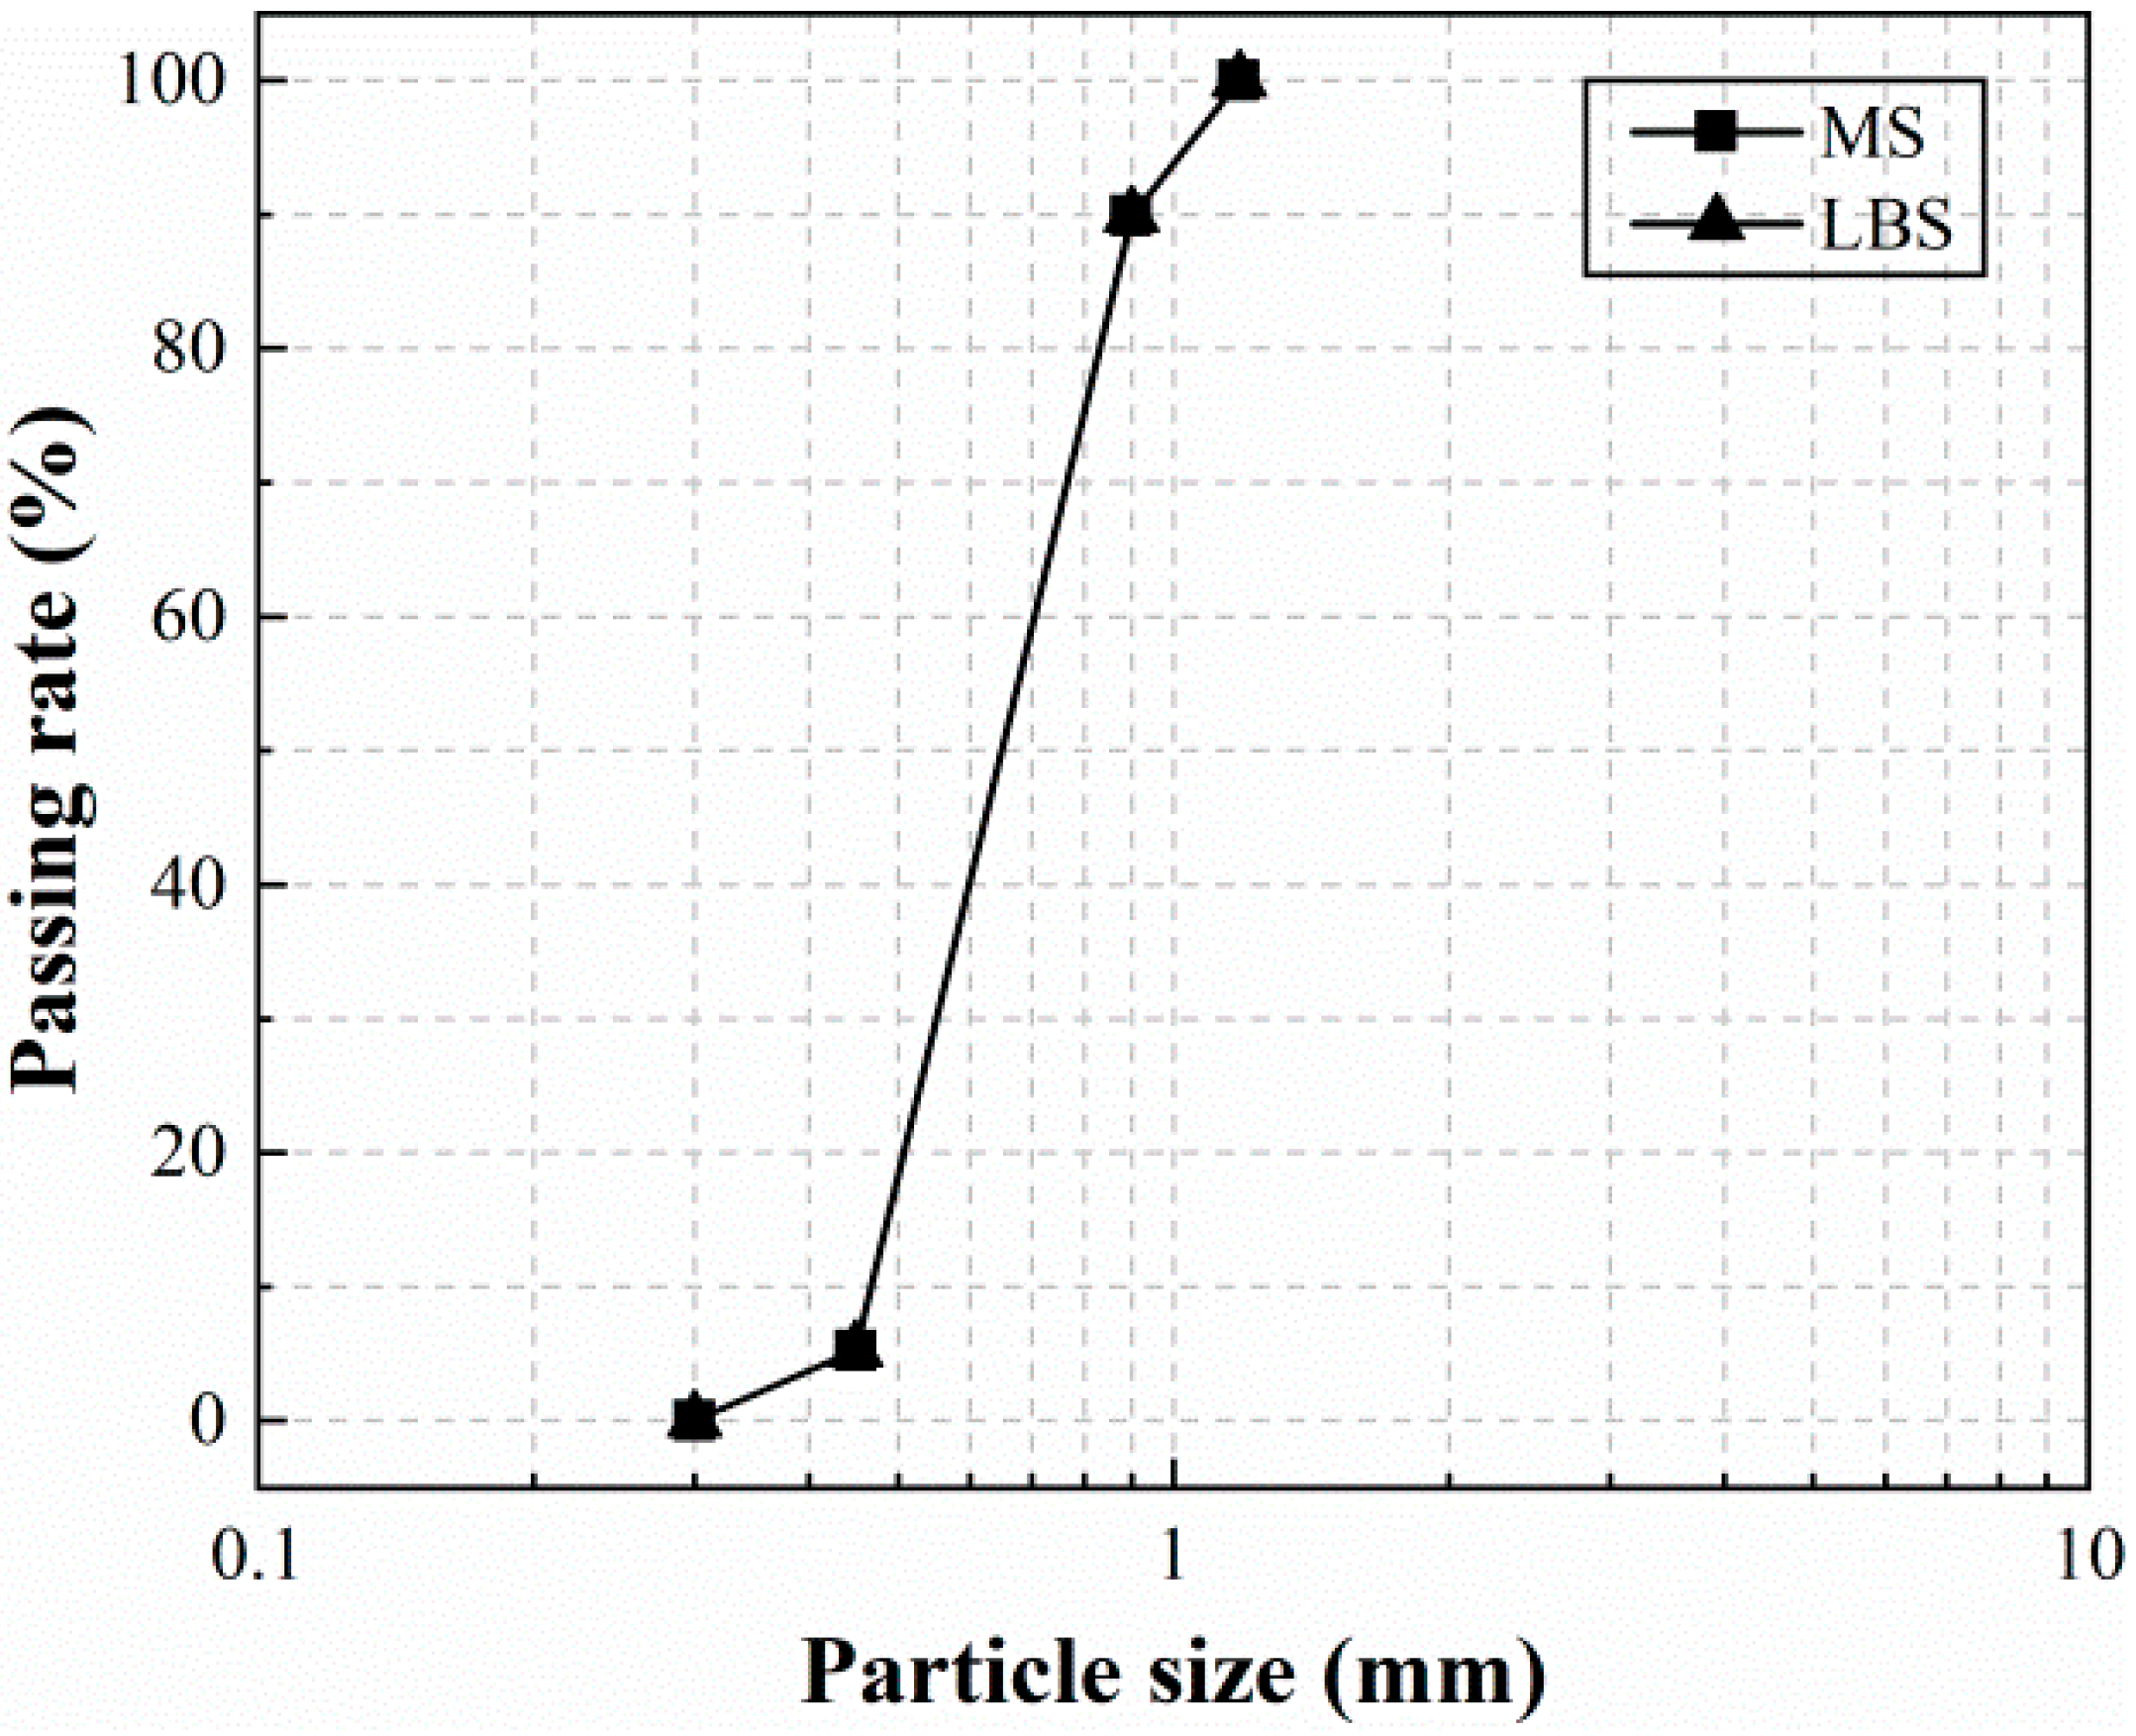
| Uniformity mean diameter D50 (mm) | 0.62 | 0.62 | 0.62 | 0.62 | 0.62 |
| Material | Sphericity (S) | Roundness (R) | Regularity (ρ) |
|---|---|---|---|
| LBS | 0.76 | 0.846 | 0.803 |
| MSSR | 0.702 | 0.512 | 0.607 |
| MSB | 0.651 | 0.421 | 0.536 |
| MSS | 0.604 | 0.392 | 0.498 |
| MSR | 0.478 | 0.386 | 0.432 |
| Pre-Liquefaction | Post-Liquefaction | ||||
|---|---|---|---|---|---|
| Testing No. | Consolidation stress (σv, kPa) | Samples | Cyclic shear strain amplitude (Aγ, %) | Re-consolidation stress (σv, kPa) | Monotonic shear |
| 1 | LBS | 50 | Along the x-direction | ||
| 2 | MSSR | ||||
| 3 | / | MSB | / | ||
| 4 | MSS | ||||
| 5 | MSR | ||||
| 6–10 | 50 | LBS | 50 | Along the x-direction | |
| 11–15 | MSSR | ||||
| 16–20 | MSB | 0.1, 0.2, 0.3, 0.4 | |||
| 21–25 | MSS | ||||
| 25–30 | MSR | ||||
| Material | Particle Regularity (ρ) | Kτ | Iτ |
|---|---|---|---|
| LBS | 0.803 | 5.416 | 3.267 |
| MSSR | 0.607 | 8.132 | 4.526 |
| MSB | 0.536 | 8.066 | 4.917 |
| MSS | 0.498 | 11.382 | 4.654 |
| MSR | 0.432 | 14.132 | 4.722 |
Disclaimer/Publisher’s Note: The statements, opinions and data contained in all publications are solely those of the individual author(s) and contributor(s) and not of MDPI and/or the editor(s). MDPI and/or the editor(s) disclaim responsibility for any injury to people or property resulting from any ideas, methods, instructions or products referred to in the content. |
© 2023 by the authors. Licensee MDPI, Basel, Switzerland. This article is an open access article distributed under the terms and conditions of the Creative Commons Attribution (CC BY) license (https://creativecommons.org/licenses/by/4.0/).
Share and Cite
Wang, Z.; Chen, G.; Wu, D.; Li, Y.; Hu, J. Pre- and Post-Liquefaction Behaviors of Manufactured Sand Considering the Particle Shape and Stress History Effects. J. Mar. Sci. Eng. 2023, 11, 739. https://doi.org/10.3390/jmse11040739
Wang Z, Chen G, Wu D, Li Y, Hu J. Pre- and Post-Liquefaction Behaviors of Manufactured Sand Considering the Particle Shape and Stress History Effects. Journal of Marine Science and Engineering. 2023; 11(4):739. https://doi.org/10.3390/jmse11040739
Chicago/Turabian StyleWang, Zhe, Guanyu Chen, Dazhi Wu, Yao Li, and Juntao Hu. 2023. "Pre- and Post-Liquefaction Behaviors of Manufactured Sand Considering the Particle Shape and Stress History Effects" Journal of Marine Science and Engineering 11, no. 4: 739. https://doi.org/10.3390/jmse11040739