


Fracture Prediction of Steel-Plated Structures under Low-Velocity Impact


Department of Naval Architecture and Ocean Engineering, Inha University, Incheon 22212, Republic of Korea
*
Author to whom correspondence should be addressed.
J. Mar. Sci. Eng. 2023, 11(4), 699; https://doi.org/10.3390/jmse11040699
Submission received: 17 February 2023
/
Revised: 9 March 2023
/
Accepted: 22 March 2023
/
Published: 24 March 2023
(This article belongs to the Special Issue Advanced Analysis of Marine Structures)
Abstract
:In this paper, a validation study of a recently proposed rate-dependent shell element fracture model using quasi-static and dynamic impact tests on square hollow sections (SHS) made from offshore high-tensile strength steel was presented. A rate-dependent forming limit curve was used to predict the membrane loading-dominated failure, while a rate-dependent ductile fracture locus was applied for predicting failure governed by bend loading. The predicted peak force and fracture initiation using the adopted material and fracture model agreed well with the experimental results. The fracture mode was also captured accurately. Further simulations were performed to discuss the importance of the inclusion of dynamic effects and the separate treatment of failure modes. Finally, the shortcomings of the common practice of treatment of rate-effects in low-velocity impact simulations involving fracture were highlighted.
1. Introduction
The importance of material definitions in simulating the response of steel-plated structures under extreme loads is widely recognized [1,2,3]. Recently, predicting the fracture of large-scale structures resulting from impact loads using the shell elements in finite element simulations has attracted considerable attention [4,5,6,7,8]. In this context, accurate predictions of fracture are challenging because of the mesh size effects and constitutive assumptions of shell elements, as well as a number of factors that affect the material response under dynamic impact loading conditions.
First of all, under impact loads, the loading speed and resultant strain rates have a substantial impact on material characteristics [9]. In practice, it is often believed that the response to a low-velocity impact is comparable to that under an equivalent quasi-static loading [10]. Experimental studies with scaled models of stiffened panels [11,12] and web girders [13] confirmed this assumption. Yet, a number of comparative experimental and numerical studies have shown that reliable predictions of plastic deformation must take into account the rate-dependency of flow stress [14,15,16].
The Cowper–Symonds model is the most commonly used model for the strain-rate effect on flow stress [17]. For a given strain rate, the same dynamic hardening factor is applied for all equivalent plastic strains, which is determined solely based on the initial flow stress. This straightforward model is frequently employed in simple rigid-plastic mechanism-based methods to fine-tune the predictions.
On the other hand, when utilizing Cowper–Symonds-type models, caution must be taken as non-linear finite element analysis (NLFEA) results are extremely sensitive to how the rate-dependency of flow stress is catered for [18]. The increase in flow stress depends not only on the rate of deformation but also on the magnitude of strain [19]. This phenomenon is closely associated with thermal softening due to self-heating. A portion of the plastic strain energy is converted to heat, which causes thermal softening to eventually dominate over the increase in flow stress due to rate-hardening. This effect is often neglected in practice because approximate constitutive models often yield acceptable results [20], particularly if plastic deformation is the only concern.
Secondly, fracture prediction with shell elements poses certain challenges. Recent research has indicated that modelling the complex nature of ductile failure with shell elements is not possible using oversimplified constitutive models. The critical failure strain for NLFEA, according to a widely used method, is the elongation at the fracture (%) of specimens for standard tension tests performed at intermediate strain rates [20,21]. According to Cerik et al. [22,23], more complex models must take into account the following in order to simulate fracture failure with finite shell elements: various mechanisms of fracture [24,25,26], variation in the stress state from the initial conditions to the onset of fracture [27,28,29,30], and differentiation between membrane and bending deformation [31].
There are several approaches for dealing with the limitations of shell elements. A straightforward method for simulating fracture in shell elements subjected to quasi-static load that causes membrane stretching, is to adopt a localized necking criterion. Usually such models involve a single constant that can be determined using the flow stress curve of a material [5,32,33]. This approach can be extended for the case of dynamic loading if the rate-dependent flow stress curves are adequately constructed. Cerik and Choung [34,35] recently adopted this approach to define the localized necking locus based on the instantaneous hardening rate. A rate-dependent ductile fracture locus was combined with the localized necking locus (termed as the rate-dependent DSSE-HC model) to predict all possible failure modes, including shear fracture and through-thickness cracking, with shell elements. The mesh size sensitivity of the proposed model was confirmed to be very low.
The model by Cerik and Choung [34] was validated using the dynamic punch indentation tests on metal sheets, given in [36], which were limited only to the failure involving localized necking. In the present study, the new test results presented by Johanessen et al. [37] on square hollow sections (SHS) subjected to quasi-static and dynamic bending were used to validate the proposed model for a more general case of loading that results in different failure modes. These new tests present a challenge for numerically predicting fractures because deformation and failure are more complex than punch-loaded plates, which predominantly undergo membrane stretching. The primary aim is to demonstrate the advantage of the proposed model over single-modelling approaches for fracture. Beside the comparison of predictions with the proposed model with the test results, additional numerical simulations of the test were performed using the simplified approaches used in industrial practice to highlight the benefits of the adopted model. The main contribution of the present work is the validation of the rate-dependent DSSE-HC model by comparing its predictions of the onset of ductile failure for both membrane- and bending-dominated loading conditions.
2. Material Model
For the sake of completeness, the model reported previously in Cerik and Choung [34,35] is summarized.
2.1. Constitutive Model
The constitutive model adopted in the present study follows Roth and Mohr [38]. The logarithmic strain tensor was decomposed into elastic and plastic strain components:
The constitutive equation for Cauchy stress, is as follows:
where is the isotropic elasticity tensor, which depends on the Young’s modulus E and Poisson’s ratio .
The magnitude of the Cauchy stress tensor is represented by von Mises stress as follows:
with denoting the second invariant of the stress deviator tensor, .
The evolution of the plastic strain tensor, , is described by the associative flow rule:
where is the increase in the equivalent plastic strain.
The yield surface is expressed as in the given equation:
Here, k represents the deformation resistance. Similar to the Jonhson–Cook model [39], the deformation resistance is assumed as a function of the equivalent plastic strain, , equivalent plastic strain rate, , and temperature, T:
The first term, which represents strain hardening, is modelled using a weighted combination of the Swift [40] and Voce [41] laws [42]:
The weighting factor requires calibration following a procedure described elsewhere [22,30]. The Swift and Voce laws are expressed as follows:
The second term in Equation (6) scales up the flow stress for the strain rates above a certain threshold, , as follows [39]:
The last term scales down the flow stress for temperatures above the reference temperature, , as follows [39]:
where is the melting temperature.
The temperature increase, due to rapid deformation, is related to strain energy as follows:
In this equation, is a constant, which defines the percentage of the plastic strain energy converted to heat. The other parameters, and , are the density and specific heat of the material, respectively. In the above equation, Roth and Mohr [38] included an extra term . This term is a function of the strain rate and helps to regulate the amount of plastic work converted to heat. It is expressed as follows:
where and indicate the two limiting conditions, namely isothermal and adiabatic conditions. It is usually assumed that [38]. With this modification of the Johnson–Cook model, thermal softening effects at low strain rates can be eliminated, and thermal softening can be considered only at intermediate and large strain rates, where adiabatic conditions will prevail, and self-heating during large plastic deformation will occur.
2.2. Fracture Prediction Model for Shell Elements
The rate-dependent shell element fracture model proposed by Cerik and Choung [34] considers two cases separately: ductile fracture preceded by thinning and without thinning before the initiation of a fracture [26]. The former case was modelled using a fracture indicator, D, as follows:
where is the fracture strain surface of the material. Note that this is valid strictly under proportional strain paths. The stress state is defined using stress triaxiality, , and the Lode angle parameter, . However, for the case of plane stress conditions (as in shell elements), the Lode angle parameter can be defined using stress triaxiality. Therefore, stress triaxiality is the sole parameter adequate for defining the stress state in shell elements.
The Hosford–Coulomb (HC) model was used as , a rate-independent version of which is given as:
A rate-dependent version of the HC model was introduced by Roth and Mohr [38] by setting the parameter b, in a rate-dependent format:
The HC model predicts a fracture if in a shell through-thickness integration point (IP), the fracture indicator, D, exceeds unity:
Ductile fracture preceded by thinning is predicted using a forming limit curve called DSSE (domain of shell-to-solid equivalence). The localized necking indicator, N, is defined as follows:
In this model, the parameter d is determined using the flow stress curve of the material. For the case of the rate-dependent flow curves, d is not constant and requires to be calculated using the procedure described in [34] at every time increment for the instantaneous values of strain rate and temperature.
Localized necking is assumed to occur only if all integration points through the thickness fulfil the failure criterion:
where t is the shell thickness and z is the through-thickness direction coordinate.
Numerical implementation of the rate-dependent DSSE-HC model and the mesh size sensitivity of the model are described in detail in [34]. Cerik and Choung [34] reported that the fracture predictions using the described model are consistent with the very fine mesh solid element results. It was noted that for predicting the localized necking, the element size to element thickness ratio up to four, yields accurate estimates. Fracture without necking was found to be insensitive to the mesh size except geometrical conditions that require finer meshes. For validation of the model, quasi-static and dynamic impact tests on steel sheets, conducted by Gruben et al. [36], were used. The model used in the present study could predict the response of the test models in both cases and accurately simulate the deviations between the two cases.
3. Description of the Experiments
Johannessen et al. [37] recently reported the material and three-point bending test results used in the present study to validate the described material model. Here, only a summary of the experiments and important test outcomes are given. The SHS test models were made from three different grade high-tensile strength steels. In the present study, only the test results of the models made from offshore grade steel (grade S355NH, in accordance with NS-EN 10225-3) were considered because of the relevance of the offshore steel grade for the application area of the proposed fracture model, marine collision problem, as well as considering the availability of the material test parameters database for the proposed material model that can be assumed to have similar characteristics as the target structure material.
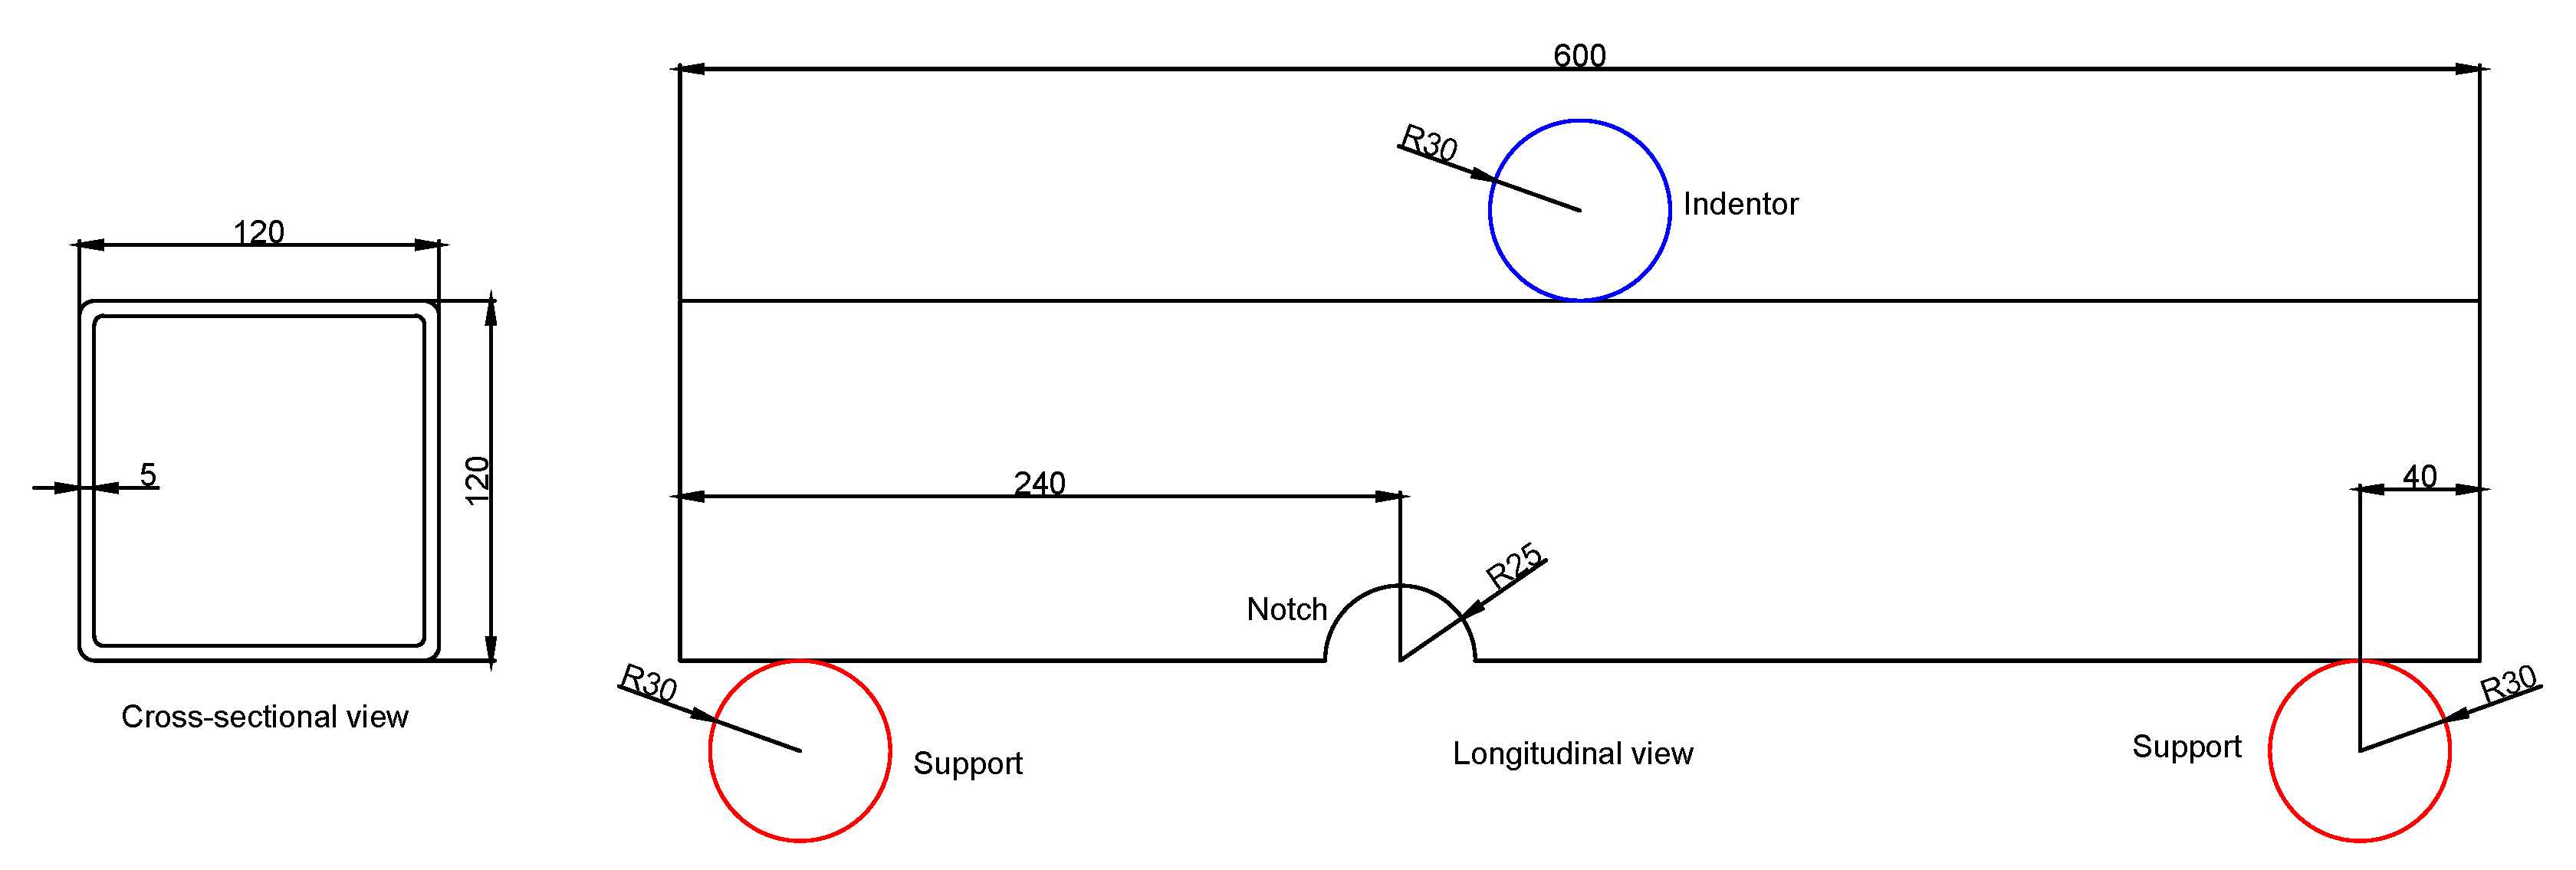
The tests were conducted with mm SHS. The test models were 600 mm long. Each model featured a 50 mm notch placed 60 mm off-centre. The purpose of each notch was to provoke failure in a pre-determined location and pose a challenge for the finite element simulations with shell elements in predicting the crack propagation direction. Figure 1 shows the dimensions of the models.
Standard uniaxial tension tests were performed on dog-bone specimens to characterize the material hardening properties. The test coupons were sampled both in the rolling direction and transverse direction . Three tests were performed for each direction. The lower yield stress of the material was scattered around 420 MPa. In addition, the test specimens sampled from the transverse direction showed a large spread in hardening and percentage elongation to fracture. The flow stress curves showed considerable scattering, which raises material uncertainties to be considered in the simulation of the tests.
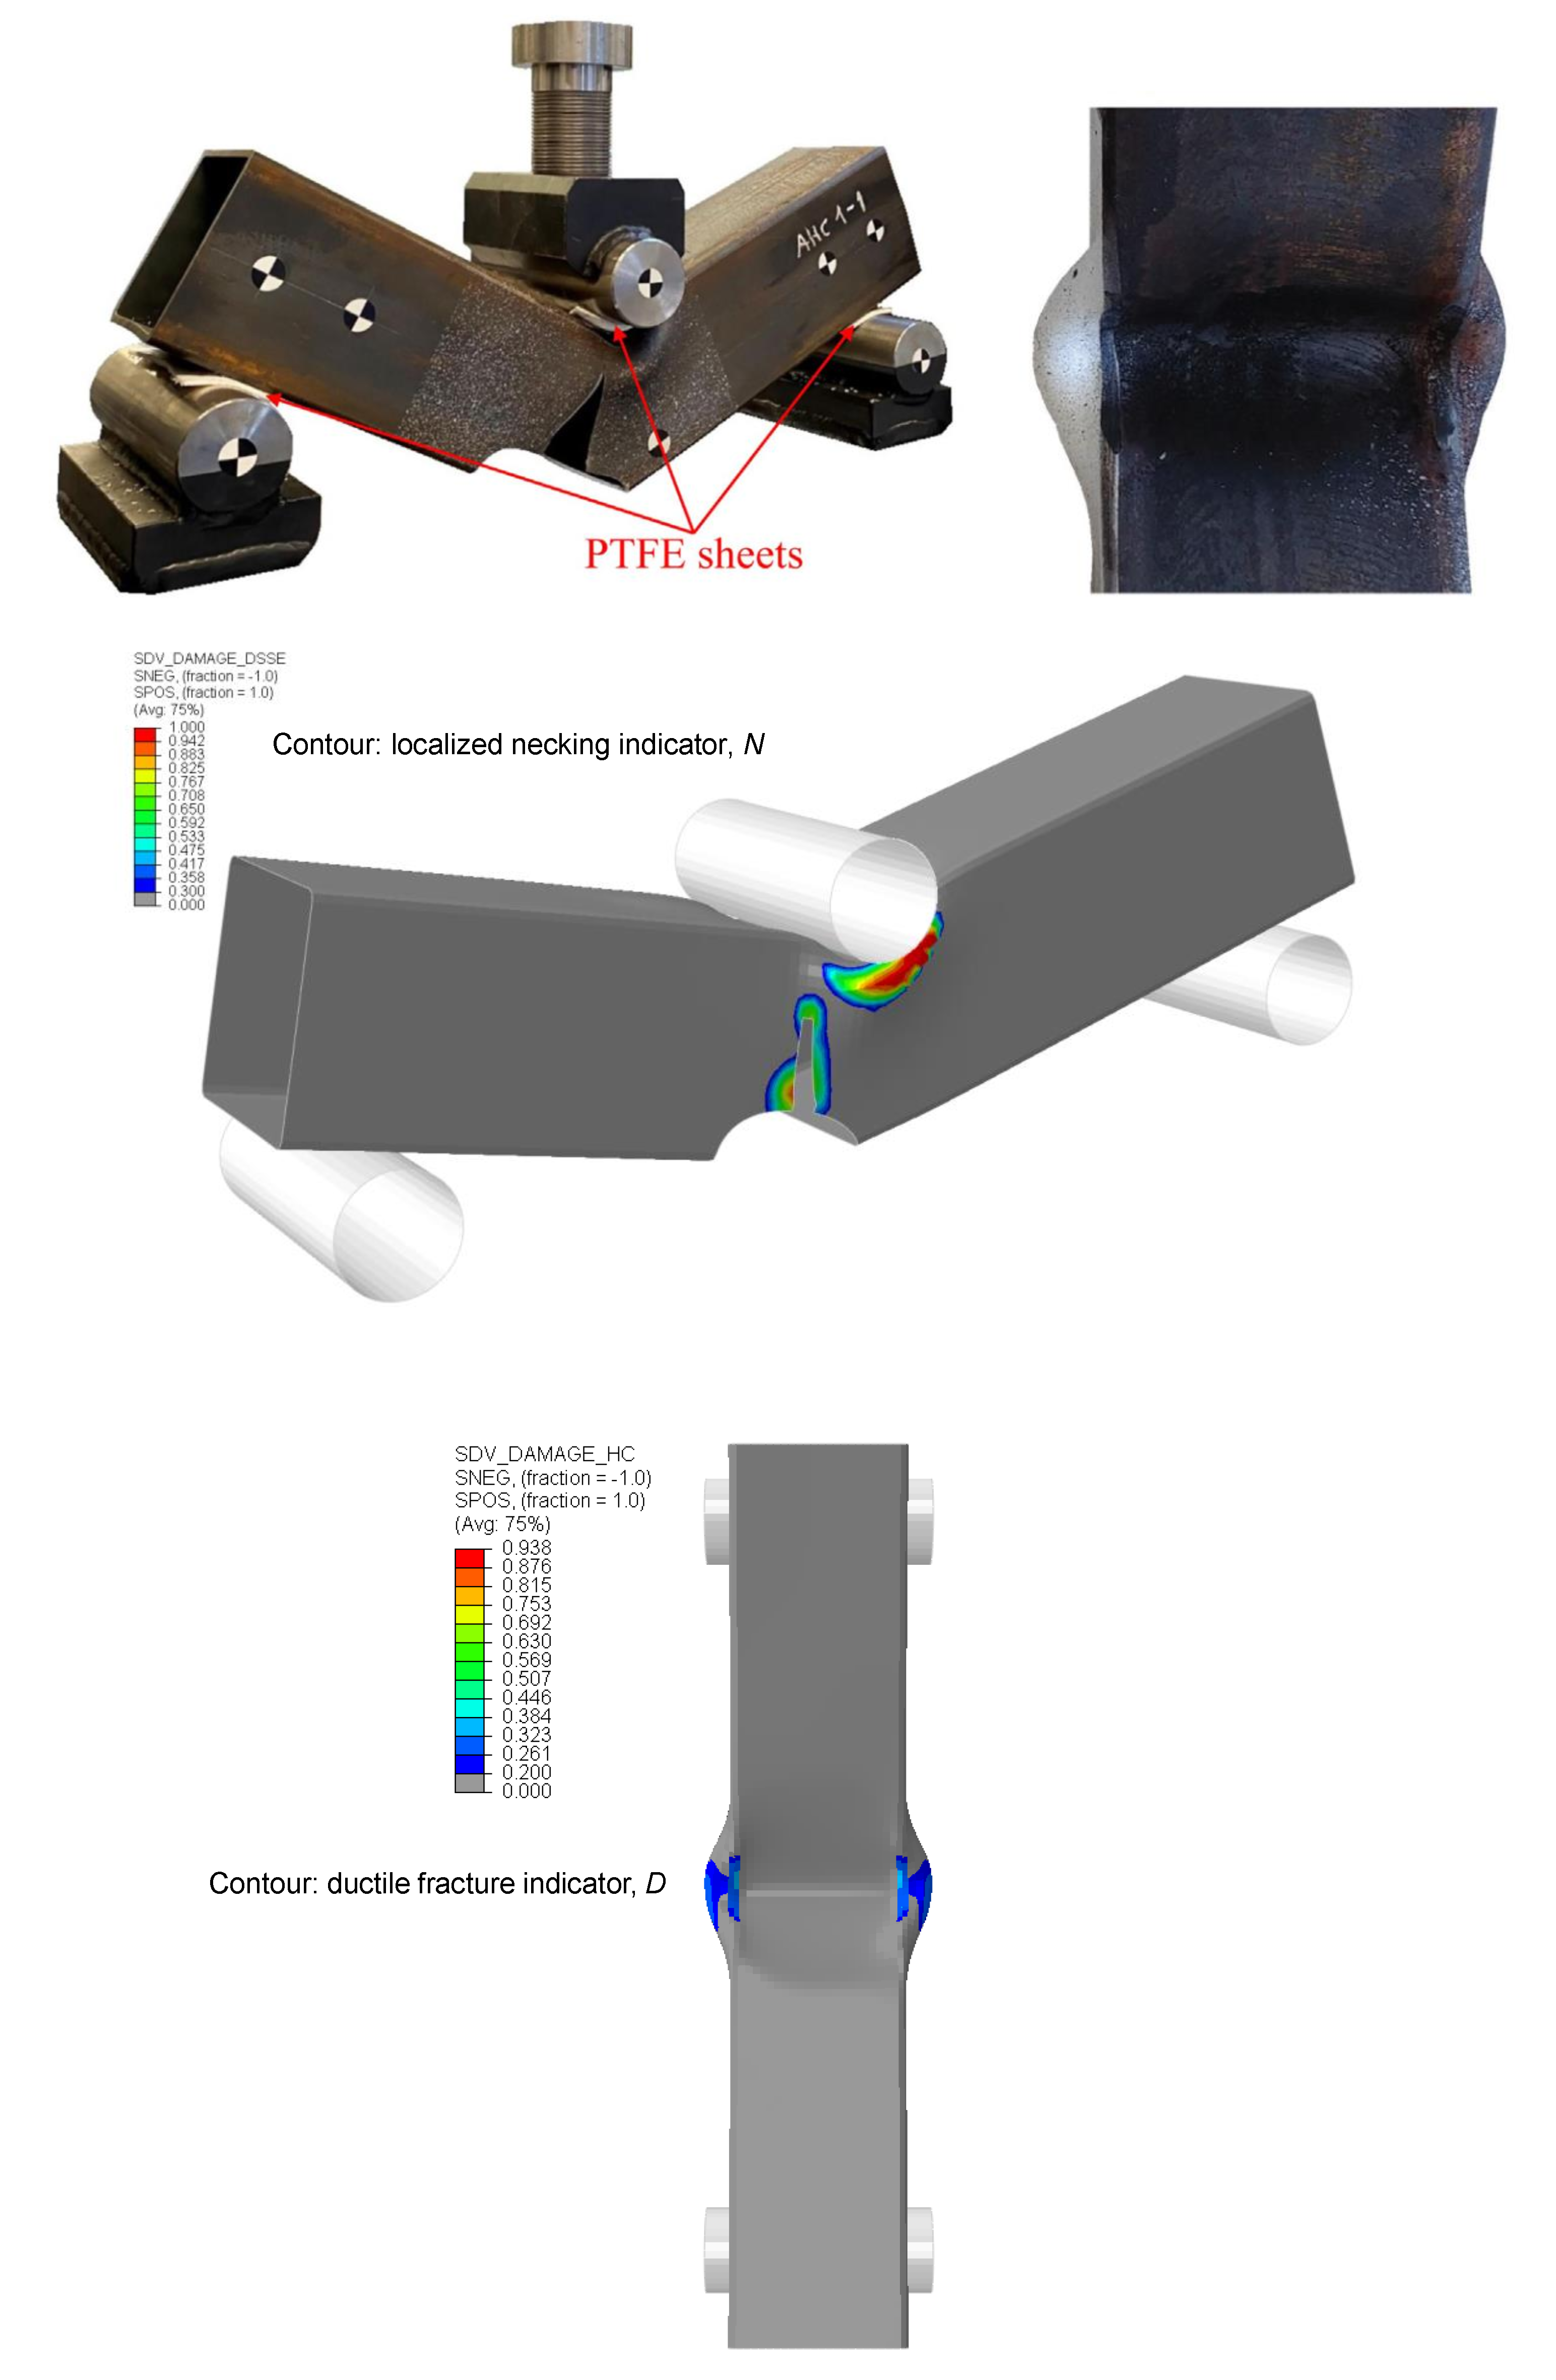
Johannessen et al. [37] performed both quasi-static and low-velocity impact tests. Figure 1 shows a schematic representation of the quasi-static test involving the SHS penetrated by a solid cylinder. The test model rested on two rigid cylinders, 60 mm in diameter. A rigid cylinder was moved with a constant velocity of 10 mm/min towards the model up to 120 mm, before fracture initiated around the notch and propagated diagonally. PEFT sheets were used at the support and contact surfaces between the indentor and model to minimize friction. The tests were repeated three times and showed relatively high scatter. This was associated with the large variability of the material properties.
The low-velocity impact tests were conducted using impact testing equipment, which utilizes a trolley system accelerated with a hydraulic kicking device. In the dynamic tests, the indentor mass was 1470.7 kg, and the velocity just prior to the impact was measured as 4.1 m/s. These yield kinetic energies large enough to cause fracture around the notch of the test models, similar to that observed in the quasi-static tests. In the dynamic tests, the supports and indentor diameter were both 50 mm. A spray lubricant was used to reduce friction between the contact surfaces. The tests were repeated three times, and the repeatability was slightly better than the quasi-static tests. Both the deformation and fracture response of the test models were similar to that in the quasi-static tests. Yet, the peak force was higher because of the strain-rate effects and fracture initiated earlier than in most quasi-static tests.
4. Finite Element Modelling
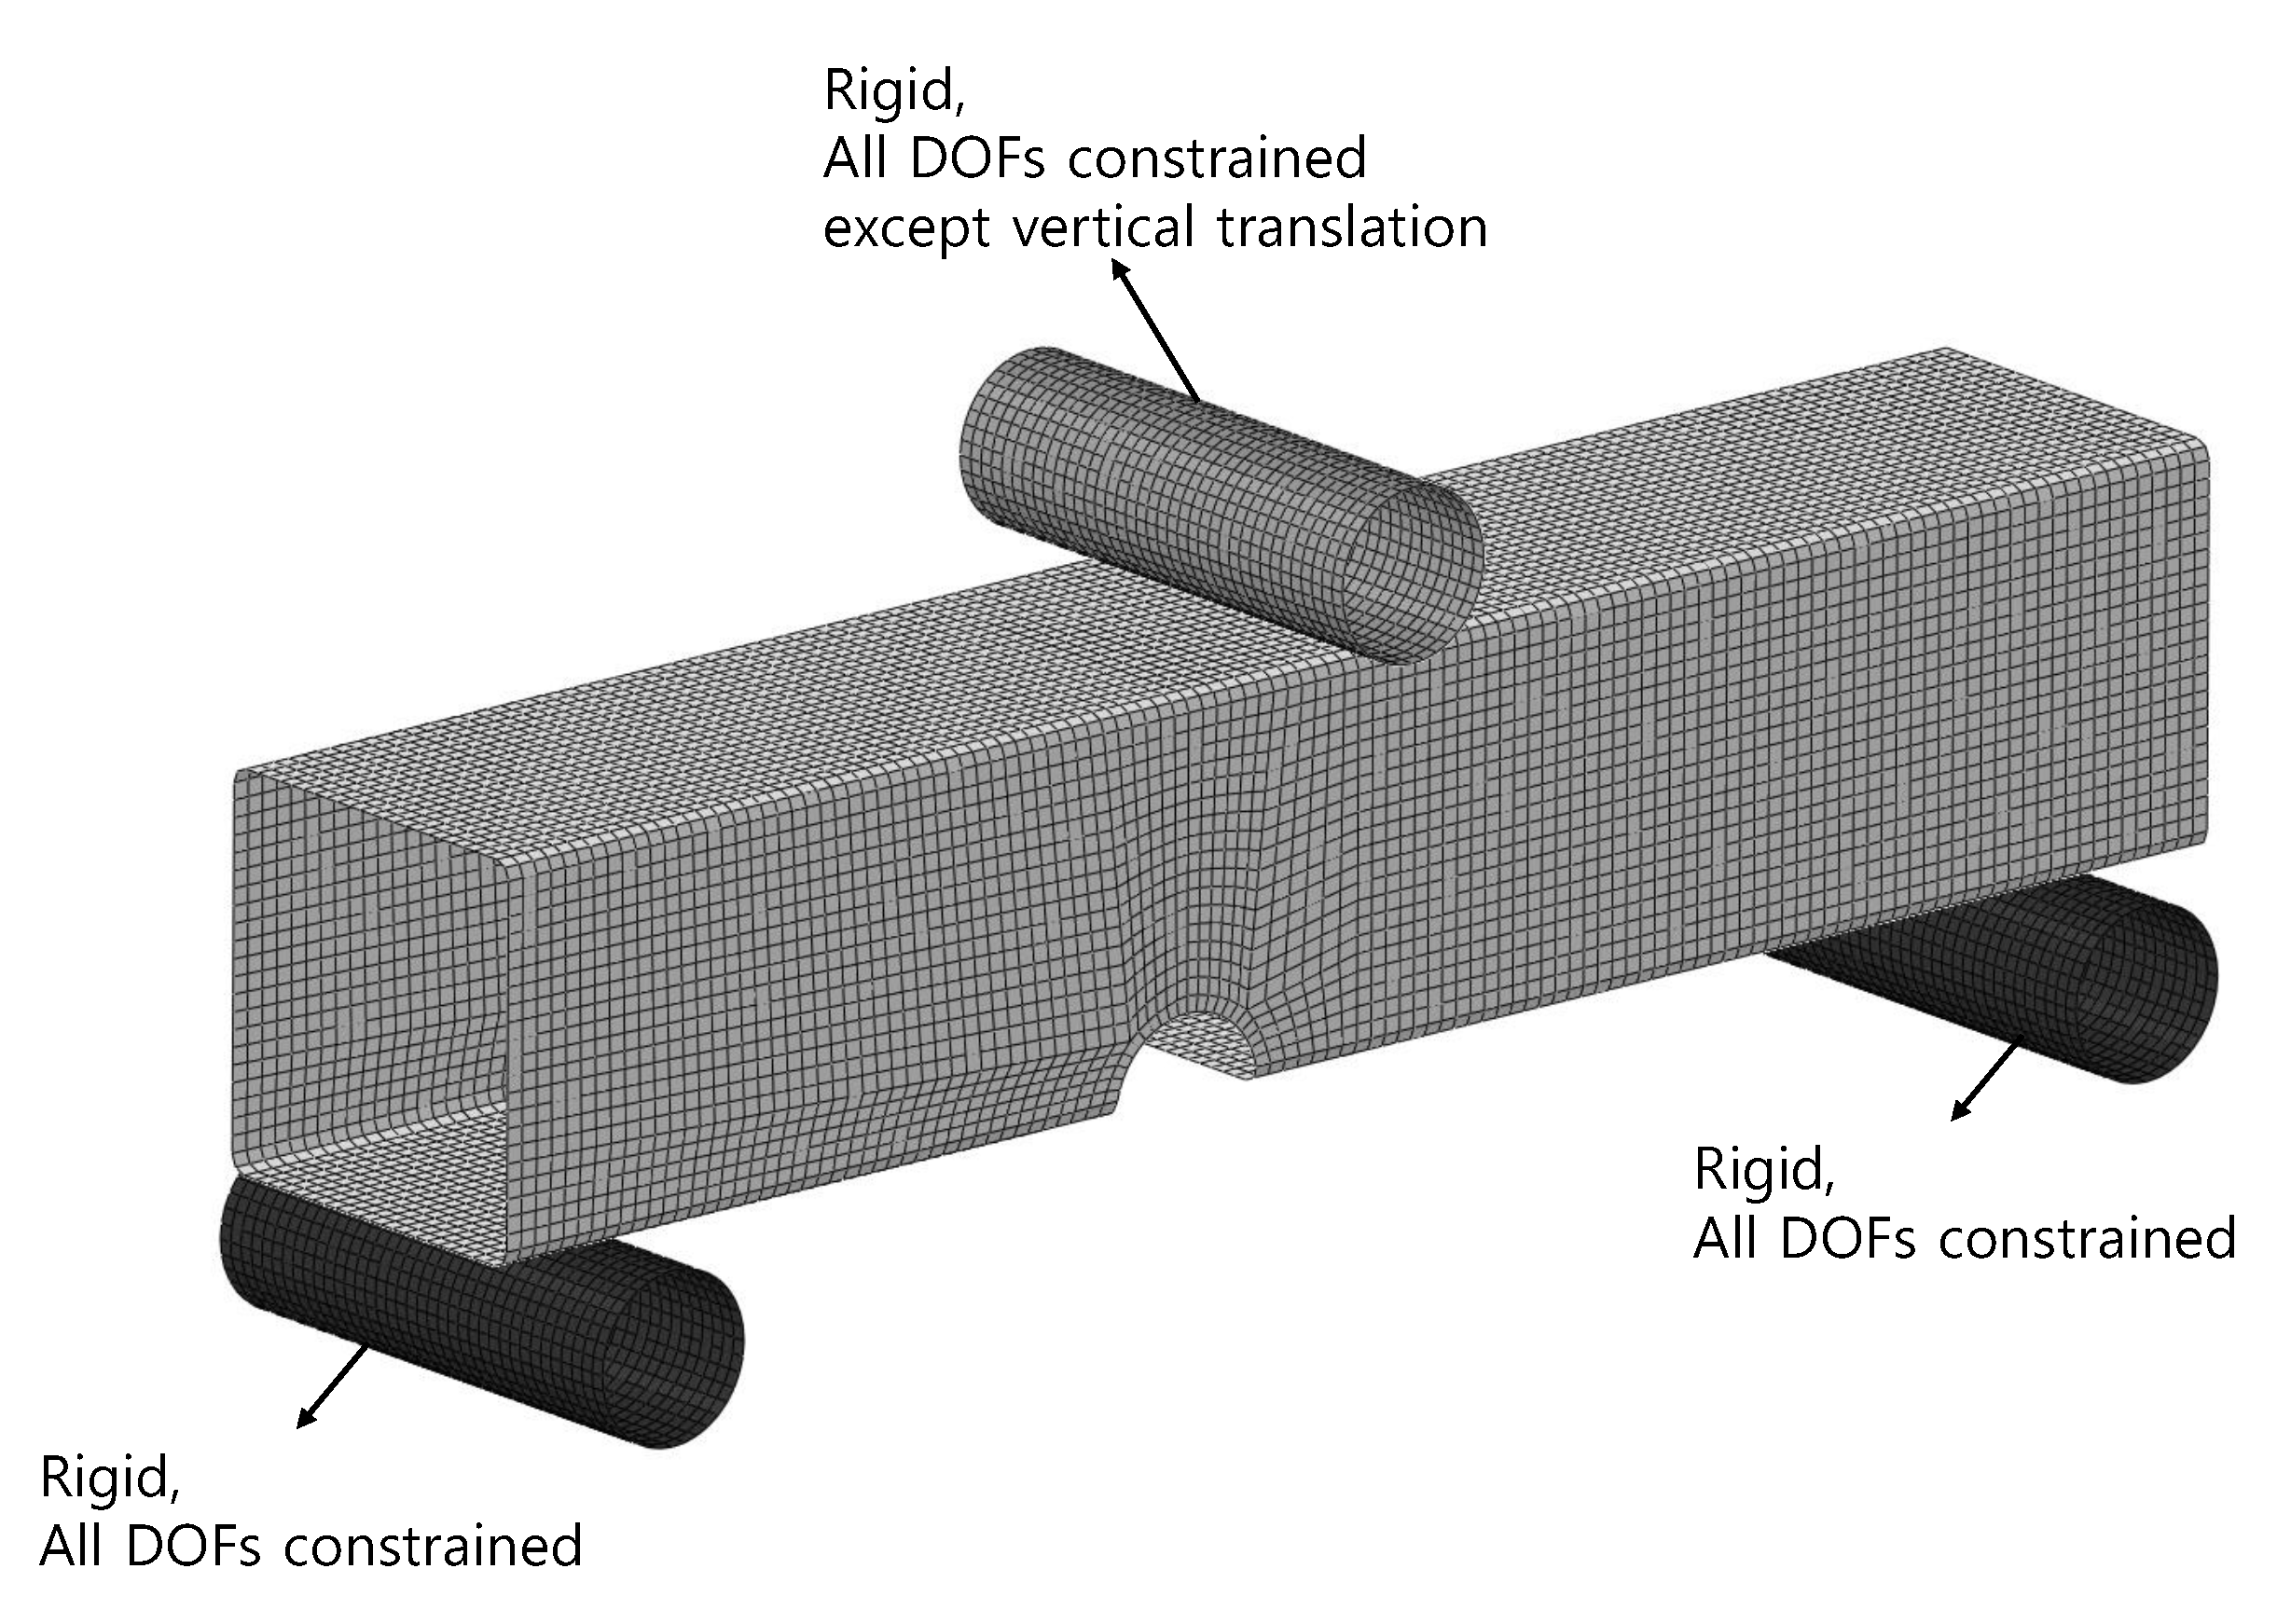
The tests described in the previous section were simulated using the Abaqus software package (explicit solver), and a user-defined material subroutine (VUMAT) implementing the described material model. The test model was meshed using four-node shell elements (S4R) with five through-thickness integration points. S4R is suitable for most common applications, including crashworthiness analysis. The average element edge length was determined to be 5 mm, which was sufficient to resolve the stress gradients around the notch. The chosen element size also reflects the findings reported in [34] on mesh size sensitivity of the employed fracture model. An element size less than the shell thickness is in general not recommended when using a localized necking criterion for predicting membrane-dominated loading. Rigid elements (R3D4) were used for the supports and indentor. Figure 2 shows a finite element model of the test setup including the boundary conditions.
For the three-point bending simulation of quasi-static and low-velocity impact tests, all the degrees of freedom at the reference node of the rigid supports were constrained except for the displacement in the impact direction. All degrees of freedom at the reference nodes associated with the rigid support were constrained. The quasi-static test was simulated using displacement control, whereas low-velocity impact was simulated by setting an initial velocity to the rigid indentor. Both analyses considered geometric non-linearity and used automatic time incrementing from stable time increment estimates. The duration of the quasi-static simulation was long enough to limit the inertia effects.
The general contact algorithm was used to consider the interaction between the rigid cylinders and the test model. Moreover, self-contact was considered for the surfaces of the impacted structure. According to Johannessen et al. [37], a low-friction coefficient of 0.05 was used for the contact between the surfaces. This value was deemed reasonable considering the applied friction reduction agents applied in the tests.
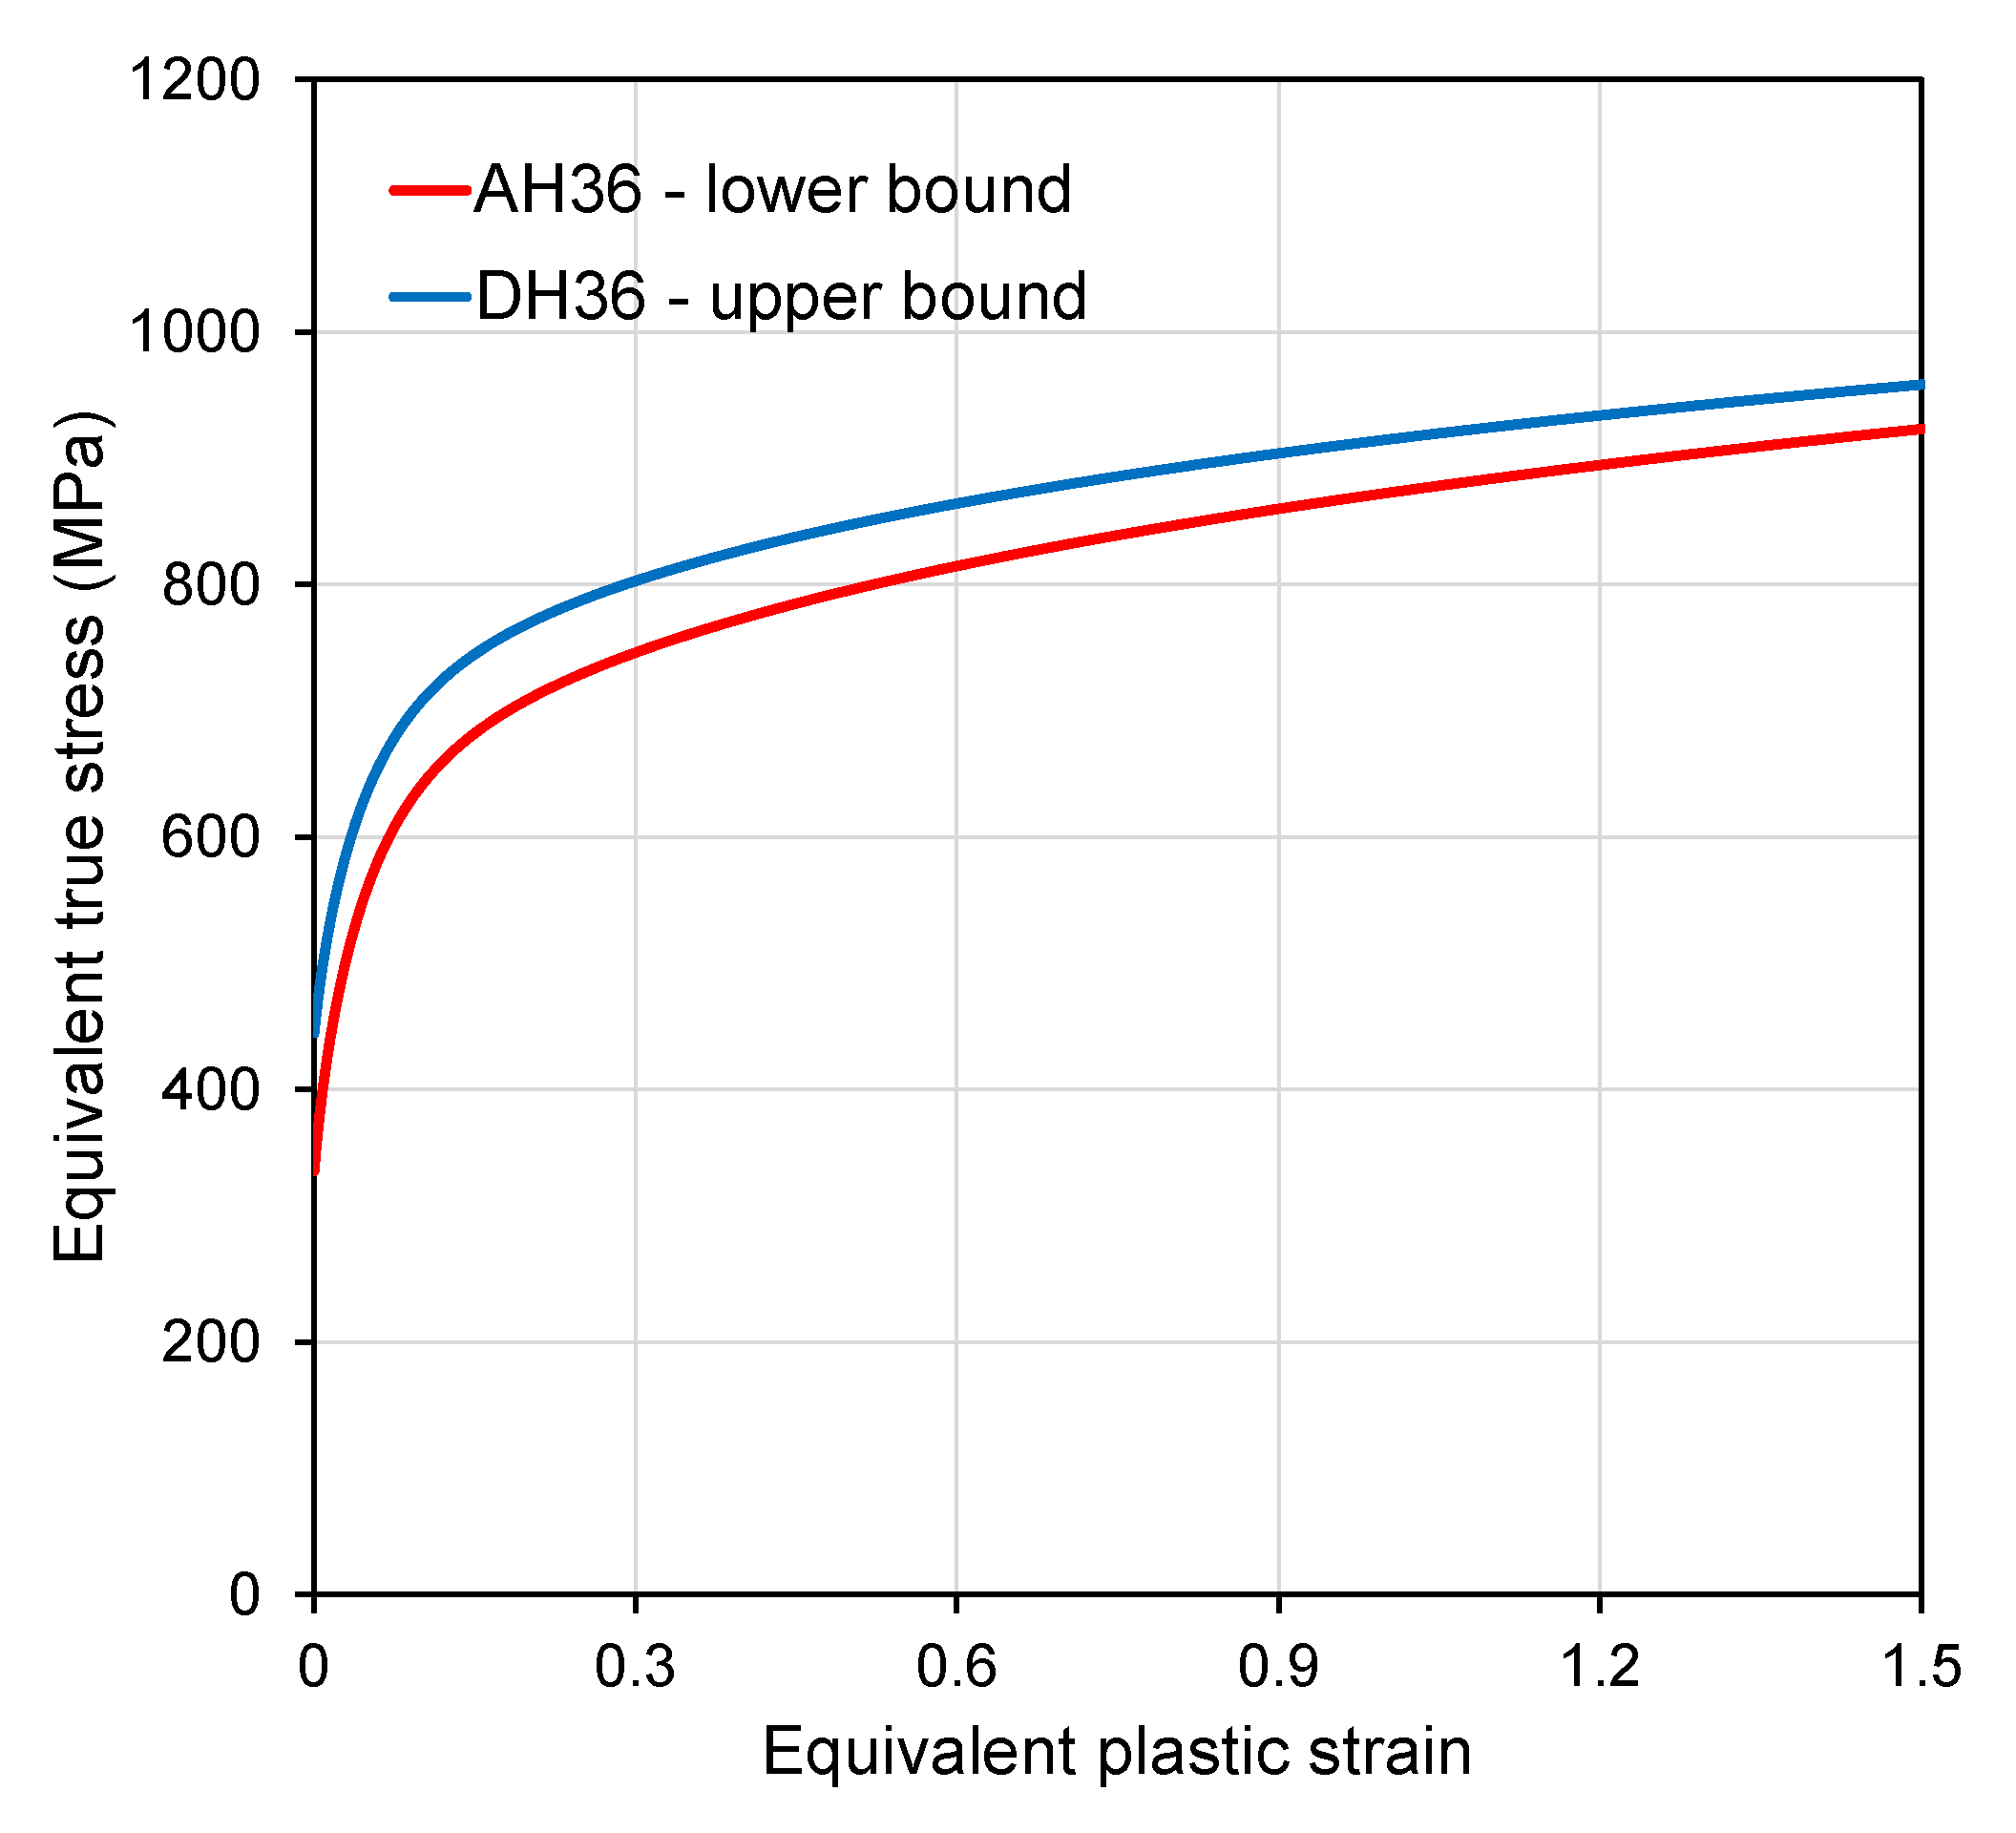
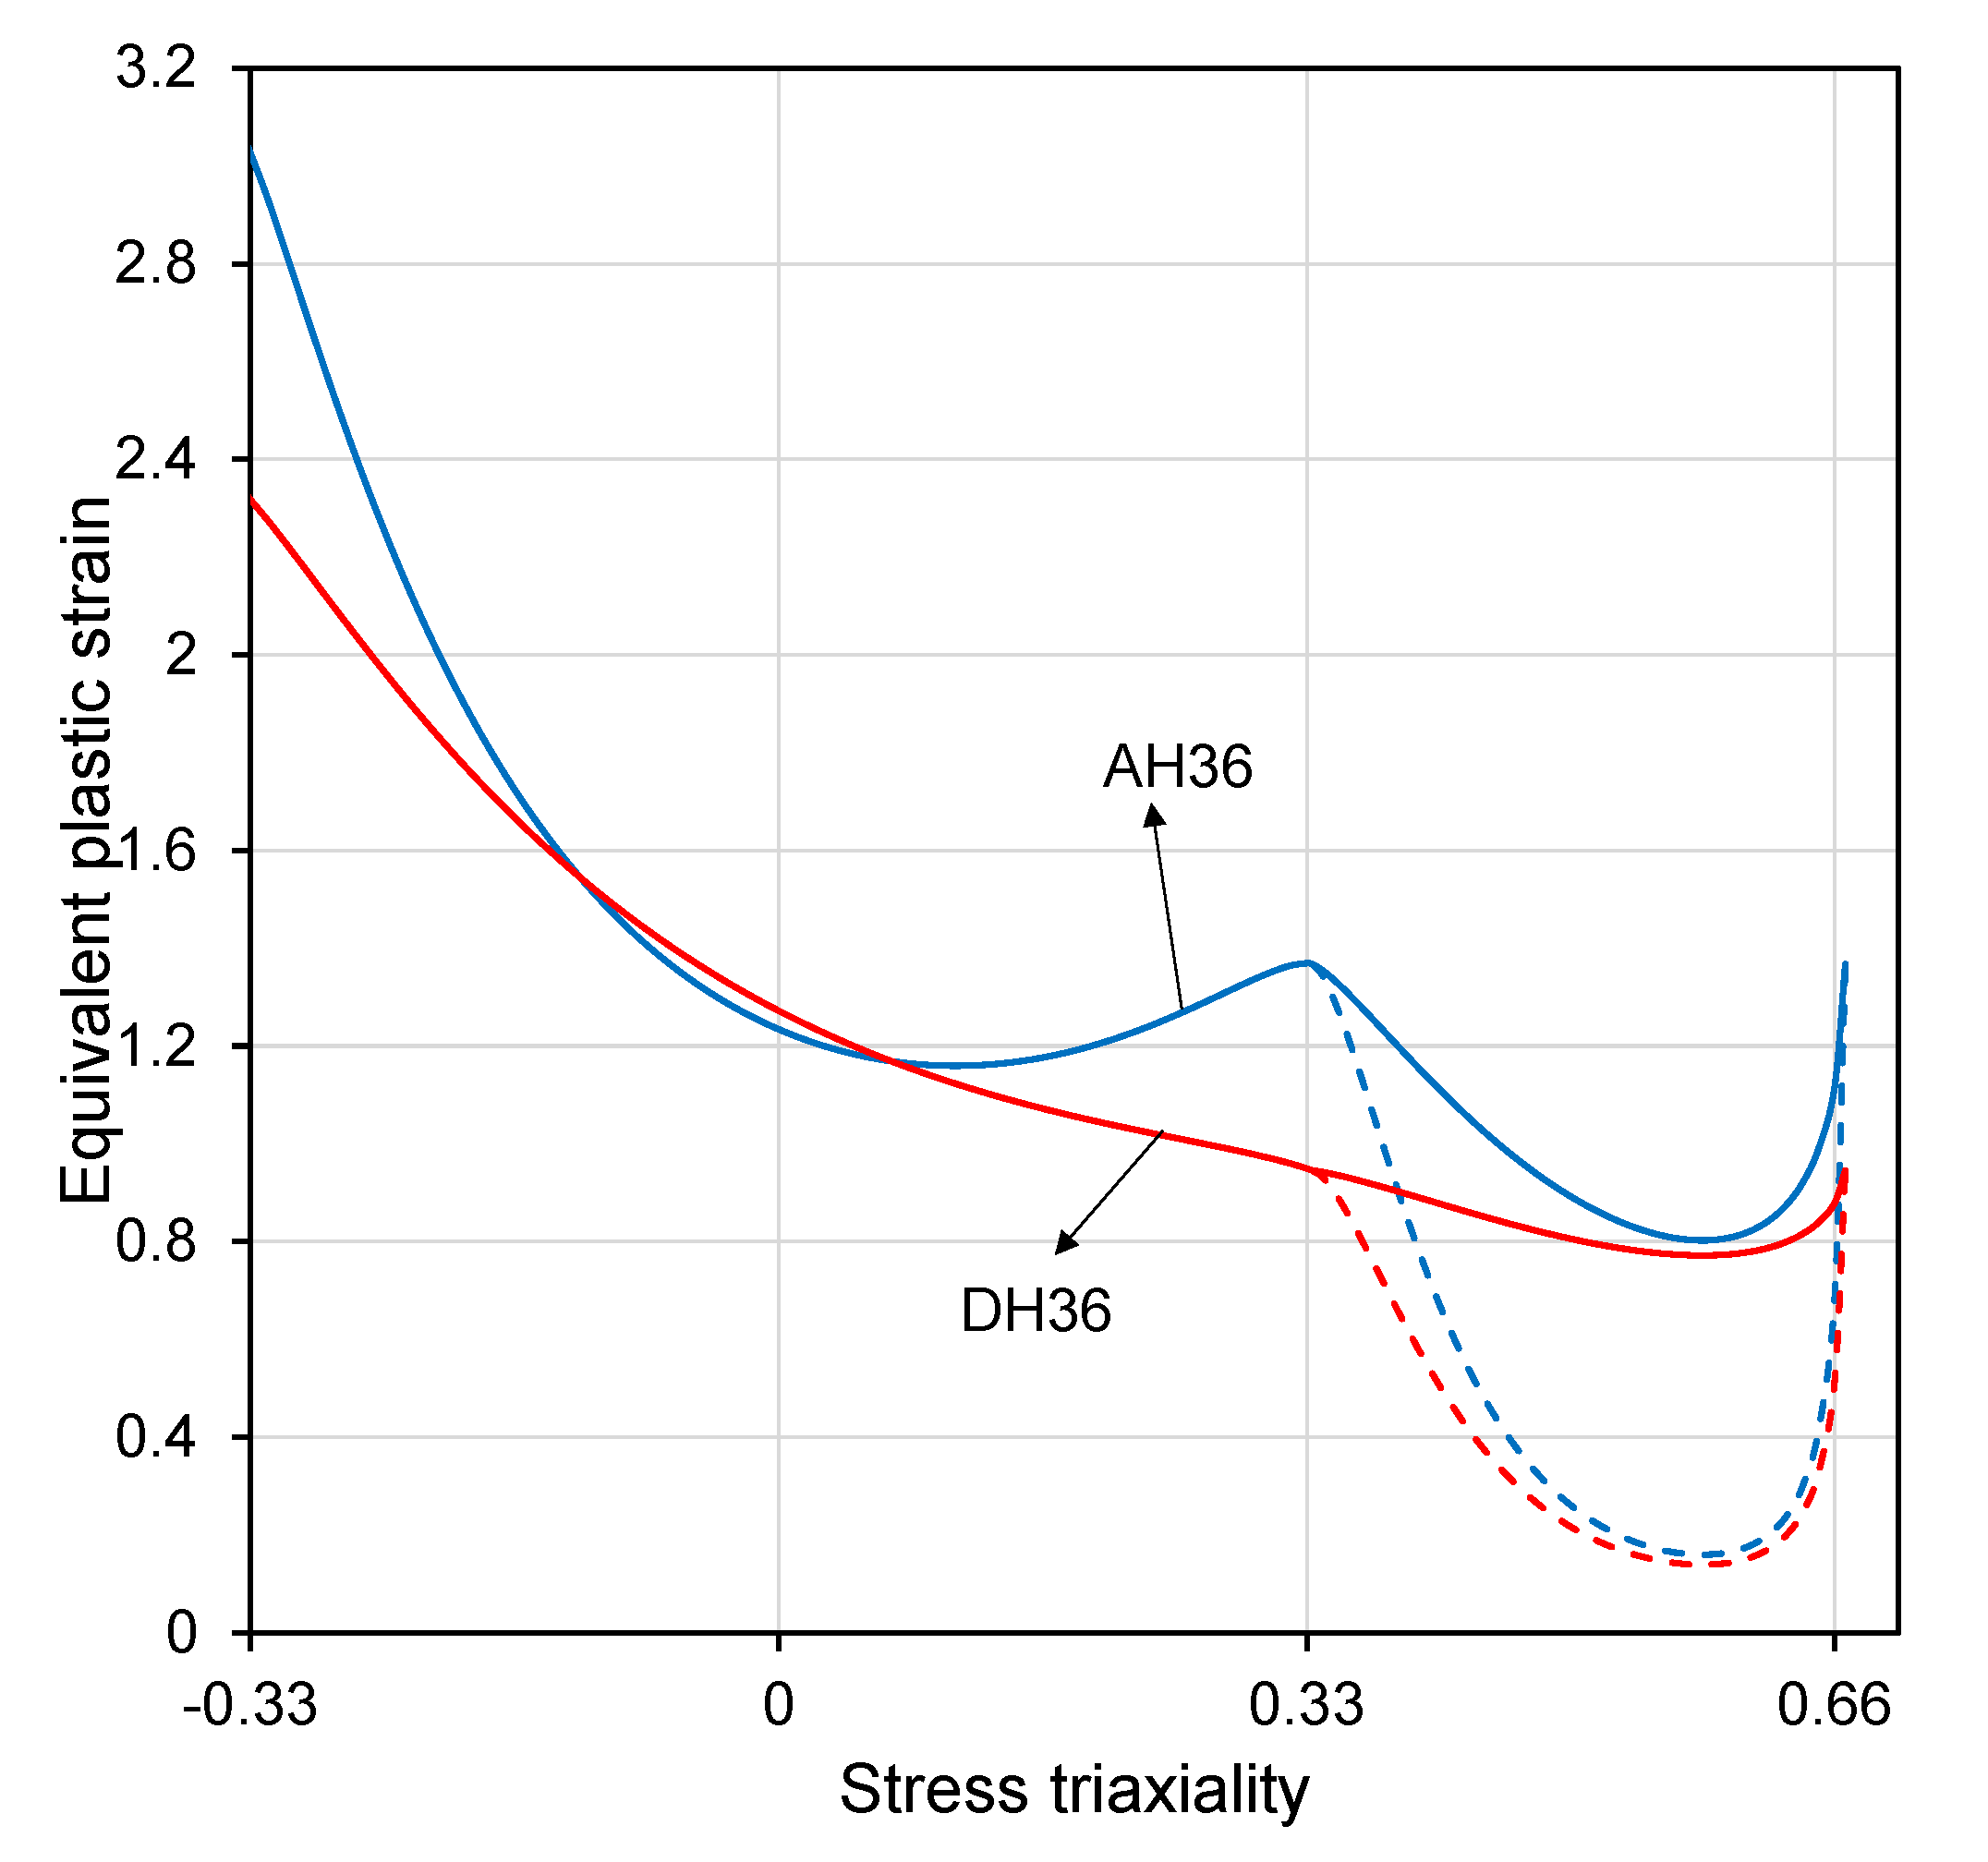
The material test results in [37] cannot be directly used for calibrating the employed material and fracture models in the present paper as they only consist of standard tension tests. On the other hand, typical test specimens and test conditions for calibrating the rate-dependent material and fracture model, as given in the paper by Roth and Mohr (reference ??), are many and require fracture specimens with unique geometries to attain the desired stress states. Therefore, it was decided to utilize the existing calibrated material model parameters reported in [30]. In marine structures practice, it is common to classify steel grades based on the yield strength and ultimate tensile strength/yield strength ratio, and steel grades with similar flow stress characteristics (i.e., hardening behaviour) can be assumed to have similar material parameters. The material model parameters were chosen considering the scatter in the test results. An upper bound for the flow stress curve under quasi-static conditions was assumed using the material parameters of the grade DH36 steel, which have been reported in [29,30]. The yield stress of DH36 is 435 MPa, and its hardening rate is comparable to the strain hardening curve of the test coupon exhibiting the largest ultimate tensile strength to yield strength ratio. In addition, a lower bound flow stress curve was defined using the material parameters of the grade AH36 [29,30] similarly. Table 1 lists the hardening law parameters of both grades. Figure 3 shows the hardening curves. The ductility limits of DH36 and AH36 were remarkably different and strongly dependent on the hardening rate. Figure 4 presents the fracture loci of these steel grades. The fracture model parameters were taken from reference [29]. The localized necking loci are plotted with dashed lines, and the fracture loci were plotted with continuous lines.
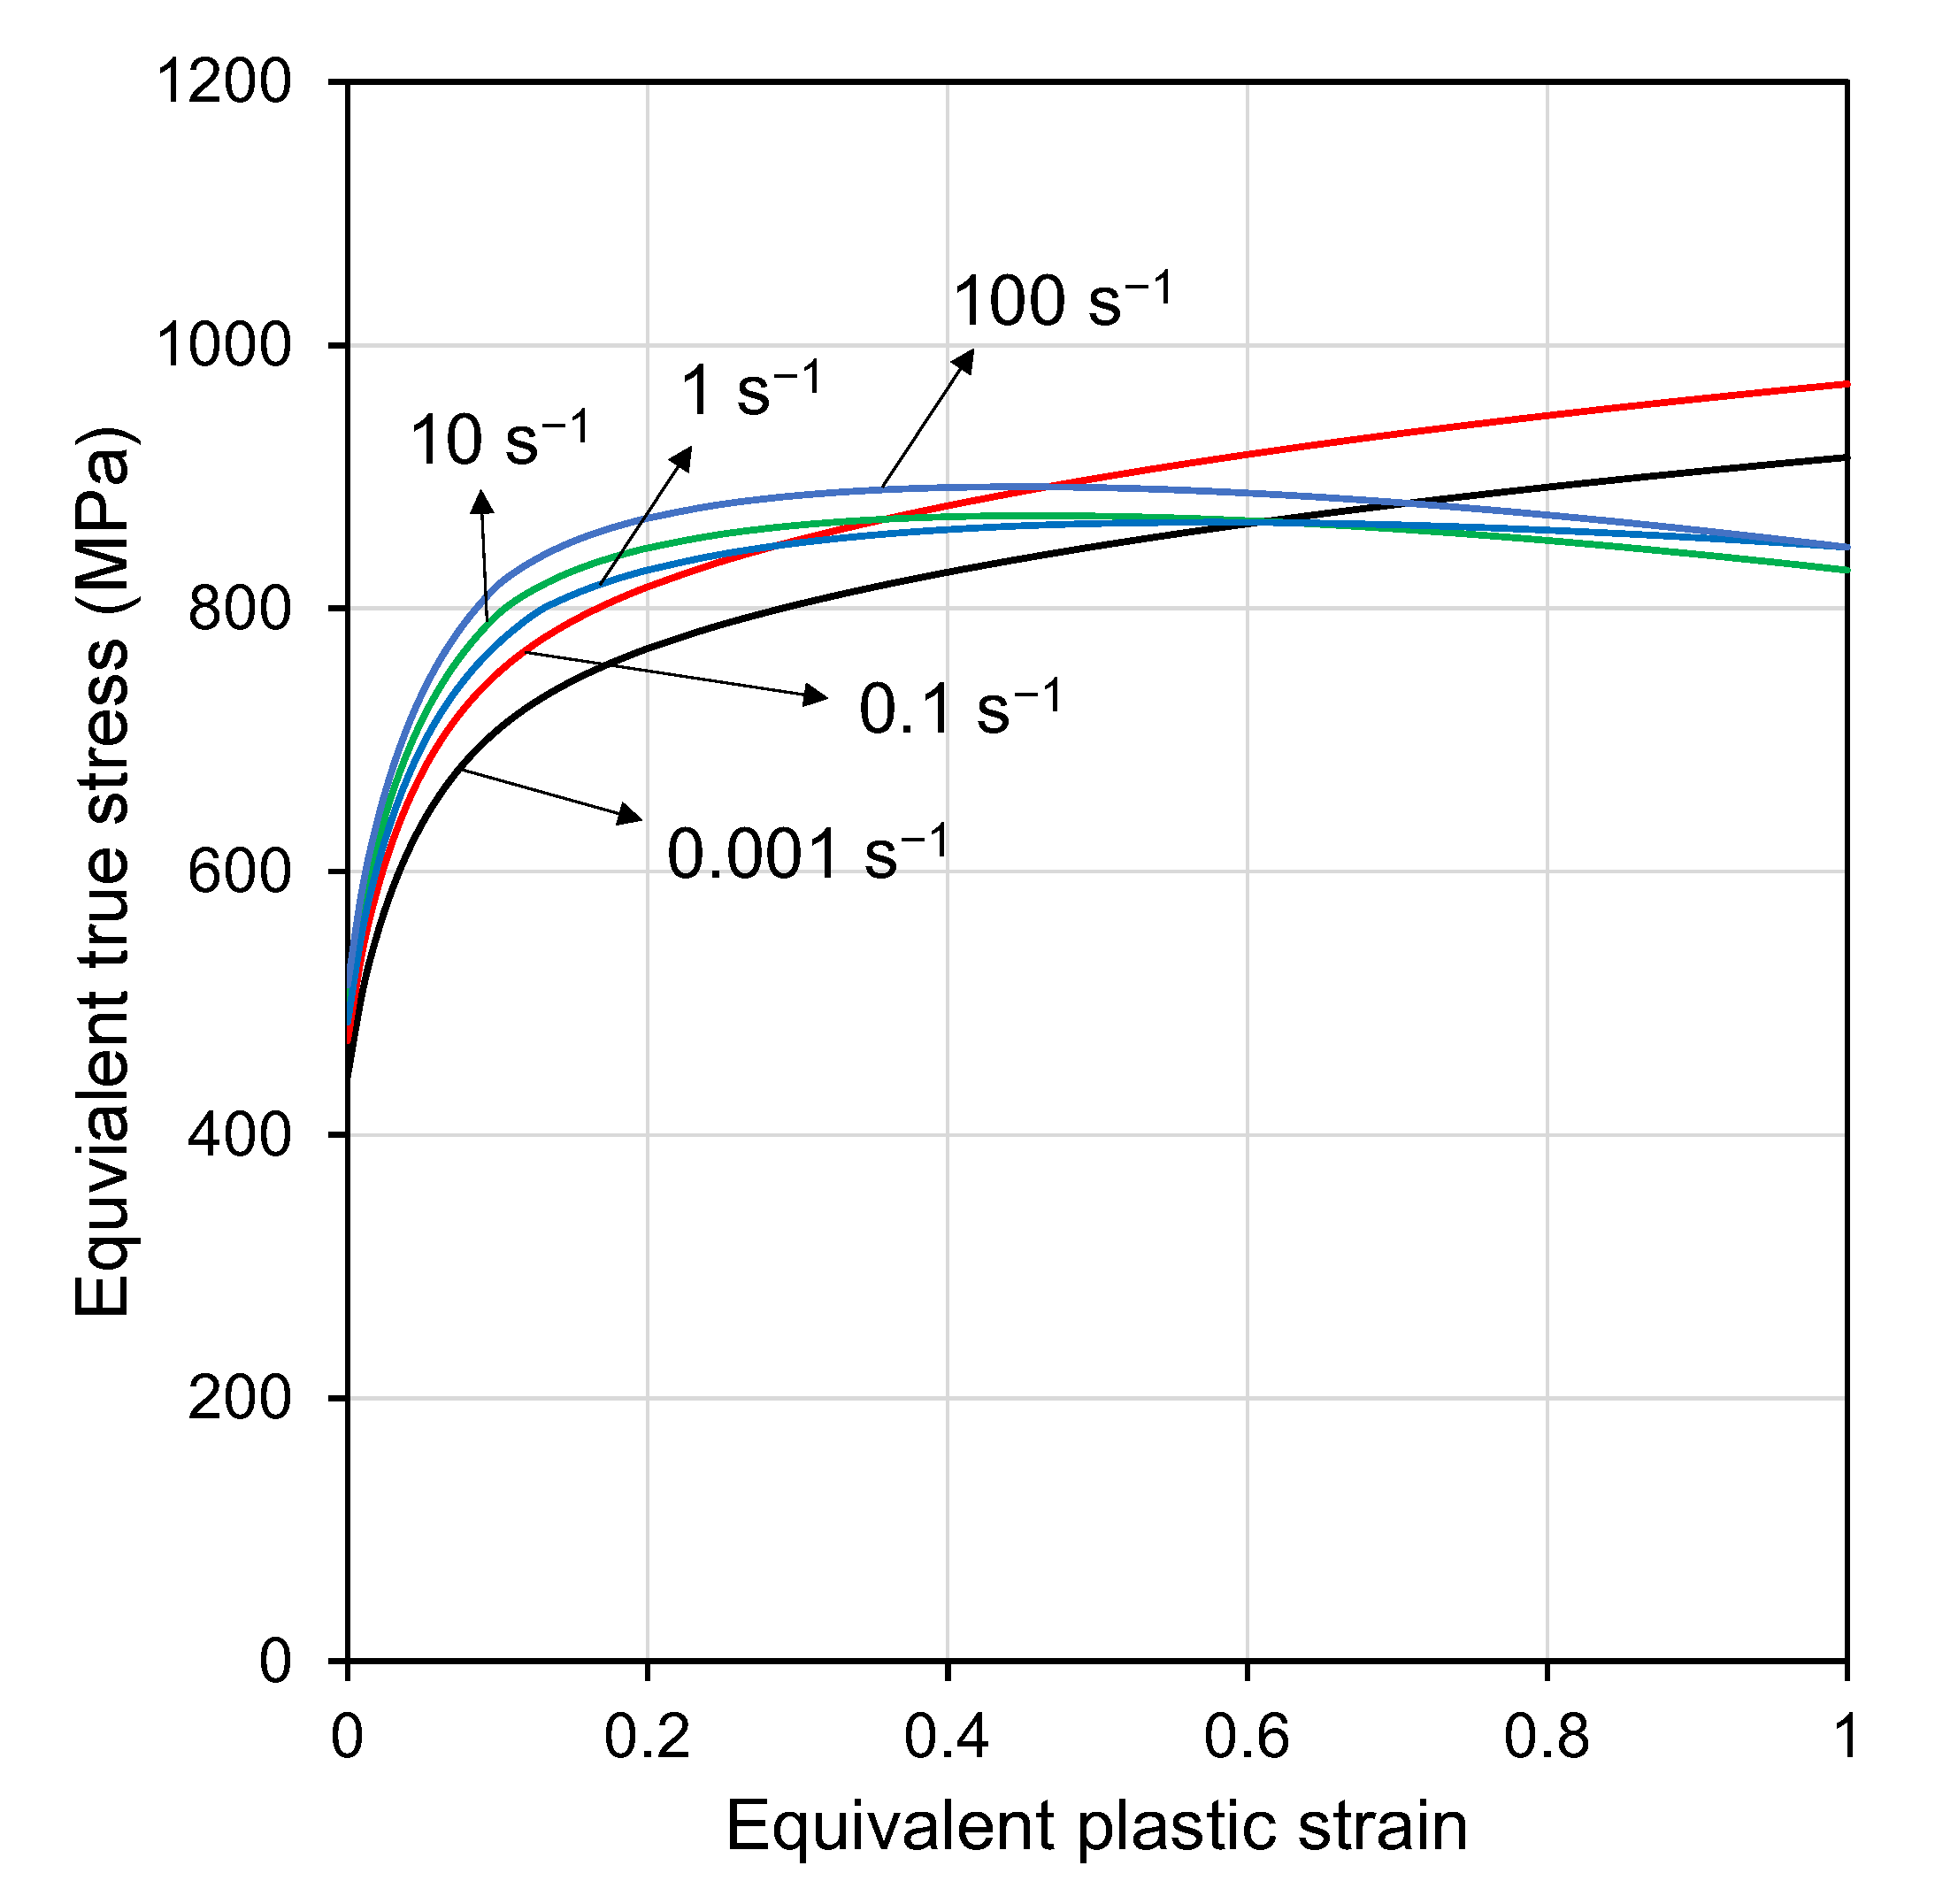
The dynamic flow stress was modelled using the quasi-static flow stress curve of DH36 and dynamic flow stress properties of DP590, which has similar mechanical properties to the steel grades considered in this study [18,34]. We emphasize that in the present study, we do not specifically compare the three materials (moreover, three high-tensile strength structural steels) but use the parameters of these materials as estimates of the subject test material’s flow stress and ductile fracture characteristics. Table 2 provides the adopted parameters, and Figure 5 depicts the resulting flow stress at various strain rates. Note that the temperature effect was implicitly considered in these curves. With increasing plastic deformation, the temperature increases and the thermal softening term in the deformation resistance function was calculated accordingly. Figure 6 shows the HC (continuous line) and DSSE (dashed line) loci for the same strain rates. To check the influence of the considered rate effects, the simulations of quasi-static tests were ran ignoring the rate- and temperature-dependent terms in the material model, as reported by [22], i.e., only using the strain-hardening law based on the combined Swift–Voce law and the original (rate-independent) DSSE–HC model. The rate-dependency was included in the low-velocity impact test simulation.
5. Results and Discussions
The credibility of numerical predictions was examined by comparing the experimental force-displacement curves with the numerical simulation results and the observed fracture pattern with the numerically predicted failure mode. Note that the sudden drop in the force-displacement curves corresponds to the fracture initiation in the vicinity of the notch. Prediction of the post-failure response and crack growth path were considered of secondary importance as the adopted fracture model is suitable only for predicting the onset of a fracture and models the crack growth in an indirect way by successive deletion of failed elements.
5.1. Quasi-Static Impact Test
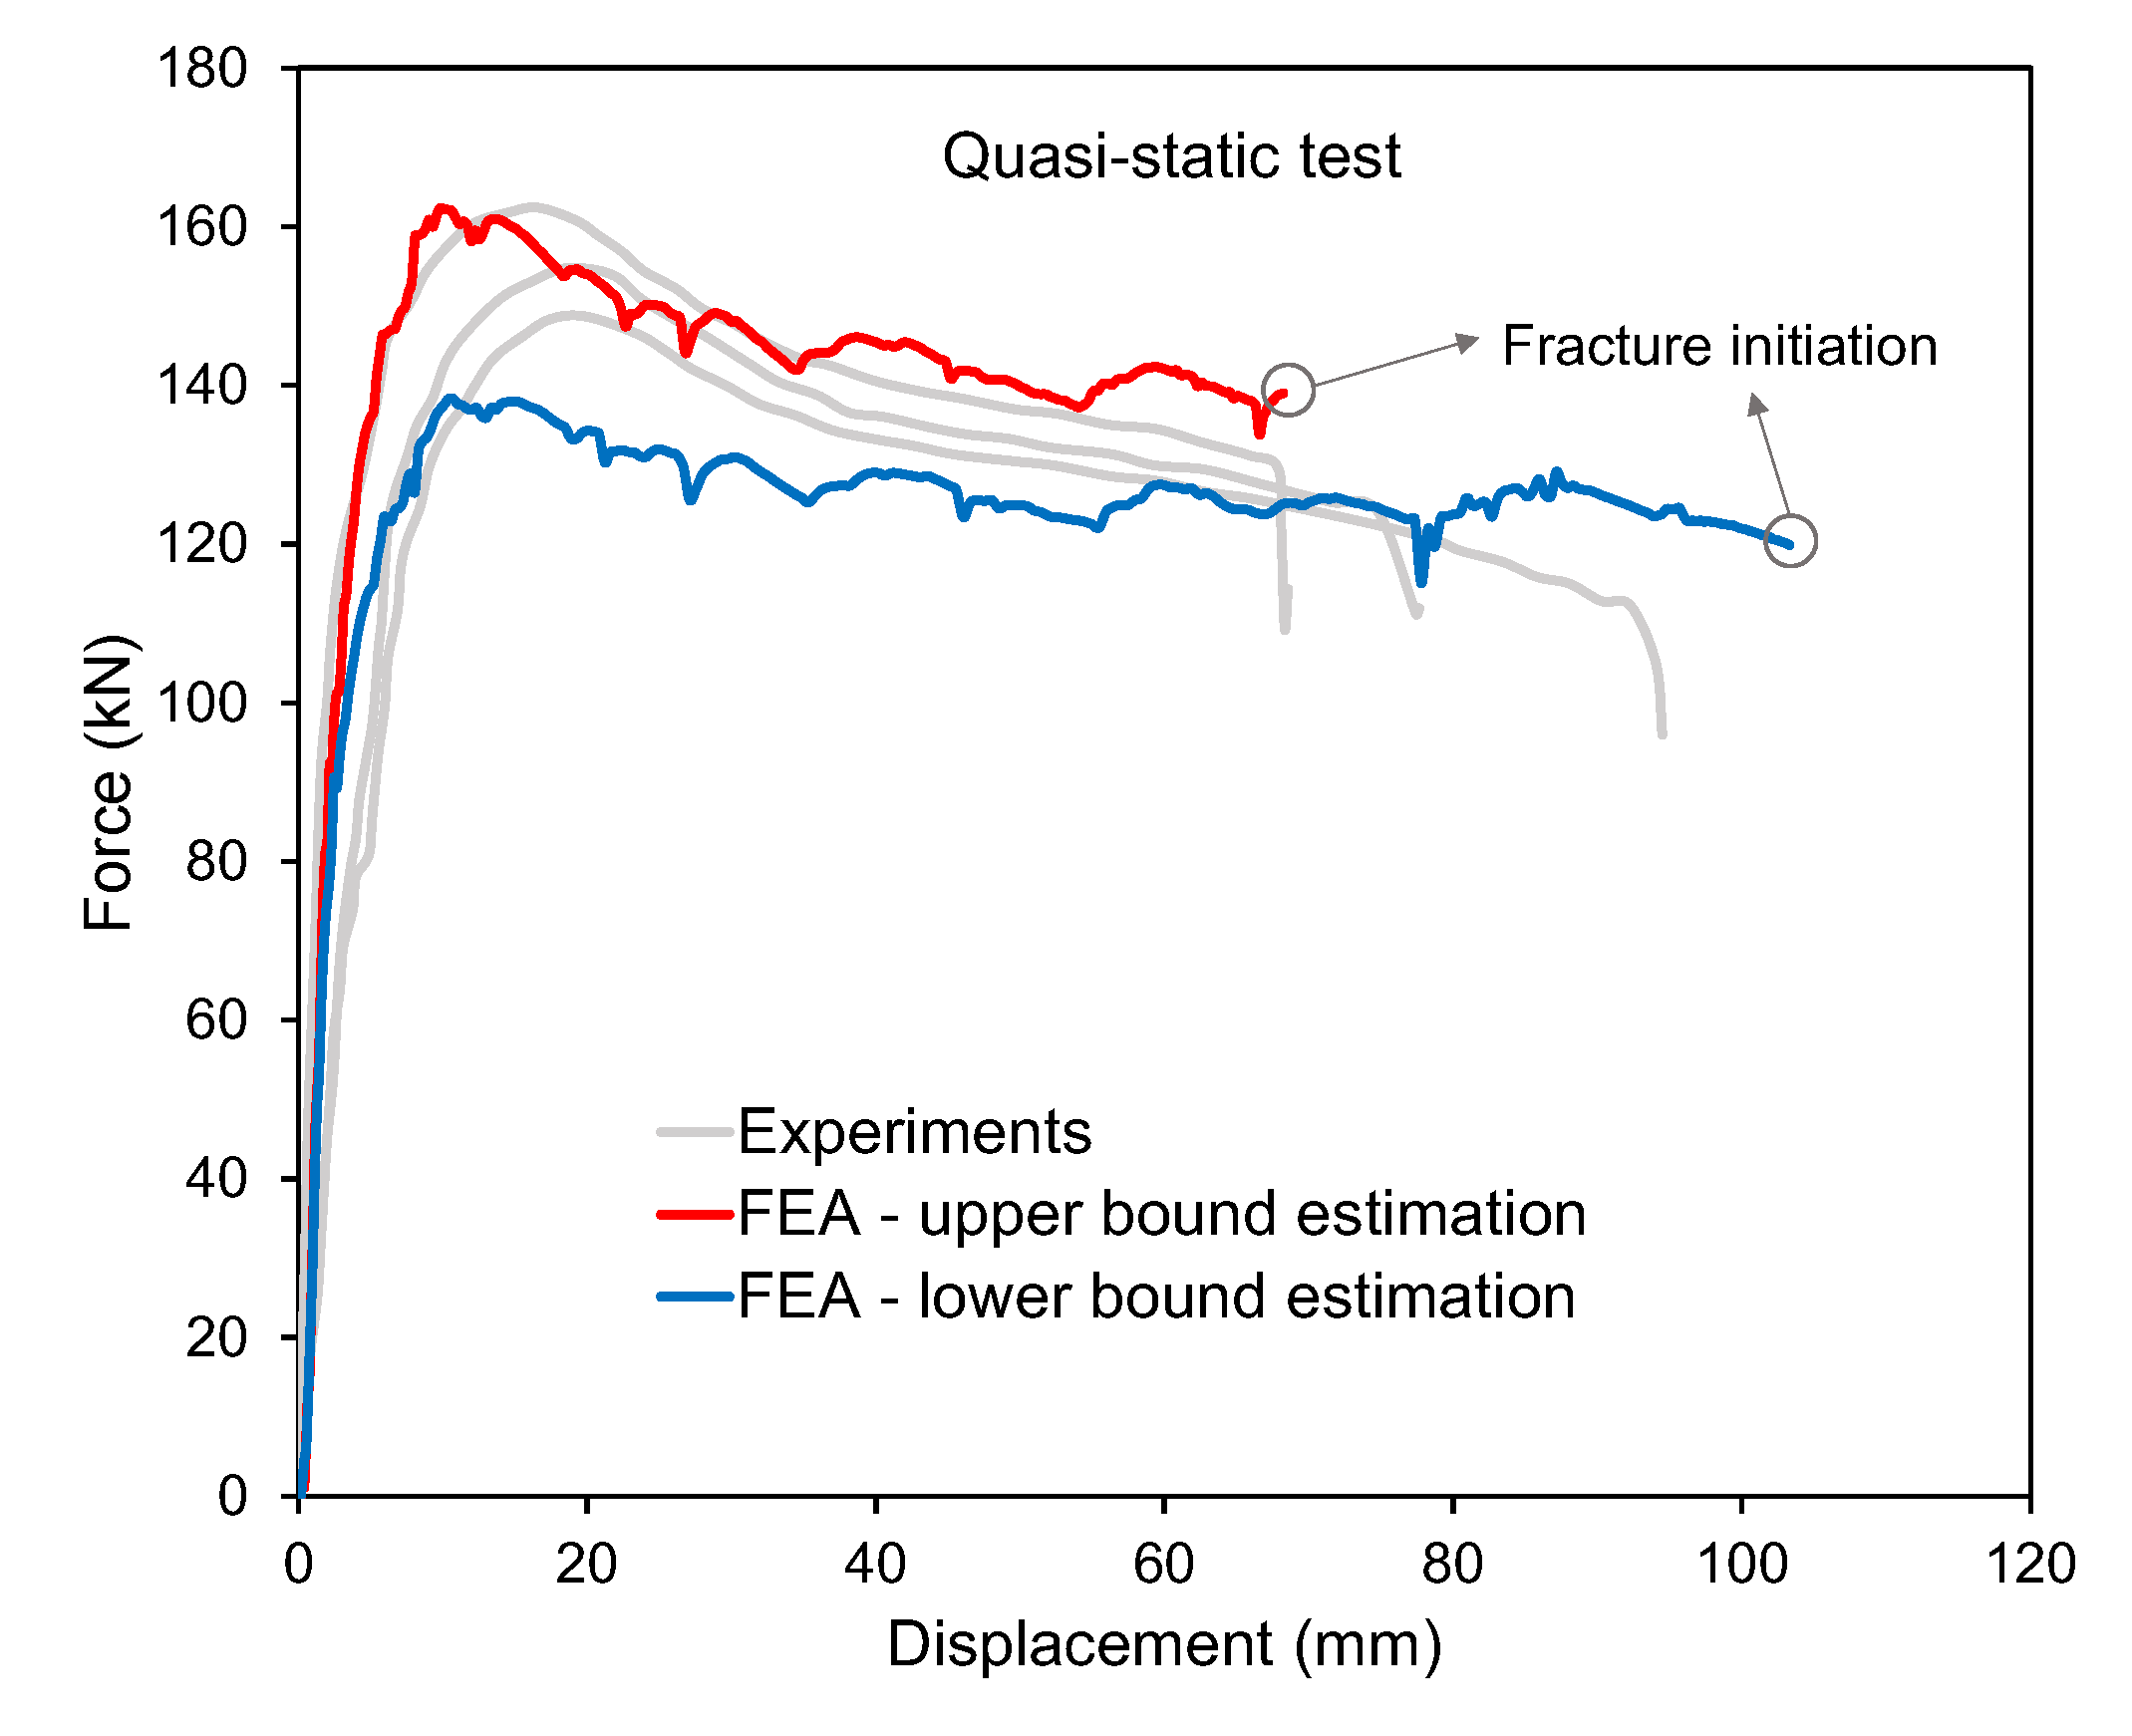
The experimental and numerical force-displacement curves were compared, as shown in Figure 7 for the quasi-static test and simulations. A good qualitative match was observed because the numerical results were within the experimentally observed scatter. The predictions made using the material model parameters of DH36 (upped bound flow stress curve) showed close agreement with the test results featuring the highest peak force. The stiffness, peak force, and instance of fracture were estimated accurately, but the force levels in the decay region were slightly larger than the test results. The predictions with the AH36 parameters (lower bound flow stress curve) resulted in a much lower peak force and a larger displacement at fracture compared to the experiments. (Therefore, it was deemed that the upper bound curve represents the test structural material more closely, and further analyses were conducted with the upper bound curve parameters.)
In the tests, the fracture initiated close to the notch and propagated diagonally towards the contact point between the indentor and the target model. In addition, there were no surface cracks on the top flange of the test model around the folded regions. Figure 8 shows the predicted failure mode and compares the results with the post-mortem specimen. Here, the localized necking indicator, N, and ductile fracture indicator, D, were used as the plotting contour. Note that localized necking occurs around the notch, but the condition for surface cracking, which is at any through-thickness integration point, was not satisfied on the top flange of the SHS. (Therefore, similar to the test observations, surface cracking was not predicted in the numerical simulations.)
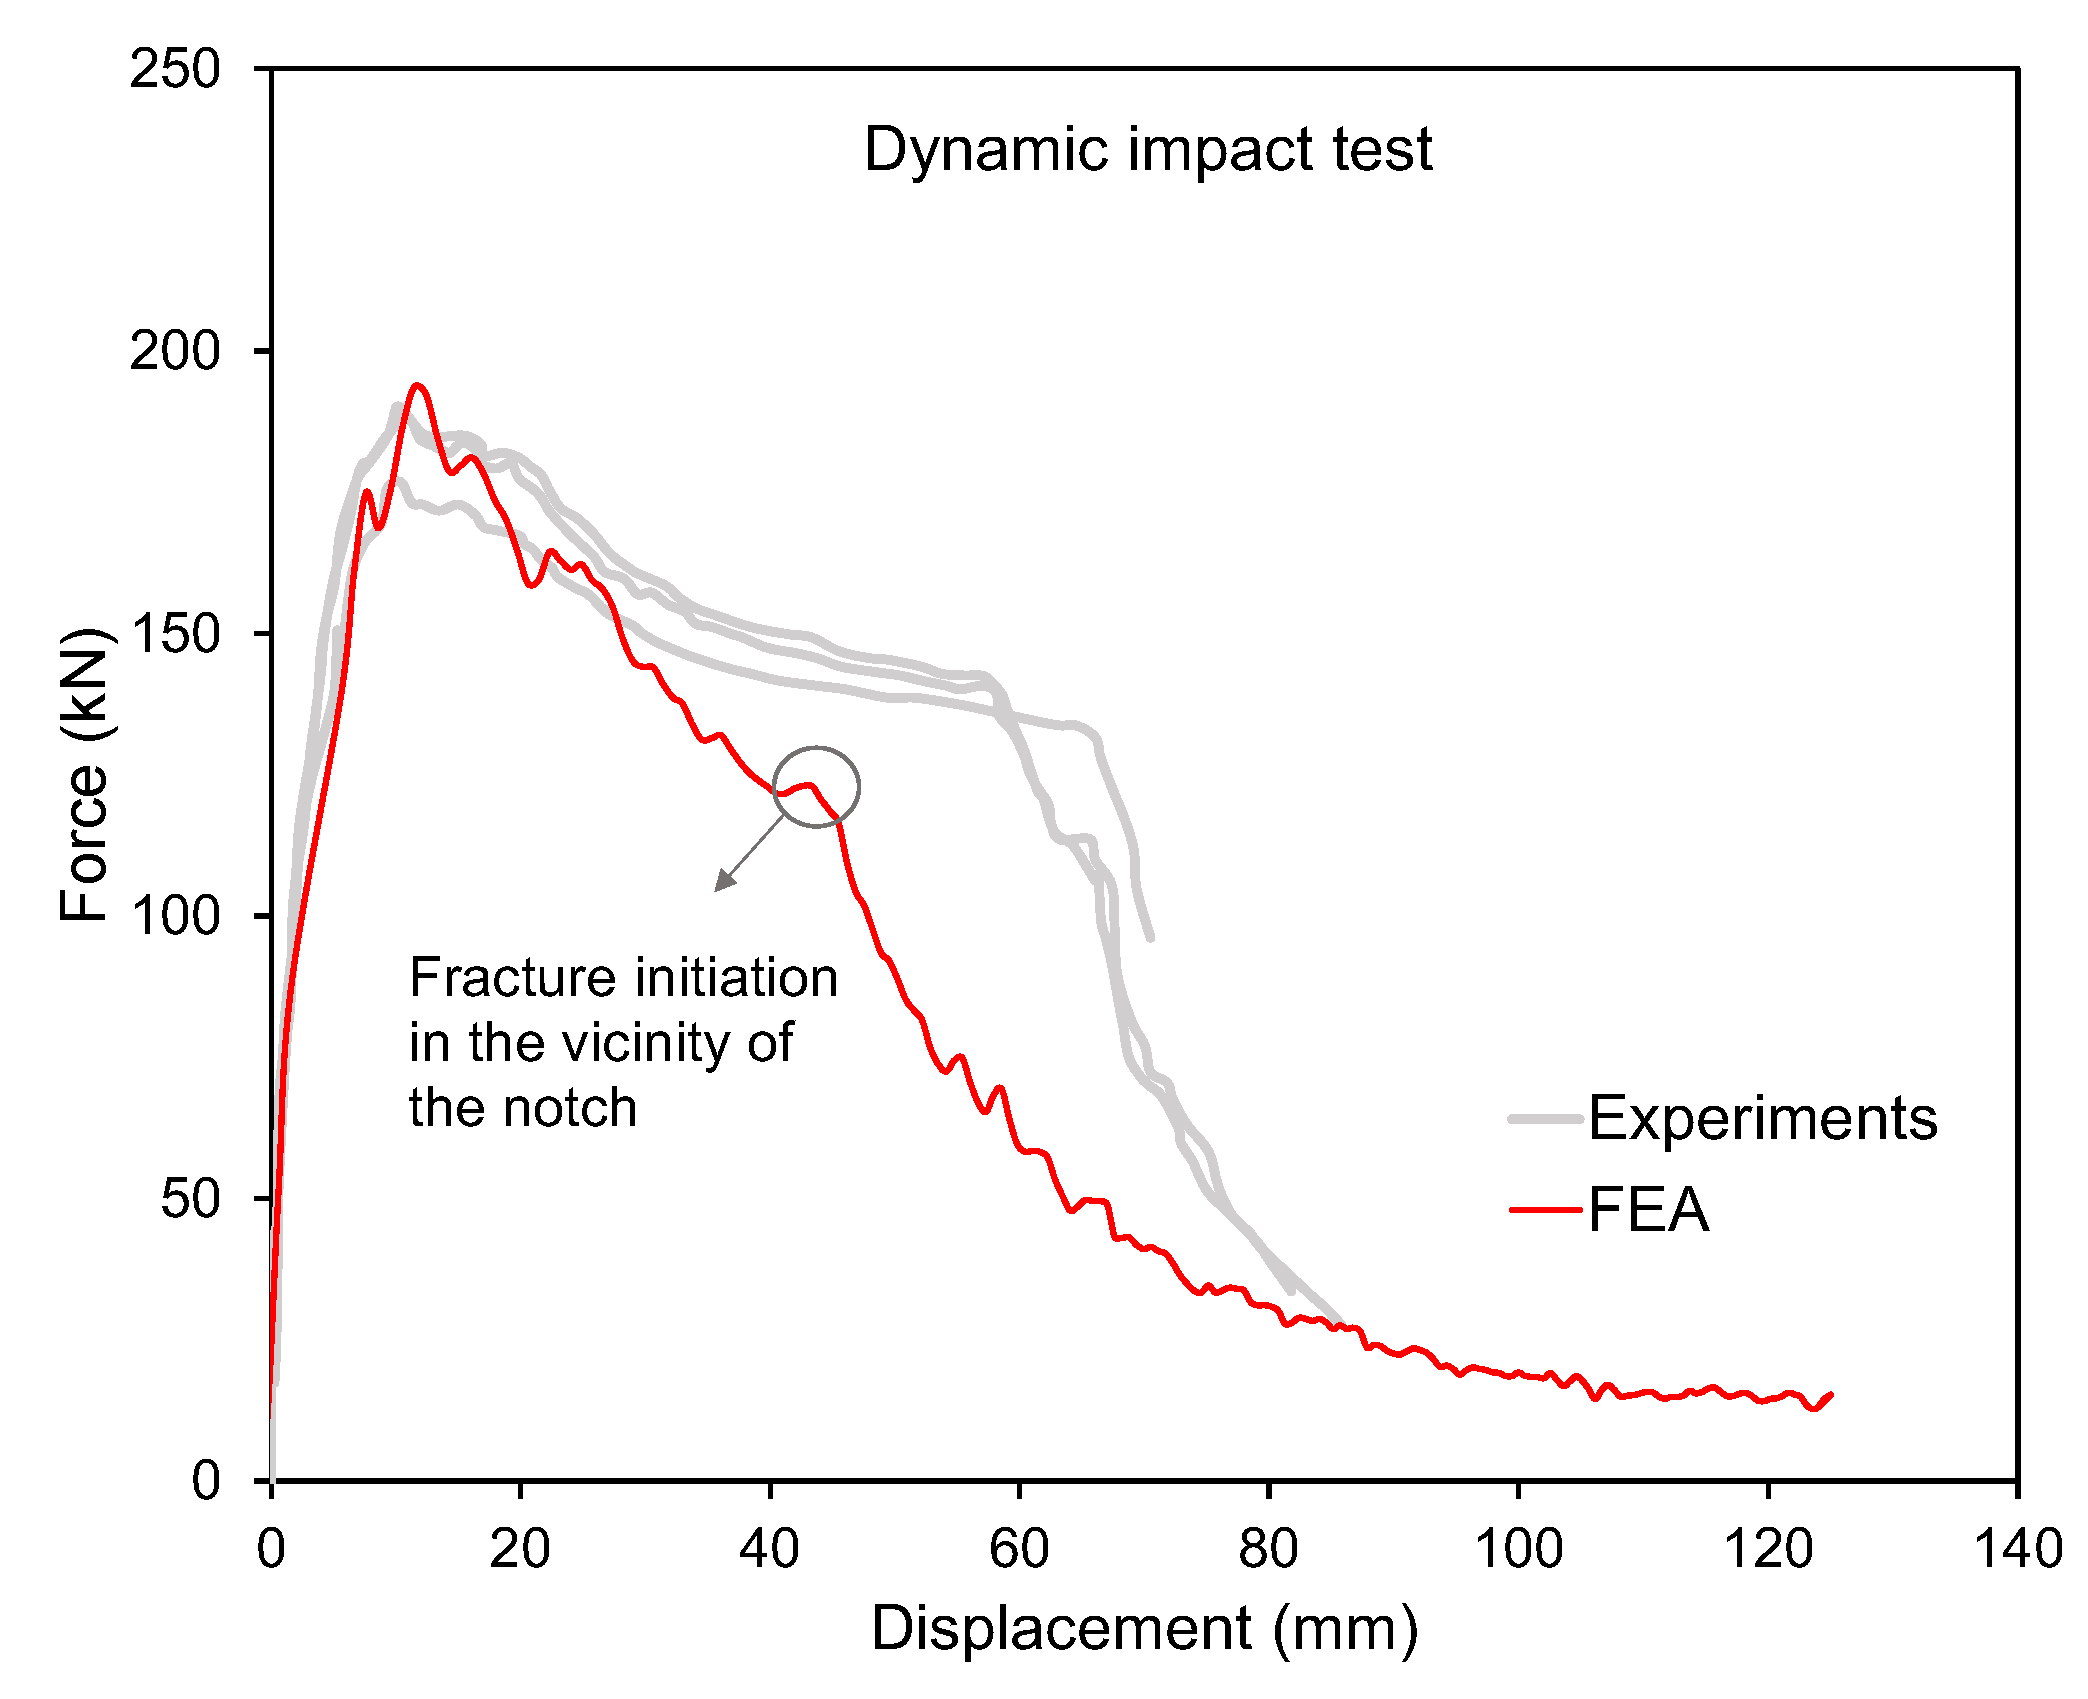
5.2. Dynamic Impact Test
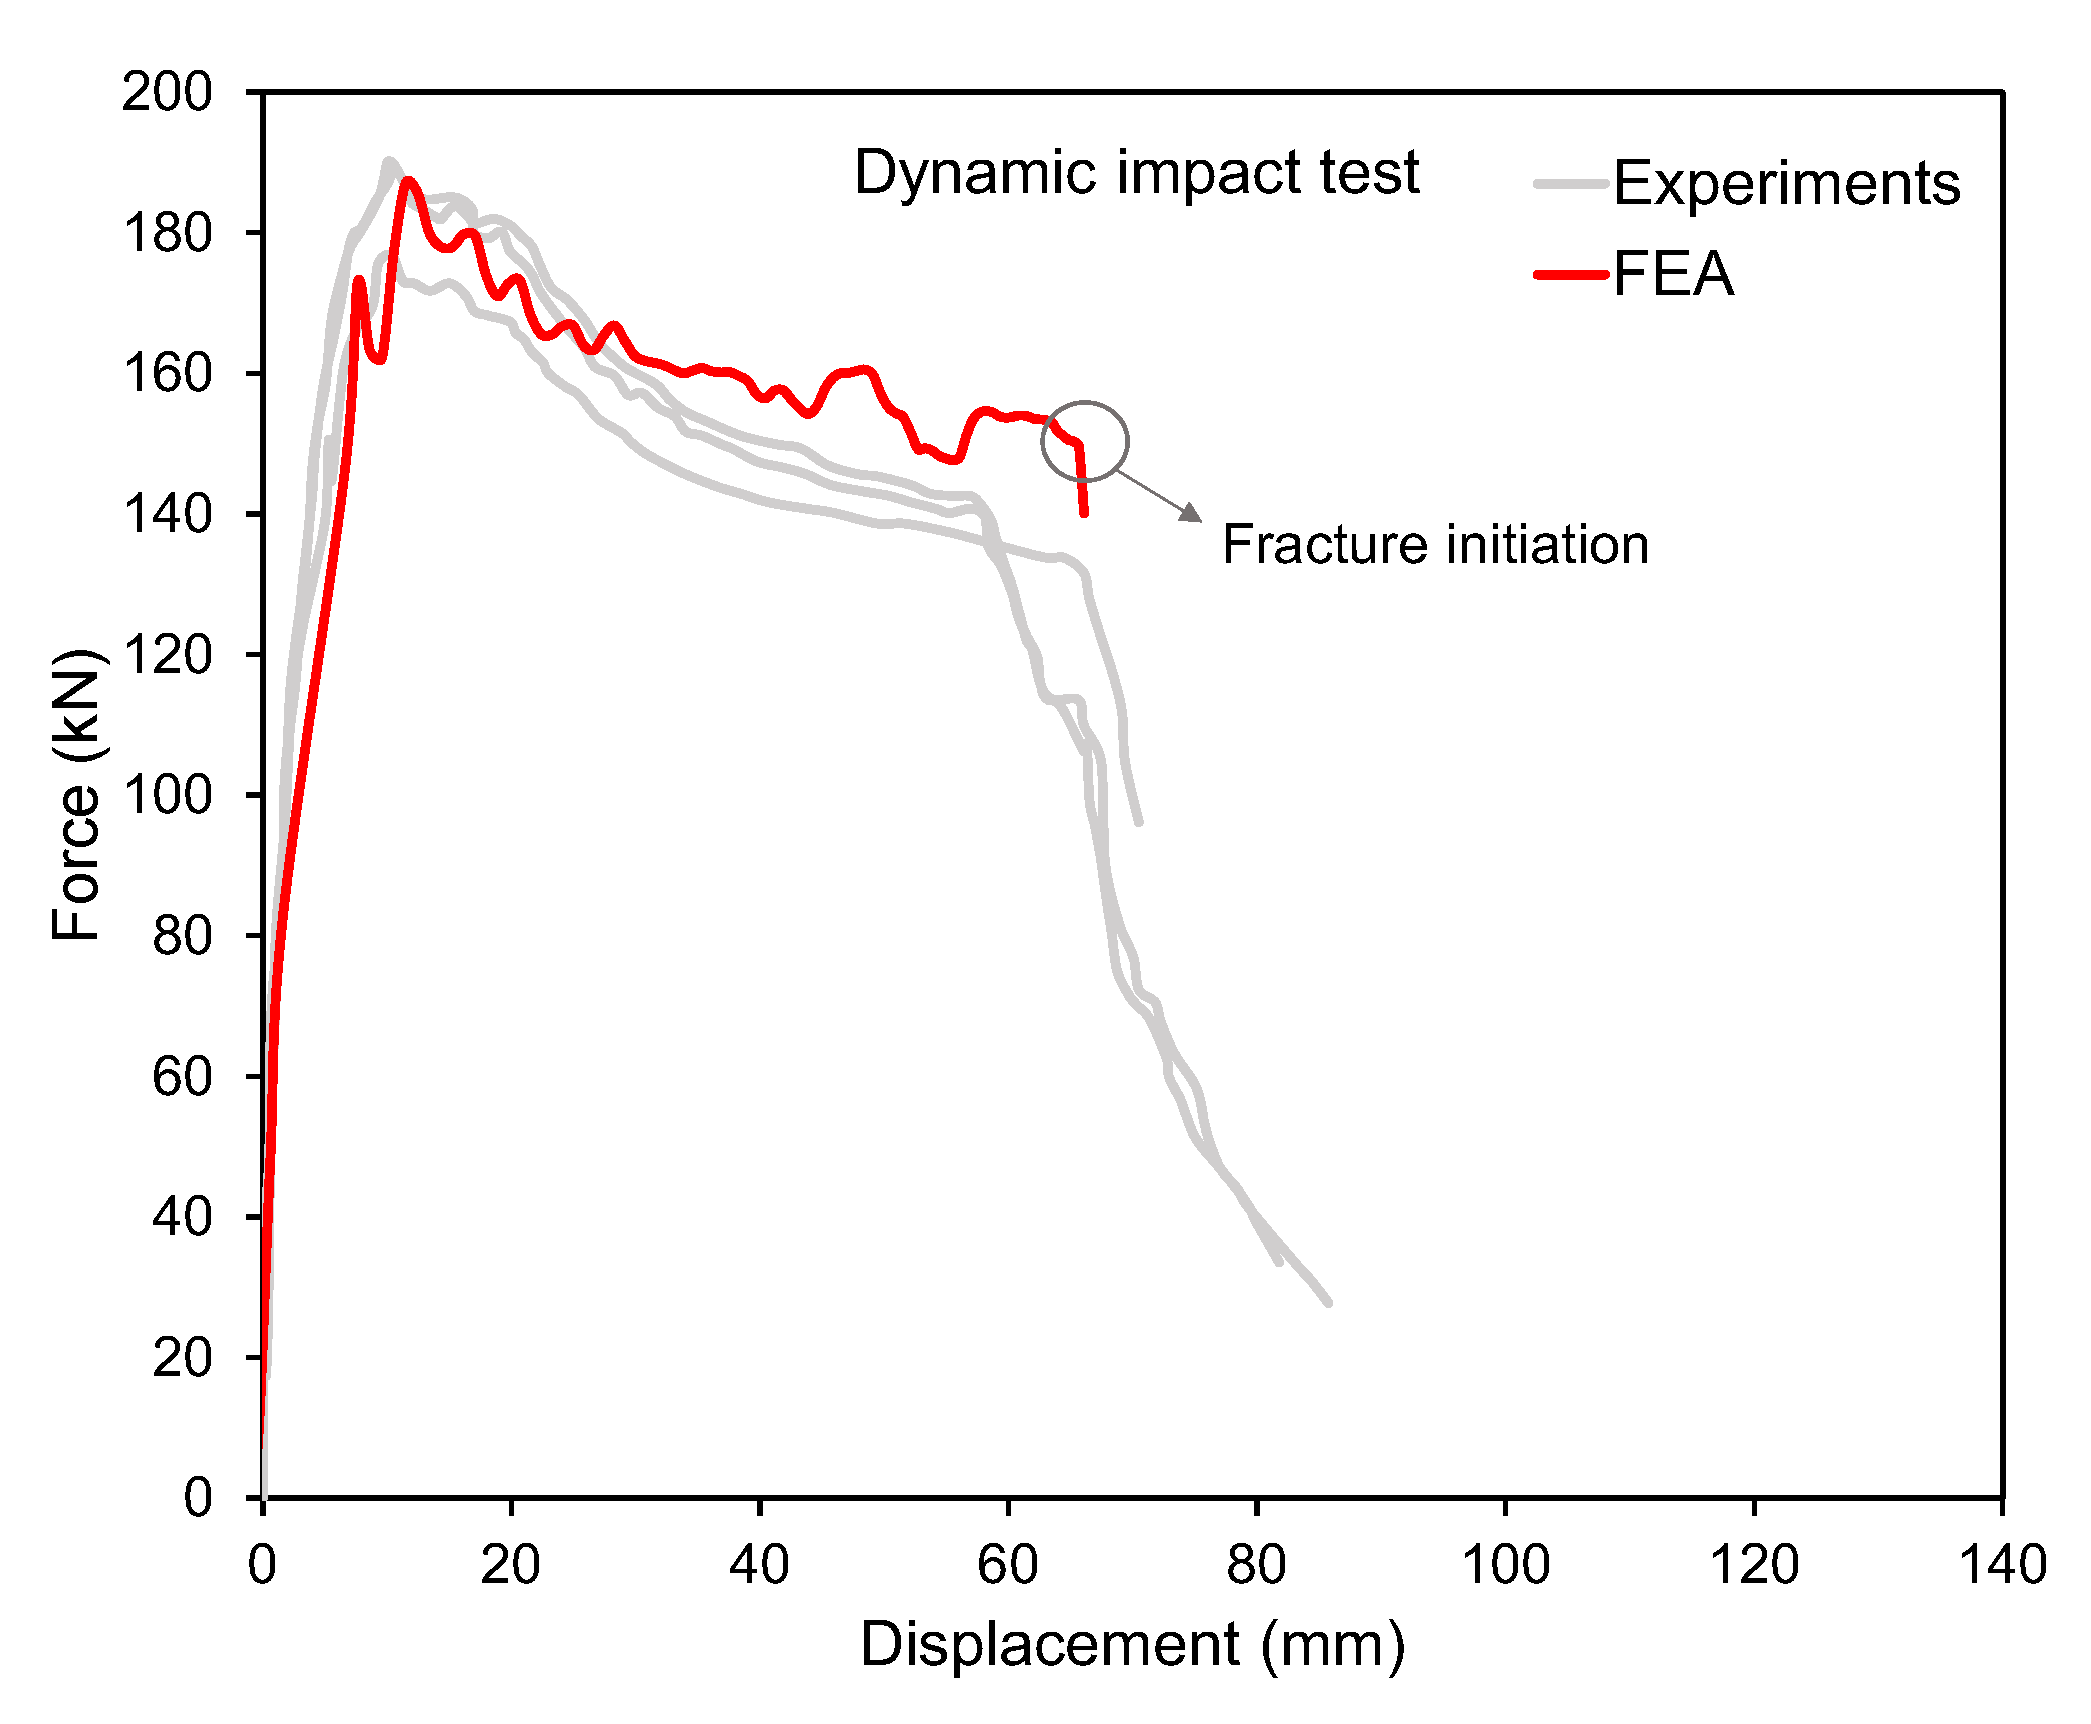
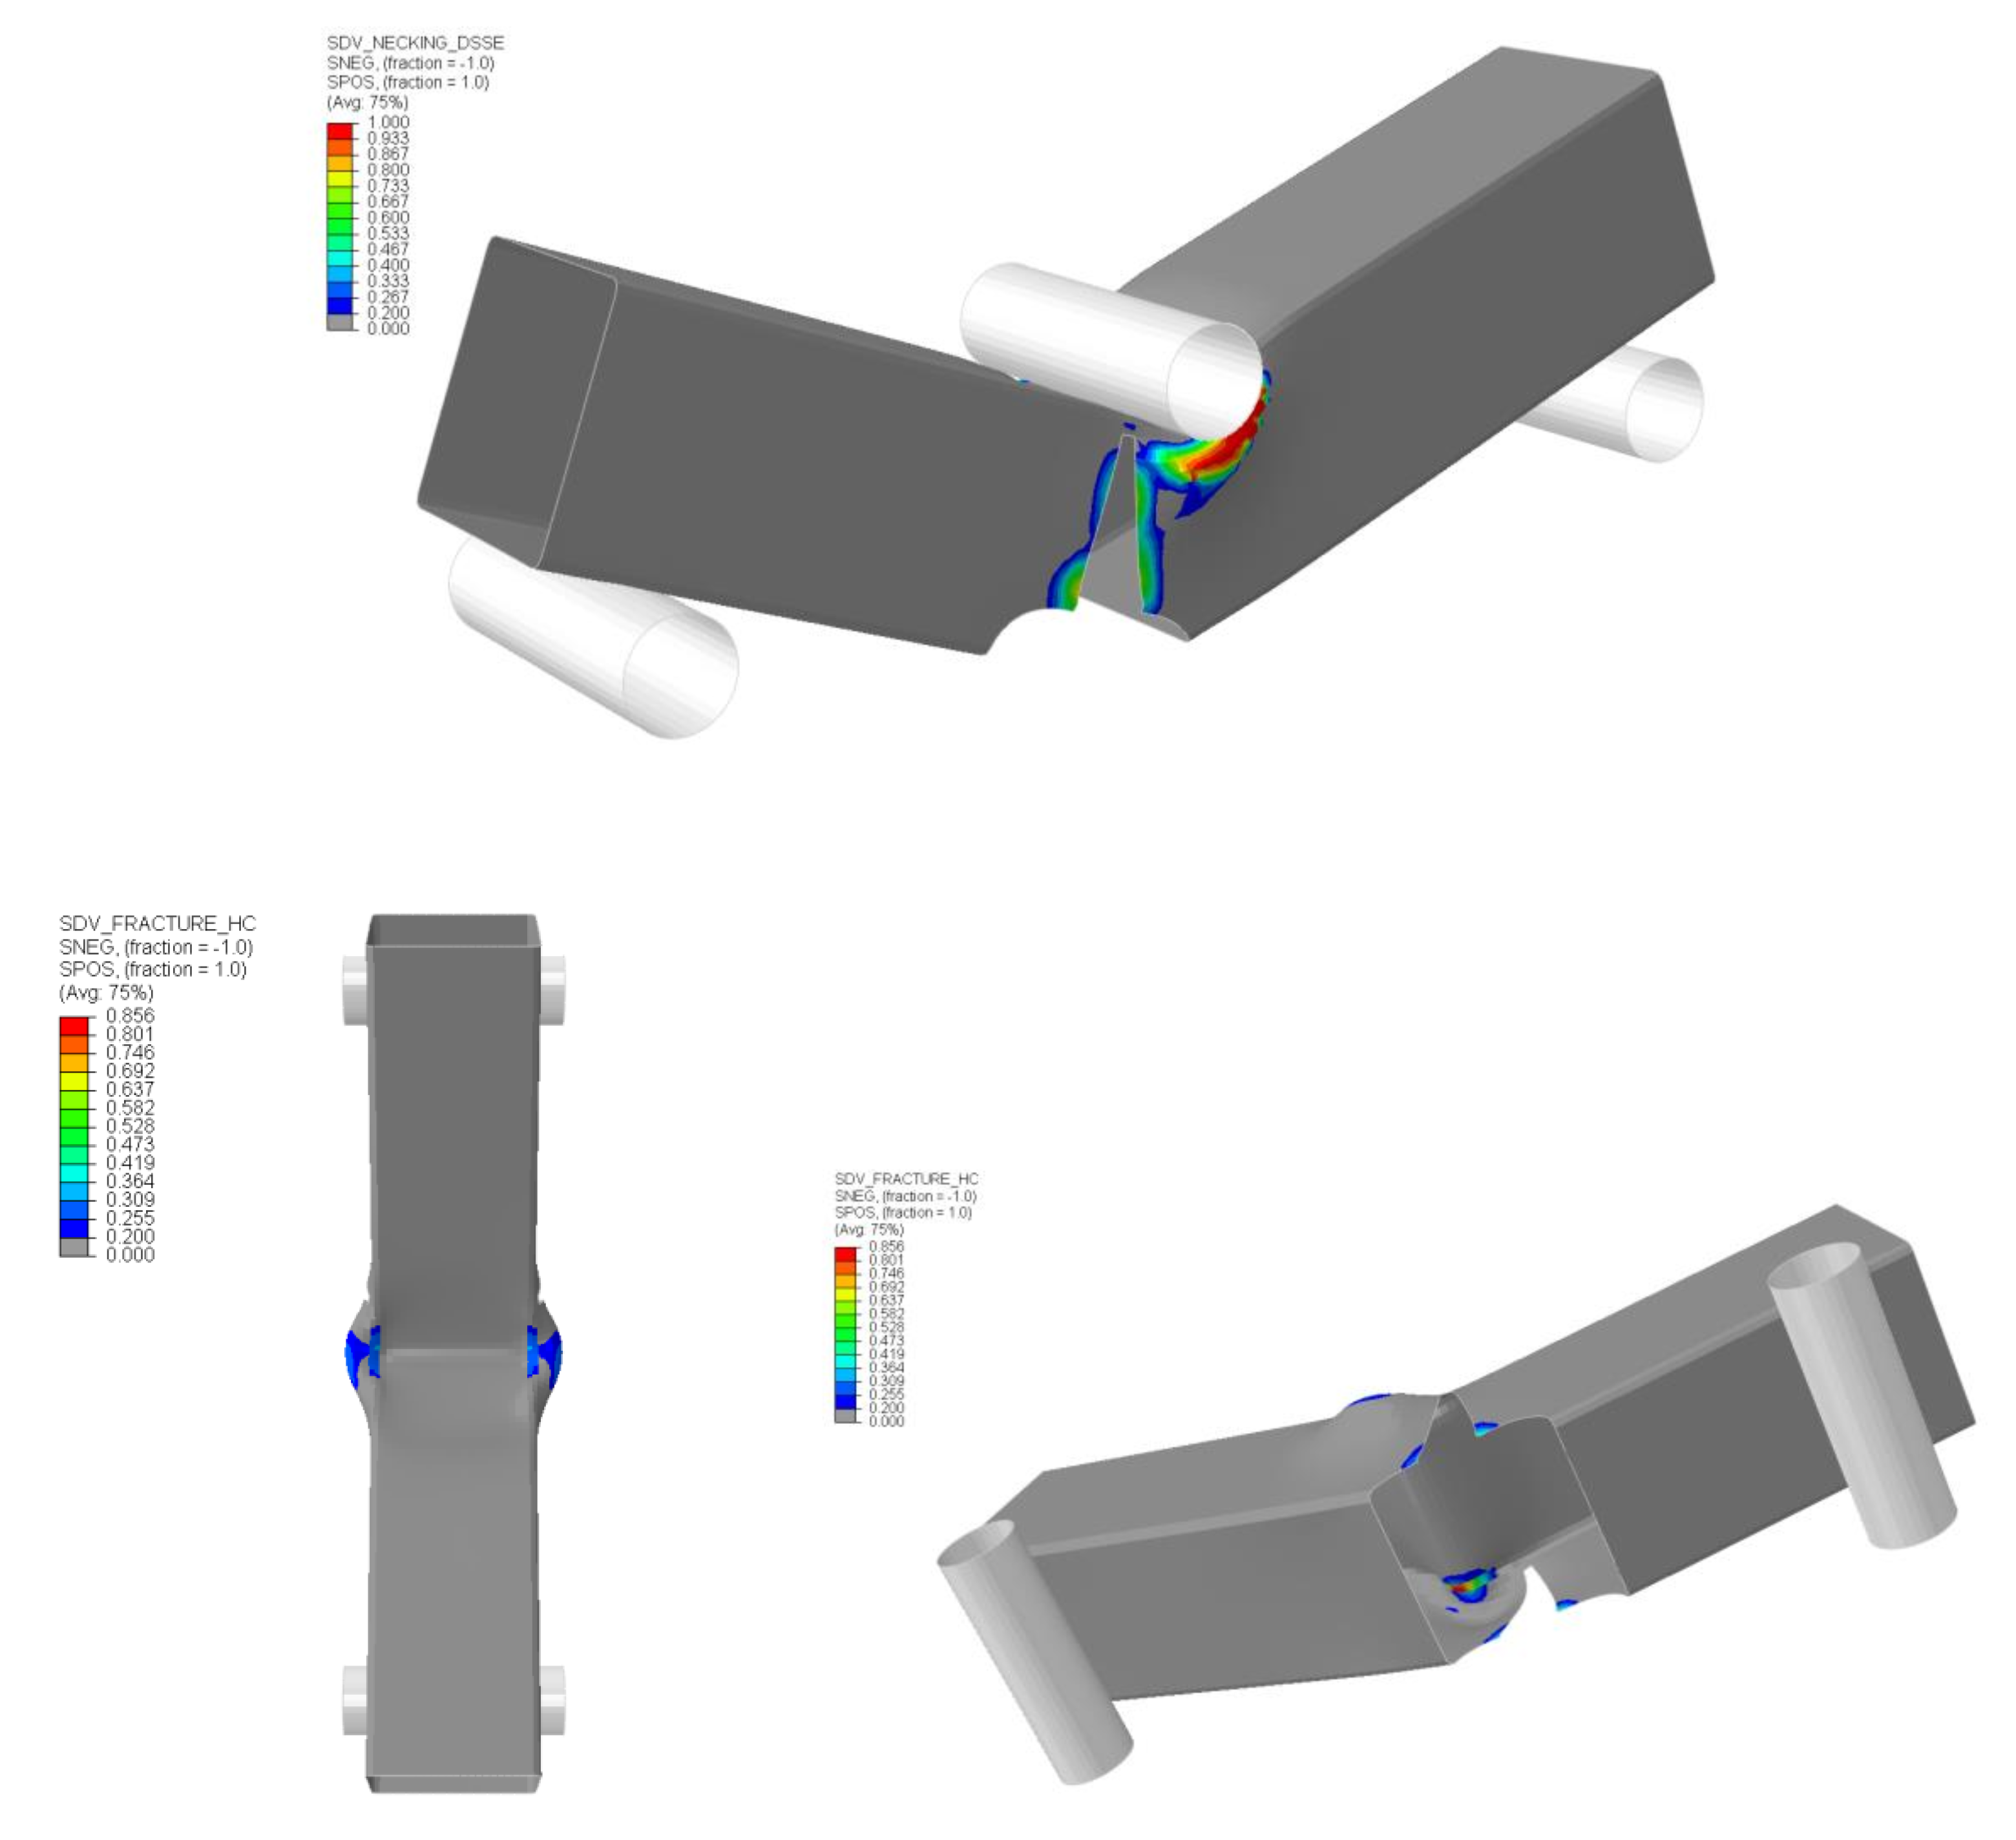
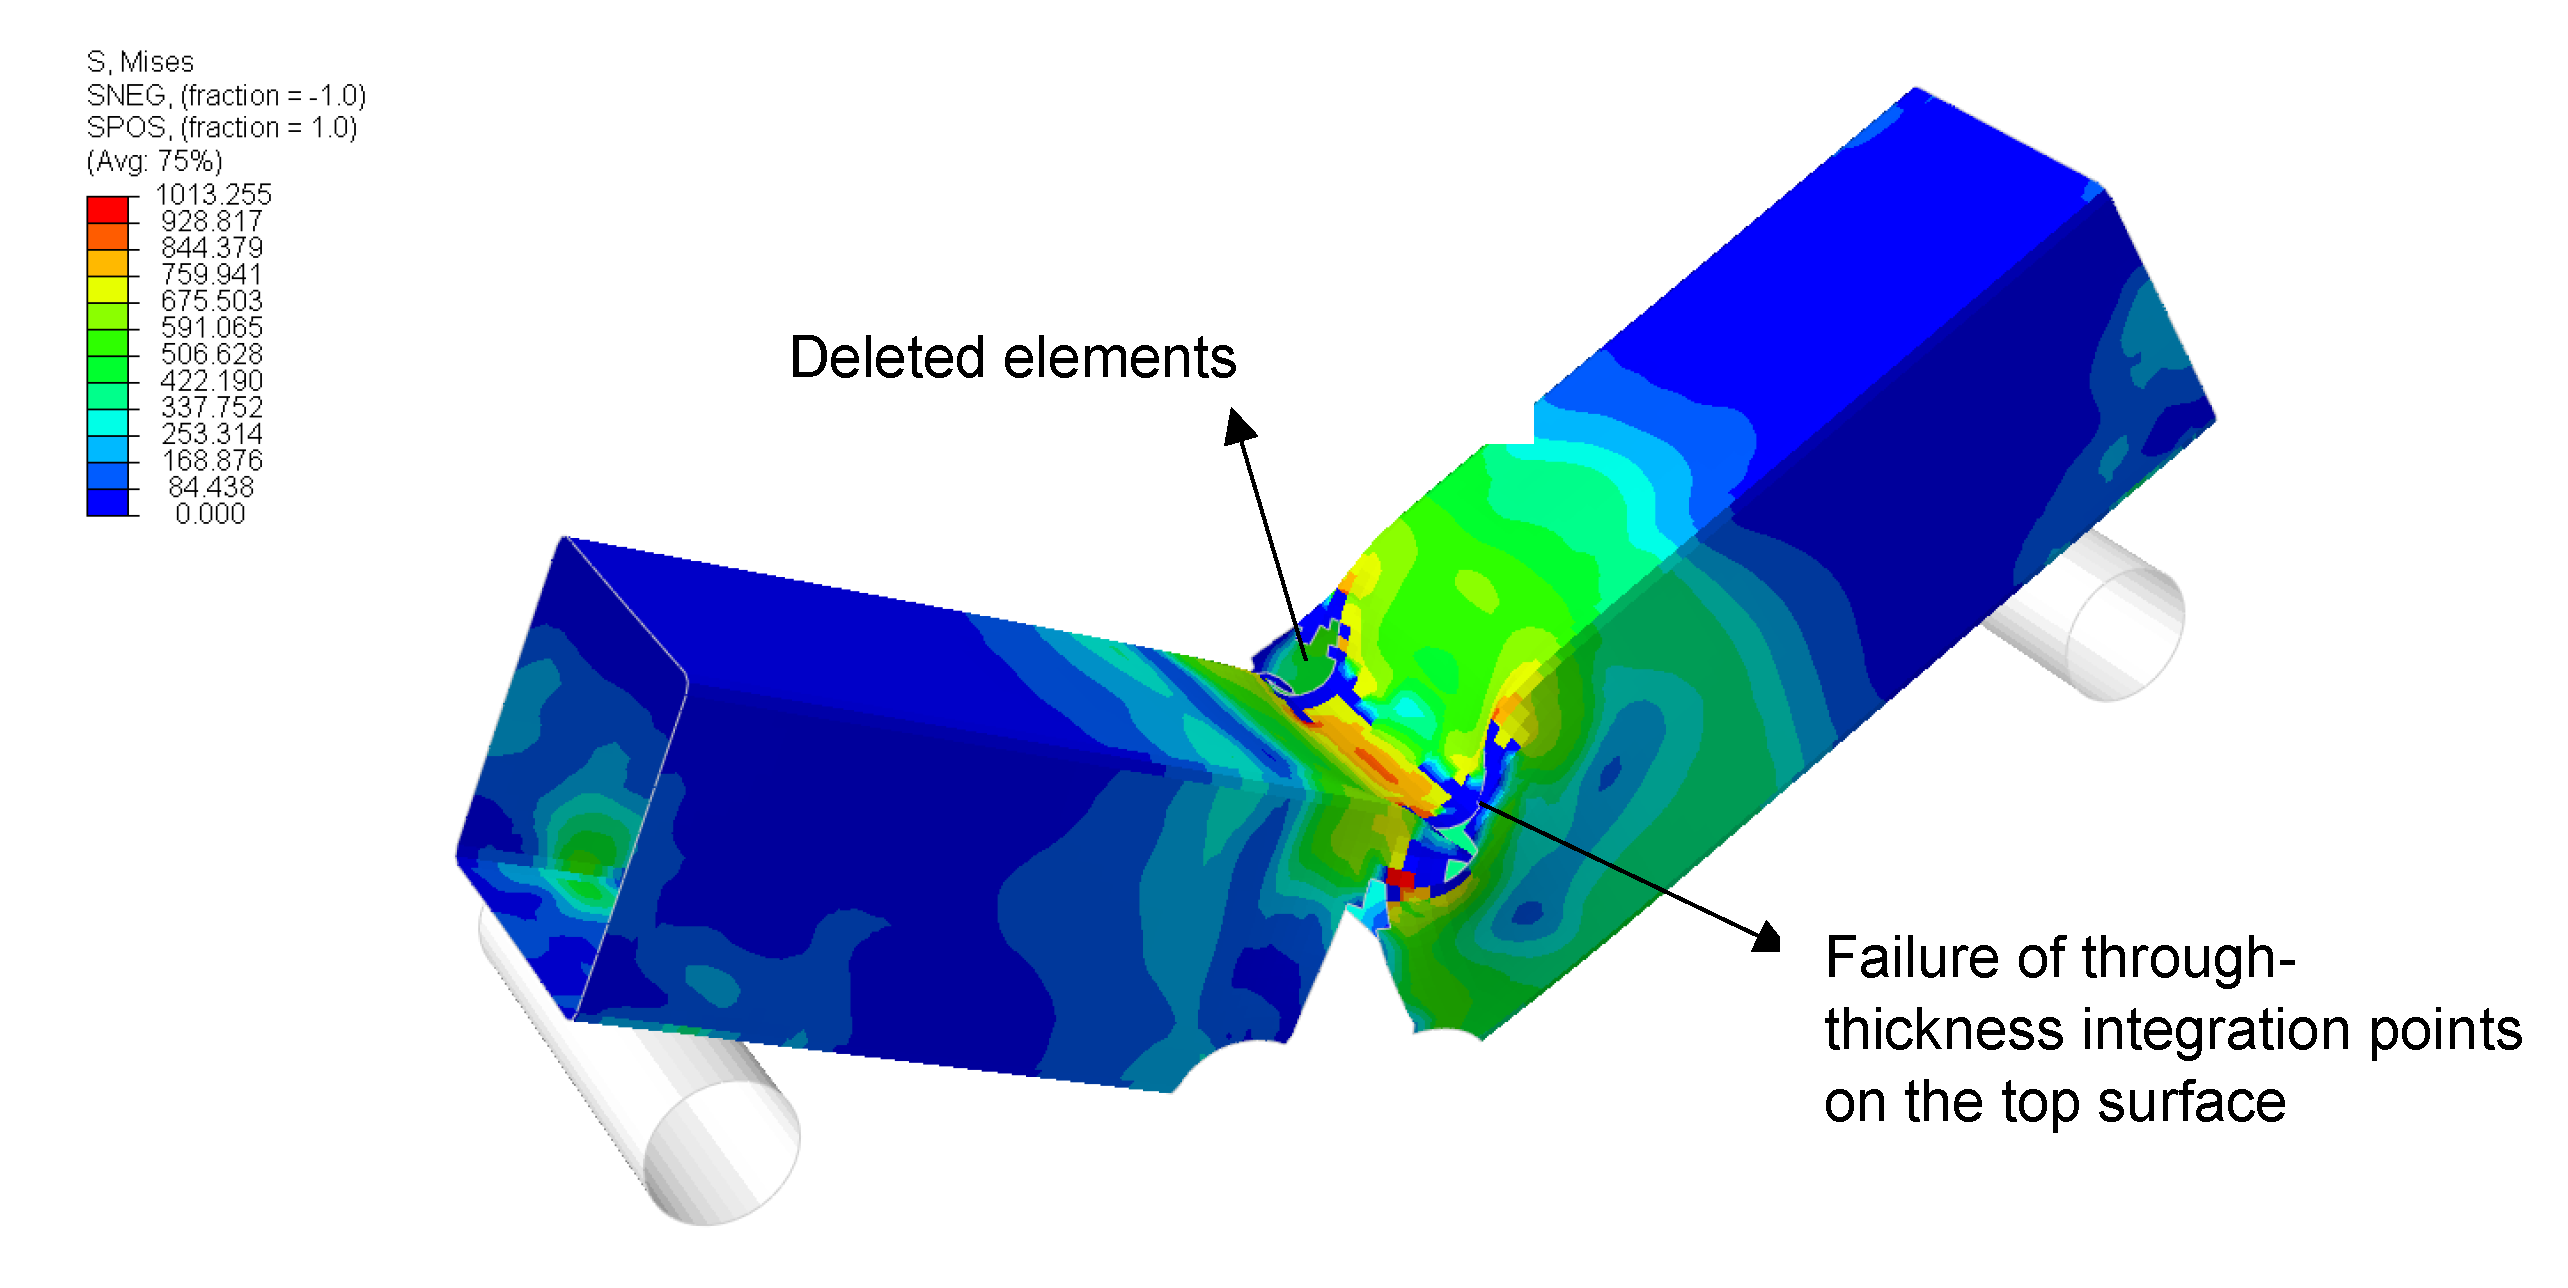
Next, by using the upper bound curve parameters and rate-dependent material parameters listed in Table 2, dynamic impact tests were simulated. Figure 9 shows the force-displacement curves for the low-velocity impact tests. Although the numerical simulation overestimated the force levels in the decay region, the peak force and the instant of fracture initiation were captured with reasonable accuracy. The agreement between the test scatter and the numerical predictions support the choice of assumed values for the material model parameters. Note that the numerical results were not filtered and display some oscillations, which were also present in the actual, unfiltered test results [37]. The oscillations can be attributed to the stress waves travelling back and forth, and the temporal variations of contact forces. In the dynamic tests, the failure mode was again localized necking around the notch, and no fractures were observed in the top flange of the SHS models. Figure 10 presents the finite element model of the test model at the final instant of the simulation with localized necking and ductile fracture indicator plots. The numerical simulations mimicked the observed physical test results. In agreement with the test results, surface cracking was not predicted in the simulations. It should be emphasized that the ductile failure model employed in the present work is applicable for predicting of the onset of ductile failure, not the ductile crack growth. The predicted crack growth appears to be in a straight line rather than curving as seen in the experimental results. The technique of successive deletion of failed elements yields rather an unrealistic crack shape, which also shows a significant dependence on mesh configuration.
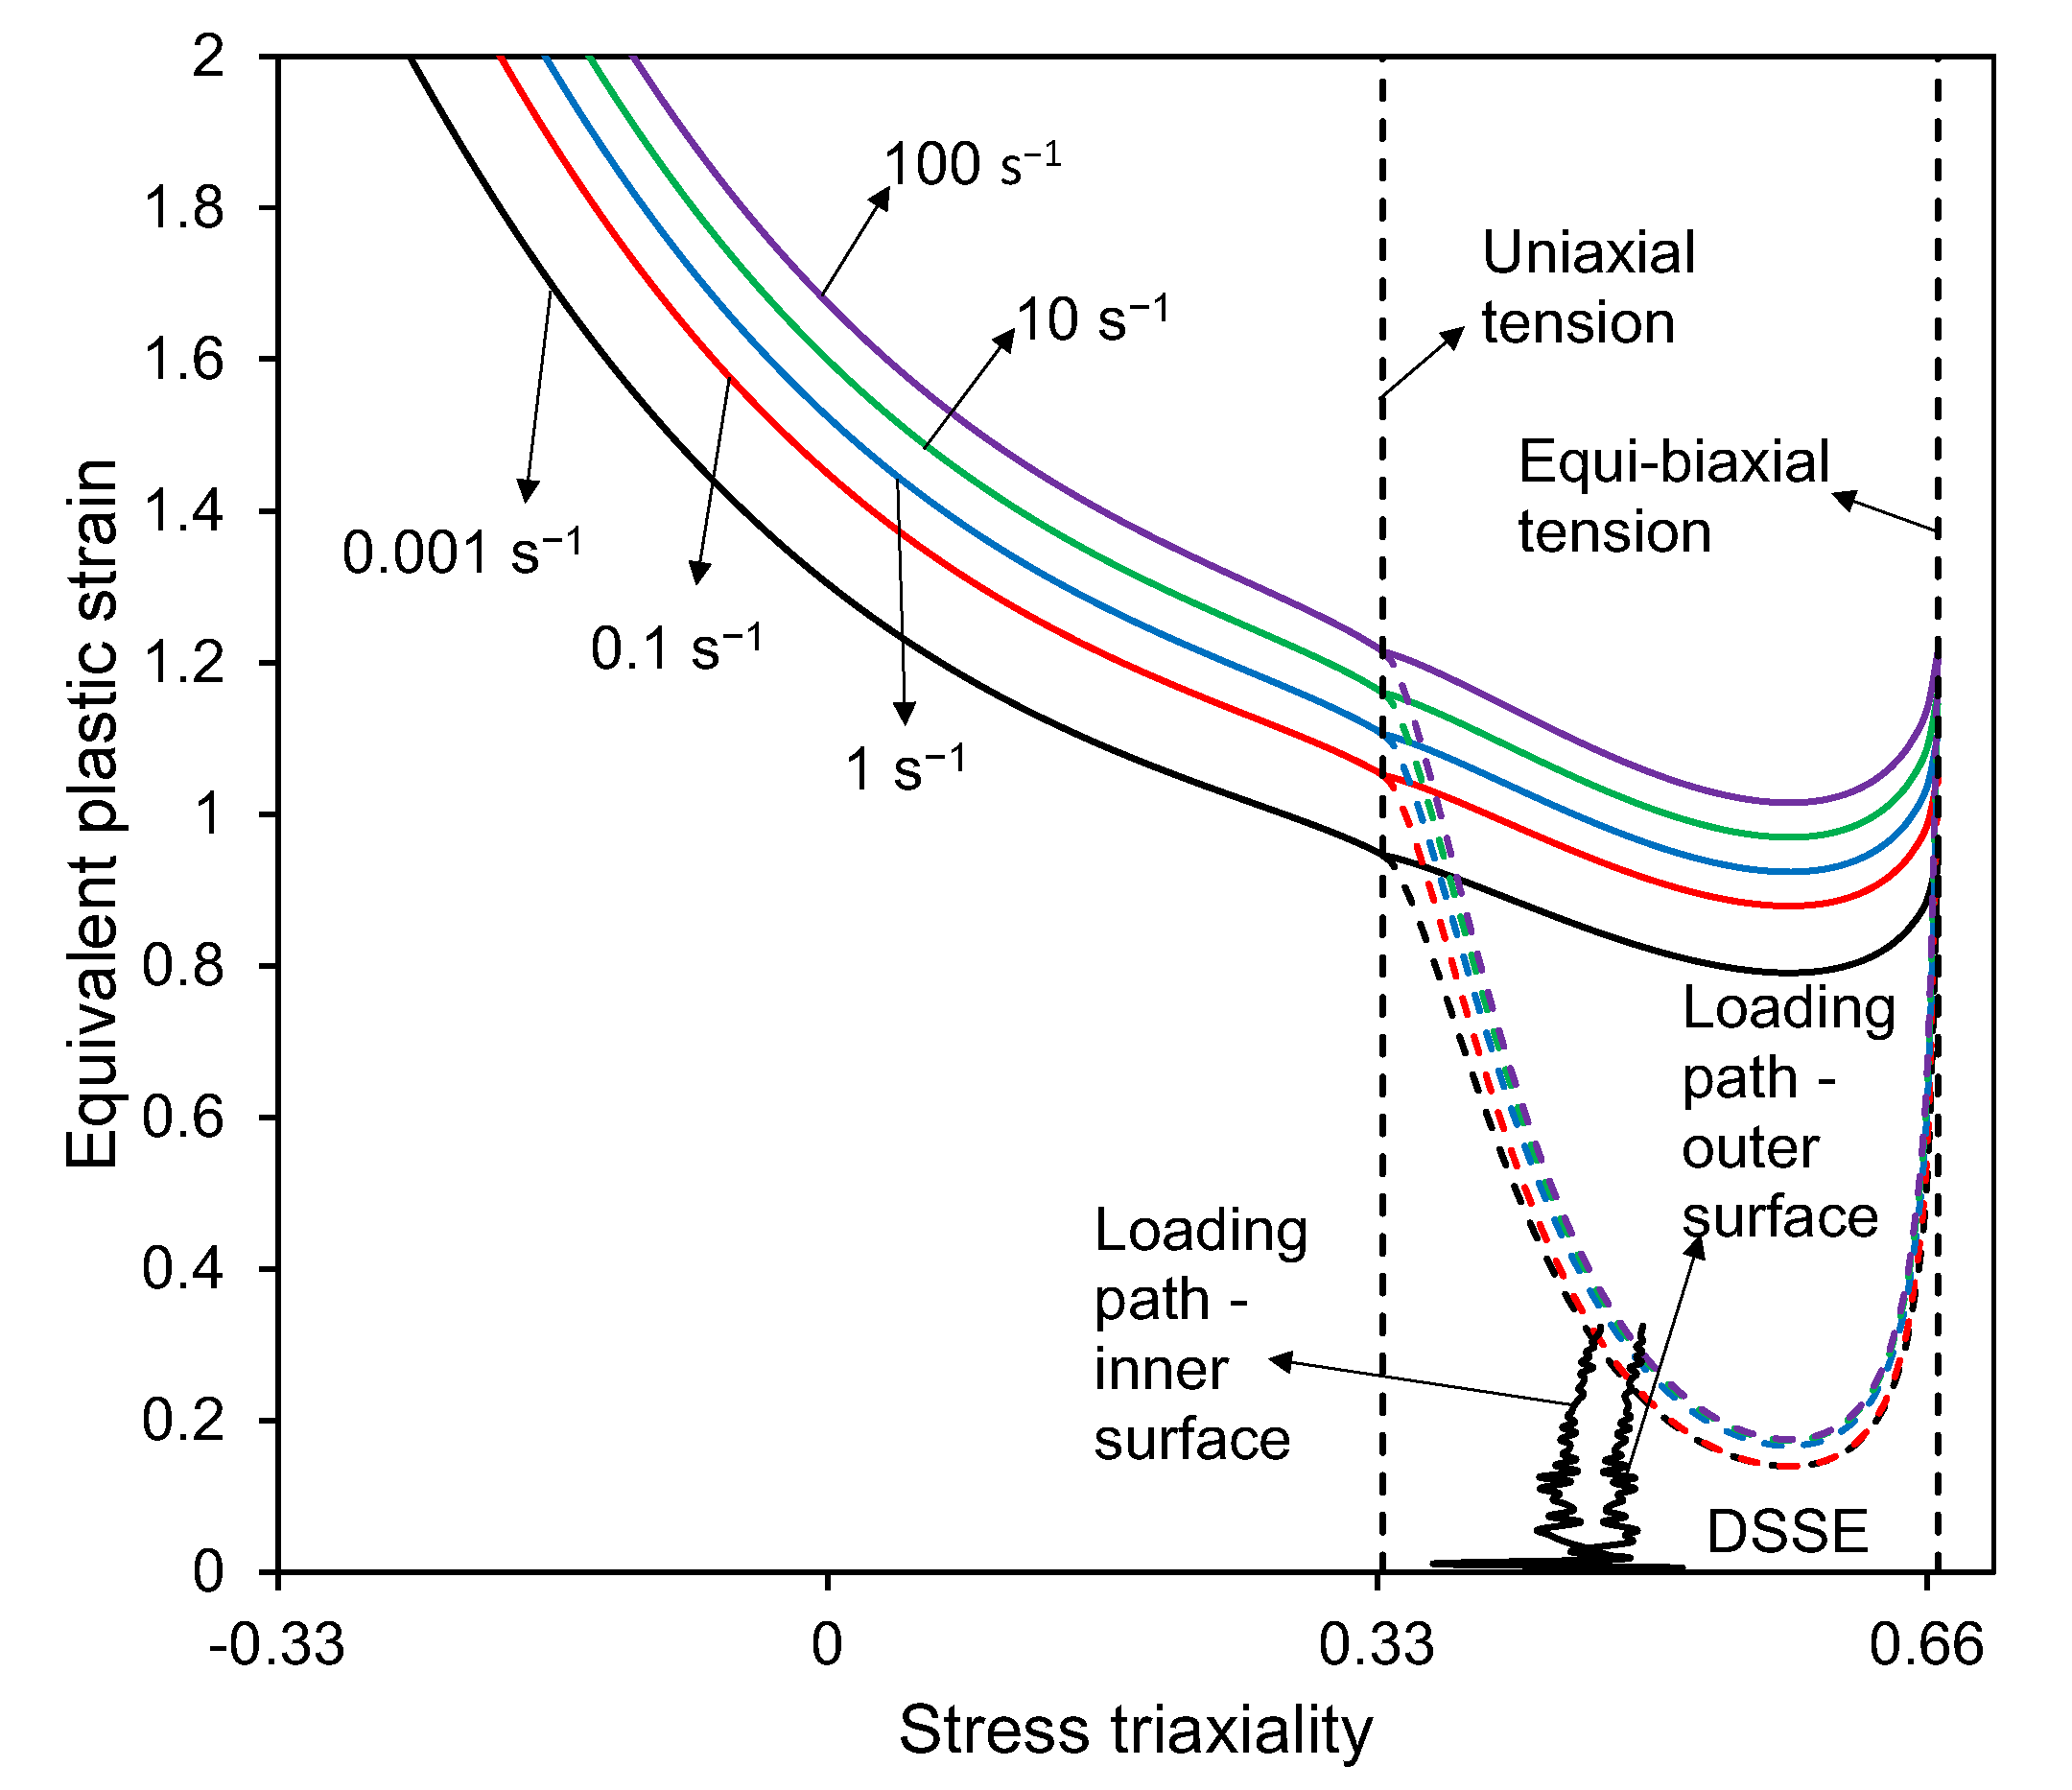
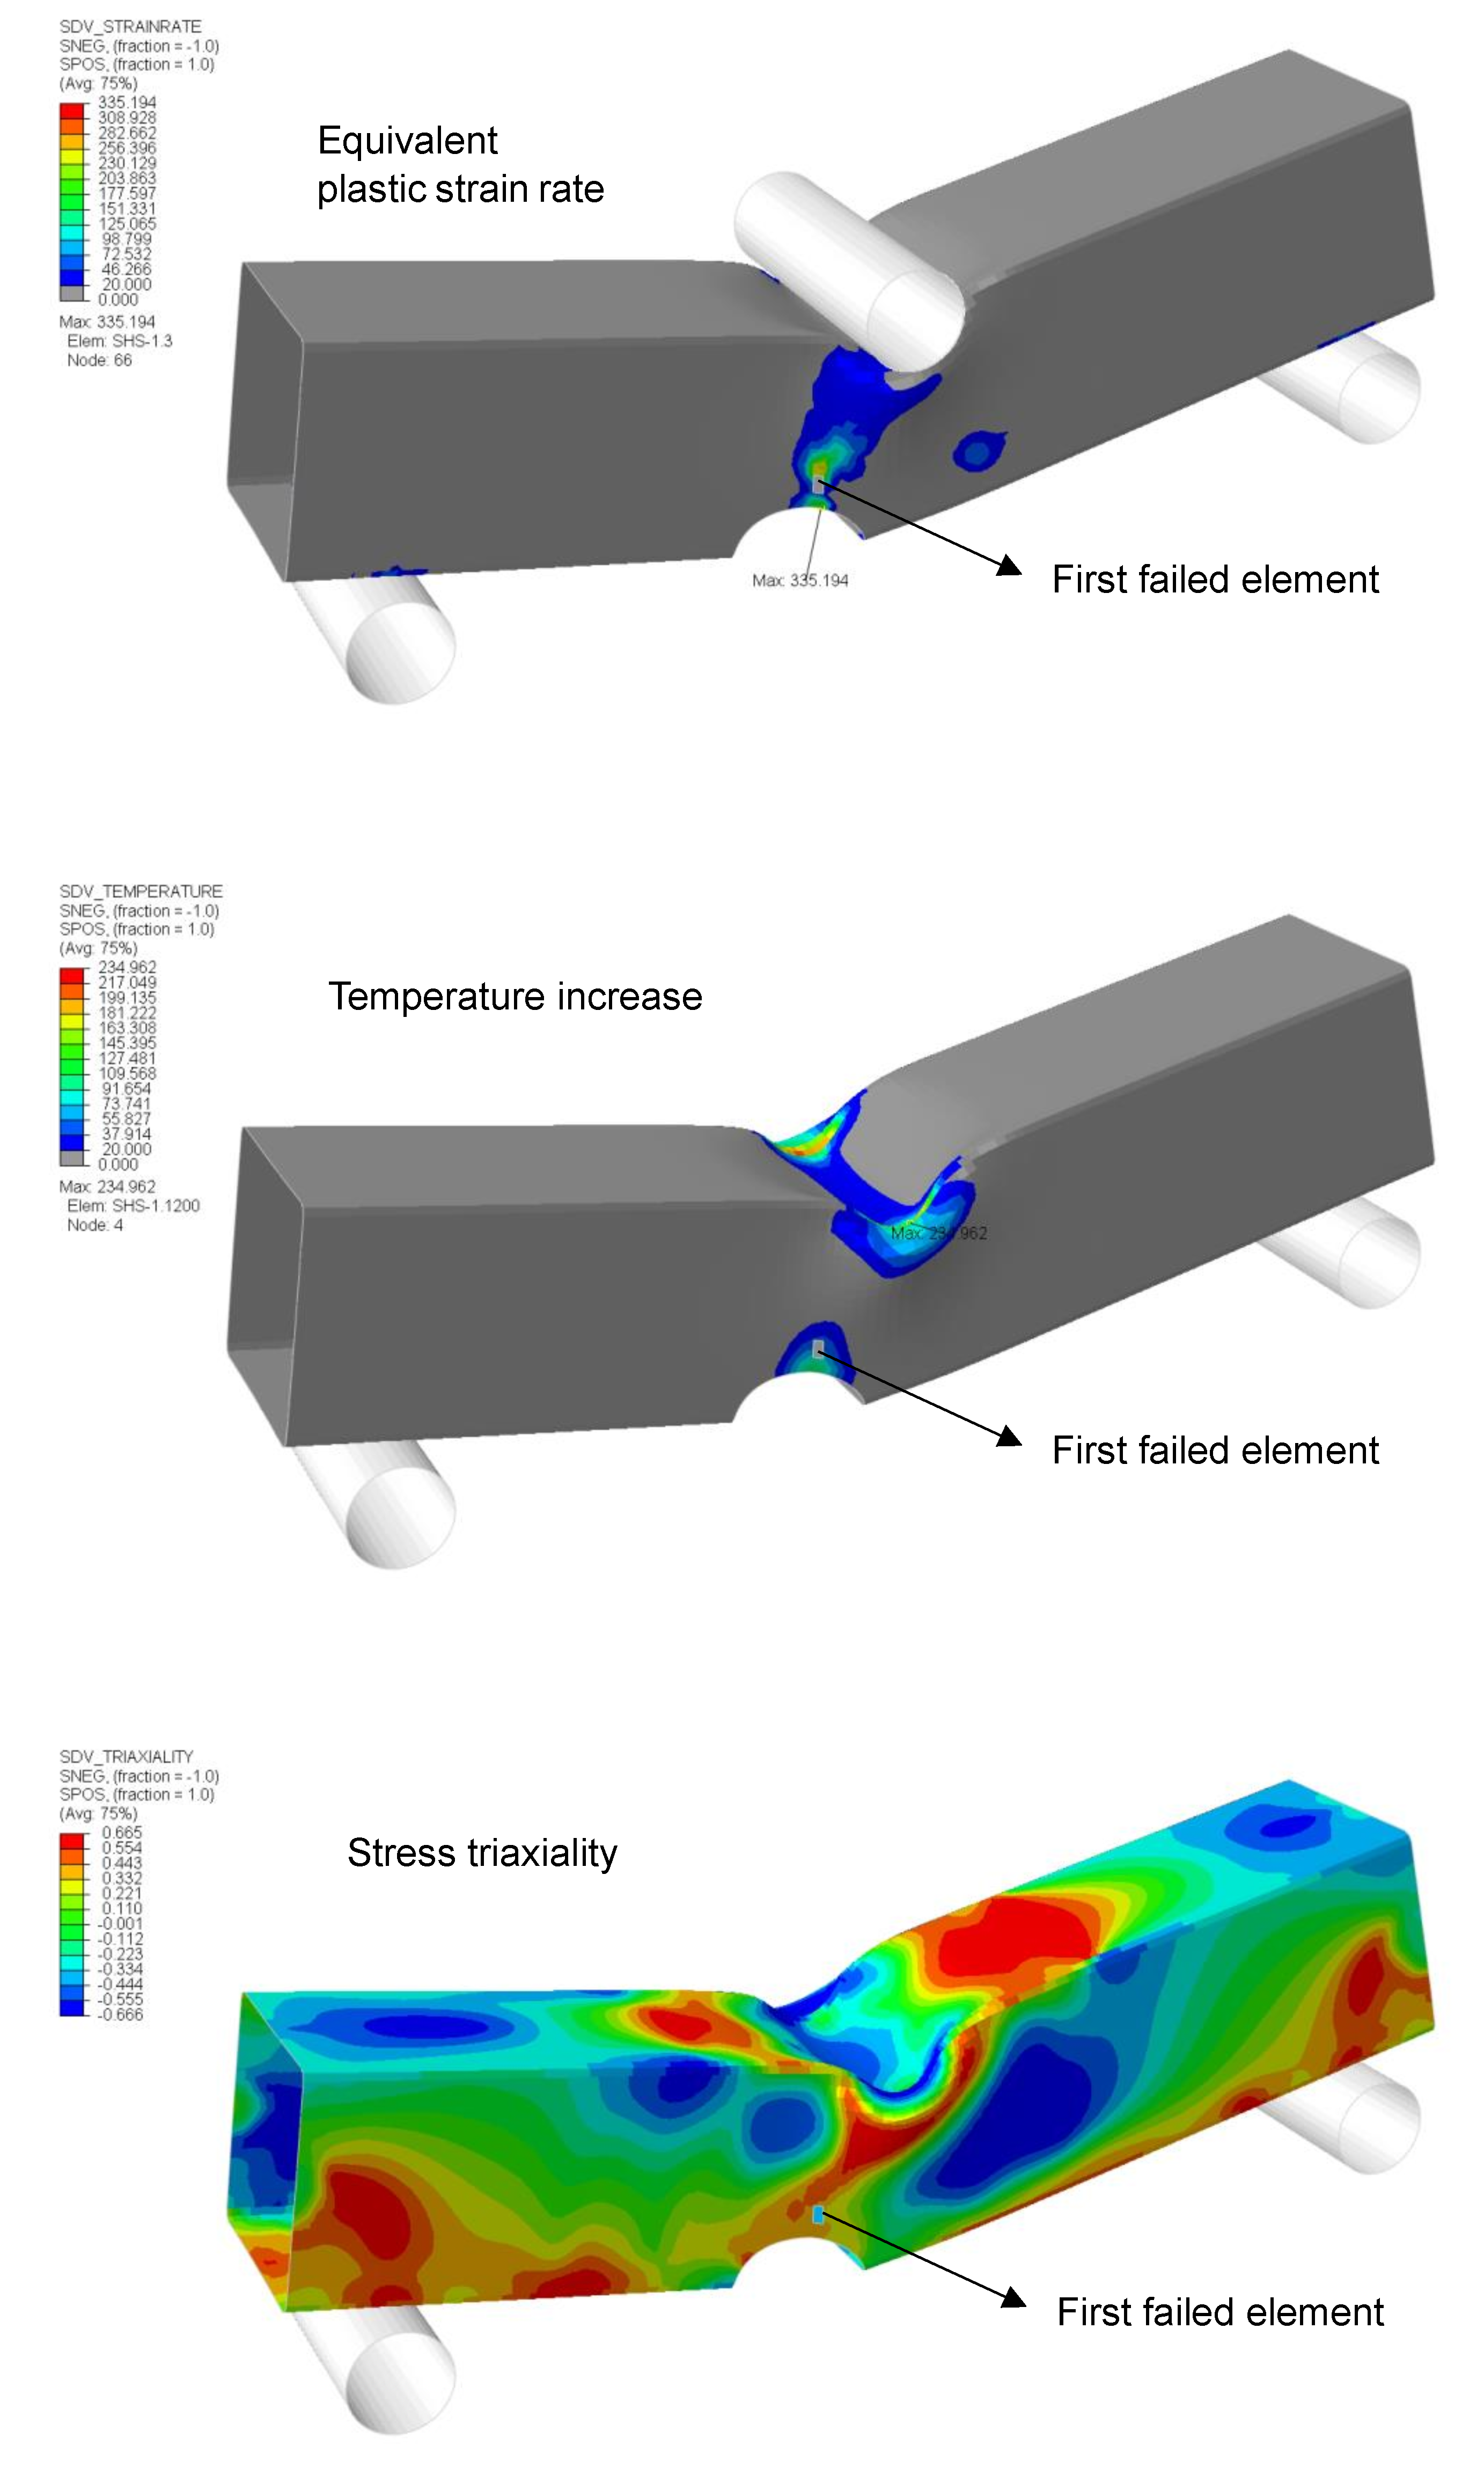
To gain further insights into how the adopted fracture model handles different fracture mechanisms and how state variables change over the course of loading, the loading paths of the element that failed first in the simulations are plotted in Figure 11. Figure 12 shows the location of the element along with the strain rate, temperature increase, and stress state (in terms of stress triaxiality) plots at the instance of first element deletion. The loading paths were extracted from the top and bottom through-thickness integration points. It was noted that the loading paths were slightly non-proportional, that is, the stress state is not constant all the way to the onset of the fracture. Close to the notch, the elements predominantly experienced membrane stretching (as indicated by the value of stress triaxiality which remains in the biaxial tension zone ), and failure was triggered by localized necking as the accumulated necking damage in all through-thickness integration points reach unity. In addition, a considerable temperature increase was estimated on the folded corners at the contact surface between the indentor and test model, and in the vicinity of the notch following Equation (12), where localized large straining occurred.
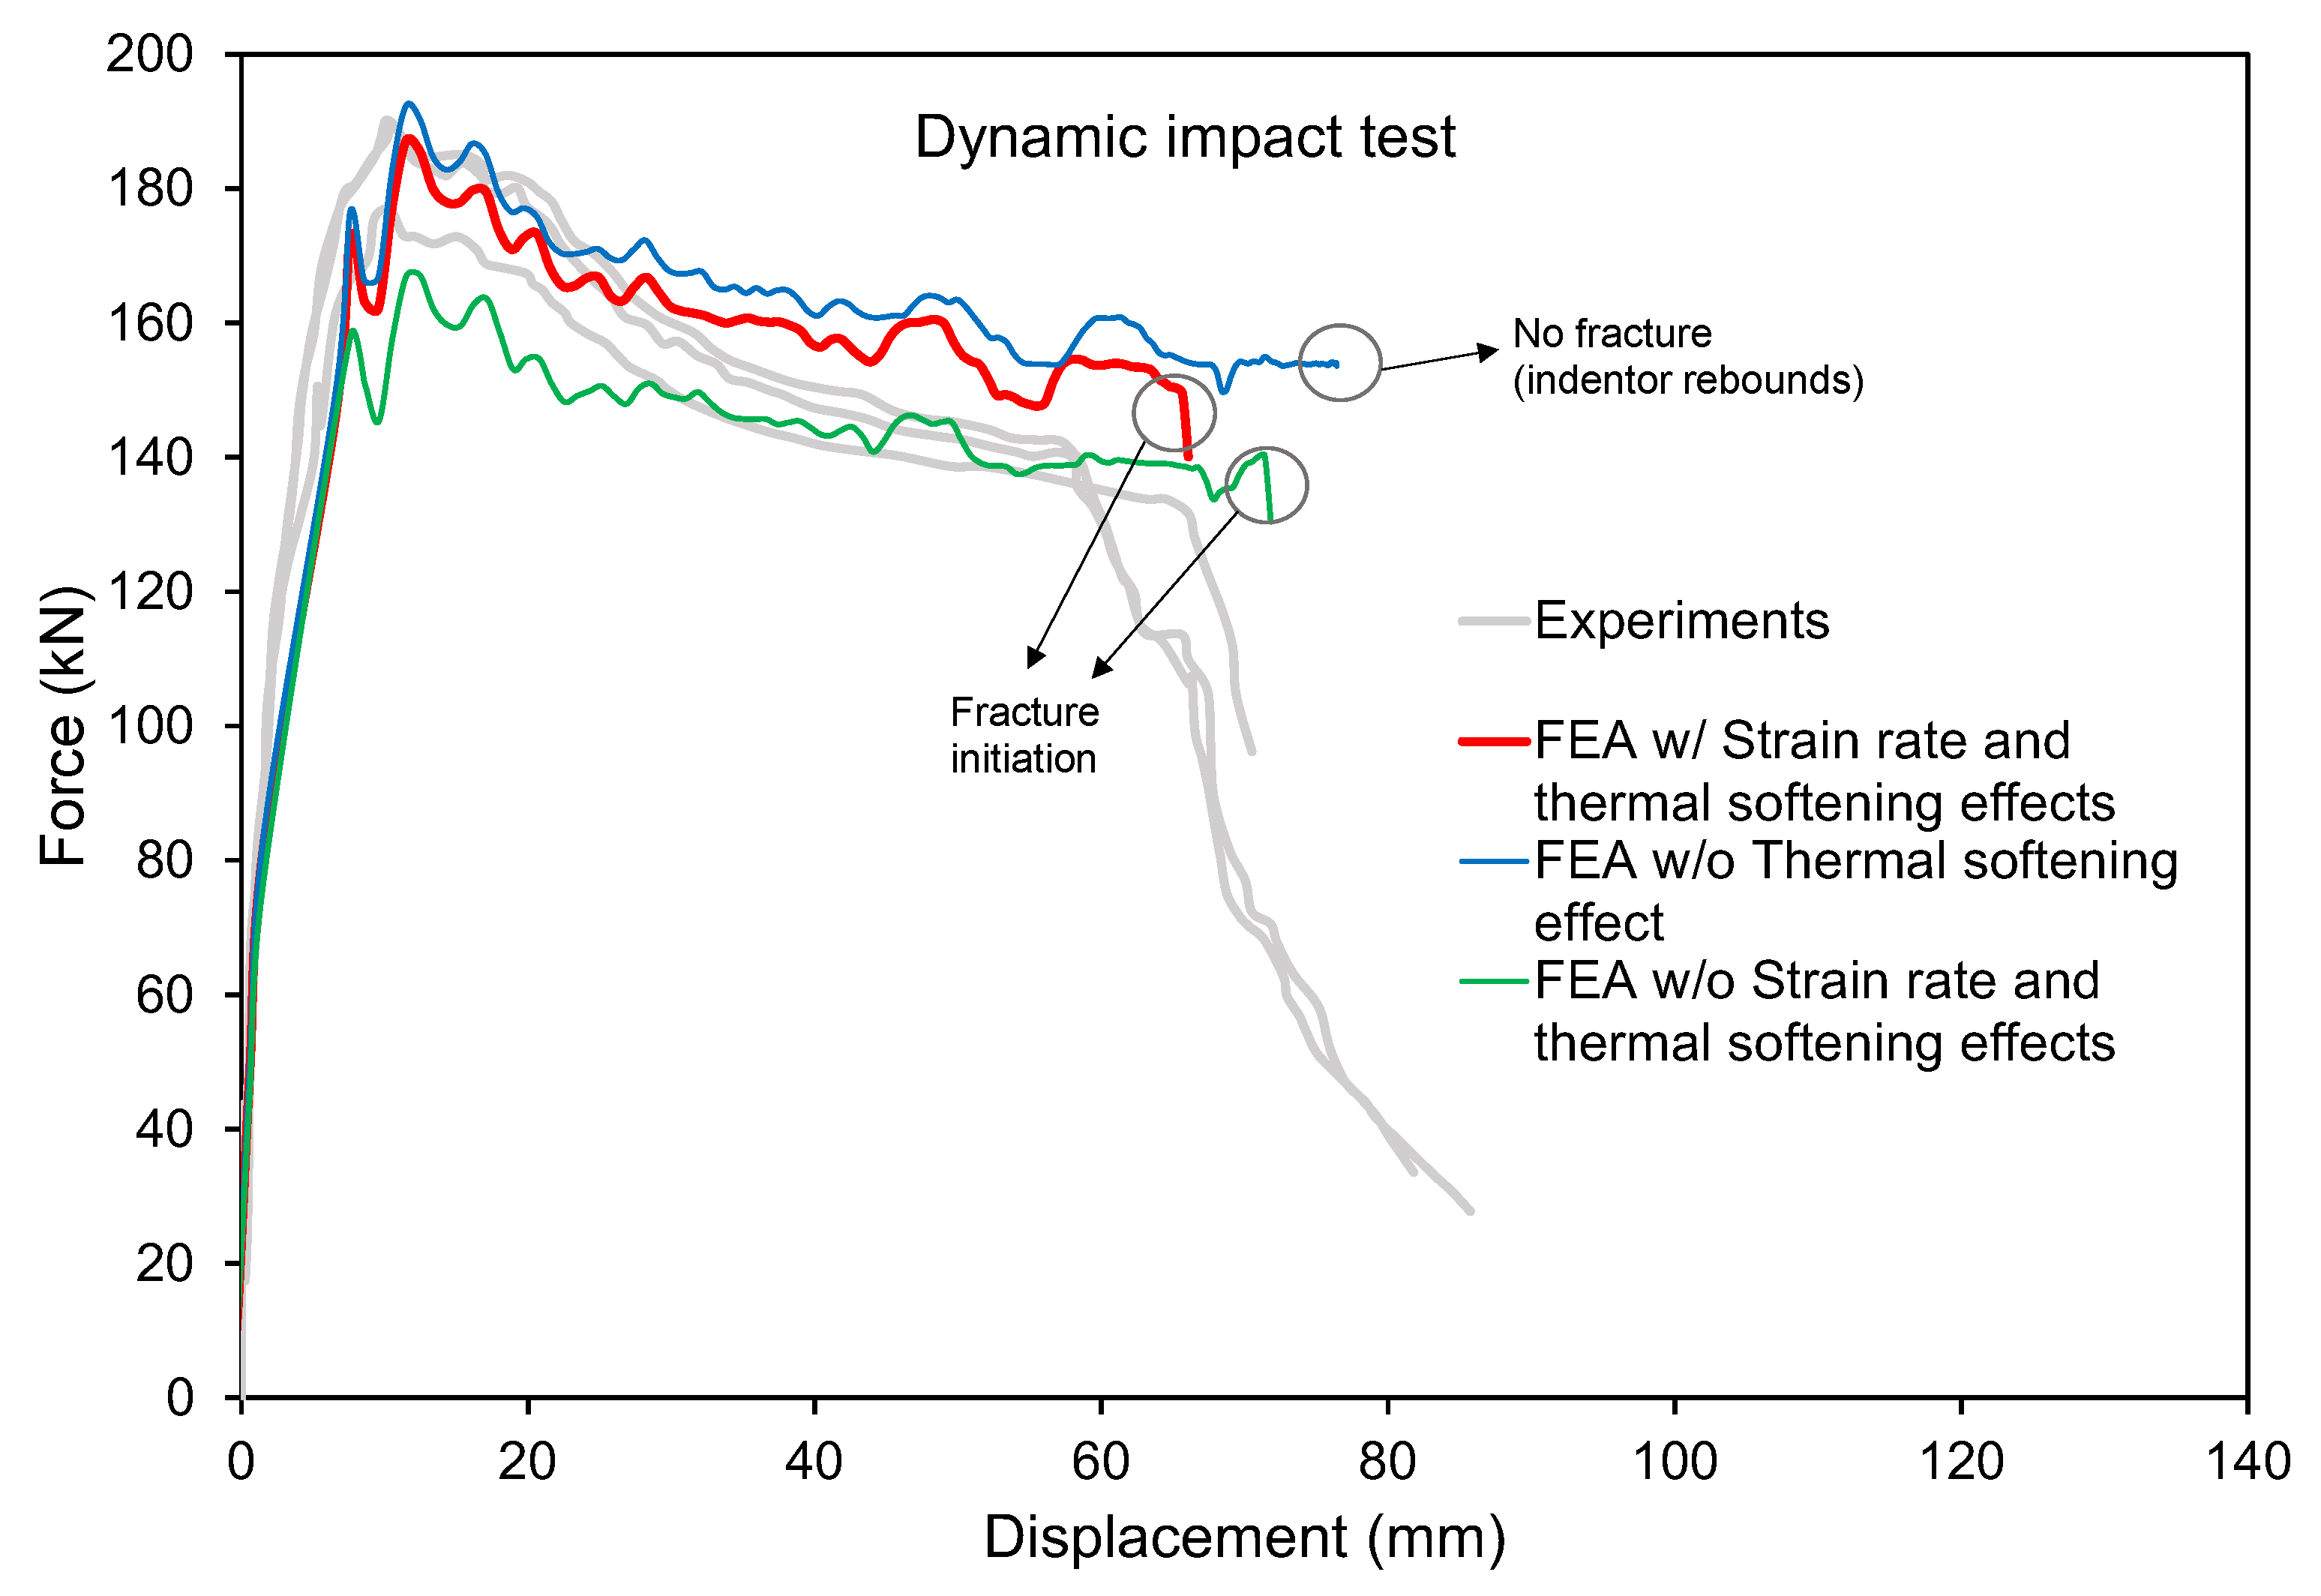
5.3. Sensitivity to Inclusion of Rate Effects
At this junction, it may be important to check whether the included rate effects play a significant role in the predicted impact response of the target structure under low-velocity mass impact. The sensitivity of the fracture predictions to the dynamic effects was checked by running the simulations, excluding the strain-rate and thermal-softening effects. Figure 13 shows the resulting force-displacement curves. It was observed that the exclusion of both the strain-rate hardening and thermal softening yielded a lower peak force associated with the plastic collapse of the SHS tube. Fracture initiation was delayed slightly, but the predicted failure mode and location were the same. On the other hand, omitting only the thermal softening led to a stiffer response. Eventually, the fracture did not occur before the kinetic energy of the indentor was fully transformed to the strain energy of the struck model.
5.4. Comparison with Industry Practice
Lastly, the simulations were ran using a constant fracture strain value of 0.2 to clarify the necessity of using two different “failure” indicators, which is one of the distinguishing properties of the proposed model evaluated in the previous section. The value of constant fracture strain was chosen close to the equivalent plastic strain associated with localized necking under plane strain tension and reflects the practice used in ship collision analysis [18]. The strain-rate effect (strain-rate hardening) was considered using the Cowper–Symonds equation with the commonly used coefficients for high-tensile steel ( s and ) [20]. Figure 14 and Figure 15 show the resulting force-displacement curve and the predicted failure modes, respectively. The deleted elements and failed through-thickness integration points on the top flange of the model caused a rapid decrease in structural resistance and premature failure compared to the experiments. According to the simple failure model employed, the stress tensor components of the IP were set to zero when the equivalent plastic strain reached the critical failure strain value (in this case, 0.2). An element is deleted if all the through-thickness integration points have zero stress, i.e., assumed to have failed following the conditions above. This caused an undesirable simulation outcome in terms of both the predicted deformation and fracture patterns and force-displacement response. A larger critical failure strain would delay failure of the top flange elements and fracture initiation around the notch. It is apparent that the material model adopted in this study overcomes this issue in a computationally convenient manner by considering the basic failure modes separately.
6. Conclusions
The present study simulated a fracture in steel-plated structures under low-velocity impact using shell elements by adopting an advanced material model that considers the strain-rate effect. The major conclusions drawn from the present study are as follows:
- It was observed that the results from both the quasi-static three-point bending and the dynamic impact simulations agreed well with the test results. The credibility of rate-dependent DSSE–HC model was confirmed as it successfully captured the overall deformation and failure behaviour of the square hollow section with an asymmetric notch.
- The necessity of distinguishing the fracture with and without localized necking when simulating a fracture with shell elements was confirmed. It was apparent that a single-failure model, i.e., a failure model for both localized necking and ductile fracture involving surface cracking or shear-induced failure, was prone to errors associated with regularizing the fracture locus (scaling the ductility limits based on mesh size).
- The adequacy of localized necking-based failure models in conjunction with the rate-dependent flow stress curves to describe the necking locus in an evolving manner was verified.
- Temperature effects were found to be significant on the absorbed energy and fracture initiation. It was noted that the inclusion of temperature effects may increase the absorbed impact energy because of increased ductility.
Author Contributions
Conceptualization, B.C.C. and J.C.; methodology, B.C.C. and J.C.; software, B.C.C.; validation, B.C.C. and J.C.; formal analysis, B.C.C. and J.C.; investigation, B.C.C. and J.C.; resources, J.C.; data curation, B.C.C.; writing—original draft preparation, B.C.C. and J.C.; writing—review and editing, B.C.C. and J.C.; visualization, B.C.C.; supervision, J.C.; project administration, J.C.; funding acquisition, J.C. All authors have read and agreed to the published version of the manuscript.
Funding
This work was supported by the Korea Environment Industry & Technology Institute funded by Korea Ministry of Environment (No. 146836) and by the Korea Energy Technology Evaluation and Planning funded by the Ministry of Trade, Industry and Energy of Korea (No. 20203030020230).
Institutional Review Board Statement
Not applicable.
Informed Consent Statement
Not applicable.
Data Availability Statement
Not applicable.
Conflicts of Interest
The authors declare no conflict of interest. The funders had no role in the design of the study; in the collection, analyses, or interpretation of data; in the writing of the manuscript; or in the decision to publish the results.
Nomenclature
The following symbols are used in this manuscript:
| Weighting factor in combined Swift–Voce hardening law | |
| Voce hardening law parameter | |
| Fracture strain rate sensitivity parameter | |
| Reference strain rate for adiabatic condition | |
| Localized necking strain under proportional loading | |
| Fracture strain under proportional loading | |
| Reference strain rate for isothermal condition | |
| Pre-strain in Swift hardening law | |
| Reference strain rate | |
| Equivalent plastic strain | |
| Equivalent plastic strain rate | |
| Stress triaxiality | |
| Taylor–Quinney coefficient | |
| Lode angle parameter | |
| Material density | |
| Cauchy stress tensor | |
| von Mises equivalent stress | |
| Regulating term for transition from isothermal to adiabatic condition | |
| A | Swift law parameter |
| C | Strain-rate hardening sensitivity parameter |
| Material specific heat | |
| D | Ductile fracture indicator |
| Cowper–Symonds model constant | |
| E | Young’s modulus |
| Second invariant of deviatoric stress tensor | |
| N | Localized necking indicator |
| Q | Voce law parameter |
| T | Temperature |
| Material melting temperature | |
| Reference temperature | |
| Hosford–Coulomb model parameters | |
| Lode angle-dependent functions in Hosford–Coulomb model | |
| Stress triaxiality-dependent functions in DSSE model | |
| k | Deformation resistance function |
| Strain hardening function | |
| Strain-rate hardening function | |
| Voce hardening law parameter | |
| Swift hardening law | |
| Thermal softening function | |
| Voce hardening law | |
| m | Thermal softening exponent |
| n | Swift law exponent |
| Hosford–Coulomb model transformation coefficient | |
| DSSE model exponent | |
| q | Cowper–Symonds model exponent |
Abbreviations
The following abbreviations are used in this manuscript:
| DOF | Degree of freedom |
| DSSE | Domain of shell-to-solid equivalence |
| HC | Hosford-Coulomb |
| IP | Integration point (through-thickness) |
| NLFEA | Non-Linear Finite Element Analysis |
| PTFE | Polytetrafluoroethylene |
| SHS | Square hollow section |
References
- Liu, B.; Guedes Soares, C. Recent developments in ship collision analysis and challenges to an accidental limit state design method. Ocean Eng. 2023, 270, 113636. [Google Scholar] [CrossRef]
- Samuelides, M. Recent advances and future trends in structural crashworthiness of ship structures subjected to impact loads. Ships Offshore Struct. 2015, 10, 1–10. [Google Scholar] [CrossRef]
- Storheim, M.; Alsos, H.S.; Amdahl, J. Evaluation of nonlinear material behavior for offshore structures subjected to accidental actions. J. Offshore Mech. Arct. Eng. 2018, 140. [Google Scholar] [CrossRef] [Green Version]
- Calle, M.; Alves, M. A review-analysis on material failure modeling in ship collision. Ocean Eng. 2015, 106, 20–38. [Google Scholar] [CrossRef]
- Storheim, M.; Amdahl, J.; Martens, I. On the accuracy of fracture estimation in collision analysis of ship and offshore structures. Mar. Struct. 2015, 44, 254–287. [Google Scholar] [CrossRef]
- Liu, B.; Villavicencio, R.; Zhang, S.; Guedes Soares, C. A simple criterion to evaluate the rupture of materials in ship collision simulations. Mar. Struct. 2017, 54, 92–111. [Google Scholar] [CrossRef]
- Cerik, B.C.; Park, S.J.; Choung, J. Use of localized necking and fracture as a failure criterion in ship collision analysis. Mar. Struct. 2020, 73, 102787. [Google Scholar] [CrossRef]
- Cerik, B.C.; Lee, K.; Choung, J. Evaluation of localized necking models for fracture prediction in punch-loaded steel panels. J. Mar. Sci. Eng. 2021, 9, 1–13. [Google Scholar] [CrossRef]
- Jones, N. The credibility of predictions for structural designs subjected to large dynamic loadings causing inelastic behaviour. Int. J. Impact Eng. 2013, 53, 106–114. [Google Scholar] [CrossRef]
- Liu, B.; Pedersen, P.T.; Zhu, L.; Zhang, S. Review of experiments and calculation procedures for ship collision and grounding damage. Mar. Struct. 2018, 59, 105–121. [Google Scholar] [CrossRef] [Green Version]
- Morin, D.; Kaarstad, B.; Skajaa, B.; Hopperstad, O.; Langseth, M. Testing and modelling of stiffened aluminium panels subjected to quasi-static and low-velocity impact loading. Int. J. Impact Eng. 2017, 110, 97–111. [Google Scholar] [CrossRef] [Green Version]
- Gruben, G.; Sølvernes, S.; Berstad, T.; Morin, D.; Hopperstad, O.; Langseth, M. Low-velocity impact behaviour and failure of stiffened steel plates. Mar. Struct. 2017, 54, 73–91. [Google Scholar] [CrossRef]
- Ohtsubo, H.; Kawamoto, Y.; Kuroiwa, T. Experimental and numerical research on ship collision and grounding of oil tankers. Nucl. Eng. Des. 1994, 150, 385–396. [Google Scholar] [CrossRef]
- Noh, M.H.; Cerik, B.C.; Han, D.; Choung, J. Lateral impact tests on FH32 grade steel stiffened plates at room and sub-zero temperatures. Int. J. Impact Eng. 2018, 115, 36–47. [Google Scholar] [CrossRef]
- Liu, K.; Liu, B.; Villavicencio, R.; Wang, Z.; Guedes Soares, C. Assessment of material strain rate effects on square steel plates under lateral dynamic impact loads. Ships Offshore Struct. 2018, 13, 217–225. [Google Scholar] [CrossRef]
- Liu, B.; Guedes Soares, C. Effect of strain rate on dynamic responses of laterally impacted steel plates. Int. J. Mech. Sci. 2019, 160, 307–317. [Google Scholar] [CrossRef]
- Cowper, G.; Symonds, P. Strain Hardening and Strain-Rate Effects in the Impact Loading of Cantilever Beam; Brown University Division of Applied Mathematics: Providence, RI, USA, 1957. [Google Scholar]
- Storheim, M.; Amdahl, J. On the sensitivity to work hardening and strain-rate effects in nonlinear FEM analysis of ship collisions. Ships Offshore Struct. 2017, 12, 100–115. [Google Scholar] [CrossRef]
- Choung, J.; Nam, W.; Lee, J.Y. Dynamic hardening behaviors of various marine structural steels considering dependencies on strain rate and temperature. Mar. Struct. 2013, 32, 49–67. [Google Scholar] [CrossRef]
- Paik, J.K. Practical techniques for finite element modeling to simulate structural crashworthiness in ship collisions and grounding (Part I: Theory). Ships Offshore Struct. 2007, 2, 69–80. [Google Scholar] [CrossRef]
- Ko, Y.G.; Kim, S.J.; Sohn, J.M.; Paik, J.K. A practical method to determine the dynamic fracture strain for the nonlinear finite element analysis of structural crashworthiness in ship–ship collisions. Ships Offshore Struct. 2018, 13, 412–422. [Google Scholar] [CrossRef] [Green Version]
- Cerik, B.C.; Lee, K.; Park, S.J.; Choung, J. Simulation of ship collision and grounding damage using Hosford-Coulomb fracture model for shell elements. Ocean Eng. 2019, 173, 415–432. [Google Scholar] [CrossRef]
- Cerik, B.C.; Ringsberg, J.W.; Choung, J. Revisiting MARSTRUCT benchmark study on side-shell collision with a combined localized necking and stress-state dependent ductile fracture model. Ocean Eng. 2019, 187, 106173. [Google Scholar] [CrossRef]
- Stoughton, T.B.; Yoon, J.W. A new approach for failure criterion for sheet metals. Int. J. Plast. 2011, 27, 440–459. [Google Scholar] [CrossRef]
- Hooputra, H.; Gese, H.; Dell, H.; Werner, H. A comprehensive failure model for crashworthiness simulation of aluminium extrusions. Int. J. Crashworthiness 2004, 9, 449–464. [Google Scholar] [CrossRef]
- Pack, K.; Mohr, D. Combined necking & fracture model to predict ductile failure with shell finite elements. Eng. Fract. Mech. 2017, 182, 32–51. [Google Scholar] [CrossRef]
- Cerik, B.C.; Park, B.; Park, S.J.; Choung, J. Modeling, testing and calibration of ductile crack formation in grade DH36 ship plates. Mar. Struct. 2019, 173, 27–43. [Google Scholar] [CrossRef]
- Park, S.J.; Lee, K.; Cerik, B.C.; Choung, J. Ductile fracture prediction of EH36 grade steel based on Hosford–Coulomb model. Ships Offshore Struct. 2019, 14, 219–230. [Google Scholar] [CrossRef]
- Park, S.J.; Cerik, B.C.; Choung, J. Comparative study on ductile fracture prediction of high-tensile strength marine structural steels. Ships Offshore Struct. 2020, 15, S208–S219. [Google Scholar] [CrossRef]
- Cerik, B.C.; Choung, J. Ductile fracture behavior of mild and high-tensile strength shipbuilding steels. Appl. Sci. 2020, 10, 7034. [Google Scholar] [CrossRef]
- Costas, M.; Morin, D.; Hopperstad, O.S.; Børvik, T.; Langseth, M. A through-thickness damage regularisation scheme for shell elements subjected to severe bending and membrane deformations. J. Mech. Phys. Solids 2019, 123, 190–206. [Google Scholar] [CrossRef]
- Cerik, B.C.; Choung, J. On the prediction of ductile fracture in ship structures with shell elements at low temperatures. Thin-Walled Struct. 2020, 151, 106721. [Google Scholar] [CrossRef]
- Park, S.J.; Choung, J. Punching fracture experiments and simulations of unstiffened and stiffened panels for ships and offshore structures. J. Ocean Eng. Technol. 2020, 34, 155–166. [Google Scholar] [CrossRef]
- Cerik, B.C.; Choung, J. Rate-dependent combined necking and fracture model for predicting ductile fracture with shell elements at high strain rates. Int. J. Impact Eng. 2020, 146, 103697. [Google Scholar] [CrossRef]
- Cerik, B.C.; Choung, J. Fracture Estimation in Ship Collision Analysis—Strain Rate and Thermal Softening Effects. Metals 2021, 11, 1402. [Google Scholar] [CrossRef]
- Gruben, G.; Langseth, M.; Fagerholt, E.; Hopperstad, O. Low-velocity impact on high-strength steel sheets: An experimental and numerical study. Int. J. Impact Eng. 2016, 88, 153–171. [Google Scholar] [CrossRef] [Green Version]
- Johannessen, H.; Johannessen, O.H.; Costas, M.; Clausen, A.H.; Sønstabø, J.K. Experimental and numerical study of notched SHS made of different S355 steels. J. Constr. Steel Res. 2021, 182, 106673. [Google Scholar] [CrossRef]
- Roth, C.C.; Mohr, D. Effect of strain rate on ductile fracture initiation in advanced high strength steel sheets: Experiments and modeling. Int. J. Plast. 2014, 56, 19–44. [Google Scholar] [CrossRef]
- Johnson, G.R.; Cook, W.H. A computational constitutive model and data for metals subjected to large strain, high strain rates and high pressures. In Proceedings of the 7th International Symposium Ballistics, Hague, The Netherlands, 19–21 April 1983; pp. 541–547. [Google Scholar]
- Swift, H. Plastic instability under plane stress. J. Mech. Phys. Solids 1952, 1, 1–18. [Google Scholar] [CrossRef]
- Voce, E. The relationship between stress and strain from homogenous deformation. J. Inst. Met. 1948, 74, 537–562. [Google Scholar]
- Sung, J.H.; Kim, J.H.; Wagoner, R. A plastic constitutive equation incorporating strain, strain-rate, and temperature. Int. J. Plast. 2010, 26, 1746–1771. [Google Scholar] [CrossRef]
Figure 1.
Dimensions of the test models (unit: mm) and the experimental setup in the quasi-static tests.
Figure 1.
Dimensions of the test models (unit: mm) and the experimental setup in the quasi-static tests.

Figure 2.
Finite element model of the test model, supports, and indentor.

Figure 3.
Hardening curves of AH36 and DH36 grade steels [30].
Figure 3.
Hardening curves of AH36 and DH36 grade steels [30].

Figure 4.
Localized necking (dashed line) and fracture (continuous line) loci of AH36 and DH36 grade steels.
Figure 4.
Localized necking (dashed line) and fracture (continuous line) loci of AH36 and DH36 grade steels.

Figure 5.
Flow stress curves at various strain rates.

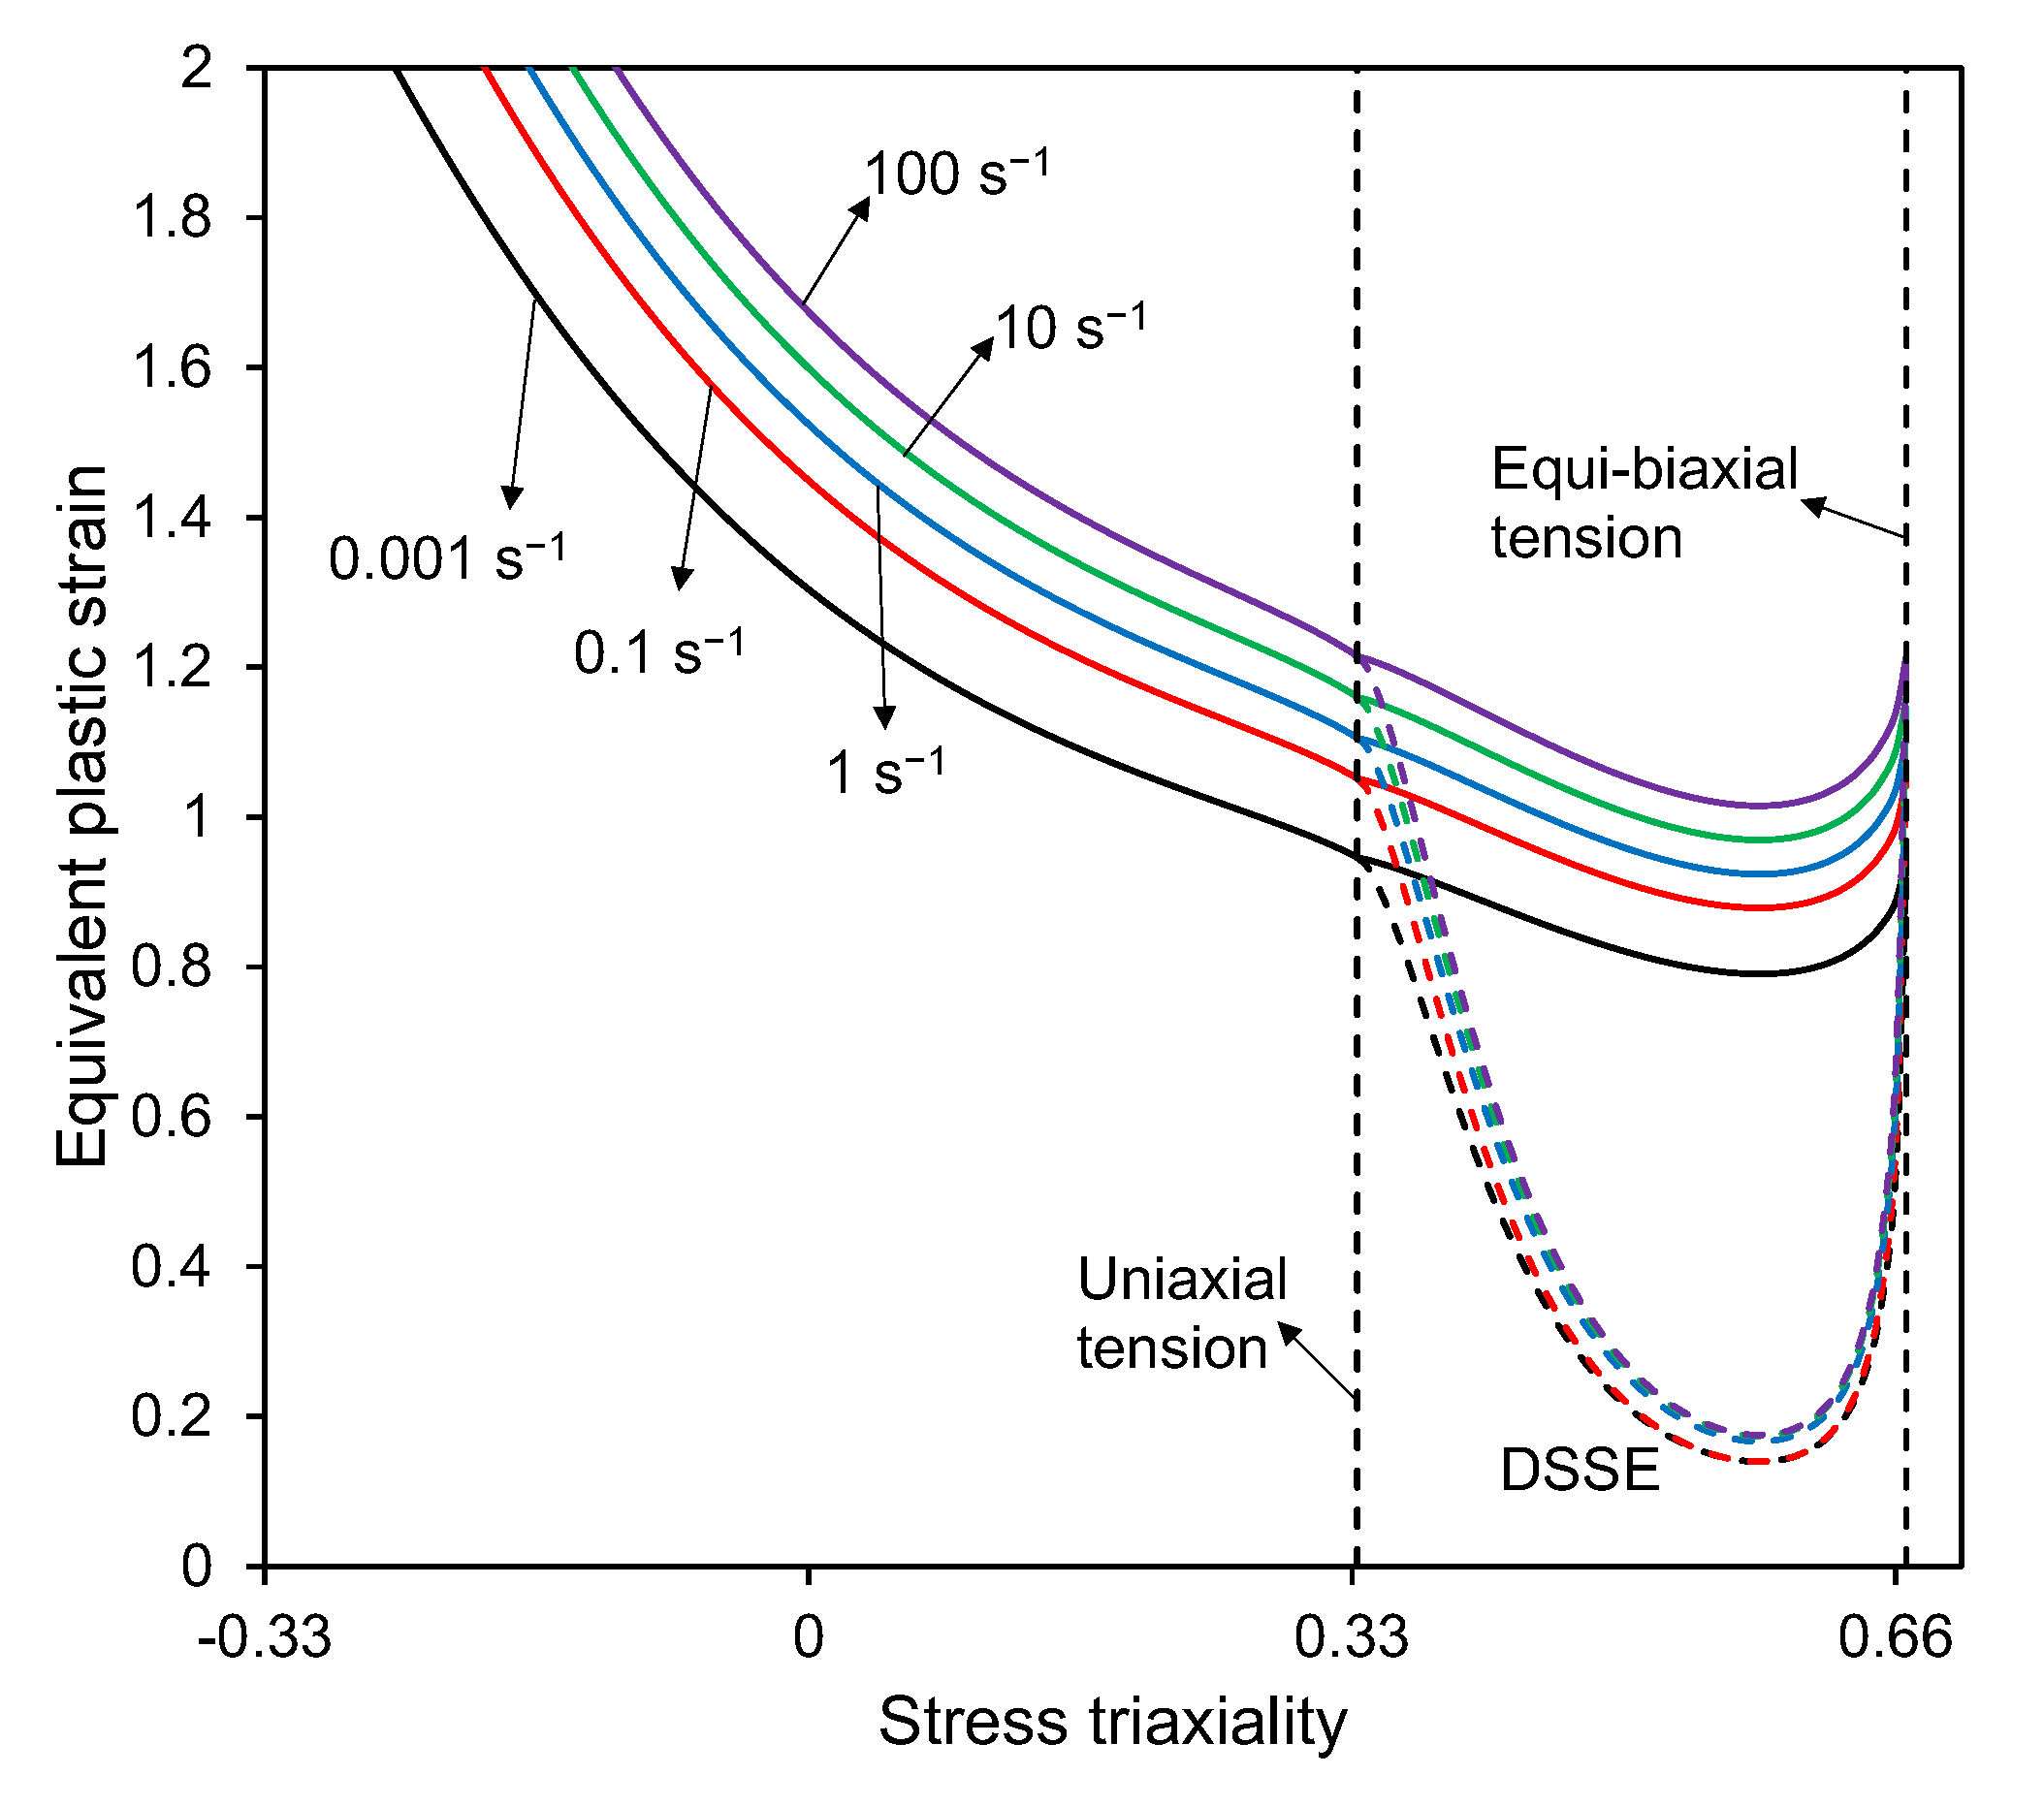
Figure 6.
Localized necking and fracture loci at various strain rates.

Figure 7.
Force-displacement curves for quasi-static test.

Figure 8.
Predicted failure mode and comparison with the post-mortem test specimen.

Figure 9.
Comparison of the experimental and numerical force-displacement curves for the dynamic impact test.
Figure 9.
Comparison of the experimental and numerical force-displacement curves for the dynamic impact test.

Figure 10.
Predicted deformations and fracture in the simulation of the dynamic impact test.

Figure 11.
Loading paths of the top and bottom through-thickness integration points in the first failed element.
Figure 11.
Loading paths of the top and bottom through-thickness integration points in the first failed element.

Figure 12.
State variables at the initiation of fracture.

Figure 13.
Force-displacement curves obtained considering or omitting dynamic effects.

Figure 14.
Force-displacement curve obtained using a constant failure strain.

Figure 15.
Equivalent stress plot of the post-mortem test model as predicted by FEA using a constant failure strain.
Figure 15.
Equivalent stress plot of the post-mortem test model as predicted by FEA using a constant failure strain.


Table 1.
Hardening law parameters of grade AH36 and DH36 steels.
| Material | A | n | Q | ||||
|---|---|---|---|---|---|---|---|
| (MPa) | - | - | (MPa) | (MPa) | - | - | |
| AH36 | 1053 | 0.005407 | 0.2194 | 335 | 340.2 | 22.14 | 0.52 |
| DH36 | 1058 | 0.007999 | 0.1794 | 444.7 | 293.1 | 21.89 | 0.55 |
Table 2.
Parameters associated with the rate- and temperature-dependent plasticity model.
| C | (s) | (K) | (K) | m | (J/kg K) | (s) | |
|---|---|---|---|---|---|---|---|
| 0.01366 | 0.00116 | 293 | 1673.7 | 0.921 | 0.9 | 420 | 1.379 |
Disclaimer/Publisher’s Note: The statements, opinions and data contained in all publications are solely those of the individual author(s) and contributor(s) and not of MDPI and/or the editor(s). MDPI and/or the editor(s) disclaim responsibility for any injury to people or property resulting from any ideas, methods, instructions or products referred to in the content. |
© 2023 by the authors. Licensee MDPI, Basel, Switzerland. This article is an open access article distributed under the terms and conditions of the Creative Commons Attribution (CC BY) license (https://creativecommons.org/licenses/by/4.0/).
Share and Cite
MDPI and ACS Style
Cerik, B.C.; Choung, J. Fracture Prediction of Steel-Plated Structures under Low-Velocity Impact. J. Mar. Sci. Eng. 2023, 11, 699. https://doi.org/10.3390/jmse11040699
AMA Style
Cerik BC, Choung J. Fracture Prediction of Steel-Plated Structures under Low-Velocity Impact. Journal of Marine Science and Engineering. 2023; 11(4):699. https://doi.org/10.3390/jmse11040699
Chicago/Turabian StyleCerik, Burak Can, and Joonmo Choung. 2023. "Fracture Prediction of Steel-Plated Structures under Low-Velocity Impact" Journal of Marine Science and Engineering 11, no. 4: 699. https://doi.org/10.3390/jmse11040699
Note that from the first issue of 2016, this journal uses article numbers instead of page numbers. See further details here.