Article

Experimental Study on Corrosion Development Model and Fatigue Performance of Strand Steel for Coastal Structures

1
School of Civil Engineering and Architecture, NingboTech University, Ningbo 315100, China
2
Ningbo Research Institute, Zhejiang University, Ningbo 315100, China
*
Author to whom correspondence should be addressed.
J. Mar. Sci. Eng. 2023, 11(3), 665; https://doi.org/10.3390/jmse11030665
Submission received: 19 February 2023 / Revised: 15 March 2023 / Accepted: 19 March 2023 / Published: 21 March 2023

Abstract

:
In order to study the corrosion time-varying law and fatigue properties of high-strength steel strands used for marine environment structures, the accelerated corrosion test of steel strands was carried out by using a climate simulation chamber, and samples with different corrosion times were taken out for mass weighing, morphology observation, and fatigue testing. Steel strand specimens with different corrosion times (from 1 month to 14 years) for use in the real marine environment were developed in an indoor climate simulation test chamber. The average mass corrosion ratio curve of the steel strands in the marine environment and the changes in the corrosion pit size over time were obtained by performing data analysis based on weight and appearance. The time-varying rule of the fatigue life of coastal-structure steel strands was determined by conducting a fatigue test and fracture scanning electron microscopy (SEM) analysis of steel strands with different corrosion degrees. The results of the experimental study show that the mass corrosion rate and pit size of steel strands change with the service time as a piecewise function, fatigue performance changes with the service time is as an exponential function, and fatigue performance changes with the mass corrosion ratio are similar to a linear function. Furthermore, the corrosion pit has a significant impact on the fatigue life of the steel strand.

1. Introduction

Stayed cables, suspenders of arch bridges, and suspenders of suspension bridges have the same characteristics of a low weight and small damping. Under the action of vehicles, typhoons, and other vibration loads, fatigue damage can easily occur after multiple cycles of alternating stress [1,2,3,4,5]. Moreover, stayed cables and suspenders are vulnerable components in bridge structures. High-levels of salt fog, high temperatures, and high humidity in coastal environments accelerate the deterioration of cable materials and affect the safety and durability of bridge structures [6,7,8,9,10]. Fatigue and corrosion are the two main causes of boom fractures [11,12,13]. Researchers [14,15,16] have studied the corrosion and fatigue properties of parallel steel wire suspenders. However, to date, only a few people have investigated the corrosion and fatigue properties of steel strand suspenders [16]. Moreover, test samples of corroded components are prepared by accelerating corrosion with electrochemistry, thus they are considerably differing from those in the real marine environment. Yu used the salt fog test and neural network method to establish a stochastic pitting corrosion model, and then they used the empirical formula to derive the stress concentration factor and predict the fatigue life of steel strands [17]. In this study, steel strand specimens with different corrosion times are developed in a large climate simulation test chamber. The variation law of the steel strand corrosion rate with time is analyzed, and the development model for corrosion pits is established by performing a statistical analysis. A fatigue test is conducted to determine the deterioration rule of the fatigue property of the steel strand with time.

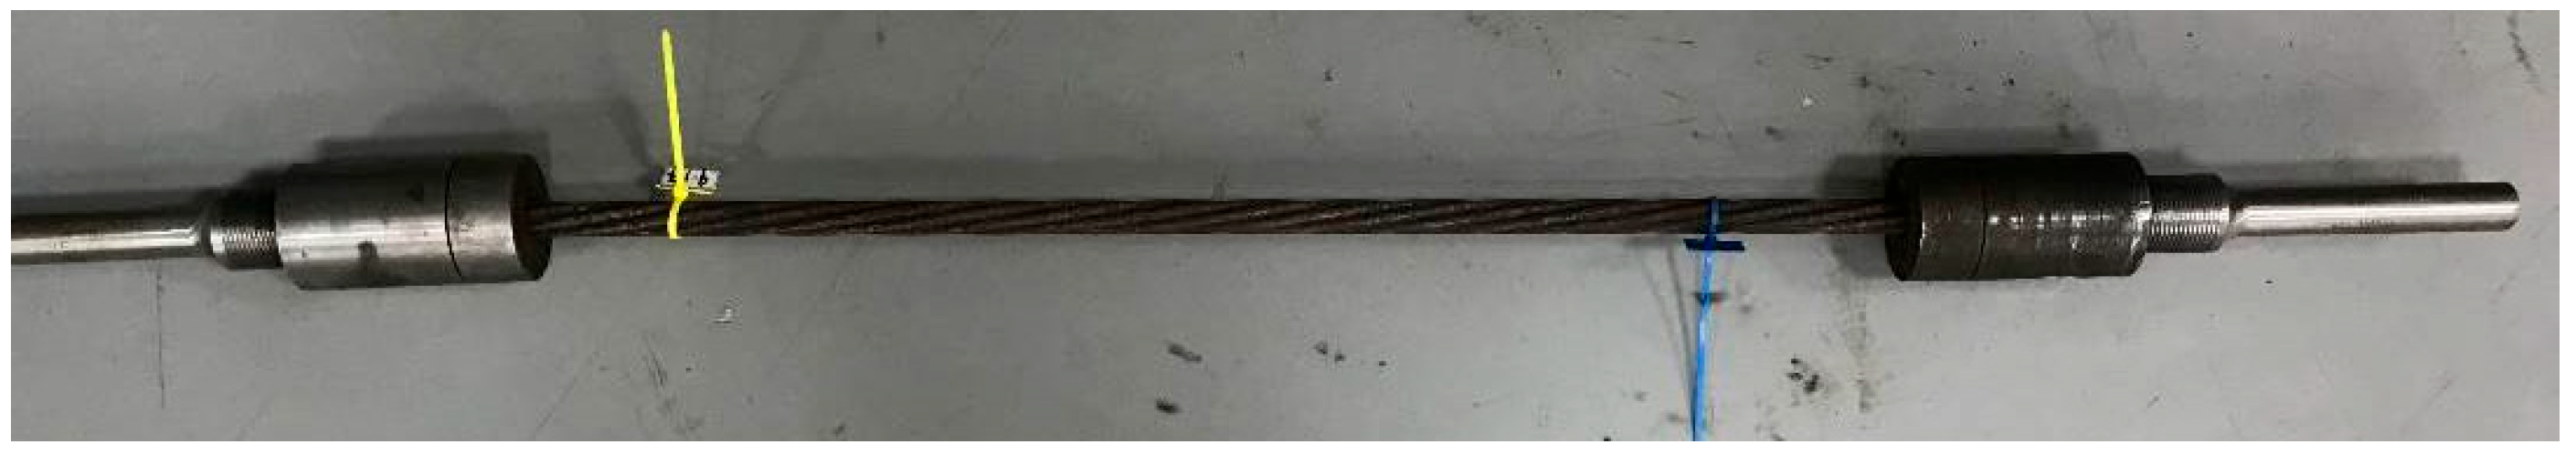
2. Sample Preparation

Each test sample was composed of 7 steel wires with a diameter of 5 mm made from carbon steel containing 0.6–0.8% carbon with a nominal diameter of 15.20 mm, an elastic modulus of 198 GPa, and an ultimate strength of 1860 MPa, and it complied with the relevant requirements for prestressed concrete (GB/T 5224.2014). The length of the steel strand used in this test was 75 cm. Seventy-eight steel strands were prepared and divided into 19 batches. The corrosion times in the simulated real environment were 1 month, 3 months, 6 months, 9 months, 12 months (1 year), 18 months (1.5 years), 2 years, 3 years, 4 years, 5 years, 6 years, 7 years, 8 years, 9 years, 10 years, 11 years, 12 years, 13 years, and 14 years. A total of 36 steel strands were present in batches 1–12. A total of six samples were present in batches 13–19. The total number of samples was 42. Specific information about the samples is shown in Table 1.
Steel strands with different corrosion rates in this test were manufactured by conducting a salt-spray-accelerated test in the loading multi-function climate simulation test chamber (temperature 40 °C, humidity 95%, and NaCl 5%); the test chamber had the following dimensions: 4500 mm × 3300 mm × 2800 mm (depth × width × height). The natural corrosion environment spectrum of coastal areas was compiled using meteorological data of Zhoushan Dinghai Station in 2018. Zhoushan has a monsoon marine climate in the southern margin of the north subtropical zone, with high chloride ion content in seawater, and its classification in terms of marine atmosphere is C5. The equivalence relationship between the environment of the loading multi-function climate simulation test chamber and the actual coastal operating environment was established [18]. The experiment started on 11 November 2019. All the steel strands were placed in the climate simulation test chamber at the same time. Then, they were taken out in batches as per the set test time. All test samples were taken out by 17 July 2020, and the accelerated corrosion test was completed.
The aim of this corrosion test is to examine the damage to the external protective sleeve of the suspenders. Therefore, the corrosion time of a bridge suspender that has been in service for many years should be added to the damage life of the external protective sleeve, which is generally considered to be 2 years [19].

3. Time-Varying Model of Steel Strand Corrosion

The corrosion appearance of the samples is shown in Table 2. Steel strands with different corrosion times were weighed and measured. Then, the test data were analyzed, and the time-varying model of the average mass corrosion rate of the steel strand and the corrosion pit development model were obtained.

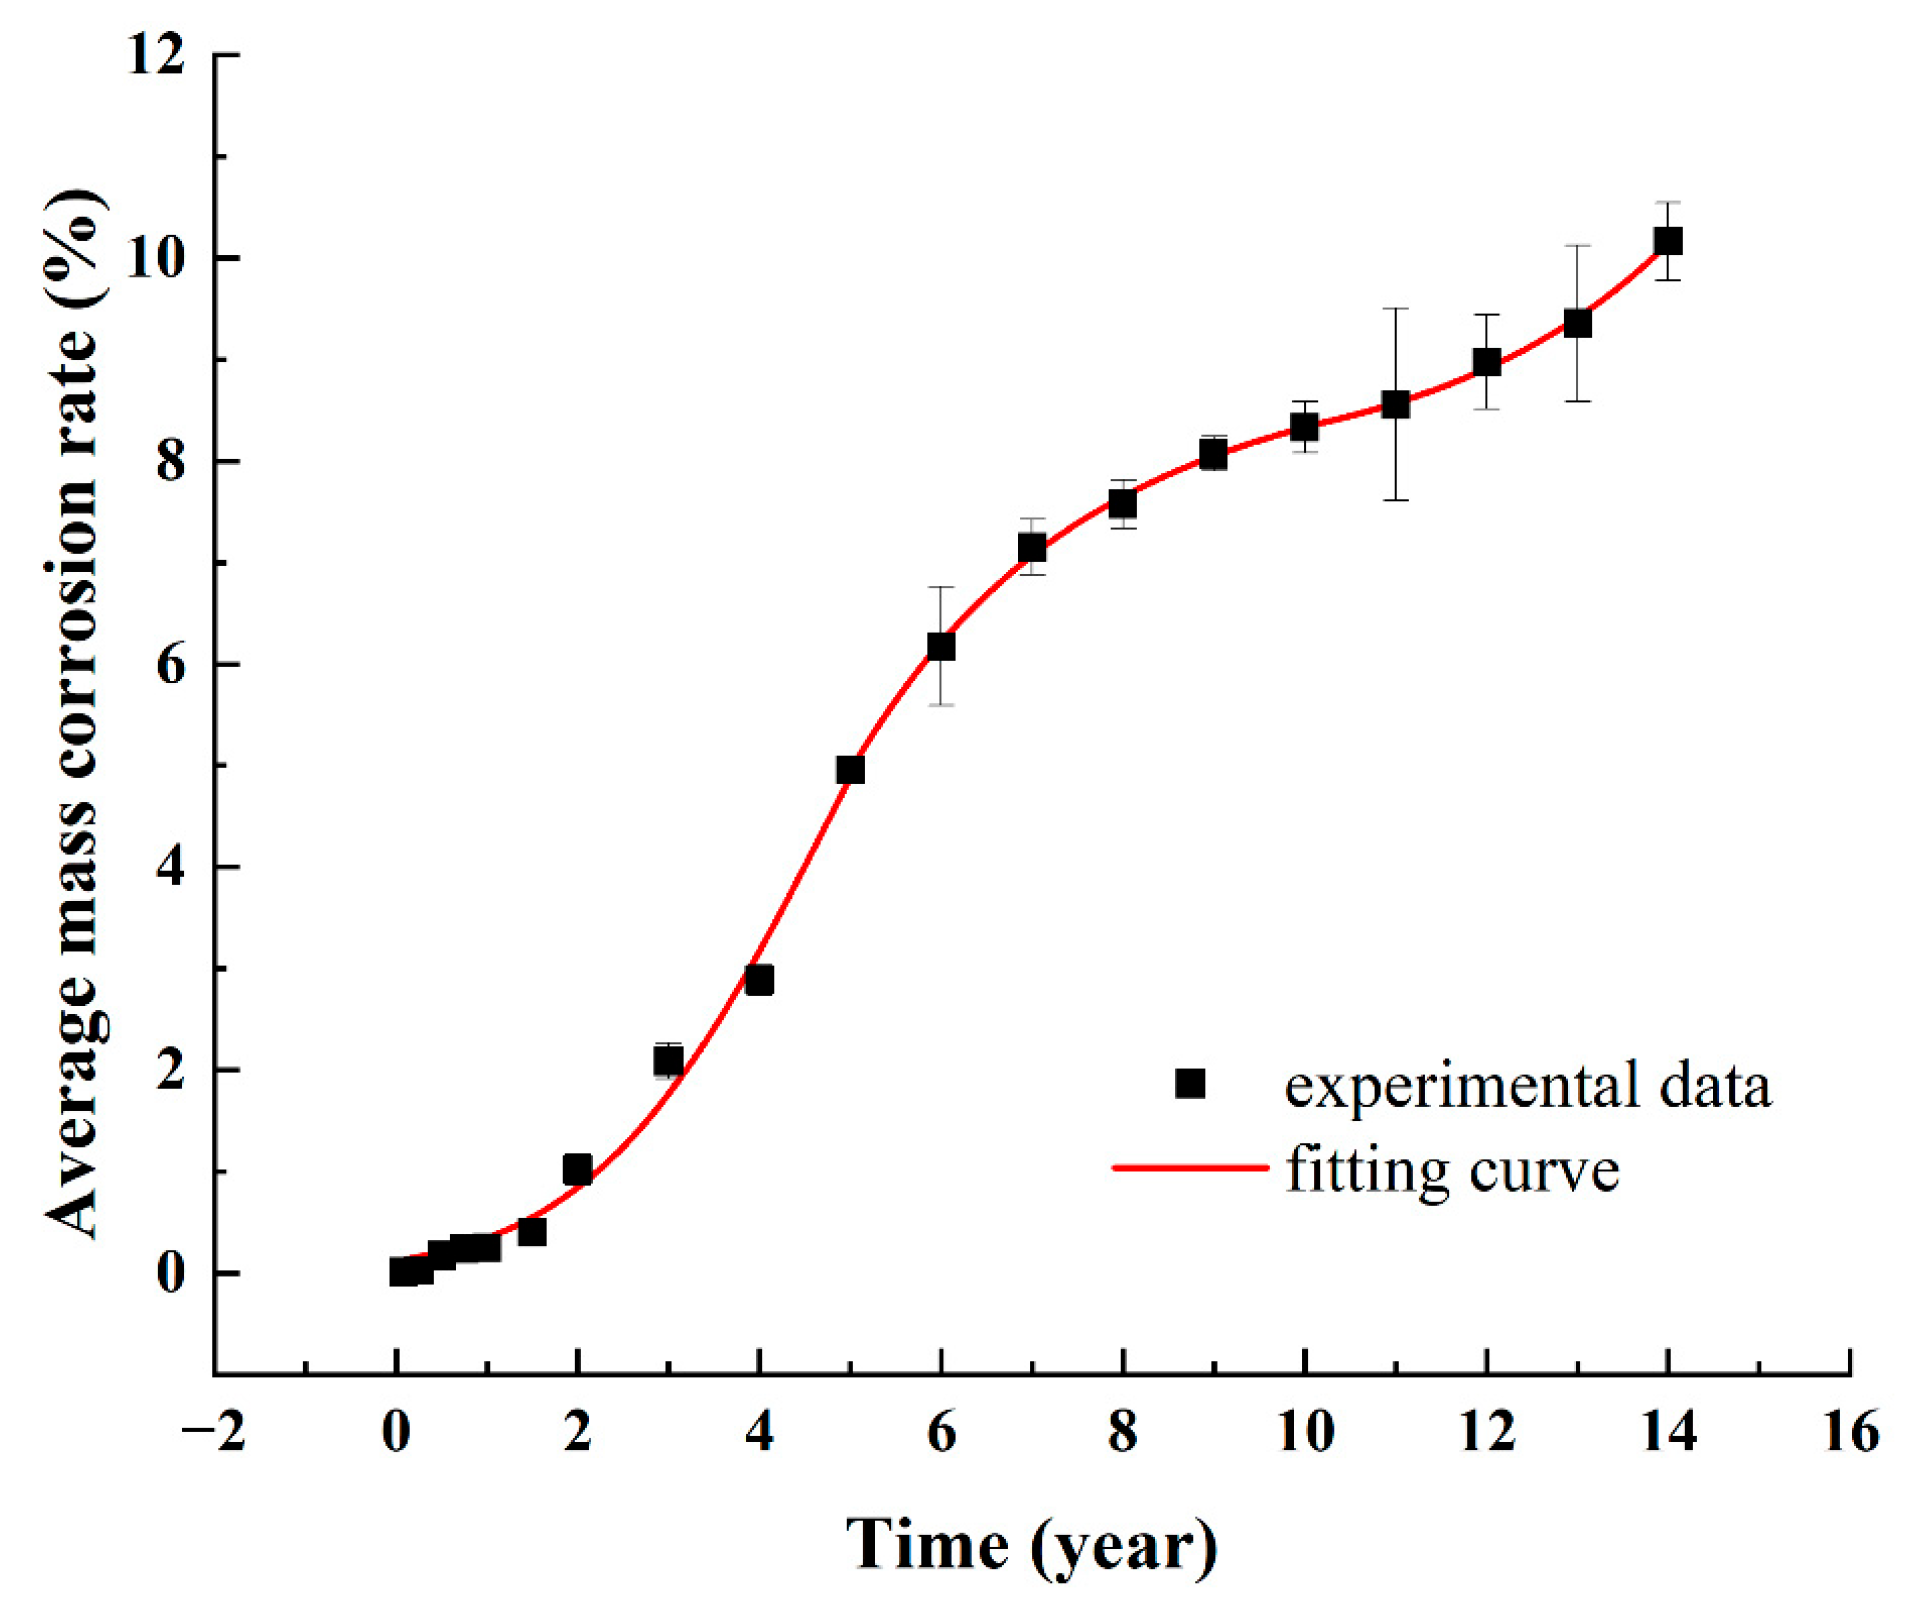
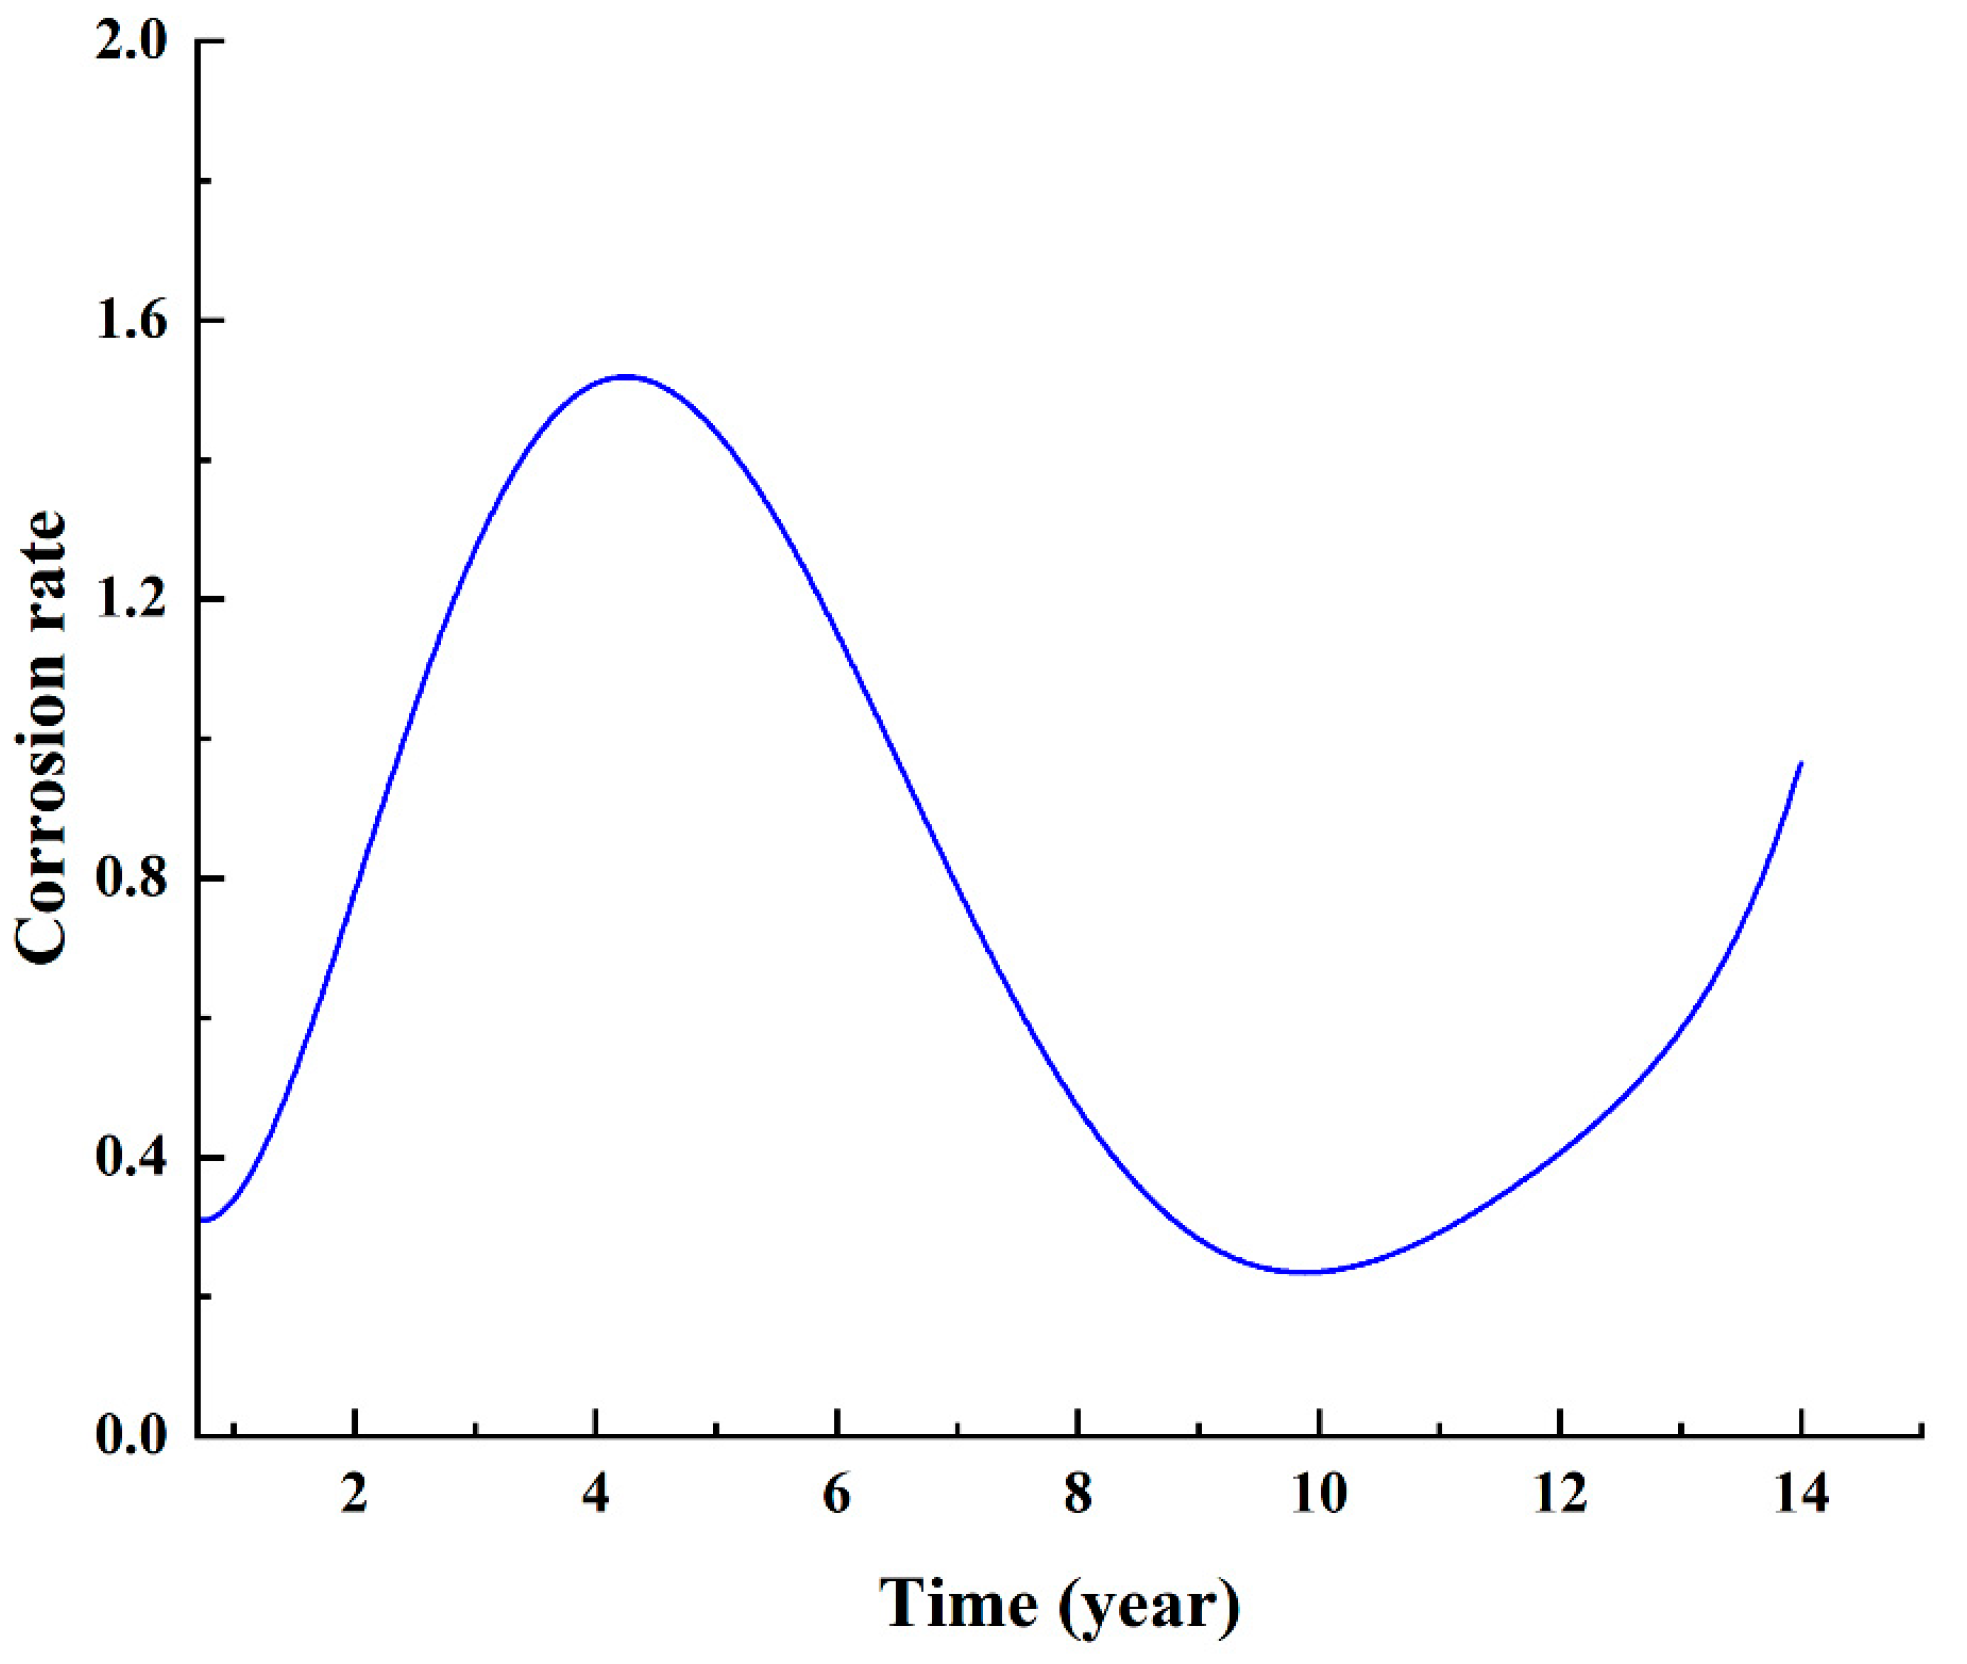
3.1. Time-Varying Model of Average Mass Corrosion Rate

The steel strands were taken out at different corrosion times and placed into a test box with diluted glacial acetic acid solution. After soaking for 24 h, the steel strand test samples were repeatedly rinsed with clean water, and a soft brush was used to treat the rust until the rust deposits on the surface of the test piece were completely cleaned. The washed steel strand was dried for 24 h at 60 °C. After the steel strand was completely dried, an electronic balance with an accuracy of 0.1 g was used to measure the mass of the steel strand. The mass loss rate of the steel strand was calculated as η = (m0 − m1) × 100%/m0
η = m 0 m 1 m 0 × 100 %
where η is the mass corrosion rate of a single steel strand, m0 is the initial mass of the steel strand before corrosion, and m1 is the mass of the steel strand after rust removal.
The corrosion time in the laboratory environment was converted to the service time of the steel strand in the real environment. The curve of the corrosion ratio of the steel strand in the real environment versus the service time is shown in Figure 1. The time-varying model of the average mass corrosion ratio of the steel strand is expressed in Formula (2).
η = e 2.113 + 1.125 t 0.077 t 2 t 5 8.914 26.682 × 0.683 t 5 < t < 10 e 2.720 0.137 t + 0.008 t 2 t 10
Figure 1 shows that the corrosion of the steel strand develops considerably slowly in the first year, relatively slowly from the first to second years, and rapidly from the second to eighth years. The average corrosion ratio at 8–12 years remains at approximately 8.5%, indicating that the corrosion degree is relatively stagnant at this time. At 12–15 years, the slope of the average ratio increases. Compared with that in the previous years, the corrosion rate significantly increases. The above piecewise rusting pattern is more intuitively shown in Figure 2.

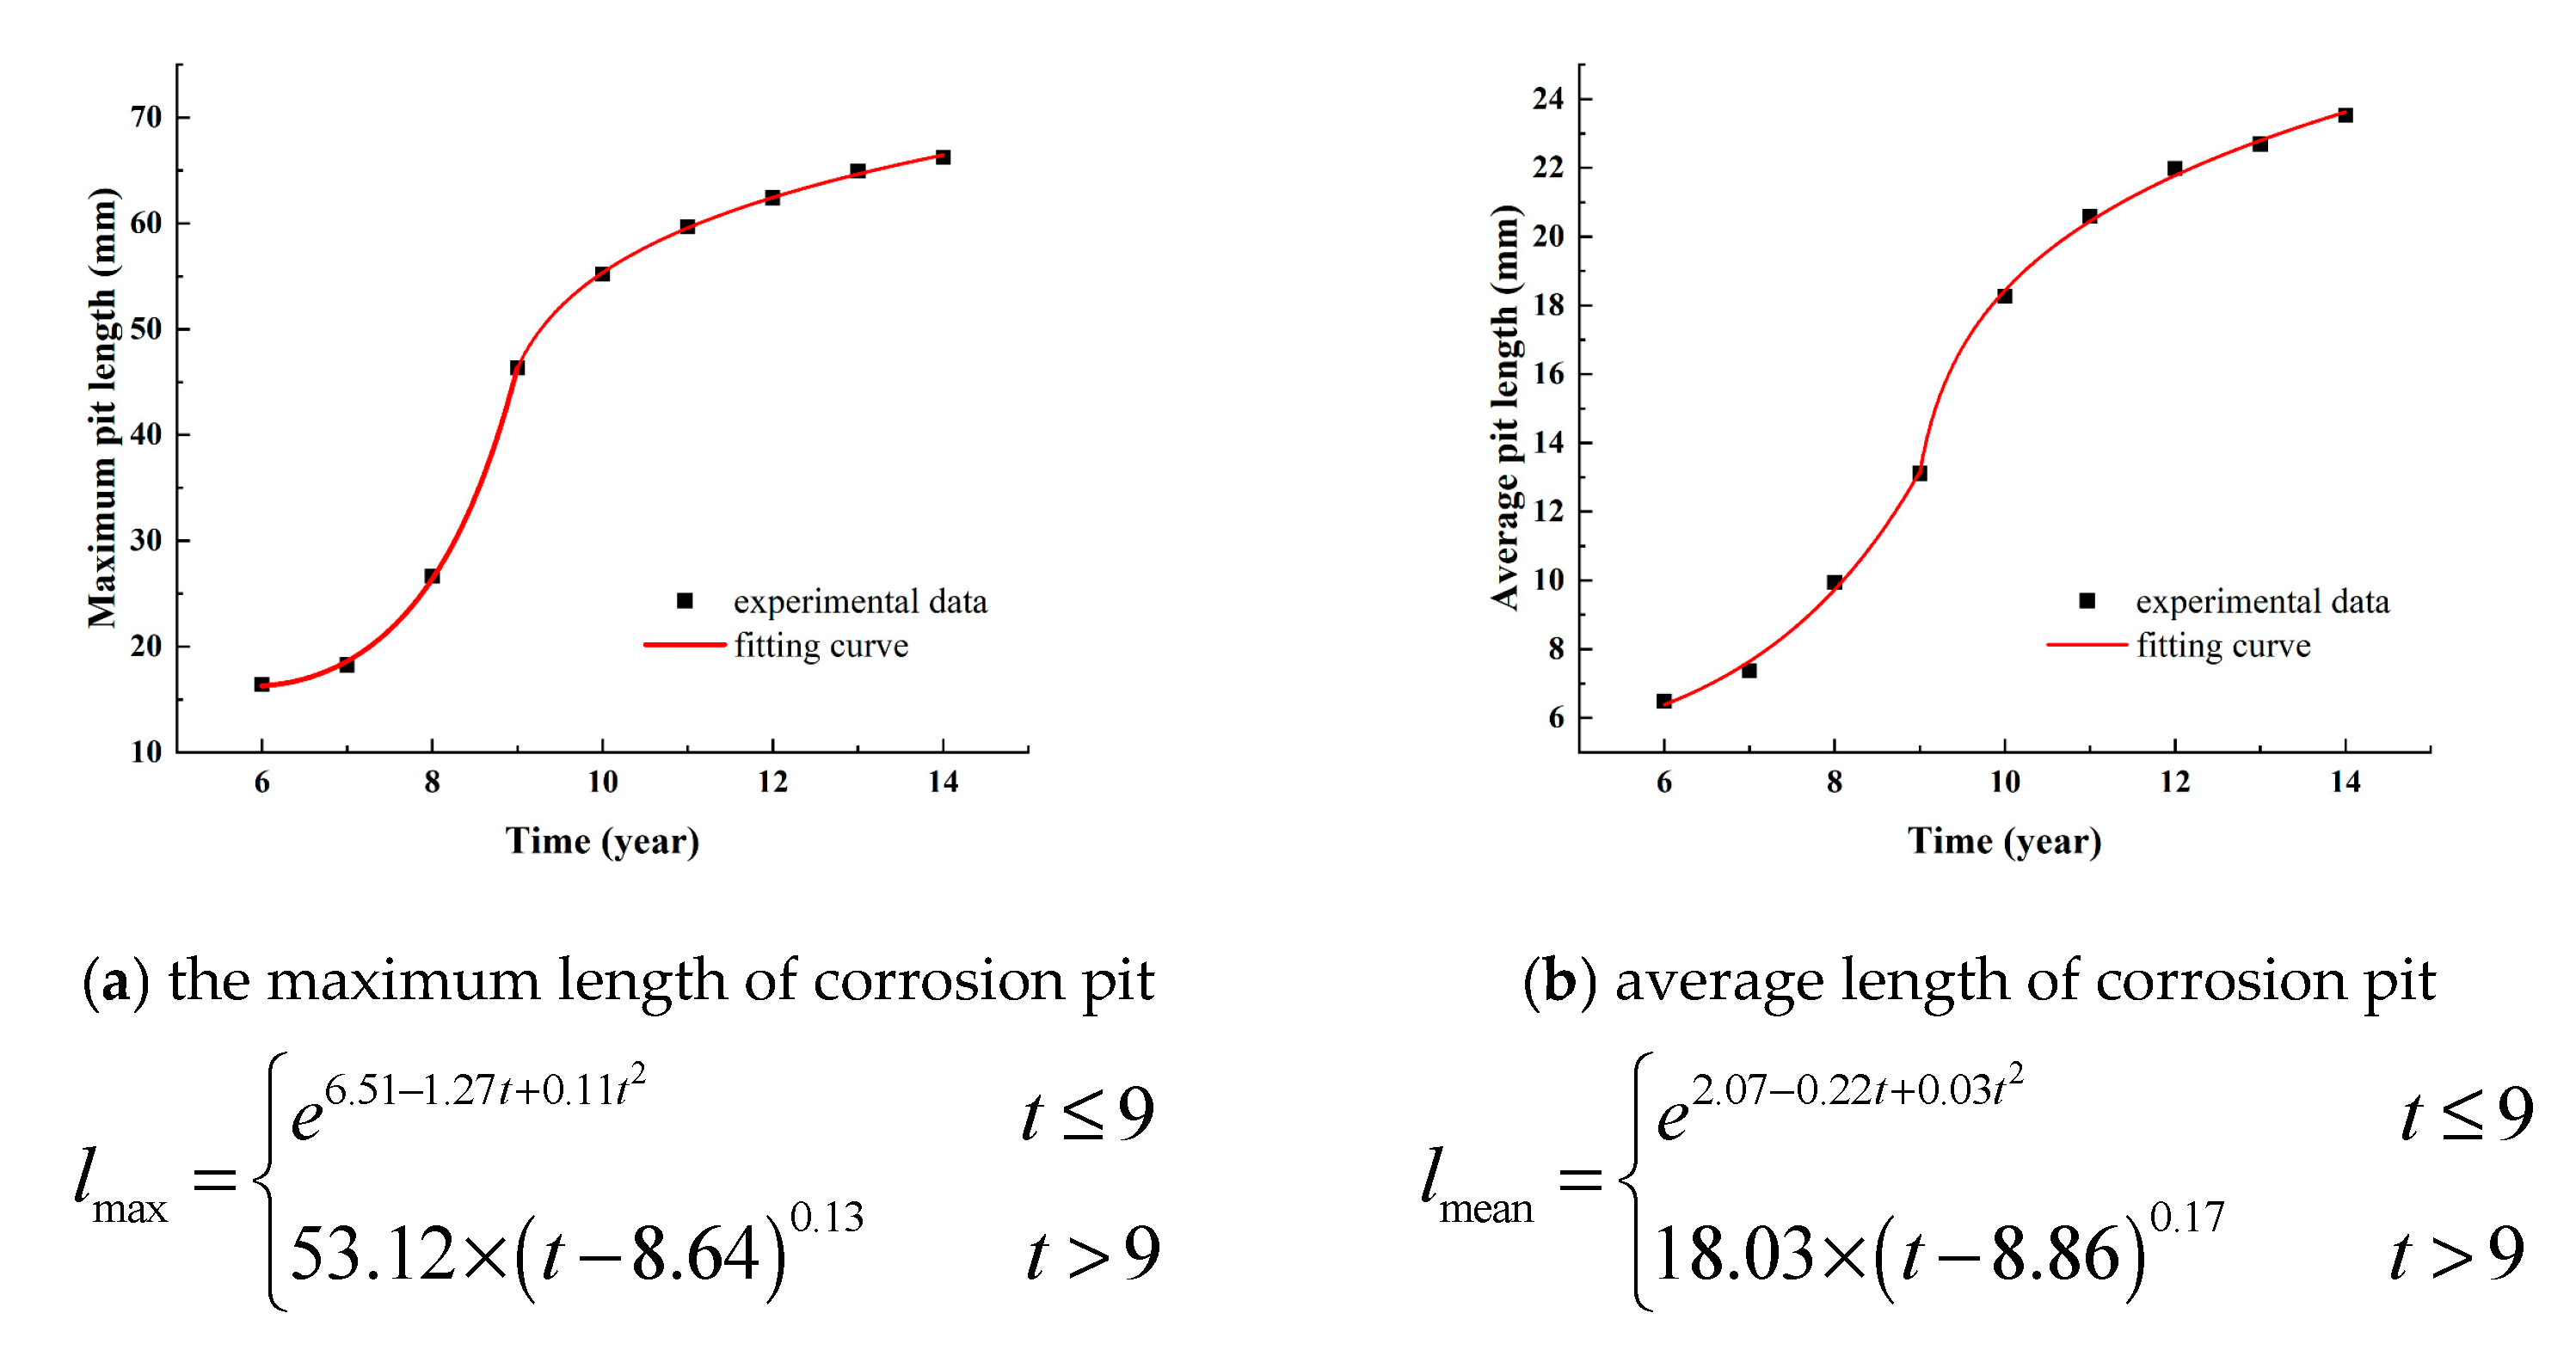
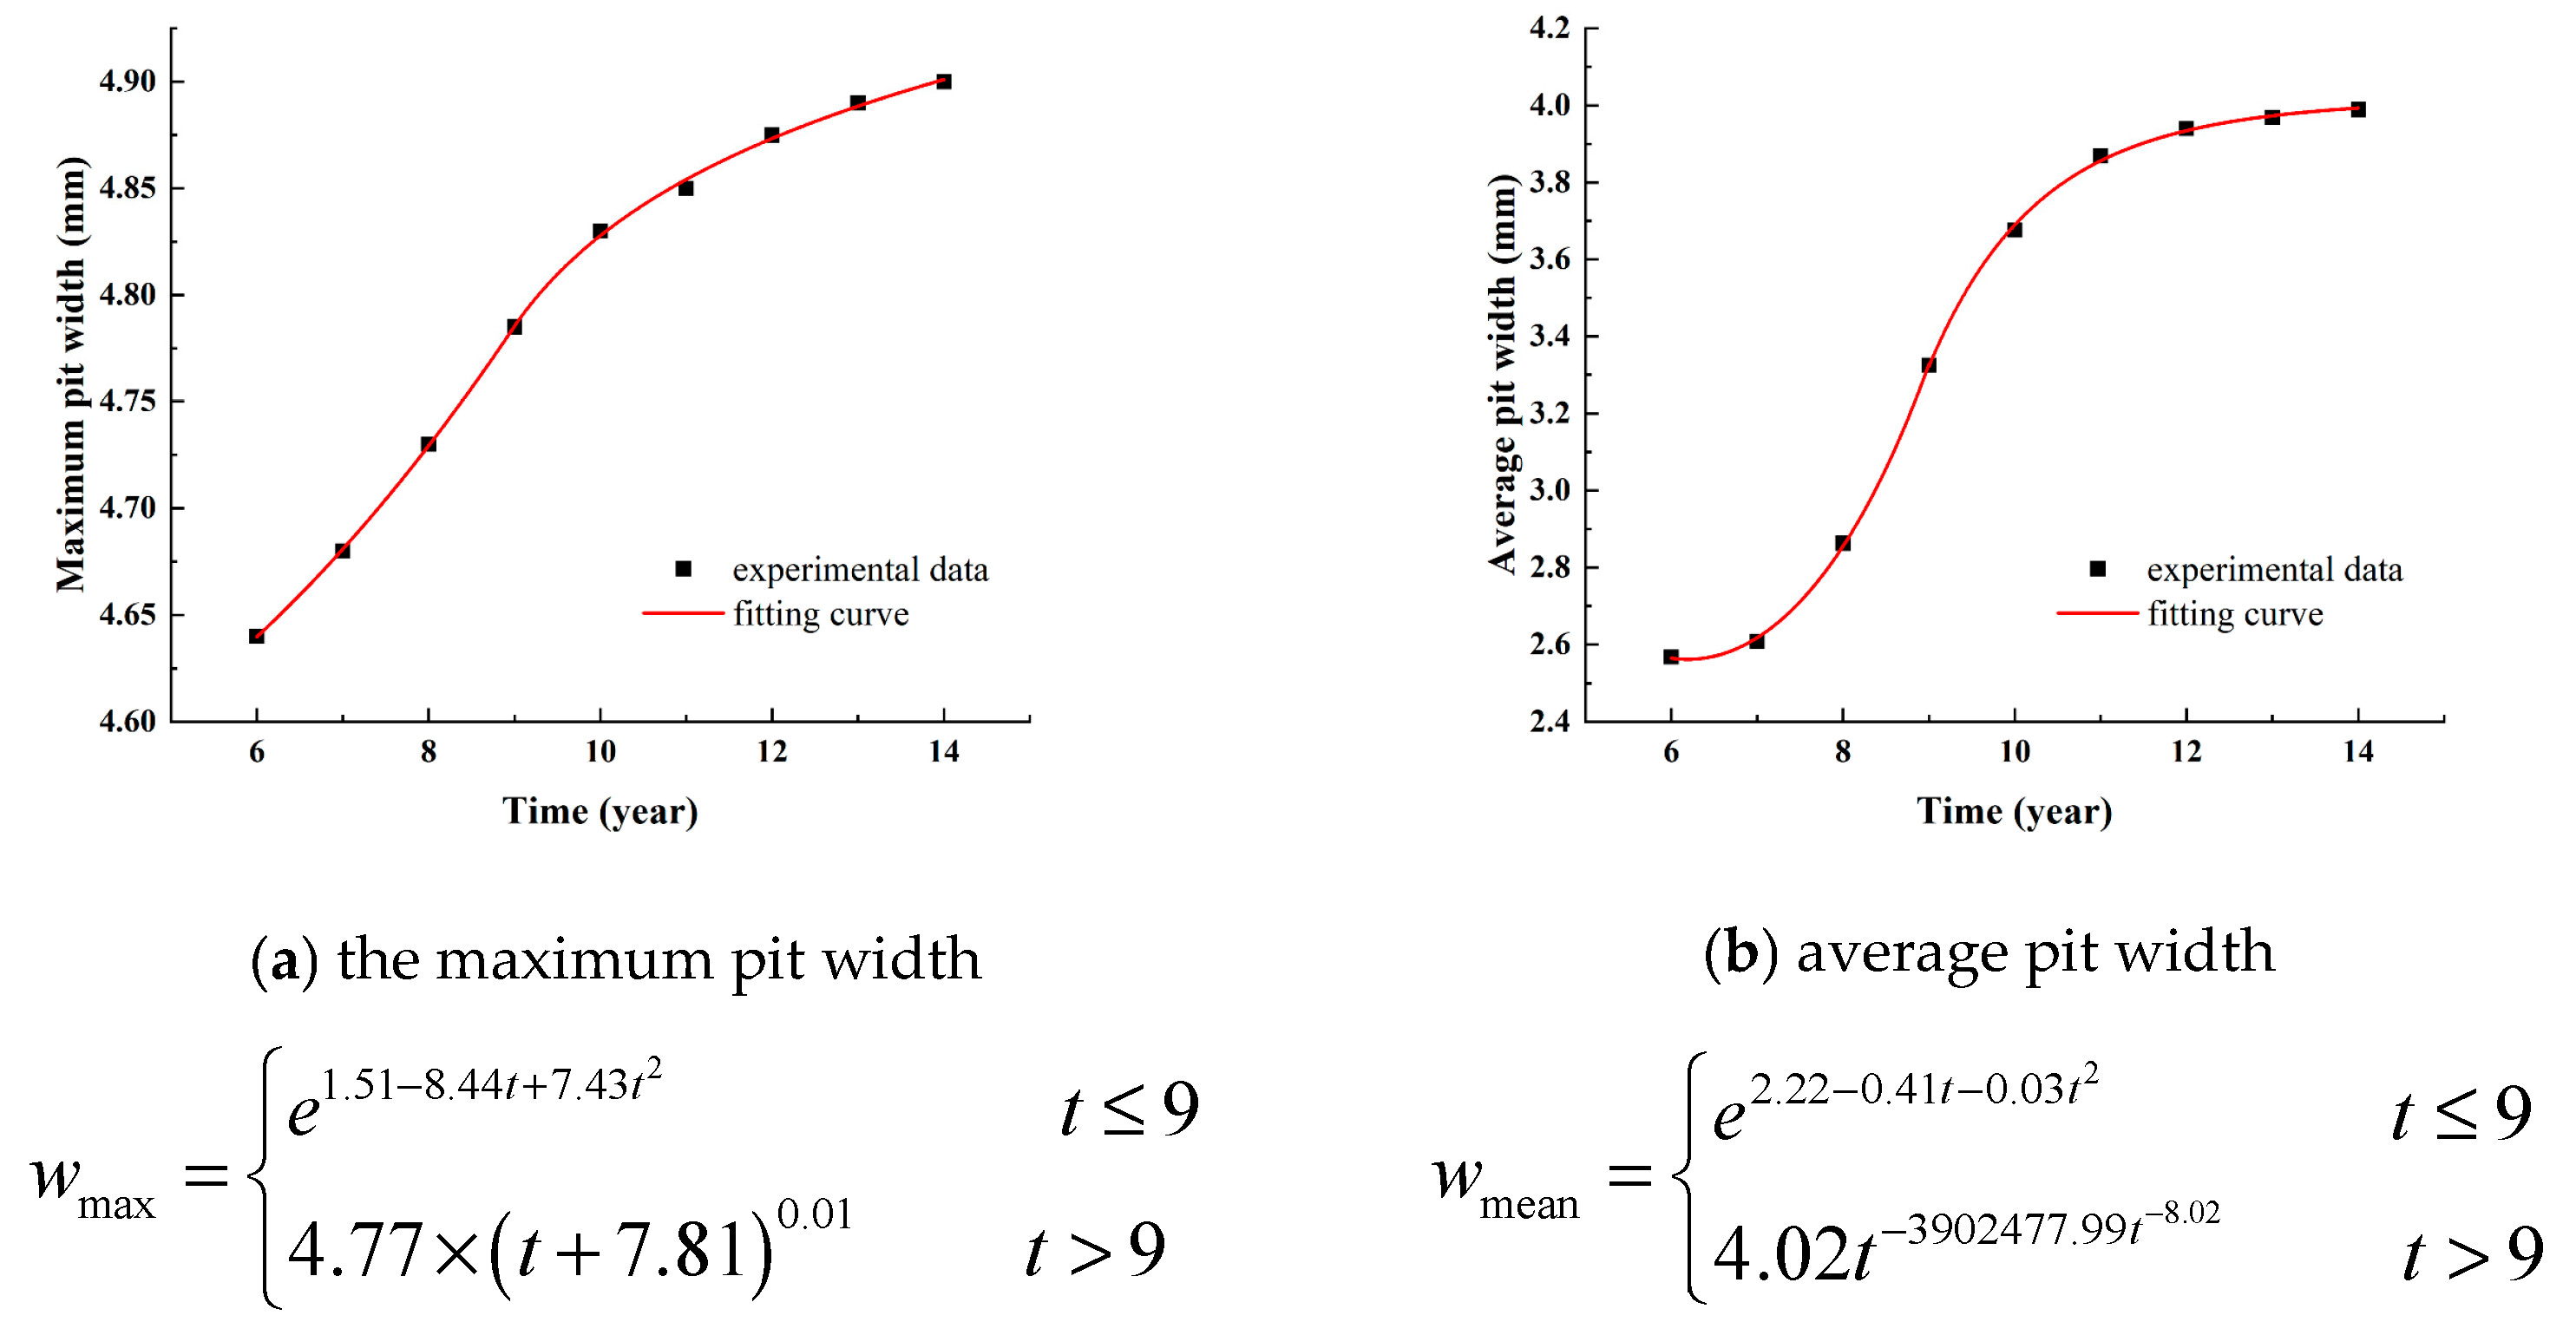
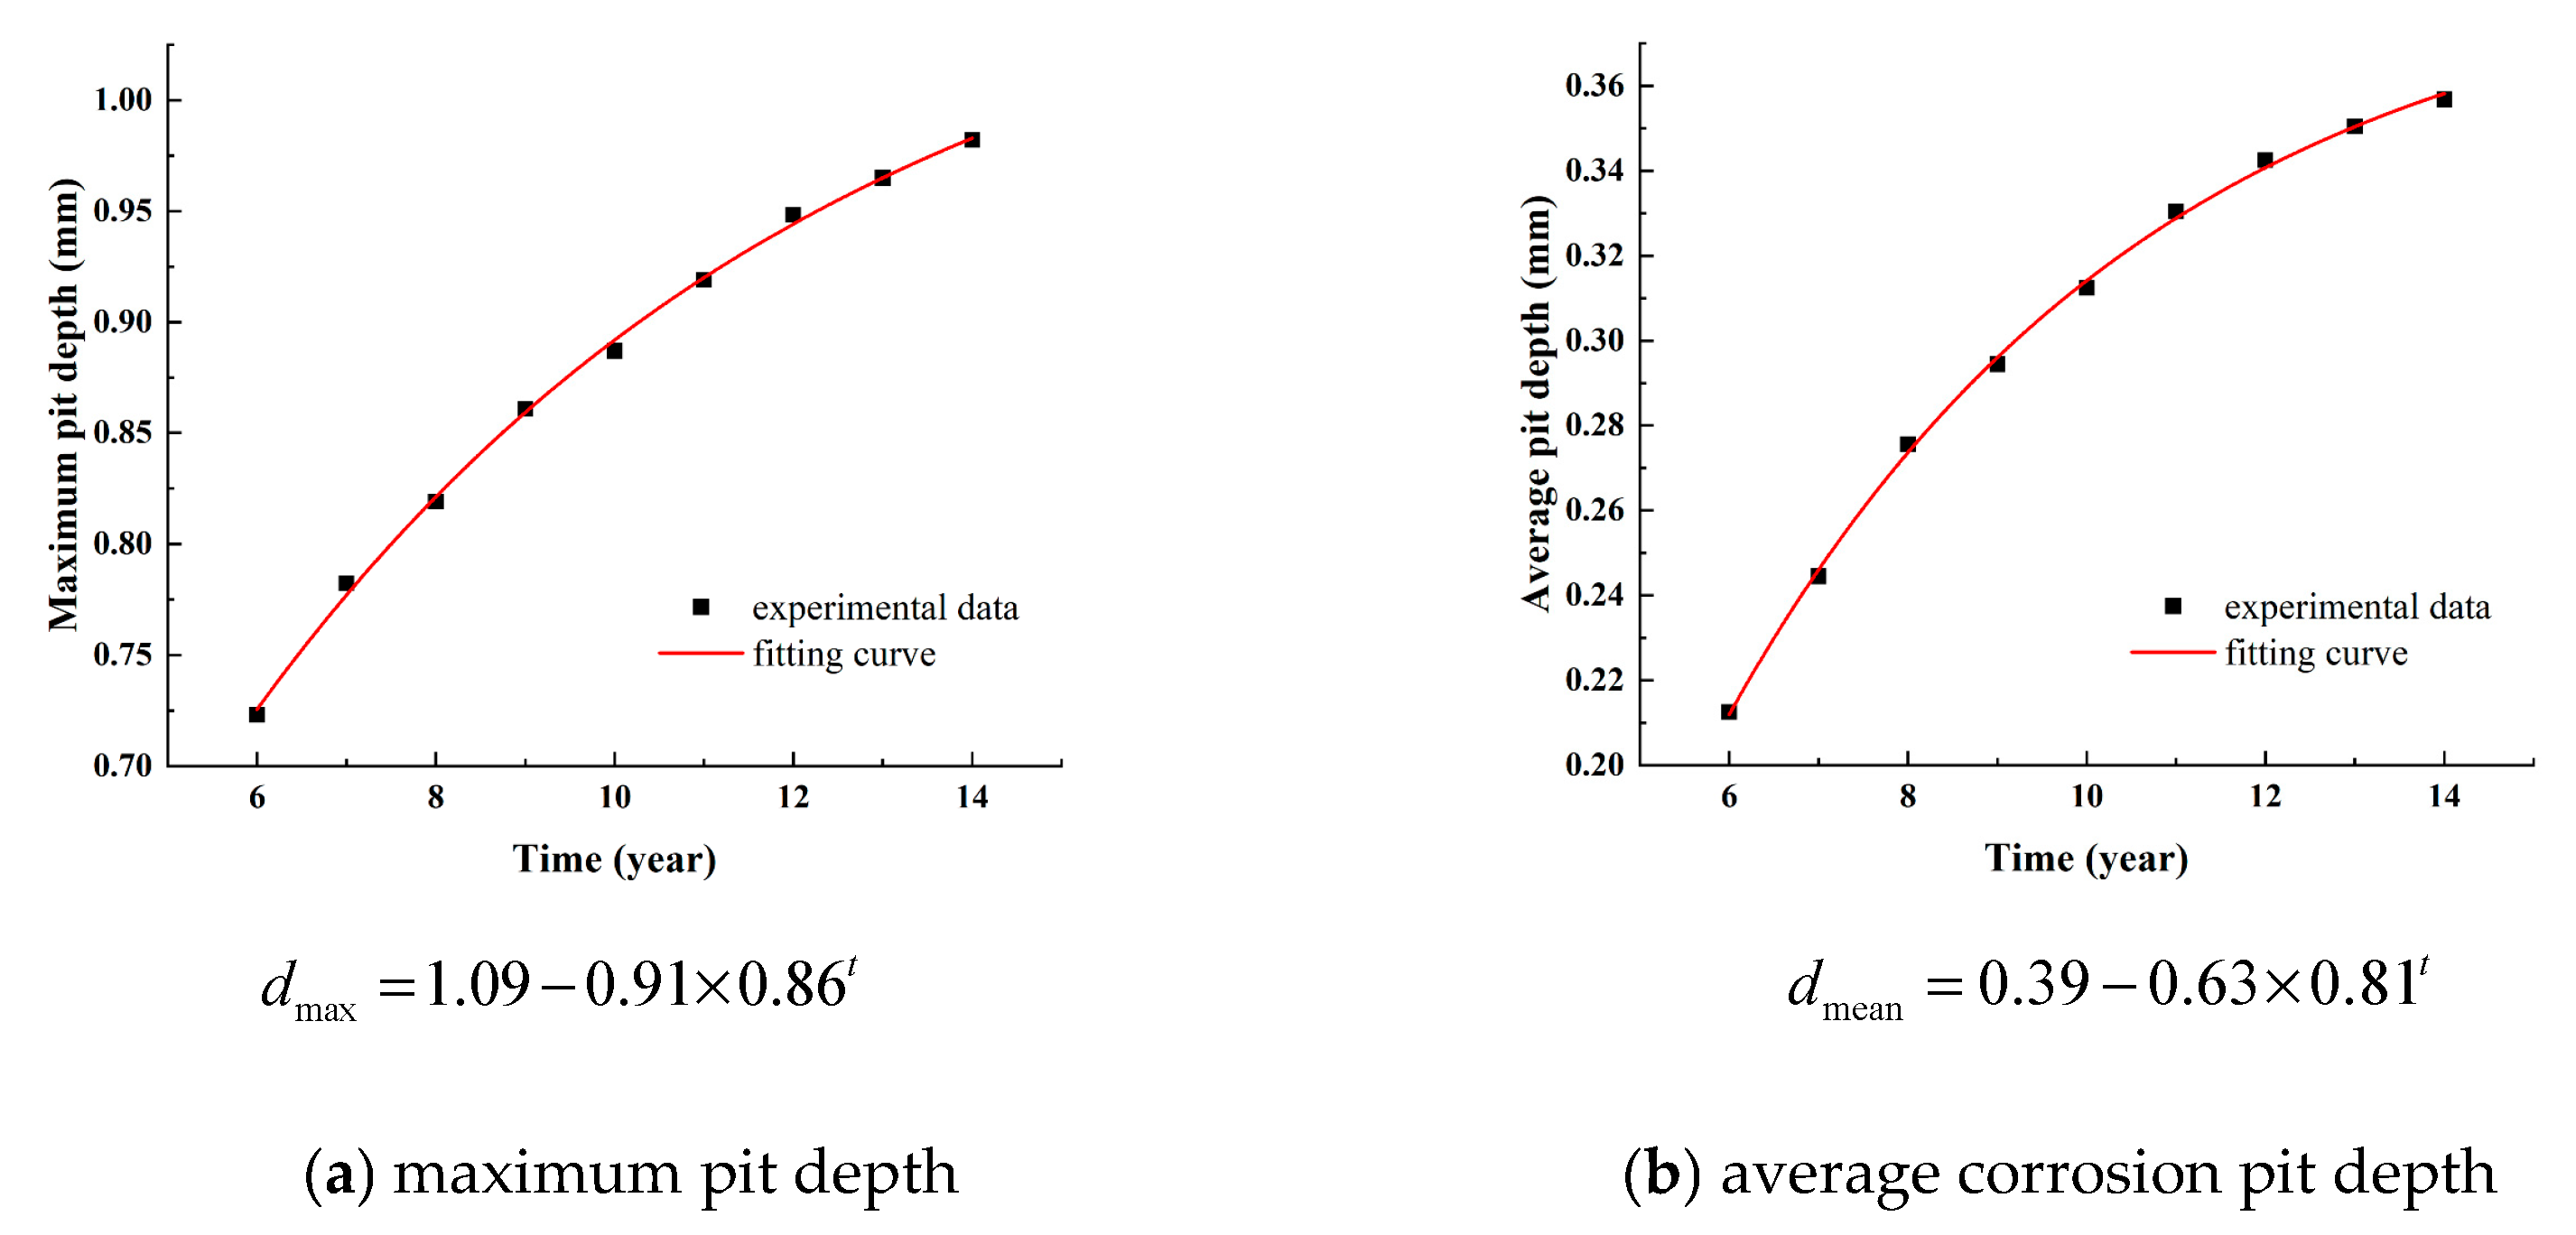
3.2. Time-Varying Model of Corrosion Pit

The typical corrosion morphology of the steel strand surface includes ellipsoidal corrosion pits, circular corrosion pits, crevice corrosion pits, voids and pits, massive corrosion, and mixed coexistence. A gap exists between the steel wires owing to the special structure of the steel strand and the continuous development of circular corrosion pits and ellipsoidal corrosion pits. Thus, a gully-like corrosion pit called the crevice corrosion pit can be easily formed. As the corrosion time increases and the degree of corrosion increases, the circular and ellipsoidal corrosion pits expand, and their boundaries interlace each other, and finally, form block corrosion pits. The block corrosion pits have clear, corrosion-shaped boundaries, and the boundaries are uneven. When the corrosion gradually deepens, honeycombs and pits appear, indicating that the boundary of the corrosion pit is not apparent and the aggregation and intersection of small pits are the main reasons for voids and pits.
The size of the corrosion pit on the surface of a parallel steel wire can be observed by using a Bruker surface profile roughness tester; however, the steel strand was a spiral. With the extension of the length direction, the height of the outer surface of the steel wire changes. Measuring the corrosion pit becomes difficult, and the corrosion pit data cannot be automatically obtained by the machine. For pits with a length or width less than 10 mm, the surface size of them can be accurately measured. For pits with a length or width greater than 10 mm, the surface sizes of these pits cannot be accurately measured by the instrument. Thus, a ruler was used to measure the length and width of the pits. To ensure accuracy, the readings were kept to one decimal place, and the accuracy control bit was 0.01 mm. A micrometer with an accuracy of 0.001 mm was used to measure the difference between the bottom and the outside of the corrosion pit, and the depth of the corrosion pit was determined by performing calculations. The length of the corrosion pit was measured along the length of the steel strand, and the width of the corrosion pit was measured along the radial dimension of the steel strand. The curves of the maximum length and average length of the corrosion pit of the steel strand versus the corrosion time are shown in Figure 3. The curves of the maximum width and average width of the corrosion pit of the steel strand versus the corrosion time are shown in Figure 4. The curves of the maximum depth and average depth of the corrosion pit of the steel strand versus the corrosion time are shown in Figure 5, which are similar to those with the earlier date [8].

4. Experimental Study on Fatigue Performance of Corroded Steel Strand

4.1. Fatigue Test Equipment

The test equipment used was an 8802 electro-hydraulic fatigue testing machine manufactured by the British INSTRON Company. As shown in Figure 6, it has a precision positioning and a highly stiff frame, and it is used for testing fracture mechanics, steel bars, aerospace plates, steel cables, civil components or structures, small concrete samples, and rock mechanics. A specially designed clamp was used in this test, and a utility model patent was applied to prevent the fracture or bending damage of the clamping end caused by the uneven stress of the steel strand material in the clamping section. Figure 7 shows a photograph of the clamp.
The specific test parameters were as follows: the average stress was 630 MPa, the stress amplitude was 210 MPa, the maximum stress was 840 MPa, the minimum stress was 420 MPa, and the stress ratio was 0.5. The sectional area of the steel strand was 140 mm2. According to stress control during loading, the average load of this test was 88.2 kN, and the load amplitude was 29.4 kN. The test was stopped when the number of fatigue cycles reached 2 million times. The limit displacement was set at 20 mm, and the loading frequency was 5 times/s. The test was terminated when the displacement of the upper chuck was considerably large and the test piece was damaged. The final fatigue life can be directly obtained from the number of cycles recorded by the control system.

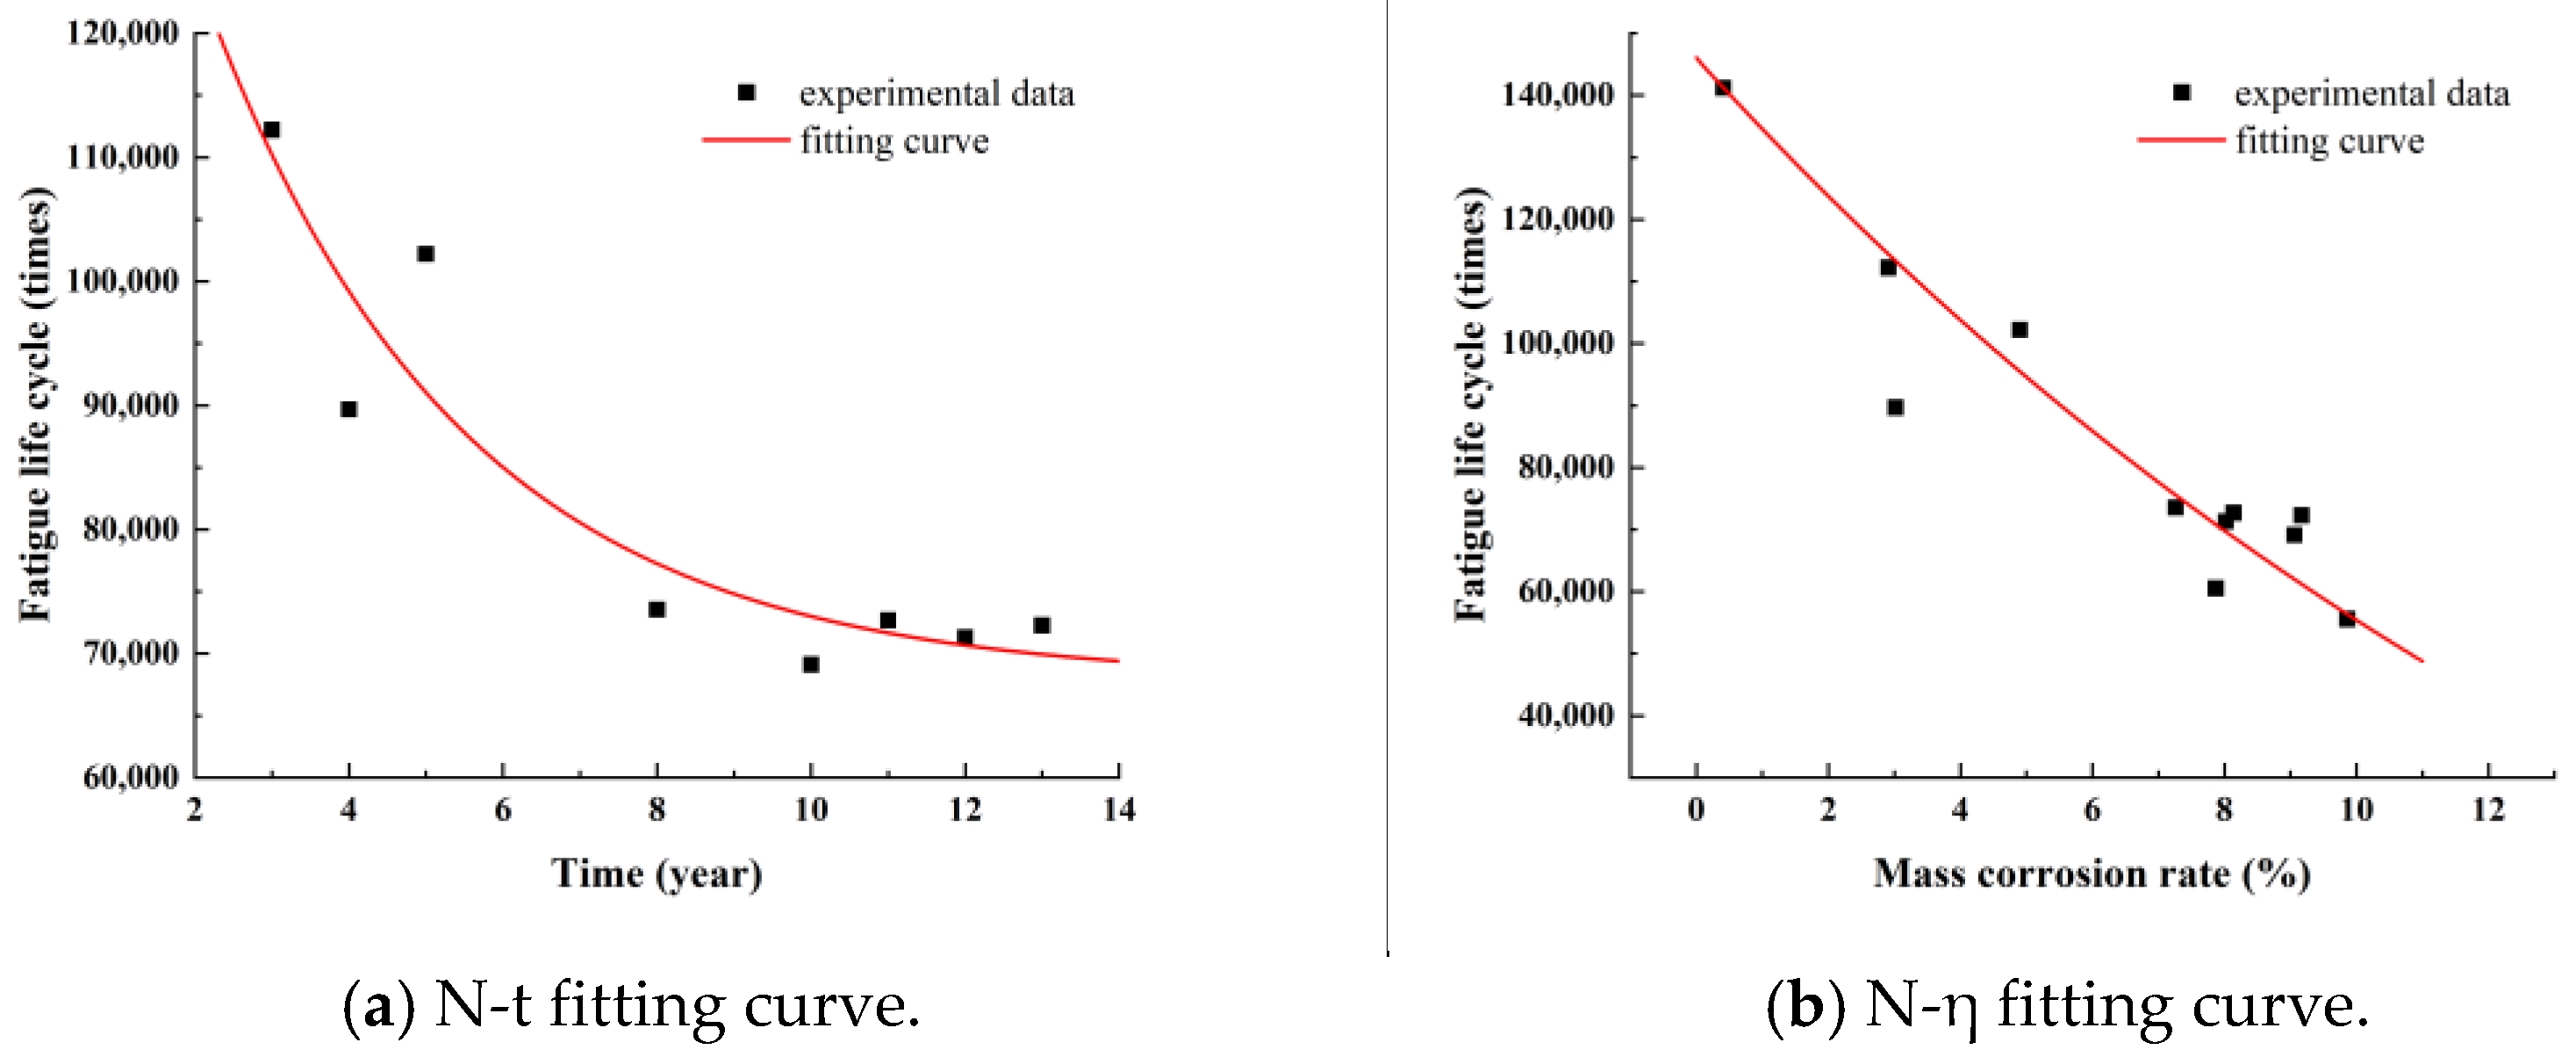
4.2. Analysis of Test Data

The least squares method was used to fit the fatigue test data. The change curve of fatigue cycle times with time is shown in Figure 8, and the fitting formula is shown in Formula (3). The change curve of fatigue cycle times with the corrosion rate is shown in Figure 8, and the fitting formula is shown in Formula (4).
N = 67854.838 + 104547.976 × 0.74 t
N = 70321.12 + 216366.4 × 0.947 η
The fatigue life change data of corroded steel strand specimens indicate that the fatigue life decreases as the service life increases. Before the service life of the steel strand reaches 8 years, number of fatigue cycles is more than 100,000 times, the steel strand has been in service for 8–13 years, and the fatigue life is maintained at 80,000–50,000 times. Subsequently, it rapidly decreases. The main reason is that the etch pits are connected by a single, long groove-type etch pit during this period, and the depth of the etch pits increases as the corrosion rate increases. The uneven distribution of etch pits gradually reduces, and large etch pits form, and the stress concentration is clearer.
According to the requirements of relevant specifications, the fatigue life of intact steel strand specimens should reach 2,000,000. The fatigue life of the corroded steel strand is significantly reduced compared with that of the intact steel strand, indicating that the local stress concentration caused by corrosion pits is significant and the local corrosion pits rapidly develop into cracks under the effect of fatigue loading, leading to fatigue fracture of the steel strand.

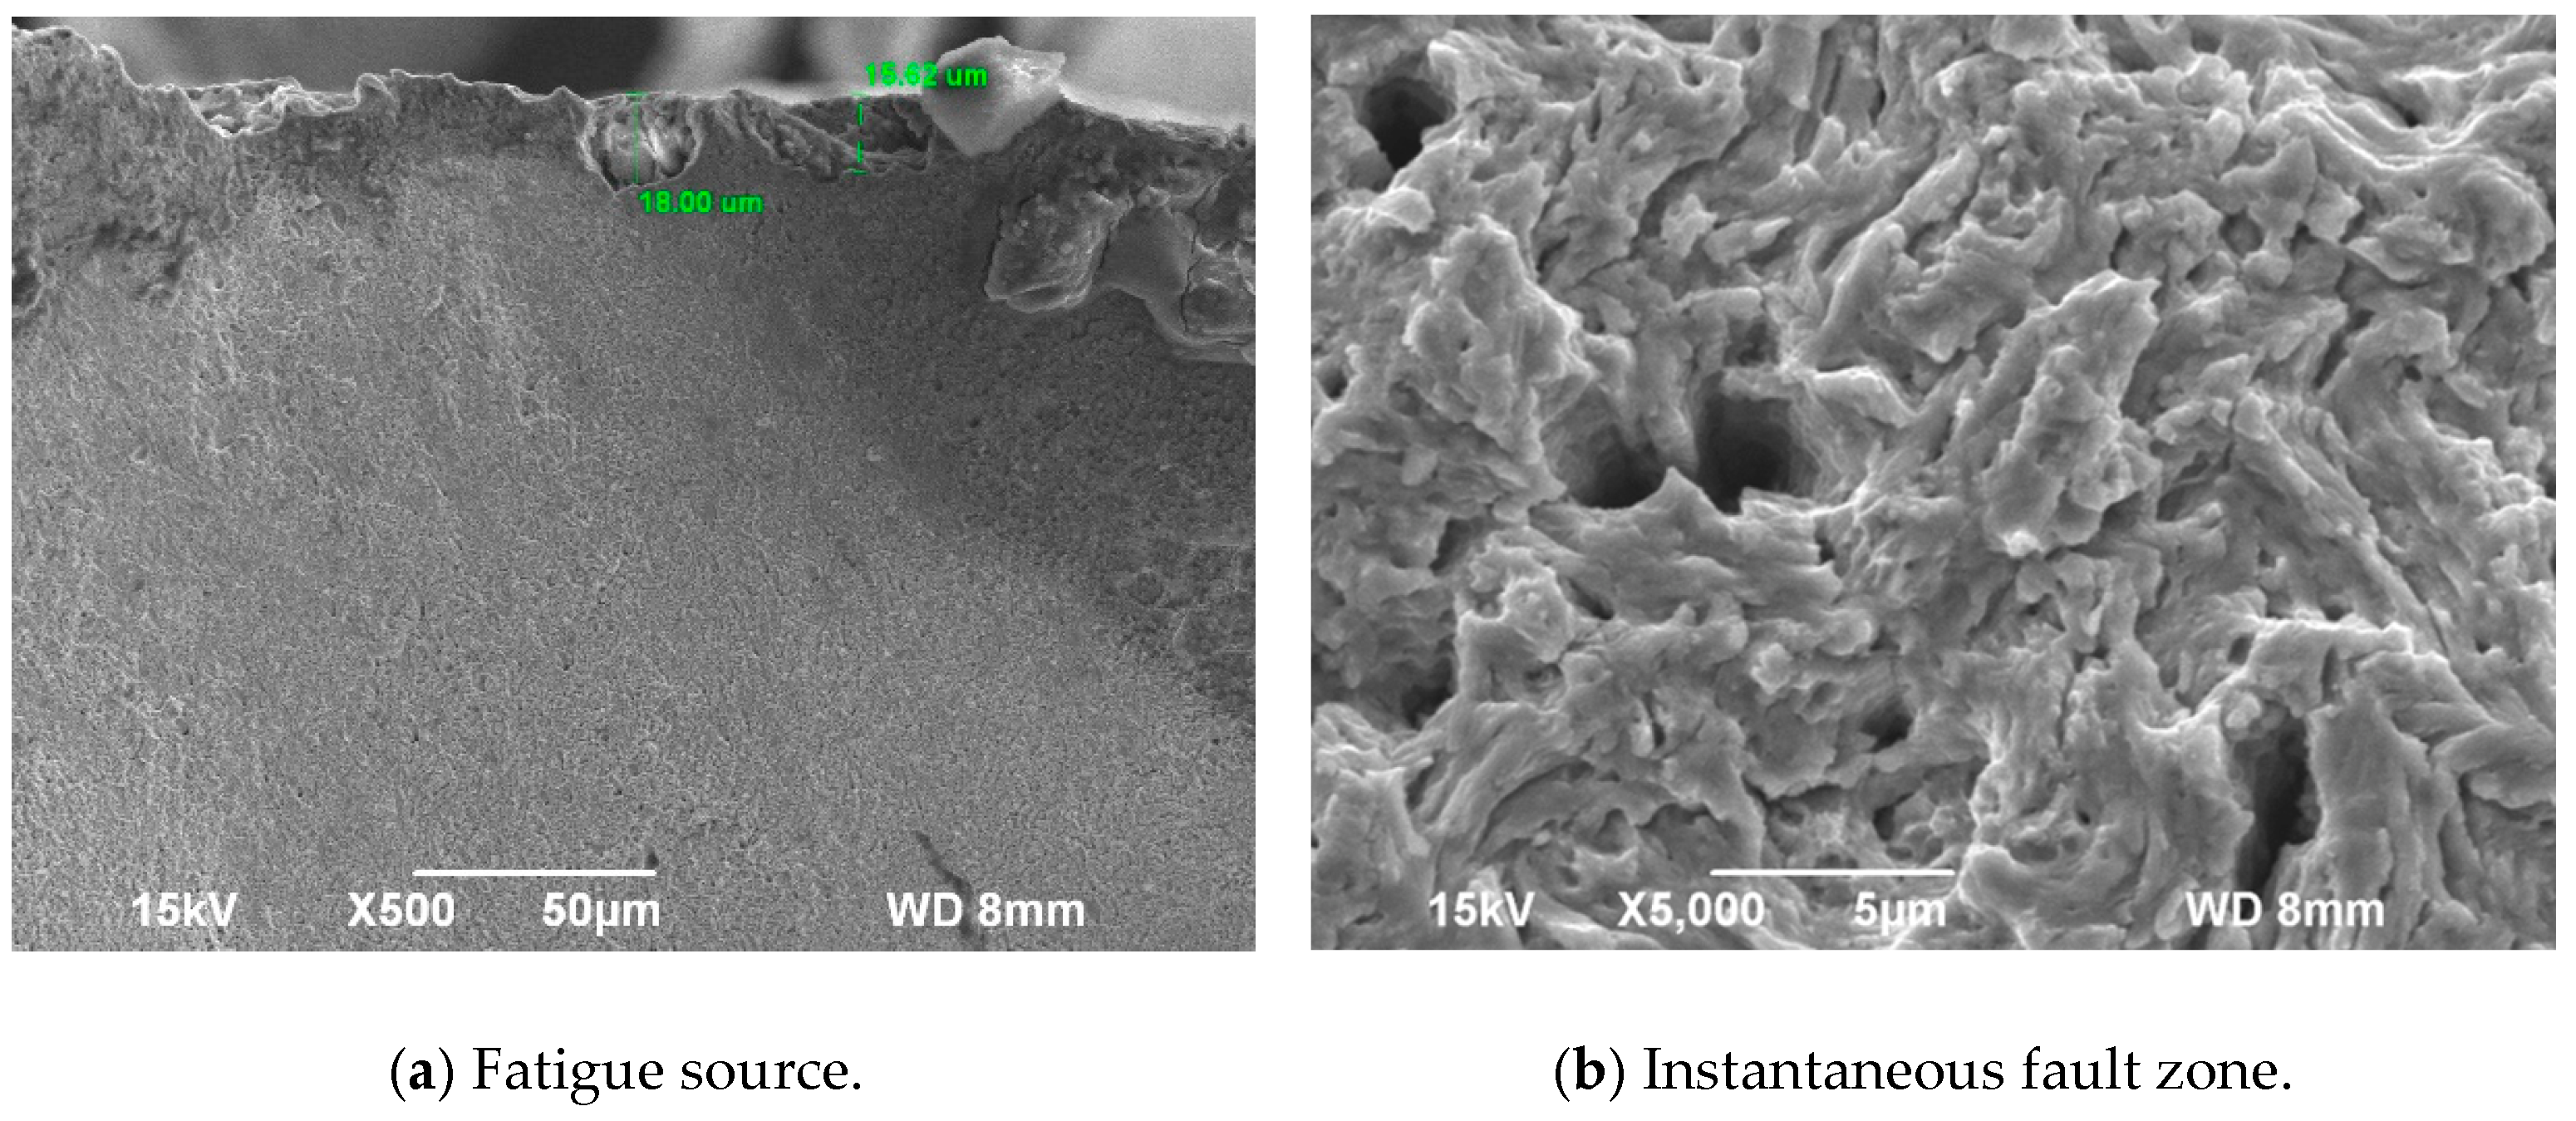
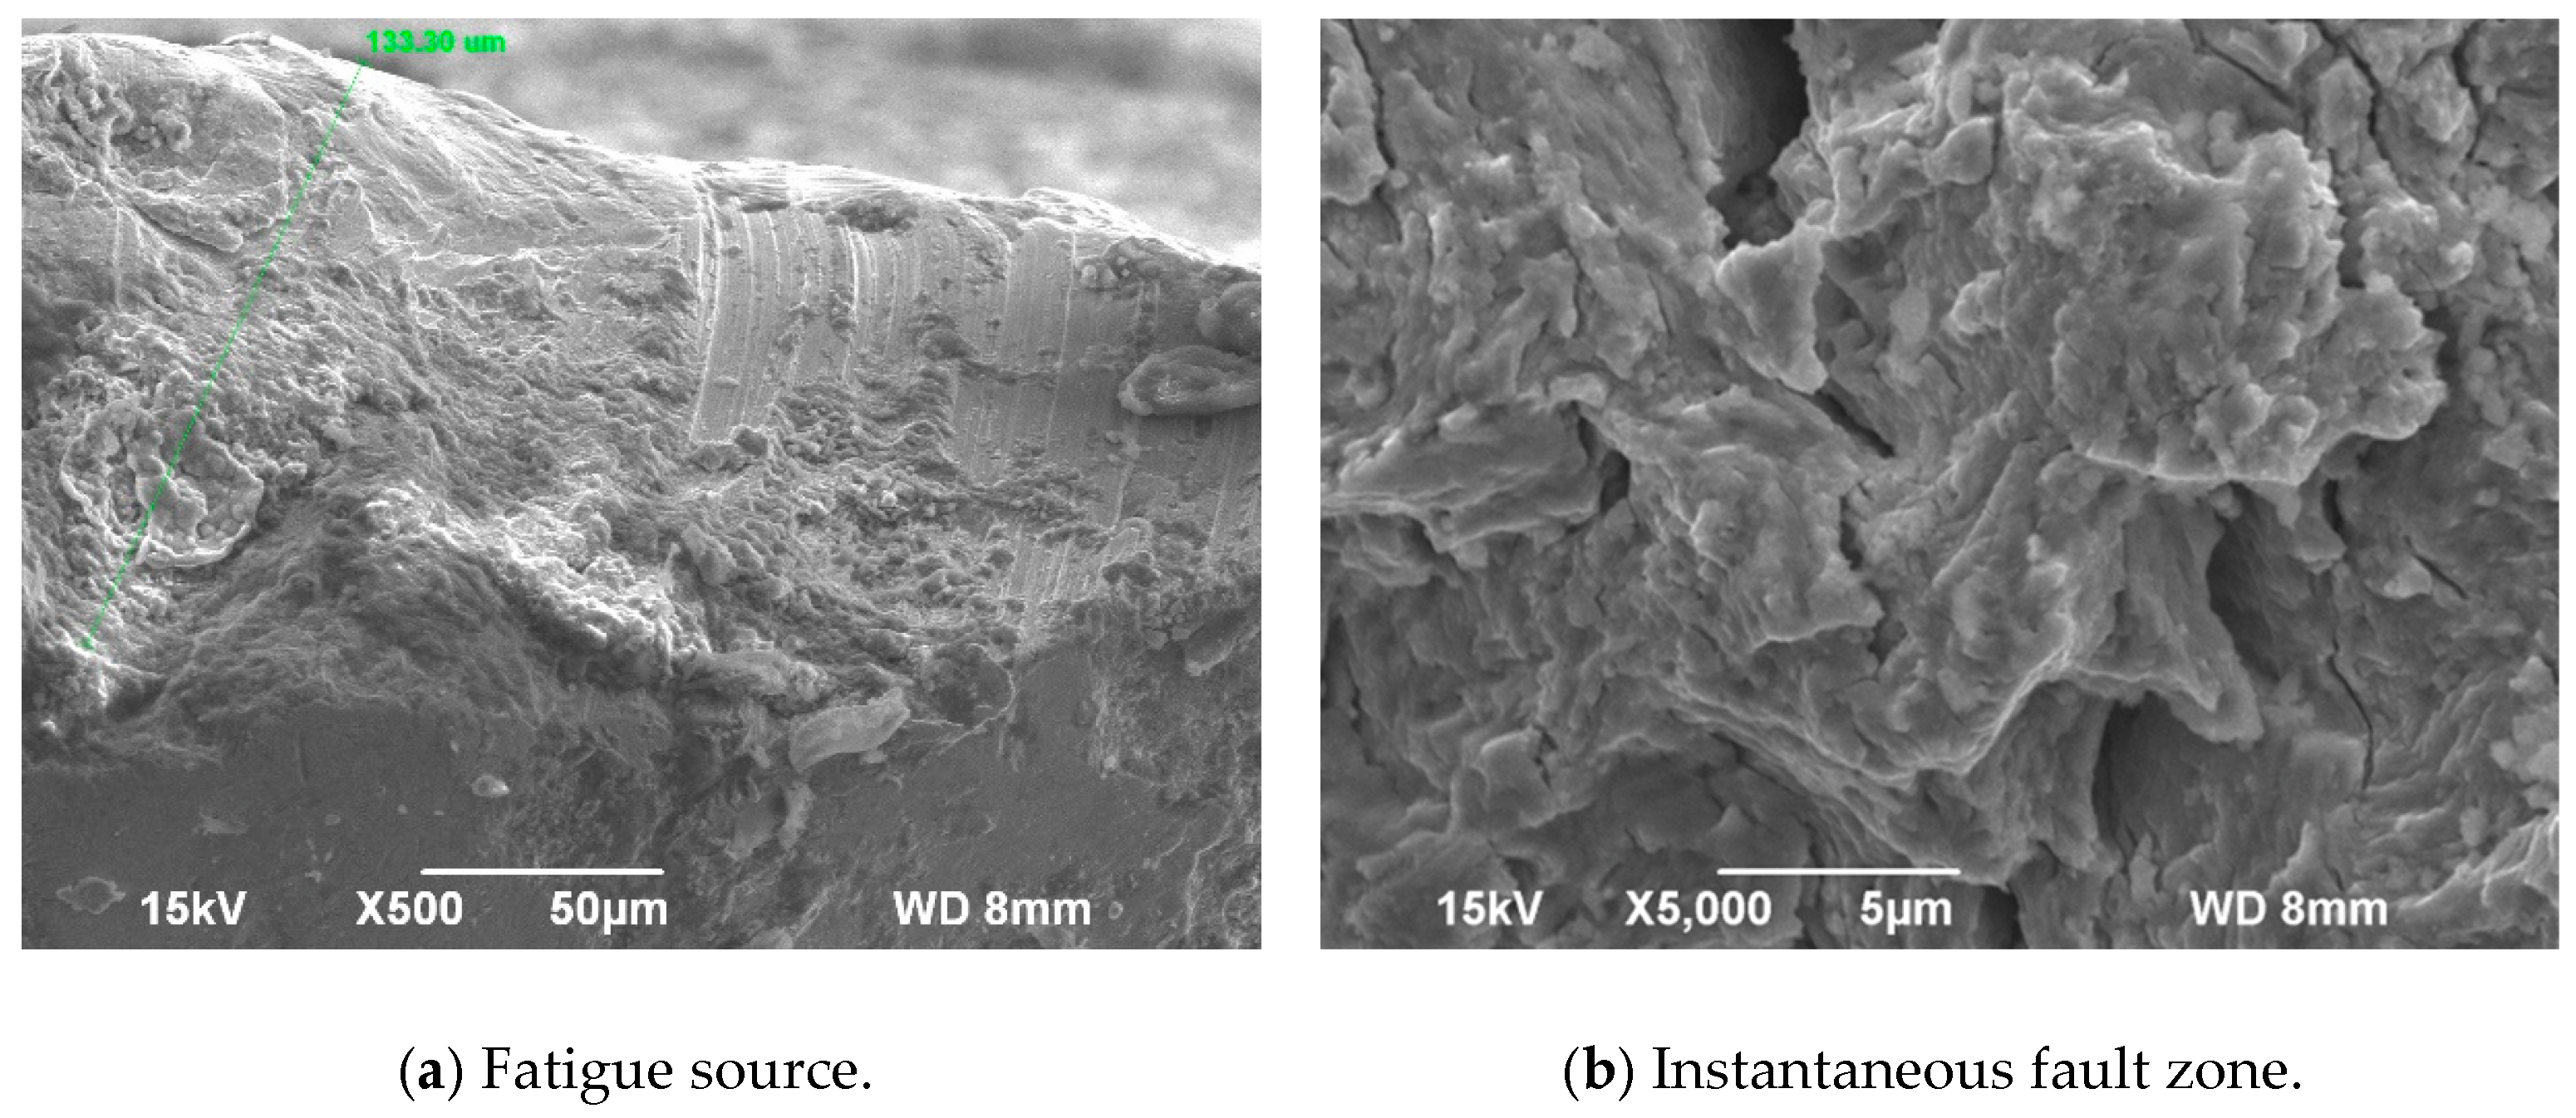
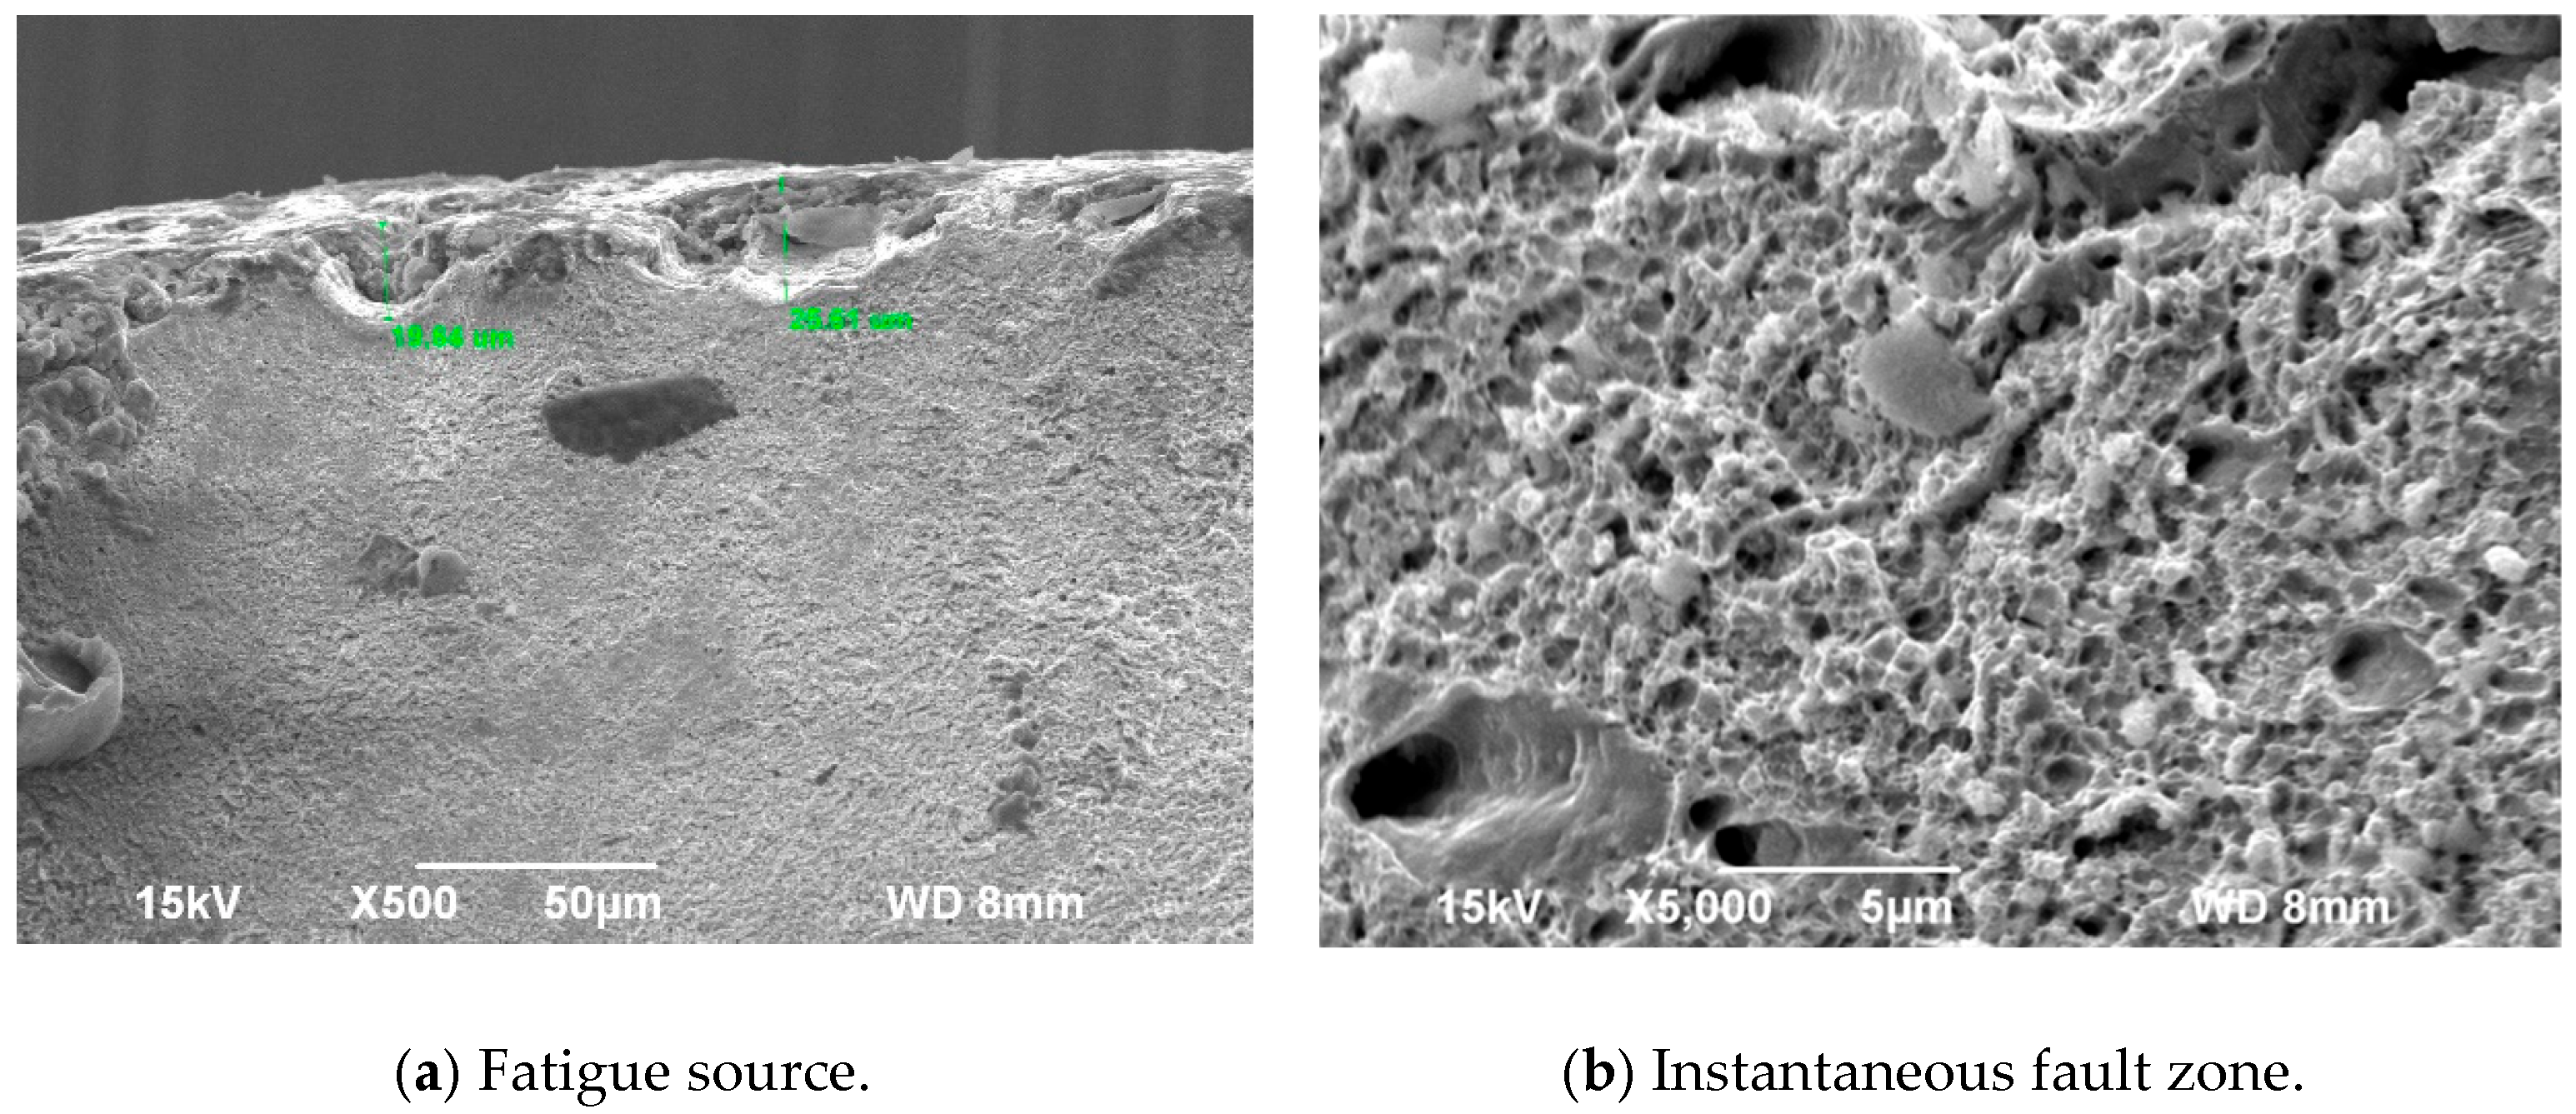
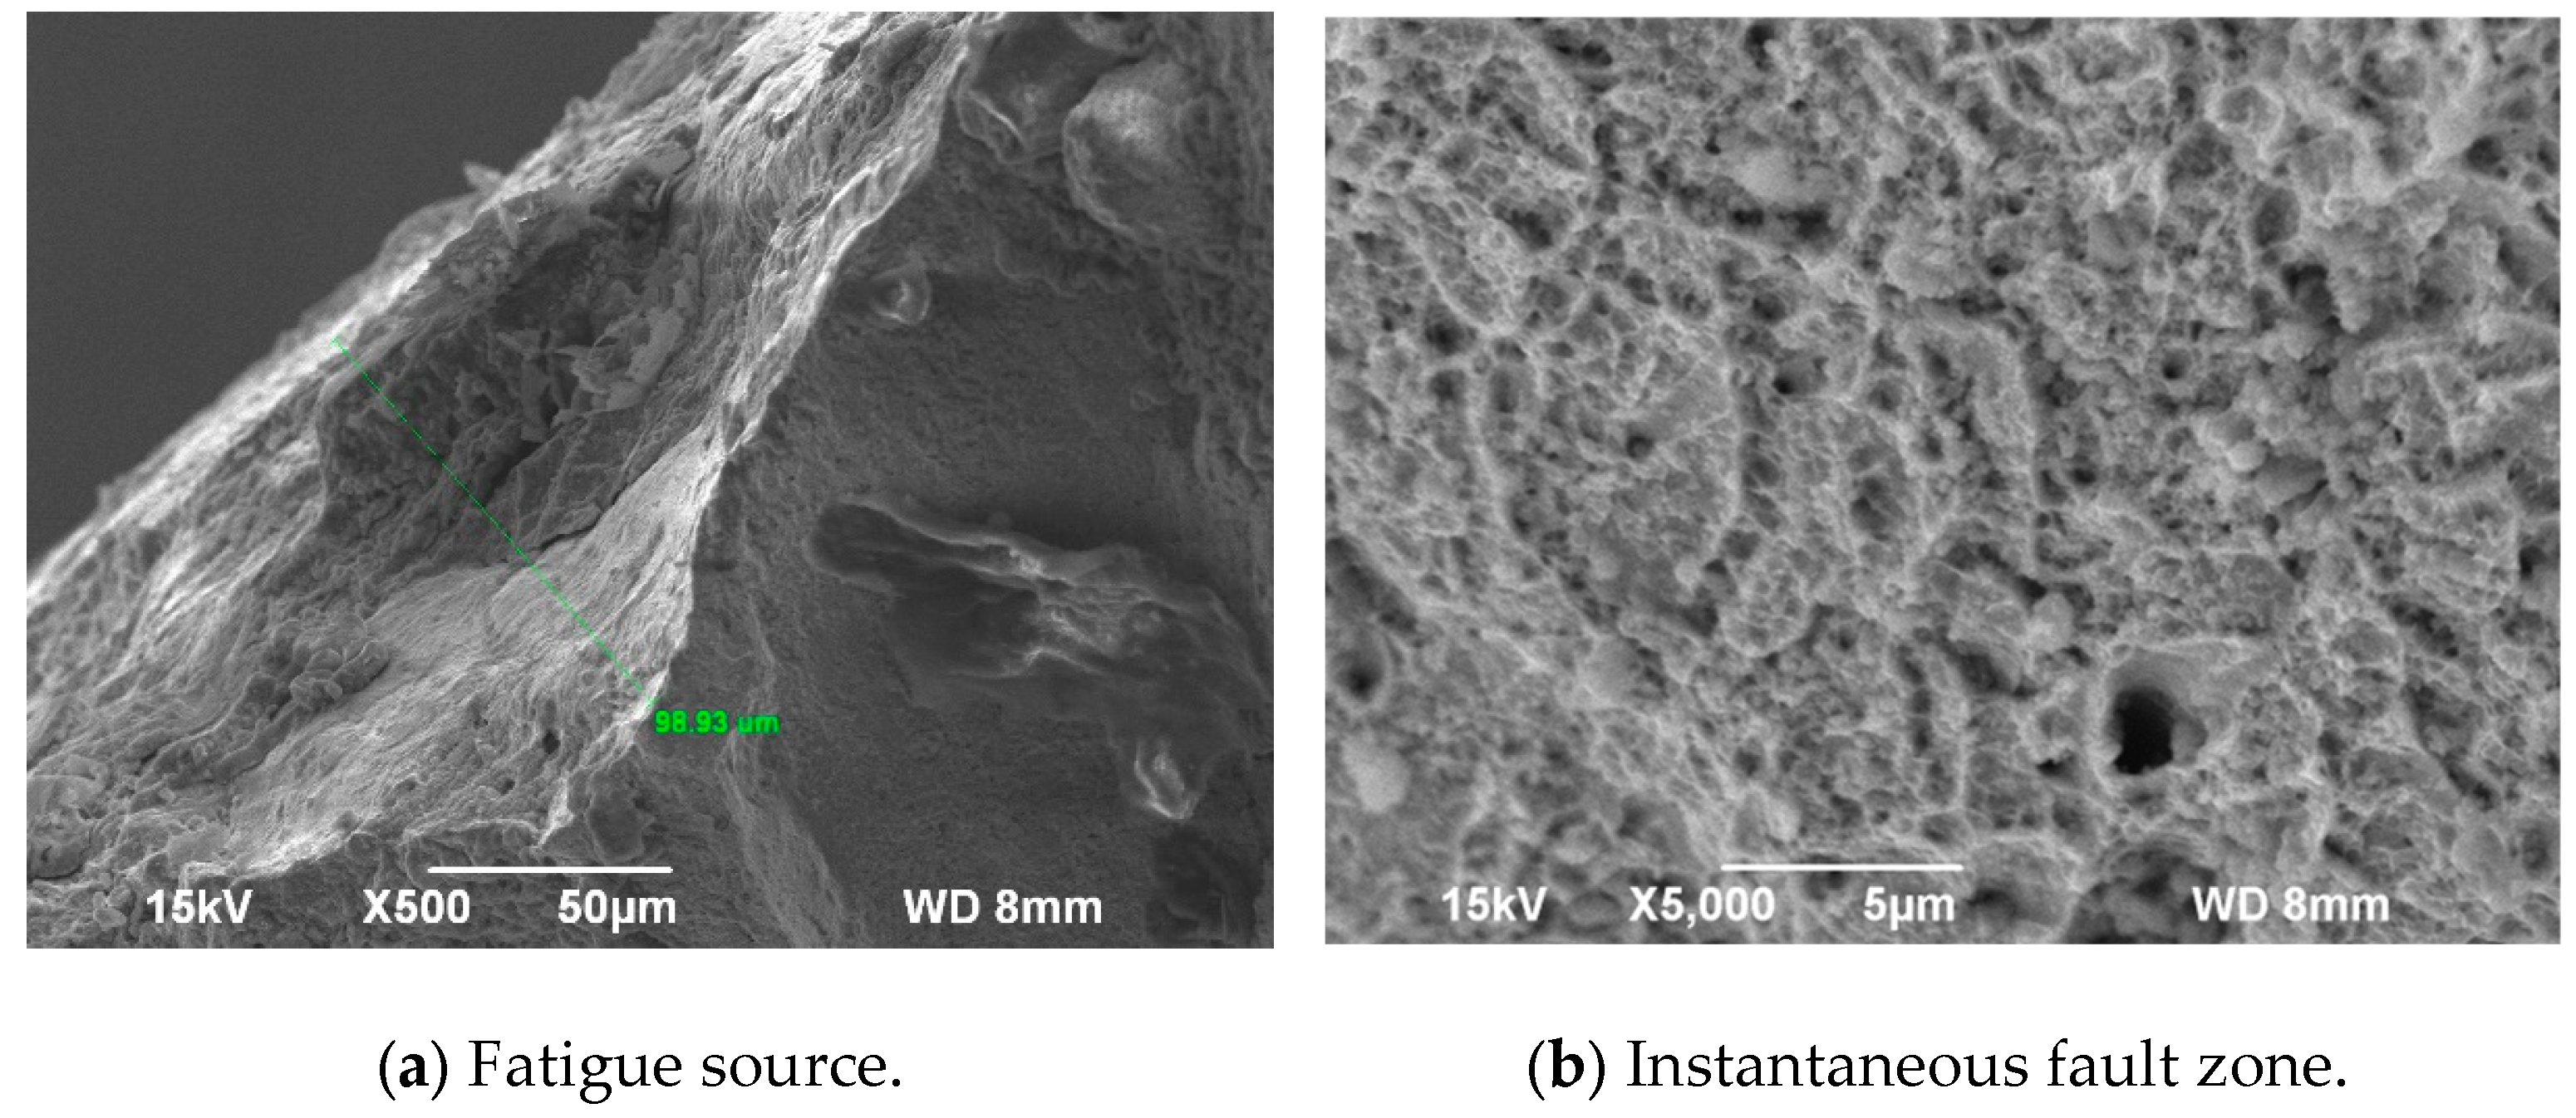
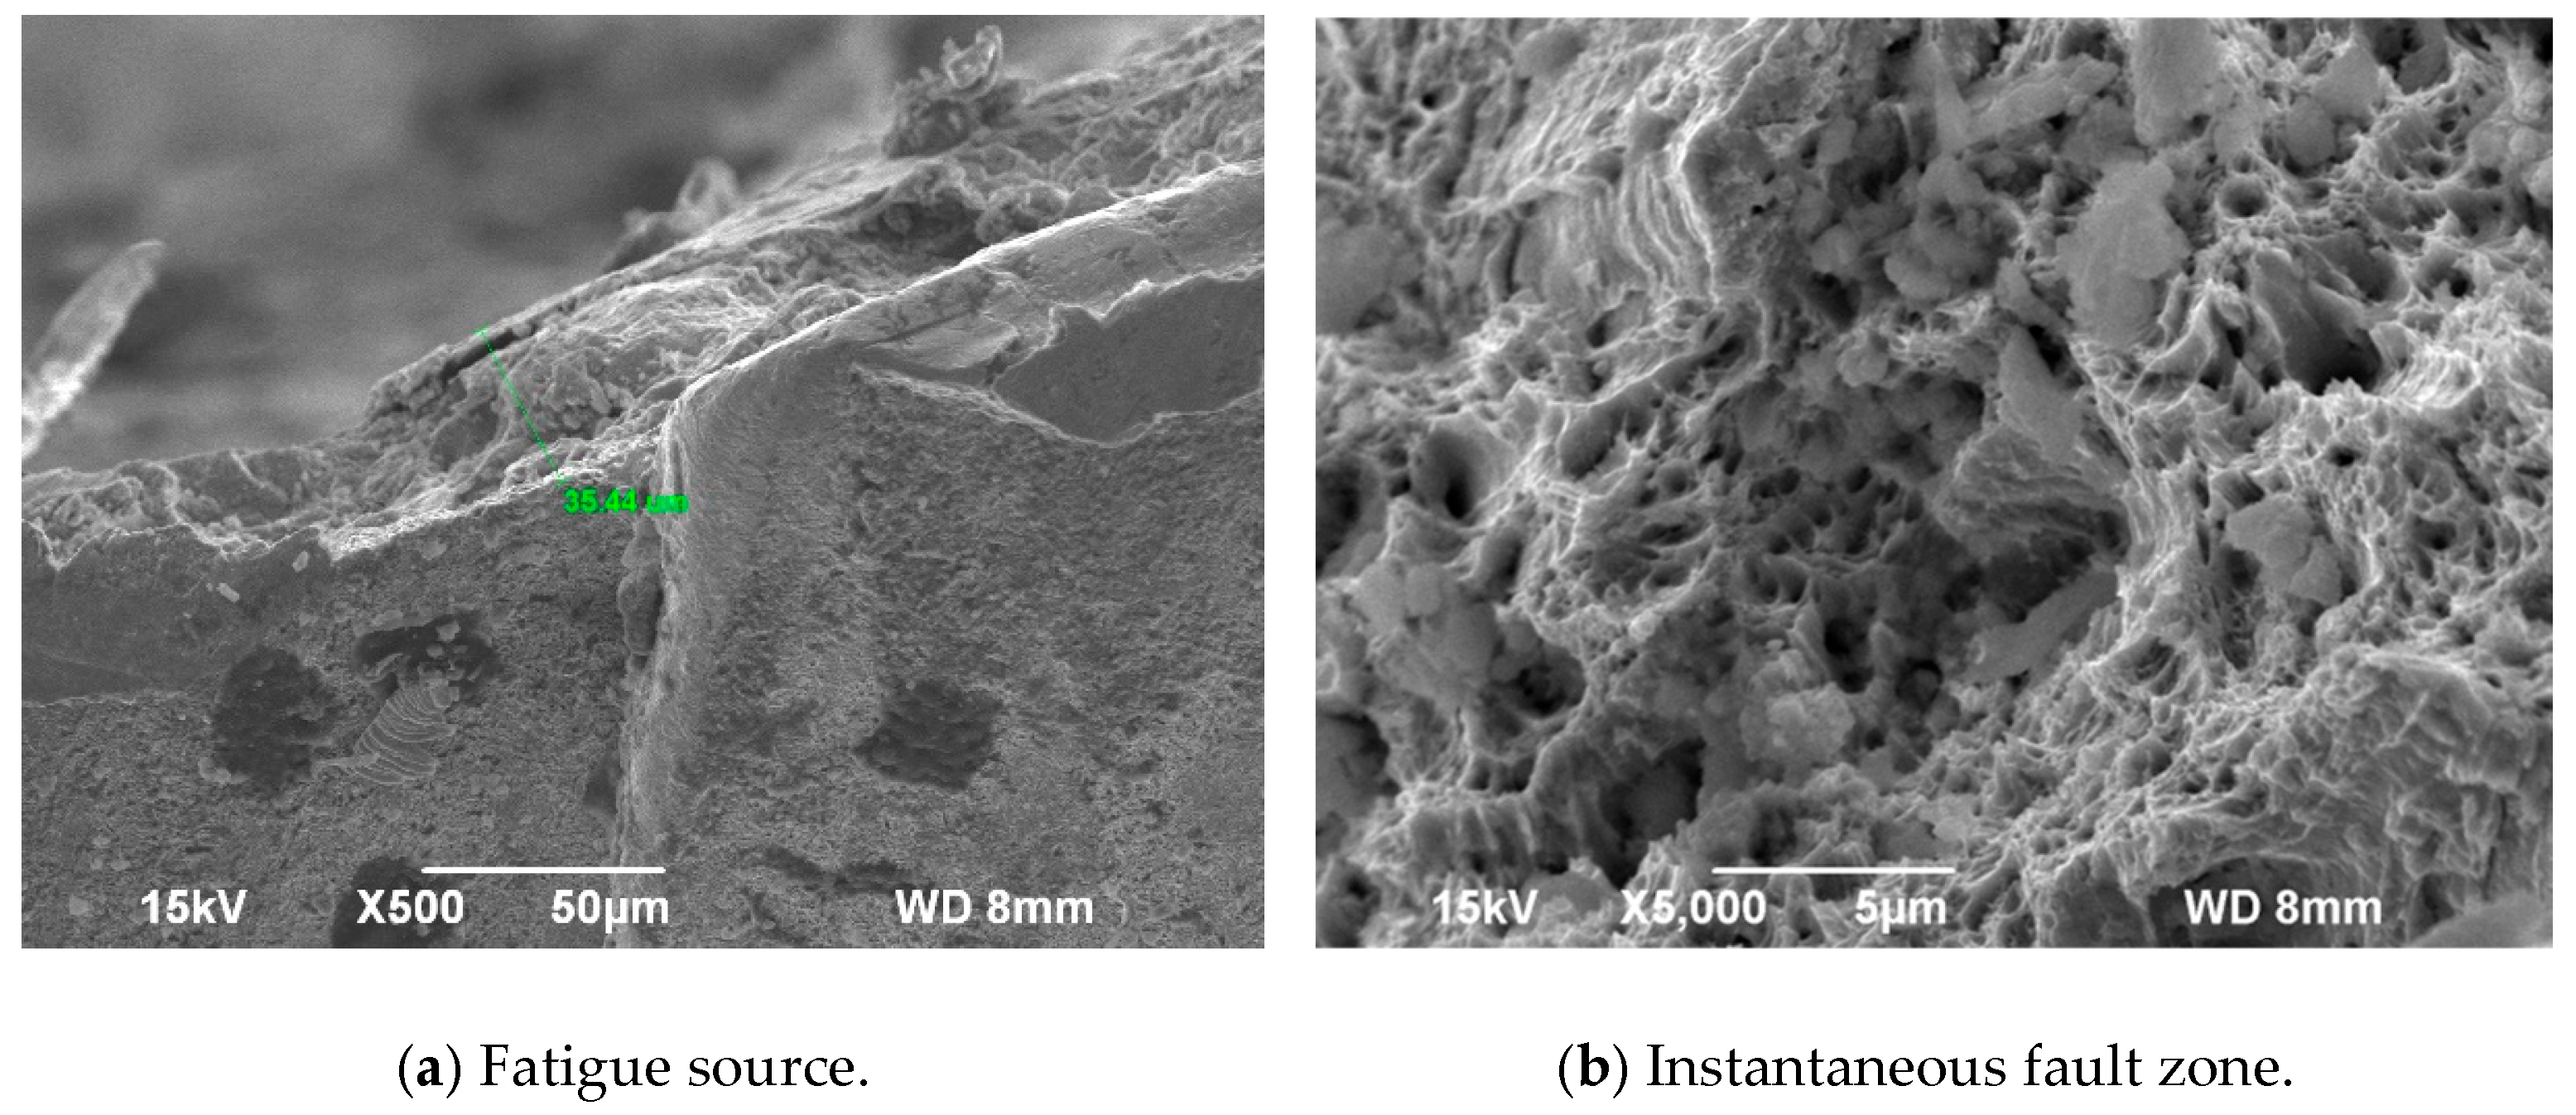
4.3. Scanning Electron Microscopy (SEM) Fracture Analysis

During the loading process of the specimen, loud noises are produced many times (steel wire is generally believed make a loud noise when it breaks). In the loading process, after the first steel wire breaks, the remaining steel wire can still maintain a certain load-bearing capacity. However, the degree of corrosion and the number of remaining fatigue lives are different. According to the test observation, after the first wire breaks, the number of remaining cycles varies from 500 to 2000, which is substantially smaller than the total number of cycles. Thus, the fatigue life depends on the fracture of the first wire.
Although many studies on the fatigue mechanism have been conducted based on the local microplasticity model [20,21], no theoretical system of fatigue mechanics is available. At present, the prevailing interpretation of the fatigue mechanism is the microlocal plasticity theory: plastic deformation occurs near the micro defects in the material due to stress concentration, which further leads to the growth and generation of micro defects, resulting in the accumulation of damage; after accumulation, local damage occurs, forming cracks at the initial stage of fatigue [22]. Therefore, the microscopic characteristics of the fatigue fracture surface of the corroded steel strand and the fatigue failure mechanism of the corroded steel strand should be analyzed.
The fatigue fracture surface of materials consists of three parts: the crack source area, the crack propagation area, and the transient fracture area [23]. Corresponding to the three parts of the fatigue fracture surface, there are three stages of fatigue failure: fatigue crack formation (initiation), fatigue crack growth, and the final fracture when the crack growth reaches the critical size. A digital SEM (JSM-6390A) was used to scan the fatigue fracture surface of the corroded steel strand, as shown in Figure 8. After being magnified 18 times by SEM, the characteristics of the fatigue fracture surface were statistically analyzed, as shown in Table 3.
Table 3 shows that the fatigue fracture morphologies of the broken wire of the corroded steel strand are similar and composed of a smooth and flat fatigue crack growth zone and a rough and step-shaped, transient fracture zone. No shell grain line is found in the fatigue growth zone of the fracture morphology. The brittleness of the material is increased, and the corroded steel strand rapidly develops after the appearance of fatigue macrocracks under the application of cyclic loads and breaks in the test. The fracture surface of the transient fracture zone is rough, and distinctive shear lips and radial fibers can be observed. The outer edge of the steel wire fracture gradually presents a concave–convex tooth shape. The more fatigue sources there are, the shorter the fatigue life is. The existence of multiple fatigue sources causes the fatigue crack growth zone to expand in different directions, making the growth occur faster and reducing the fatigue life.
The micromorphology of the fatigue source, fatigue propagation zone, and transient fracture zone of the sample fracture surface were observed by using a local scanning electron microscope, as shown in Figure 9, Figure 10, Figure 11, Figure 12 and Figure 13.
The results of the SEM indicate that on the fatigue fracture surface of each steel strand, the fatigue source is at the location of the corrosion pit; thus, the corrosion pit is the source of fatigue crack growth. The crack starts at the bottom or inner wall of the corrosion pit and expands until it becomes a smooth area, including the corrosion pit. The fatigue source etch pits have various shapes, and the surface etch pits on the steel strand have different shapes. Determining the location where the stress concentration effect is most obvious is challenging. Multiple etch pits can initiate cracks in a single area, and a single etch pit can initiate cracks in multiple areas. After the micro defects of the fatigue source were examined, the depth of the defects ranged from 15.62 to 133.3, indicating micro defects. Therefore, even if it is slightly rusted, as long as micro defects are formed on the surface of the steel strand, fatigue crack growth sources will be formed, and the probability of crack initiation at the defects will increase.
The morphology of the fatigue growth zone is flat, the pearlite lamellar transgranular fracture is visible, and individual fracture pits exist. Plastic deformation occurs during the process of crack growth, which reflects the characteristics of fatigue fracture under complex stress cases. The fatigue transient fracture zone is the area where the fatigue crack grows to a critical size. Figure 9, Figure 10, Figure 11, Figure 12 and Figure 13 reveal that the torn edge of the fatigue strip is clearly visible. The crystal is torn owing to a high level of stress, resulting in distinctive cracks. Because of the existence of many dislocations and twins, the lattice is severely distorted, and the crack cannot expand inside the crystal. Relatively large plastic deformation connected by tearing occurs at the adjacent boundaries when crack growth is present inside the crystal, with a severely distorted lattice, forming microporous polymerization dimples or torn edges. The appearance of dimples and torn edges indicates that the brittleness of the corroded steel strands gradually increases, resulting in greater plastic deformation, and ultimately, fatigue failure.

5. Conclusions

(1)
The fitting curve of the corrosion of steel strands in coastal environments is a piecewise function that can be used to predict the corrosion degree of exposed steel strands in the suspender after 15 years.
(2)
The size development of corrosion pits on the surface of steel strands has a certain relevance, but the corrosion development trend in three directions may be different at different time periods. With the increase in corrosion time, the corrosion time stops radially increasing at 8 years, and the depth and length of corrosion pits exhibit a nonlinear growth trend with time.
(3)
Fitting the fatigue life and service life of steel strands shows that the decline function of the fatigue performance with respect to the corrosion time is N = 67854.838 + 104547.976 × 0.74 t . The fitting curve for the corrosion degree is N = 70321.12 + 216366.4 × 0.947 η .
(4)
The higher the corrosion rate is, the lower the number of fatigue cycle times of the steel strand specimen is, indicating that the corrosion pit has a significant impact on the fatigue life of the steel strand. The existence of the corrosion pit will cause the fatigue life of the steel strand to drop compared with that of the intact steel strand.
(5)
The SEM results of fatigue ports show that multiple etch pits can initiate cracks in a single area, and a single etch pit can initiate cracks in multiple areas. Even if it is slightly rusted, as long as microscopic defects are formed on the surface of the steel strand, fatigue crack growth sources will be formed, and the probability of crack initiation at the defects will increase. With the gradual increase in the brittleness of the corroded steel strand, the plastic deformation increases and fatigue failure occurs.
(6)
In this study, fatigue fracturing was not analyzed by energy dispersive X-ray (EDAX), and there were no deep mechanistic studies. Therefore, the mechanism of fatigue fracture will be studied in the future.

Author Contributions

Conceptualization, W.F.; writing—original draft preparation, W.P.; writing—review and editing, W.F.; supervision, W.P. All authors have read and agreed to the published version of the manuscript.

Funding

This research was funded by the National Natural Science Foundation of China (51638013, 51820105012, 51878610, 51908496), the Natural Science Foundation of Zhejiang Province (LQ19E080012, LQ19E080011, LY20E080002), and the Natural Science Foundation of Ningbo City (2021J168, 2022S176).

Institutional Review Board Statement

Not applicable.

Informed Consent Statement

Not applicable.

Data Availability Statement

Some or all data and models that support the findings of this study are available from the corresponding author upon reasonable request.

Conflicts of Interest

The authors declare no conflict of interest.

References

  1. Li, R.; Miao, C.; Feng, Z.; Wei, T. Experimental study on the fatigue behavior of corroded steel wire. J. Constr. Steel Res. 2021, 176, 106375. [Google Scholar] [CrossRef]
  2. Li, Y.; Chen, Y.L.; Shao, W.; Zhang, J.; Liao, S.; Manuel, T.F. Service life prediction and lateral bearing capacity analysis of piles considering coupled corrosion-Temperature deterioration Processes. J. Bridge Eng. 2021, 9, 614. [Google Scholar] [CrossRef]
  3. Melchers, R.E. Long-term durability of marine reinforced concrete structures. J. Mar. Sci. Eng. 2020, 8, 290. [Google Scholar] [CrossRef] [Green Version]
  4. Yu, X.R.; Yao, G.W.; Zhong, H.; Jiang, Y.X. Corrosion Characteristics and Mechanical Properties of Steel Strands under Coupling Effect of Alternating Load and Chloride Salt Environment. J. Build. Mater. 2021, 24, 1315–1321. [Google Scholar]
  5. Yue, J.X.; Lei, J.K.; Garbatov, Y.; Yang, K. Crack growth in Ni-Cr-Mo-V steel using ΔCTOD elastic–plastic model. J. Mar. Sci. Eng. 2022, 10, 1944. [Google Scholar] [CrossRef]
  6. Ren, X.; Sherif, M.; Wei, Y.Y.; Lyu, Y.H.; Sun, Y.; Ozbulut, O. Effect of corrosion on the tensile and fatigue performance of CFRP strand Sheet/Steel double strap joints. Eng. Struct. 2022, 260, 114240. [Google Scholar] [CrossRef]
  7. Jiang, C.; Wu, C.; Cai, C.S.; Jiang, X.; Xiong, W. Corrosion fatigue analysis of stay cables under combined loads of random traffic and wind. Eng. Struct. 2020, 206, 110153. [Google Scholar] [CrossRef]
  8. Li, S.L.; Xu, Y.; Li, H.; Guan, X. Uniform and pitting corrosion modeling for high-strength bridge wires. J. Bridge Eng. 2014, 19, 04014025. [Google Scholar] [CrossRef]
  9. Jeon, C.H.; Nguyen, C.D.; Shim, C.S. Assessment of Mechanical Properties of Corroded Prestressing Strands. Appl. Sci. 2020, 10, 24055. [Google Scholar] [CrossRef]
  10. Oktavianus, Y.; Sofi, M.; Lumantarna, E.; Kusuma, G.; Duffield, C. Long-term performance of trestle bridges: Case study of an indonesian marine port structure. J. Mar. Sci. Eng. 2020, 8, 358. [Google Scholar] [CrossRef]
  11. Yu, F.; Jia, J.Q.; Yao, D.L.; Wu, F. Experimental analysis of fatigue properties of corroded prestressing strands. J. Harbin Eng. Univ. 2014, 35, 1487–1491; 1502. [Google Scholar]
  12. Nakamura, S.; Suzumura, K. Experimental study on fatigue strength of corroded bridge wires. J. Bridge Eng. 2013, 18, 200–209. [Google Scholar] [CrossRef]
  13. Kim, S.T.; Yoon, H.; Park, Y.H.; Jin, S.S.; Shin, S.; Yoon, S.M. Smart Sensing of PSC Girders Using a PC Strand with a Built-in Optical Fiber Sensor. Appl. Sci. 2021, 11, 359. [Google Scholar] [CrossRef]
  14. Li, H.; Ju, Y.; Li, D.S. Experimental and Numerical Study of the Fatigue Properties of Corroded Parallel Wire Cables. J. Bridge Eng. 2012, 17, 211–220. [Google Scholar] [CrossRef]
  15. Jeon, C.H.; Shim, C.S. flexural behavior of post-tensioned concrete beams with multiple internal corroded strands. Appl. Sci. 2020, 10, 7994. [Google Scholar] [CrossRef]
  16. Du, Y.; Sun, Y.K.; Li, G.Q. Mechanical Properties of High Tensile Steel Cables at Elevated Temperature. Eng. Mech. 2019, 40, 472–476. [Google Scholar] [CrossRef]
  17. Yu, X.R.; Yao, G.W.; Gu, L.F.; Fan, W.Q. Numerical and Experimental Study on the Steel Strands under the Coupling Effect of a Salt Spray Environment and Cyclic Loads. Materials 2020, 13, 736. [Google Scholar] [CrossRef] [Green Version]
  18. Hu, Z.W.; Jia, J.; Peng, W. Equivalent Relationship of Accelerated Corrosion of Bridge Hangers in Coastal Corrosion Environment. Bull. Sci. Technol. 2020, 36, 22–26. [Google Scholar]
  19. Li, S.L.; Zhu, S.Y.; Xu, Y.L.; Chen, Z.W.; Li, H. Long-term condition assessment of suspenders under traffic loads based on structural monitoring system: Application to the Tsing Ma Bridge. Struct. Control Health Monit. 2012, 19, 82–101. [Google Scholar] [CrossRef]
  20. Cetin, A.; Naess, A. Toward a proper statistical description of defects. Int. J. Fatigue 2012, 38, 100–107. [Google Scholar] [CrossRef]
  21. Chai, G.; Zhou, N.; Ciurea, S.; Andersson, M.; Peng, R.L. Local plasticity exhaustion in a very high cycle fatigue regime. Scr. Mater. 2012, 66, 769–772. [Google Scholar] [CrossRef]
  22. Xu, J.Q. Mechanics of Fatigue; China Science Publishing: Beijing, China, 2017. [Google Scholar]
  23. Liu, X.L.; Zhang, Z.; Tao, C.H. Fatigue Fractography Quantitative Analysis; National Defense Industry Press: Beijing, China, 2010. [Google Scholar]
Figure 1. Variation curve of average mass corrosion ratio with time.
Jmse 11 00665 g001
Figure 2. Variation curve of average mass corrosion rate with time.
Jmse 11 00665 g002
Figure 3. Time-varying fitting curve of corrosion pit length.
Jmse 11 00665 g003
Figure 4. Time-varying fitting curve of the corrosion pit width.
Jmse 11 00665 g004
Figure 5. Time-varying fitting curve of corrosion pit depth.
Jmse 11 00665 g005
Figure 6. Fatigue test equipment for rusted steel strand.
Jmse 11 00665 g006
Figure 7. Assembly diagram of steel strand and clamp for fatigue test.
Jmse 11 00665 g007
Figure 8. Curve of fatigue cycle numbers with time(t)/corrosion rate (η).
Jmse 11 00665 g008
Figure 9. GJX12m fatigue fracture morphology.
Jmse 11 00665 g009
Figure 10. GJX18m fatigue fracture morphology.
Jmse 11 00665 g010
Figure 11. GJX2y fatigue fracture morphology.
Jmse 11 00665 g011
Figure 12. GJX3y fatigue fracture morphology.
Jmse 11 00665 g012
Figure 13. GJX6y fatigue fracture morphology.
Jmse 11 00665 g013
Table 1. Specific information about samples.
No.BatchExperiment Times/YearsNumber of Test Samples
1GJX1m1/123
2GJX3m3/123
3GJX6m6/123
4GJX9m9/123
5GJX1y13
6GJX18m1.53
7GJX2y23
8GJX3y33
9GJX4y43
10GJX5y53
11GJX6y63
12GJX7y73
13GJX8y86
14GJX9y96
15GJX10y106
16GJX11y116
17GJX12y126
18GJX13y136
19GJX14y146
Table 2. Corrosion of unstressed steel strands at different corrosion times.
Jmse 11 00665 i001Jmse 11 00665 i002Jmse 11 00665 i003Jmse 11 00665 i004Jmse 11 00665 i005
Before rustingGJX1mGJX3mGJX6mGJX9m
Jmse 11 00665 i006Jmse 11 00665 i007Jmse 11 00665 i008Jmse 11 00665 i009Jmse 11 00665 i010
GJX1y GJX18mGJX2yGJX3yGJX4y
Table 3. Analysis of fatigue fracture characteristics of rusted steel strands.
Fatigue FractureCharacterization
Jmse 11 00665 i011This fracture is formed after the outer steel wire breaks off from the non-clamped section. It belongs to the multi-step fatigue fracture with multiple fatigue sources. Three main fatigue crack growth areas can be observed. The middle transient fracture area is stepped and surrounded by three main fatigue growth areas.
Jmse 11 00665 i012The fracture is formed after the fracture of the outer steel wire in the clamping section, which belongs to the step fracture with multiple fatigue sources. It is divided into primary and secondary fatigue crack growth zones. The middle transient fracture zone is stepped, and the two growth zones are on both sides of the transient fracture zone and do not intersect.
Jmse 11 00665 i013The fracture is formed after the fracture of the outer steel wire in the non-clamped section, which belongs to the step fracture with multiple fatigue sources. There is a large defect and the main fatigue growth zone, and there are still many small defects around them. The transient fault zone has steps, and their distribution is relatively disordered and irregular.
Jmse 11 00665 i014This fracture is formed when the central steel wire of the steel strand first breaks. It is a stepped fracture with multiple fatigue sources. The apparent main fatigue crack propagation zone can be seen. The transient fracture zone is in the middle of the section and is in the form of steps.
Jmse 11 00665 i015This fracture is caused by the fracture of the non-clamped section of the outer steel wire, which belongs to the step-type fracture with multiple fatigue sources. There are multiple fatigue growth zones, but finally, they converge into a main crack growth zone. The transient fracture zone has a step shape, and the fatigue source is apparent.
Disclaimer/Publisher’s Note: The statements, opinions and data contained in all publications are solely those of the individual author(s) and contributor(s) and not of MDPI and/or the editor(s). MDPI and/or the editor(s) disclaim responsibility for any injury to people or property resulting from any ideas, methods, instructions or products referred to in the content.

