Article

Numerical Analysis of Flow Characteristics in Impeller-Guide Vane Hydraulic Coupling Zone of an Axial-Flow Pump as Turbine Device

1
College of Hydraulic Science and Engineering, Yangzhou University, Yangzhou 225009, China
2
Jiangxi Research Center on Hydraulic Structures, Jiangxi Academy of Water Science and Engineering, Nanchang 330029, China
3
Water Resources Research Institute of Jiangsu Province, Nanjing 210017, China
4
Jiangsu Aerospace Hydraulic Equipments Co., Ltd., Yangzhou 225600, China
5
College of Civil Engineering, Tongji University, Shanghai 200092, China
*
Author to whom correspondence should be addressed.
J. Mar. Sci. Eng. 2023, 11(3), 661; https://doi.org/10.3390/jmse11030661
Submission received: 5 February 2023 / Revised: 18 March 2023 / Accepted: 19 March 2023 / Published: 21 March 2023
(This article belongs to the Section Ocean Engineering)

Abstract

:
An axial-flow pump as a turbine (PAT), as compared to the conventional Francis turbine, has the advantages of not being restricted by the terrain and having lower cost to reverse the pump as a turbine for power generation. When an axial-flow pump is reversed as a turbine, the internal flow pattern is more complicated than when in the pump mode, which can cause instability in the whole system and result in degradation of the hydraulic performance and structural vibration. The impeller and guide vane are the core of the axial-flow PAT unit. This research compares the experimental and numerical simulation results in order to verify the energy performance and pressure pulsation signal of the axial-flow PAT. The unsteady flow regime, fluid force, and pressure pulsation characteristics of the impeller-guide vane hydraulic coupling zone are analyzed in detail. The findings demonstrate that both the dominant frequency of the fluid force pulsation signal and the flow field pressure pulsation signal appear at 3 times of the rotation frequency. The blade passing frequency (BPF) of the impeller is the dominant frequency, and other frequency components are also dominated by the harmonic frequency of the BPF. The impeller and guide vane are primarily subject to radial fluid force. Under partial working conditions, the pressure pulsation intensity in the flow field greatly increases, and the pressure pulsation amplitude at the guide vane outlet and impeller outlet appears to be more sensitive to the flow rate change.

1. Introduction

With the intensification of environmental pollution and the frequent occurrence of climate extremes in recent years, the world has reached a consensus on the topic of the sustainable development of renewable energy. People have realized the importance of reducing environmental pollution and alleviating the energy crisis [1]. In China, the share of fossil energy generation is decreasing, while the share of clean energy is increasing year by year [2]. Thanks to the abundant hydro energy resources, hydroelectric power generation has become the main source of clean energy. In plain areas, axial-flow PATs have good application scenarios, both for lifting water for irrigation during dry periods and for hydroelectric power generation when water is plentiful.
Axial-flow pumps, when operating in turbine mode, have a changed hydraulic mode and different internal flow characteristics from pumping conditions [3]. The internal complex unsteady flow phenomenon is significant [4,5,6], with the three-dimensional unsteady flow in the impeller and guide vane region being the most prominent [7]. The axial-flow PAT device’s performance and stability is significantly impacted by the unstable flow. Scholars [8,9] have done a lot of work on the performance prediction and flow field analysis of PATs through model tests, numerical simulations, and theoretical analysis. In the review of performance prediction and flow stability of PATs, Binama et al. [10] focused on the effects of the PAT’s S-shape and saddle-type properties. Wang et al. [11] designed an impeller with forward-curved blades, and both numerical simulation and model test results indicate that the performance of PATs have been improved. Chen [12] simulated the three-dimensional unsteady flow of a prototype PAT during transient start-up under no-load conditions by computational fluid dynamics and analyzed the transient flow rate, head, and torque. Su et al. [13], firstly, focused on the internal flow characteristics of a typical centrifugal PAT in order to reveal the periodic pattern of flow rate distribution combined with experimental validation to analyze the time-varying flow variation in the volute and rotor passage. Pugliese et al. [14] evaluated the performance of a centrifugal horizontal single-stage pump and a vertical multistage pump in reverse operation by means of model tests. Adjustable guide vanes were designed by Qian et al. [15] for an axial-flow PAT, and they demonstrated that partial load considerably increased the efficiency of the device. Han et al. [16] applied dynamic mode decomposition to decompose and reconstruct the tip leakage vortex in a PAT in turbine mode, and the evolution pattern and frequency characteristics of the leakage vortex was found.
In PATs, the impeller and guide vane are the main regions where unsteady flow occurs, accompanied by complex flow patterns and violent rotor–stator interaction phenomena [17,18], which have attracted the attention of scholars. Zhang et al. [19] applied particle image velocimetry (PIV) to investigate the flow field features of impeller and the guide vane interference area in an axial-flow pump. He found that the trailing vortex and flow separation at the blade trailing edge affect the flow velocity variation in the region and, thus, disrupt the flow field continuity. Through experiments and numerical simulations, Al-Obaidi et al. [20] examined the impact of the number of guide vanes on the flow field and performance of an axial-flow pump and concluded that the device’s performance could be enhanced by appropriately increasing the number of guide vanes. Rotor–stator interaction between the impeller blades and guide vanes can cause flow field and pressure pulsations [21,22], which may be the main cause of structural vibrations and fatigue damage [23]. Periodic fluctuations of the fluid can exert fluid forces on the flow structures [24]. Intense fluid forces can lead to severe vibrations in the shaft system [25], and flow conduits, impeller, and bearing failures [26] seriously threaten the operational stability of the whole system. Santolaria Morros et al. [27] studied the flow state and energy performance of a centrifugal PAT at different flow rates and analyzed the axial and radial forces in the impeller. It was found that these stresses may be strongly dynamically loaded when operating beyond the nominal intervals, causing the risk of fatigue failure of the mechanical components. Li et al. [28] conducted numerical simulations of a PAT at six different guide vane openings in order to study the rotor–stator interaction effects and found that the dominant frequency in the vaneless zone at the optimum guide vane opening was blade passing frequency and the harmonic frequency. The hydraulic performance of the flow structure of a PAT was examined by Xiao et al. [29] in order to determine the impact of misaligned guide vanes with various openings on the dominant frequency characteristics of pressure pulsation. They discovered that misaligned guide vanes can lessen the amplitude of pressure pulsation in flow channels other than the impeller. Combining the pressure pulsation signals obtained from experiments and numerical simulations, Zhang et al. [30] analyzed the pressure characteristics of a centrifugal PAT in pump mode and found that the rotor–stator interaction produced the largest pressure pulsation at the tongue of volute.
The aforementioned scholars have focused on the performance prediction, flow analysis, and pressure pulsation features of PATs. However, the relationship between flow field, pressure pulsations, and fluid forces of the impeller-guide vane hydraulic coupling zone in an axial-flow PAT is still not sufficiently revealed. This paper analyzes the unsteady flow and pressure pulsation characteristics in the impeller and guide vane region through experiments and numerical simulations. In the hydraulic coupling zone between the impeller and guide vane, the influence of the rotor–stator interaction effects on the flow field, pressure fluctuation, and fluid force characteristics are explored, as well as the relationship between them.

2. Numerical Simulation Methods

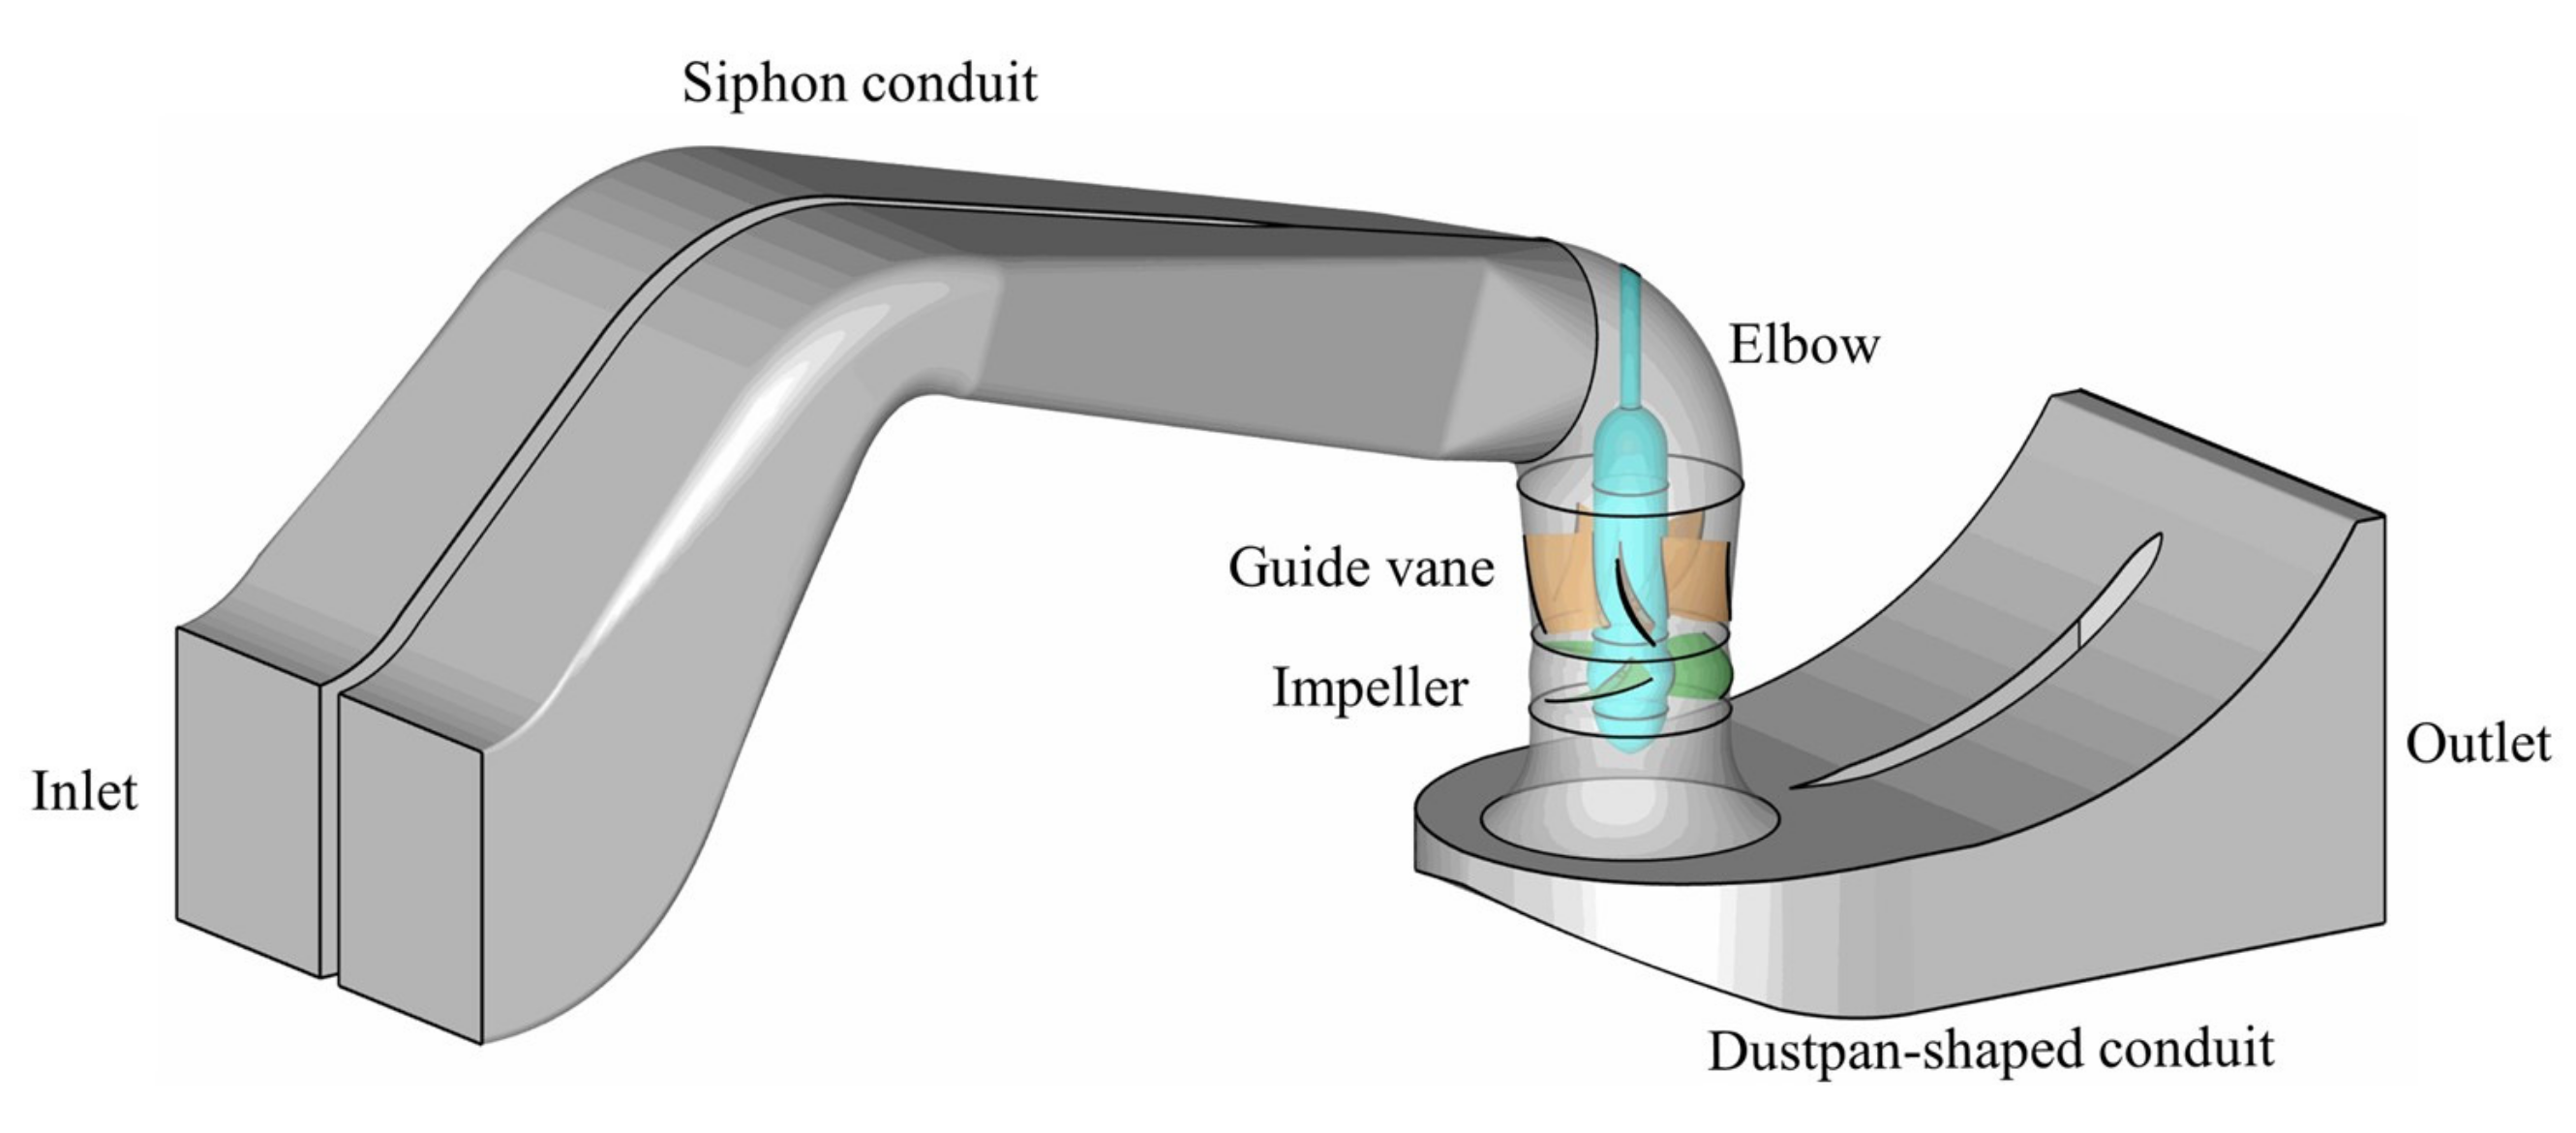
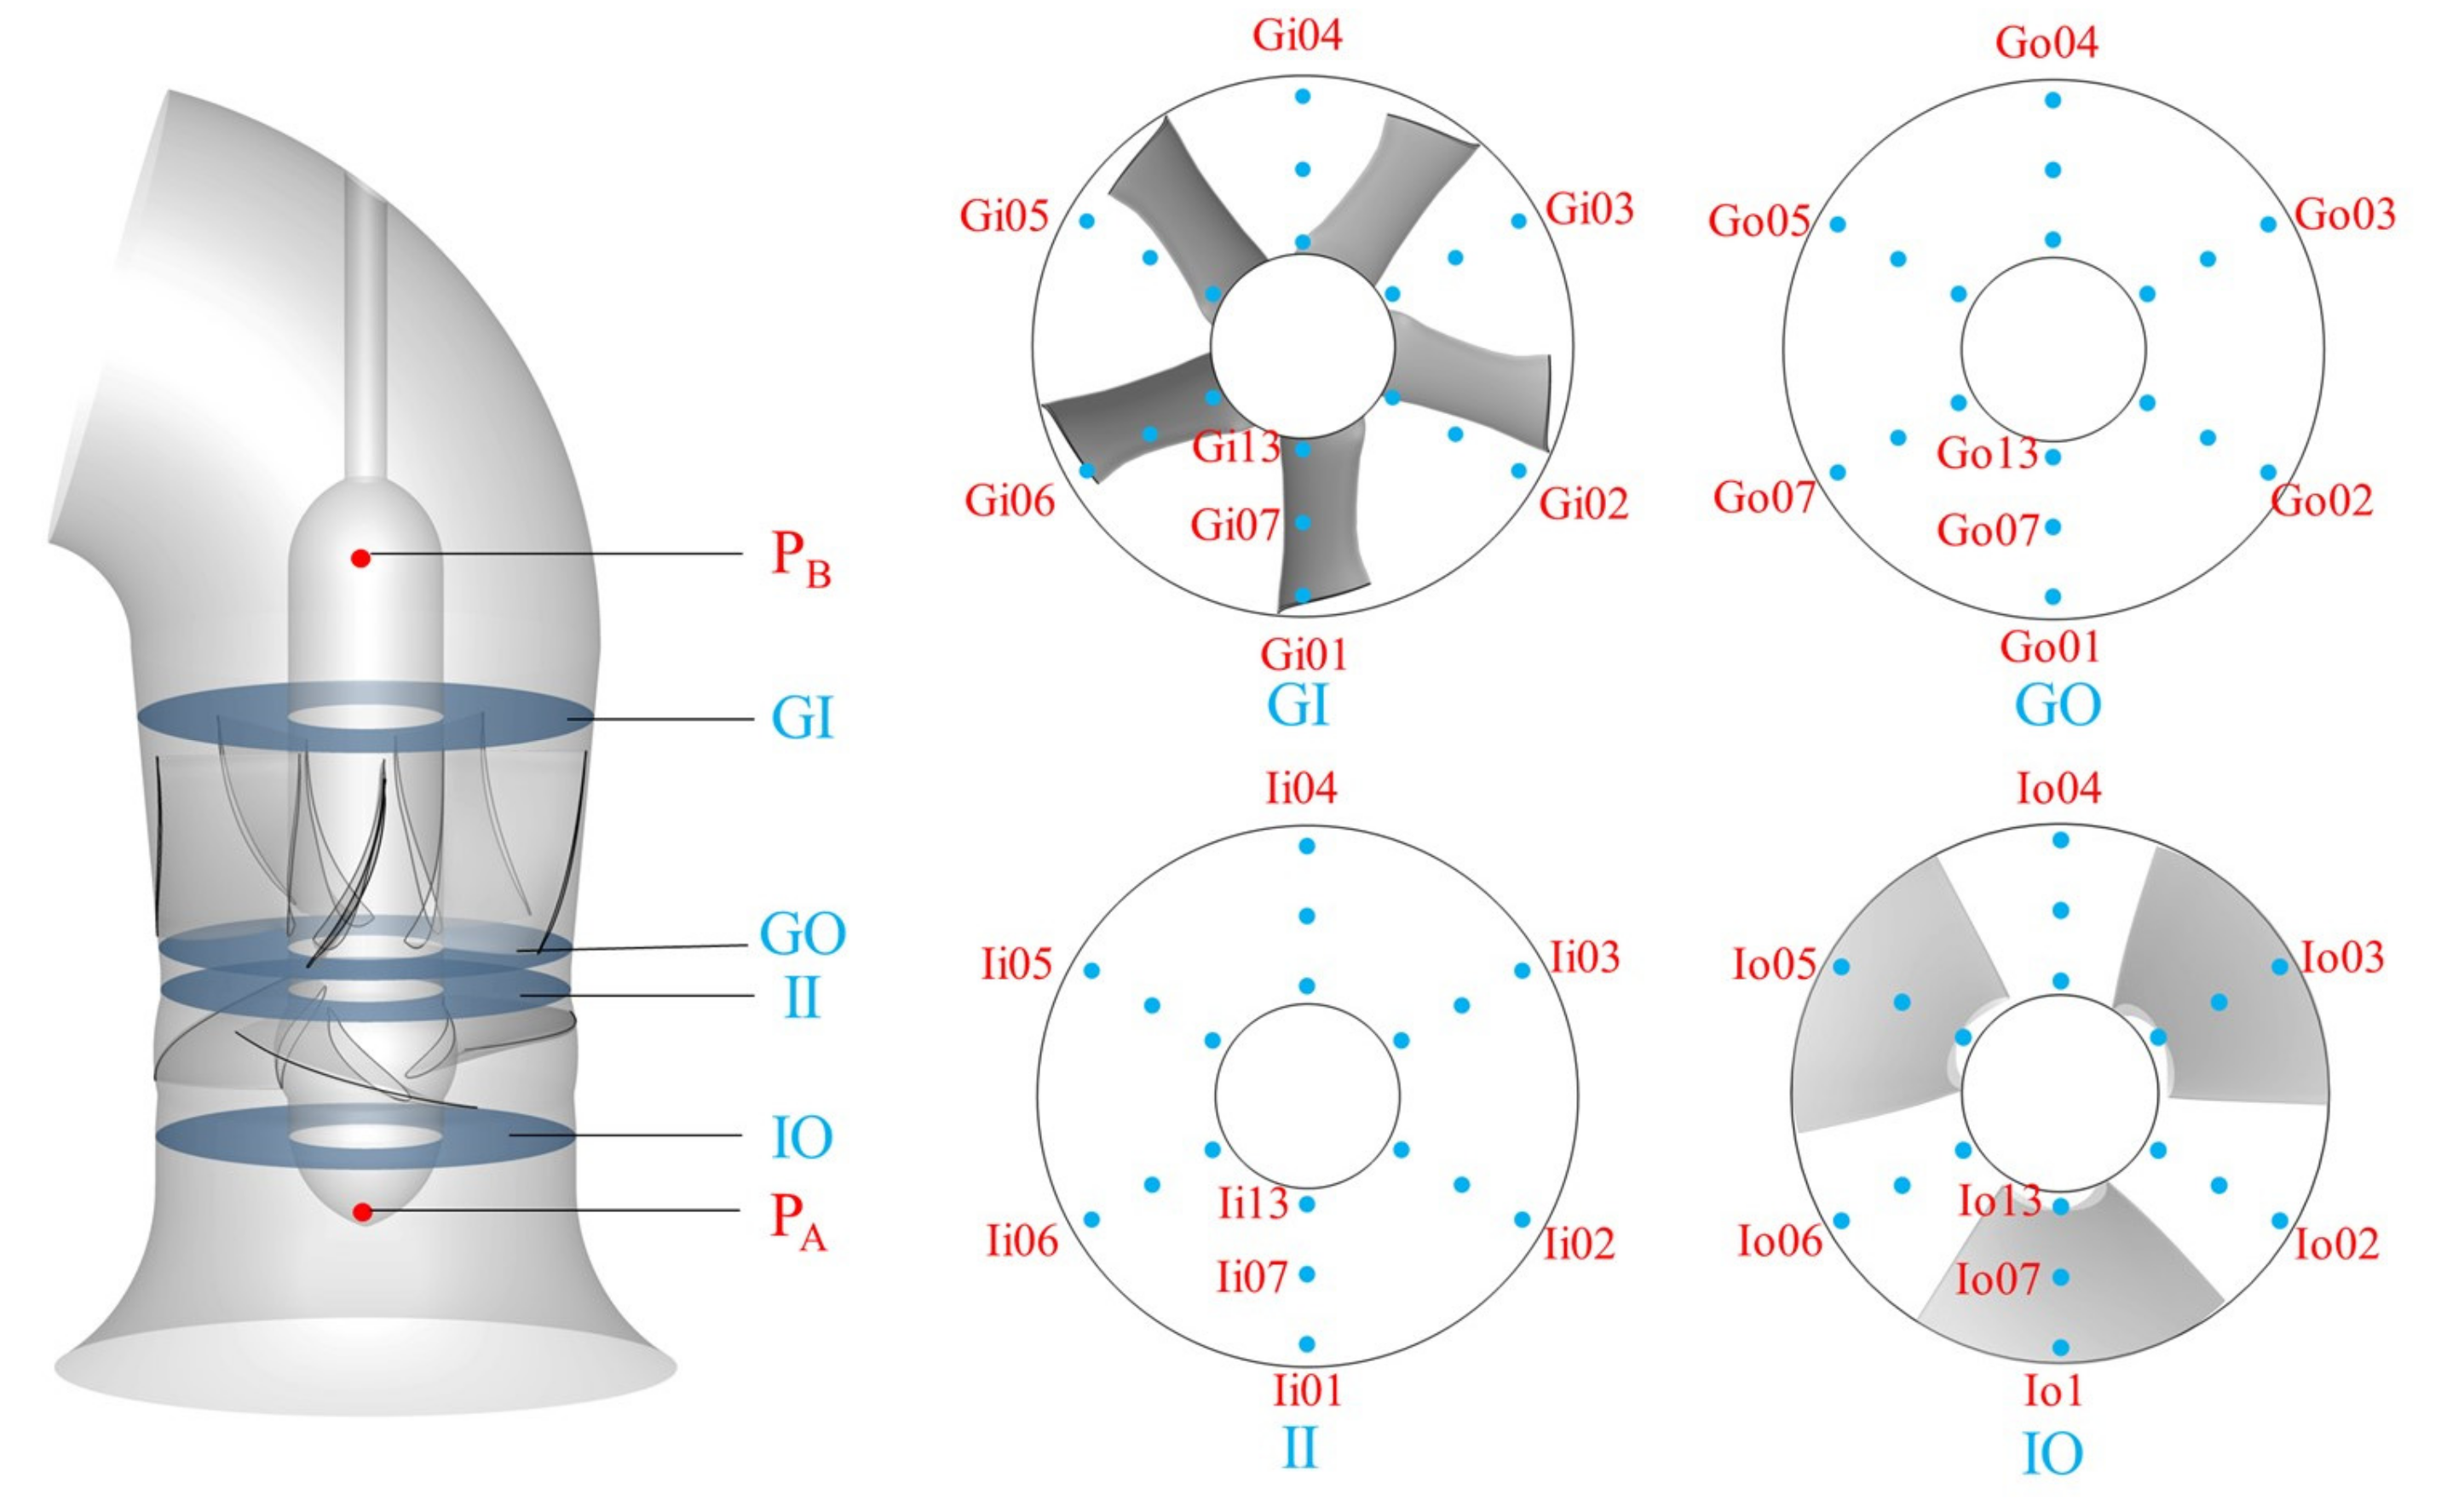
2.1. Geometric Model

The model in this paper is a vertical axial-flow PAT device. The whole device consists of a siphon conduit, a 75-degree elbow, a guide vane body, an impeller, and a dustpan-shaped conduit connected in sequence, as displayed in Figure 1. Each part of the vertical axial-flow PAT device was modeled using UG NX. The detailed dimensions of the model are shown in Table 1.

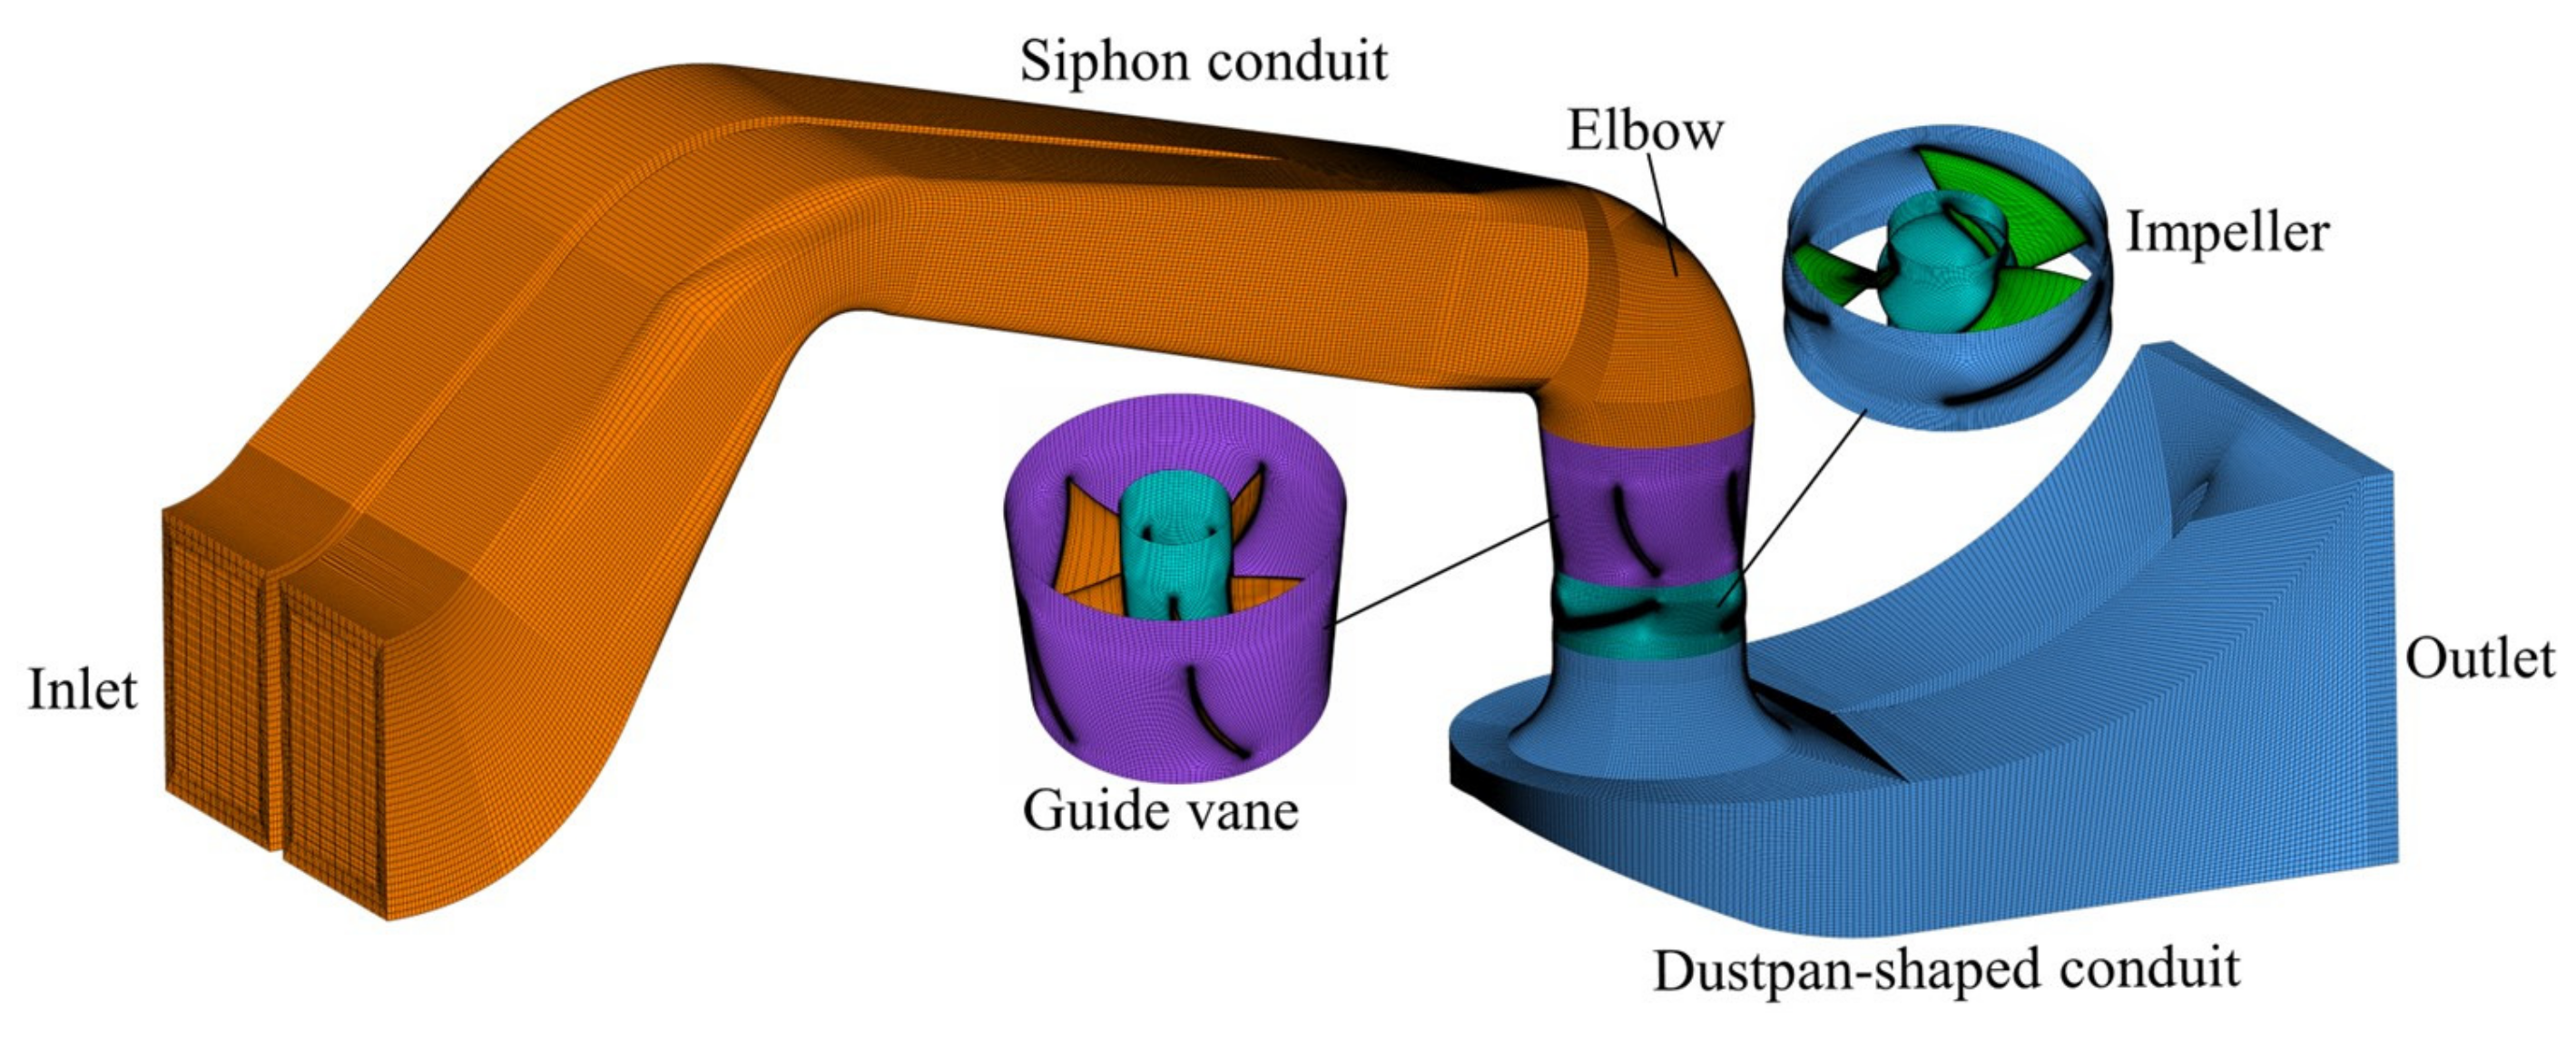
2.2. Mesh Generation and Validation

ICEM CFD software was adopted to structured hexahedral meshing for each part of the computational domain of the vertical axial-flow PAT device. H-type topology was applied to generate the guide vane mesh, and O-type topology was adopted to control the mesh boundary layers for the impeller blade, and the blade root and tip were locally encrypted. The entire computational domain and the local meshes of the impeller and guide vane are displayed in Figure 2.
The influence of mesh quantity and quality on the numerical simulation results was huge, and it is necessary to verify the mesh convergence of the computational domain so as to balance the need for computational resources with the accuracy of numerical calculation. In this paper, the GCI (grid convergence index) criterion based on the Richardson extrapolation method [31] is used to verify the grid convergence. Three groups of grids, fine grid N1 = 6,143,640, medium grid N2 = 2,746,492, and coarse grid N3 = 721,326 were chosen for grid convergence analysis, and the grid refinement factors were all greater than 1.3 [32]. Discrete error analysis was performed by efficiency parameters of the vertical axial-flow PAT device. Referring to the GCI calculation procedure of Celik et al. [33], the outcomes of the specific process are displayed in Table 2. The convergence index GCI21 was 1.13% and the discrete error was small. Therefore, the grid scheme 6,143,640 was determined for the numerical simulation calculation. The dimensionless distance y+ of the impeller domain was controlled to be less than 30.

2.3. Turbulence Model and Boundary Conditions

In this work, the 3D commercial modeling software ANSYS CFX was applied to simulate the flow in the axial-flow PAT at various operating conditions. The flow in the axial-flow PAT can be considered as incompressible turbulent flow at normal atmospheric temperature. Therefore, the continuity equation and Reynolds time-averaged equation were used to solve the turbulent motion. The control equations were discretized using the finite element-based finite volume method. The discrete equation was solved by the fully implicit coupled algebraic multigrid method, with a high-resolution format for the convective terms and a second-order windward format for the other terms in the discretization process. Based on previous studies [34,35], the SST-CC turbulence model with rotational curvature correction works well in simulating large curvature flow with high-speed rotation inside the PAT [36,37]. Therefore, the SST-CC turbulence model was chosen for the current study. The working water temperature was set to 25 °C at normal atmospheric temperature, and the mass flow was specified at the siphon conduit inlet, while the dustpan-shaped conduit outlet was set at a static pressure. A no-slip condition was set to all solid wall surface. The unsteady calculations were performed with the steady results as the initial file, with 3° of the impeller rotation as a time step of 5.376 × 10⁻⁴ s and a total calculation time of 0.6452 s corresponding to 10 circles of impeller rotation. The calculation’s convergence accuracy was set at 10−5.

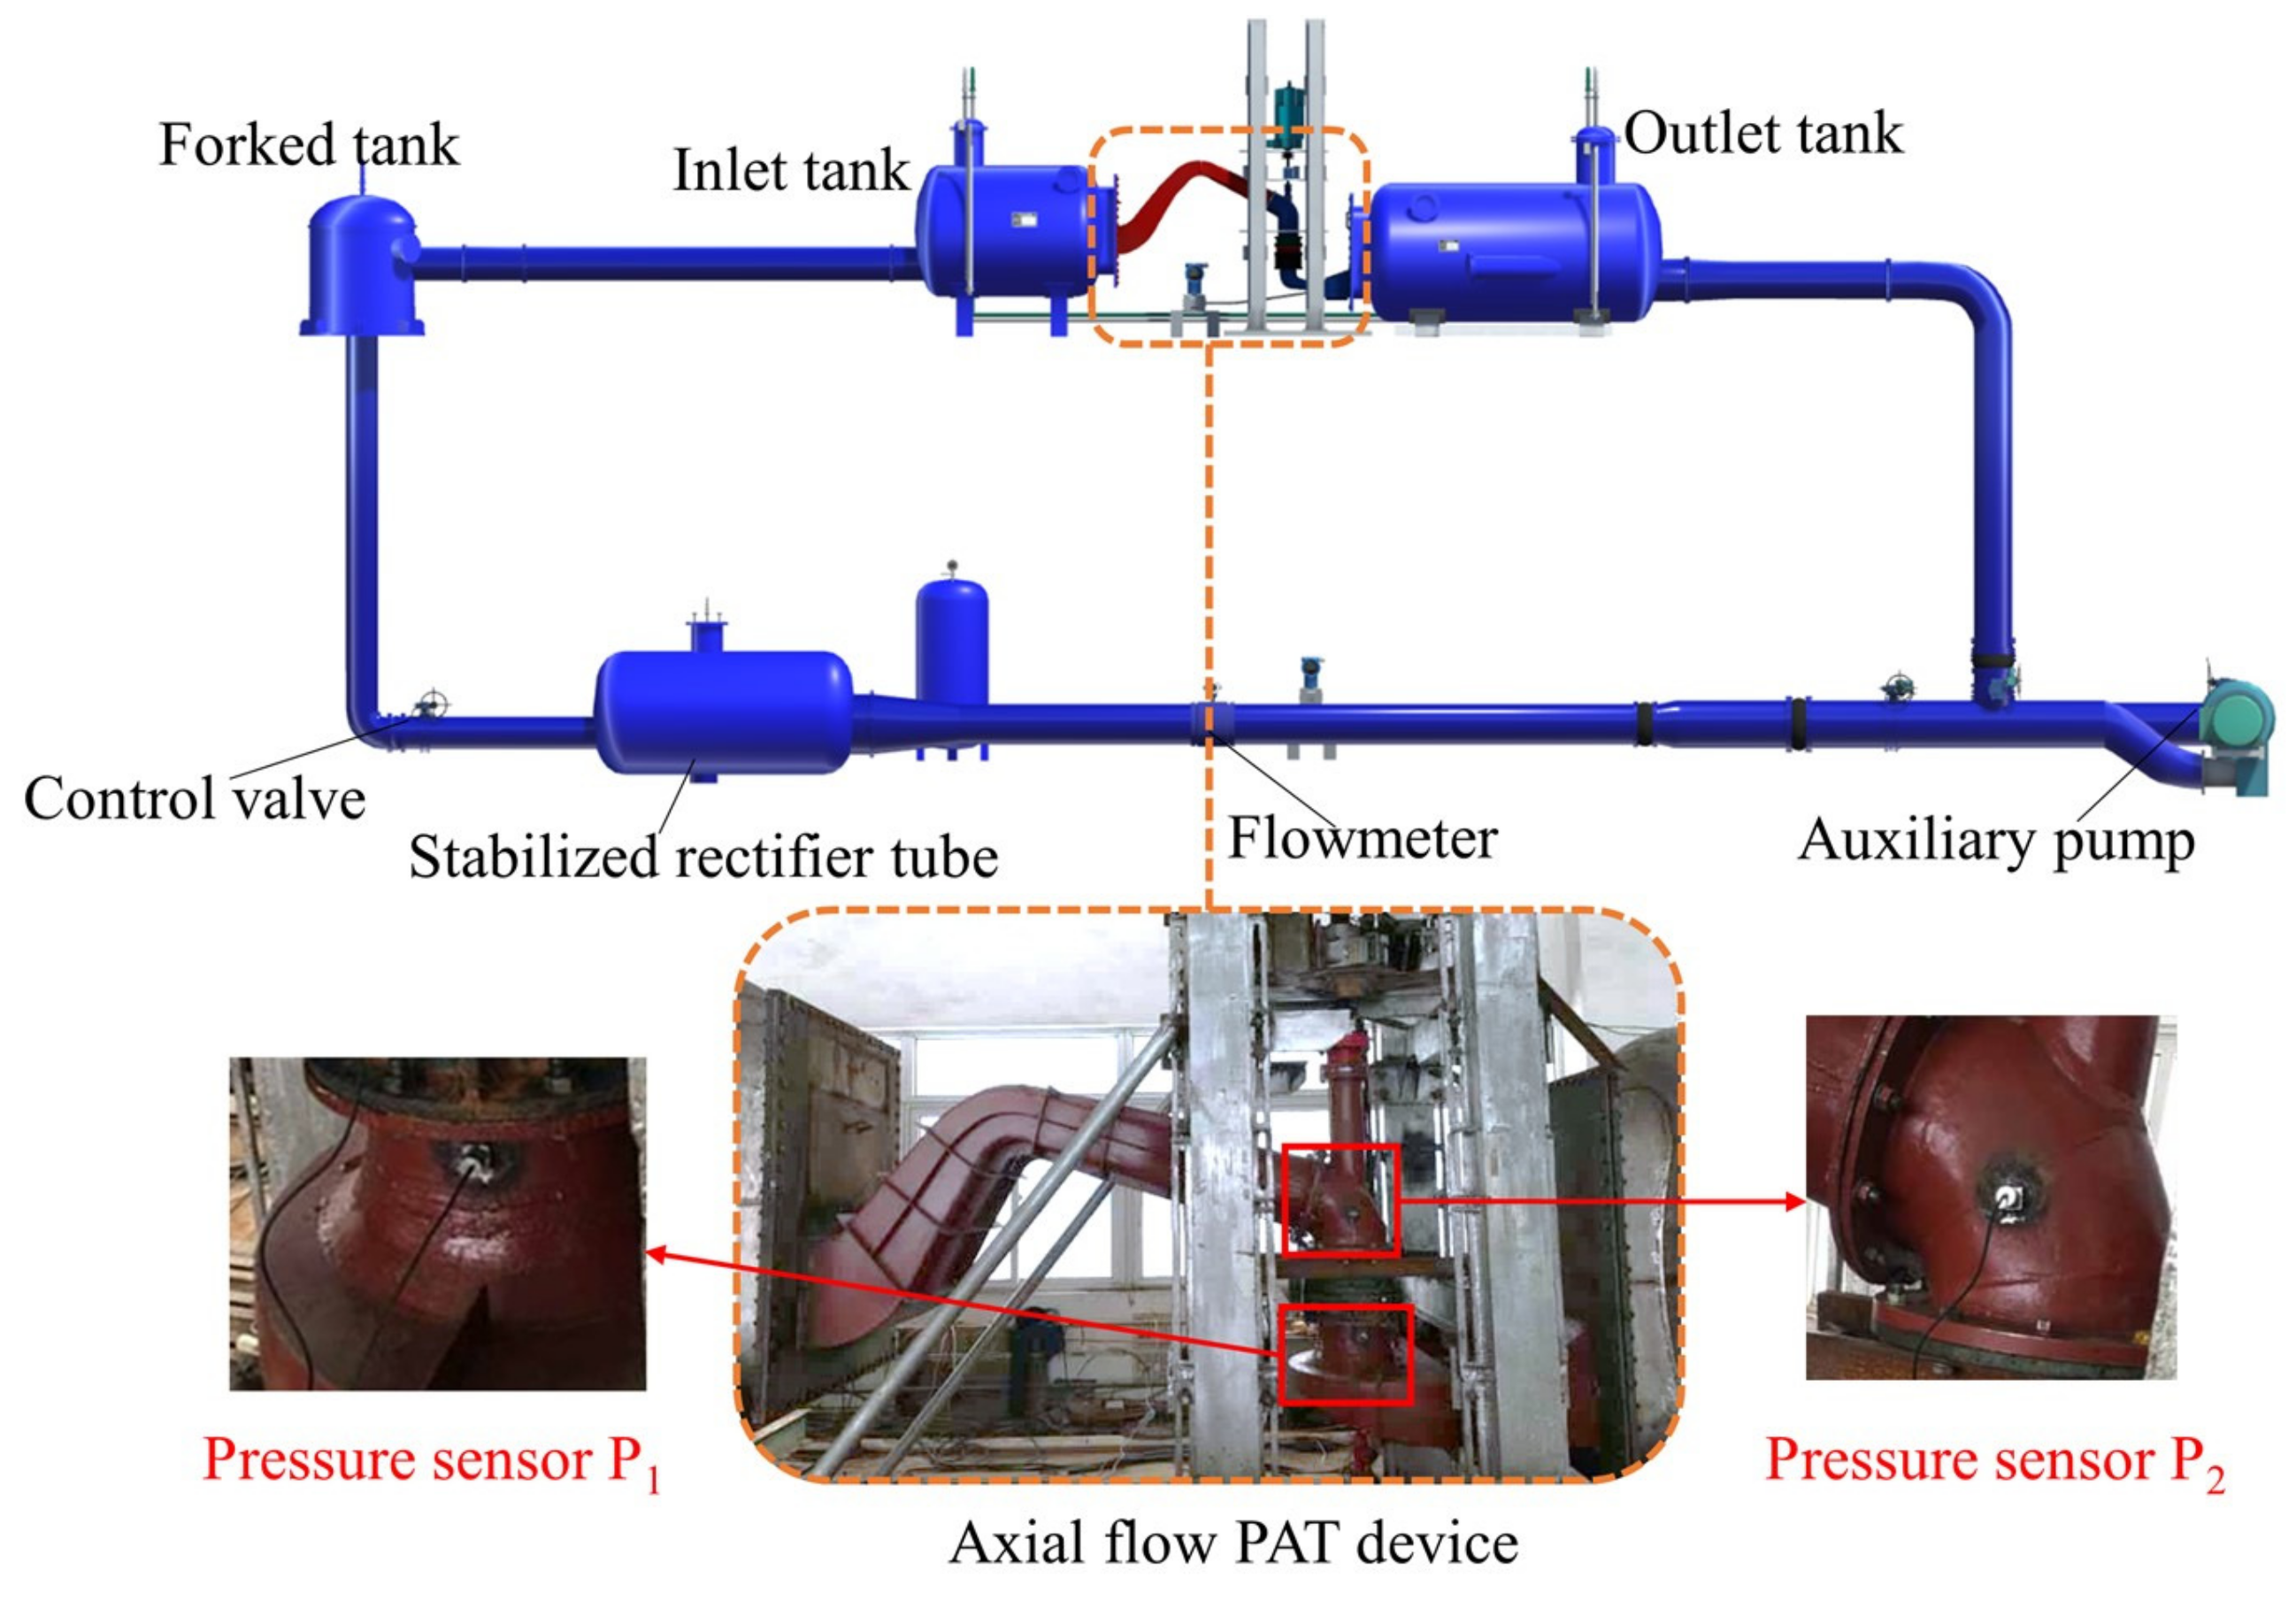
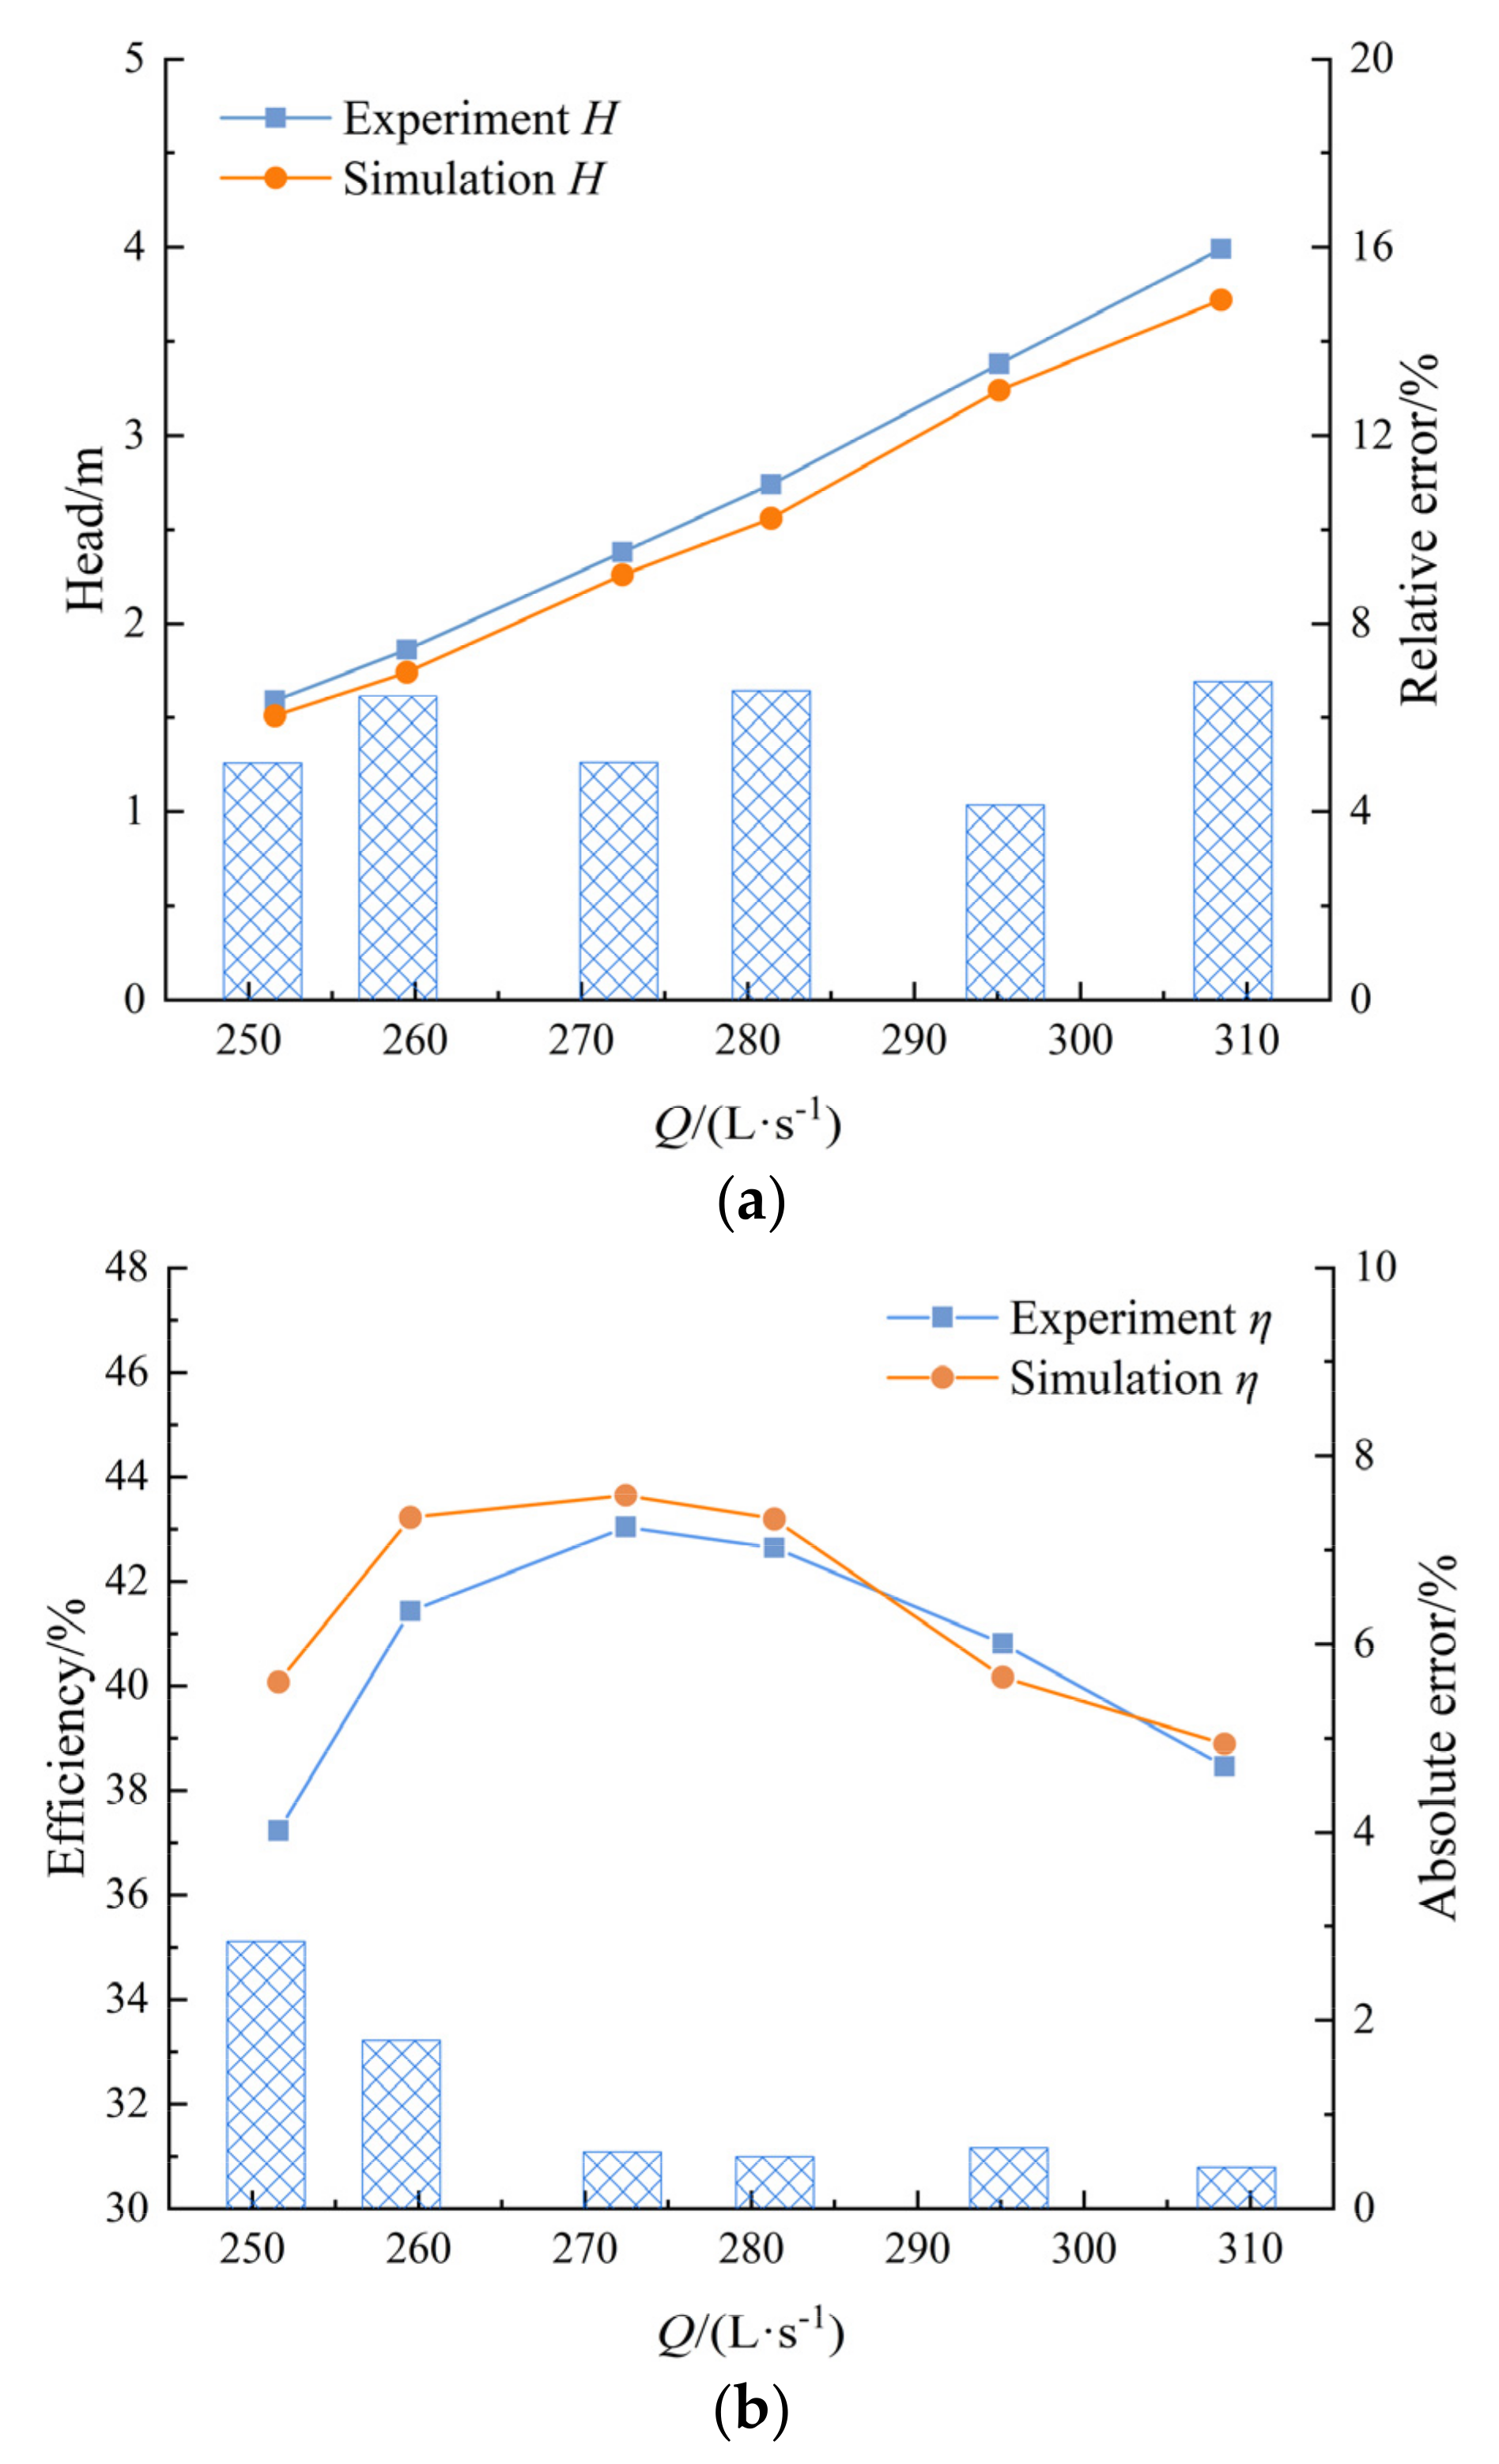
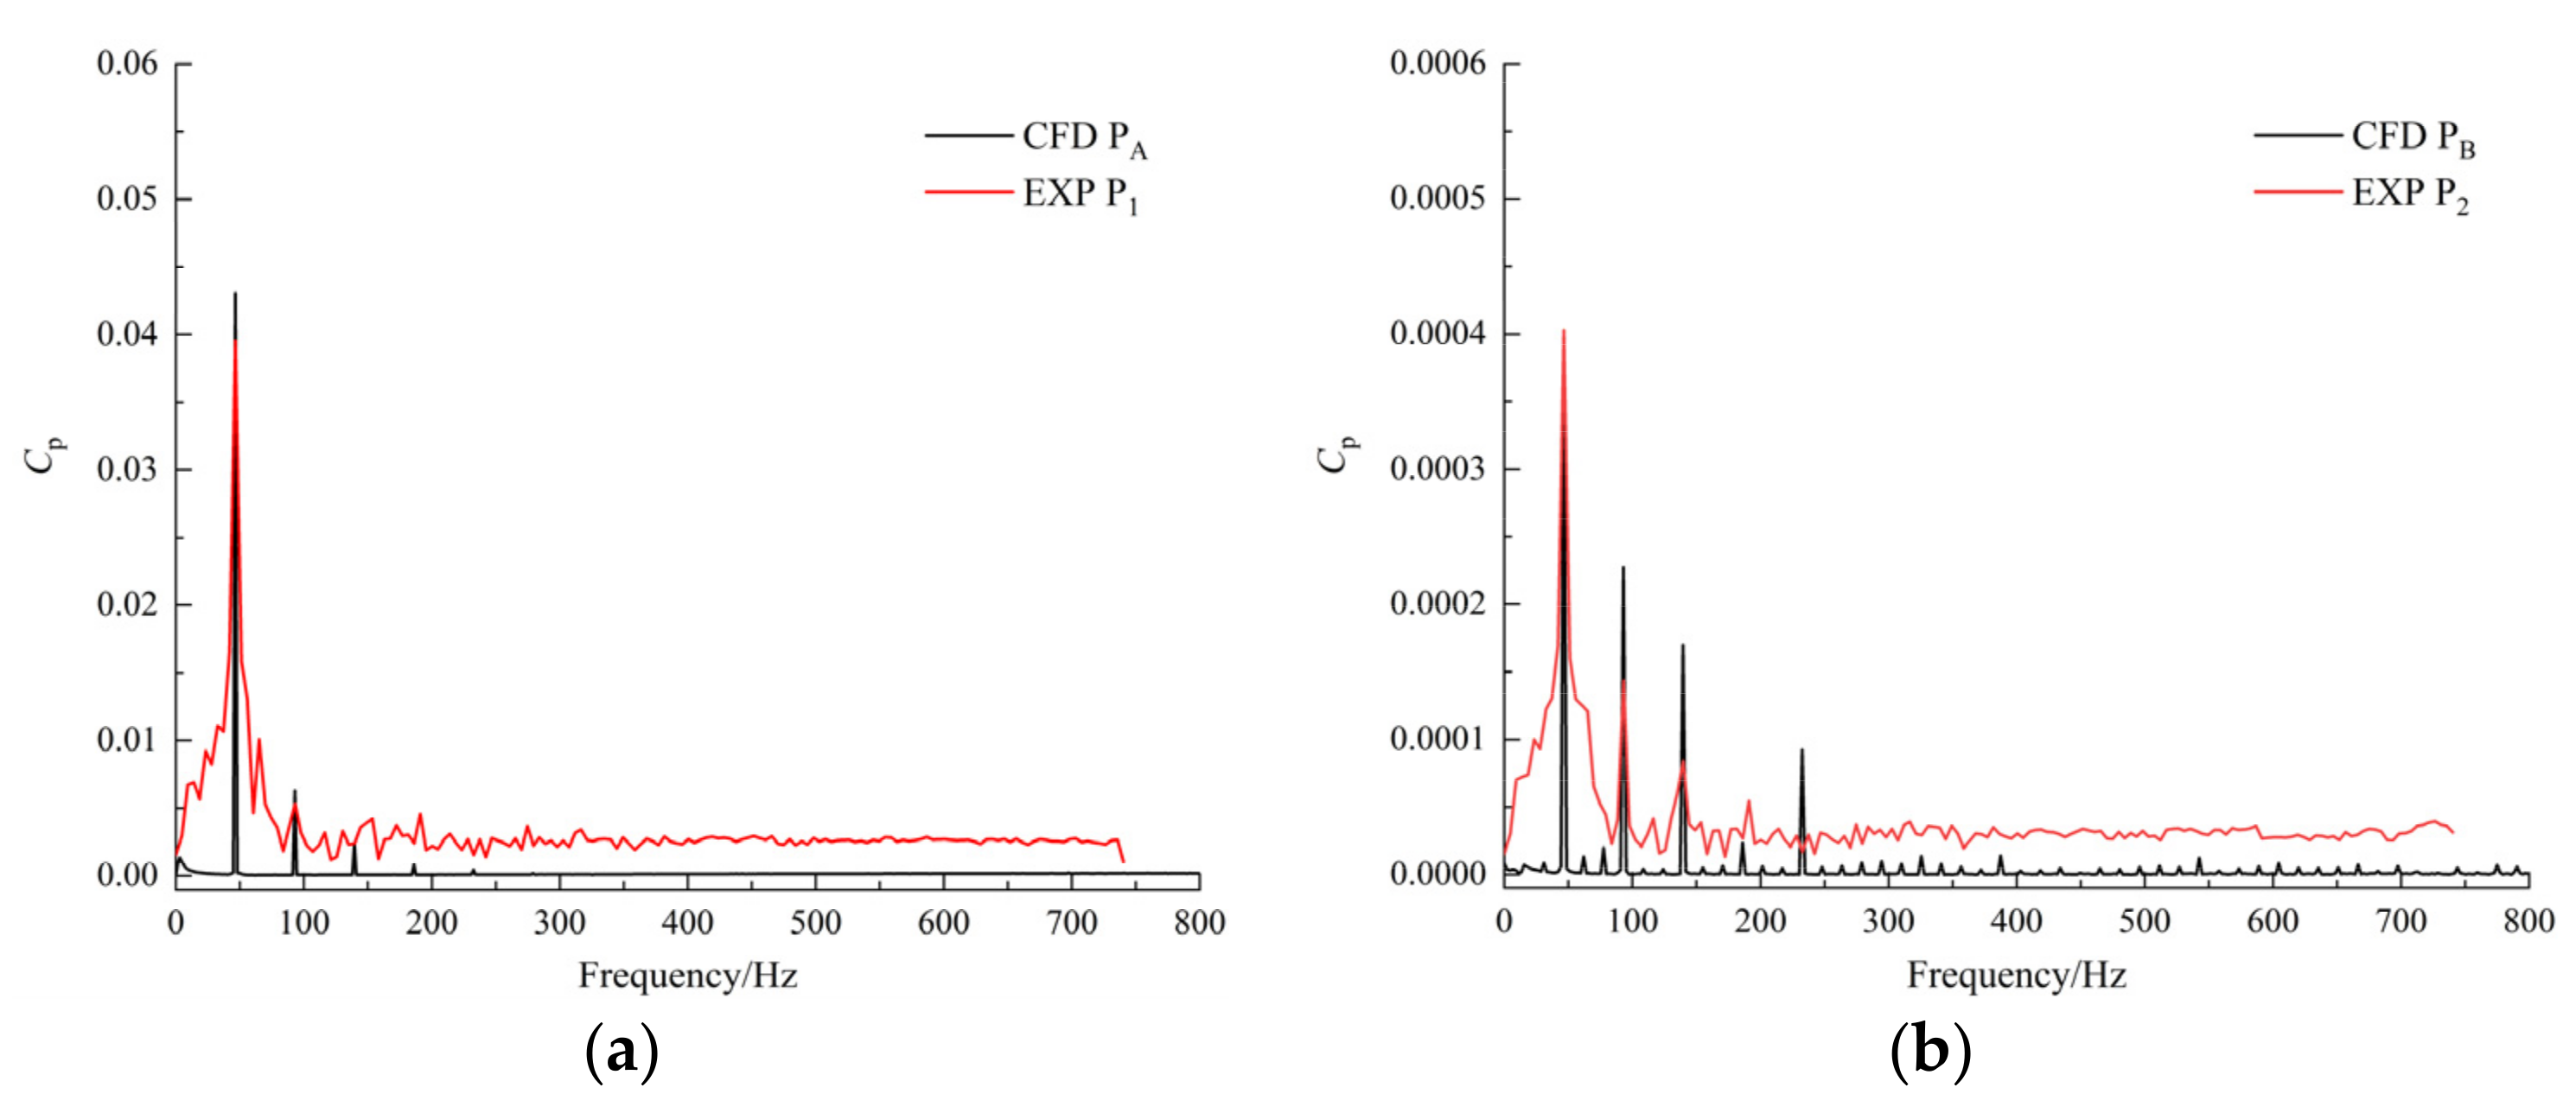
3. Experiment Equipment

The experiment in this paper was conducted on a high-precision closed-cycle hydro-mechanical test bench, which was mainly composed of inlet and outlet tanks, control valves, a stabilized rectifier tube, and an auxiliary pump. The control of the flow rate was achieved by an electromagnetic flow meter and a control valve. Figure 3 displays the test bench’s schematic diagram, featuring pressure sensor P1 situated at the impeller inlet and P2 situated at the elbow section. The pressure was measured by two CYG1505GLLF high-frequency dynamic pressure sensors with a range of 200 kPa, and the data was collected using the SQCJ-USB-16 collector. The material of the whole test bench was a steel structure, and the flow conduit was welded by a steel plate and connected with an impeller, guide vane, and elbow section by flange. The physical model device’s installation accuracy was examined, and the impeller tip clearance was adjusted to within 0.2 mm. Following many tests to measure and quantify the test bench’s system and random uncertainties, the test bench’s total uncertainty for the axial-flow PAT device’s efficiency was calculated to be 0.368%.
The performance curve of the axial-flow PAT was obtained by varying the magnitude of the flow rate. Figure 4 compares the experimental performance curve with the numerical simulation. It is obvious to observe that the head H and efficiency η curves of the numerical model and the experiment match well with the variation of the flow rate. The relative inaccuracy of the head was steady at roughly 6% and was less impacted by changes in the flow rate. The absolute error of efficiency was the largest at 250 L/s, and when the flow rate increased, the error value dropped dramatically. Overall, the model test results confirmed the accuracy of the numerical simulation prediction results.

4. Results and Discussion

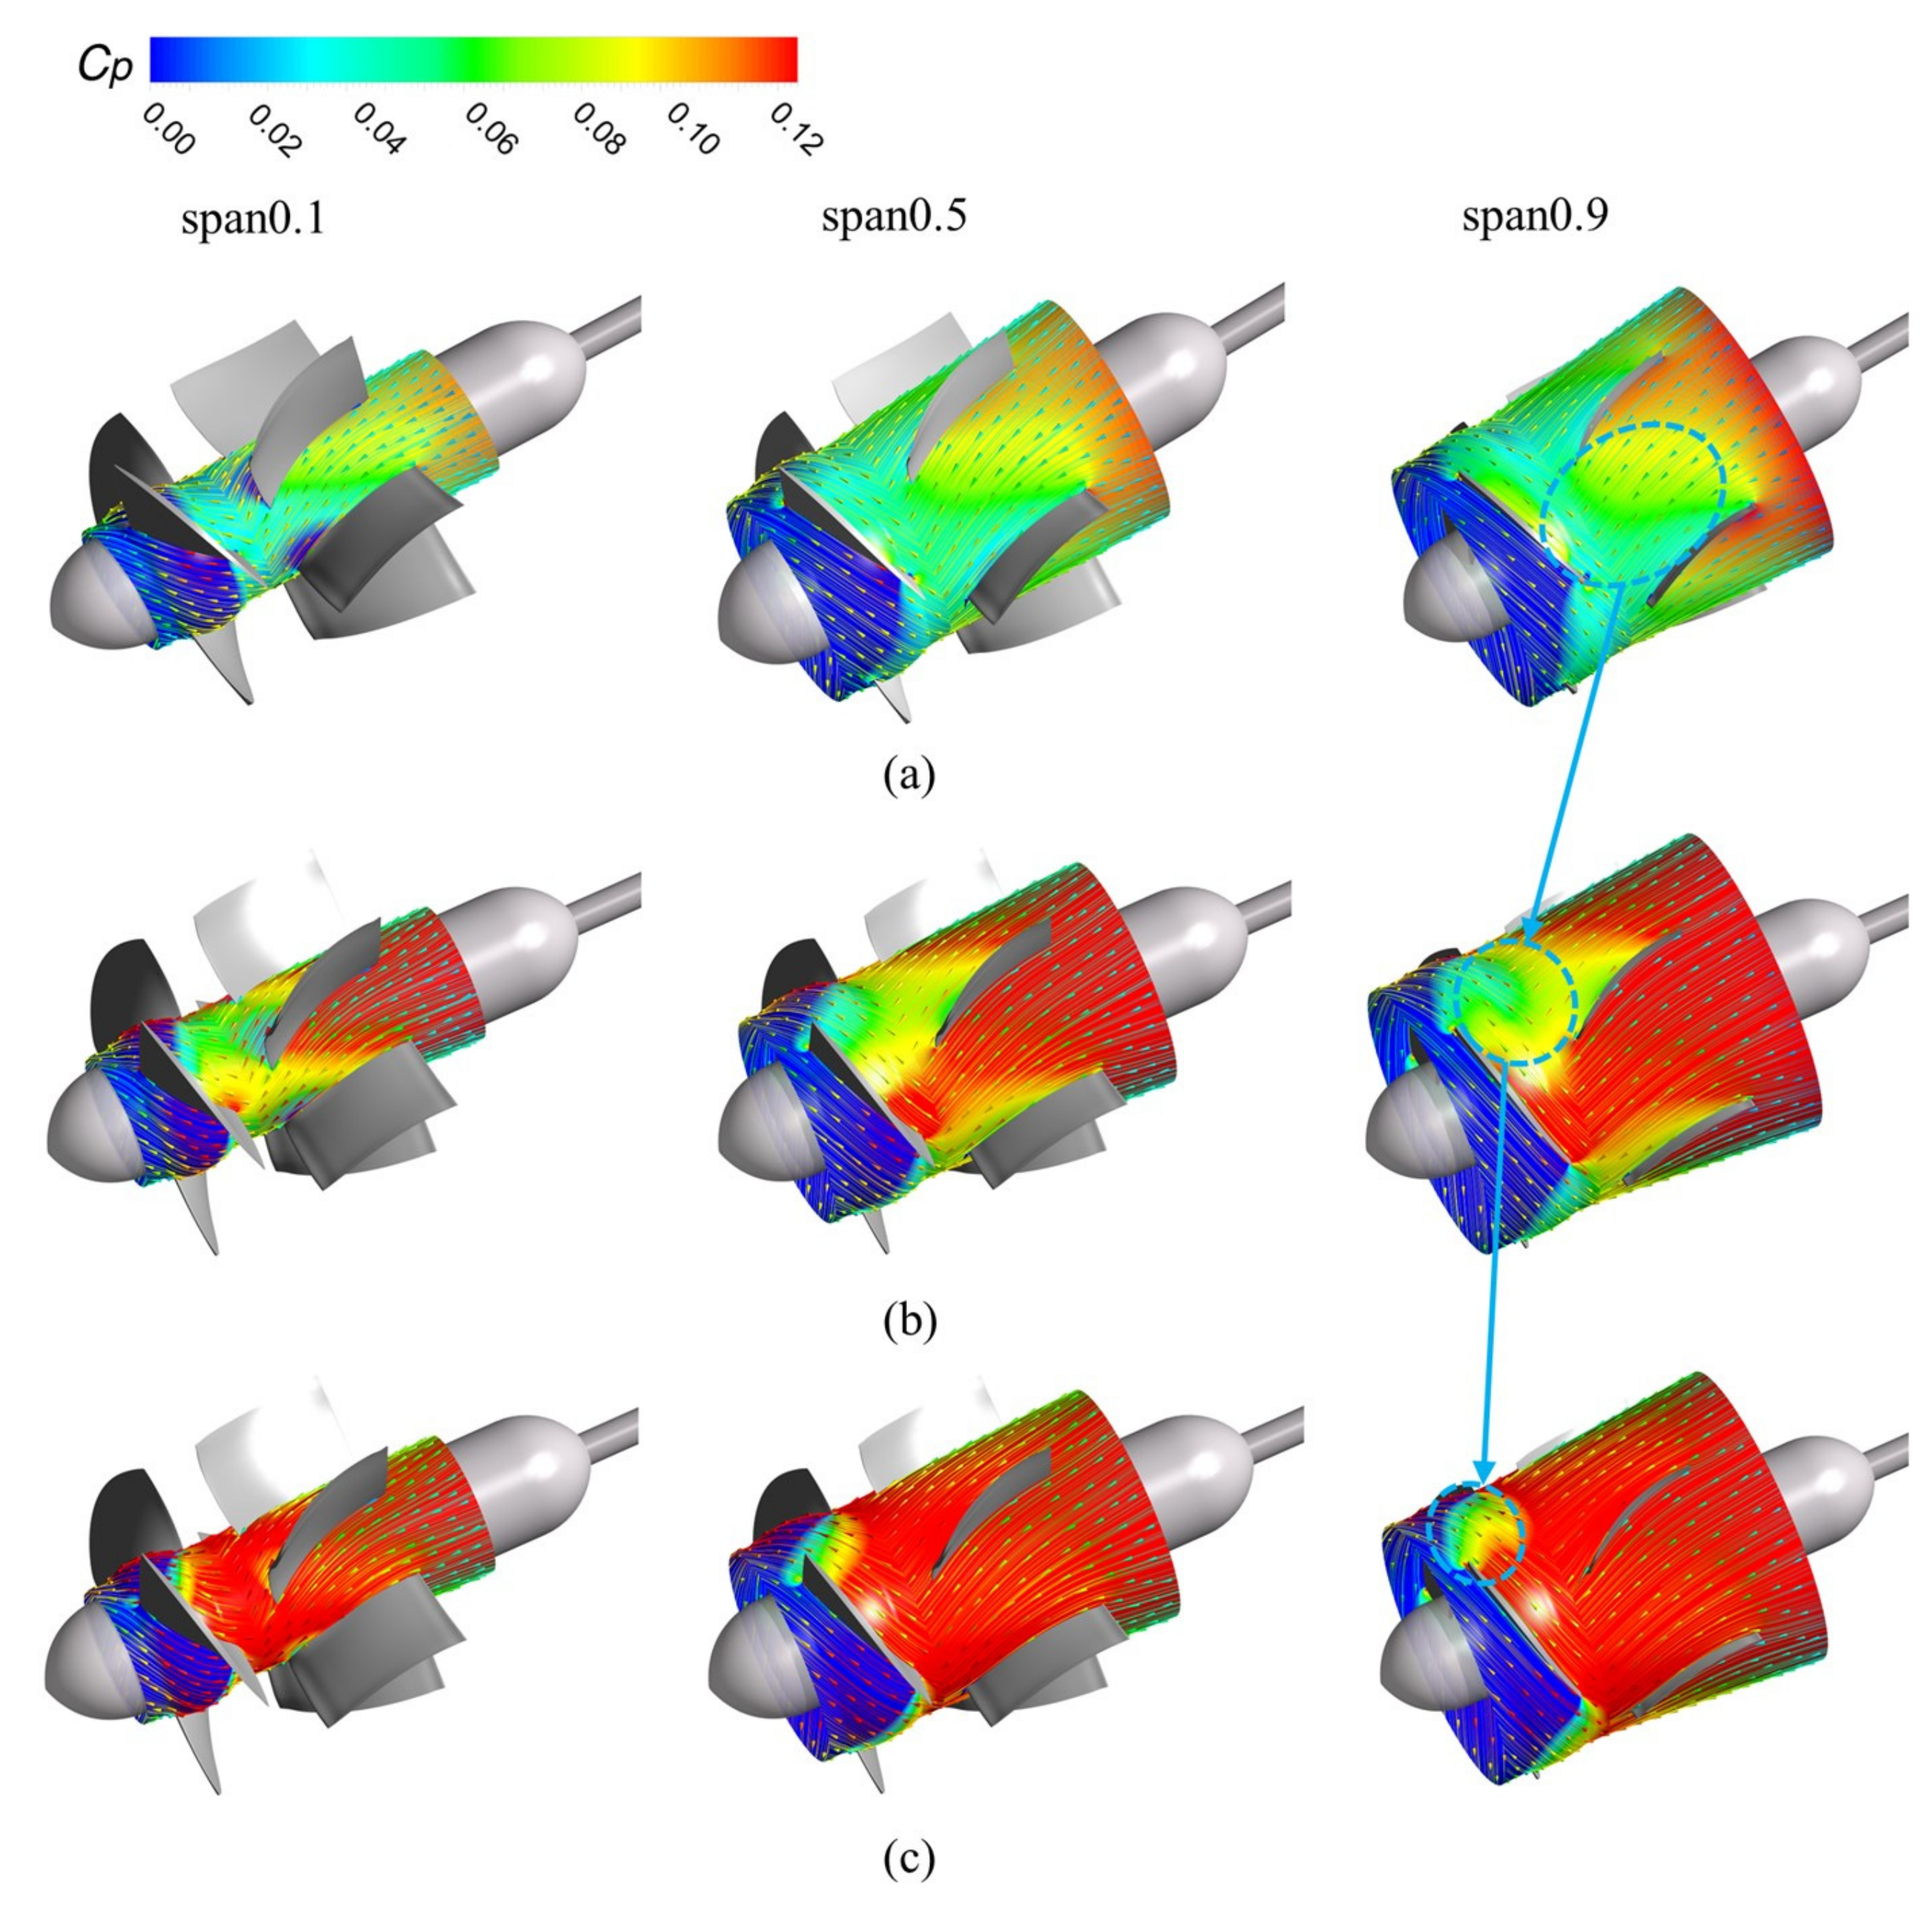
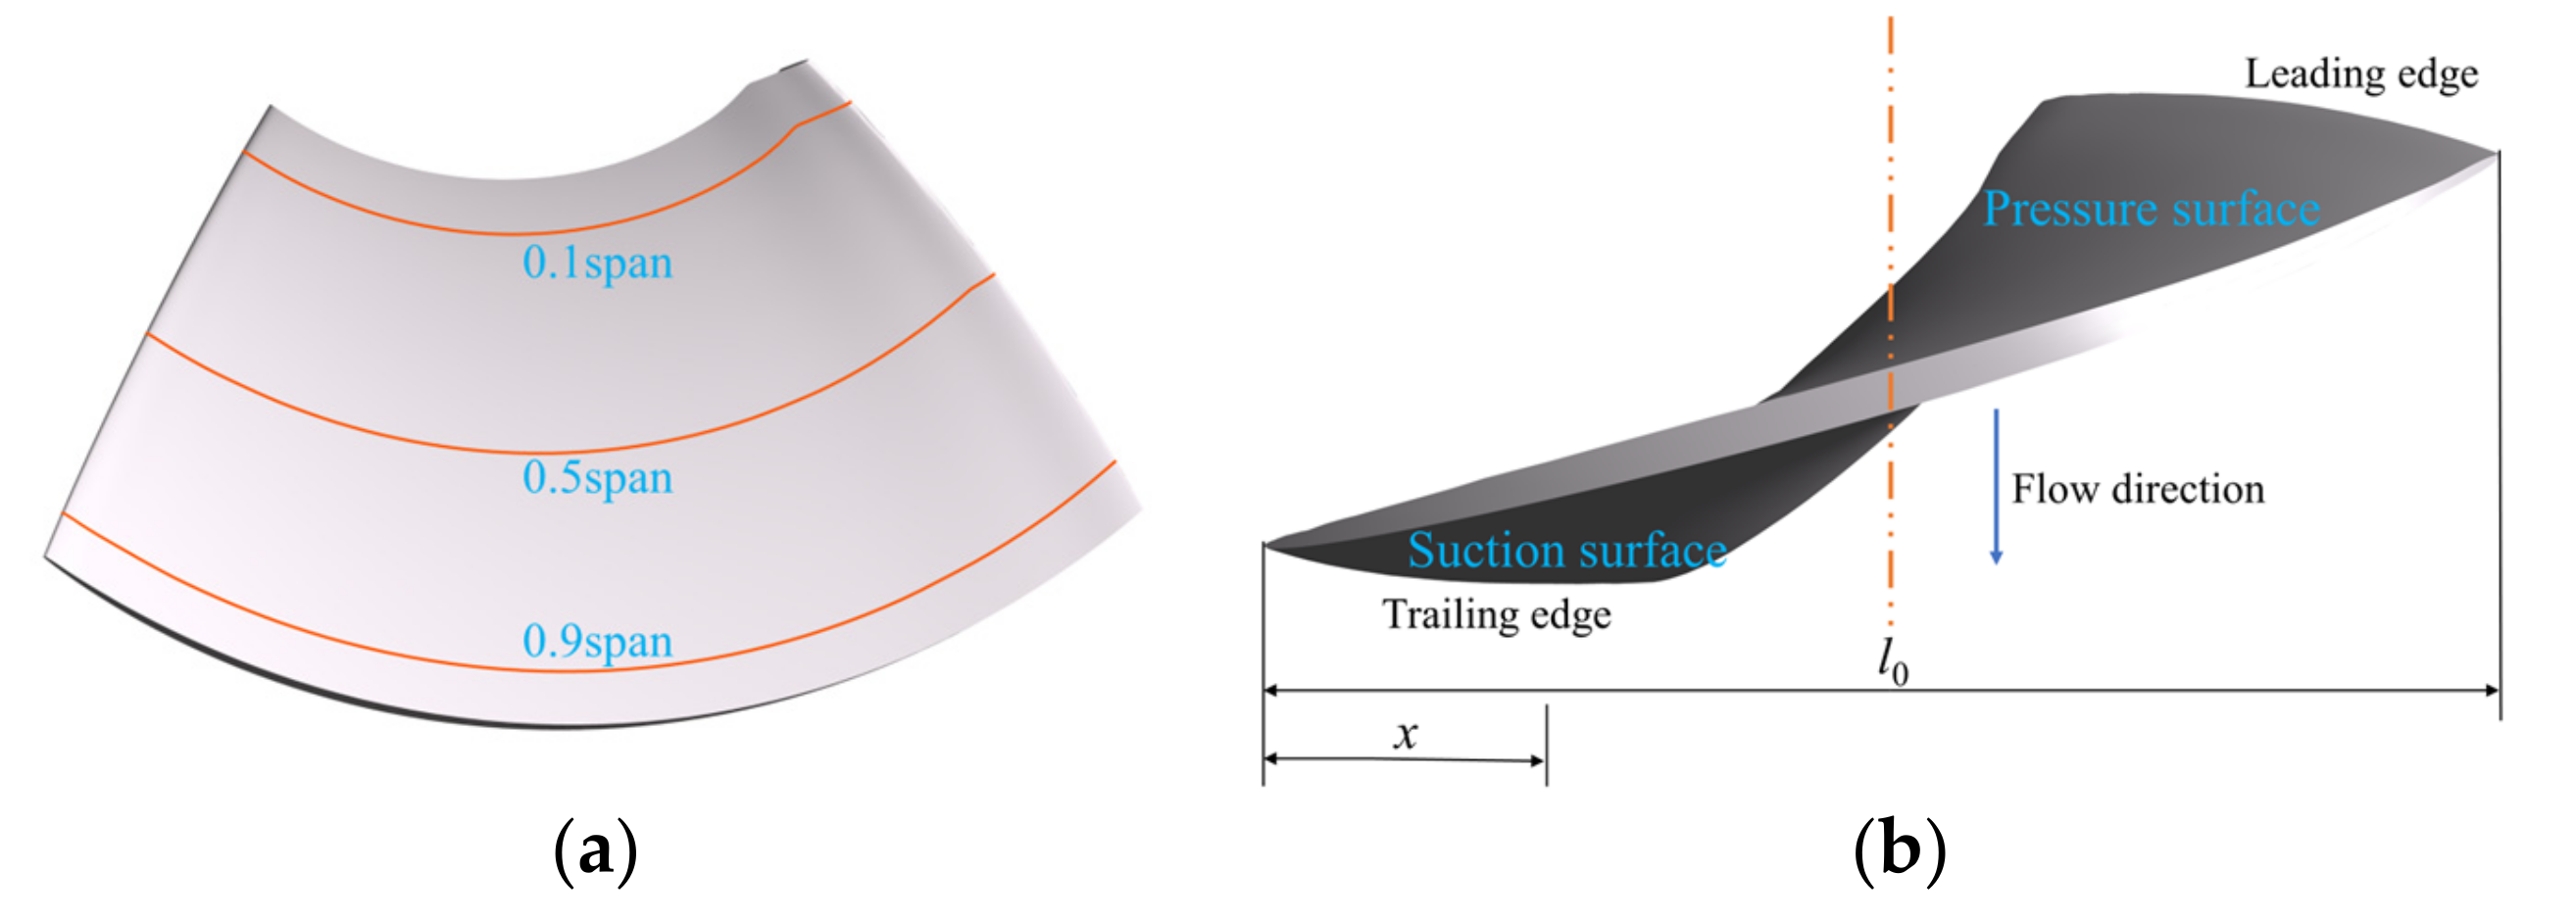
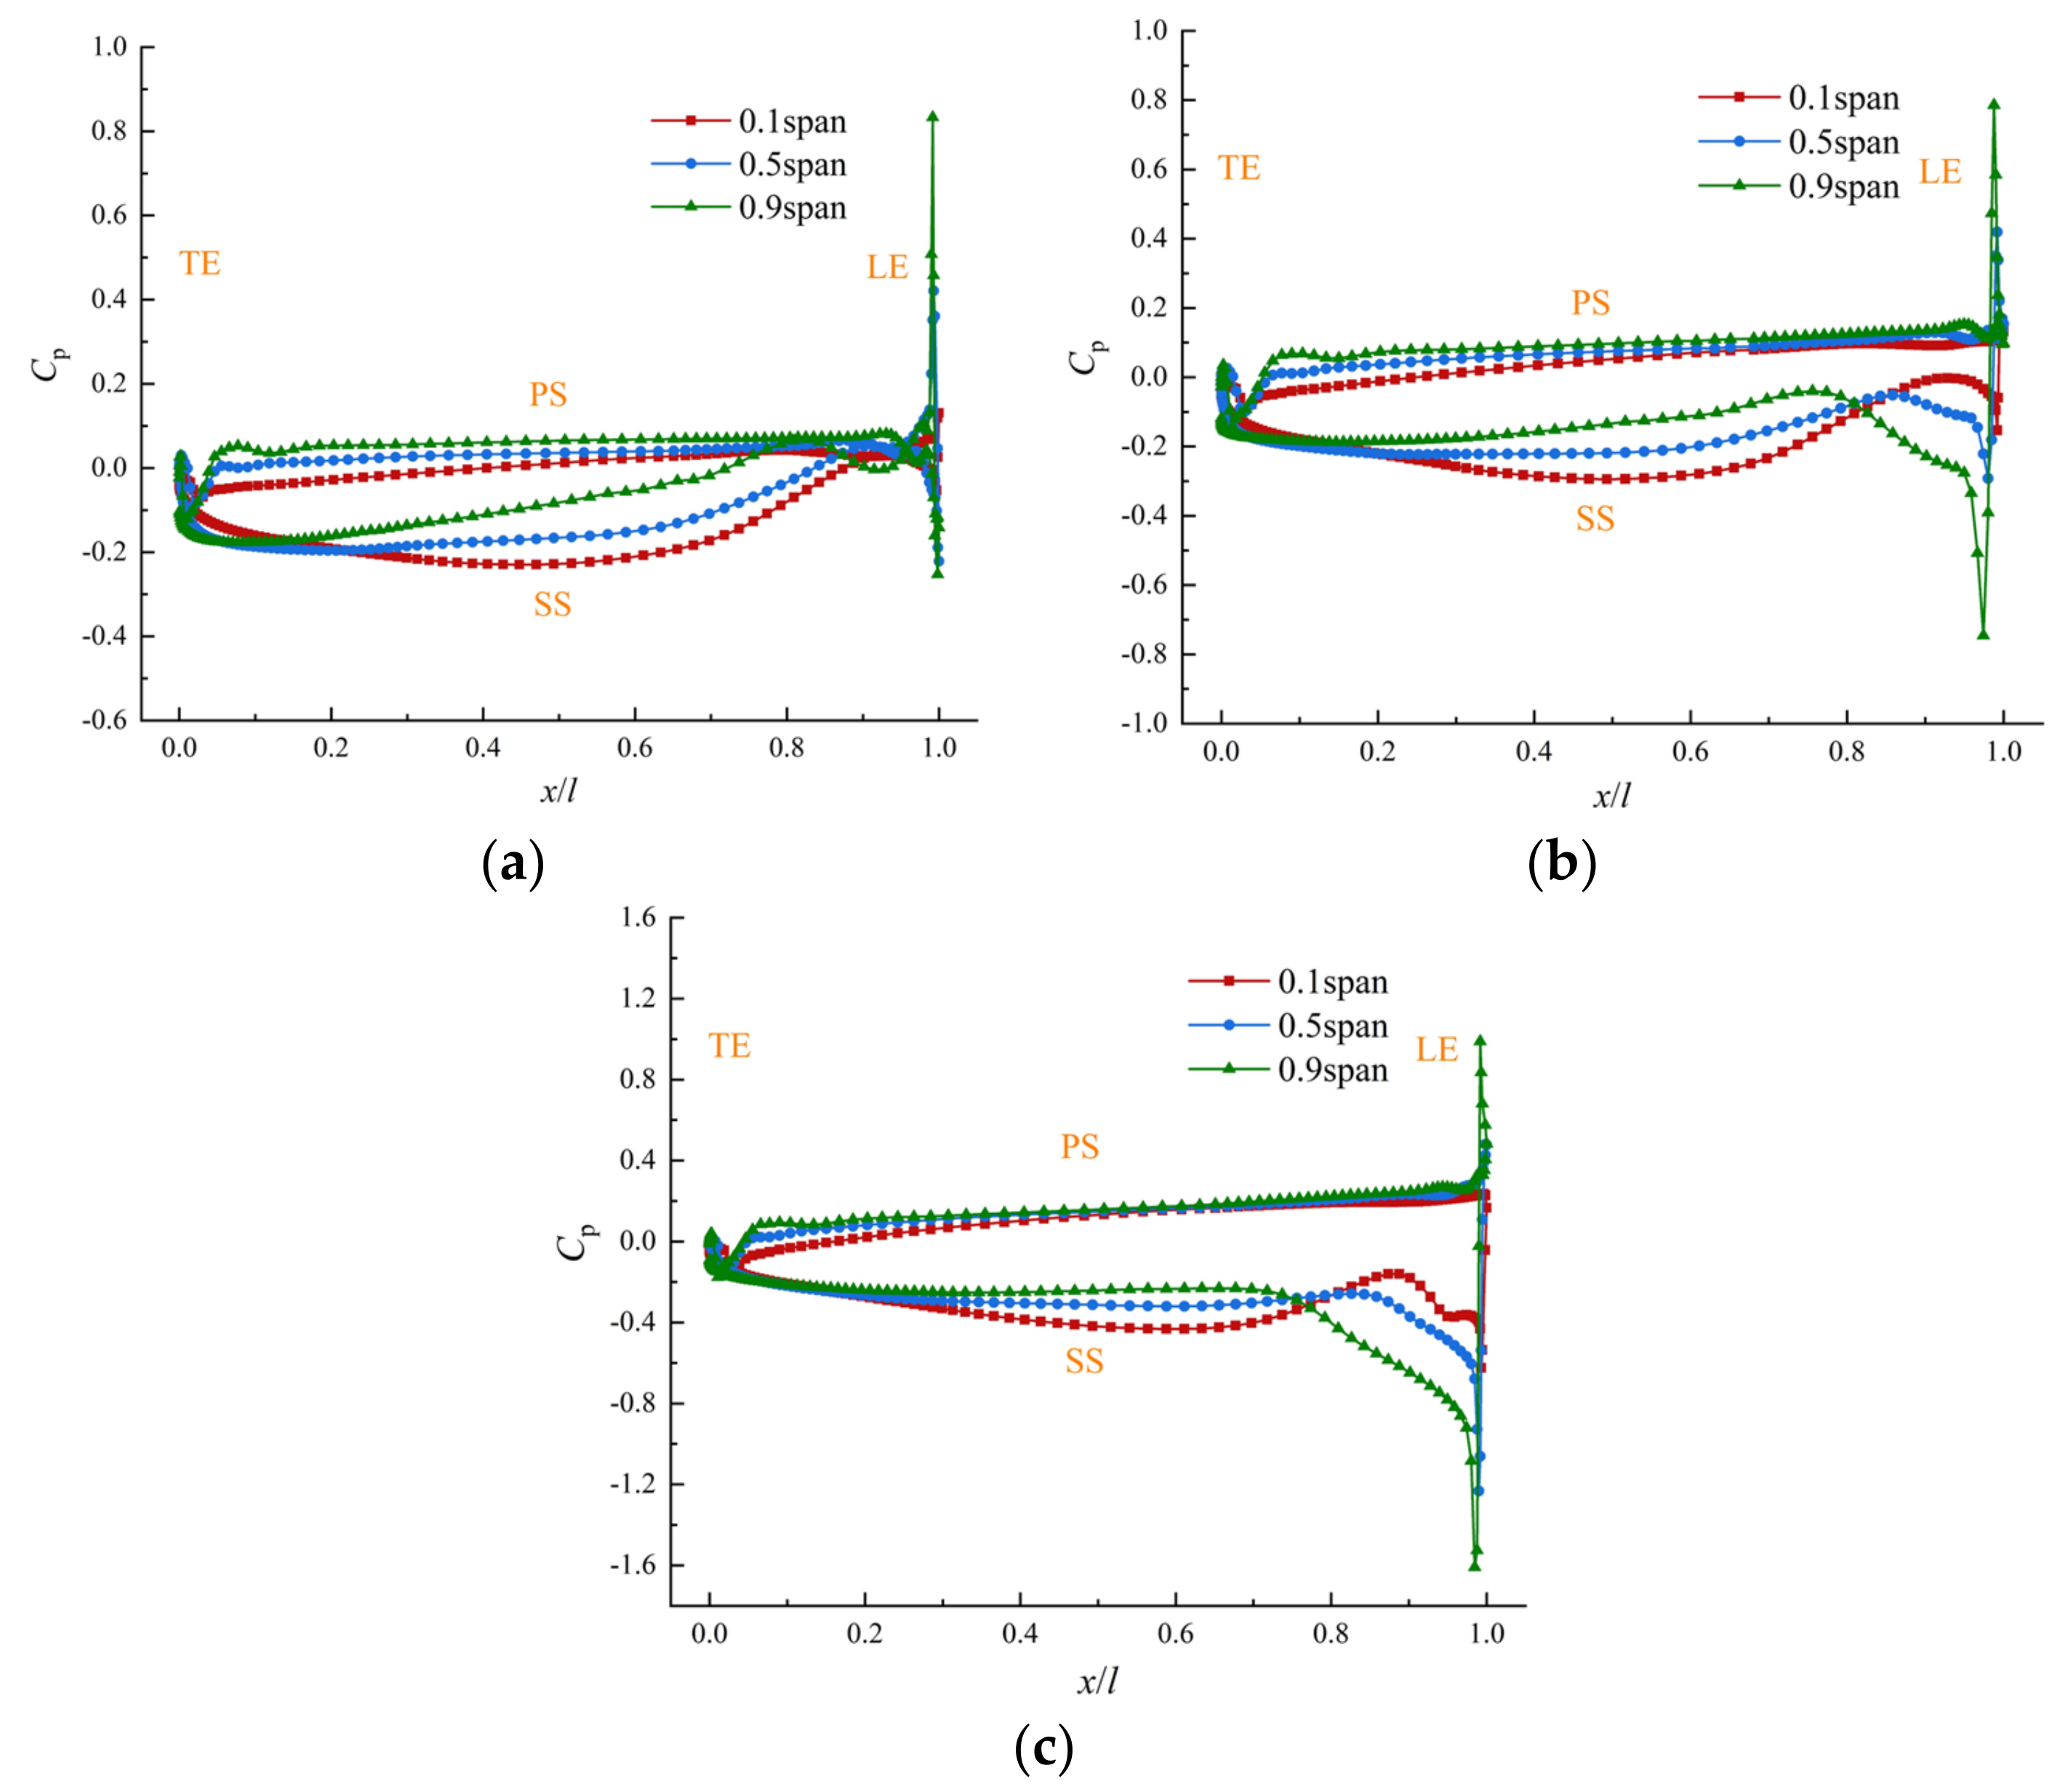
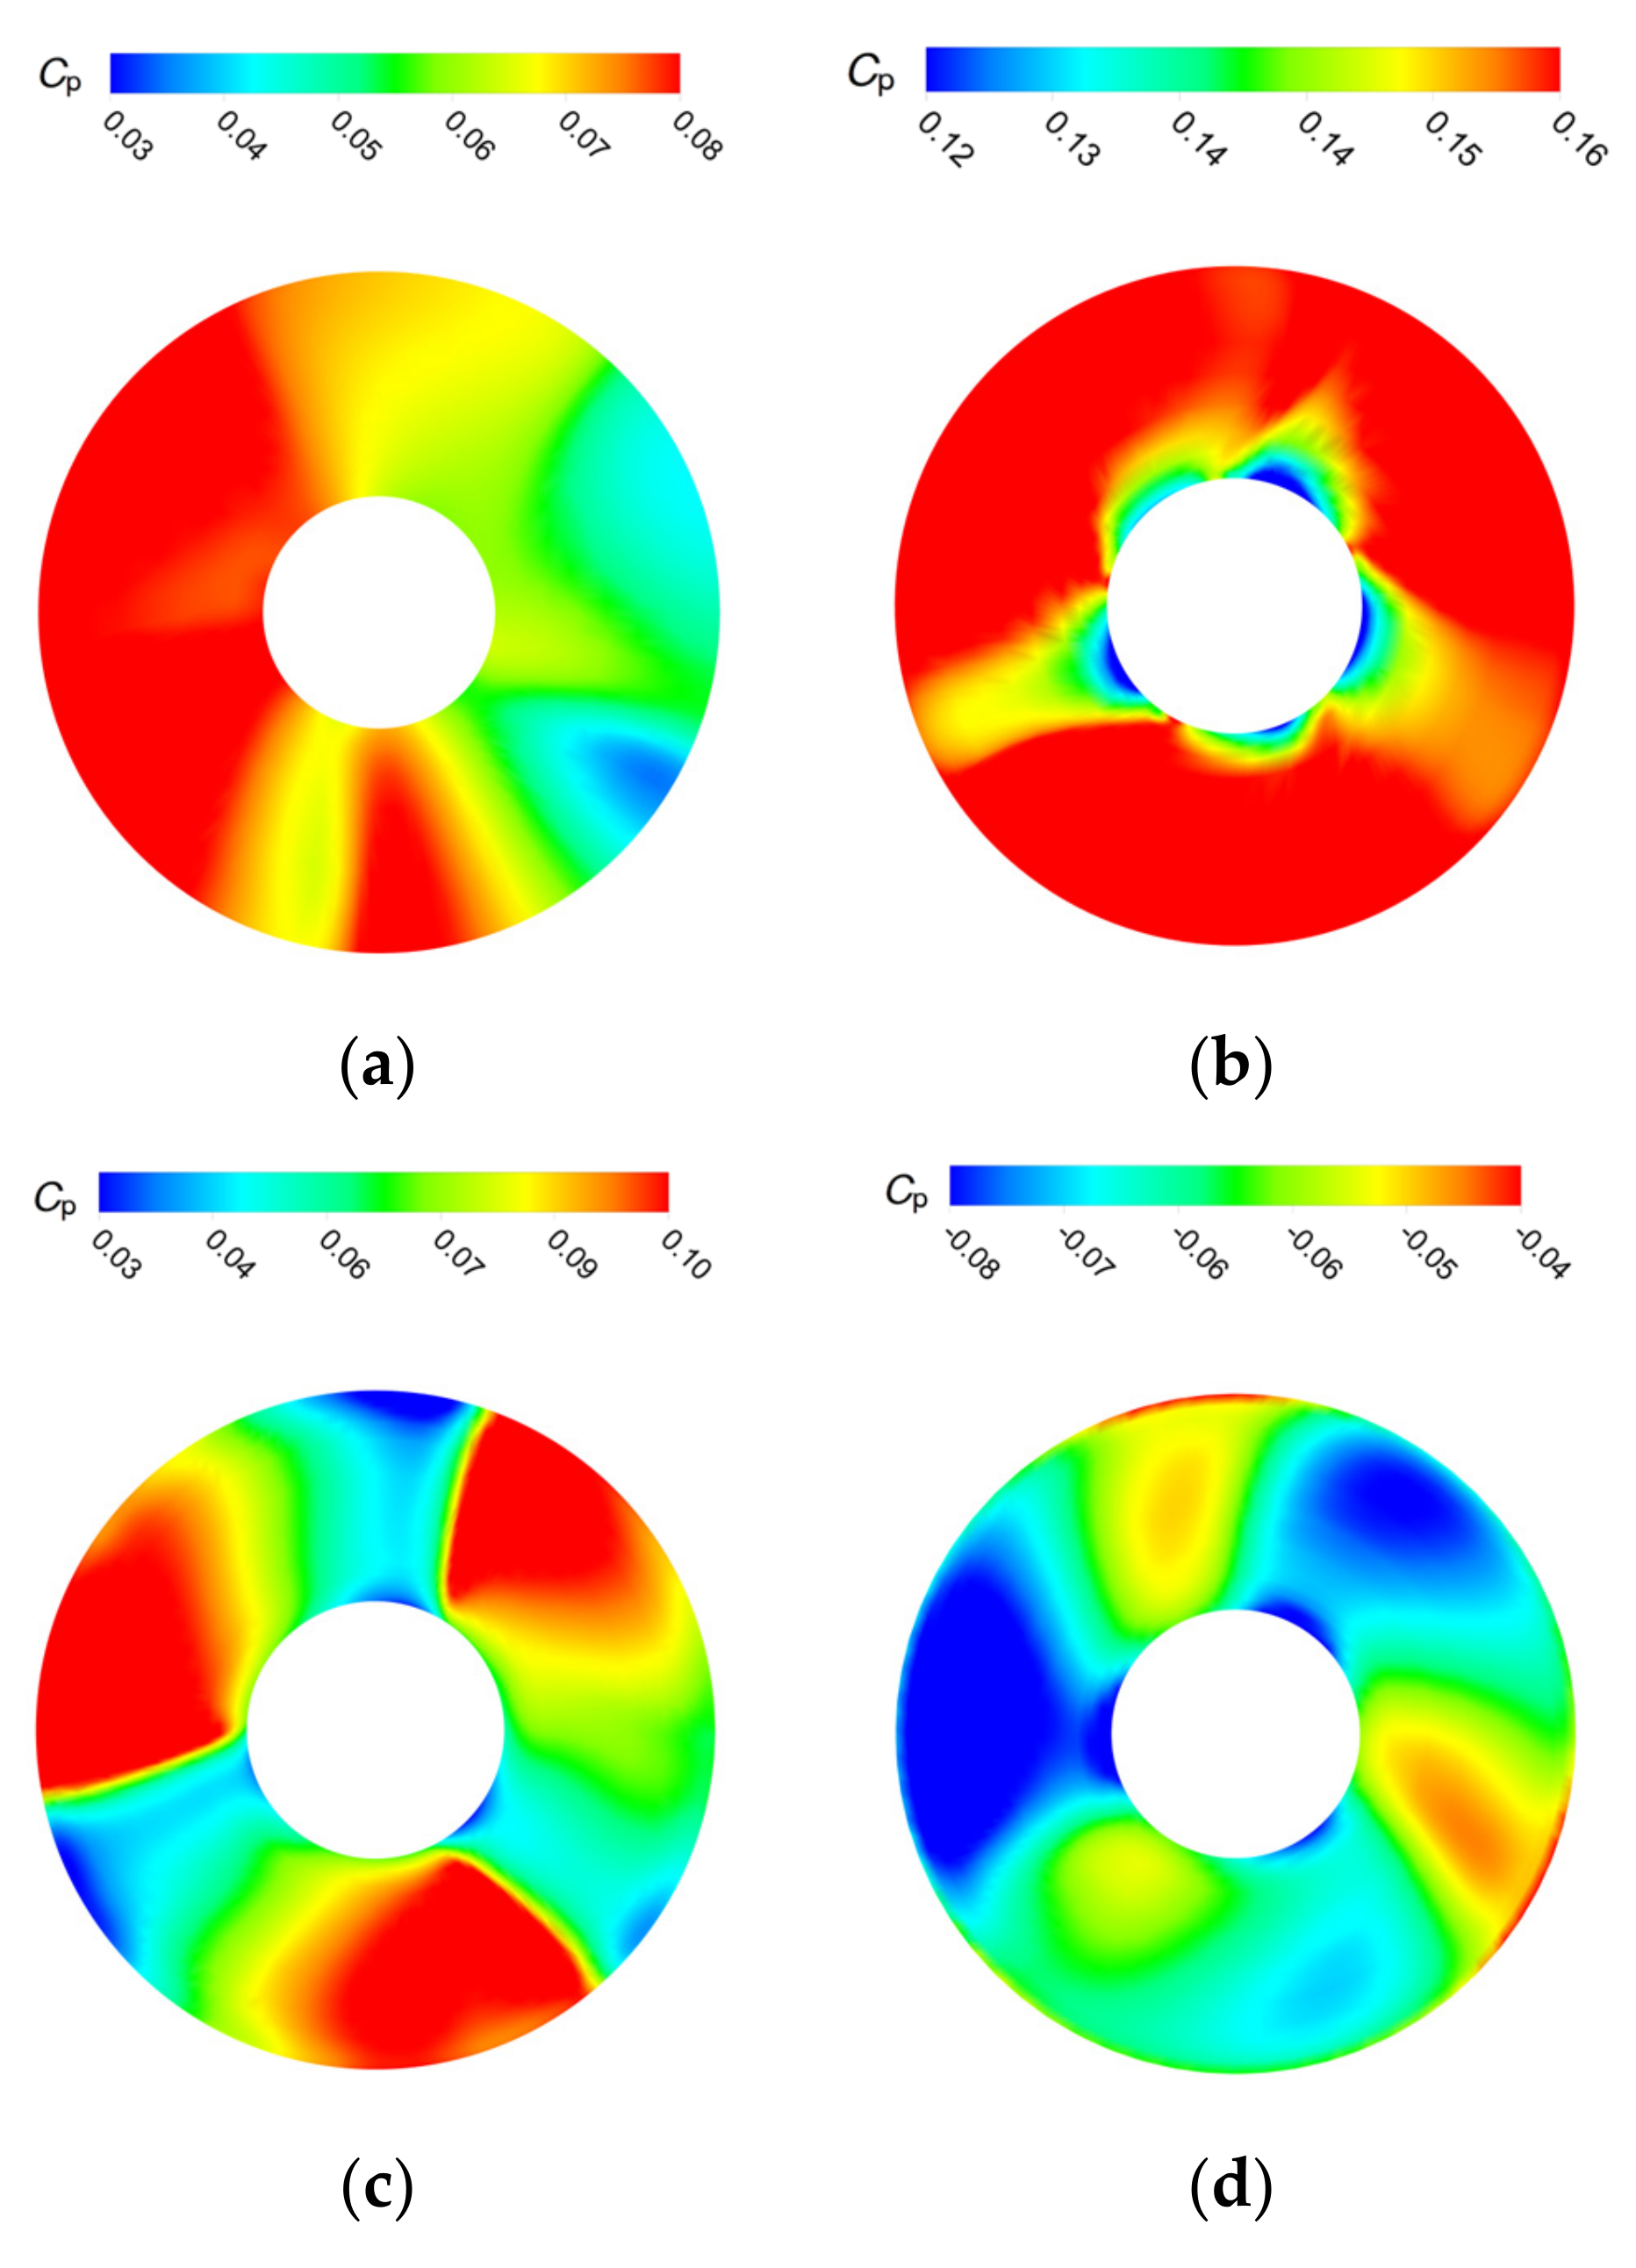
4.1. Internal Flow Characteristics in Impeller-Guide Vane Hydraulic Coupling Zone

The pressure is normalized to a dimensionless pressure coefficient Cp, C p = P / 0.5 ρ V 2 2 , and V 2 is the circumferential velocity of the impeller outlet. The impeller rotational frequency is fn = 15.5 Hz. The flow characteristics in the impeller-guide vane hydraulic coupling zone have a crucial impact on the performance of the whole device. Span is the definition of the dimensionless distance between the hub and the shroud: span = r r h R r h ( r h is the radius of the hub, and R is the radius of the shroud). To investigate the instability flow in the impeller-guide vane hydraulic coupling zone, the pressure coefficient clouds at three typical spans (0.1 span, 0.5 span, and 0.9 span) for different flow rates are obtained in Figure 5. The Cp at different spans in the guide vane area increase significantly in response to an increase in flow rate, while the Cp in the impeller area change less. There is an obvious pressure gradient zone in the impeller and guide vane intersection area, and the larger flow rate drives the gradient zone to shrink significantly. Further, there is a small local high-pressure area near leading edge and trailing edge of the impeller blades, where the pressure gradient increases significantly as the flow rate increases. There exist obvious unstable flow phenomena at the leading edge and the trailing edge of the impeller, i.e., the hydraulic shock at the leading edge and the wake disturbance at the trailing edge.
In order to study the pressure distribution on the blade surface, three measuring lines (at the mid-radius, near the hub and tip) were set up on the blade, as shown in Figure 6a. The parameters near the blade are described in Figure 6b. The impeller blade surface’s static pressure distribution at various flow rates is shown in Figure 7. It is evident that the static pressure is polarized at the blade’s leading edge (LE), with the static pressure of the pressure surface (PS) rising sharply, while the static pressure of the suction surface (SS) declines considerably. Because the pressure surface at the leading edge is rapidly impacted by the water flow, the pressure at the blade leading edge suddenly rises. The large flow velocity near the suction surface causes local low pressure on the suction surface. By the influence of the wake disturbance, the pressure difference between SS and PS near the blade trailing edge (TE) is small. While the static pressure of the SS gradually declines and the low-pressure area of the SS gradually increases as the flow rate increases, the static pressure distribution of the entire PS of the blade does not vary appreciably. Note that the static pressure increases continuously from the hub to the shroud, which is coherent with the flow field distribution law of different spans in Figure 5.

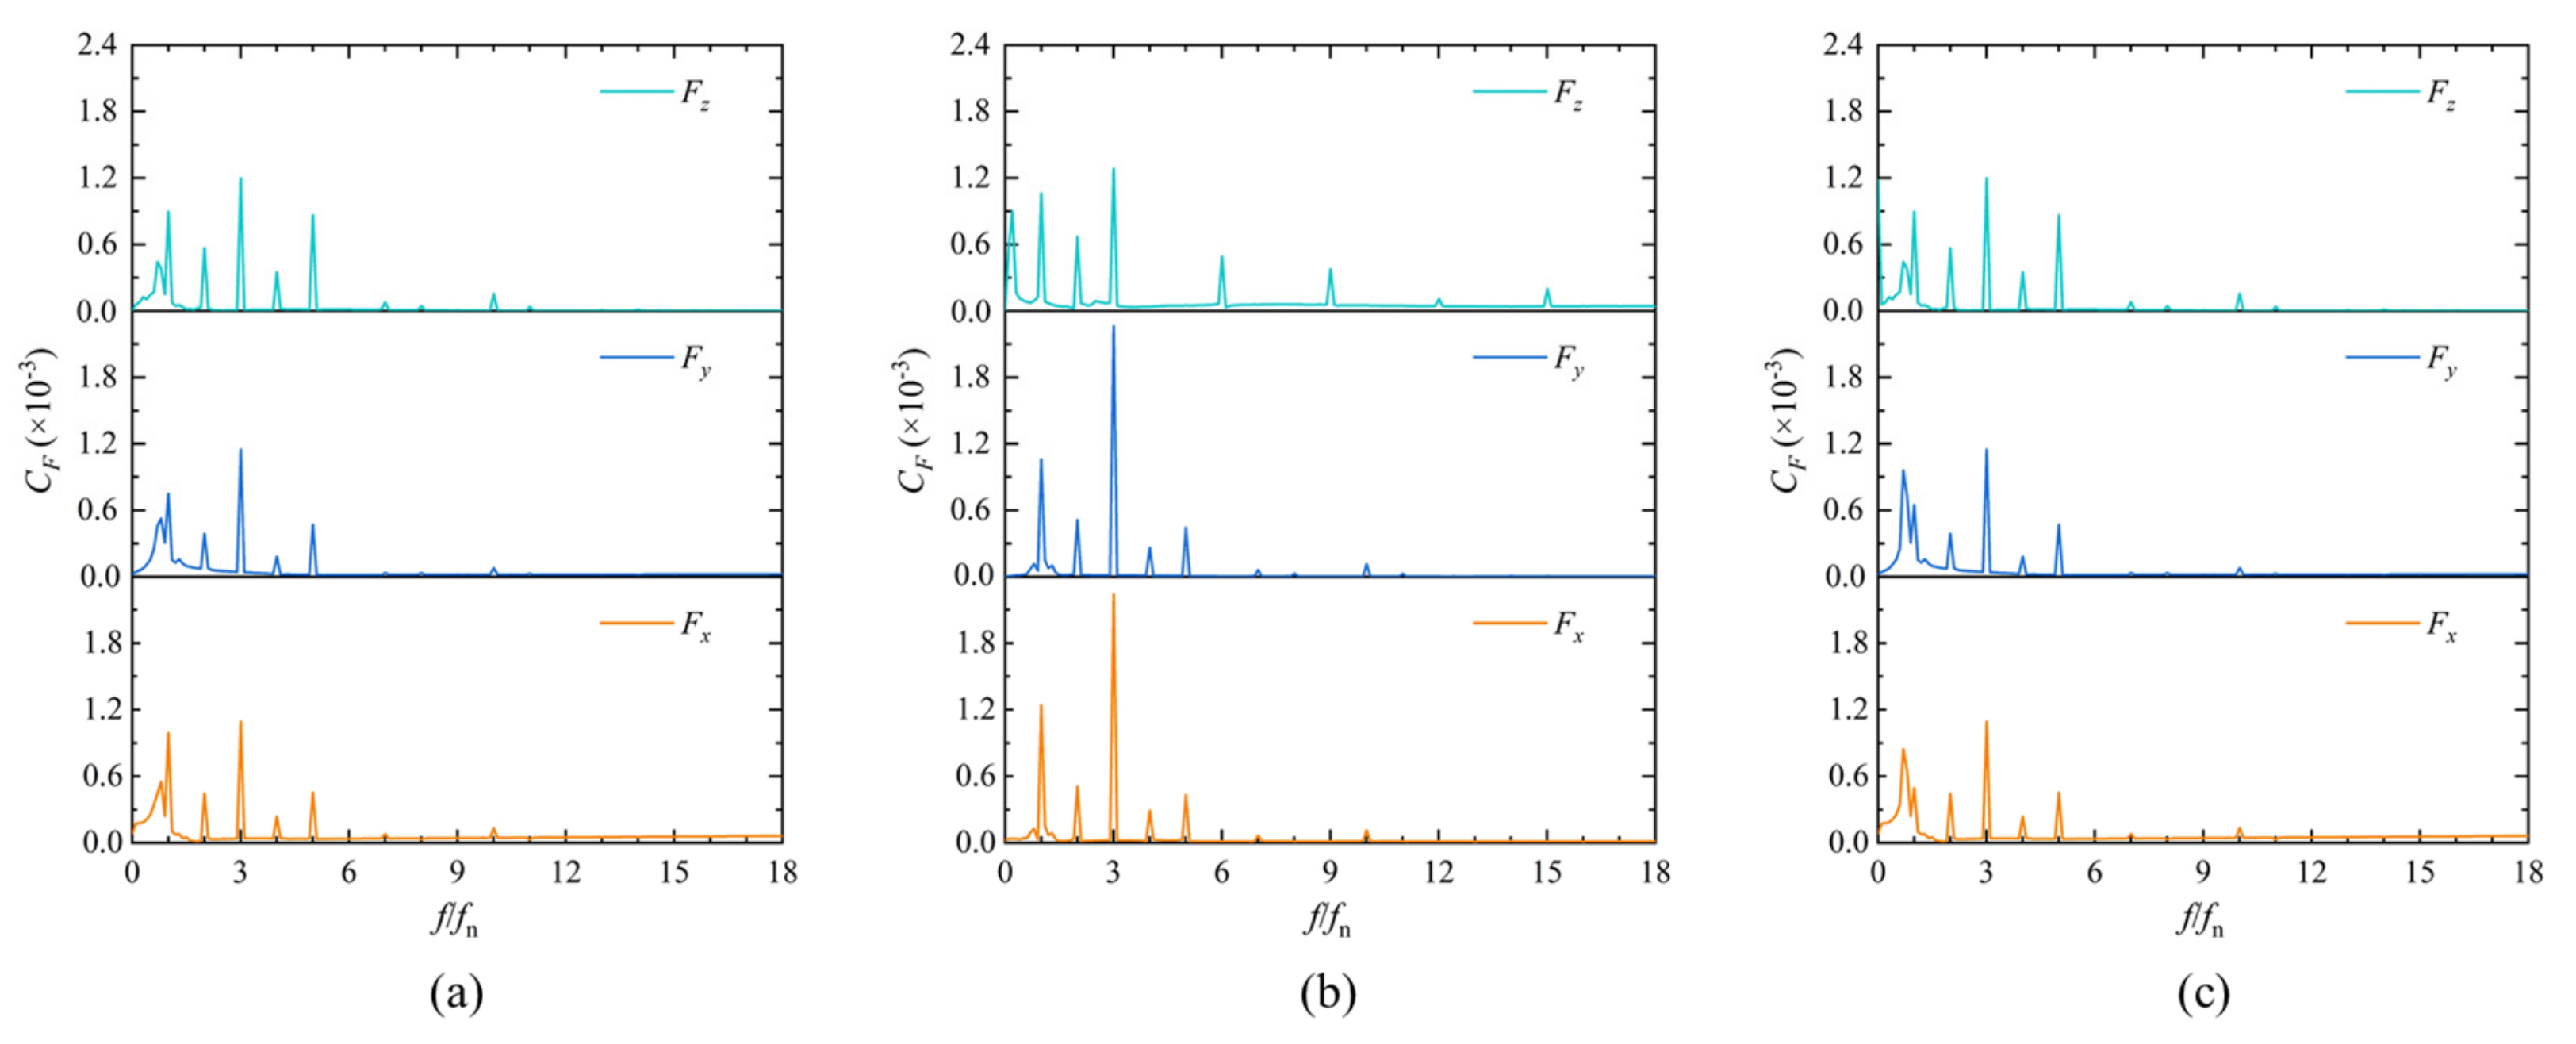
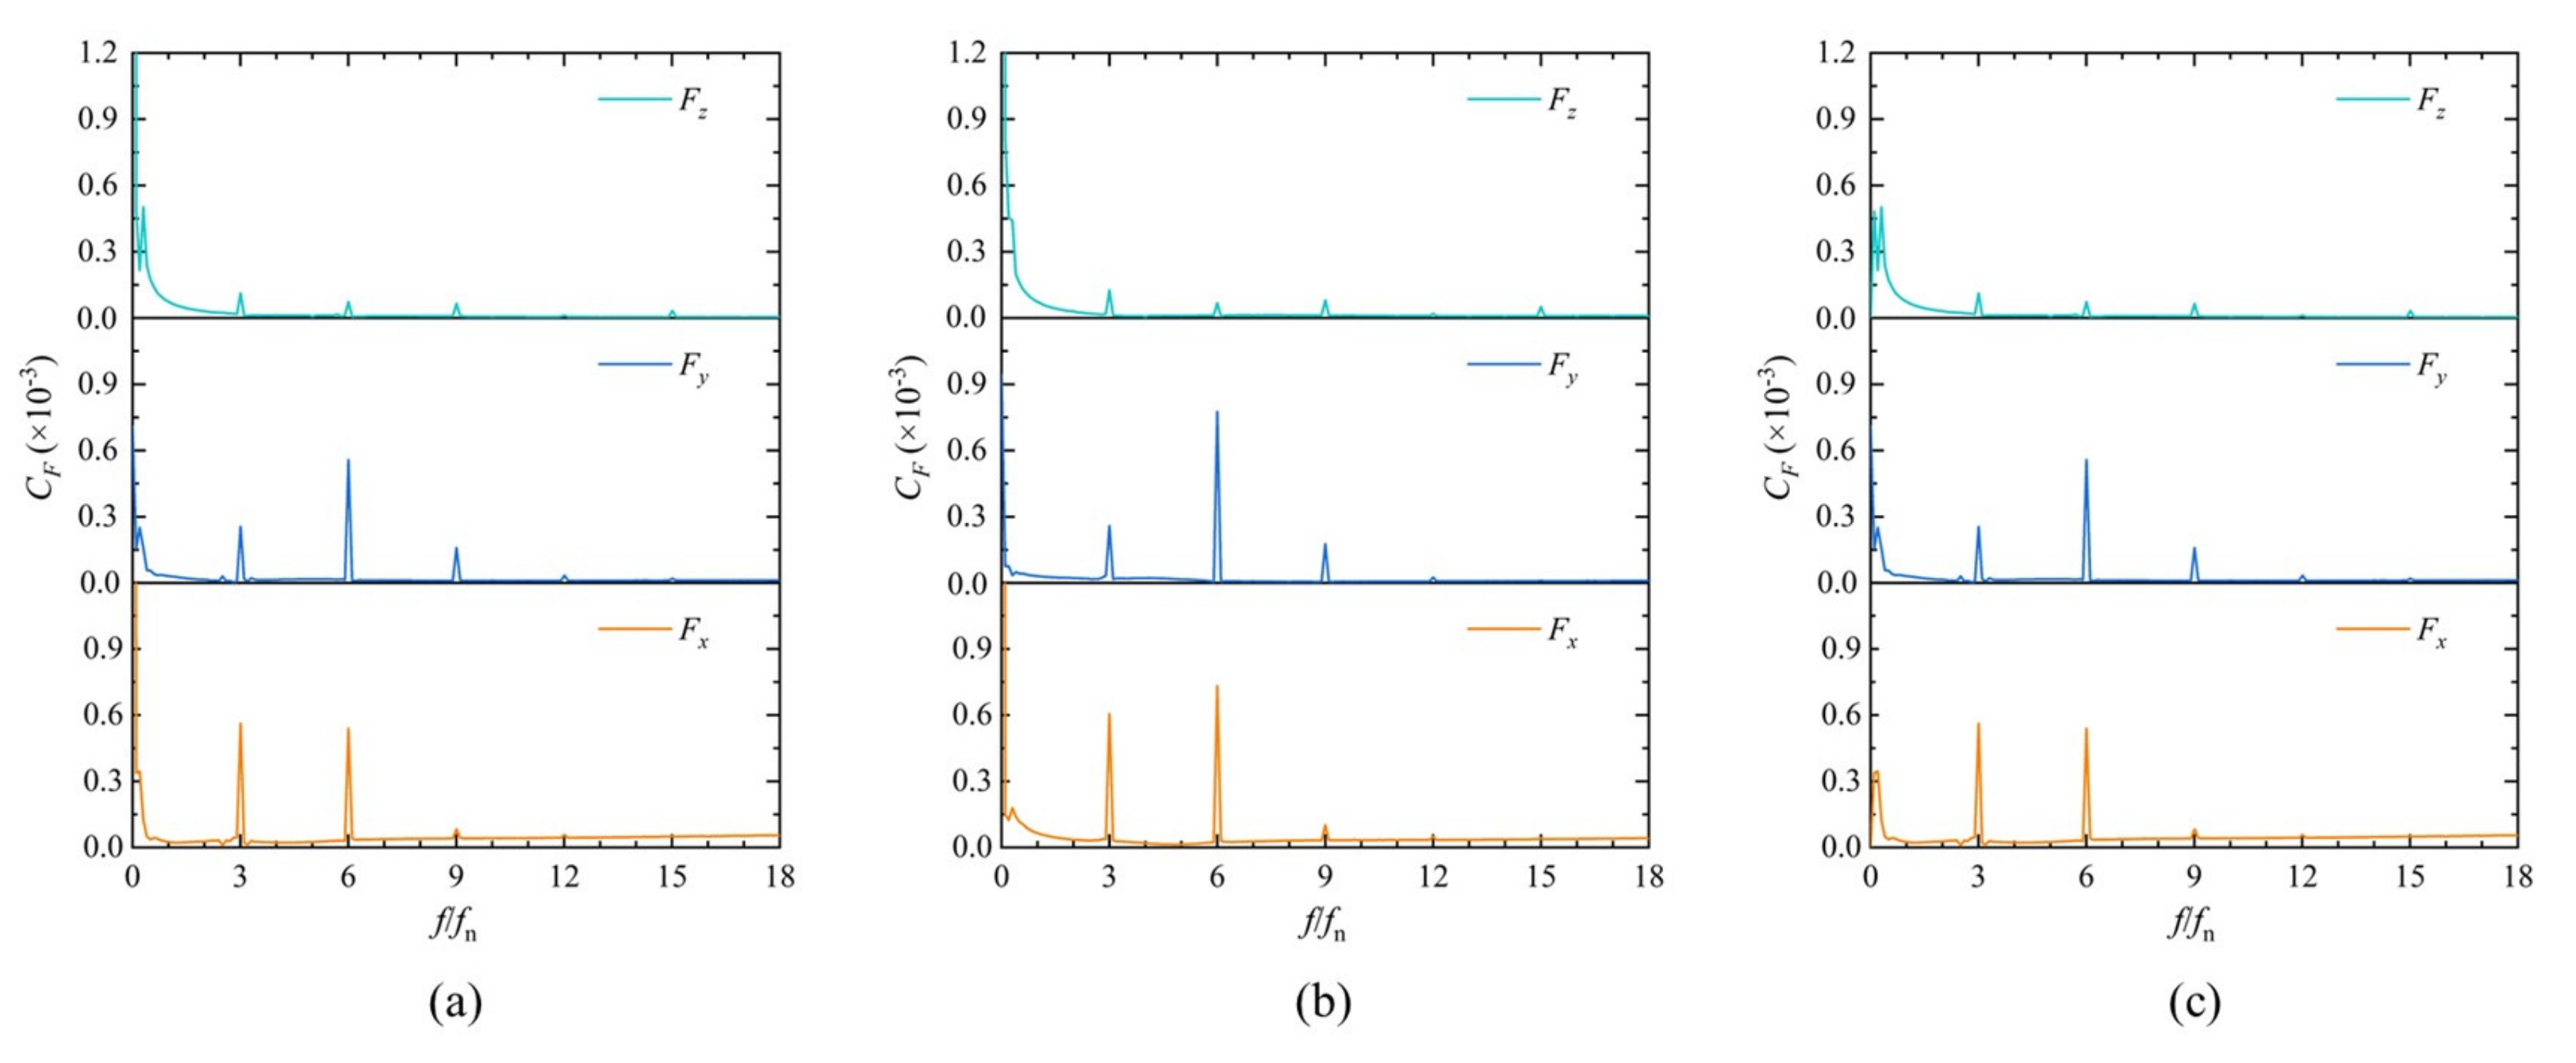
4.2. Fluid Force Pulsation Analysis of Impeller and Guide Vane

When the impeller rotates, the flow in the axial-flow PAT device will appear as a periodic pulsation, and the most obvious is the pressure pulsation of the internal flow field. Meanwhile, the force of the fluid on the flow structure changes periodically, that is, the fluid force. The pressure pulsation of the flow field will cause flow noise [38] and cavitation in the flow conduit, while the fluid force pulsation directly acts on the flow structure, resulting in structural vibration and induced noise. Further fatigue damage to the structure and reducing its life may be caused. There is a significant rotor–stator interaction in the impeller-guide vane hydraulic coupling zone, so it is necessary to investigate the fluid force acting on the impeller and guide vane. The magnitude of the fluid force is normalized to the fluid force coefficient C F [39].
C F = F 0.5 π ρ V 2 2 D 2 b 2 ,
where F is fluid force, V 2 is the circumferential velocity at the impeller outlet, D 2 is the diameter at mid-span of impeller outlet, and b 2 is the diameter of impeller outlet.
As displayed in Figure 8, the spectrum of the fluid force acting on the impeller dominates a multiple of the rotational frequency fn. The spectrum of the fluid force at different flow rates is concentrated at low frequencies, and the maximum spectrum amplitude appears at 3 fn. It indicates that the BPF component of the fluid force is mainly caused by the rotor–stator interaction of the impeller-guide vane hydraulic coupling zone. The pulsation spectrum of the fluid force in the x, y, and z directions is relatively similar, and the pulsation amplitude of the radial fluid force (Fx and Fy) of the impeller is slightly larger than that of the axial (Fz). At 1.0 Qbep, the impeller fluid force pulsation amplitude is larger than 0.8 Qbep and 1.1 Qbep. The fluid force pulsation spectrum of the guide vane is shown in Figure 9. The fluid force of the guide vane is obviously subjected to the rotor–stator interaction effect between the impeller and guide vane, and the fluid force pulsation is a significant BPF multiplier (3 fn, 6 fn, 9 fn). The dominant frequency of the fluid force on the guide vane is at 6 fn, which is mainly related to the flow field pulsation interference caused by the matching relationship between the impeller and the number of guide vane blades. Compared with the spectral amplitude of the fluid force on the guide vane in the x and y directions, the spectral amplitude of the fluid force on the guide vane in the z direction appears to be insignificant. It can be known that the effect of rotor–stator interaction between the impeller and guide vane is not very obvious in the guide vane axial direction (z direction). The direction of the fluid force acting on the impeller and guide vane is mainly in the radial direction, and the force in the axial direction is small.

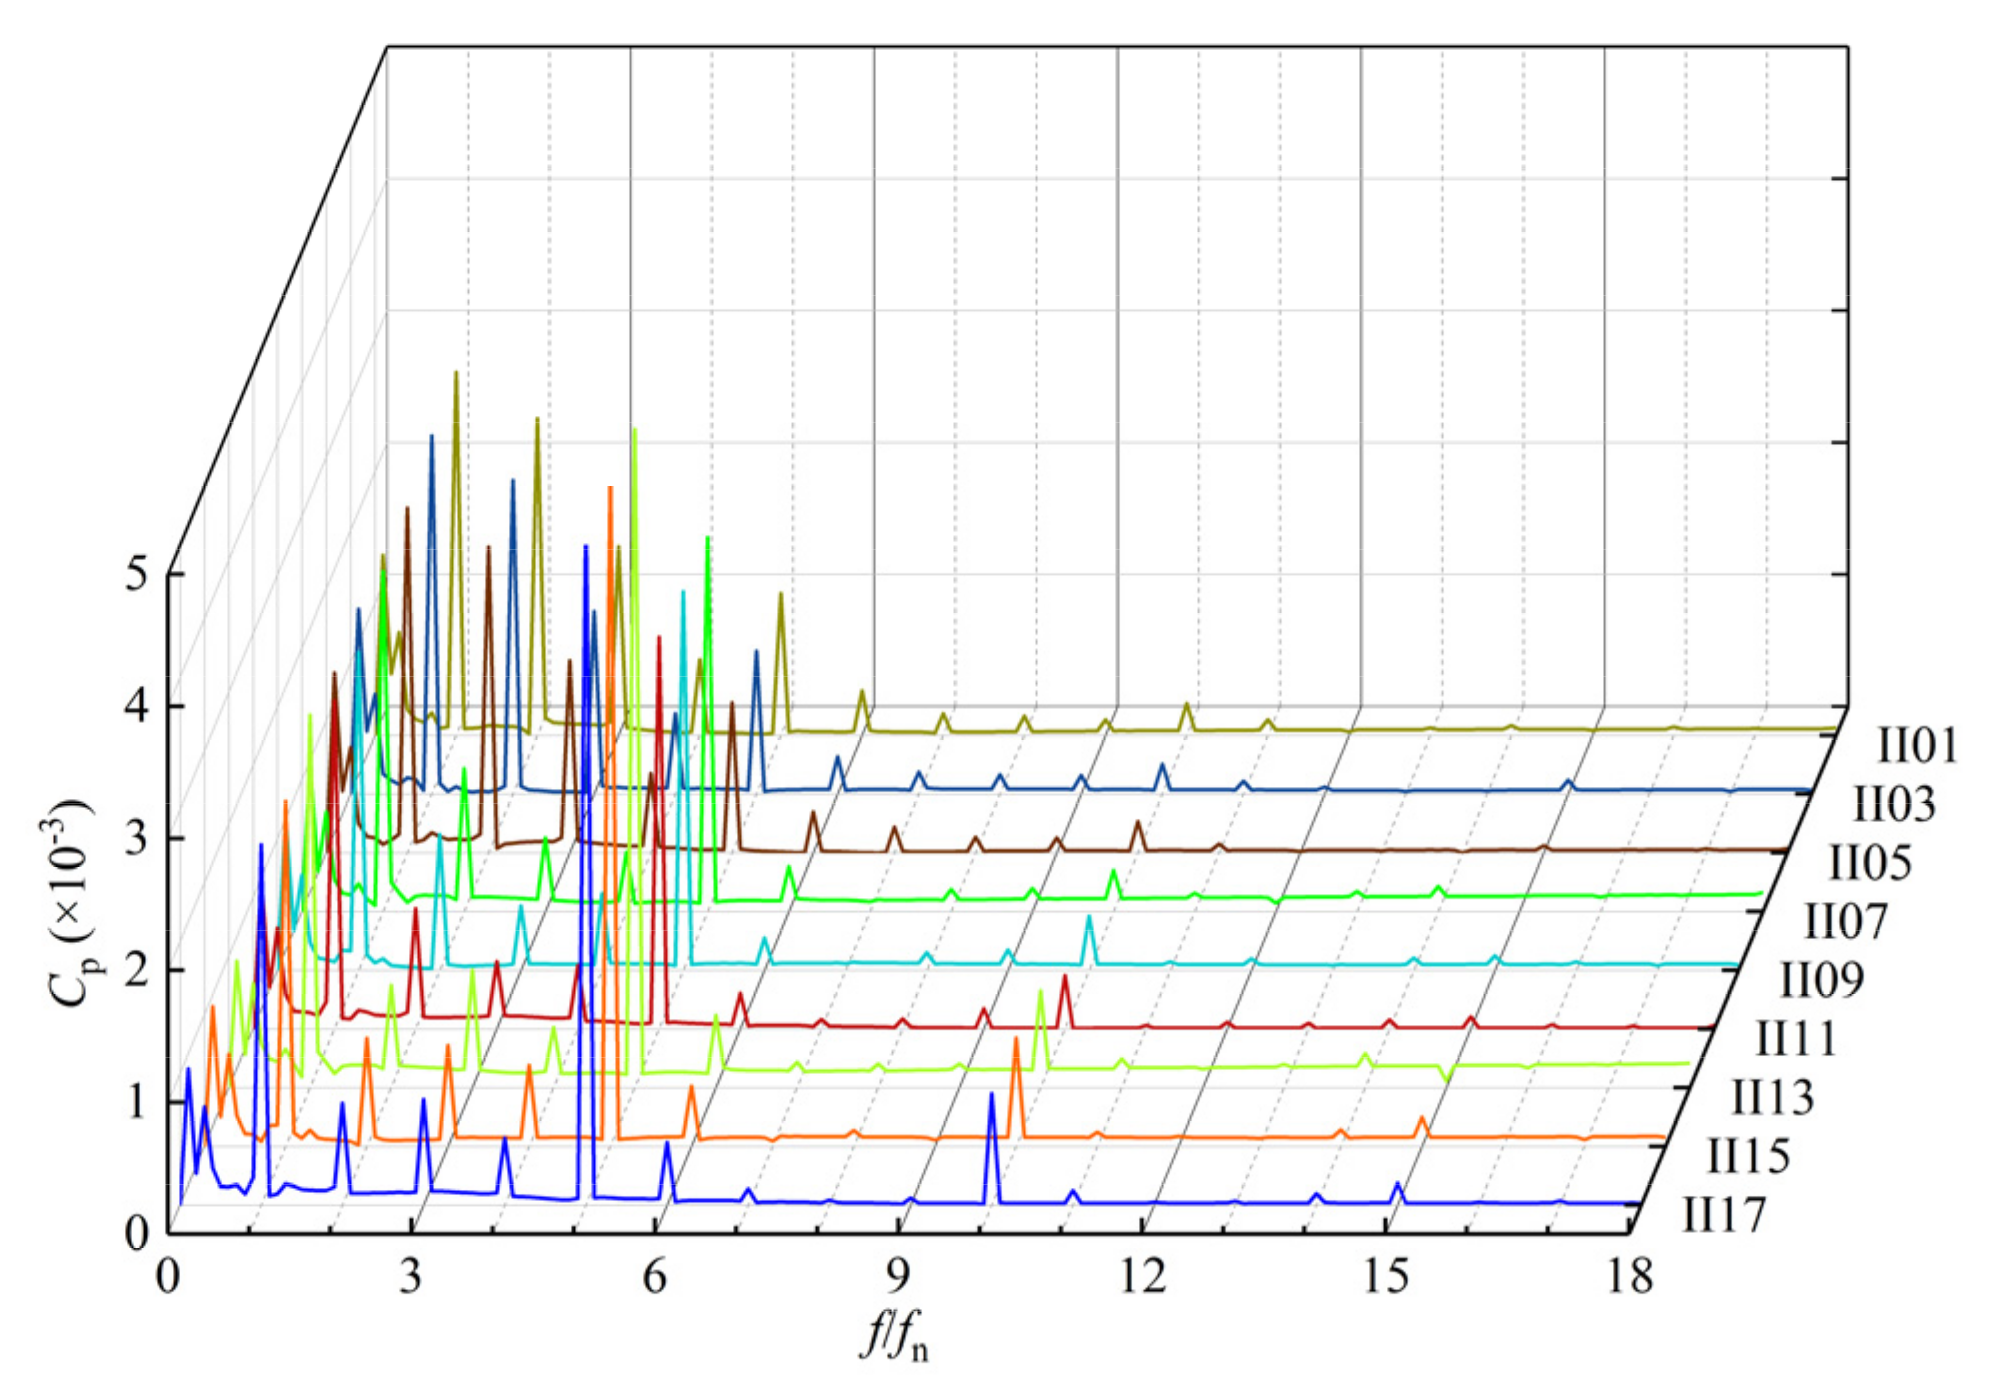
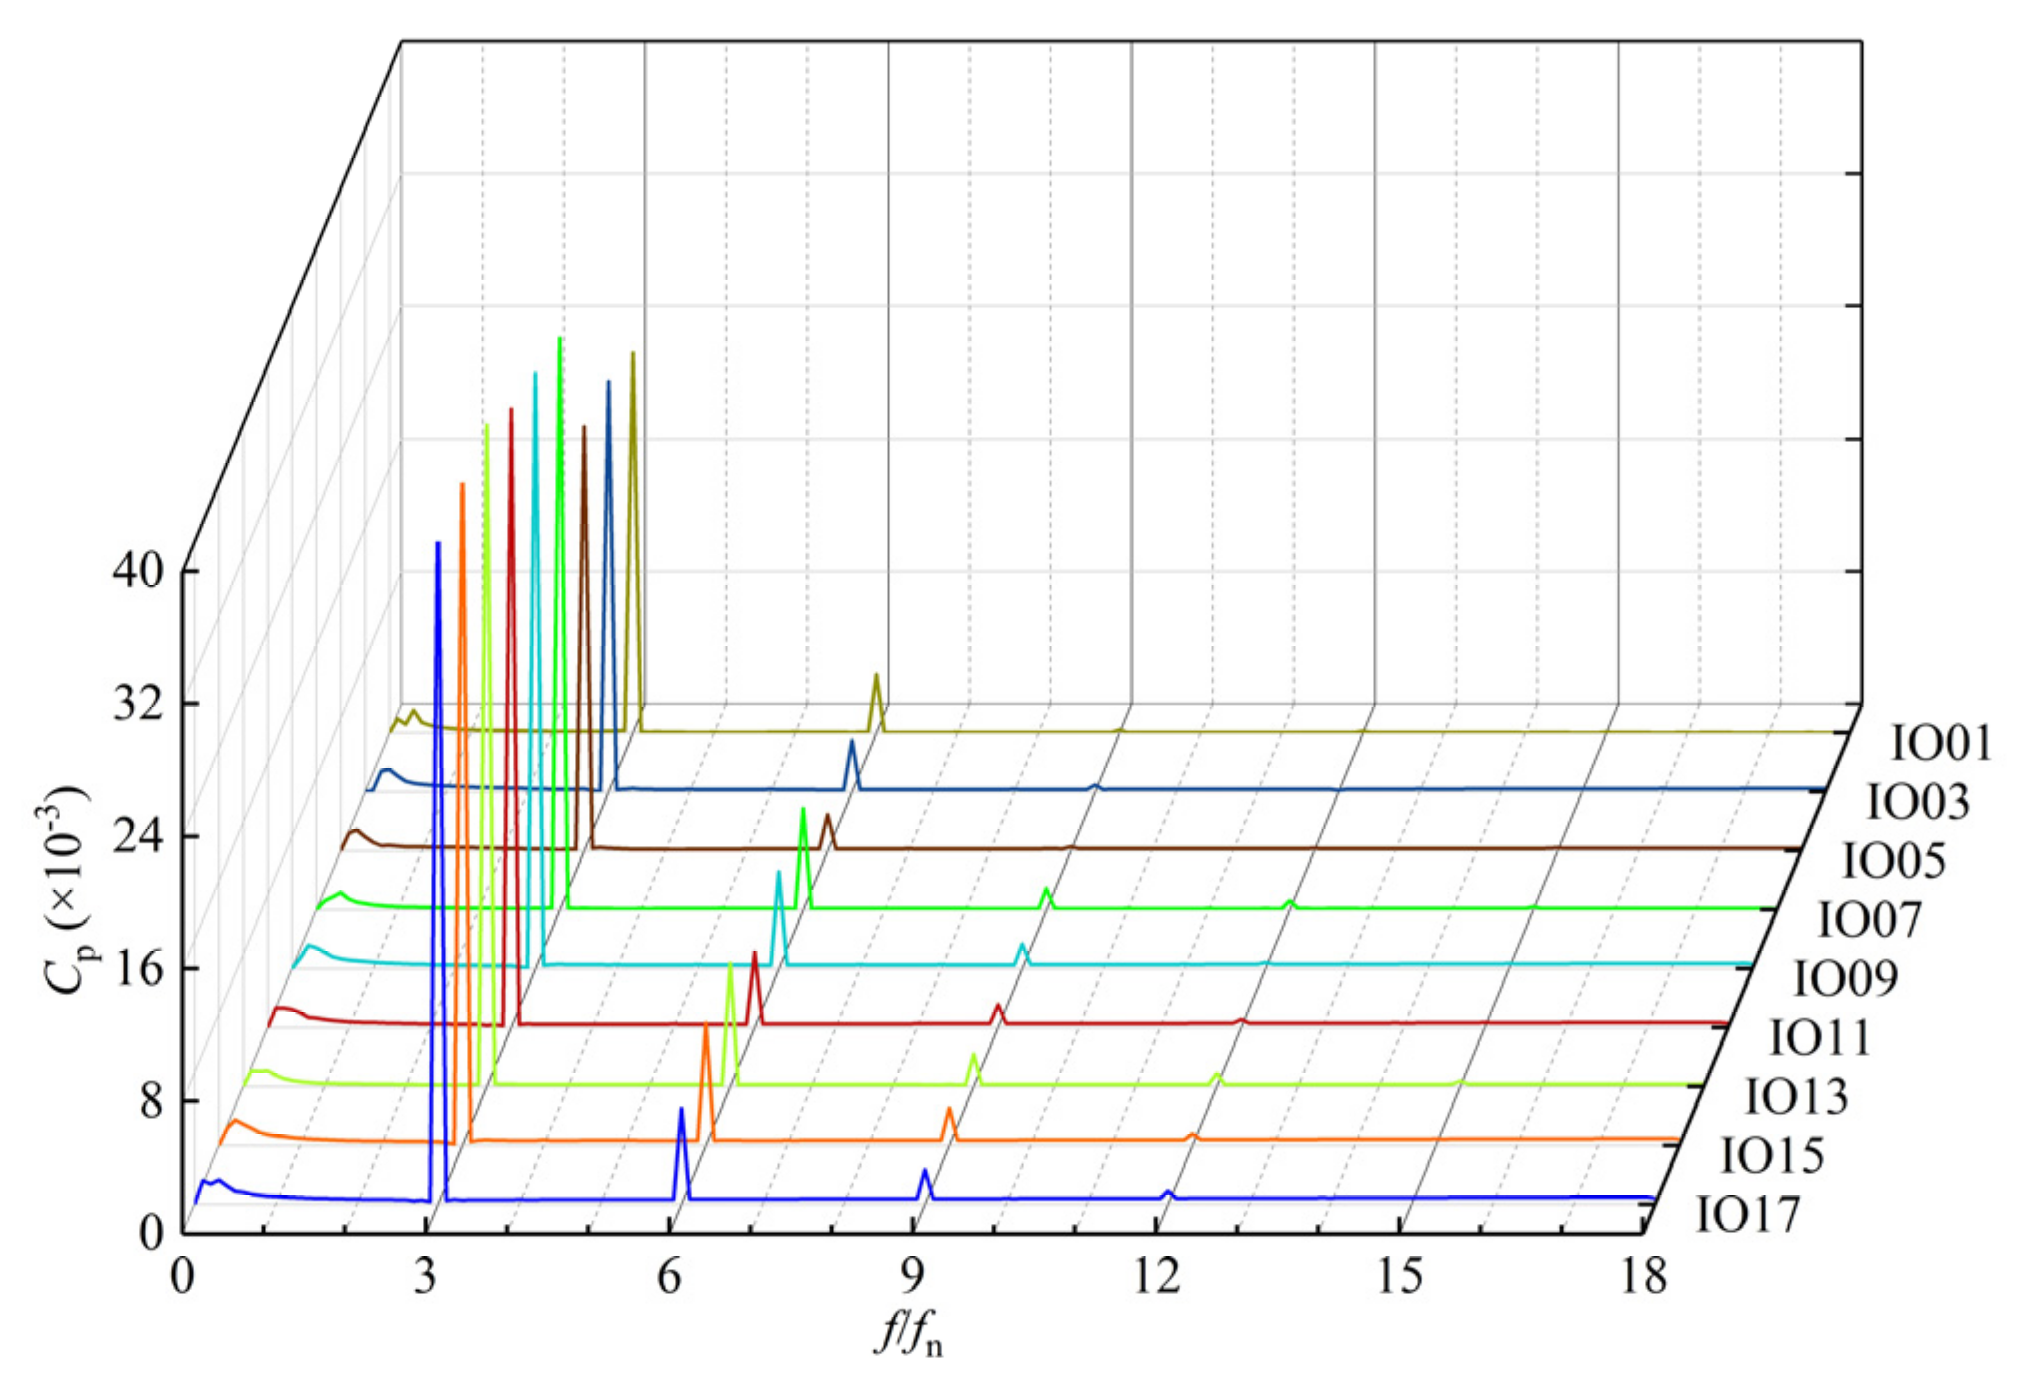
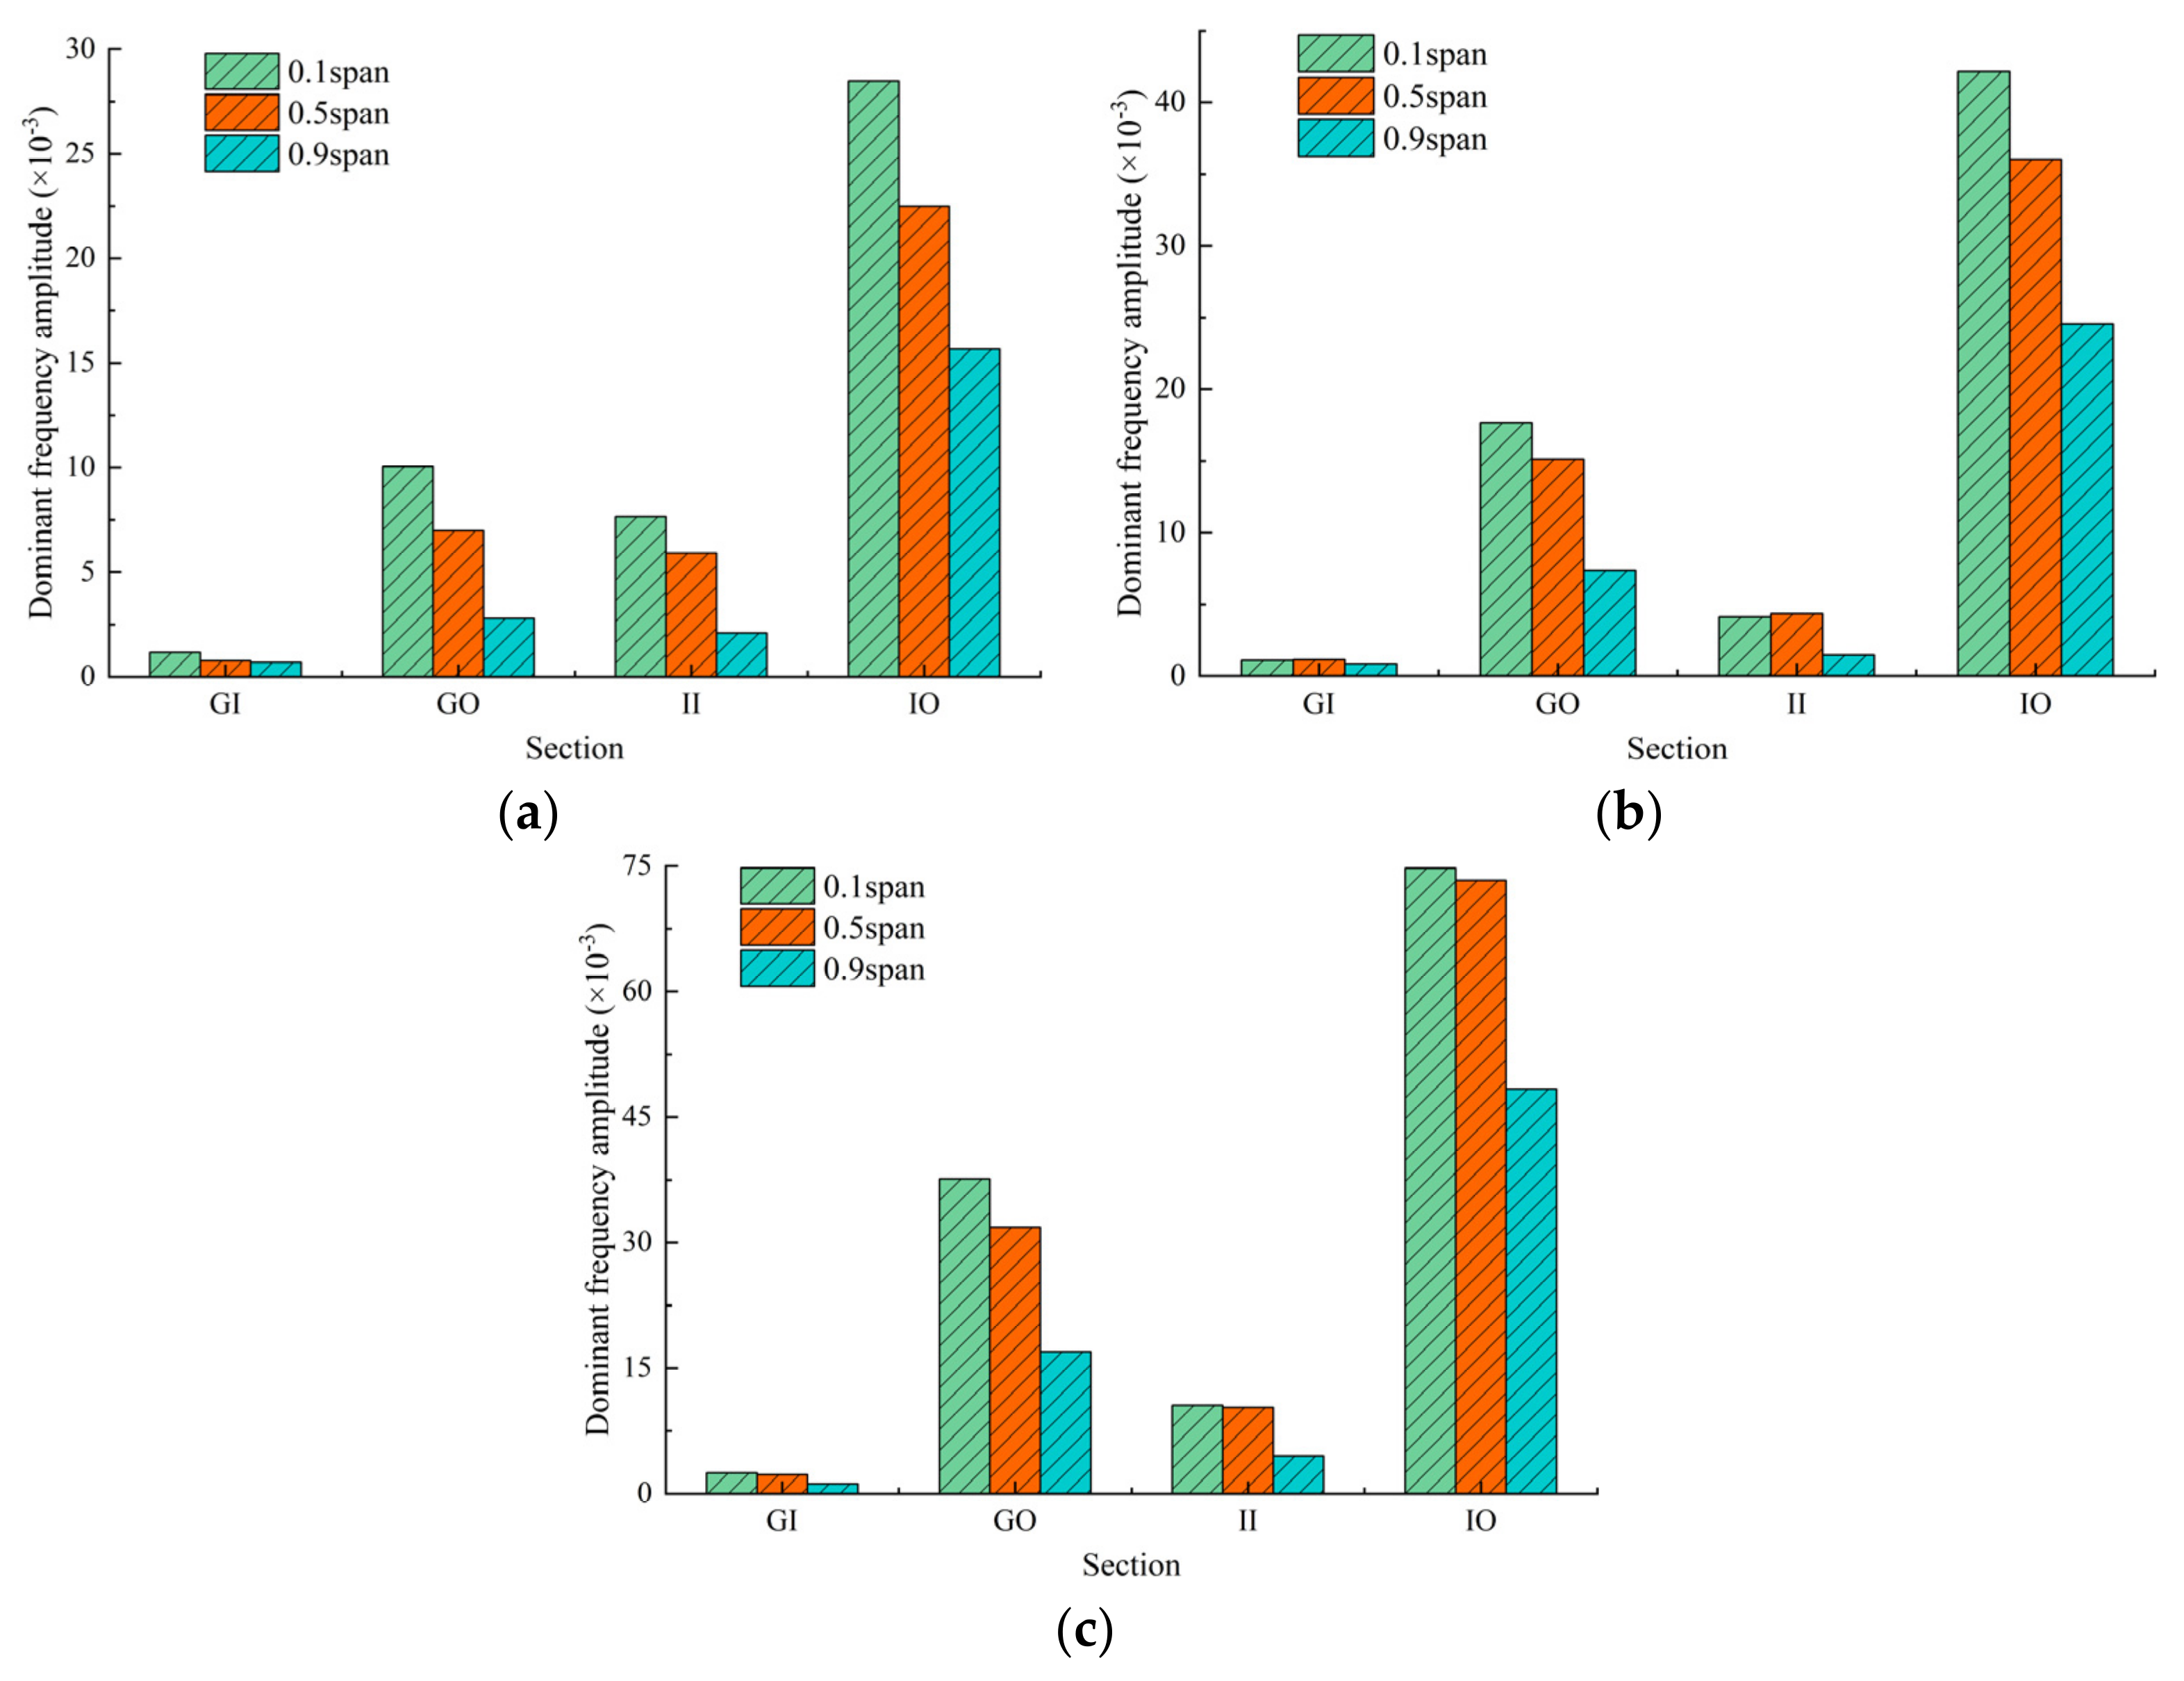
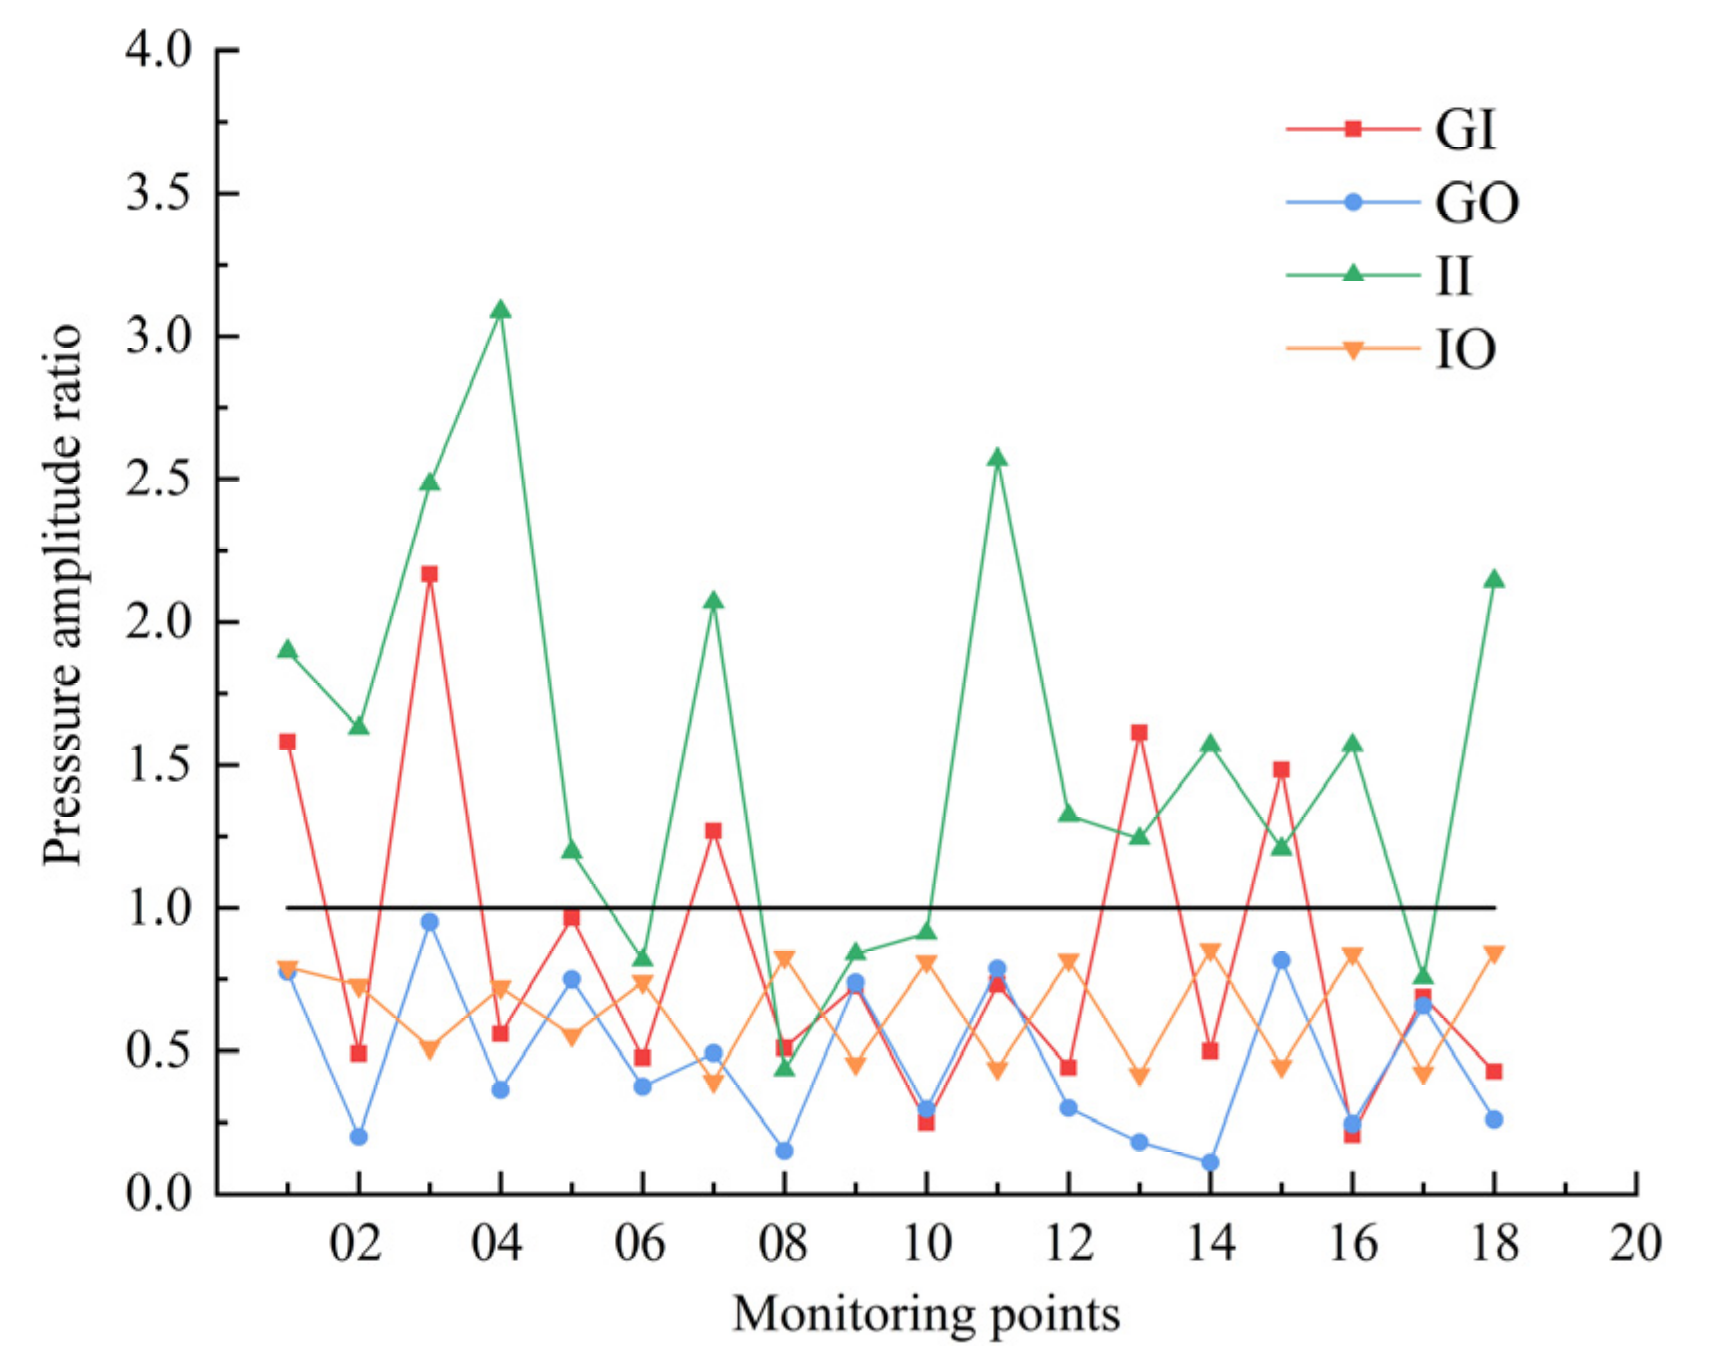
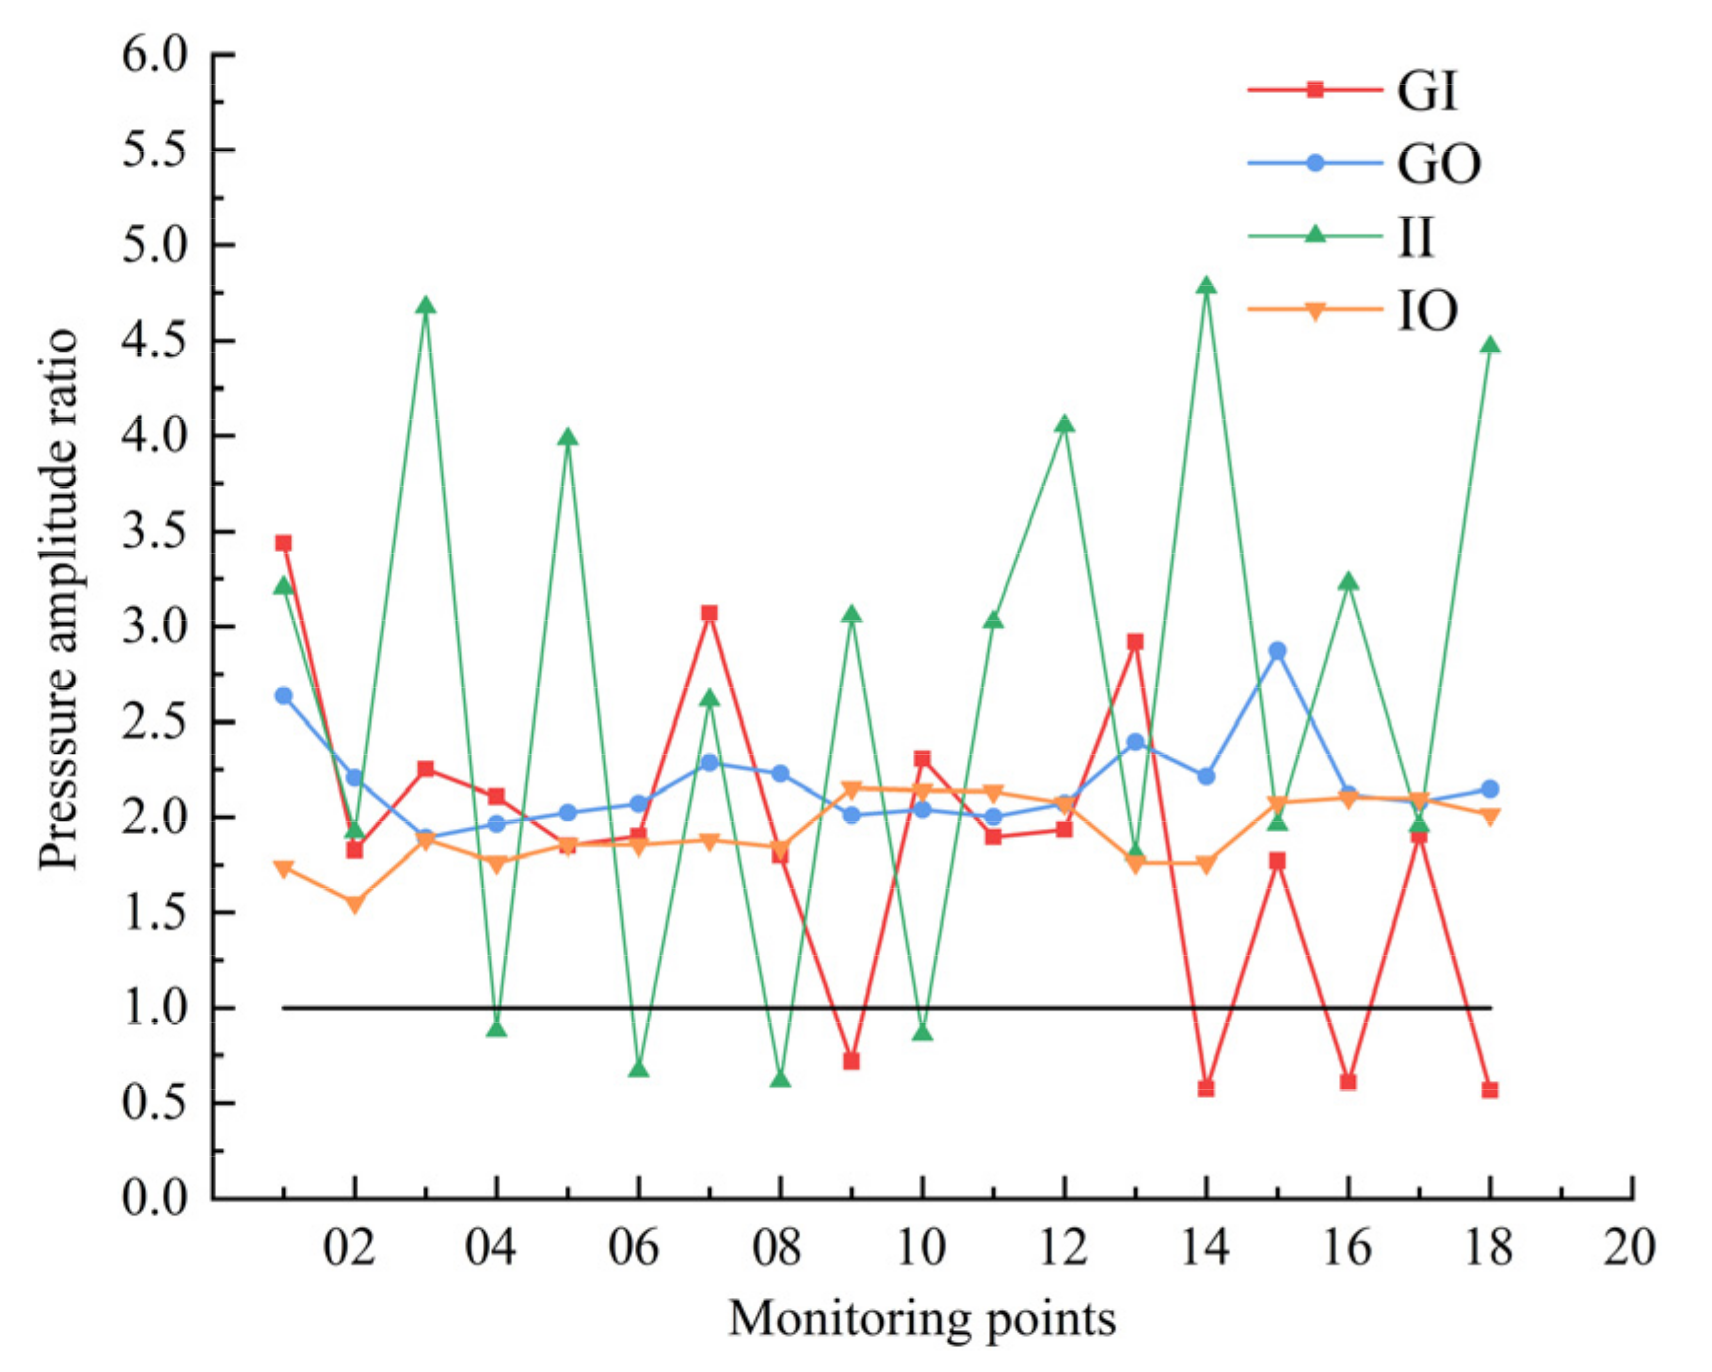
4.3. Analysis of Pressure Pulsation in Impeller-Guide Vane Hydraulic Coupling Zone

While the axial-flow PAT device works, the hydraulic-induced flow instability is the key factor affecting the instability of the whole system. When the impeller rotates, the finite number of impeller blades induces uneven distribution of the flow field, resulting in periodic changes in the flow field parameters. The most obvious is the periodic pulsation of the pressure in the flow field, the periodic pulsation of the fluid and the static structure to produce a strong coupling effect, and the formation of the “rotor-stator interaction” phenomenon. Strong pressure pulsation and the rotor–stator interaction phenomenon has a profound impact for the stability of the total system.
In order to study the pressure pulsation characteristics of the impeller-guide vane hydraulic coupling zone at different operating conditions of the axial-flow PAT, several pressure pulsation monitoring points were arranged in four typical cross-sections of the guide vane inlet (GI), guide vane outlet (GO), impeller inlet (II), and impeller outlet (IO), as displayed in Figure 10. Eighteen monitoring points are positioned in each cross-section, evenly distributed in three spans (0.9 span, 0.5 span, and 0.1 span). Among them, the pressure pulsation monitoring points PA and PB near the wall correspond to the pressure sensors P1 and P2 in the physical experimental test bench, respectively (Figure 3).
Figure 11 compares the pressure pulsation spectrum from the experimental test with the numerical simulation. The dominant frequency of both the numerical simulation and the test at the two monitoring points are the BPF (3 fn = 46.5 Hz), and the other frequency components are mainly multiples of the impeller rotational frequency. Compared with the numerical simulation results, the pressure pulsation spectrum obtained from the experimental measurements had more low-frequency components, which was the main difference. The validity of the results of the numerical simulation can be confirmed by comparing the dominant frequency and harmonic frequency laws of pressure pulsation between the numerical simulation and experiment.
Figure 12 and Figure 13 show the pressure pulsation spectra processed by Fast Fourier Transformation (FFT) at a 1.0 Qbep flow rate on GI and GO planes, respectively. The pressure pulsation spectra of the GI and GO have obvious similarity, that is, the frequency components of each monitoring point are mainly the BPF (3 fn) and its harmonic frequency. The maximum pulsation amplitude is at 3 times the rotational frequency, and the amplitude decreases sequentially with the increase in frequency. The pressure pulsation amplitude guide vane at various spans does not change noticeably from one another, and the reason for the inequalities in the amplitude of pressure pulsation at the same span is the unevenness of the flow field. The pulsation amplitude of GO is significantly larger than GI, and the pulsation amplitude of the BPF is the most significant. This is because the closer to the impeller, the more obvious the effect of the rotor–stator interaction and the greater the fluctuation amplitude of pressure.
Figure 14 and Figure 15 are the pulsation spectrum of some monitoring points on the II and IO planes at 1.0 Qbep. The pulsation spectrum of the II and IO has an obvious difference. The frequency component of the impeller inlet is mainly the multiple of the impeller rotation frequency fn. Among them, the frequency components and spectrum amplitudes of the monitoring points II01, II03, and II05 (0.9 span) is fn. The dominant frequency of the monitoring points at 0.5 span and 0.1 span is 5 times the impeller rotational frequency, namely the guide vane blade frequency. It shows that the guide vane has a great influence on the flow field of plane II. The pulsation spectrum of plane IO is the impeller BPF and its harmonic frequency (Figure 15). In addition, the amplitude of the dominant frequency is greatly increased compared with that of the II plane.
The pressure distribution of the four typical sections is shown in Figure 16. There is a significant low pressure distribution half at the GI plane. This is because when the flow enters the guide vane from the elbow, a low-pressure area is formed locally due to centrifugal force. The pressure distribution at the GO shows five “petal-shaped”, low-pressure areas near the hub. The flow field is evidently influenced by the rectification effect of the guide vane blades. In the II and IO sections exist three high-pressure and low-pressure areas alternately distributed, and the high-pressure area range of IO equals to the impeller blade area. The strong non-uniform distribution of the pressure field at II and IO is a concrete manifestation of the huge pressure fluctuation amplitude, further reflecting the strength of the rotor–stator interaction effect.
The pressure coefficients of the monitoring points at 0.8 Qbep and 1.1 Qbep are transformed by FFT, and it is found that the pulsation spectrum at different flow rates has a certain similarity. The pressure pulsation dominant frequency amplitudes of all monitoring points on 0.1 span, 0.5 span, and 0.9 span are averaged separately, as shown in Figure 17. It can be seen intuitively that the dominant frequency amplitude of the pressure pulsation on different sections decreases from the hub to the shroud, with the largest decrease in the dominant frequency amplitude at the IO. The dominant frequency amplitude of the GI is the smallest and is less affected by the flow variation. The dominant frequency amplitude at IO is most significantly influenced by the flow rate. This is related to the high-speed rotation of the impeller and the huge kinetic energy contained in the outflow. Benefiting from the rectification effect of the guide vanes, the dominant frequency amplitude at the II is relatively small, and the non-uniformity of the flow field is significantly improved.
In order to explore the influence of flow rate on the pressure pulsation in the impeller-guide vane hydraulic coupling zone, the amplitude ratio of the pressure spectrum at each monitoring point is defined as the ratio of the dominant frequency amplitude at other flow rates to the dominant frequency amplitude at the optimal flow rate (1.0 Qbep). Figure 18 shows the amplitude ratio of the monitoring points on different spans at 0.8 Qbep. It can be seen that the amplitude ratios GO and IO fluctuate slightly with the change of monitoring points, with an average ratio of 0.47 and 0.65, respectively. The amplitude ratio of the GI fluctuates around 1, while the amplitude ratio of most monitoring points at the impeller inlet is greater than 1. The reason for this phenomenon is the unevenness of flow field distribution caused by the impeller rotation. Figure 19 is the amplitude ratio of the monitoring points on different spans under 1.1 Qbep. The typical feature is that the amplitude ratio of different spans is greater than 1. The fluctuation range of the amplitude ratio of the GI and the II is larger, and the ratios are 1.86 and 2.65, respectively, while the amplitude ratios of the GO and the IO appears to be more stable, with an average of 2.18 and 1.93. In summary, the flow rate has a significant effect on the pressure fluctuation amplitude of the four typical sections, and the fluctuation amplitudes of GO and IO are positively correlated with the flow rate to a certain extent. The fluctuation amplitude ratio of GI to II is more sensitive to the flow rate change, which is related to the unevenness of the flow field.

5. Conclusions

This paper studies the unsteady flow characteristics of the impeller-guide vane hydraulic coupling zone of the axial-flow PAT and conducts a detailed analysis of several aspects, such as internal flow characteristics, fluid forces of the impeller and guide vane, and pressure pulsation characteristics of typical sections. The following conclusions are summarized.
The pressure distribution in different spans of the impeller-guide vane hydraulic coupling zone has significant differences, showing the law of gradually increasing pressure from hub to shroud. The region of the pressure gradient contracts as the flow rate rises, while the pressure gradient of the impeller leading edge and the trialing edge increases significantly. The flow rate increase prompted the impeller blade suction surface of the low-pressure area of the expanding range, with no significant impact on the static pressure of the pressure surface.
The fluid force of the impeller and guide vane is obviously influenced by the rotor–stator interaction effect of the rotating impeller and static guide vane, and the fluid force spectrum of the impeller and guide vane is composed of the impeller rotational frequency and its harmonic frequency. The pulsation amplitude of the axial component of the fluid force (Fz) is small, and the pulsation amplitude of the Fx and Fy components of the fluid force is large and of equal magnitude, indicating that the fluid force of the impeller and guide vane is concentrated in the radial direction.
By contrasting the energy performance and pressure pulsation characteristics of the test and numerical simulation, the accuracy of the simulation’s results is confirmed. The magnitude of the pressure pulsation in the impeller-guide vane hydraulic coupling zone gradually decreases from the hub to the shroud, and the effect of the rotor–stator interaction gradually increases sequentially from the guide vane inlet, guide vane outlet, and impeller inlet to impeller outlet. The pulsation amplitude of the guide vane inlet and impeller inlet is positively correlated with the flow rate to a certain extent, while the pressure pulsation amplitude of the guide vane outlet and impeller outlet section is more sensitive to the flow rate change.

Author Contributions

Conceptualization, F.Y. and Z.L.; Methodology, F.Y.; Software, F.Y. and Z.L.; Writing—Original draft preparation, Z.L.; Formal analysis, Z.L. and J.L.; Investigation, Y.L. and G.Z.; Resources, F.Y. and J.L.; Visualization, Z.L., A.N. and G.Z.; Writing—Review and Editing, F.Y. and Y.L.; Supervision, J.L. All authors have read and agreed to the published version of the manuscript.

Funding

This research was funded by National Natural Science Foundation of China (Grant No. 51609210), Major Projects of the Natural Science Foundation of the Jiangsu Higher Education Institutions of China (Grant No. 20KJA570001), the Technology Project of the Water Resources Department of Jiangsu Province (Grant No. 2022074), the Science and Technology Plan Project of Yangzhou City (Grant No. YZ2022192), Open Project of Jiangxi Research Center on Hydraulic Structures (2021SKSG06), and the Scientific Research Program of Jiangsu Hydraulic Research Institute (Grant No. 2021).

Institutional Review Board Statement

Not applicable.

Informed Consent Statement

Not applicable.

Data Availability Statement

All data is available in this paper.

Conflicts of Interest

The authors declare no conflict of interest.

References

  1. Ocko, I.B.; Hamburg, S.P. Climate impacts of hydropower: Enormous differences among facilities and over time. Environ. Sci. Technol. 2019, 53, 14070–14082. [Google Scholar] [CrossRef] [PubMed]
  2. Qiu, T.; Wang, L.; Lu, Y.; Zhang, M.; Qin, W.; Wang, S.; Wang, L. Potential assessment of photovoltaic power generation in China. Renew. Sustain. Energy Rev. 2022, 154, 111900. [Google Scholar] [CrossRef]
  3. Dong, Y.; Lakshminarayana, B.; Maddock, D. Steady and Unsteady Flow Field at Pump and Turbine Exits of a Torque Converter. J. Fluids Eng. 1998, 120, 538–548. [Google Scholar] [CrossRef]
  4. Yang, J.; Pavesi, G.; Liu, X.; Xie, T.; Liu, J. Unsteady flow characteristics regarding hump instability in the first stage of a multistage pump-turbine in pump mode. Renew. Energy 2018, 127, 377–385. [Google Scholar] [CrossRef]
  5. Ran, H.; Luo, X.; Zhang, Y.; Zhuang, B.; Xu, H. Numerical simulation of the unsteady flow in a high-head pump turbine and the runner improvement. In Proceedings of the Fluids Engineering Division Summer Meeting 2008, Jacksonville, FL, USA, 10–14 August 2008; Volume 48401, pp. 1115–1123. [Google Scholar]
  6. Hu, X.; Zhang, L. Numerical simulation of unsteady flow for a pump-turbine in transition cases with large-eddy simulation. Water Energy Int. 2019, 61, 75. [Google Scholar]
  7. Binama, M.; Kan, K.; Chen, H.X.; Zheng, Y.; Zhou, D.; Su, W.T.; Muhirwa, A.; Ntayomba, J. Flow instability transferability characteristics within a reversible pump turbine (RPT) under large guide vane opening (GVO). Renew. Energy 2021, 179, 285–307. [Google Scholar] [CrossRef]
  8. Zuo, Z.; Fan, H.; Liu, S.; Wu, Y. S-shaped characteristics on the performance curves of pump-turbines in turbine mode—A review. Renew. Sustain. Energy Rev. 2016, 60, 836–851. [Google Scholar] [CrossRef]
  9. Lu, G.; Zuo, Z.; Liu, D.; Liu, S. Energy balance and local unsteady loss analysis of flows in a low specific speed model pump-turbine in the positive slope region on the pump performance curve. Energies 2019, 12, 1829. [Google Scholar] [CrossRef] [Green Version]
  10. Binama, M.; Su, W.T.; Li, X.B.; Li, F.C.; Wei, X.Z.; An, S. Investigation on pump as turbine (PAT) technical aspects for micro hydropower schemes: A state-of-the-art review. Renew. Sustain. Energy Rev. 2017, 79, 148–179. [Google Scholar] [CrossRef]
  11. Wang, T.; Wang, C.; Kong, F.; Gou, Q.; Yang, S. Theoretical, experimental, and numerical study of special impeller used in turbine mode of centrifugal pump as turbine. Energy 2017, 130, 473–485. [Google Scholar] [CrossRef]
  12. Chen, T.J.; Luo, X.Q.; Guo, P.C.; Wu, Y.L. 3-D Simulation of a prototype pump-turbine during starting period in turbine model. IOP Conf. Ser. Mater. Sci. Eng. 2013, 52, 052028. [Google Scholar] [CrossRef] [Green Version]
  13. Su, X.; Huang, S.; Zhang, X.; Yang, S. Numerical research on unsteady flow rate characteristics of pump as turbine. Renew. Energy 2016, 94, 488–495. [Google Scholar] [CrossRef]
  14. Pugliese, F.; De Paola, F.; Fontana, N.; Giugni, M.; Marini, G. Experimental characterization of two pumps as turbines for hydropower generation. Renew. Energy 2016, 99, 180–187. [Google Scholar] [CrossRef]
  15. Qian, Z.; Wang, F.; Guo, Z.; Lu, J. Performance evaluation of an axial-flow pump with adjustable guide vanes in turbine mode. Renew. Energy 2016, 99, 1146–1152. [Google Scholar] [CrossRef]
  16. Han, Y.; Tan, L. Dynamic mode decomposition and reconstruction of tip leakage vortex in a mixed flow pump as turbine at pump mode. Renew. Energy 2020, 155, 725–734. [Google Scholar] [CrossRef]
  17. Zobeiri, A. Investigations of Time Dependent Flow Phenomena in a Turbine and a Pump-Turbine of Francis Type. Ph.D. Thesis, Laboratory for Hydraulic Machines, Lausanne, Switzerland, 2009. [Google Scholar]
  18. Trivedi, C. Compressible large eddy simulation of a Francis turbine during speed-no-load: Rotor stator interaction and inception of a vortical flow. J. Eng. Gas Turbines Power 2018, 140, 112601. [Google Scholar] [CrossRef]
  19. Zhang, H.; Shi, W.D.; Bin, C.; Zhang, Q.H.; Cao, W.D. Experimental study of flow field in interference area between impeller and guide vane of axial flow pump. J. Hydrodyn. Ser. B 2015, 26, 894–901. [Google Scholar] [CrossRef]
  20. Al-Obaidi, A.R. Influence of guide vanes on the flow fields and performance of axial pump under unsteady flow conditions: Numerical study. J. Mech. Eng. Sci. 2020, 14, 6570–6593. [Google Scholar] [CrossRef]
  21. Yan, J.; Koutnik, J.; Seidel, U.; Hübner, B. Compressible simulation of rotor-stator interaction in pump-turbines. Int. J. Fluid Mach. Syst. 2010, 3, 315–323. [Google Scholar] [CrossRef] [Green Version]
  22. Nicolet, C.; Ruchonnet, N.; Alligné, S.; Koutnik, J.; Avellan, F. Hydroacoustic simulation of rotor-stator interaction in resonance conditions in Francis pump-turbine. IOP Conf. Ser. Earth Environ. Sci. 2010, 12, 012005. [Google Scholar] [CrossRef]
  23. Rodriguez, C.G.; Mateos-Prieto, B.; Egusquiza, E. Monitoring of rotor-stator interaction in pump-turbine using vibrations measured with on-board sensors rotating with shaft. Shock. Vib. 2014, 2014, 276796. [Google Scholar] [CrossRef] [Green Version]
  24. Guo, S.; Okamoto, H. An experimental study on the fluid forces induced by rotor-stator interaction in a centrifugal pump. Int. J. Rotating Mach. 2003, 9, 135–144. [Google Scholar] [CrossRef]
  25. Li, W.; Ji, L.; Shi, W.; Yang, Y.; Awais, M.; Wang, Y.; Xu, X. Correlation research of rotor–stator interaction and shafting vibration in a mixed-flow pump. J. Low Freq. Noise Vib. Act. Control. 2020, 39, 72–83. [Google Scholar] [CrossRef]
  26. Ohashi, H. Case study of pump failure due to rotor-stator interaction. Int. J. Rotating Mach. 1994, 1, 53–60. [Google Scholar] [CrossRef]
  27. Santolaria Morros, C.; Fernández Oro, J.M.; Argüelles Díaz, K.M. Numerical modelling and flow analysis of a centrifugal pump running as a turbine: Unsteady flow structures and its effects on the global performance. Int. J. Numer. Methods Fluids 2011, 65, 542–562. [Google Scholar] [CrossRef]
  28. Li, D.Y.; Gong, R.Z.; Wang, H.J.; Wei, X.Z.; Liu, Z.S.; Qin, D.Q. Analysis of rotor-stator interaction in turbine mode of a pump-turbine model. J. Appl. Fluid Mech. 2016, 9, 2559–2568. [Google Scholar] [CrossRef]
  29. Xiao, Y.X.; Sun, D.G.; Wang, Z.W.; Zhang, J.; Peng, G.Y. Numerical analysis of unsteady flow behaviour and pressure pulsation in pump turbine with misaligned guide vanes. IOP Conf. Ser. Earth Environ. Sci. 2012, 15, 032043. [Google Scholar] [CrossRef]
  30. Zhang, J.; Appiah, D.; Zhang, F.; Yuan, S.; Gu, Y.; Asomani, S.N. Experimental and numerical investigations on pressure pulsation in a pump mode operation of a pump as turbine. Energy Sci. Eng. 2019, 7, 1264–1279. [Google Scholar] [CrossRef]
  31. Roache, P.J. Quantification of uncertainty in computational fluid dynamics. Annu. Rev. Fluid Mech. 1997, 29, 123–160. [Google Scholar] [CrossRef] [Green Version]
  32. Ali, M.S.M.; Doolan, C.J.; Wheatley, V. Grid convergence study for a two-dimensional simulation of flow around a square cylinder at a low Reynolds number. In Seventh International Conference on CFD in the Minerals and Process Industries; Witt, P.J., Schwarz, M.P., Eds.; CSIRO: Melbourne, VIC, Australia, 2009; pp. 1–6. [Google Scholar]
  33. Celik, I.B.; Ghia, U.; Roache, P.J.; Freitas, C.J. Procedure for estimation and reporting of uncertainty due to discretization in CFD applications. J. Fluids Eng.-Trans. ASME 2008, 130, 078001. [Google Scholar]
  34. Yang, F.; Li, Z.; Yuan, Y.; Lin, Z.; Zhou, G.; Ji, Q. Study on vortex flow and pressure fluctuation in dustpan-shaped conduit of a low head axial-flow pump as turbine. Renew. Energy 2022, 196, 856–869. [Google Scholar] [CrossRef]
  35. Yang, F.; Li, Z.; Cai, Y.; Jiang, D.; Tang, F.; Sun, S. Numerical study for flow loss characteristic of an axial-flow pump as turbine via entropy production analysis. Processes 2022, 10, 1695. [Google Scholar] [CrossRef]
  36. Guo, Q.; Zhou, L.; Wang, Z.; Liu, M.; Cheng, H. Numerical simulation for the tip leakage vortex cavitation. Ocean Eng. 2018, 151, 71–81. [Google Scholar] [CrossRef]
  37. Xiaoran, Z.; Yexiang, X.; Zhengwei, W.; Hongying, L.; Soo-Hwang, A.; Yangyang, Y.; Honggang, F. Numerical analysis of non-axisymmetric flow characteristic for a pump-turbine impeller at pump off-design condition. Renew. Energy 2018, 115, 1075–1085. [Google Scholar] [CrossRef]
  38. Yang, F.; Jiang, D.; Yuan, Y.; Lv, Y.; Jian, H.; Gao, H. Influence of rotation speed on flow field and hydraulic noise in the conduit of a vertical axial-flow pump under low flow rate condition. Machines 2022, 10, 691. [Google Scholar] [CrossRef]
  39. Chen, X.; Li, S.; Wu, D.; Yang, S.; Wu, P. Effect of suction and discharge conditions on the unsteady flow phenomena of axial-flow reactor coolant pump. Energies 2020, 13, 1592. [Google Scholar] [CrossRef] [Green Version]
Figure 1. Model of vertical axial-flow PAT device.
Jmse 11 00661 g001
Figure 2. Mesh of the entire computing domain.
Jmse 11 00661 g002
Figure 3. Schematic diagram of high precision test bench.
Jmse 11 00661 g003
Figure 4. Comparison of numerical simulation and experimental results: (a) Head, (b) Efficiency.
Jmse 11 00661 g004
Figure 5. Flow field distribution in the guide vane and impeller hydraulic coupling zone: (a) 0.8 Qbep, (b) 1.0 Qbep, (c) 1.1 Qbep.
Jmse 11 00661 g005
Figure 6. The position of the measuring lines on the blade surface and parameters: (a) position of measuring lines, (b) parameters near the blade.
Jmse 11 00661 g006
Figure 7. Static pressure distribution on blade surface at different flow rates: (a) 0.8 Qbep, (b) 1.0 Qbep, (c) 1.1 Qbep.
Jmse 11 00661 g007
Figure 8. Frequency spectrum of fluid force acting on impeller: (a) 0.8 Qbep, (b) 1.0 Qbep, (c) 1.1 Qbep.
Jmse 11 00661 g008
Figure 9. Frequency spectrum of fluid force acting on guide vane: (a) 0.8 Qbep, (b) 1.0 Qbep, (c) 1.1 Qbep.
Jmse 11 00661 g009
Figure 10. Arrangement of pressure pulsation monitoring points for different cross sections.
Jmse 11 00661 g010
Figure 11. Comparison of pressure spectrum between numerical simulation and test: (a) P1 and PA, (b) P2 and PB.
Jmse 11 00661 g011
Figure 12. Pulsation spectrum of monitoring points on section GI at 1.0 Qbep.
Jmse 11 00661 g012
Figure 13. Pulsation spectrum of monitoring points on section GO at 1.0 Qbep.
Jmse 11 00661 g013
Figure 14. Pulsation spectrum of monitoring points on section II at 1.0 Qbep.
Jmse 11 00661 g014
Figure 15. Pulsation spectrum of monitoring points on section IO at 1.0 Qbep.
Jmse 11 00661 g015
Figure 16. Pressure distribution of typical section at 1.0 Qbep: (a) GI, (b) GO, (c) II, (d) IO.
Jmse 11 00661 g016
Figure 17. Amplitude of dominant frequency at each spanwise under different flow rates: (a) 0.8 Qbep, (b) 1.0 Qbep, (c) 1.1 Qbep.
Jmse 11 00661 g017
Figure 18. Amplitude ratio of dominant frequency at 0.8 Qbep.
Jmse 11 00661 g018
Figure 19. Amplitude ratio of dominant frequency at 1.1 Qbep.
Jmse 11 00661 g019
Table 1. Main parameters of the vertical axial-flow PAT.
ParameterValue
Design flow rate (L/s)272
Design head (m)2.4
Rated rotational speed (r/min)930
Nominal impeller diameter (mm)300
Impeller blades number3
Guide vane body blades number5
Tip clearance size (mm)0.2
Table 2. Calculation of mesh dispersion error.
Parameter Φ = Efficiency
N1, N2, N36,143,640, 2,746,492, 721,326
r21, r321.31, 1.56
φ1, φ2, φ343.64%, 42.82%, 42.13%
p4.2
Φ e x t 21 , Φ e x t 32 44.03%, 42.9%
e a 21 , e a 32 1.9%, 1.6%
e e x t 21 , e e x t 32 0.89%, 0.19%
GCI21, GCI321.13%, 0.37%
Disclaimer/Publisher’s Note: The statements, opinions and data contained in all publications are solely those of the individual author(s) and contributor(s) and not of MDPI and/or the editor(s). MDPI and/or the editor(s) disclaim responsibility for any injury to people or property resulting from any ideas, methods, instructions or products referred to in the content.

