1. Introduction
Effective marine mammal conservation management depends on accurate and timely data on abundance and distribution. Scientists currently employ a variety of visual (vessel, aircraft) and acoustic (buoys, gliders, fixed moorings) research platforms to monitor marine mammals. While various approaches have different challenges and benefits, it is clear that very high-resolution (VHR) satellite imagery holds tremendous potential to acquire data in difficult-to-reach locations [
1,
2,
3]. The time has come to create an operational platform leveraging the increased resolution of satellite imagery, proof-of-concept research, advances in cloud computing, and advanced machine learning methods to monitor the world’s oceans. The Geospatial Artificial Intelligence for Animals (GAIA) initiative was formed to address this challenge. In this paper, we share lessons learned, challenges faced, and our vision for how VHR satellite imagery can be used to enhance our understanding of cetacean distribution in the future. Having another tool in the toolbox enables greater flexibility in achieving our research and conservation goals.
1.1. Geospatial Artificial Intelligence for Animals
The initiative Geospatial Artificial Intelligence for Animals brings together an extraordinary coalition of organizations to tackle the challenge of designing a large-scale operational platform to detect marine mammals from space-orbiting satellites. These organizations include government agencies (National Oceanic and Atmospheric Administration (NOAA), U.S. Naval Research Laboratory (NRL), the Bureau of Ocean Energy Management (BOEM), the U.S. Geological Survey (USGS), independent research organizations (British Antarctic Survey), academia (University of Edinburgh, University of Minnesota, and the private sector (Microsoft AI for Good Research Lab, Maxar Technologies).
To accurately inform Stock Assessment Reports and meet the regulatory requirements of the U.S. Marine Mammal Protection Act, the Endangered Species Act, and the National Environmental Protection Act, government agencies in the United States require data on the abundance, distribution, density, and habitat use of marine mammals. As stewards of the sea, the U.S. Navy is committed to protecting the environment while defending freedom. This commitment has encouraged the U.S. Navy to develop and leverage existing technologies for marine mammal detection and situational awareness. The Navy funds three main programs focused on marine species to support compliance with the Marine Mammal Protection Act and Endangered Species Act—Office of Naval Research Marine Mammals and Biology Program, the Living Marine Resources Program, and the Navy Marine Species Monitoring Program. NOAA Fisheries, BOEM, and USGS are working together to task imagery over known whale aggregations that will be used to create an annotated dataset of detections. Researchers at the British Antarctic Survey, University of Edinburgh, and University of Minnesota with extensive expertise in processing and annotating satellite imagery have been tremendously valuable as we learn best practices. The Microsoft AI for Good team has created a ‘human-in-the-loop’ software solution to speed up the annotation process. The resulting detections will be used to train models in an active learning process to develop and refine machine learning models to detect marine animals and other objects of interest.
The GAIA team is focused on two endangered species with high risk of extinction: the North Atlantic right whale (
Eubalaena glacialis) and the Cook Inlet beluga whale (
Delphinapterus leucas) (
Figure 1). The critically endangered North Atlantic right whale in the Atlantic Ocean has been experiencing a population decline for over 10 years and has only an estimated 368 individuals remaining (95% probability interval 356 to 378) [
4], while the endangered Cook Inlet beluga population is estimated at 279 individuals (95% probability interval 250 to 317) and is experiencing a ~2.3% decline in abundance per year [
5]. These two species could benefit from additional monitoring methods and also present an opportunity to examine how differences in body size, color, behavior, and surrounding environment may influence detectability in VHR satellite imagery. North Atlantic right whales average 16 m in length, have dark-colored bodies with white callosities on their head, and inhabit waters under a variety of turbidity conditions. On the other hand, Cook Inlet belugas are much smaller, up to ~4.5 m, are either gray or white, and inhabit a very turbid, glacial-fed, tidal estuary in which only a fraction of their body is visible when surfacing. White adults can be easily confused with large white birds, white caps, or exposed rocks.
1.2. Background on Satellite Imagery for Marine Mammal Detection
Earth-orbiting satellites can capture optical imagery over any region on the planet, and both the resolution and revisit rates have increased over the years (
Figure 2). Tremendous progress has been made, resulting in the ability to use VHR satellite imagery to gain insights into the habitat, distribution, and density of marine mammals (
Figure 3,
Table 1). Monitoring marine mammals from space started with NASA’s Landsat-1 satellite launched in 1972, which had a spatial resolution of 100 m and allowed for habitat preference surveys [
6,
7] and distribution mapping [
8]. With the subsequent improvement of spatial resolution with the Centre National d’Etudes Spatiales SPOT-1 satellite, large aggregations of animals, such as king penguins (
Aptenodytes patagonicus), could be detected [
9].
The detection of individual animals was not possible until the arrival of VHR satellites capable of collecting sub-meter resolution imagery. In a groundbreaking study, Abileah [
11] identified orca and humpback whales with the IKONOS-2 satellite with one-meter panchromatic resolution. Since then, there has been an explosion of additional research on marine mammals (polar bears: [
18]; walrus: [
12,
14,
34]; Antarctic seals: [
13,
40,
41]) despite the additional challenges presented by high sea state and surface availability. Fretwell et al. [
16] was able to identify and count Southern right whales in a WorldView-2 satellite image with 50 cm panchromatic resolution. The authors speculated that the resolution was not sufficient for differentiating between species. After the 2014 launch of Maxar Technologies’ WorldView-3 satellite with 31 cm panchromatic resolution, species identification of marine mammals became more feasible. For example, Cubaynes et al. [
24] identified four species of whales (fin, humpback, Southern right, and gray whales) in WorldView-3 imagery, and speculated that it was possible to determine species based on species-specific features such as flippers and flukes. For the first time, Charry et al. [
33] was successfully able to discern between two similarly sized species, beluga and narwhal, with overlapping ranges in WorldView-3 imagery.
Using geospatial software such as ArcGIS, most studies using satellite imagery have detected animals by manually scanning through imagery. However, this manual detection process is time consuming and is a limiting factor for generating near-real-time detections. Replacing these techniques with a semi-automated machine learning approach has the potential to rapidly accelerate our ability to process large volumes of imagery. Machine learning models such as convolutional neural networks (CNNs) have been effective at image processing [
42,
43,
44,
45,
46,
47,
48,
49]. Several early attempts at using CNNs to detect whales [
25,
27] and seals [
50] have been made, although these studies all used down-sampled three-band RGB imagery rather than the full range of spectral bands collected by WorldView-2 and WorldView-3 sensors. In addition to advances in detection algorithms—methodology for estimating whale density is needed to derive abundance estimates. The first studies to look at this found that whale density estimates fell within an order of magnitude of those derived from traditional ship-board survey estimates [
28] and were not significantly different from aerial survey estimates [
38].
In summary, a flurry of recent publications and an increasing number of workshops have focused on the feasibility of using VHR satellite imagery to identify marine mammals. For example, at the biennial Society for Marine Mammalogy conference in 2019, there was a workshop devoted to the topic “Marine Mammal Surveys from Satellite Imagery: Applications, automation, and challenges”. Increasing interest, combined with the advancements in VHR satellite resolution, machine learning, and cloud computing provides the momentum needed for the creation of a rapid management tool for the detection of marine mammals. Satellite revisit rates are expected to increase with the launches of more VHR optical satellites in the coming years, which will rapidly accelerate the amount of imagery that can be collected over an area of interest (AOI). The time has come to transition from research to operations to gain geospatial insights from VHR satellite imagery for better understanding of marine animals worldwide. An image processing pipeline can be developed to programmatically collect and download imagery, run through detection algorithms, host detections online for validation by subject matter experts, and upload results to a web-based database platform to inform conservation management.
2. Demystifying Satellite Data at Warp Speed
While VHR satellite imagery has the potential to greatly improve the monitoring of marine mammals, acquiring and using such data is not straightforward. Most readers will be familiar with RGB imagery captured by standard handheld cameras, which contains information from the visible light portion of the electromagnetic spectrum (red, green, blue). Satellite imagery, in contrast, is captured from platforms that orbit the Earth, and is usually multispectral (i.e., contains spectral bands that span different portions of the electromagnetic spectrum). The following subsections provide a high-level overview of the different components and terminology encountered when working with VHR satellite imagery to help demystify the process and bring new researchers up to speed quickly.
2.1. Satellite Sensors
We live in an exciting time where commercial and government VHR satellite imagery are widely available on a global scale. Civilians can purchase sub-meter commercial imagery and have requested faster acquisition times, higher revisit rates, and finer resolution, and the industry has answered the demand. For marine mammal monitoring, a spatial resolution of ≤0.50 m seems well suited for detecting most species, though resolution closer to 30 cm may be needed for detecting smaller animals or identifying specific behaviors or features such as whale flukes [
24]. Currently, there are nine commercial VHR satellites collecting VHR satellite imagery with a panchromatic spatial resolution of ≤0.50 m, operated by Maxar Technologies, Planet, Airbus, and China Siwei (
Table 2). More VHR satellites are scheduled to be launched in the near future, including the six satellites forming the Legion constellation operated by Maxar Technologies, the Pelican constellation by Planet Labs, and the Albedo constellation by Albedo Space Corporation.
GAIA has initially focused on Maxar Technologies’ WorldView-3, WorldView-2, and GeoEye-1 sensors for the detection of marine animals due to their sub-meter resolution, and access to their imagery via the U.S. government Electro-Optical Commercial Layer (EOCL) and EnhancedView Follow-On (EVFO) contracts, which also includes tasking.
2.2. Metadata
The standard formats for transferring geospatial imagery are Tag Image File Formats (TIFFs/GeoTIFFs) or National Transfer Formats (NTFs). Each satellite image also has an associated XML file containing metadata, some of which can be viewed prior to image acquisition. The metadata includes information such as sensor type, acquisition date and time, catalog ID, image product, and ground sampling distance (GSD, or pixel resolution). Metadata can be viewed in a text editor or extracted from the TIFF or NTF using commercially available products and libraries. The most renowned library for translating geospatial data is the Geospatial Data Abstraction Library (GDAL). Many geographic information systems, such as ArcGIS Pro and QGIS, invoke the GDAL library to process imagery. It is recommended that users of satellite imagery become familiar with the GDAL features and documentation. GDAL is an open-source library (
https://gdal.org/ (accessed on 23 December 2022)) that allows users to view, clip, and transform geospatial data.
2.3. Optical Sensors
There are two common types of optical satellite imaging sensors: whisk broom and push broom (
Figure 4). Whisk broom scanners (across track) use a rotating mirror to scan a series of lines from one side to the other (much like sweeping a whisk broom side to side [
51,
52]. Push broom scanners (along track) use a line of detectors that capture imagery as the satellite flies forward (much like using a push broom to sweep a floor in a forward motion). Push broom sensors collect data in one long strip with a start and end time spanning a few seconds and the resulting images are then mosaicked together. The push broom technique results in different collection times as you move north or south (up or down) along a strip [
52]. The beginning and end time can be found in the image metadata.
2.4. Nadir
Nadir refers to the downward-facing viewing geometry of an orbiting satellite. A zero-degree nadir angle means that the satellite was directly overhead when the image was collected, and yields the highest resolution possible. As the off-nadir angle increases, the resolution of the image becomes increasingly degraded (
Figure 5,
Table 3). Images collected as close to the nadir as possible are higher resolution and therefore better suited for marine mammal detection.
2.5. Ground Sampling Distance
The ground sampling distance (GSD) is the distance between pixel centers measured on the ground and is effectively the resolution of the image. The capability of the image sensor, the altitude the sensor is flown at, and how far off the nadir the image was taken determine the GSD. In order to discriminate between species, GAIA targets imagery with a GSD ≤ 0.50 m (
Table 3).
2.6. Spectral Bands
VHR satellites contain remote sensing payloads that measure the intensity of solar radiation reflected from earth’s surface and capture panchromatic and multispectral images. The multispectral product measures the intensity of solar radiation across sets of spectral bands (i.e., wavelengths), such that one pixel has multiple light intensity values per band. This radiation is dispersed into constituent wavelengths, which are then captured independently by detectors sensitive to a specific range of wavelengths. The panchromatic combines the intensity of solar radiation across the visible light spectrum (RGB), such that one pixel has one total light intensity value. The panchromatic and multispectral contain different information because solar radiation intensity is captured differently. Since the panchromatic detector is reporting a total intensity, larger amounts of solar radiation are collected per pixel. Thus, panchromatic detectors are able to detect greater variations in brightness within a small portion of earth resulting in a higher spatial resolution as compared to multispectral images.
Figure 6 summarizes information on multispectral wavebands which vary by VHR satellites. See
Supplementary Material S2 for additional information on multispectral and panchromatic bands by satellite sensor.
2.7. Image Products
Satellite imagery providers offer a variety of image products which vary by level of processing. The cost of the imagery is directly proportional to the level of processing completed. Most marine mammal studies have used Standard 2A imagery which has already been orthorectified and projected [
16,
23,
24,
30]. Knowing the image product is critical if sharing annotations (rather than the image chips) as the labels might shift location from one product to the next due to differences in image processing. Although we strongly recommend sharing the actual image, if license restrictions prevent image sharing, another solution is sharing the catalog ID and image product to ensure identical TIFFs can be obtained. The following products are best for spectral detection because these products contain four to eight bands of spectral information: Maxar Technologies’ WorldView Basic (1B) imagery, Standard (2A) imagery, and Ortho Natural Color (3D).
GAIA focuses on the Basic 1B product available from Earth Explorer, as that has been the most consistent and reliable way to ensure that we receive the full native resolution. The Basic 1B product is described in the
DigitalGlobe Core Imagery Product Guide (accessed on 23 December 2022) as the least processed of the Base Product Series intended for advanced image processing, and is corrected for radiometric distortions, internal sensor geometry, optical distortions, and sensor distortions. The Basic Image product is not projected and remains in the satellite frame of reference, not tied to ground location. See
Supplementary Material S3 for additional information on image products.
2.8. Browsing and Downloading Imagery
There are several online web portals where archived satellite imagery can be viewed (
Table 4). Portals such as Discover Maxar (formerly Discover DigitalGlobe) are accessible to anyone, while others have restricted access (Earth Explorer, Global Enhanced Geoint Delivery, SecureWatch). Discover Maxar only allows users to query and view available imagery, while the other platforms also allow downloading. Consistent across most if not all portals is the inability to view images in their full resolution. The interactive websites allow users to view images and image footprints as well as filter by metadata such as satellite sensor, date, image product, resolution, catalog ID, and AOI.
Available image products are not consistent across platforms. For example, Maxar Technologies level 3 pansharpened products are available on G-EDG but not elsewhere. Some platforms also have API connections, which enables programmatic access and downloading of imagery. All product types are available in the following data formats, GeoTIFF, NTF 2.1, and NTF 2.1 NCDRD with ZIP or TAR compression. Both G-EGD and Earth Explorer offer API connectivity to automatically query and download imagery, although the G-EGD API only allows programmatic access to recently collected level 3 image products, typically less than 2 years old and housed in the online catalog, which is lacking the full number of spectral bands. The G-EGD web interface allows users to individually download level 1B image strips through an FTP connection, but this is not practical for large quantities (
Figure 7). GAIA primarily uses Earth Explorer for searching and downloading imagery. This platform offers a Bulk Download web application to download large amounts of imagery at one time. Due to file size limitations through both the G-EGD API (10 GB) and the Earth Explorer bulk downloader (2GB), images are broken into smaller overlapping tiles (
Figure 7). The GAIA team has requested access to 1B and 2A products from both the online and archive catalogs to be made available through the API, which would allow for much more streamlined data processing, as opposed to the current time-consuming manual downloads. The National Geospatial-Intelligence Agency’s Source Geomatics Office recently created the eAPI program, which may fill this requirement.
Once ordered, imagery is delivered or downloaded as an image packet or folder containing several files including the image in the requested format, the XML metadata file, and a TIL file, among others. The number of image packets downloaded is dependent on several factors due to size limitations imposed by the web portal (either API or web interface) and the image file type. If the AOI selected crosses the boundary between two image strips, the downloaded product will be divided into components denoted and P001, P002,…, etc. [
53]. Additionally, when the product component exceeds the size limit for the media selected (e.g., GeoTIFF 1.0 is limited to 4 GB), the image is tiled and given a number corresponding to the row and column of its position in the overall image. The TIL file included in each image package can assist with placement of the tiles in the product coordinates [
53].
Before downloading large quantities of VHR satellite imagery, it is important to consider storage options. While it can be faster to process imagery stored on a local machine, a single satellite image can be multiple gigabytes and is thus not a practical option for users interested in processing vast amounts of imagery. Storing images on external hard drives can also be problematic due to drastic increases in image processing and rendering times. Cloud storage provides the best of both worlds by allowing high processing speeds without overburdening local machines. While there are several cloud storage options, GAIA uses Microsoft Azure cloud computing services to house multiple terabytes of VHR satellite imagery.
2.9. Tasking Imagery
There is a preconceived notion that a plethora of archived satellite imagery over open oceans already exists and is available for detecting marine mammals. However, imagery over open ocean is sparse since satellite sensors are typically programmed to go dormant to save power unless specifically tasked. Building a library of marine mammal detections requires tasking future satellite collection at specific times and over particular areas where the species of interest are known to occur based on current and/or historical distribution patterns.
GAIA began tasking VHR satellite imagery over seasonal hotpots for North Atlantic right whale and Cook Inlet beluga whales in early 2020 through the USGS CRSSP Imagery Derived Requirements (CIDR) system (
https://cidr.cr.usgs.gov/ (accessed on 23 December 2022)). This system acquires imagery under the Electro-Optical Commercial Layer (EOCL) contract (formerly the EnhancedView Follow-On contract) for the U.S. Government by the National Reconnaissance Office, and is limited to federal employees. While tasking has been successful, the learning curve to task image collection through this platform has been significant. Tasking requests are limited to ≤ 700 sq. nautical miles (2400 sq. km), and requesting imagery collection more frequently than 1 out of every 3 days is unlikely to be successful. GAIA focuses on Maxar Technologies WorldView-2 and WorldView-3, and Geo-Eye level 1B imagery that is radiometrically corrected, and both Multispectral + Panchromatic output in the format of an unprocessed GeoTIFF.
3. Image Processing
The number of steps needed to process an image depends on how much preprocessing has already been performed, which is dependent on the product type. Common preprocessing steps include orthorectifying, projecting, and pansharpening.
3.1. Orthorectification
Satellite imagery cannot be properly used for land mapping until it has been processed so that pixels accurately reflect coordinates on the ground. Orthorectification is the process of removing sensor motion, optical distortions, and terrain-related geometric distortions from raw imagery [
54,
55]. For example, if an image is collected at 25° off the nadir, it must be corrected for relief displacement caused by the terrain. This correction results in an orthorectified view (looking straight down). Imagery of topographically diverse areas experience more distortion as opposed to areas such as the ocean, which have little variation. A digital elevation model (DEM) is used during orthorectification to remove image distortion. While some DEMs are considered standard, a variety of DEMs can be used when higher mapping accuracy is required. GAIA is working with level 1B products which have not been orthorectified as this process offers little benefit over open ocean where little to no topographic relief is present.
3.2. Projecting
Projecting is the mathematical process of transforming a coordinate system from a sphere to a flat surface. Most commercial satellite imagery products (i.e., Standard 2A, Level 3 products) are spatially referenced using the World Geodetic System (WGS84) datum with a Universal Transverse Mercator (UTM) coordinate reference system. The UTM projection divides the Earth into 60, 6°-degree longitude segments, or zones, and is the standard projection used for satellite imagery. Basic 1B products, however, must be projected before annotating. The appropriate UTM zone for the area of interest must be specified during the projection process (see
https://www.dmap.co.uk/utmworld.htm (accessed on 23 December 2022)). The user must also specify the algorithm used to resample the data. The most common resampling techniques are nearest neighbor, bilinear interpolation, and cubic convolution. Although nearest neighbor is the fastest of the three methods, it is primarily used for categorical data and is not suited for continuous data; therefore, due to its poor interpolation, this method should not be used to resample VHR satellite data [
56,
57]. The bilinear method uses a weighted distance average of the surrounding cells, while the cubic option fits a smooth curve through the surrounding points. Both the bilinear and cubic methods are appropriate for continuous data. Despite the cubic method producing a smoother surface, processing time is exceedingly higher than the bilinear method. Given this tradeoff, GAIA uses the bilinear interpolation method.
3.3. Pansharpening
Pansharpening is the process of combining pixels from the high spatial resolution of a panchromatic image with those containing RGB color information from the multispectral image to create a higher resolution color image (
Figure 8). While marine mammals can be seen in the panchromatic image alone, combining the color information improves object discrimination and species identification. Pansharpened images acquired directly from imagery providers typically use proprietary algorithms. Commonly used pansharpening algorithms include but are not limited to the following: Intensity-Hue-Saturation (IHS), high pass filtering, Brovey, Gram-Schmidt, the University of New Brunswick algorithm, wavelet-based principal component analysis, simple mean, and Esri specific algorithms. Depending on the algorithm used, pansharpened images can have notable differences in appearance and spectral values [
58,
59]. GAIA uses the Brovey method because it is computationally fast, open source, and provides an appropriate rendering to visually detect whales.
3.4. Top of Atmosphere Correction
Atmospheric correction removes the effects of absorption and scattering from the atmosphere. Electromagnetic radiation passes through the atmosphere from the sun to the Earth and is then reflected back up from the surface and nearby clouds. Absorption of this radiation reduces its intensity, resulting in a haziness effect. Scattering also redirects the electromagnetic energy in the atmosphere, causing the values of neighboring pixels to be shared [
60]. This is known as the ‘adjacency effect’ and reduces contrast by decreasing the top of the atmosphere radiance over bright pixels and increasing the brightness of the dark pixels. Atmospheric correction is especially important when using spectral data, as it removes the effects of absorption and scattering and improves the image quality.
4. Data Annotation
Data annotation is the process of labeling objects of interest (i.e., “right whale”, “beluga whale”, “ship”, “wave”) in order to train machine learning models to predict additional data of interest. Building a dataset of target features requires annotating large amounts of VHR satellite imagery. This can be performed using a variety of methods that involve human annotators to varying degrees. The most demanding method involves recruiting expert annotators to methodically inspect entire scenes of imagery manually. By using statistical methods and/or machine learning to identify interesting features, the “human-in-the-loop” approach aims to reduce the amount of satellite imagery that needs to be manually searched. This approach results in image chips containing objects of interest that are then served to annotators to label appropriately. An extension of this “human-in-the-loop” approach is called active learning, where the results of the human validation step are used to update the underlying machine learning models and improve performance over time. Advanced machine learning methods such as convolutional neural networks require large amounts of labeled data (both positive instances of marine mammals in existing satellite imagery and negative examples of image features in the water that might be mistaken for marine mammals). Such large datasets do not currently exist; however, the creation of these data is one of the main objectives of GAIA. Below, we expand on the three methods that GAIA is pursuing to create large-labeled datasets of marine mammals: (1) manual annotation of the full image in ArcGIS Pro, (2) crowdsourcing annotations from Maxar Technologies’ GeoHIVE platform, and (3) annotating image chips with a human-in-the-loop approach.
4.1. Manual Annotations
Until reliable automated detection systems are built, manually annotating satellite images for the presence of marine mammals is the most accurate method, although time-consuming. Even once more automated methods are developed, these systems will still need to be trained, tested, and validated with manually labeled datasets. A variety of software including ArcGIS desktop, ArcGIS Pro, QGIS, and Google Earth Pro can be used for manually annotating VHR satellite imagery [
24,
35,
38]. Manual annotation requires several steps: (1) scanning the imagery, (2) labeling the point features of interest, and (3) transforming the point labels into bounding box annotations. We recommend scanning the whole image systematically using a grid overlay relevant to the proper zoom scale [
39]. Metadata containing information on the image (sensor, product, catalog ID), the feature of interest (species, certainty), annotator, and geographical information (latitude, longitude) should be associated with each annotation [
39].
Before diving into manual annotation, GAIA spent considerable time investigating software options to annotate imagery. While there are many software solutions that hold promise (i.e., Video and Image Analytics for Multiple Environments (VIAME), Vigilant, Picterra, Visual Geometry Group (VGG), Computer Vision Annotation Tool (CVAT), and LabelImg), several shortcomings prevented their use. Such challenges included GPU requirements, lack of support for bounding box annotations, and inability to (1) work with GeoTIFF and/or NTIF file formats, (2) export annotations in desired format (COCO, JSON), (3) validate annotations generated by machine learning models, (4) feed multiple images into model training, and/or (5) extract geographic positions. Therefore, Dr. Hannah Cubaynes took the lead on developing a set of standardized annotation protocols to be used with ArcMap and ArcGIS Pro [
61].
4.2. Crowdsourcing Annotations
Crowdsourcing is a way to harness the energy of a large pool of talent through an online platform to accomplish a challenging goal. This innovative approach has become quite popular in recent years with many different varieties including hackathons, citizen science, and data science competitions. There are several companies that offer crowdsourced image annotation to create AI-ready data sets (i.e., Zooniverse, Amazon Mechanical Turk, Toloka, ScaleHub, Neevo, Appen) although most do not specialize in the use of satellite imagery and require the customer to supply the images as low resolution RGB files. The Maxar Technologies’ Geospatial Human Imagery Verification Effort (GeoHIVE) is one exception where this crowdsourcing image annotation service pulls the original MAXAR satellite images and does the transformation to RGB in-house. GAIA contracted GeoHIVE to run crowdsourced imagery Discovery and Validation campaigns to detect four whale species (right, humpback, beluga, and bowhead). During the Discovery campaign, Maxar Technologies hosted image chips online for a group of annotators to indicate which images contained whales. The Discovery campaign resulted in a large number of false detections (primarily whitecaps) which were resolved during the Validation campaign. Suggestions for improving future campaigns include providing additional training material to annotators and reducing false positives by first running an initial campaign to identify whether or not there are any objects in the imagery before running annotation campaigns. However, whales are challenging to discriminate and may not be suitable for approaches that downsample the imagery and serve it up online as RGB files. Our subject matter experts found it difficult to confirm species with this degraded imagery during the Validation campaign. For such small objects, being able to view the native resolution imagery is critical.
4.3. Human-In-The-Loop Approach
Until automated detection algorithms are developed, a hybrid, human-in-the-loop approach can be taken to improve the efficiency of the manual annotation process. In this approach, a few manual detections are used to train a rudimentary machine learning model to identify image chips (or patch) that
might contain whales (e.g., by filtering out all areas that contain only open water). These image chips are served to manual annotators, and the resulting annotations can then be used to improve the algorithms in a repeating cycle. This process is known as
active learning in the machine learning community. Here, the role of the model is to reduce the search space from large VHR imagery scenes 100 s of square kilometers in size to 100 s of small chips of imagery cropped from the larger scene. For annotators, indicating whether a given chip of imagery contains a whale or not only takes a few seconds, while manually scanning 100 square kilometers of imagery takes approximately 3 hours and 20 minutes [
24]. Assuming that image chips can be labeled at a rate of 1 chip per 10 seconds, as long as the human-in-the-loop approach produces fewer than 1200 chips per 100 km
2 and identifies most whales, it will be more efficient than manual annotation.
One challenge to implementing a human-in-the-loop approach is facilitating the communication between the model training process and the human annotators. Ideally, human annotators are served high-resolution image chips sequentially in a web-based (or equally accessible) interface, while the annotations they submit are used asynchronously by a backend server to update model parameters and prioritize future chips to be annotated. GAIA is developing an open-source software platform for facilitating this process (
Figure 9).
Another challenge is ensuring that the model maintains high recall after every update. In other words, the model should prioritize not eliminating image chips that potentially contain whales from the human annotator’s consideration. Depending on the type of backend model used, different methods can be used to enforce this property. For example, with logistic regression models, higher weight can be given to the positive class with a penalized loss function.
5. Annotation Database
As we seek to collaborate with other algorithm development efforts to detect marine mammals from VHR satellite imagery, a shared annotation database would benefit the community. While image licensing restrictions make it impossible to share a repository of TIFF files some licensing arrangements allow sharing of PNG images and associated metadata. Using this strategy, Cubaynes and Fretwell [
39] published 633 annotations of four different species: Southern right whale (
Eubalaena australis), humpback whale (
Megaptera novaeangliae), fin whale (
Balaenoptera physalus), and gray whale (
Eschrichtius robustus) from VHR satellites (i.e., WorldView-3, WorldView-2, GeoEye-1 and Quickbird-2). GAIA intends to build on this foundation and contribute our whale annotations publicly as well.
6. Automating Detections
Pattern recognition and computer-assisted counting techniques are common in the medical field but have only recently been used to count wildlife. Neural networks, in particular convolutional neural networks (or CNNs), have recently become the model of choice for image processing [
44,
45,
47,
48] and even individual animal identification [
62,
63,
64,
65,
66,
67,
68,
69]. These advancements are due to the development of neural-network-based models and graphical processing units (e.g., [
70,
71,
72]). Recent improvements in image resolution and spectral bands in VHR satellite imagery have made marine mammal detection and classification through machine learning algorithms more feasible [
25,
27,
51].
Many of the automated methods used in Maritime Domain Awareness (MDA) systems to detect vessels in satellite imagery are spectral signature based [
73]. MDA is the effective understanding of anything associated with the global maritime domain that could impact the security, safety, economy, or environment of the United States. The Naval Research Laboratory’s MDA system, Proteus, uses Spectral Angle Mapping (SAM) to assess vessel spectral signature profiles in commercial satellite imagery. SAM compares an input target spectrum with the spectrum of each pixel within an image. If the pixel spectrum is close to the target spectrum, the output is a high pixel value. GAIA used the whale annotation dataset from Cubaynes and Fretwell [
39] to test whether marine mammal pixels are spectrally distinguishable from background pixels using SAM in a WorldView-2 image taken over Southern right whales in Peninsulas Valdes, Argentina (Catalog ID: 103001001C8C0300, see
Supplementary Material S4).
GAIA has experimented with several unsupervised learning techniques to detect anomalous points in the water for a given satellite image. For instance, given a large satellite imagery scene, we can train a generative model of the water based on randomly sampled points throughout the water, then use such models to evaluate the log-likelihood of each pixel in the scene. Here, anomalous pixels (i.e., those that represent whales, boats, rocks, planes, etc.) will have very low likelihood compared to normal water pixels. Different types of generative models can be used, ranging in complexity from Gaussian mixture models to generative adversarial networks. Another approach we have tried involves standardizing the spectral values of each pixel in a satellite imagery scene using the statistics taken from a window around that pixel. Pixels with large (in magnitude) standardized values are anomalous by definition, and groups of such pixels that are larger than an area threshold represent an object in the water that should be examined more closely. This approach can be implemented efficiently on GPUs to identify all “interesting” objects in scenes of VHR imagery in minutes. After all “interesting” objects in a scene have been identified, we can classify each using supervised models, human annotators, or a mixture of both.
7. Operational System
Once machine learning algorithm(s) of sufficient accuracy have been developed, GAIA aims to build an operational system that detects marine mammals and shares this information with stakeholders. This system will automatically download and process incoming imagery and run machine learning algorithms. Annotated images and associated data would be stored in a database that is vetted by domain experts and then distributed to multiple display outlets, several of which are discussed below. Ultimately, GAIA envisions expanding this system to include other species and regions at a tremendous benefit to marine mammal science and conservation efforts.
7.1. Proteus
Detections of marine mammals in VHR satellite imagery could be layered into existing MDA systems for vessel situational awareness while supporting the Naval Research Laboratory’s commitment to leverage satellite imagery for marine mammal ship-strike and fishing gear entanglement risk assessment. The Proteus web application allows an operator to analyze current and historical vessel tracks and create a suite of rules and alerts that automatically monitor an AOI for illicit maritime activities (
Figure 10). Having whale positions overlaid onto this display could allow for more targeted vessel enforcement around recent whale sightings.
7.2. WhaleMap
WhaleMap is a website application designed to collate and display the latest whale positions (both visual sightings and acoustic detections) as well as survey effort (
Figure 11, [
74]). This research and management tool was designed with a focus on the North Atlantic right whale, although other species detections can be contributed. This is another example of a platform that could potentially be used to share whale sightings from VHR imagery.
7.3. WhaleAlert
Whale Alert is a citizen science app used to report and display whale sightings in an effort to reduce the risk of vessel strikes (
Figure 12, [
75]). The app displays verified visual sightings (from shore, vessels, and aircraft) and acoustic detections (from buoys and gliders). In the future, sightings of whales from VHR satellite imagery could also be displayed here for mariner awareness. Sightings submitted to Whale Alert help establish management zones including speed restrictions, warnings, and other measures.
7.4. Obis Seamap
The Ocean Biodiversity Information System Spatial Ecological Analysis of Megavertebrate Populations (OBIS-SEAMAP) web application coalesces marine mammal, sea turtle, seabird, ray, and shark sightings from contributors around the world (
Figure 13, [
76]). It also establishes an automated data import from collaborators including seaturtle.org that serves sea turtle telemetry data. The interactive database can be queried by species, date, and geographic locations. Other services that OBIS-SEAMAP provides include habitat-based density models for marine mammals, photo identification workflows, and a mapping tool for sea turtle nesting sites. Sightings from VHR imagery could be added to visual and acoustic detections already present in OBIS-SEAMAP.
8. Challenges
According to Neil deGrasse Tyson, “When you stop making mistakes, you are no longer on the frontier”; our experience in learning how to work with VHR satellite imagery has made it clear that this work is still very much on the cutting edge. We hope that by sharing the knowledge gained over the past several years we can ease this learning curve for others wishing to explore this field, and we also want to set realistic expectations for the limitations and challenges that will be encountered as we transition to operations, despite the uncertainty surrounding many of these issues.
8.1. Cost of VHR Satellite Imagery
Access to imagery is a barrier for most researchers wishing to explore the potential of using VHR satellite imagery to monitor wildlife. The cost of VHR satellite imagery is prohibitively high and data sharing is limited by strict licensing agreements. This is especially difficult for researchers in less resourced countries [
77,
78,
79,
80,
81]. Long-lasting solutions, such as partnerships and data sharing between satellite providers, researchers, NGOs and governments, is essential to ultimately achieve conservation goals. Cubaynes and Fretwell’s [
39] open source database is an important first step to achieving a global dataset, a direction GAIA aims to follow.
8.2. Lack of Archival Imagery
Satellite sensors do not continuously collect imagery as they orbit around the Earth, but rather use the time between collection requests to perform sensor maintenance and conserve power. Therefore, archival imagery is only available where customers have tasked image collection, and this tends to be over areas of interest to the military or commercial development—rarely does this coincide with marine mammal aggregations. Therefore, in most cases, a researcher interested in looking through satellite imagery for historical insights will find the available imagery lacking.
8.3. Tasking Limitations
Due to the unavailability of archival imagery over open water, researchers must task the collection of new imagery. Tasking imagery has several drawbacks including limited geographic and temporal coverage, weather conditions, and competing priorities that can make image acquisition uncertain and/or unsuccessful. For example, with the Electro-Optical Commercial Layer license, GAIA is limited to collection areas ≤2400 km2 for each tasking, with a collection frequency every three days for a maximum of 21 days. Additionally, tasking under this contract is classified as ‘low priority’ which can be particularly challenging when trying to collect imagery near an area such as a major city that may be of interest to military or commercial clients with higher priority. While the AOI is specified during the tasking process, there is no ability to determine the specific timing of the collection with the 21-day period; therefore, making comparative studies to understand marine mammal detection across platforms such as aerial and ship board surveys is difficult if not impossible.
8.4. Downloading Imagery
Currently GAIA downloads Basic 1B imagery via manual download from Earth Explorer, a process that is very time consuming and hampers the development of automated systems. The development of APIs to automatically query and download imagery is essential for enabling real-time monitoring applications. With programmatic access to VHR satellite imagery, automated tasks could be created to: (1) search for new imagery over known whale hotspots, (2) download and process images, (3) run detection algorithms, and (4) serve image chips to expert annotators for validation.
8.5. Environmental Conditions
The impact of cloud cover on the availability of VHR satellite imagery may represent a significant challenge in some parts of the world. Some machine learning experts have indicated that this issue can be resolved for thin cloud cover, but thick cover will continue to present a challenge. Algorithms that remove thin cloud layers may not be appropriate for all species, particular white animals such as belugas.
Wind conditions also present a significant challenge to detecting marine mammals in satellite imagery. High winds produce waves on the surface of the ocean, which can create a large amount of visual clutter that obfuscates the presence of whales, especially small light-colored animals such as beluga whales that are easily confused with whitecaps. Thus far, VHR satellite detection of whales in the ocean have all been under ideal weather conditions, and it remains to be seen how well whales can be detected in higher winds. This will likely vary by species with smaller animals such as dolphins and seals being obscured more easily than large whales.
8.6. Difficulty of Manual Annotation
Once the challenges of acquiring high-quality imagery have been overcome, the next obstacle is finding the object of interest. In the case of marine mammals, this is especially difficult given their small size, limited time spent at the surface, and sparsity. Most of the image will contain water and waves, and finding the animals is akin to looking for a needle in a haystack. Until automated tools are developed, this requires a large pool of scientists with the expertise to identify different species from an aerial viewpoint to go through large volumes of imagery. This process is tedious, time consuming, and therefore expensive. Cubaynes et al. [
24] estimated a time of 3 hours and 20 minutes to scan 100 km
2 of imagery. Observer bias and fatigue can also play a role, analogous to the challenges faced by aerial and shipboard surveys.
8.7. Licensing Restrictions
Given the challenges discussed above with collecting imagery of whale aggregations and then finding whales in the imagery, it is critical to the development of machine learning models that the research community is able to pool this information into a shared annotation database. We encourage satellite imagery providers to consider licensing agreements that facilitate sharing AI-ready datasets to accelerate the development of machine learning and launch us into a future where this imagery lives up to its full potential. In the meantime, we encourage the research community to share what we can including annotation metadata ((Catalog ID and image product)) following the example set by Cubaynes and Fretwell [
39].
8.8. Annotation Alignment
Spatial offsets between imagery and annotations can occur if an image was processed differently than the one originally used to create the annotations. These offsets are typically due to differences in image processing (orthorectification, projection, pansharpening, etc.). To prevent annotation misalignment, it is best to share the image used to create the annotations. However, since license restrictions often prevent image sharing, collaborators can share geographically referenced annotations along with image metadata (Catalog ID and image product) so that an identical image can be obtained independently. However, GAIA discovered a spatial shift between annotations provided by collaborators and the image obtained through Maxar Technologies’ G-EDG interface despite having the same Catalog ID and being the same product (Standard 2A) (
Figure 14). The annotated whales were shifted 10 to 30 meters because the image used to create the annotations was a mosaic (an image made of several images merged together), whereas GAIA received the individual tiles that were used to create the mosaic. This difference resulted in a five-second difference in the acquisition times of the two images, and thus spatial offset. Without access to the exact same product that was used for annotation, researchers are unable to leverage annotations by previous researchers and reproduce their results. This finding revealed the importance of understanding the various commercial image products and image processing steps. Ideally, an operational whale detection system should be able to handle all satellite imagery product types available.
8.9. Animal Behavior
In addition to the challenges already discussed, whales are dynamic and their position in time and space is quite variable. For example, consider an AI-ready dataset of vehicles from satellite imagery. While the size and shape may vary, they will generally always be in the same orientation with wheels on the ground. Marine animals, however, can look quite different depending on what behavioral state they are in (traveling, feeding, socializing, breaching, etc.), and these differences in position can make the object classification task more complex. Whales can easily be confused with whitecaps, birds, and rocks, particularly in images of poor quality due to adverse weather conditions and/or lower resolution.
8.10. Availability and Perception Biases
Further research will be required to evaluate the availability and perception bias of counting various species of marine mammals by satellite (as opposed to vessel or aerial surveys) before the techniques described here can be used to assess populations in abundance and distribution estimates such as Bamford et al. [
28].
8.11. IT Infrastructure
Downloading and handling large volumes of satellite imagery is time consuming and requires cloud storage and processing infrastructure. This adds additional complexity and cost to the development of an operational system. GAIA is being supported by a grant from Microsoft AI for Good for cloud compute resources in Azure.
8.12. Platform Limitations
All of the different tools utilized in conservation research have different strengths and limitations. Some research goals are not applicable to this methodology such as individual photo identification, detecting entanglements, health assessments, and biopsy sampling. Researchers will determine which tool best suits the study goals by considering a variety of factors such as cost, data collection needs, distance from shore, availability of assets and personnel, weather conditions, and timeliness of the data needed. We do not envision that VHR satellite imagery will replace other tools such as vessels, aircraft, and acoustics, but rather augment them.
9. Conclusions
The recent advancements in VHR satellite imagery, cloud computing, and artificial intelligence have tremendous potential for the development of an operational system to detect marine mammals around the world. The Geospatial Artificial Intelligence for Animals (GAIA) initiative was formed to address this challenge with collaborative innovation pulling from government agencies, independent researchers, academia, and the private sector. We have acquired large volumes of Maxar Technologies imagery over known seasonal aggregations of North Atlantic right whales and Cook Inlet beluga whales from WorldView-3, WorldView-2, and GeoEye-1 satellites. This publication summarizes much of what we have learned over the past few years, and we share this knowledge in hopes that it will speed up the onboarding process for those new to handling satellite imagery. We seek to develop and share a large, standardized dataset of high-quality annotations to facilitate automated detection, and to share our knowledge and software tools along the way. Once the machine learning algorithms have matured, significant investments will be needed to transition from research to operations. The potential benefits of a platform that is not limited by distance from shore is very exciting. These efforts should lay the groundwork for future generations of scientists to have another tool in the toolbox as we seek to understand and protect marine mammals around the world.
Supplementary Materials
The following supporting information can be downloaded at:
https://www.mdpi.com/article/10.3390/jmse11030595/s1, Table S1: Khan et al Satellite Trends Data Supplemental Materials_S1; Table S2: Khan et al Biologists Guide Bands Supplemental Material_S2, Table S3: Khan et al Image Product Summary Supplemental Materials_S3, Word S4: Khan et al Spectral Angle Mapping Supplemental Materials_S4.
Author Contributions
Conceptualization, C.B.K., K.T.G., E.M., and H.C.C.; investigation, C.B.K., K.T.G., H.C.C., C.R., E.M., T.A., M.S., P.J.C., M.A.L., K.L., and A.O.; resources, J.M.L.F.; data curation, T.A., C.R., E.M., T.W., and H.C.C.; writing—original draft preparation, C.B.K., K.T.G., H.C.C., C.R., E.M., and P.J.C.; writing—review and editing, C.B.K., K.T.G., H.C.C., C.R., and P.J.C.; visualization, C.B.K. and C.R.; funding acquisition, C.B.K., K.T.G., E.M., H.C.C., and J.M.L.F. All authors have read and agreed to the published version of the manuscript.
Funding
This research was funded by the U.S. Naval Research Laboratory, Microsoft, the National Oceanographic Partnership Program, the National Protected Species Toolbox initiative, NOAA’s High Performance Computing and Communications IT Incubator, the Marine Mammal Commission (project MMC21-043), and the Ecosystems component of the British Antarctic Survey, funded by the Natural Environment Research council (NERC).
Institutional Review Board Statement
Not applicable for studies not involving humans or animals.
Data Availability Statement
Acknowledgments
Acknowledgments: We are deeply grateful to a large community of supporters without whom this work would not have been possible—to Olivia Pisano for her research which inspired confidence in the future of satellites to monitor whales; to Caroline Höschle from Spacewhale and the organizing committee of the workshop “Marine mammal surveys from satellite imagery: Applications, automation, and challenges” at the Society for Marine Mammalogy meeting in Barcelona where the buzz of energy in the room propelled this work forward; to Justin Harrison (Maxar Technologies) for providing a vision of what the future could hold and for helping us work through numerous challenges; to Scott Southerland (Maxar Technologies) for numerous technical discussions; to Christopher Wackerman (Naval Research Laboratory) for his deep dive into the detection of whales in satellite imagery and for sharing his passion for the technical details; to Andrew Haack and Steven Hak (U.S. Geological Survey), and Brenda Ellis (KBR Inc., Contractor to the U.S. Geological Survey) for their operational support for collecting imagery; to Danielle Cholewiak, Robyn Angliss, and Sean Hayes (NOAA Fisheries) for supporting this ambitious and innovative project.
Conflicts of Interest
GAIA received a grant from Microsoft AI for Good for compute time and data scientist expertise. We have no other conflicts of interest to declare. The findings and conclusions in this paper are those of the author(s) and do not necessarily represent the views of the National Marine Fisheries. Service, NOAA. Mention of trade names and commercial firms does not imply endorsement by the National Marine Fisheries Service, NOAA.
Glossary
| Area of Interest (AOI) | The area on the Earth that you want to view. |
| Catalog ID | unique identifier for satellite images |
| Convolutional Neural Network (CNN) | A type of network architecture for deep learning algorithms specifically used for image recognition. |
| Geospatial Data Abstraction Library (GDAL) | An open-source library for translating and transforming geospatial data. |
| Geographic Coordinate System | A network of imaginary lines (latitude and longitude) on used to define locations on the surface of the earth. |
| GeoTIFF Format | Georeferenced tagged image file format. A GeoTIFF file is a TIFF file that is embedded with geographic data tags. |
| Ground Sample Distance (GSD) | The distance between pixel centers measured on the ground, also referred to as the spatial resolution of the image. |
| Image Strip | Interchangeable with Catalog ID |
| Marine Domain Awareness (MDA) | The effective understanding of anything associated with the global maritime domain that could impact the security, safety, economy, or environment of the United States. |
| Multispectral (MS) | Imagery with data recorded in multiple discrete spectral bands. Imagery collected in four or eight ranges of wavelengths in the electromagnetic spectrum. |
| Nadir | The point on the ground vertically beneath the sensor. |
| NITF Format | National Imagery Transmission Format. A United States Department of Defense standard for transmitting and storing digital imagery. |
| Off-nadir Angle | The angle between nadir and the point on the ground that the sensor is pointing. Off-nadir angle can be measured in the along-track (forward) direction or across-track (sideways) direction. |
| Orthorectification | The process of removing image distortions introduced by the collection geometry and variable terrain, and re-sampling the imagery to a specified map projection. It is also referred to as ortho-correction or terrain correction. |
| Panchromatic (PAN) | A wide spectral band which is composed of reflected light in the visible spectrum (blue, green, red and NIR). It is displayed as a black and white image. |
| Pansharpen | Processed used to colorize imagery by fusing multispectral and panchromatic bands. |
| Projection | The transformation of latitude and longitude coordinates to plane coordinates. |
| Push Broom | Push broom scanners (or along track scanners) use a line of detectors that capture imagery as the satellite flies forward (much like using a push broom) |
| Radiometric Correction | The correction of variations in data that are not caused by the object or scene being scanned, such as non-responsive detectors, scanner inconsistencies, and atmospheric interference. |
| Remote Sensing | The measurement or acquisition of data about an object by an instrument not in contact with the object. Satellite imagery, aerial photography, and radar are all types of remote sensing. |
| Resolution | The resampled image pixel size derived from the ground sampling distance, or GSD. |
| RGB | The visible light portion of the electromagnetic spectrum (red, green, and blue). |
| Sensor Azimuth | The azimuth of the sensor measured from the target. |
| Sensor Correction | The correction of variations in data that are caused by variations in sensor geometry, attitude, and ephemeris. |
| Spectral Angle Map (SAM) | An automated method for matching pixels to a reference spectra. |
| Spectral Bands | Parts of the electromagnetic spectrum of specific wavelengths. |
| Spectral Signature | Pattern of wavelengths reflected or emitted by an object. |
| Stereo | The collection of two or more images of the same Area of Interest (AOI) from different viewing angles. |
| Swath Width | The width of an image. |
| Universal Transverse Mercator | A projection which divides the earth into 60, 6°-degree longitude segments, or zones. |
| Very High-resolution (VHR) | Very high-resolution satellite imagery. |
| Whisk Broom | Whisk broom scanners (or spotlight or across track scanners) use a mirror to reflect light onto a detector and this mirror moves back and forth (much like sweeping side to side with a whisk broom). |
References
- Aragones, L.V.; Jefferson, T.A.; Marsh, H. Marine mammal survey techniques applicable in developing countries. Asian Mar. Bio. 1997, 14, 15–39. [Google Scholar]
- Kaschner, K.; Tittensor, D.P.; Ready, J.; Gerrodette, T.; Worm, B. Current and future patterns of global marine mammal biodiversity. PLoS ONE 2011, 6, e19653. [Google Scholar] [CrossRef]
- Petso, T.; Jamisola, R.S.; Mpoeleng, D. Review on methods used for wildlife species and individual identification. J. Wildl. Res. 2021, 68, 3. [Google Scholar] [CrossRef]
- Hayes, S.H.; Josephson, E.; Maze-Foley, K.; Rosel, P.E.; Wallace, J.U.S. Atlantic and Gulf of Mexico Marine Mammal Stock Assessments 2021. U.S. Department of Commerce, NOAA Technical Memorandum NMFS-NE-288. 2022. Available online: https://repository.library.noaa.gov/view/noaa/45014 (accessed on 23 December 2022).
- Shelden, K.E.W.; Wade, P.R. Aerial Surveys, Distribution, Abundance, and Trend of Belugas (Delphinapterus leucas) in Cook Inlet, Alaska, June 2018; AFSC Processed Rep; Alaska Fish. Sci. Cent., NOAA, Natl. Mar. Fish. Serv.: Seattle, WA, USA, 2019; 93p. [Google Scholar]
- Nelson, R.F. Detecting forest canopy change due to insect activity using Landsat MSS. Photogramm. Eng. Remote Sens. 1983, 49, 1303–1314. [Google Scholar]
- Reeves, H.M.; Cooch, F.G.; Munro, R.E. Monitoring arctic habitat and goose production by satellite imagery. J. Wildl. Manag. 1976, 40, 532–541. [Google Scholar] [CrossRef]
- Löffler, E.; Margules, C. Wombats detected from space. Remote Sens. Environ. 1980, 9, 47–56. [Google Scholar] [CrossRef]
- Guinet, C.; Jouventin, P.; Malacamp, J. Satellite remote sensing in monitoring change of seabirds: Use of Spot Image in king penguin population increase at Ile aux Cochons, Crozet Archipelago. Polar Biol. 1995, 15, 511–515. [Google Scholar] [CrossRef]
- Finer, M.; Novoa, S.; Weisse, M.J.; Petersen, R.; Mascaro, J.; Souto, T.; Stearns, F.; Martinez, R.G. Combating deforestation: From satellite to intervention. Science 2018, 360, 1303–1305. [Google Scholar] [CrossRef]
- Abileah, R. Marine mammal census using space satellite imagery. US Navy J. Underw. Acoust. 2002, 52, 709–724. [Google Scholar]
- Burn, D.M.; Cody, M.B. Use of satellite imagery to estimate walrus abundance at Round Island, Alaska. In Proceedings of the 16th Biennial Conference on the Biology of Marine Mammals, San Diego, CA, USA, 12–16 December 2005. [Google Scholar]
- LaRue, M.A.; Rotella, J.J.; Garrott, R.A.; Siniff, D.B.; Ainley, D.G.; Stauffer, G.E.; Porter, C.C.; Morin, P.J. Satellite imagery can be used to detect variation in abundance of Weddell seals (Leptonychotes weddellii) in Erebus Bay, Antarctica. Polar Biol. 2011, 34, 1727–1737. [Google Scholar] [CrossRef]
- Boltunov, A.; Evtushenko, N.; Knijnikov, A.; Puhova, M.; Semenova, V. Space technology for the marine mammal research and conservation in the Arctic; WWF-Russia: Murmansk, Russia, 2012; p. 12. [Google Scholar]
- Platonov, N.G.; Mordvintsev, I.N.; Rozhnov, V.V. The possibility of using high resolution satellite images for detection of marine mammals. Biol. Bull. 2013, 40, 197–205. [Google Scholar] [CrossRef]
- Fretwell, P.T.; Staniland, I.J.; Forcada, J. Whales from space: Counting southern right whales by satellite. PLoS ONE 2014, 9, e88655. [Google Scholar] [CrossRef] [PubMed] [Green Version]
- McMahon, C.R.; Howe, H.; van den Hoff, J.; Alderman, R.; Brolsma, H.; Hindell, M.A. Satellites, the All-Seeing Eyes in the Sky: Counting Elephant Seals from Space. PLoS ONE 2014, 9, e92613. [Google Scholar] [CrossRef] [Green Version]
- Stapleton, S.; LaRue, M.; Lecomte, N.; Atkinson, S.; Garshelis, D.; Porter, C.; Atwood, T. Polar bears from space: Assessing satellite imagery as a tool to track arctic wildlife. PLoS ONE 2014, 9, e101513. [Google Scholar] [CrossRef]
- LaRue, M.A.; Stapleton, S.; Porter, C.; Atkinson, S.; Atwood, T.; Dyck, M.; Lecomte, N. Testing methods for using high-resolution satellite imagery to monitor polar bear abundance and distribution. Wildl. Soc. Bull. 2015, 39, 772–779. [Google Scholar] [CrossRef]
- Leaper, R.; Fretwell, P. Results of a pilot study on the use of satellite imagery to detect blue whales off the south coast of Sri Lanka. Paper SC/66a/HIM/2 Presented to the IWC Scientific Committee (unpublished). 2015, p. 9. Available online: https://archive.iwc.int/pages/search.php?search=!collection216&bc_from=themes (accessed on 23 December 2022).
- Moxley, J.H.; Bogomolni, A.; Hammill, M.O.; Moore, K.M.T.; Polito, M.J.; Sette, L.; Sharp, W.B.; Waring, G.T.; Gilbert, J.R.; Halpin, P.N.; et al. Google haul out: Earth observation imagery and digital aerial surveys in coastal wildlife management and abundance estimation. BioScience 2017, 67, 760–768. [Google Scholar] [CrossRef] [PubMed] [Green Version]
- Thums, M.; Jenner, C.; Waples, K.; Salgado Kent, C.; Meekan, M. Humpback Whale Use of the Kimberley, Understanding and Monitoring Spatial Distribution; Report of Project 1.2.1 prepared for the Kimberley Marine Research Program; Western Australian Marine Science Institution: Perth, Western Australia, 2018; 78p. [Google Scholar]
- LaRue, M.A.; Stapleton, S. Estimating the abundance of polar bears on Wrangel Island during late summer using high-resolution satellite imagery: A pilot study. Polar Biol. 2018, 41, 2621–2626. [Google Scholar] [CrossRef]
- Cubaynes, H.C.; Fretwell, P.T.; Bamford, C.; Gerrish, L.; Jackson, J.A. Whales from space: Four mysticete species described using new VHR satellite imagery. Mar. Mammal Sci. 2019, 35, 466–491. [Google Scholar] [CrossRef]
- Borowicz, A.; Le, H.; Humphries, G.; Nehls, G.; Höschle, C.; Kosarev, V.; Lynch, H.J. Aerial-trained deep learning networks for surveying cetaceans from satellite imagery. PLoS ONE 2019, 14, e0212532. [Google Scholar] [CrossRef] [Green Version]
- Fretwell, P.T.; Jackson, J.A.; Ulloa Encina, M.J.; Häussermann, V.; Perez Alvarez, M.J.; Olavarría, C.; Gutstein, C.S. Using remote sensing to detect whale strandings in remote areas: The case of sei whales mass mortality in Chilean Patagonia. PLoS ONE 2019, 14, e0222498. [Google Scholar]
- Guirado, E.; Tabik, S.; Rivas, M.L.; Alcaraz-Segura, D.; Herrera, F. Whale counting in satellite and aerial images with deep learning. Sci. Rep. 2019, 9, 14259. [Google Scholar] [CrossRef] [Green Version]
- Bamford, C.; Kelly, N.; Dalla Rosa, L.; Cade, D.; Fretwell, P.; Trathan, P.; Cubaynes, H.; Mesquita, A.; Gerrish, L.; Friedlaender, A. A comparison of baleen whale density estimates derived from overlapping satellite imagery and a shipborne survey. Sci. Rep. 2020, 10, 12985. [Google Scholar] [CrossRef] [PubMed]
- Cubaynes, H.C. Whales from space: Assessing the feasibility of using satellite imagery to monitor whales. Ph.D Thesis, University of Cambridge, Cambridge, UK, 2020. [Google Scholar] [CrossRef]
- Wege, M.; Salas, L.; LaRue, M. Citizen science and habitat modelling facilitates conservation planning for crabeater seals in the Weddell Sea. Divers. Distrib. 2020, 26, 1291–1304. [Google Scholar] [CrossRef]
- Gonçalves, B.C.; Spitzbart, B.; Lynch, H.J. SealNet: A fully-automated pack-ice seal detection pipeline for sub-meter satellite imagery. Remote Sens. Environ. 2020, 239, 111617. [Google Scholar] [CrossRef]
- Zinglersen, K.B.; Garde, E.; Langley, K.; Mätzler, E. RemoteID: Identification of Atlantic Walrus at Haul Out Sites in Greenland Using High-Resolution Satellite Images; Technical Report No. 111; Greenland Institute of Natural Resources: Nuuk, Greenland, 2019; 62p, ISBN 87-91214-89-0. [Google Scholar]
- Charry, B.; Tissier, E.; Iacozza, J.; Marcoux, M.; Watt, C.A. Mapping Arctic cetaceans from space: A case study for beluga and narwhal. PLoS ONE 2021, 16, e0254380. [Google Scholar] [CrossRef]
- Fischbach, A.S.; Douglas, D.C. Evaluation of satellite imagery for monitoring Pacific walruses at a large coastal haulout. Remote Sens. 2021, 13, 4266. [Google Scholar] [CrossRef]
- Ramos, E.A.; Santoya, L.; Verde, J.; Walker, Z.; Castelblanco-Martínez, N.; Kiszka, J.J.; Rieucau, G. Lords of the Rings: Mud ring feeding by bottlenose dolphins in a Caribbean estuary revealed from sea, air, and space. Mar. Mammal Sci. 2022, 38, 364–373. [Google Scholar] [CrossRef]
- Houegnigan, L.; Merino, E.R.; Vermeulen, E.; Block, J.; Safari, P.; Moreno-Noguer, F.; Nadeu, C. Wildlife and Marine Mammal Spatial Observatory: Observation and automated detection of Southern Right Whales in multispectral satellite imagery. bioRxiv 2022. [Google Scholar] [CrossRef]
- Hodul, M.; Knudby, A.; McKenna, B.; James, A.; Mayo, C.; Brown, M.; Durette-Morin, D.; Bird, S. Individual North Atlantic right whales identified from space. Mar. Mammal Sci. 2022, 39, 220–231. [Google Scholar] [CrossRef]
- Corrêa, A.A.; Quoos, J.H.; Barreto, A.S.; Groch, K.R.; Eichler, P.P.B. Use of satellite imagery to identify southern right whales (Eubalaena australis) on a Southwest Atlantic Ocean breeding ground. Mar. Mammal Sci. 2022, 38, 87–101. [Google Scholar] [CrossRef]
- Cubaynes, H.C.; Fretwell, P.T. Whales from space dataset, an annotated satellite image dataset of whales for training machine learning models. Sci. Data 2022, 9, 245. [Google Scholar] [CrossRef] [PubMed]
- LaRue, M.; Salas, L.; Nur, N.; Ainley, D.; Stammerjohn, S.; Pennycook, J.; Dozier, M.; Saints, J.; Stamatiou, K.; Barrington, L.; et al. Insights from the first global population estimate of Weddell seals in Antarctica. Sci. Adv. 2021, 7, eabh3674. [Google Scholar] [CrossRef] [PubMed]
- LaRue, M.A.; Ainley, D.G.; Pennycook, J.; Stamatiou, K.; Salas, L.; Nur, N.; Stammerjohn, S.; Barrington, L. Engaging ‘the crowd’ in remote sensing to learn about habitat affinity of the Weddell seal in Antarctica. Remote Sens. Ecol. Conserv. 2020, 6, 70–78. [Google Scholar] [CrossRef] [Green Version]
- Bogucki, R.; Cygan, M.; Khan, C.B.; Klimek, M.; Milczek, J.K.; Mucha, M. Applying deep learning to right whale photo identification. Conserv. Biol. 2019, 33, 676–684. [Google Scholar] [CrossRef]
- Krizhevsky, A.; Sutskever, I.; Hinton, G.E. Imagenet Classification with Deep Convolutional Neural Networks. In Proceedings of the 25th International Conference on Neural Information Processing Systems, Lake Tahoe, NV, USA, 3–6 December 2012; pp. 1097–1105. [Google Scholar]
- He, K.; Zhang, X.; Ren, S.; Sun, J. Deep residual learning for image recognition. In Proceedings of the Las Vegas 2016 IEEE Conference on Computer Vision and Pattern Recognition (CVPR), Las Vegas, NV, USA, 27–30 June 2016; pp. 770–778. [Google Scholar]
- Long, J.; Shelhamer, E.; Darrell, T. Fully convolutional networks for semantic segmentation. In Proceedings of the Boston 2015 IEEE Conference on Computer Vision and Pattern Recognition (CVPR), Boston, MA, USA, 7–12 June 2015; pp. 3431–3440. [Google Scholar] [CrossRef] [Green Version]
- Ren, S.; He, K.; Girshick, R.; Sun, J. Faster r-cnn: Towards real-time object detection with region proposal networks. Adv. Neural Inf. Process. Syst. 2015, 28, 91–99. [Google Scholar] [CrossRef] [PubMed] [Green Version]
- Redmon, J.; Divvala, S.; Girshick, R.; Farhadi, A. You only look once: Unified, real-time object detection. In Proceedings of the Las Vegas 2016 IEEE Conference on Computer Vision and Pattern Recognition (CVPR), Las Vegas, NV, USA, 27–30 June 2016; pp. 779–788. [Google Scholar]
- Taigman, Y.; Yang, M.; Ranzato, M.A.; Wolf, L. Deepface: Closing the gap to human-level performance in face verification. In Proceedings of the Columbus 2014 IEEE Conference on Computer Vision and Pattern Recognition (CVPR), Columbus, OH, USA, 23–28 June 2014; pp. 1701–1708. [Google Scholar] [CrossRef]
- Xing, F.; Xie, Y.; Su, H.; Liu, F.; Yang, L. Deep learning in microscopy image analysis: A survey. IEEE Trans. Neural Netw. Learn. Syst. 2017, 29, 4550–4568. [Google Scholar] [CrossRef]
- Hoekendijk, J.P.A.; Kellenberger, B.; Aarts, G.; Brasseur, S.; Poiesz, S.S.H.; Tuia, D. Counting using deep learning regression gives value to ecological surveys. Sci. Rep. 2021, 11, 23209. [Google Scholar] [CrossRef]
- Shippert, P. Push Broom and Whisk Broom Sensors. 2013. Available online: https://www.l3harrisgeospatial.com/Learn/Blogs/Blog-Details/ArtMID/10198/ArticleID/16262/Push-Broom-and-Whisk-Broom-Sensors (accessed on 23 December 2022).
- NASA’s Goddard Space Flight Center. Landsat Sensors: Pushbroom vs Whiskbroom. 2017. Available online: https://svs.gsfc.nasa.gov/12754 (accessed on 23 December 2022).
- Digital Globe Core Imagery Products Guide. Available online: www.geosoluciones.cl/documentos/worldview/DigitalGlobe-Core-Imagery-Products-Guide.pdf (accessed on 23 December 2022).
- Brown, C. The ArcGIS® Imagery Book: New View, New Vision; Esri Press: Redlands, CA, USA, 2016. [Google Scholar]
- What is Orthorectified Imagery? 2016. Available online: https://www.esri.com/about/newsroom/insider/what-is-orthorectified-imagery/ (accessed on 23 December 2022).
- Contributors, G.O. 2022 GDAL/OGR Geospatial Data Abstraction software Library. Open Source Geospatial Foundation. Available online: https://gdal.org10.5281/zenodo.5884351 (accessed on 23 December 2022).
- Project Raster. Available online: https://pro.arcgis.com/en/pro-app/latest/tool-reference/data-management/project-raster.htm (accessed on 23 December 2022).
- Van Der Meer, F. What does multisensor image fusion add in terms of information content for visual interpretation? Int. J. Remote Sens. 1997, 18, 445–452. [Google Scholar] [CrossRef]
- Xu, Q.; Zhang, Y.; Li, B. Recent advances in pansharpening and key problems in applications. Int. J. Image Data Fusion 2014, 5, 175–195. [Google Scholar] [CrossRef]
- GIS Geography. What is Atmospheric Correction in Remote Sensing? 2022. Available online: https://gisgeography.com/atmospheric-correction/ (accessed on 23 December 2022).
- Cubaynes, H.C.; Clarke, P.J.; Goetz, K.T.; Aldrich, T.; Fretwell, P.T.; Leonard, K.E.; Khan, C.B. Annotating very high-resolution satellite imagery: A whale case study. MethodsX 2023, 10, 102040. [Google Scholar] [CrossRef]
- Blount, D.; Gero, S.; Van Oast, J.; Parham, J.; Kingen, C.; Scheiner, B.; Stere, T.; Fisher, M.; Minton, G.; Khan, C.; et al. Flukebook: An open-source AI platform for cetacean photo identification. Mamm. Biol. 2022, 102, 1005–1023. [Google Scholar] [CrossRef]
- Cheeseman, T.; Southerland, K.; Park, J.; Olio, M.; Flynn, K.; Calambokidis, J.; Jones, L.; Garrigue, C.; Frisch Jordán, A.; Howard, A. Advanced image recognition: A fully automated, high-accuracy photo-identification matching system for humpback whales. Mamm. Biol. 2021, 102, 915–929. [Google Scholar] [CrossRef]
- Crall, J.P.; Stewart, C.V.; Berger-Wolf, T.Y.; Rubenstein, D.I.; Sundaresan, S.R. Hotspotter—Patterned species instance recognition. In Proceedings of the Clearwater 2013 IEEE Workshop on Applications of Computer Vision (WACV), Clearwater Beach, FL, USA, 15–17 January 2013; pp. 230–237. [Google Scholar] [CrossRef]
- Khan, C.; Blount, D.; Parham, J.; Holmberg, J.; Hamilton, P.; Charlton, C.; Christiansen, F.; Johnston, D.; Rayment, W.; Dawson, S.; et al. Artificial intelligence for right whale photo identification: From data science competition to worldwide collaboration. Mamm. Biol. 2022, 102, 1025–1042. [Google Scholar] [CrossRef]
- Moskvyak, O.; Maire, F.; Dayoub, F.; Armstrong, A.O.; Baktashmotlagh, M. Robust re-identification of manta rays from natural markings by learning pose invariant embeddings. In Proceedings of the 2021 Digital Image Computing: Techniques and Applications (DICTA), Gold Coast, Australia, 29 November–1 December 2021; pp. 1–8. [Google Scholar] [CrossRef]
- Thompson, J.W.; Zero, V.H.; Schwacke, L.H.; Speakman, T.R.; Quigley, B.M.; Morey, J.S.; McDonald, T.L. finFindR: Computer-assisted recognition and identification of bottlenose dolphin photos in R. bioRxiv 2019. [Google Scholar] [CrossRef] [Green Version]
- Weideman, H.; Stewart, C.; Parham, J.; Holmberg, J.; Flynn, K.; Calambokidis, J.; Paul, D.B.; Bedetti, A.; Henley, M.; Pope, F. Extracting identifying contours for African elephants and humpback whales using a learned appearance model. In Proceedings of the Snowmass 2020 IEEE Winter Conference on Applications of Computer Vision (WACV), Snowmass, CO, USA, 1–5 March 2020; pp. 1265–1274. [Google Scholar] [CrossRef]
- Weideman, H.J.; Jablons, Z.M.; Holmberg, J.; Flynn, K.; Calambokidis, J.; Tyson, R.B.; Allen, J.B.; Wells, R.S.; Hupman, K.; Urian, K. Integral curvature representation and matching algorithms for identification of dolphins and whales. In Proceedings of the Venice 2017 IEEE International Conference on Computer Vision Workshops (ICCVW), Venice, Italy, 22–29 October 2017; pp. 2831–2839. Available online: https://doi.ieeecomputersociety.org/10.1109/ICCVW.2017.334 (accessed on 23 December 2022).
- Cireşan, D.C.; Meier, U.; Gambardella, L.M.; Schmidhuber, J. Deep, big, simple neural nets for handwritten digit recognition. Neural Comput. 2010, 22, 3207–3220. [Google Scholar] [CrossRef] [Green Version]
- Oh, K.-S.; Jung, K. GPU implementation of neural networks. Pattern Recognit. 2004, 37, 1311–1314. [Google Scholar] [CrossRef]
- Raina, R.; Madhavan, A.; Ng, A.Y. Large-scale deep unsupervised learning using graphics processors. In Proceedings of the 26th Annual International Conference on Machine Learning, Montreal, QC, Canada, 14–18 June 2009; ACM: Montreal, QC, Canada, 2009; pp. 873–880. [Google Scholar]
- Mcgowan, J.A. Small Satellite Sensor and Processing Analysis for Maritime Domain Awareness. Master’s Thesis, Naval Postgraduate School, Monterey, CA, USA, 2018. [Google Scholar]
- Johnson, H.; Morrison, D.; Taggart, C. WhaleMap: A tool to collate and display whale survey results in near real-time. J. Open Source Softw. 2021, 6, 3094. [Google Scholar] [CrossRef]
- Wiley, D.; Hatch, L.; Schwehr, K.; Thompson, M.; MacDonald, C. Marine sanctuaries and marine planning. Coast Guard. Proc. Mar. Saf. Secur. Counc. 2013, 70, 10–15. [Google Scholar]
- Halpin, P.N.; Read, A.J.; Fujioka, E.I.; Best, B.D.; Donnelly, B.E.N.; Hazen, L.J.; Kot, C.; Urian, K.I.M.; Labrecque, E.; Dimatteo, A.; et al. OBIS-SEAMAP The World Data Center for Marine Mammal, Sea Bird, and Sea Turtle Distributions. Oceanography 2019, 22, 104–115. [Google Scholar] [CrossRef]
- Asase, A.; Mzumara-Gawa, T.I.; Owino, J.O.; Peterson, A.T.; Saupe, E. Replacing “parachute science” with “global science” in ecology and conservation biology. Conserv. Sci. Pract. 2022, 4, e517. [Google Scholar] [CrossRef]
- Clarke, P.J.; Cubaynes, H.C.; Stockin, K.A.; Olavarría, C.; de Vos, A.; Fretwell, P.T.; Jackson, J.A. Cetacean Strandings from Space: Challenges and Opportunities of Very High Resolution Satellites for the Remote Monitoring of Cetacean Mass Strandings. Front. Mar. Sci. 2021, 8, 1448. [Google Scholar] [CrossRef]
- Höschle, C.; Cubaynes, H.C.; Clarke, P.J.; Humphries, G.; Borowicz, A. The Potential of Satellite Imagery for Surveying Whales. Sensors 2021, 21, 963. [Google Scholar] [CrossRef] [PubMed]
- Parker, C.; Cranford, M.; Oakes, N.; Leggett, M. The Little Biodiversity Finance Book: A Guide to Proactive Investment in Natural Capital (PINC); Global Canopy Programme: Oxford, United Kingdom, 2012. [Google Scholar]
- Turner, W.; Rondinini, C.; Pettorelli, N.; Mora, B.; Leidner, A.K.; Szantoi, Z.; Buchanan, G.; Dech, S.; Dwyer, J.; Herold, M.; et al. Free and open-access satellite data are key to biodiversity conservation. Biol. Conserv. 2015, 182, 173–176. [Google Scholar] [CrossRef] [Green Version]
Figure 1.
A comparison of imagery collected during aerial surveys and from VHR satellites for the North Atlantic right whale and the Cook Inlet beluga whale. (a) An aerial photograph of a North Atlantic right whale taken from a handheld 300 mm fixed lens from a NOAA Twin Otter aircraft. Image collected under MMPA Research Permit 17355; (b) A WorldView-3 satellite image of a North Atlantic right whale (Catalog ID: 10400100674B2100, Standard 2A product, pansharpened at 0.5 m/px resolution); (c) An aerial still image of Cook Inlet beluga whales captured from video footage collected on a Sony FDR-AX700 video handycam (3840 × 2160 pixel resolution) at 800 ft altitude. Video collected under MMPA Research Permit 25563; (d) A WorldView-3 satellite image of Cook Inlet beluga whale (Catalog ID: 104001006F3F8E00, Basic 1B product, pansharpened at a 0.37 m/px resolution). Satellite images © 2023 Maxar Technologies.
Figure 2.
Trends in earth observation very high-resolution (VHR) satellites launched since 1972 by commercial and government providers (excluding military), showing the number of satellites launched per year on the left vertical axis and the mean spatial resolution on the right vertical axis. Adapted with permission from [
10]. See
Supplementary Materials S1 for the underlying data.
Figure 3.
The timeline of advancements in wildlife research using very high-resolution (VHR) satellite imagery to understand habitat, distribution, and density with particular emphasis on developments relevant to the detection of marine mammals.
Figure 3.
The timeline of advancements in wildlife research using very high-resolution (VHR) satellite imagery to understand habitat, distribution, and density with particular emphasis on developments relevant to the detection of marine mammals.
Figure 4.
Demonstration of differences between two commonly used optical sensors: whisk broom and push broom. Adapted with permission from Florian Hillen’s illustrations [
51].
Figure 4.
Demonstration of differences between two commonly used optical sensors: whisk broom and push broom. Adapted with permission from Florian Hillen’s illustrations [
51].
Figure 5.
Illustration of nadir and the off-nadir angle when a satellite captures imagery over a whale.
Figure 5.
Illustration of nadir and the off-nadir angle when a satellite captures imagery over a whale.
Figure 6.
The wavelengths of multispectral band edges for each band given in nanometers found in VHR satellites with image resolution ≤ 0.50 m. * Utilized by Geospatial Artificial Intelligence for Animals (GAIA). § As of early 2019, WorldView-4 is in non-recoverable status and no longer collecting new imagery.
Figure 7.
Results from querying and downloading a specific Catalog ID (104001002090DF00) through the G-EGD web interface as a full image strip (left) and through Earth Explorer as tiled images (right).
Figure 7.
Results from querying and downloading a specific Catalog ID (104001002090DF00) through the G-EGD web interface as a full image strip (left) and through Earth Explorer as tiled images (right).
Figure 8.
Example of very high-resolution panchromatic imagery, lower-resolution multispectral RGB imagery, and the resulting pansharpened product (Brovey pansharpening) of two right whales in Cape Cod Bay, Massachusetts (Top row, Catalog ID: 10400100674B2100, WorldView-3, Standard 2A product) and three beluga whales in Cook inlet, Alaska (bottom row, Catalog ID: 104001006F3F8E00, WorldView-3, Basic 1B product). Satellite images © 2023 Maxar Technologies.
Figure 9.
Screenshot of an initial version of the GAIA human-in-the-loop annotation tool. (a) Shows where the current point is in a larger spatial context-e.g., the point shown in the screenshot is off the east coast of Cape Cod Bay; (b) shows the current image chip to be labeled-these chips are extracted from larger satellite images in an unsupervised manner; (c) radio buttons let users select classification confidence and whale species type (if necessary), a comment box allows users to annotate anything additional of interest about each sample, and sliders allow users to adjust the image chip to be labeled (zooming in and out and adjusting brightness/contrast); (d) a list of buttons allows users to quickly label each chip-each time a button is clicked the interface will immediately show the next image chip to be labeled.
Figure 10.
The Maritime Domain Awareness (MDA) platform, Proteus, demonstrating the last 24 hours of vessel activity at the mouth of Chesapeake Bay on 30 June 2022.
Figure 10.
The Maritime Domain Awareness (MDA) platform, Proteus, demonstrating the last 24 hours of vessel activity at the mouth of Chesapeake Bay on 30 June 2022.
Figure 11.
The WhaleMap web application designed to collate and display the latest whale positions (both visual sightings and acoustic detections) as well as survey effort (
www.whalemap.org (accessed on 23 December 2022)).
Figure 11.
The WhaleMap web application designed to collate and display the latest whale positions (both visual sightings and acoustic detections) as well as survey effort (
www.whalemap.org (accessed on 23 December 2022)).
Figure 12.
The Whale Alert citizen science app used to report and display whale sightings in an effort to reduce the risk of vessel strikes (
https://www.whalealert.org/ (accessed on 23 December 2022)).
Figure 12.
The Whale Alert citizen science app used to report and display whale sightings in an effort to reduce the risk of vessel strikes (
https://www.whalealert.org/ (accessed on 23 December 2022)).
Figure 13.
The Ocean Biodiversity Information System Spatial Ecological Analysis of Megavertebrate Populations (OBIS-SEAMAP) web application, which coalesces marine mammal, sea turtle, seabird, ray, and shark sightings from contributors around the world (
https://seamap.env.duke.edu/ (accessed on 23 December 2022)).
Figure 14.
Example of annotation misalignment due to image processing despite obtaining the same Catalog ID and image product (Catalog ID: 103001000CD56600, WorldView-3, Standard 2A product). The green point annotations are shifted rather than being centered on each animal as they were when the image was originally annotated. Satellite images © 2023 Maxar Technologies.
Table 1.
Summary of publications that have used satellite imagery to detect marine mammals.
Table 1.
Summary of publications that have used satellite imagery to detect marine mammals.
| Year | Authors | Satellite | Species | Details |
|---|
| 2002 | [11] | IKONOS-2 | Orca, Humpback | Detection |
| 2005 | [12] | Quickbird | Walrus | Detect haulouts, abundance |
| 2011 | [13] | Quickbird-2,WorldView-1 | Weddell seals | Abundance variation |
| 2012 | [14] | Eros-B | Walrus | Detect rookeries, count individuals |
| 2013 | [15] | GeoEye-1 | Polar bear, pinnipeds, whales | Detect individuals and tracks |
| 2014 | [16] | WorldView-2 | Southern
right whale | Abundance |
| 2014 | [17] | GeoEye-1 | Elephant seal | Abundance |
| 2014 | [18] | WorldView-2, Quickbird | Polar bear | Distribution, abundance |
| 2015 | [19] | WorldView-2, Quickbird | Polar bear | Distribution, abundance, automation |
| 2015 | [20] | WorldView-2 | Blue whale | Detect individuals |
| 2017 | [21] | Various via Google Earth | Gray seal | Abundance variation |
| 2018 | [22] | WorldView-2, -3 | Humpback whale | Detect individuals |
| 2018 | [23] | WorldView-3 | Polar bear | Abundance, count individuals |
| 2019 | [24] | WorldView-3 | Fin, humpback, Southern right, gray whales | Detection |
| 2019 | [25] | WorldView-3 | Southern
right, humpback whales | Detect individuals |
| 2019 | [26] | WorldView-2 | Sei whale | Stranding counts |
| 2019 | [27] | Google Earth | various | Abundance |
| 2020 | [28] | WorldView-3 | Humpback whale | Density |
| 2020 | [29] | WorldView-2,-3, GeoEye-1, Quickbird-2 | Southern right, humpback, fin, gray whales | Detect individuals |
| 2020 | [30] | Specific sensors not listed | Crabeater seal | Abundance variation |
| 2020 | [31] | WorldView-3 | Crabeater, Weddell, leopard, Ross seals | Abundance |
| 2020 | [32] | WorldView-2, -3 | Walrus | Spatial and temporal satellite capability |
| 2021 | [33] | WorldView-3 | Beluga, narwhal whales | Density |
| 2021 | [34] | Sentinel-1, TerraSAR-X, Landsat | Pacific walrus | Detect aggregations |
| 2021 | [35] | WorldView-2 | Bottlenose dolphin | Detect individuals and mud ring feeding |
| 2022 | [36] | IKONOS-2, GeoEye-1, WorldView-1,-2,-3 | Southern
right whale | Detect individuals, automation |
| 2022 | [37] | Worldview-3 | North Atlantic
right whale | Detect individuals |
| 2022 | [38] | Pleiades-1A, Sentinel 2, Landsat 8, Rapid Eye, Planet Scope | Southern
right whale | Detect individuals, aerial comparison |
| 2022 | [39] | WorldView-2,-3, GeoEye-1, Quickbird-2 | Southern right, humpback, fin, gray whales | Annotated satellite image dataset |
Table 2.
Sensors collecting ≤ 0.50 m resolution very high-resolution satellite imagery including company, launch date, panchromatic and multispectral resolution, swath width, and revisit rate.
Table 2.
Sensors collecting ≤ 0.50 m resolution very high-resolution satellite imagery including company, launch date, panchromatic and multispectral resolution, swath width, and revisit rate.
| Sensor | Launch Date | Panchromatic Resolution † | Multispectral Resolution † | Swath Width † | Revisit Rate |
|---|
WorldView-1
Maxar Technologies | 18 September 2007 | 0.50 m | NA | 17.6 km | 1.7 days |
GeoEye-1 *
Maxar Technologies | 6 September 2008 | 0.41/0.49 m ** | 1.64 m | 15.2 km | <3 days |
WorldView-2 *
Maxar Technologies | 8 October 2009 | 0.46 m | 1.84 m | 16.4 km | 1.1 days |
Pléiades-1A
Airbus | 16 December 2011 | 0.50 m | 2.00 m | 20.0 km | Daily |
Pléiades-1B
Airbus | 2 December 2012 | 0.50 m | 2.00 m | 20.0 km | Daily |
WorldView-3 *
Maxar Technologies | 13 August 2014 | 0.31 m | 1.24 m | 13.1 km | <1/day |
WorldView-4 §
Maxar Technologies | 2016
November | 0.30 m | 1.24 m | 13.1 km | <1/day |
Pléiades Neo 3
Airbus | 28 April 2021 | 0.30 m | 1.20 m | 14.0 km | 2x/day |
Pléiades Neo 4
Airbus | 16 August 2021 | 0.30 m | 1.20 m | 14.0 km | 2x/day |
SuperView Neo
China Siwei | 29 April 2022 | 0.30 m | 1.20 m | 12.0 km | Daily |
Pleiades Neo 5 & 6 §§
Airbus | 20 December 2022 | 0.30 m | 1.20 m | 14.0 km | 2x/day |
WorldView Legion
Maxar Technologies | Estimated: 2023 | 0.29 m | 0.48 m | 9.0 km | 15x/day |
Pelican
Planet | Estimated: 2023 | 0.30 m | – | – | 30x/day |
Albedo
Albedo | Estimated: 2024 | 0.10 m | 0.40 m | 7.0 km | 15 days |
Table 3.
The relationship between off-nadir angle and the ground sampling distance (GSD) by sensor for Maxar Technologies satellites. Grayed-out boxes indicate GSD > 0.50 m resolution and are therefore unlikely to be of sufficient quality for marine mammal detection. The closer the nadir angle is to zero, the higher the resolution of the resulting image collection.
| Off-Nadir | Ground Sampling Distance |
|---|
| Angle | GeoEye-1 | WorldView-1 | WorldView-2 | WorldView-3 |
|---|
| 0 | 0.41 | 0.50 | 0.47 | 0.31 |
| 5 | 0.41 | 0.50 | 0.47 | 0.31 |
| 10 | 0.42 | 0.51 | 0.48 | 0.32 |
| 15 | 0.44 | 0.53 | 0.49 | 0.33 |
| 20 | 0.46 | 0.55 | 0.52 | 0.34 |
| 25 | 0.49 | 0.59 | 0.55 | 0.37 |
| 30 | 0.53 | 0.64 | 0.60 | 0.40 |
| 35 | 0.59 | 0.70 | 0.67 | 0.44 |
| 40 | 0.67 | 0.79 | 0.76 | 0.50 |
| 45 | 0.78 | 0.91 | 0.90 | 0.58 |
| 50 | 0.96 | 1.10 | 1.12 | 0.70 |
| 55 | 1.26 | 1.39 | 1.51 | 0.91 |
| 60 | 1.93 | 1.93 | 2.51 | 1.34 |
Table 4.
Websites for browsing and downloading very high-resolution satellite imagery.
Table 4.
Websites for browsing and downloading very high-resolution satellite imagery.
| Disclaimer/Publisher’s Note: The statements, opinions and data contained in all publications are solely those of the individual author(s) and contributor(s) and not of MDPI and/or the editor(s). MDPI and/or the editor(s) disclaim responsibility for any injury to people or property resulting from any ideas, methods, instructions or products referred to in the content. |
© 2023 by the authors. Licensee MDPI, Basel, Switzerland. This article is an open access article distributed under the terms and conditions of the Creative Commons Attribution (CC BY) license (https://creativecommons.org/licenses/by/4.0/).


 ,
, 


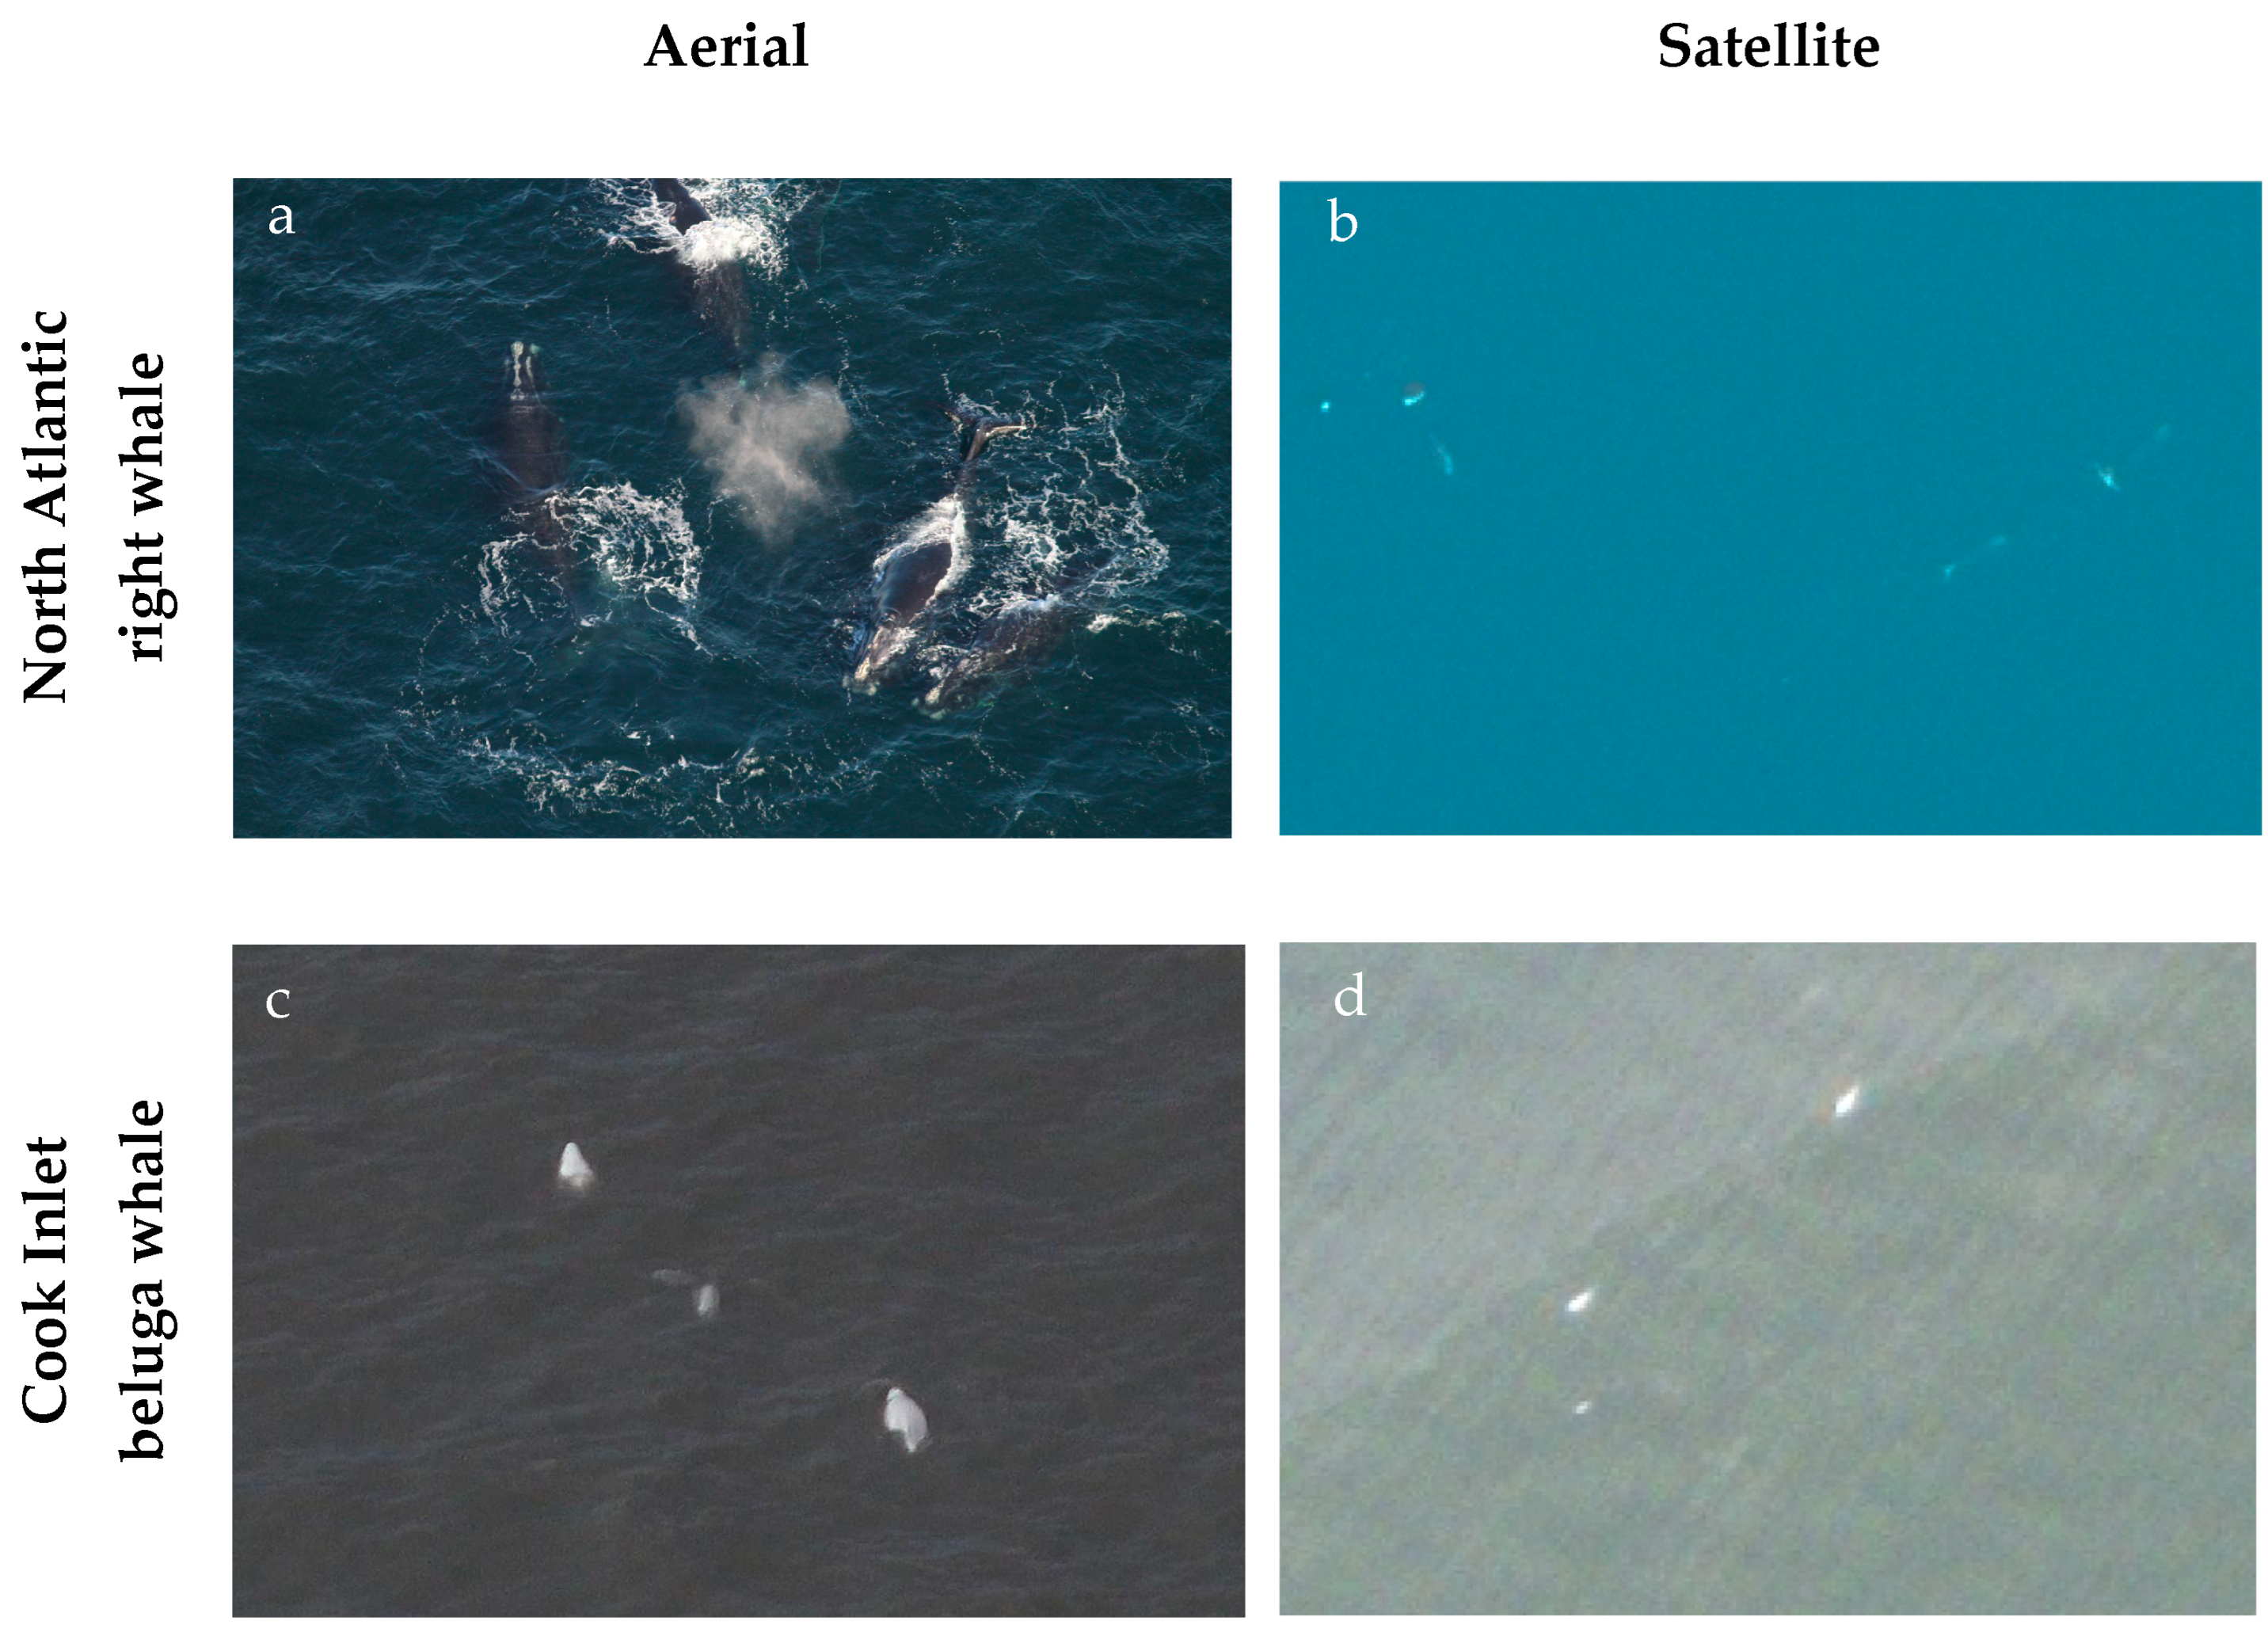
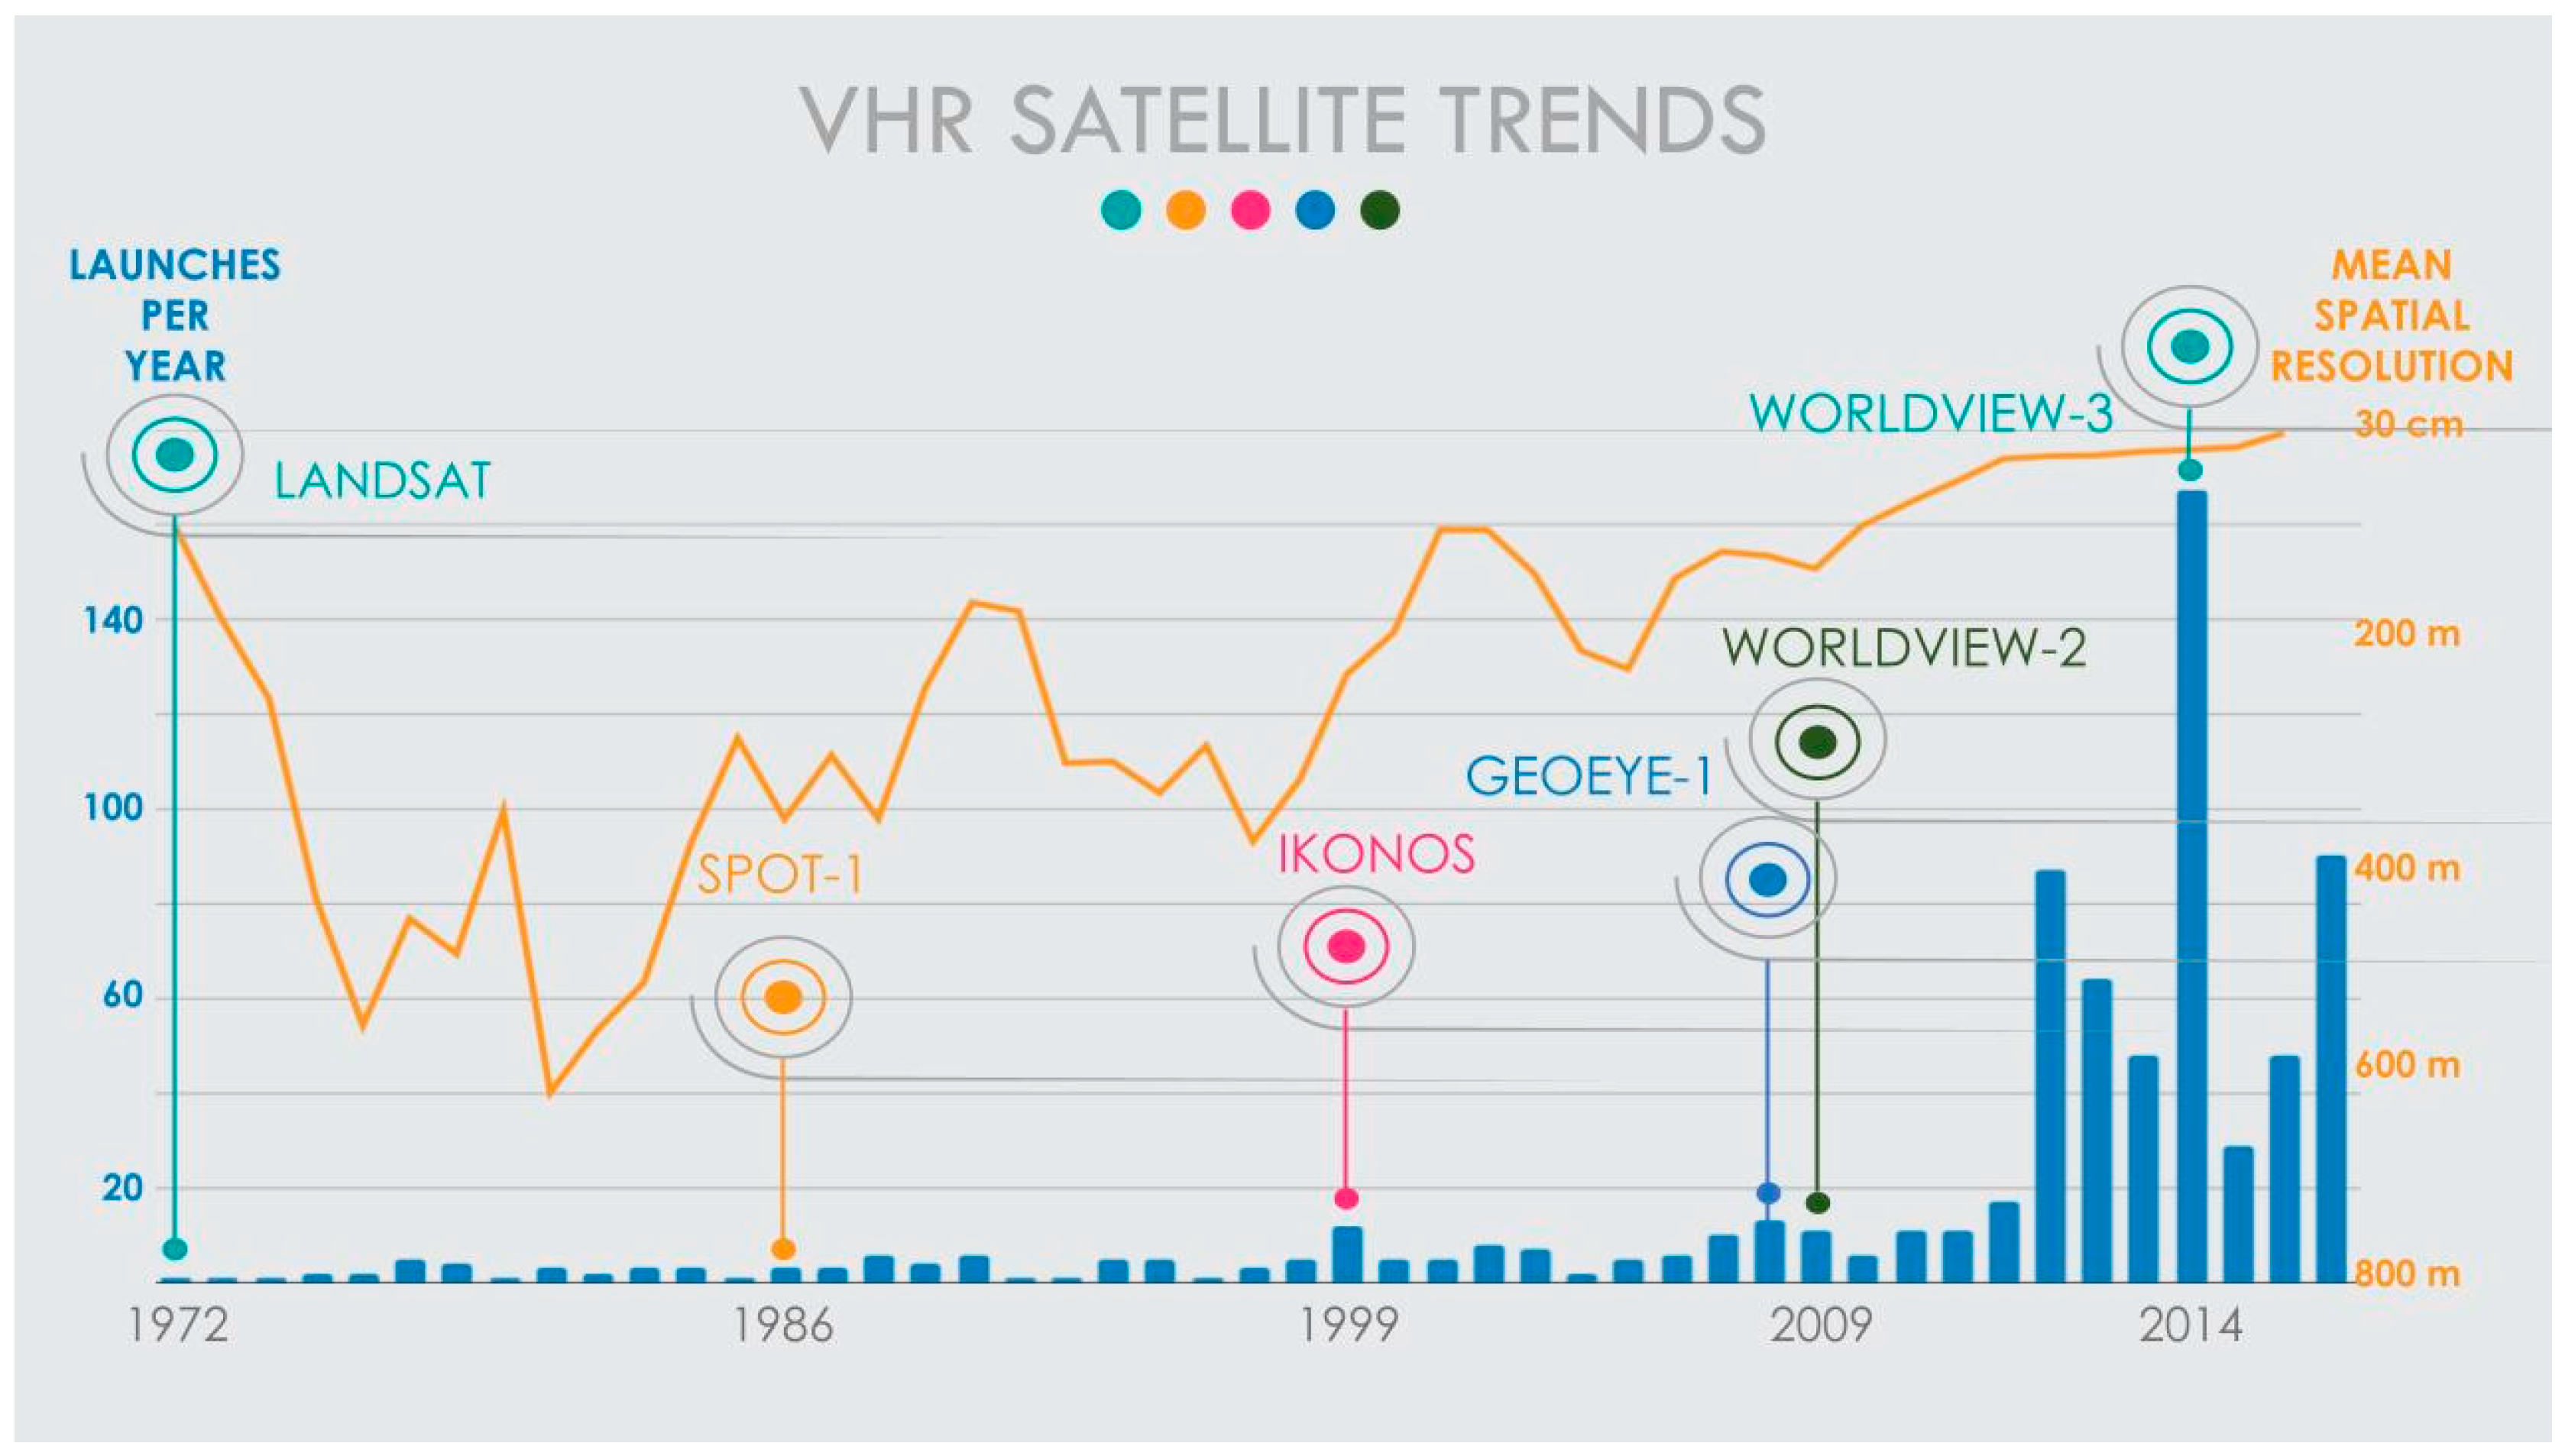
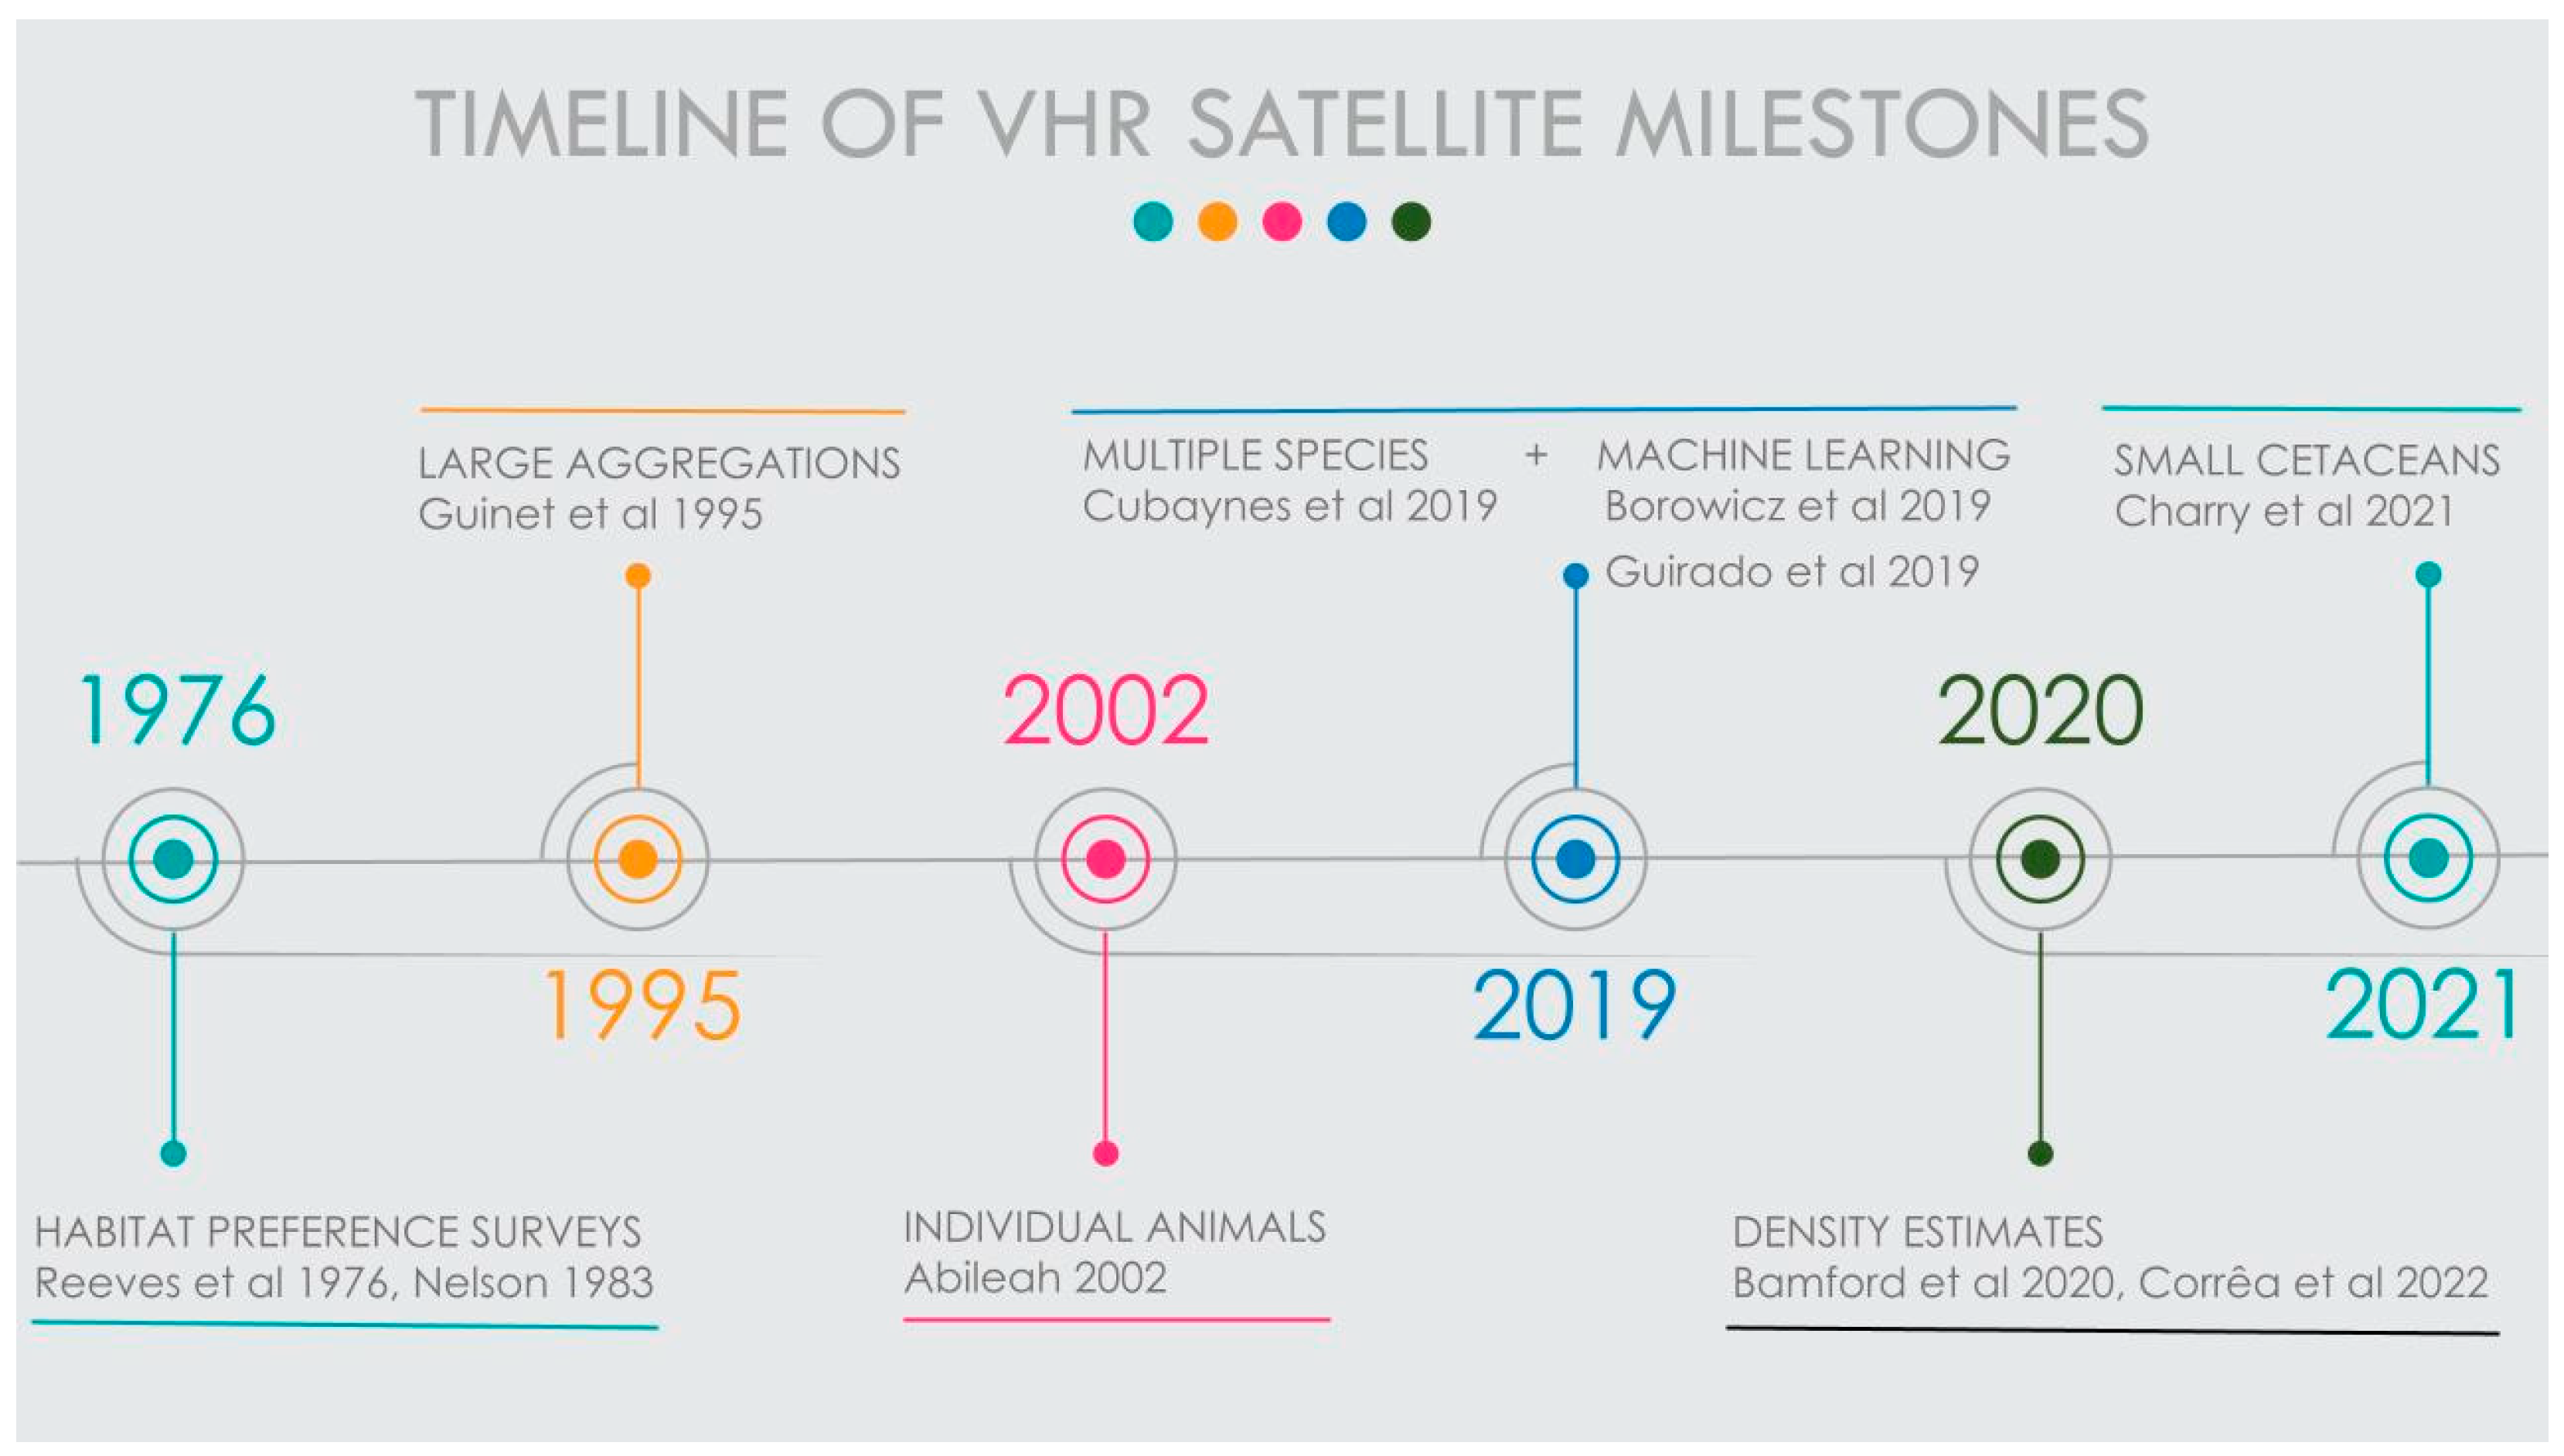
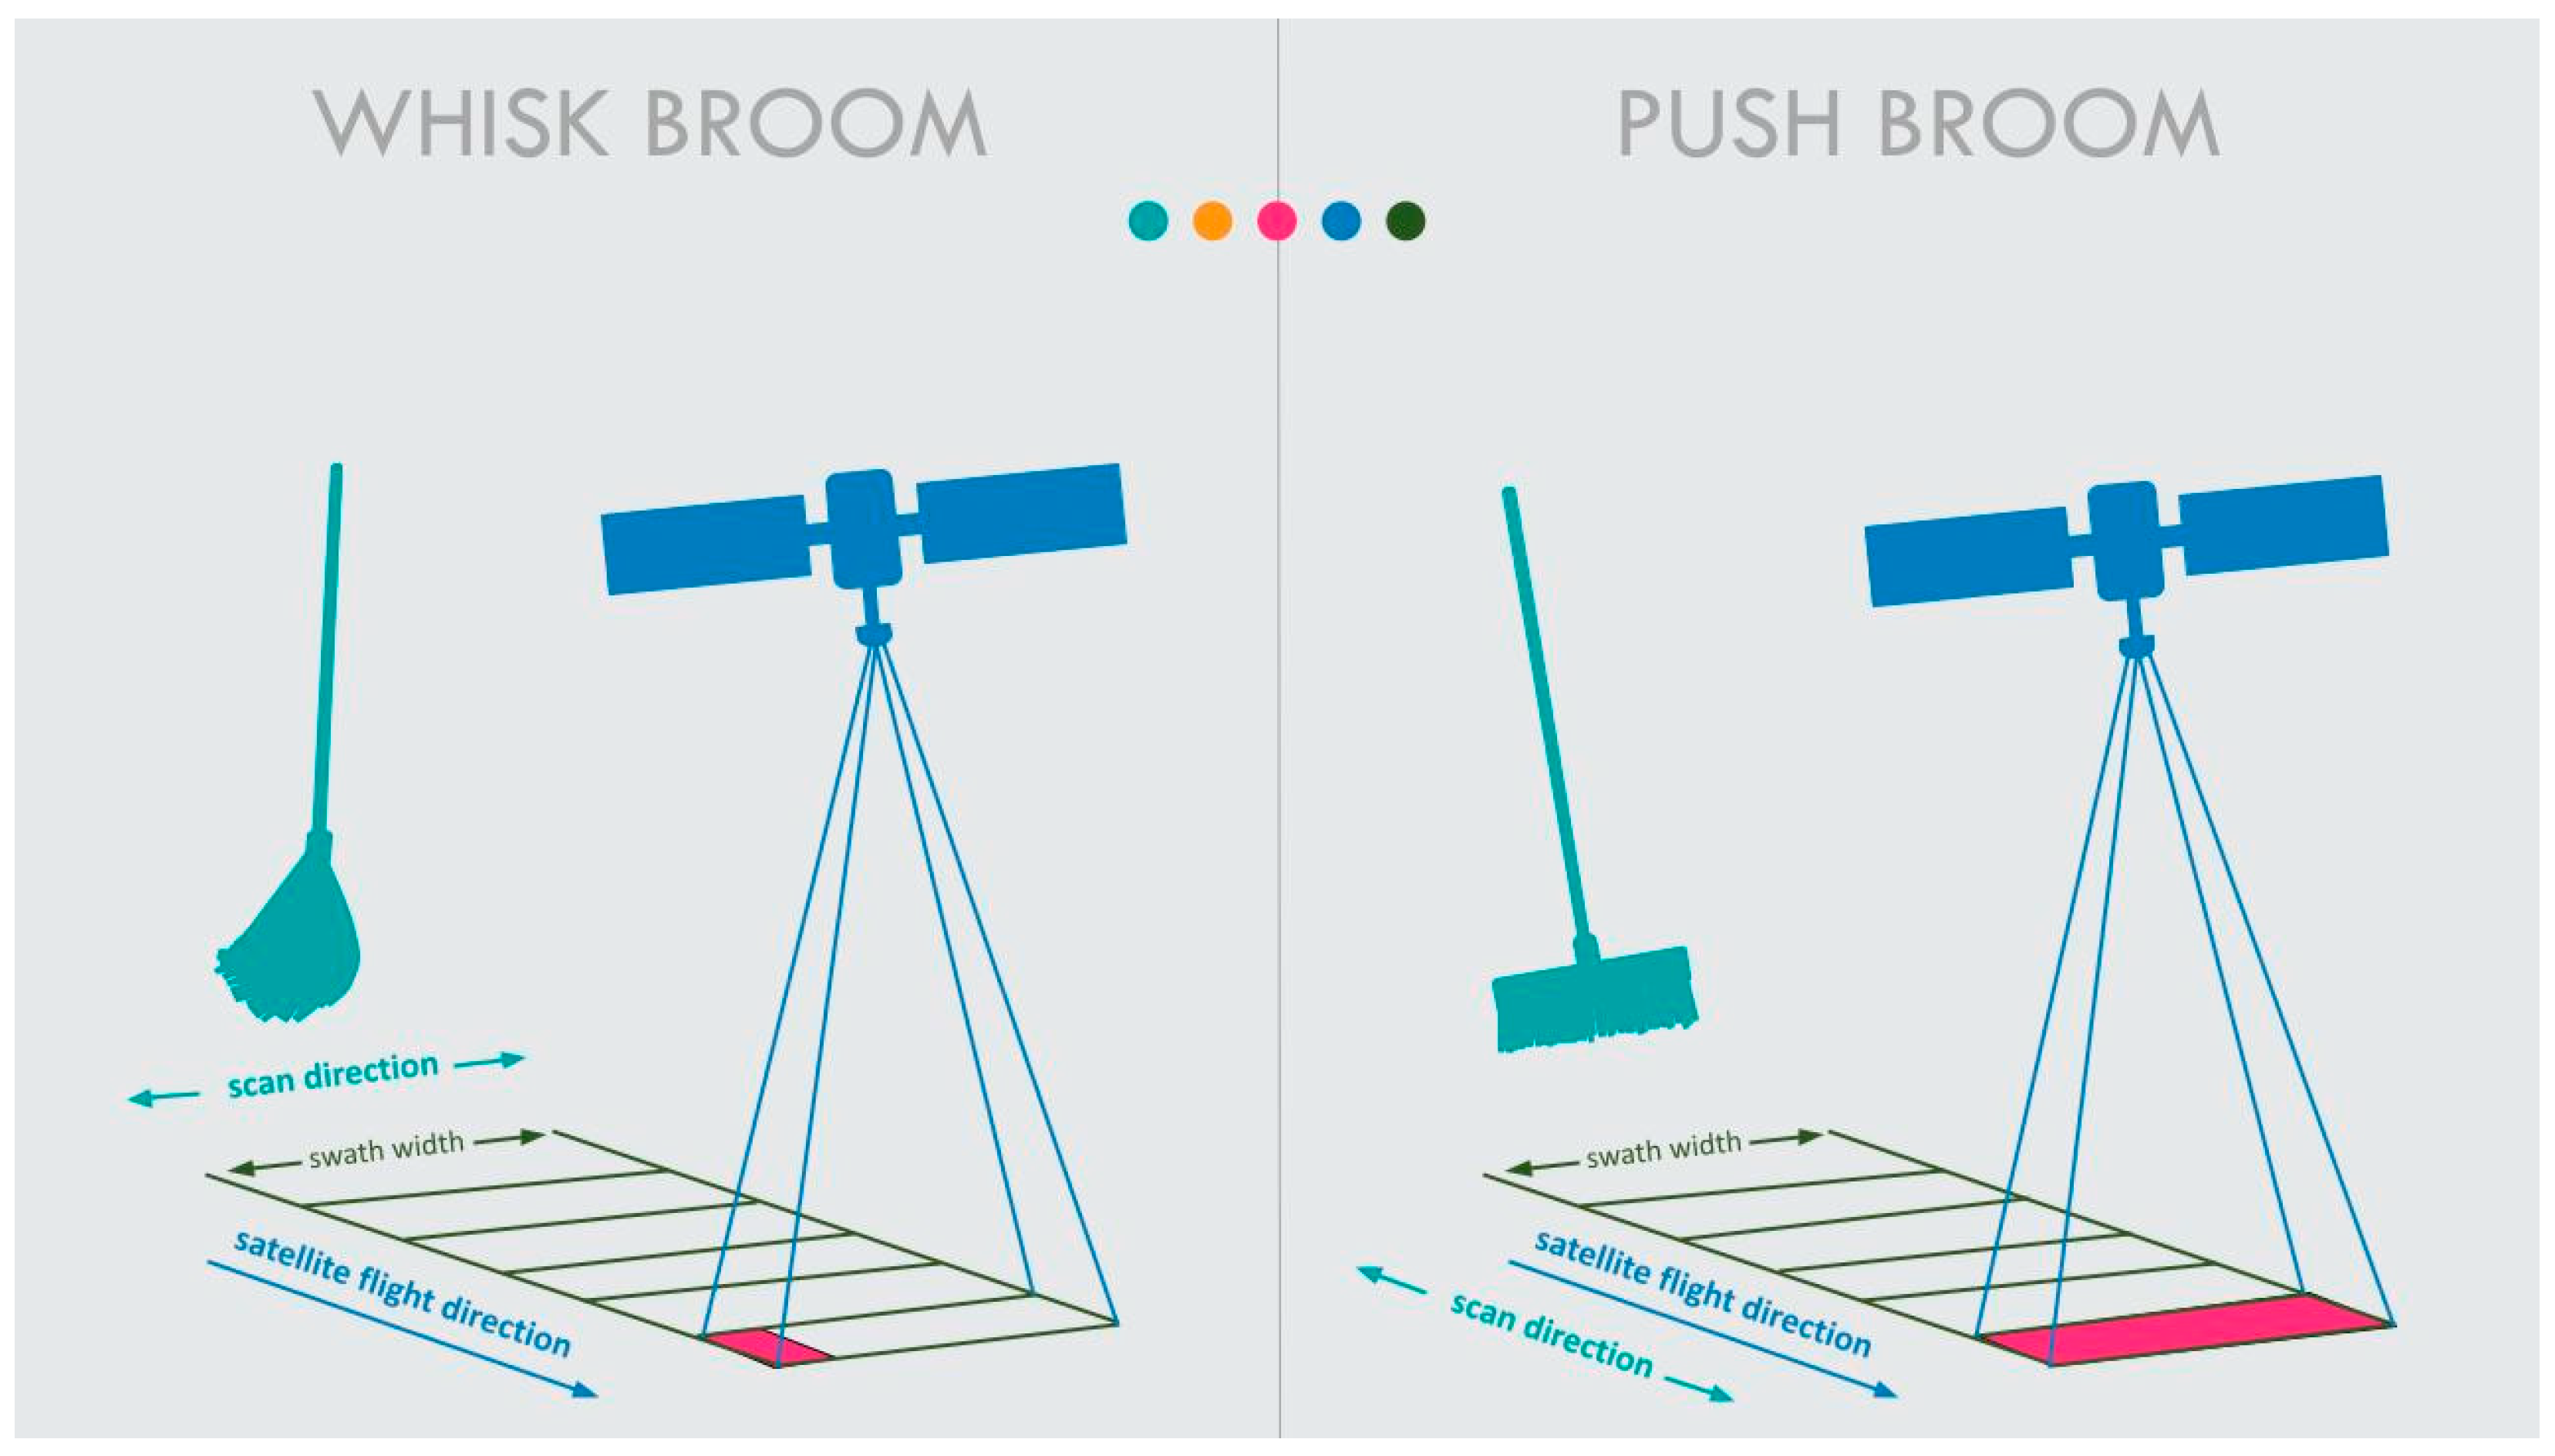
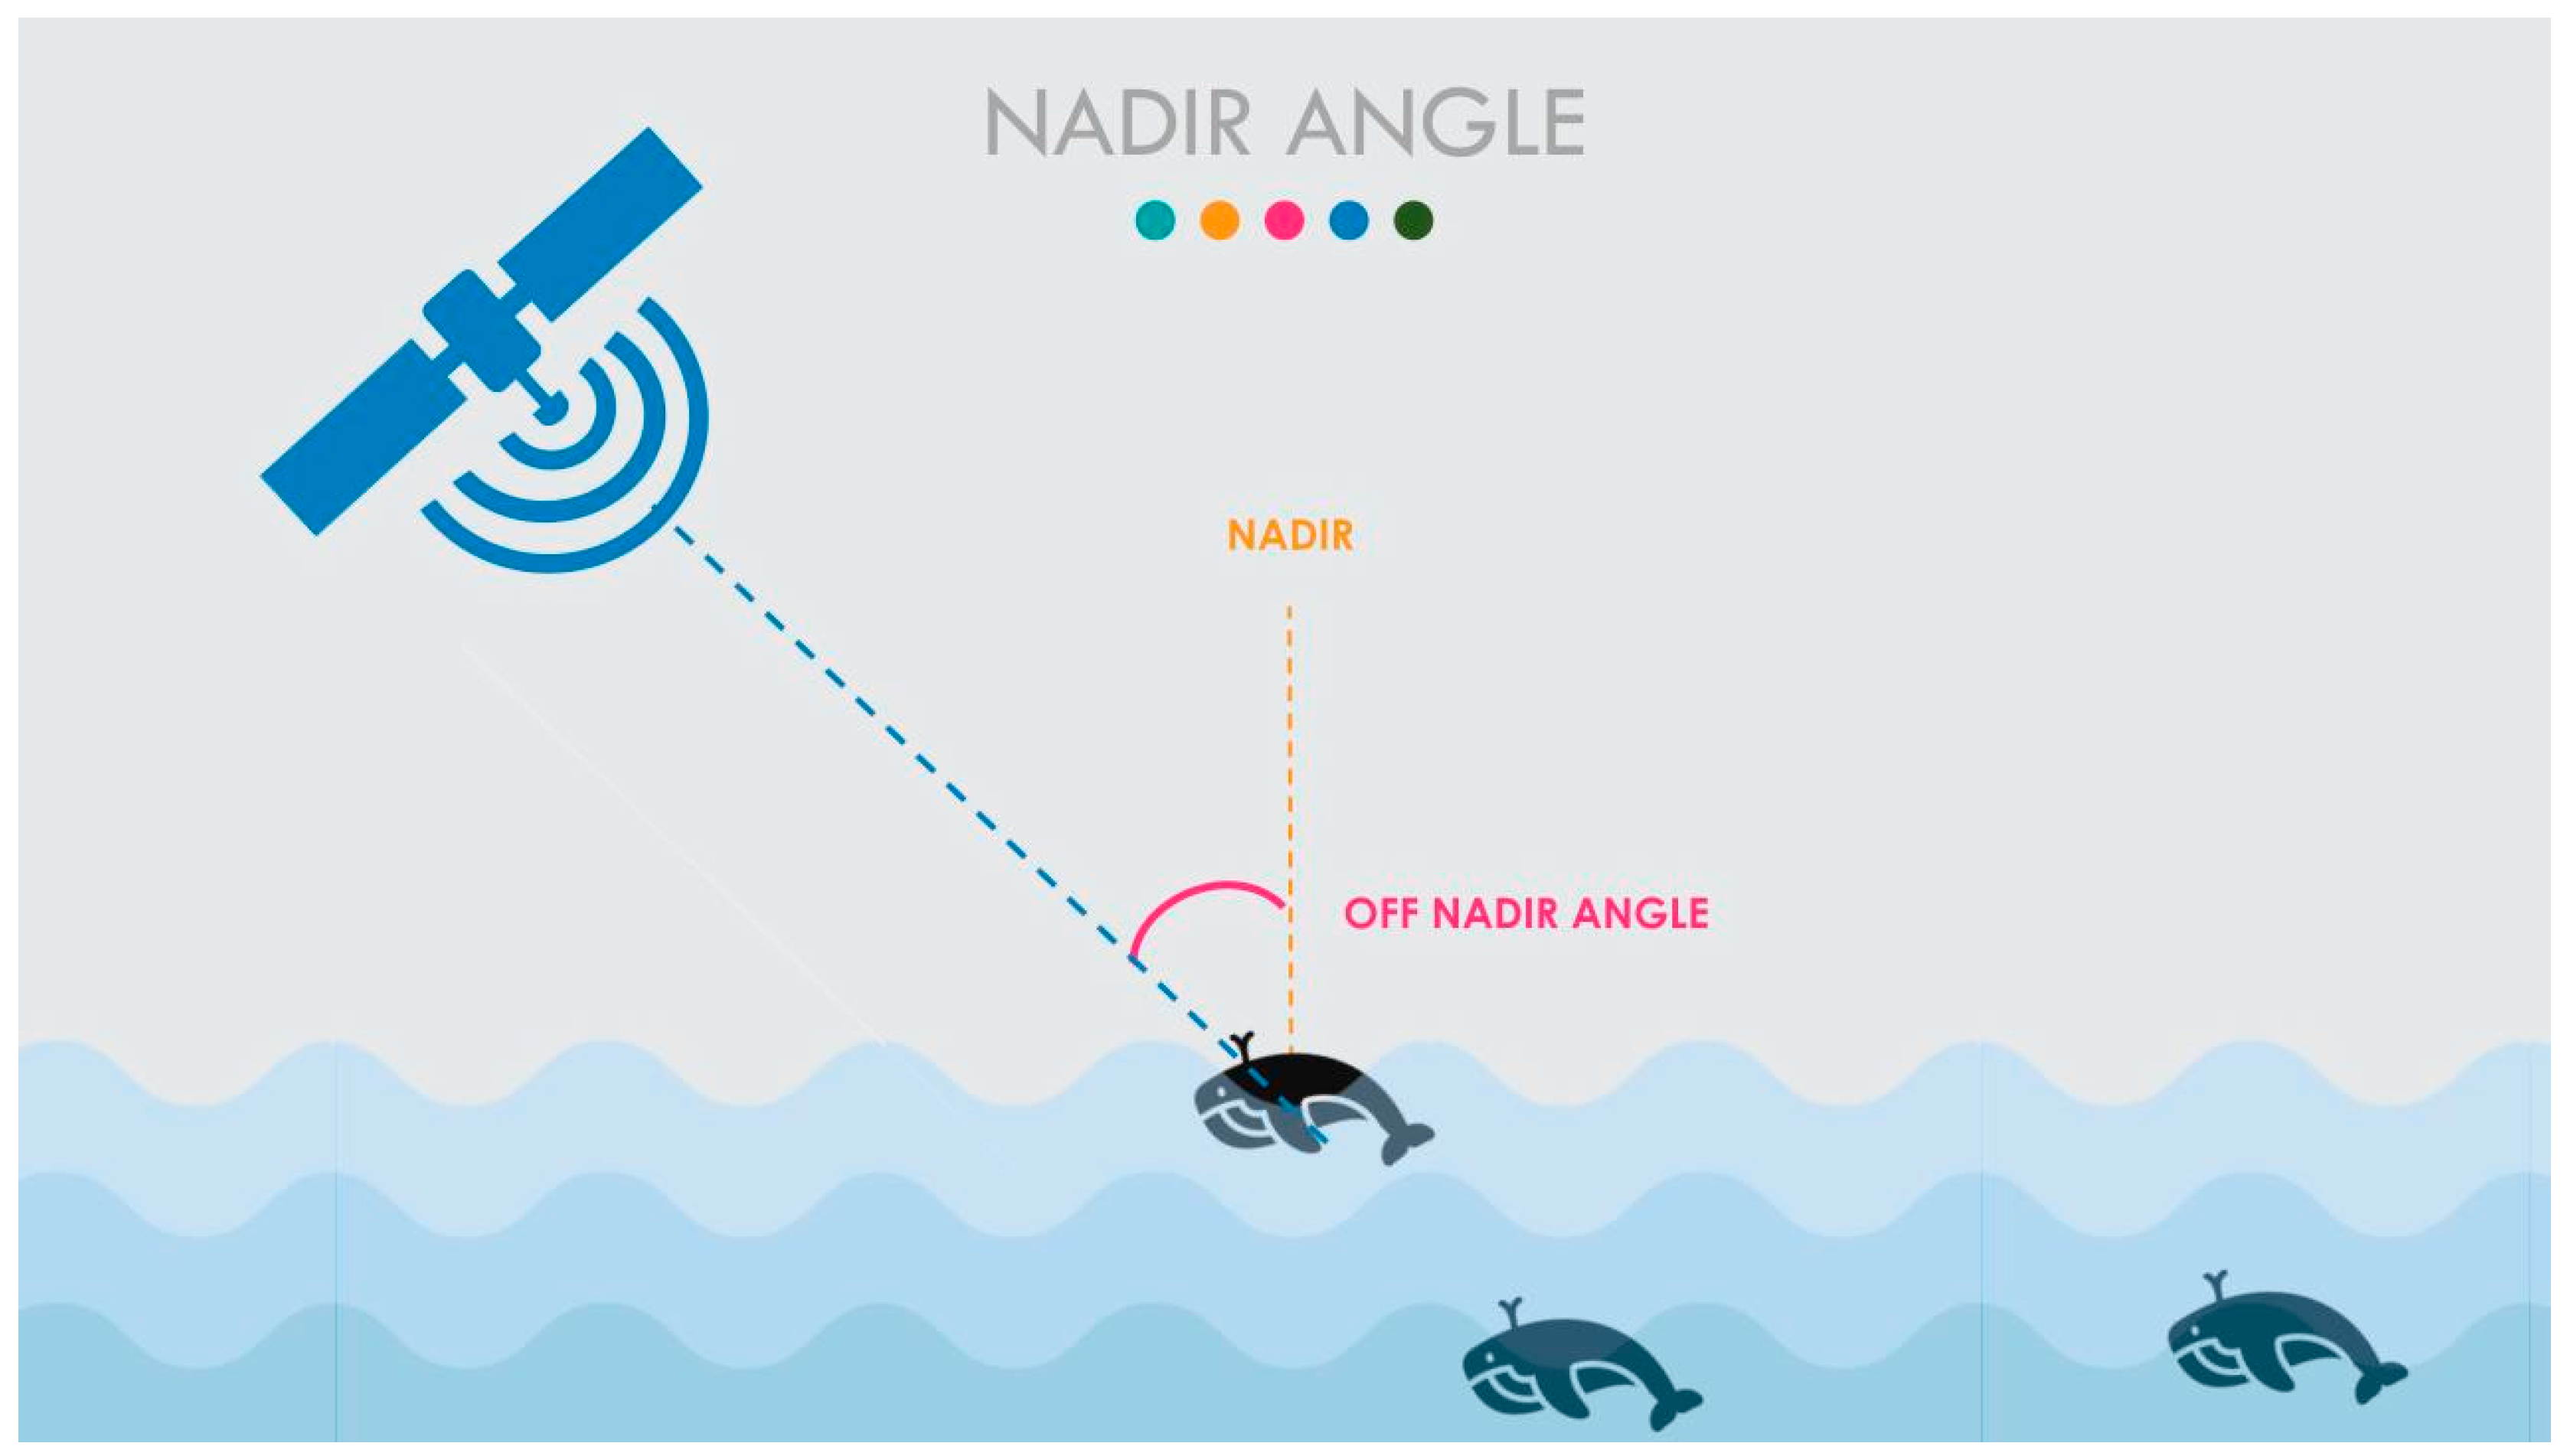
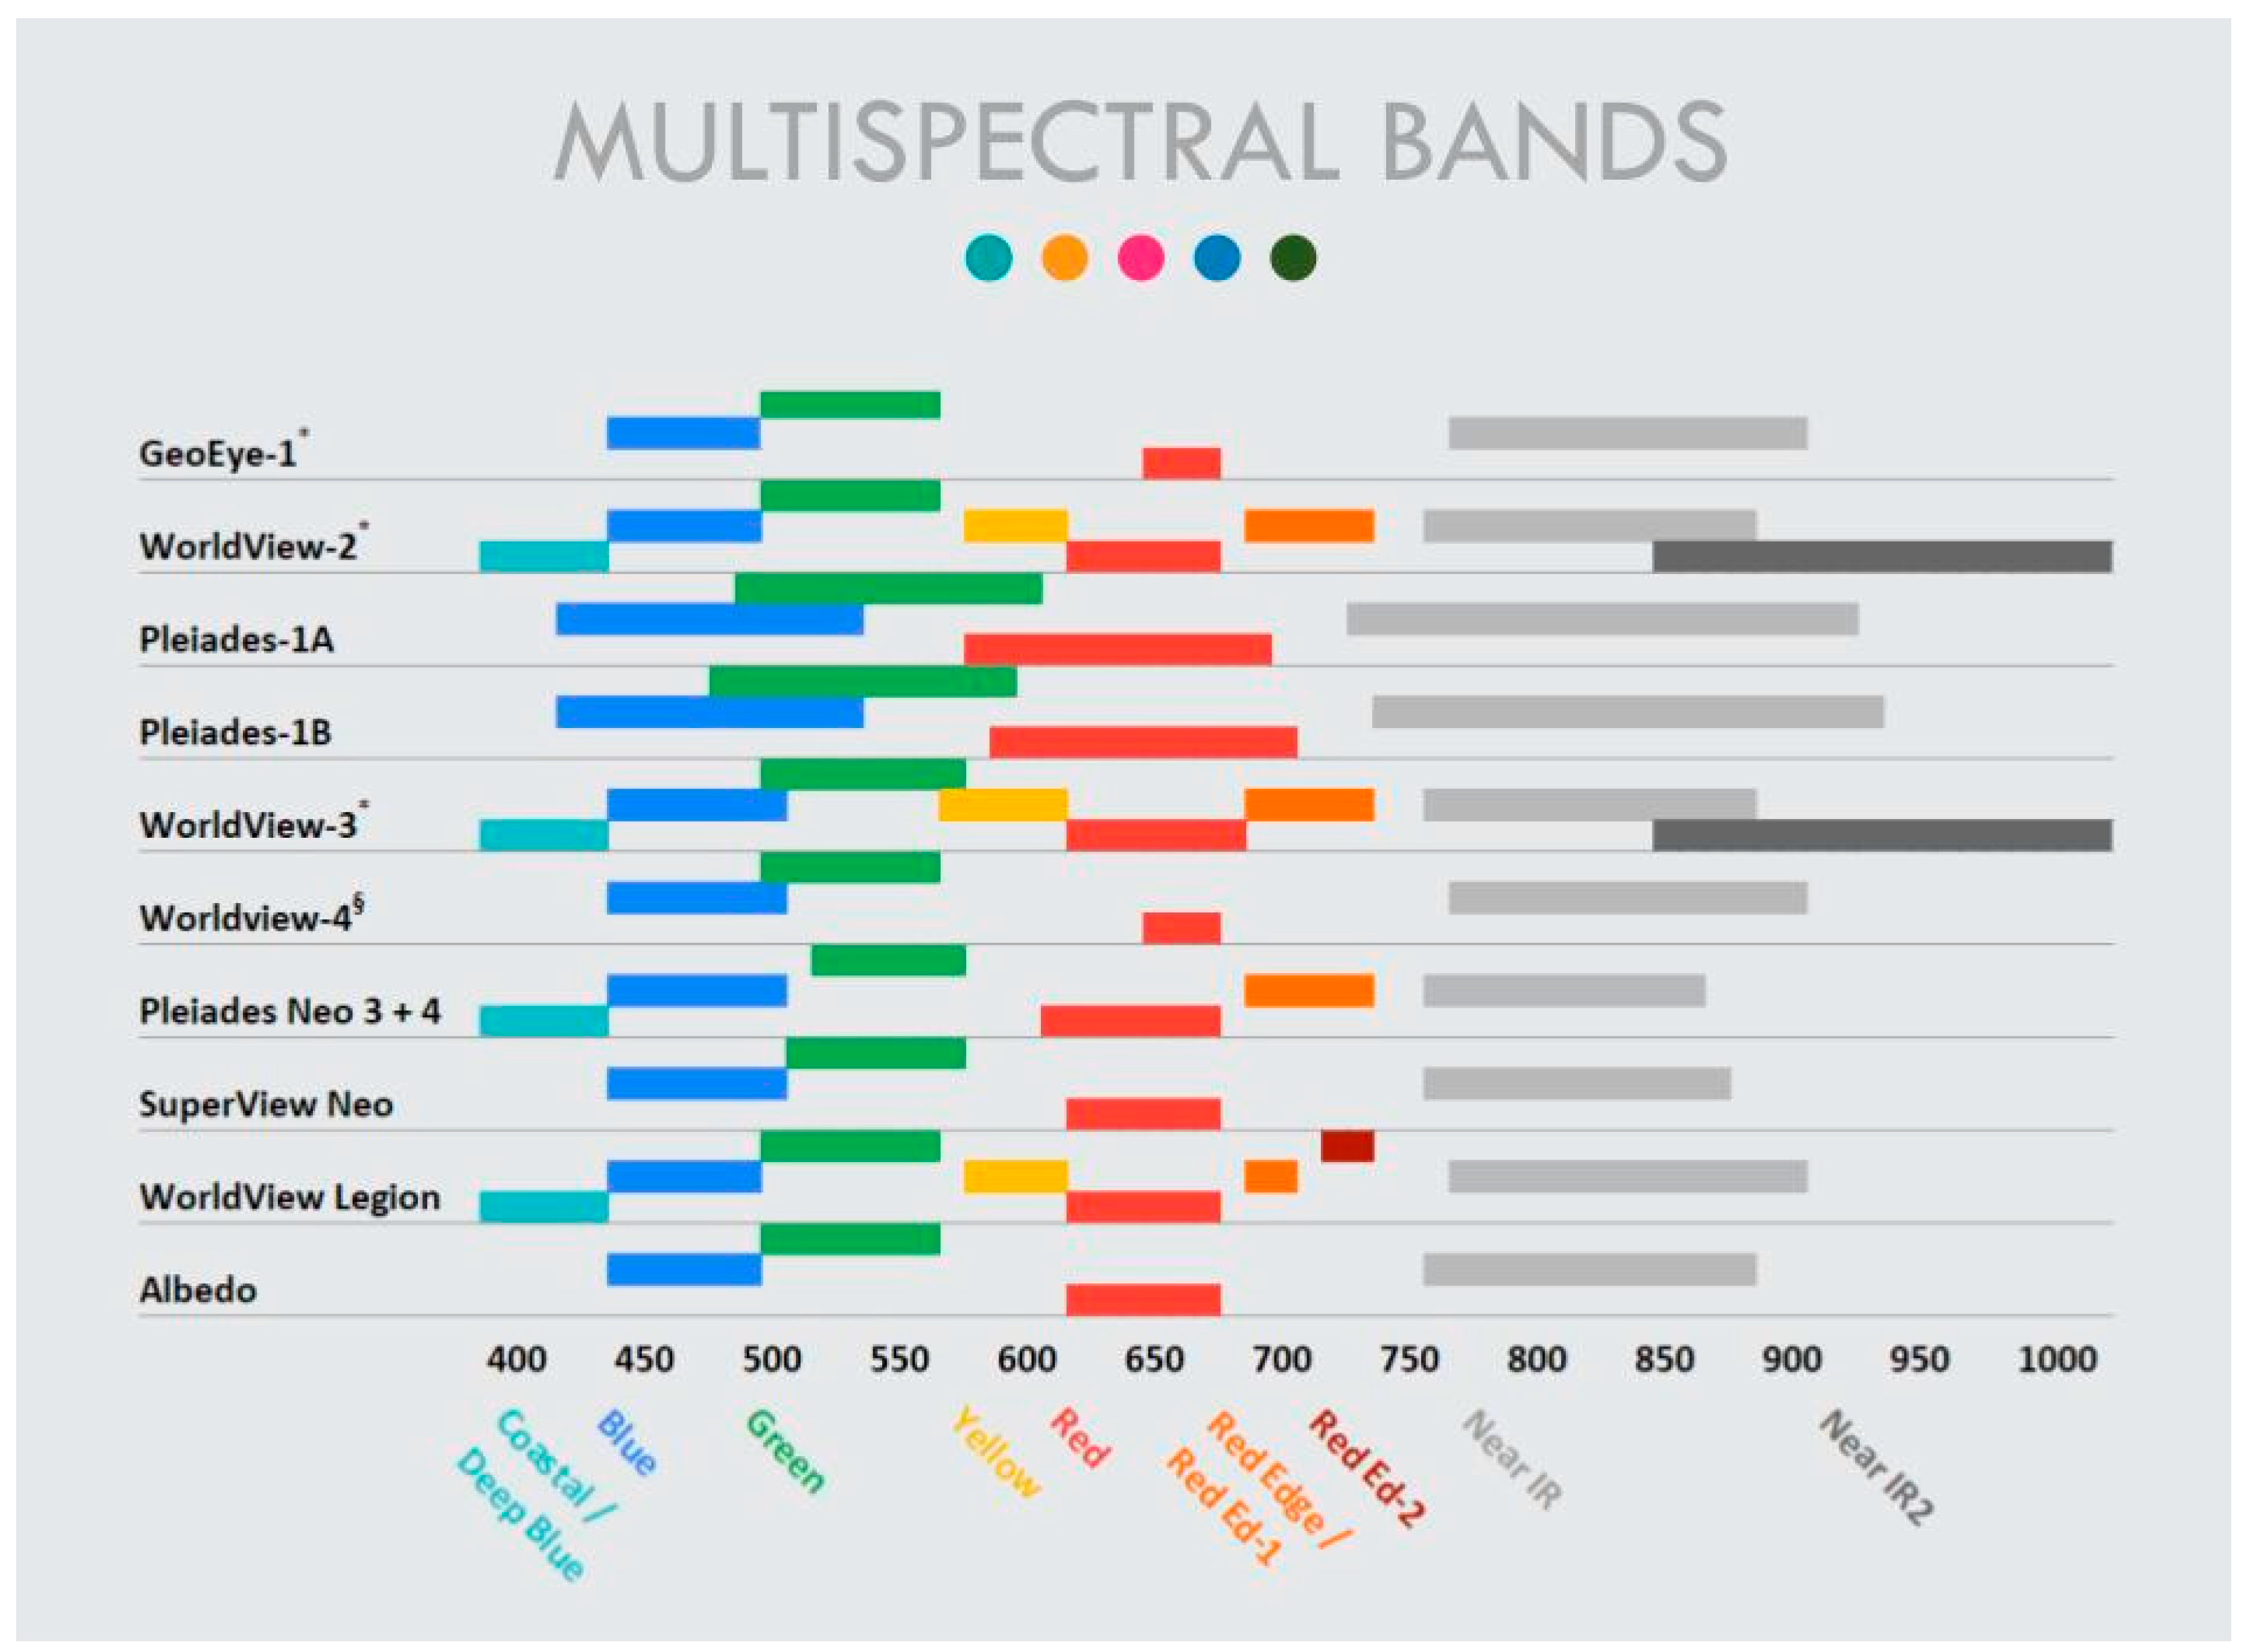
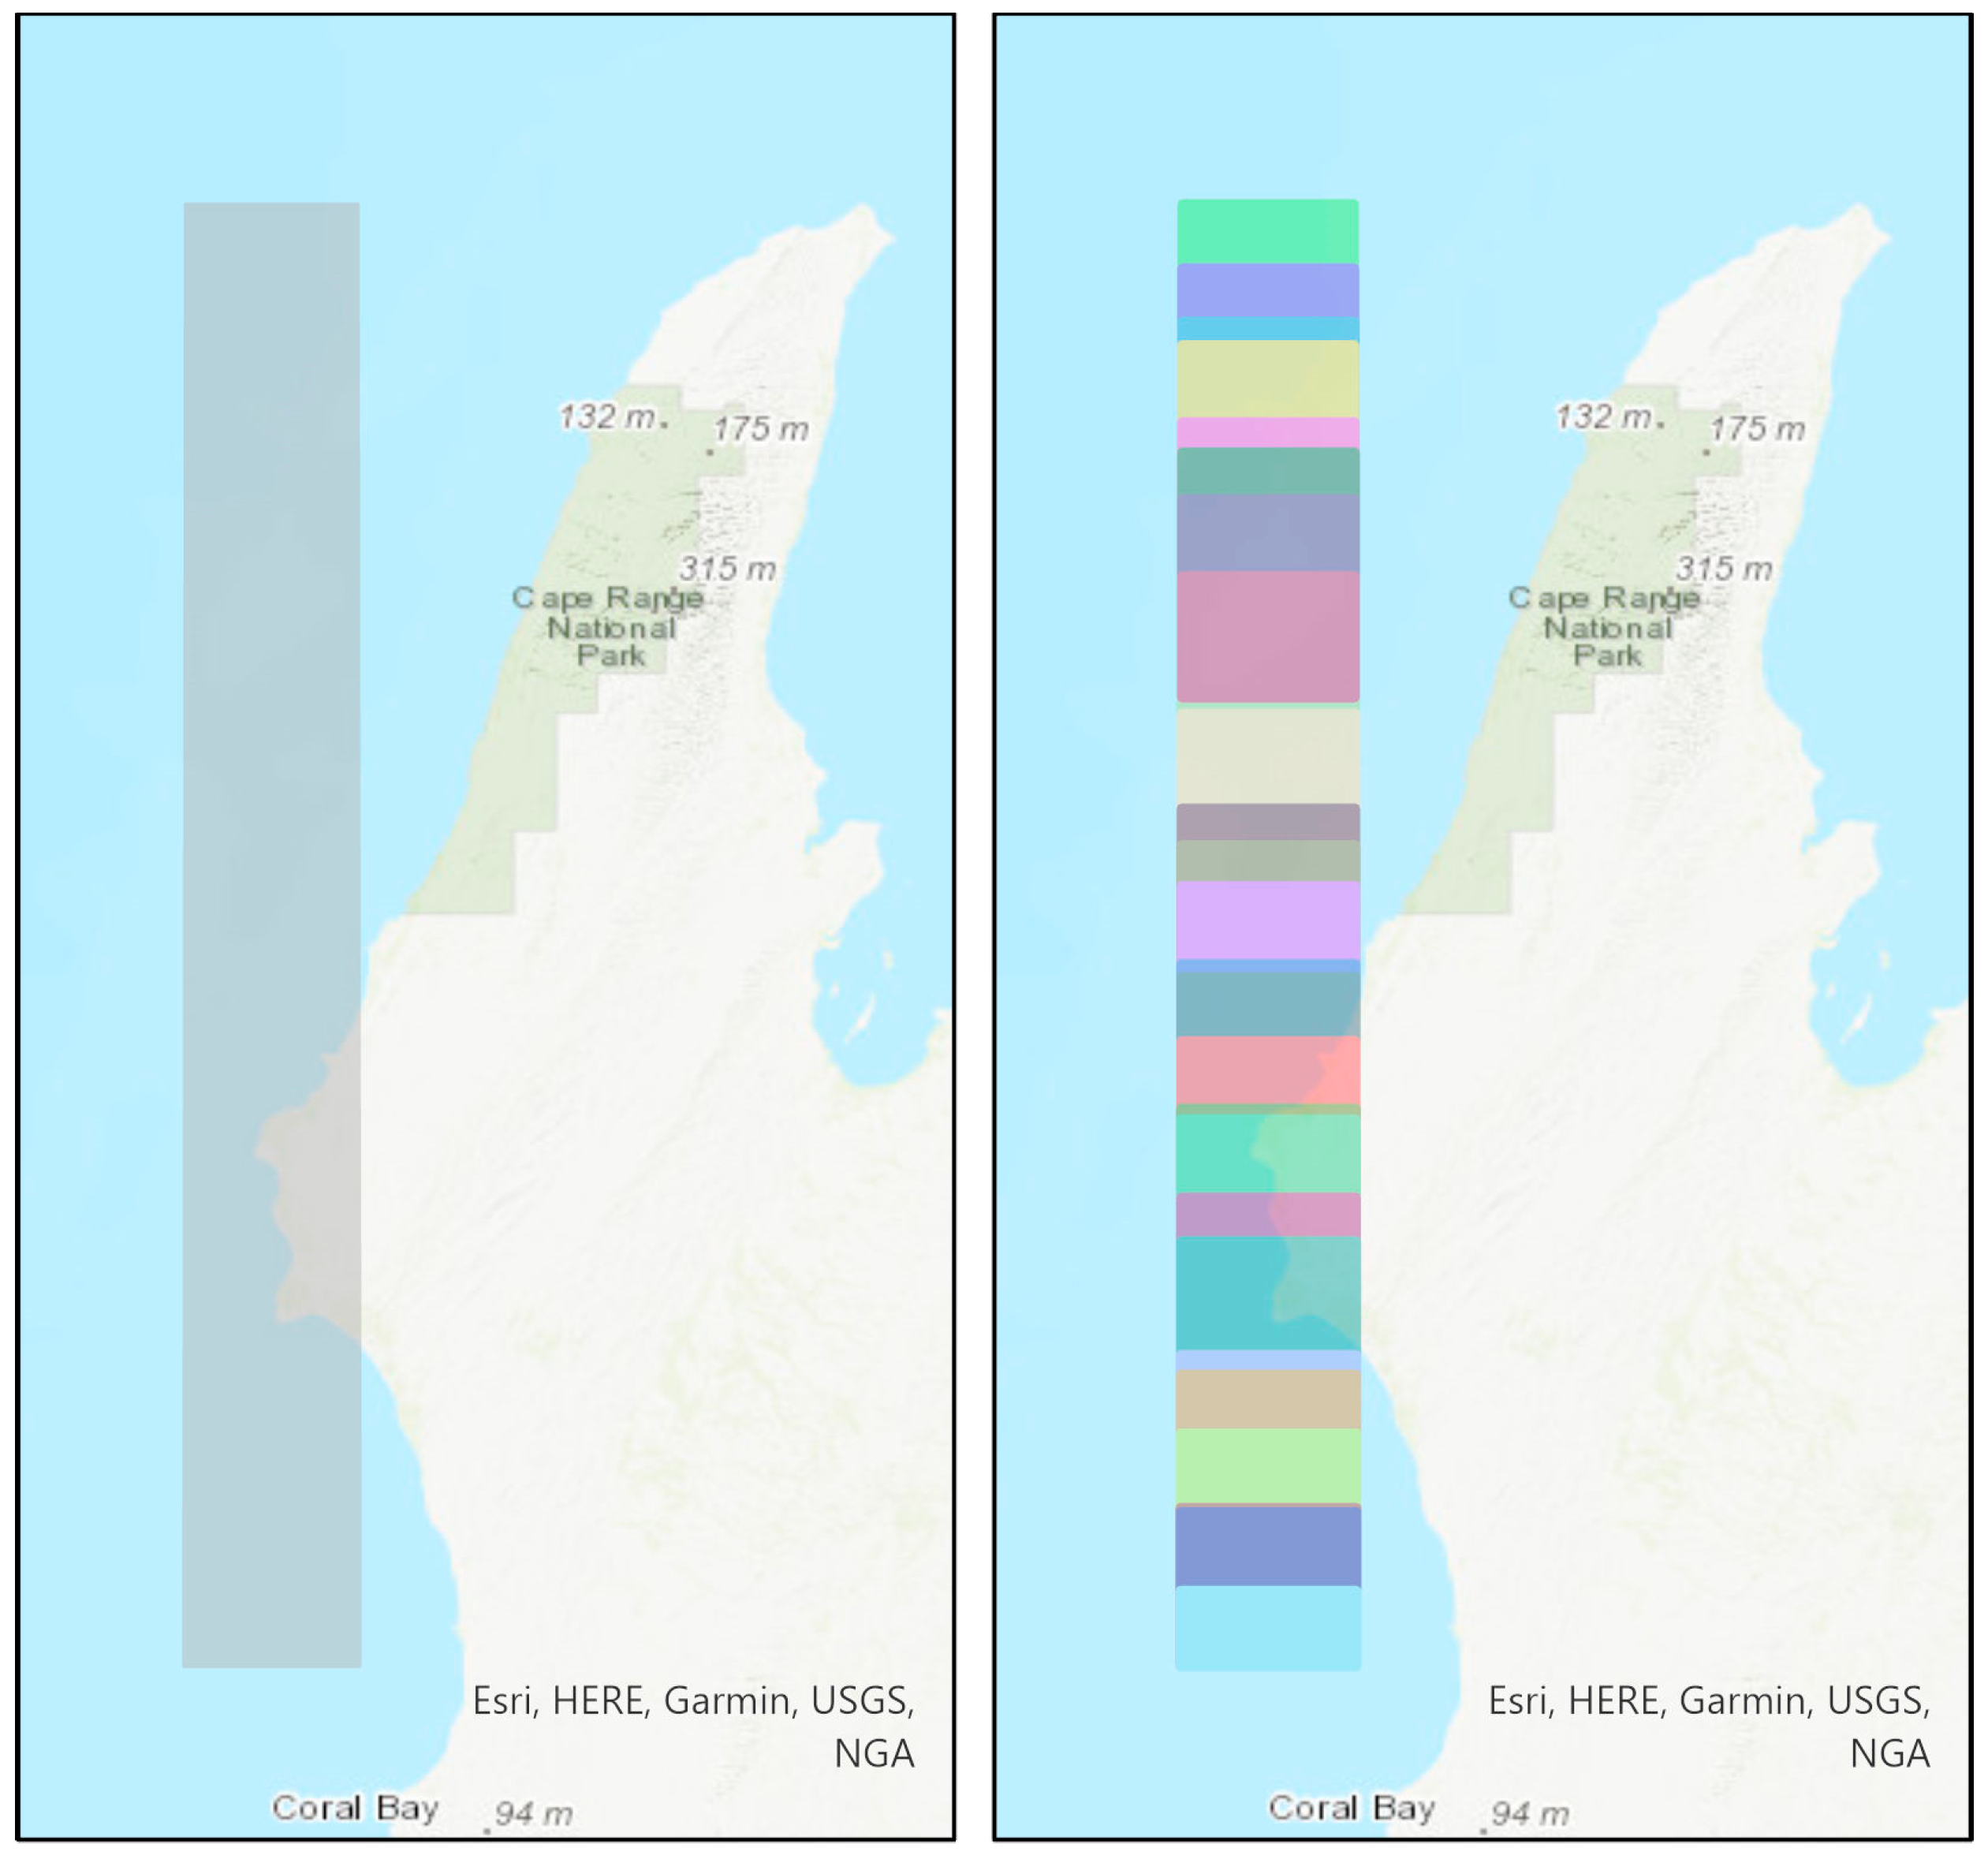
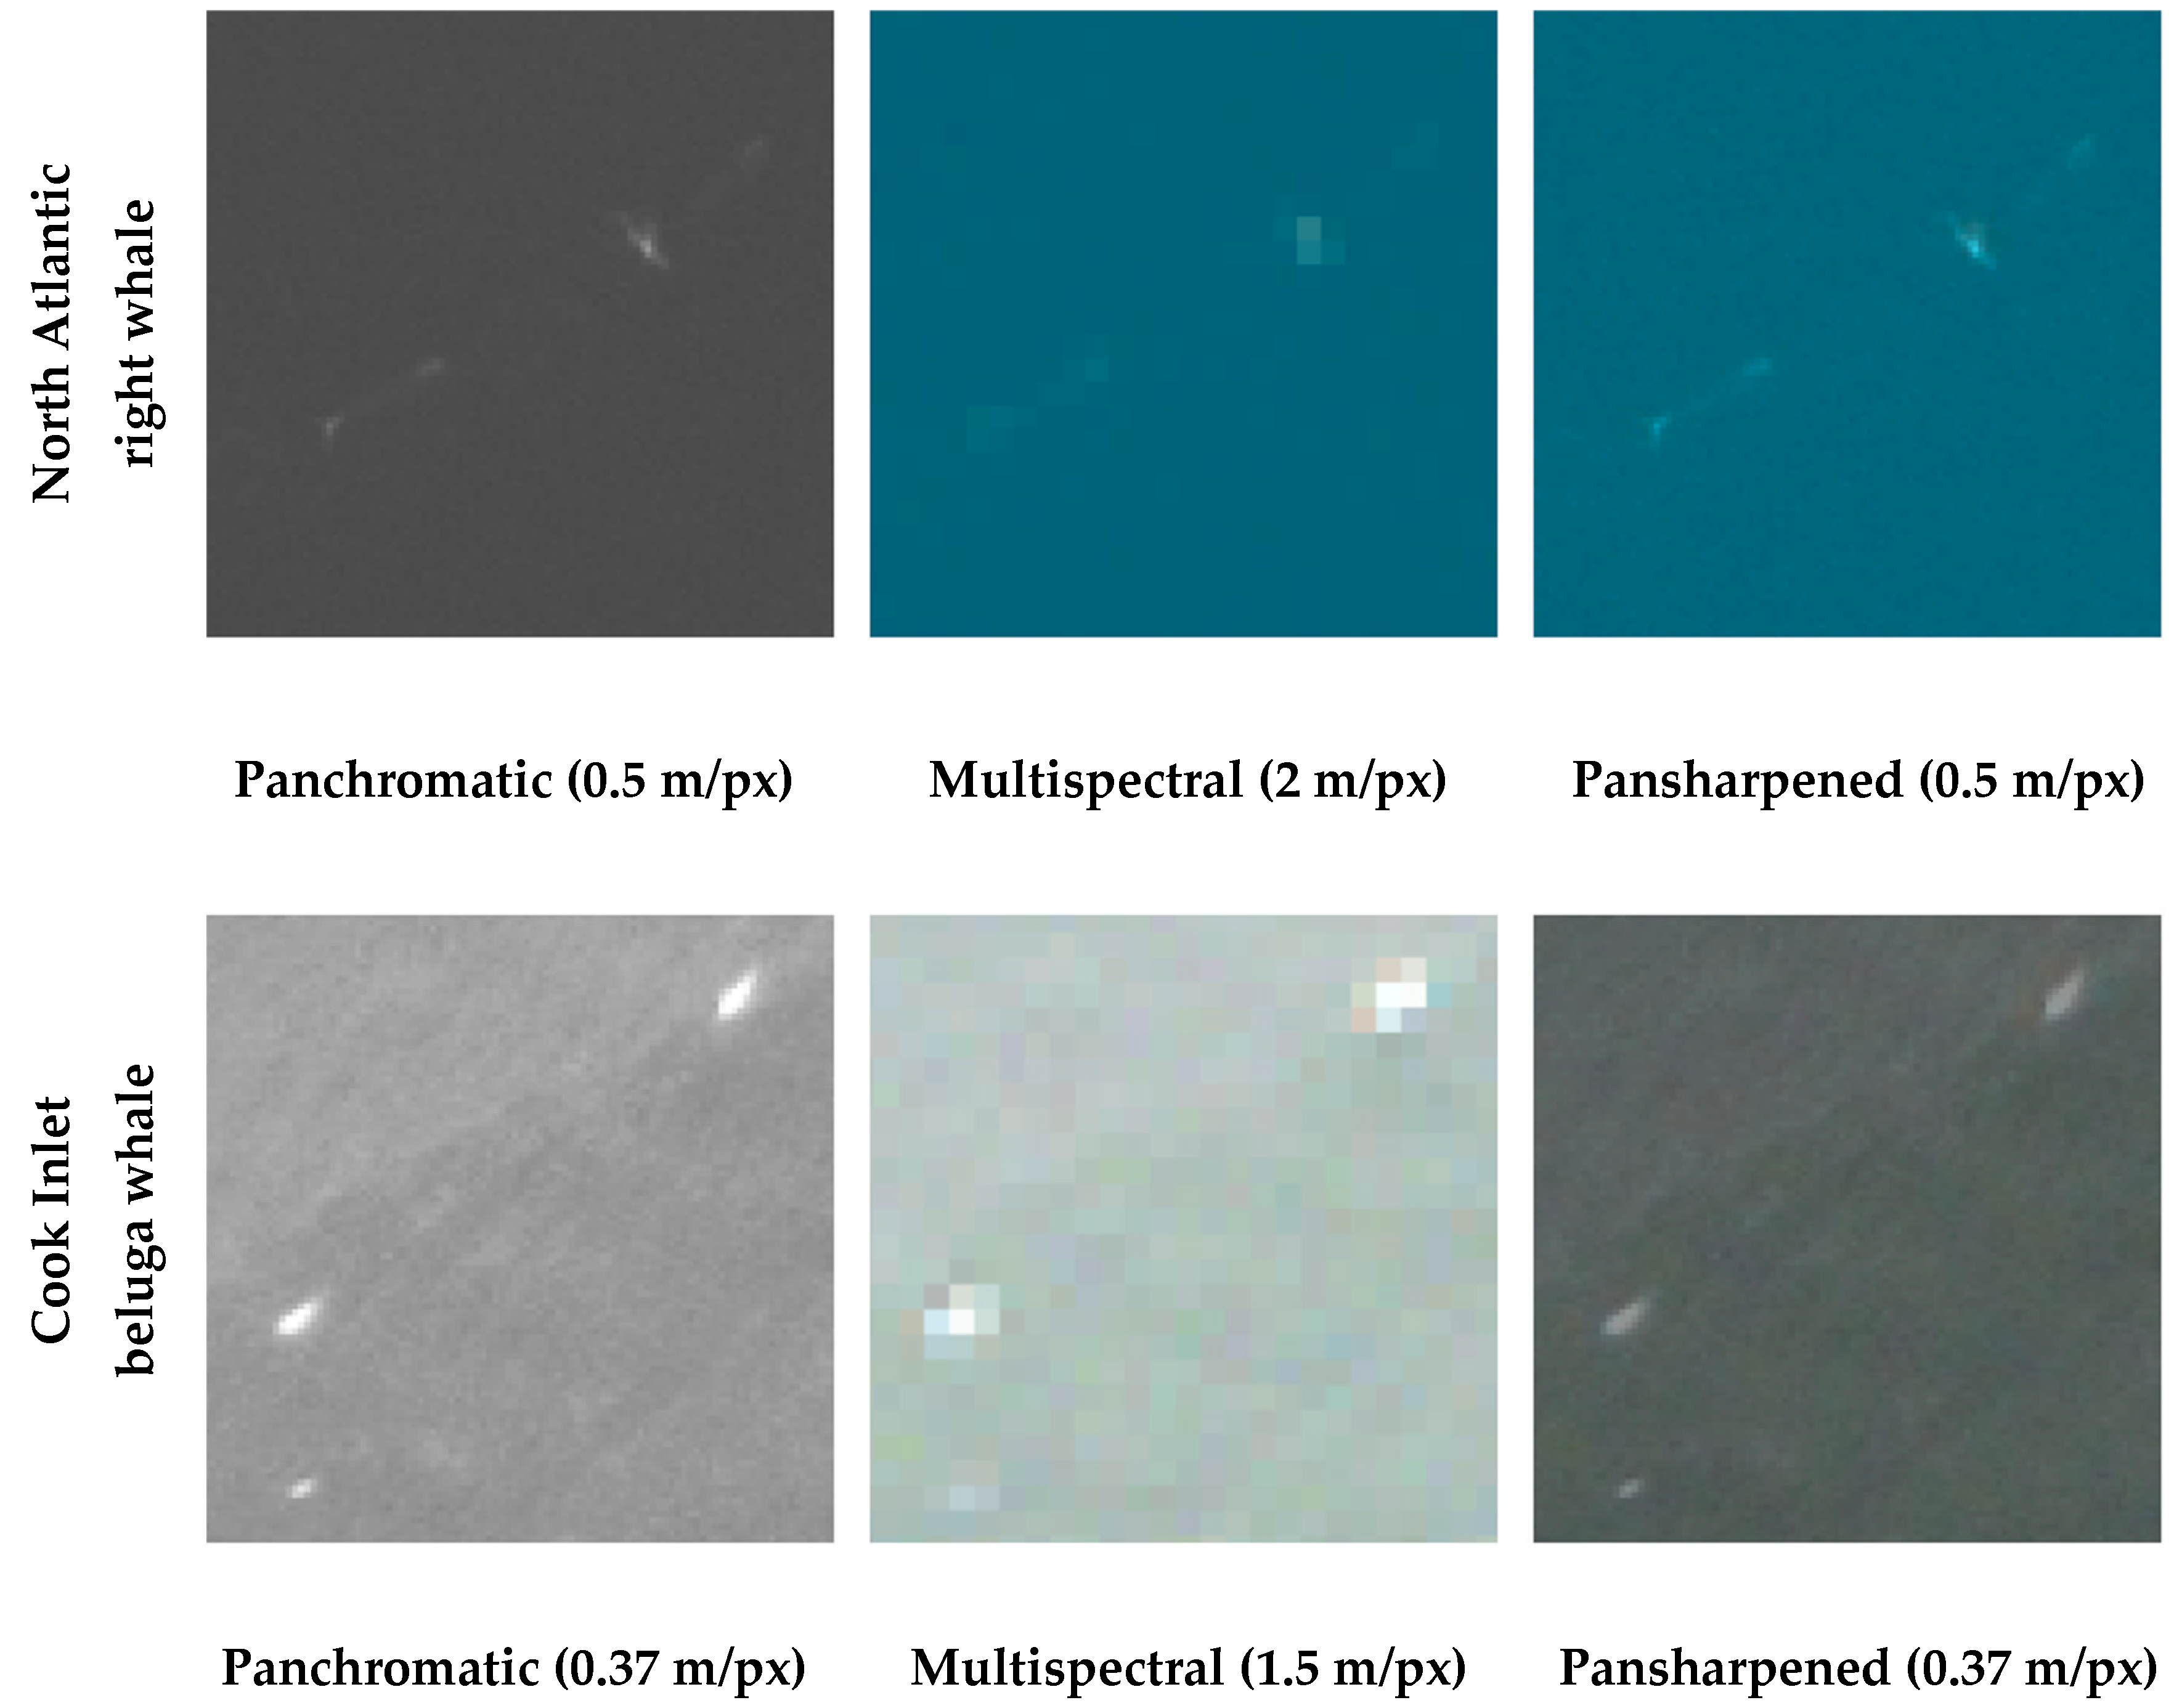
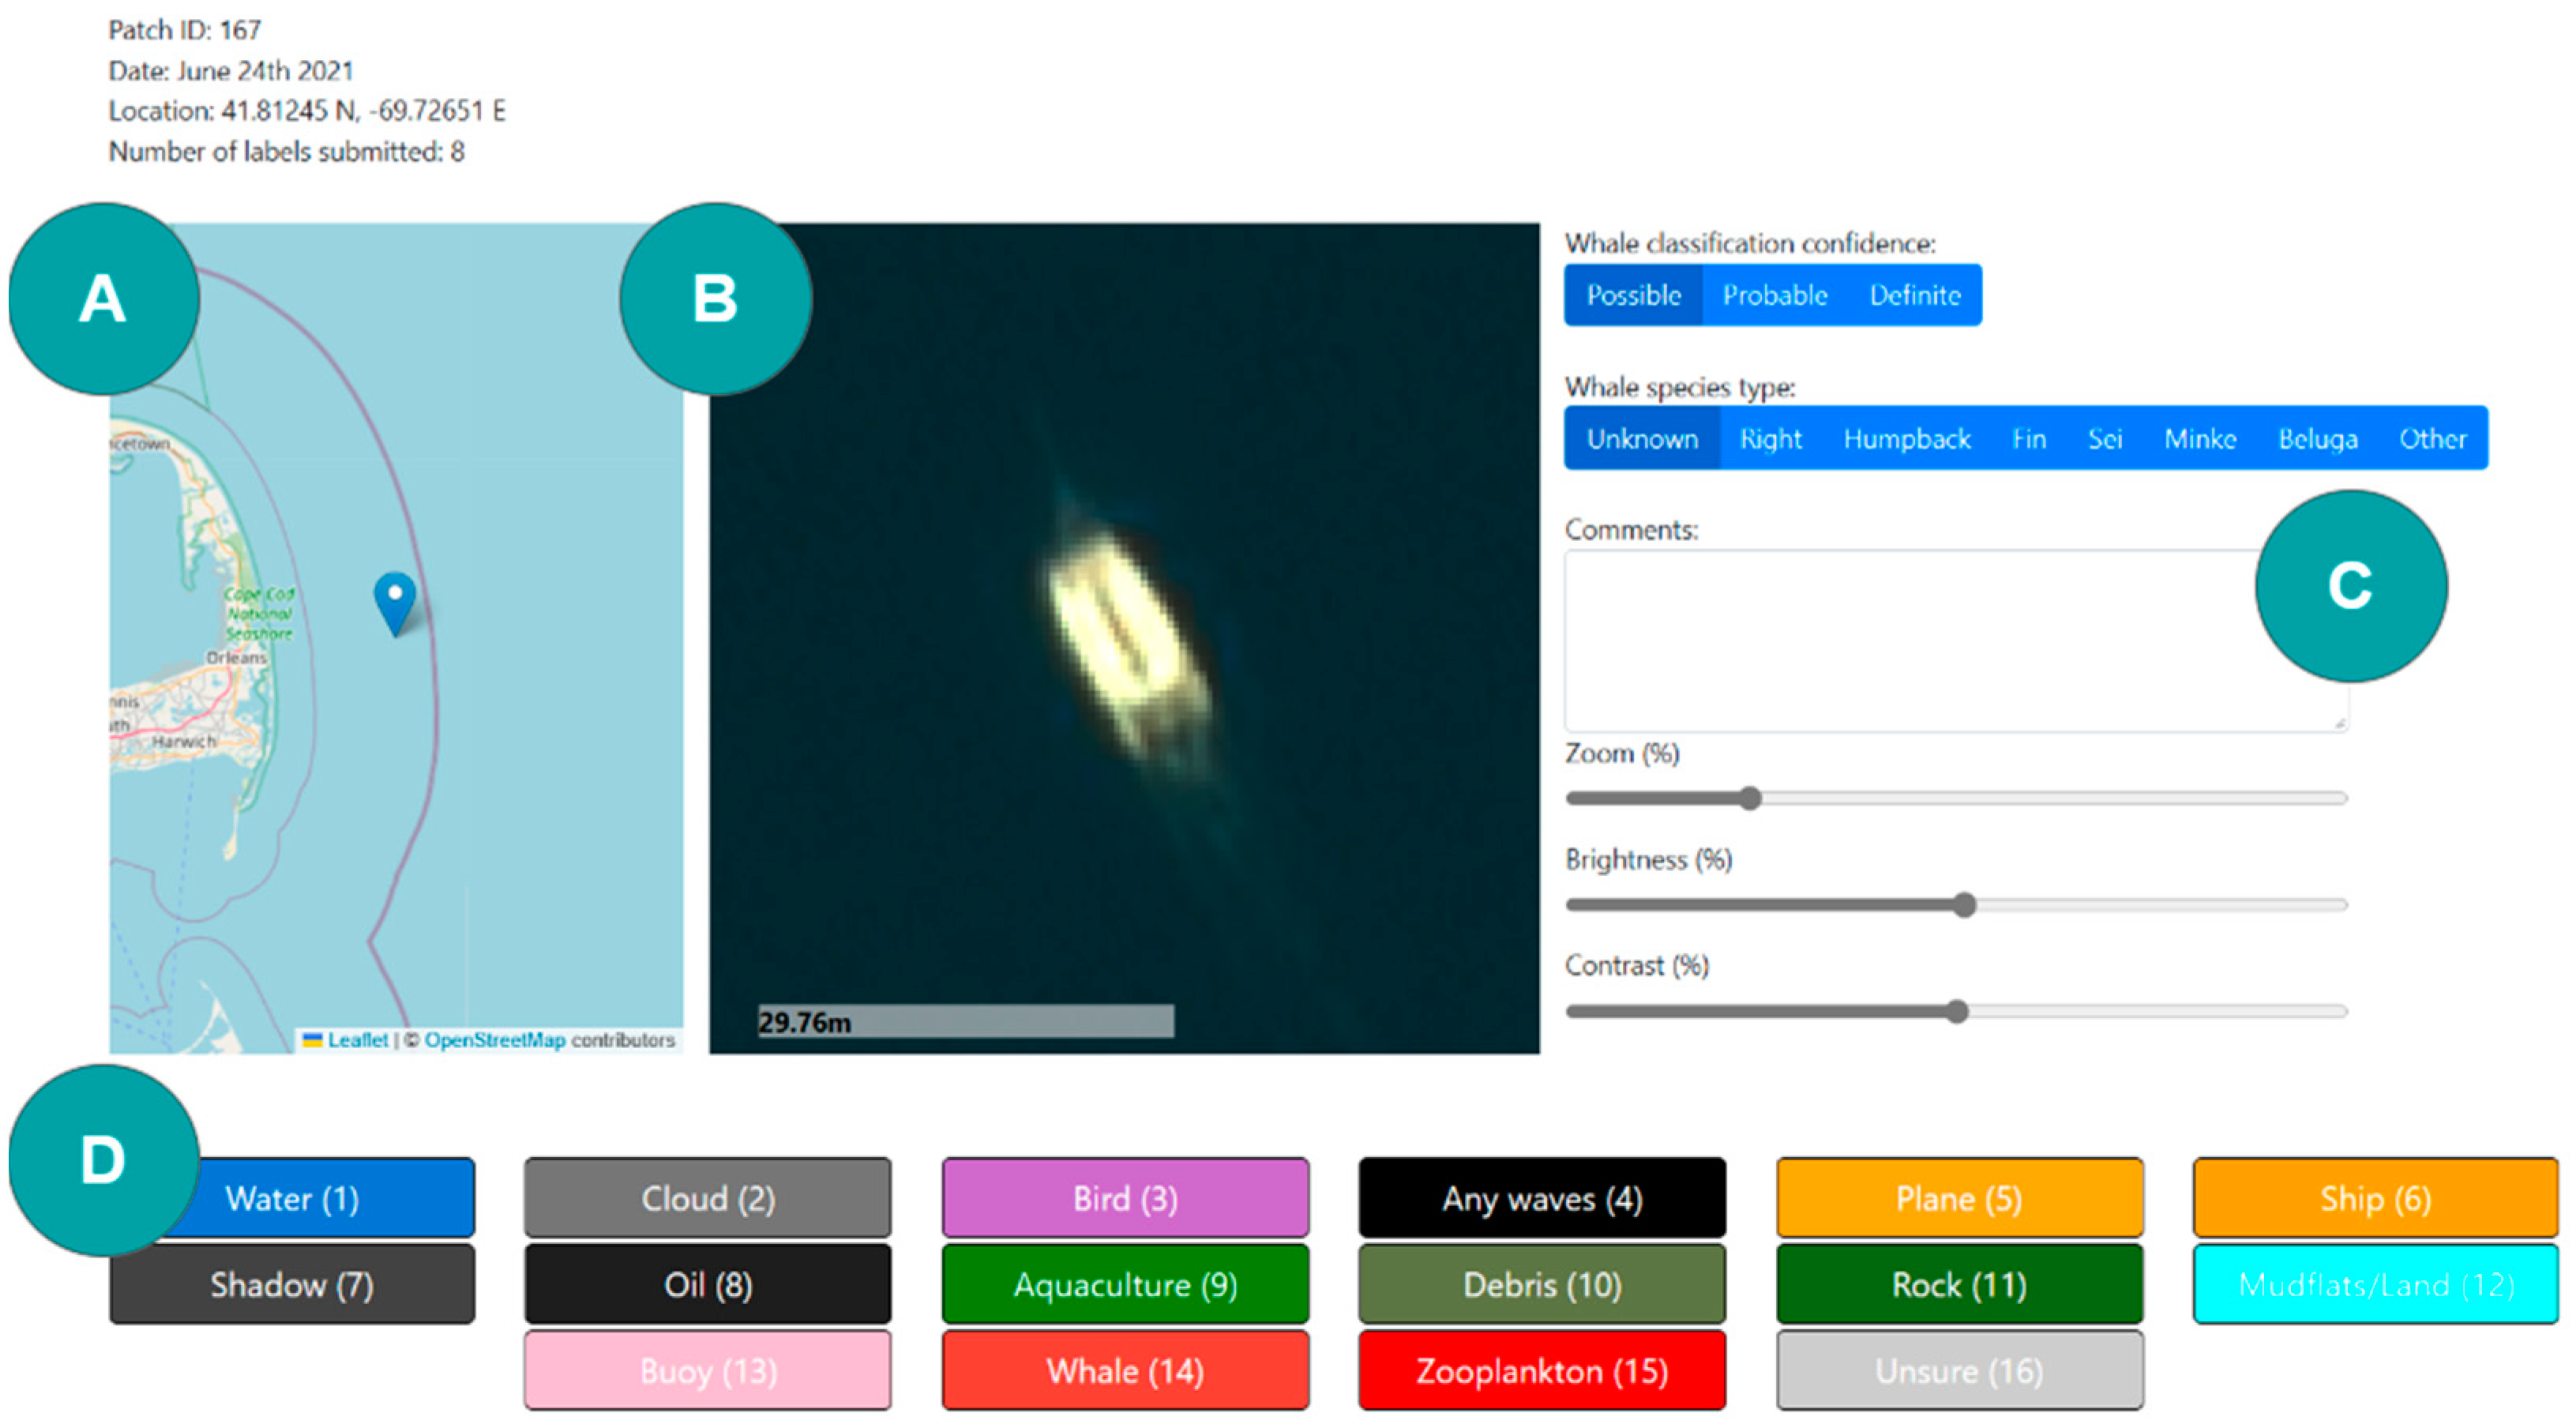
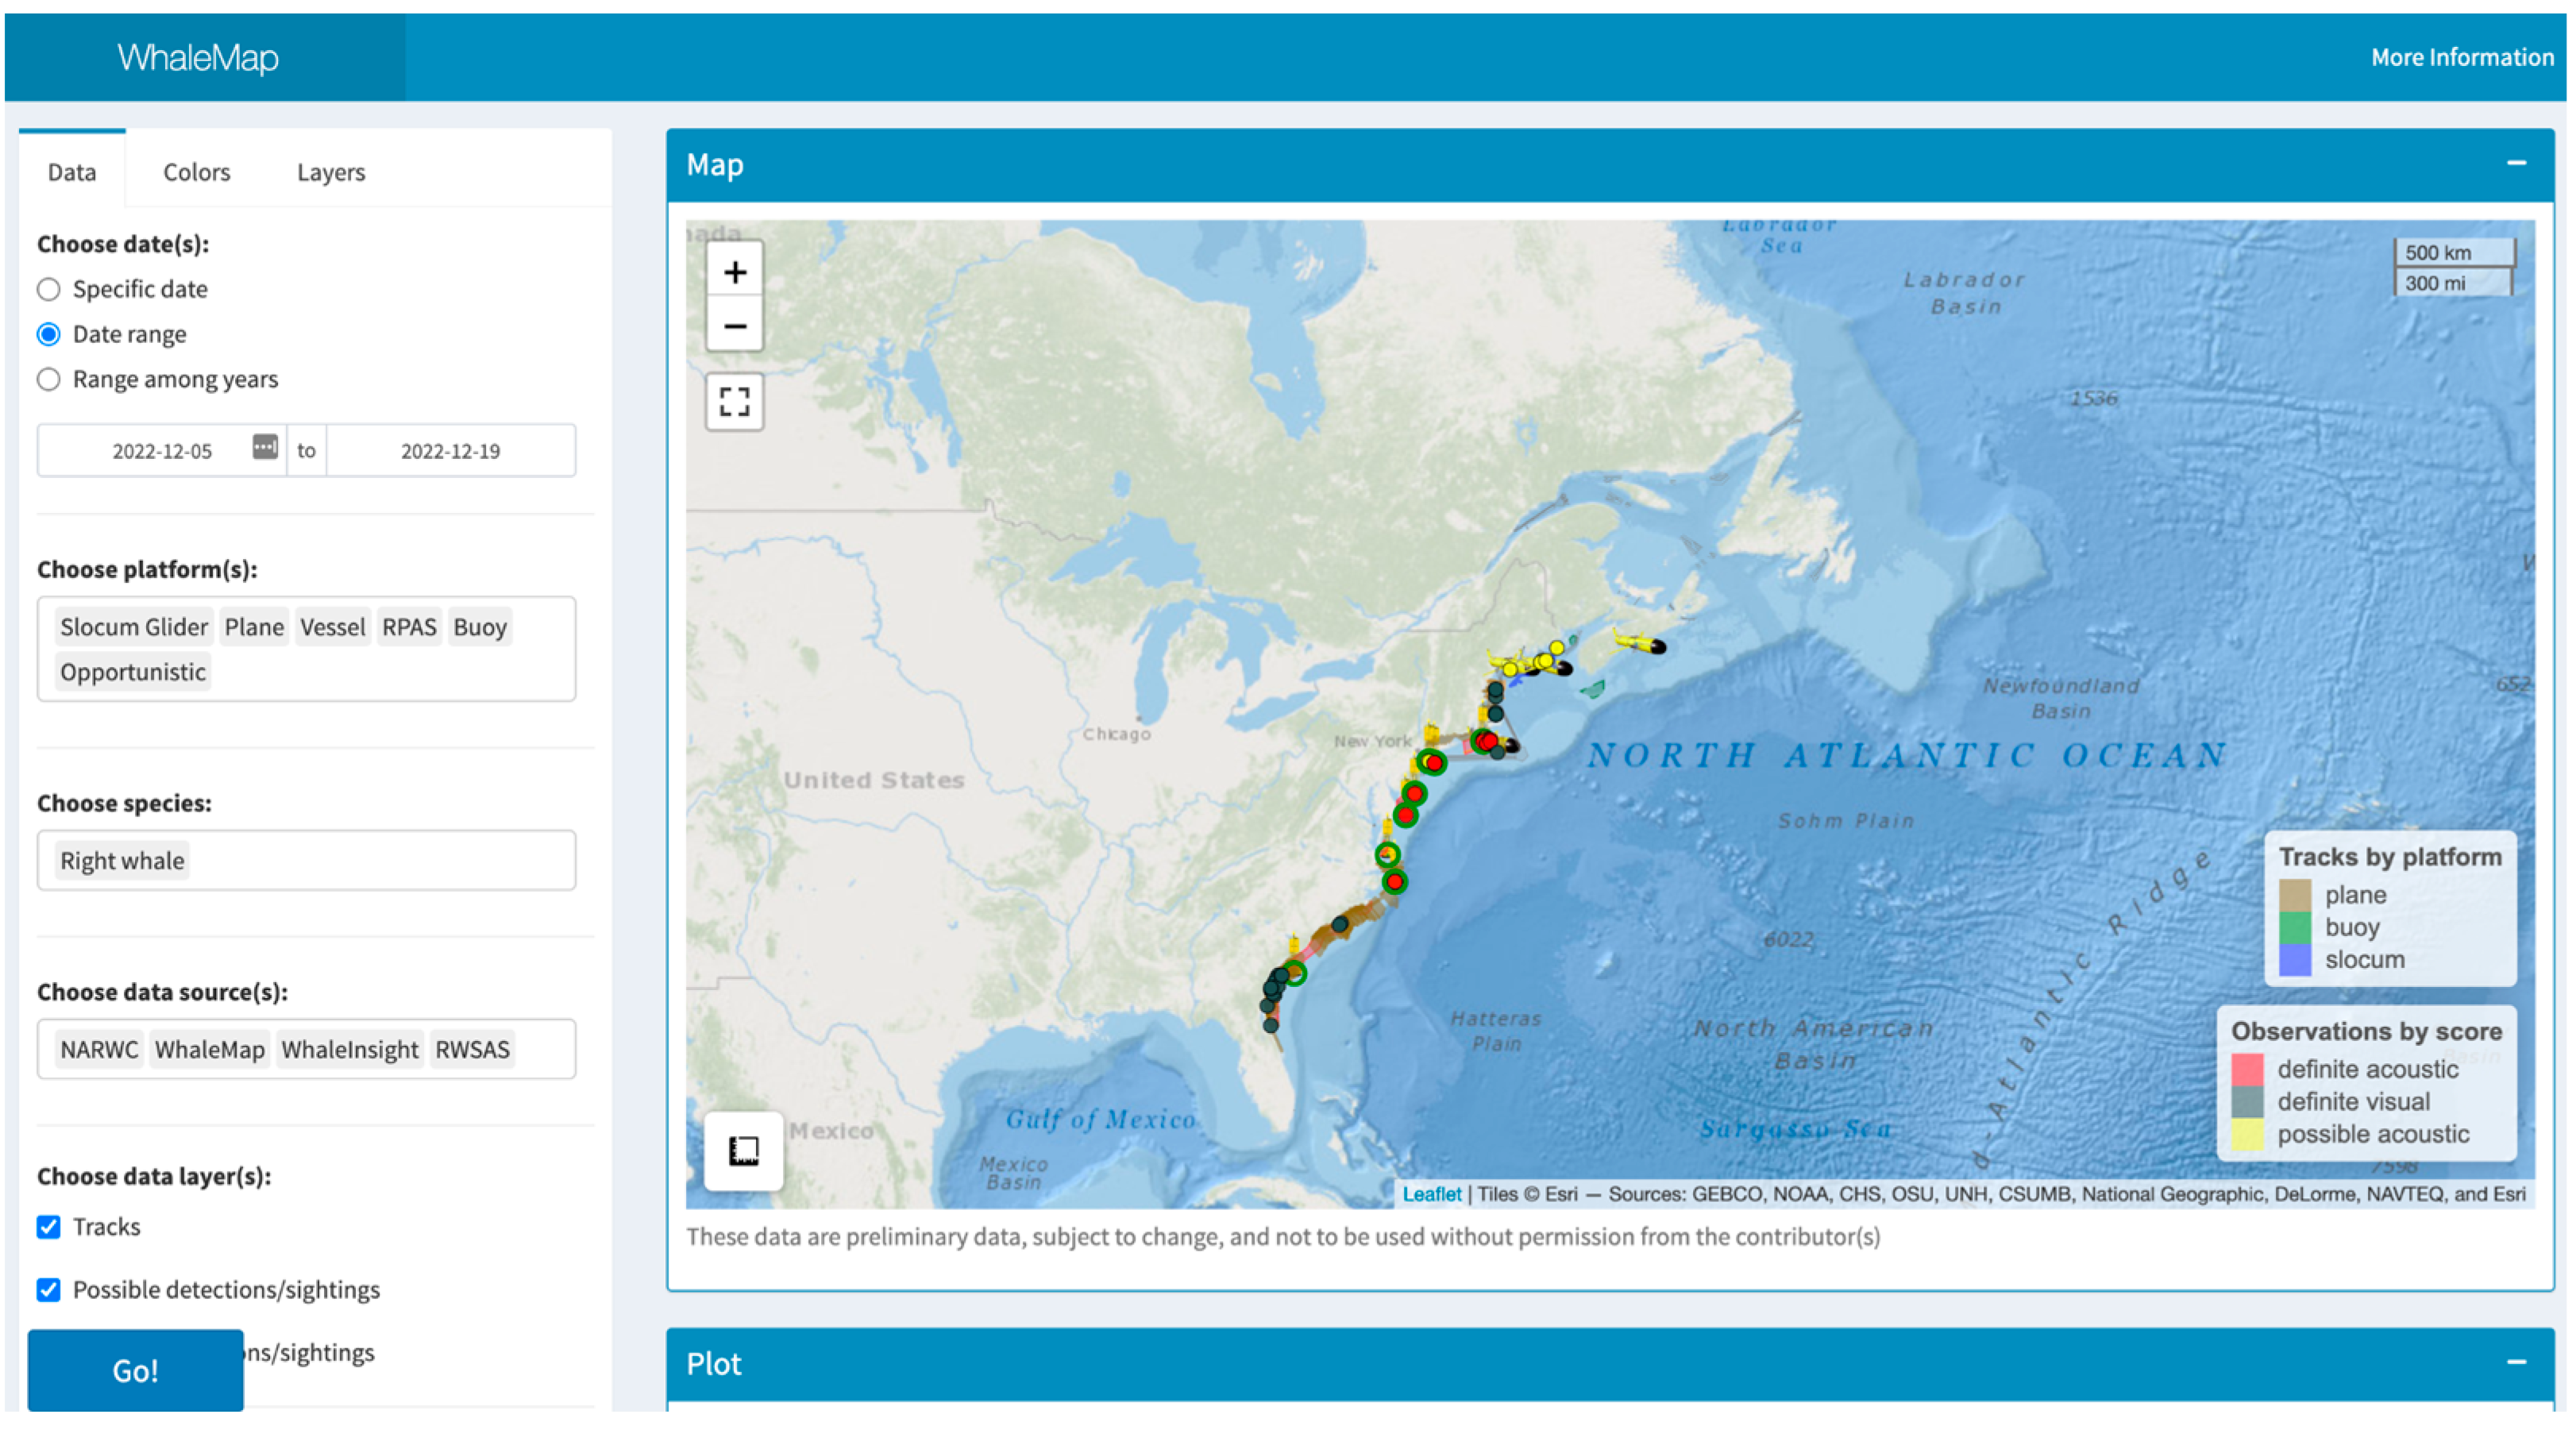
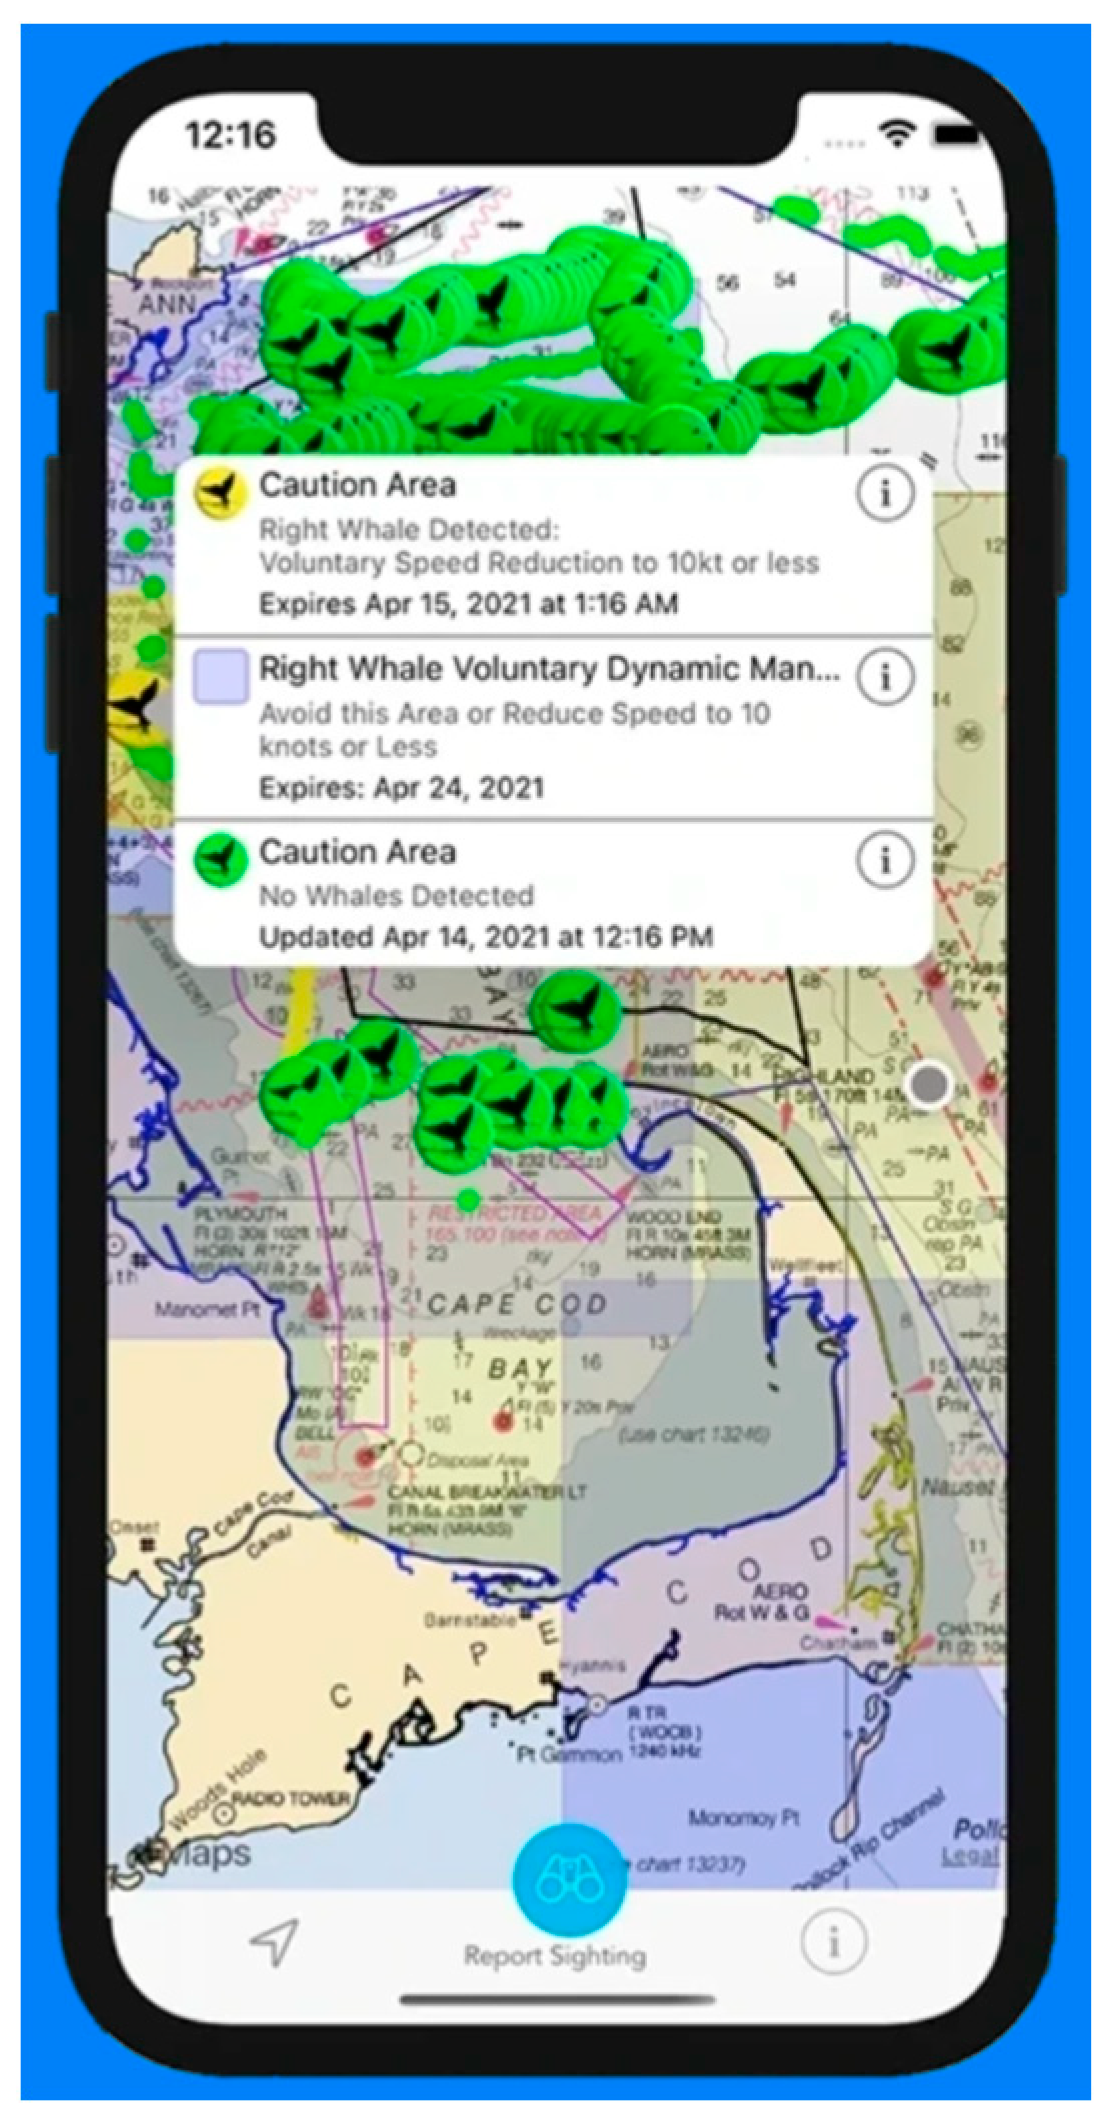
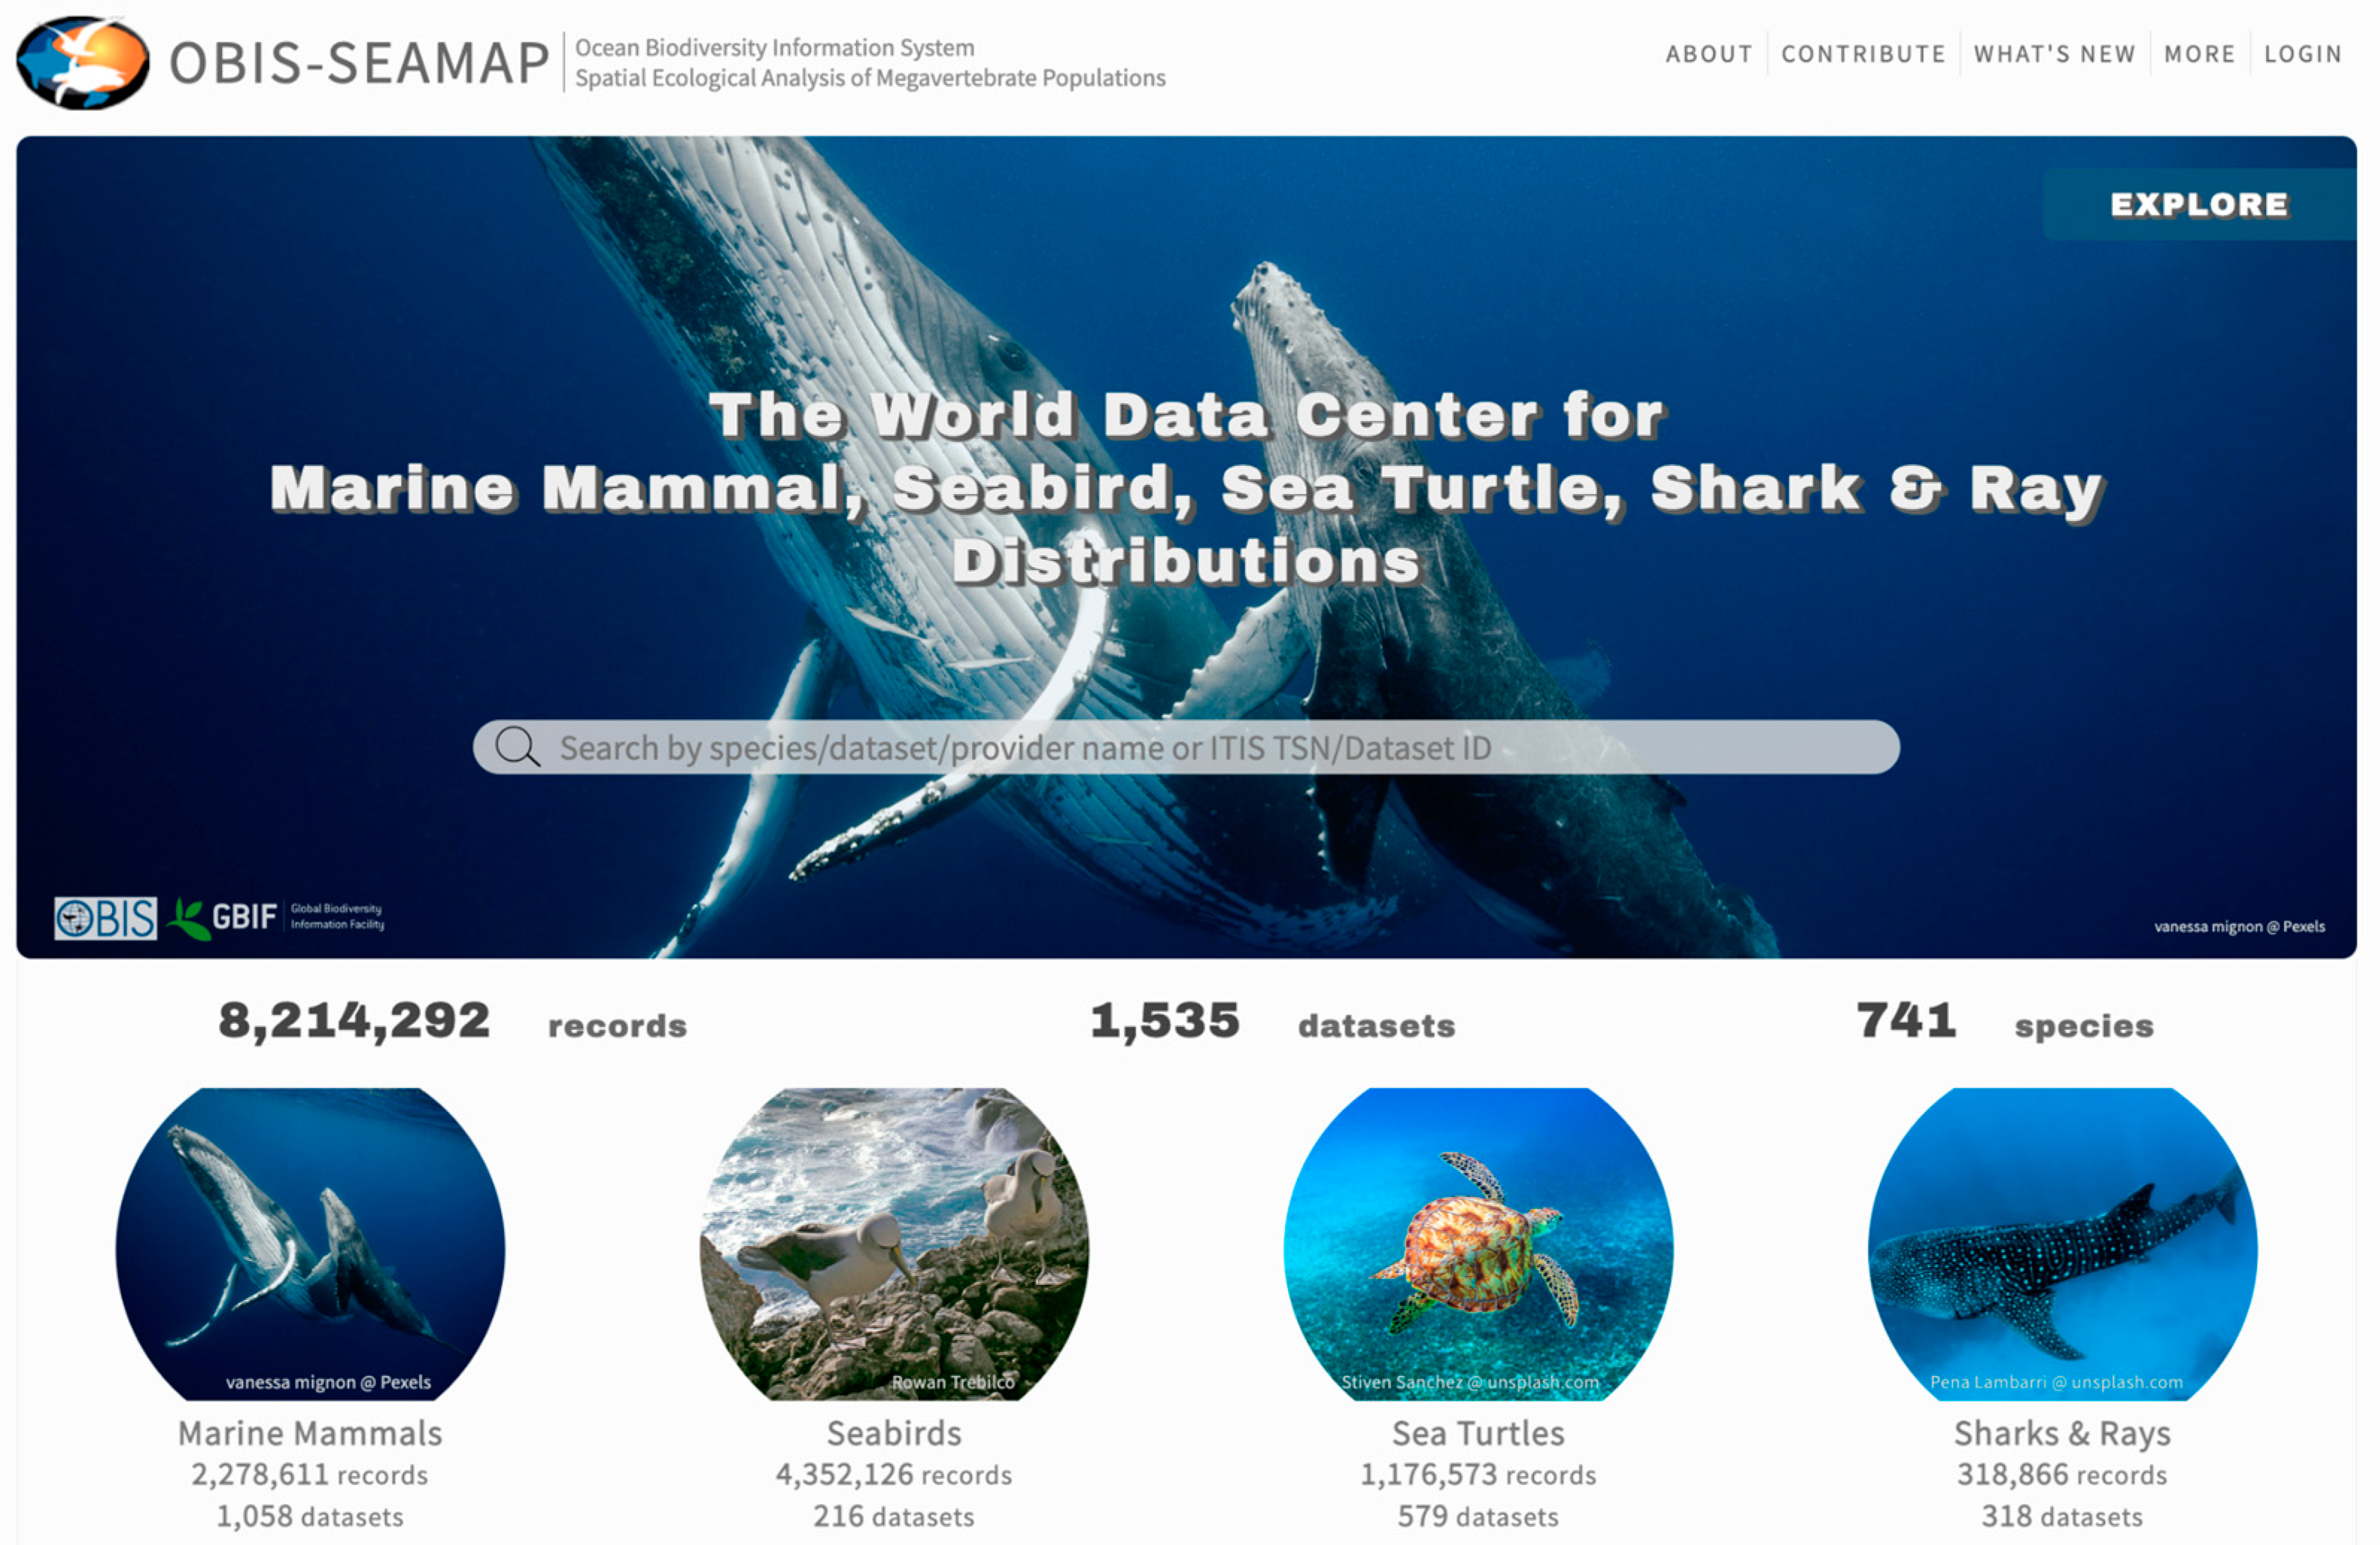
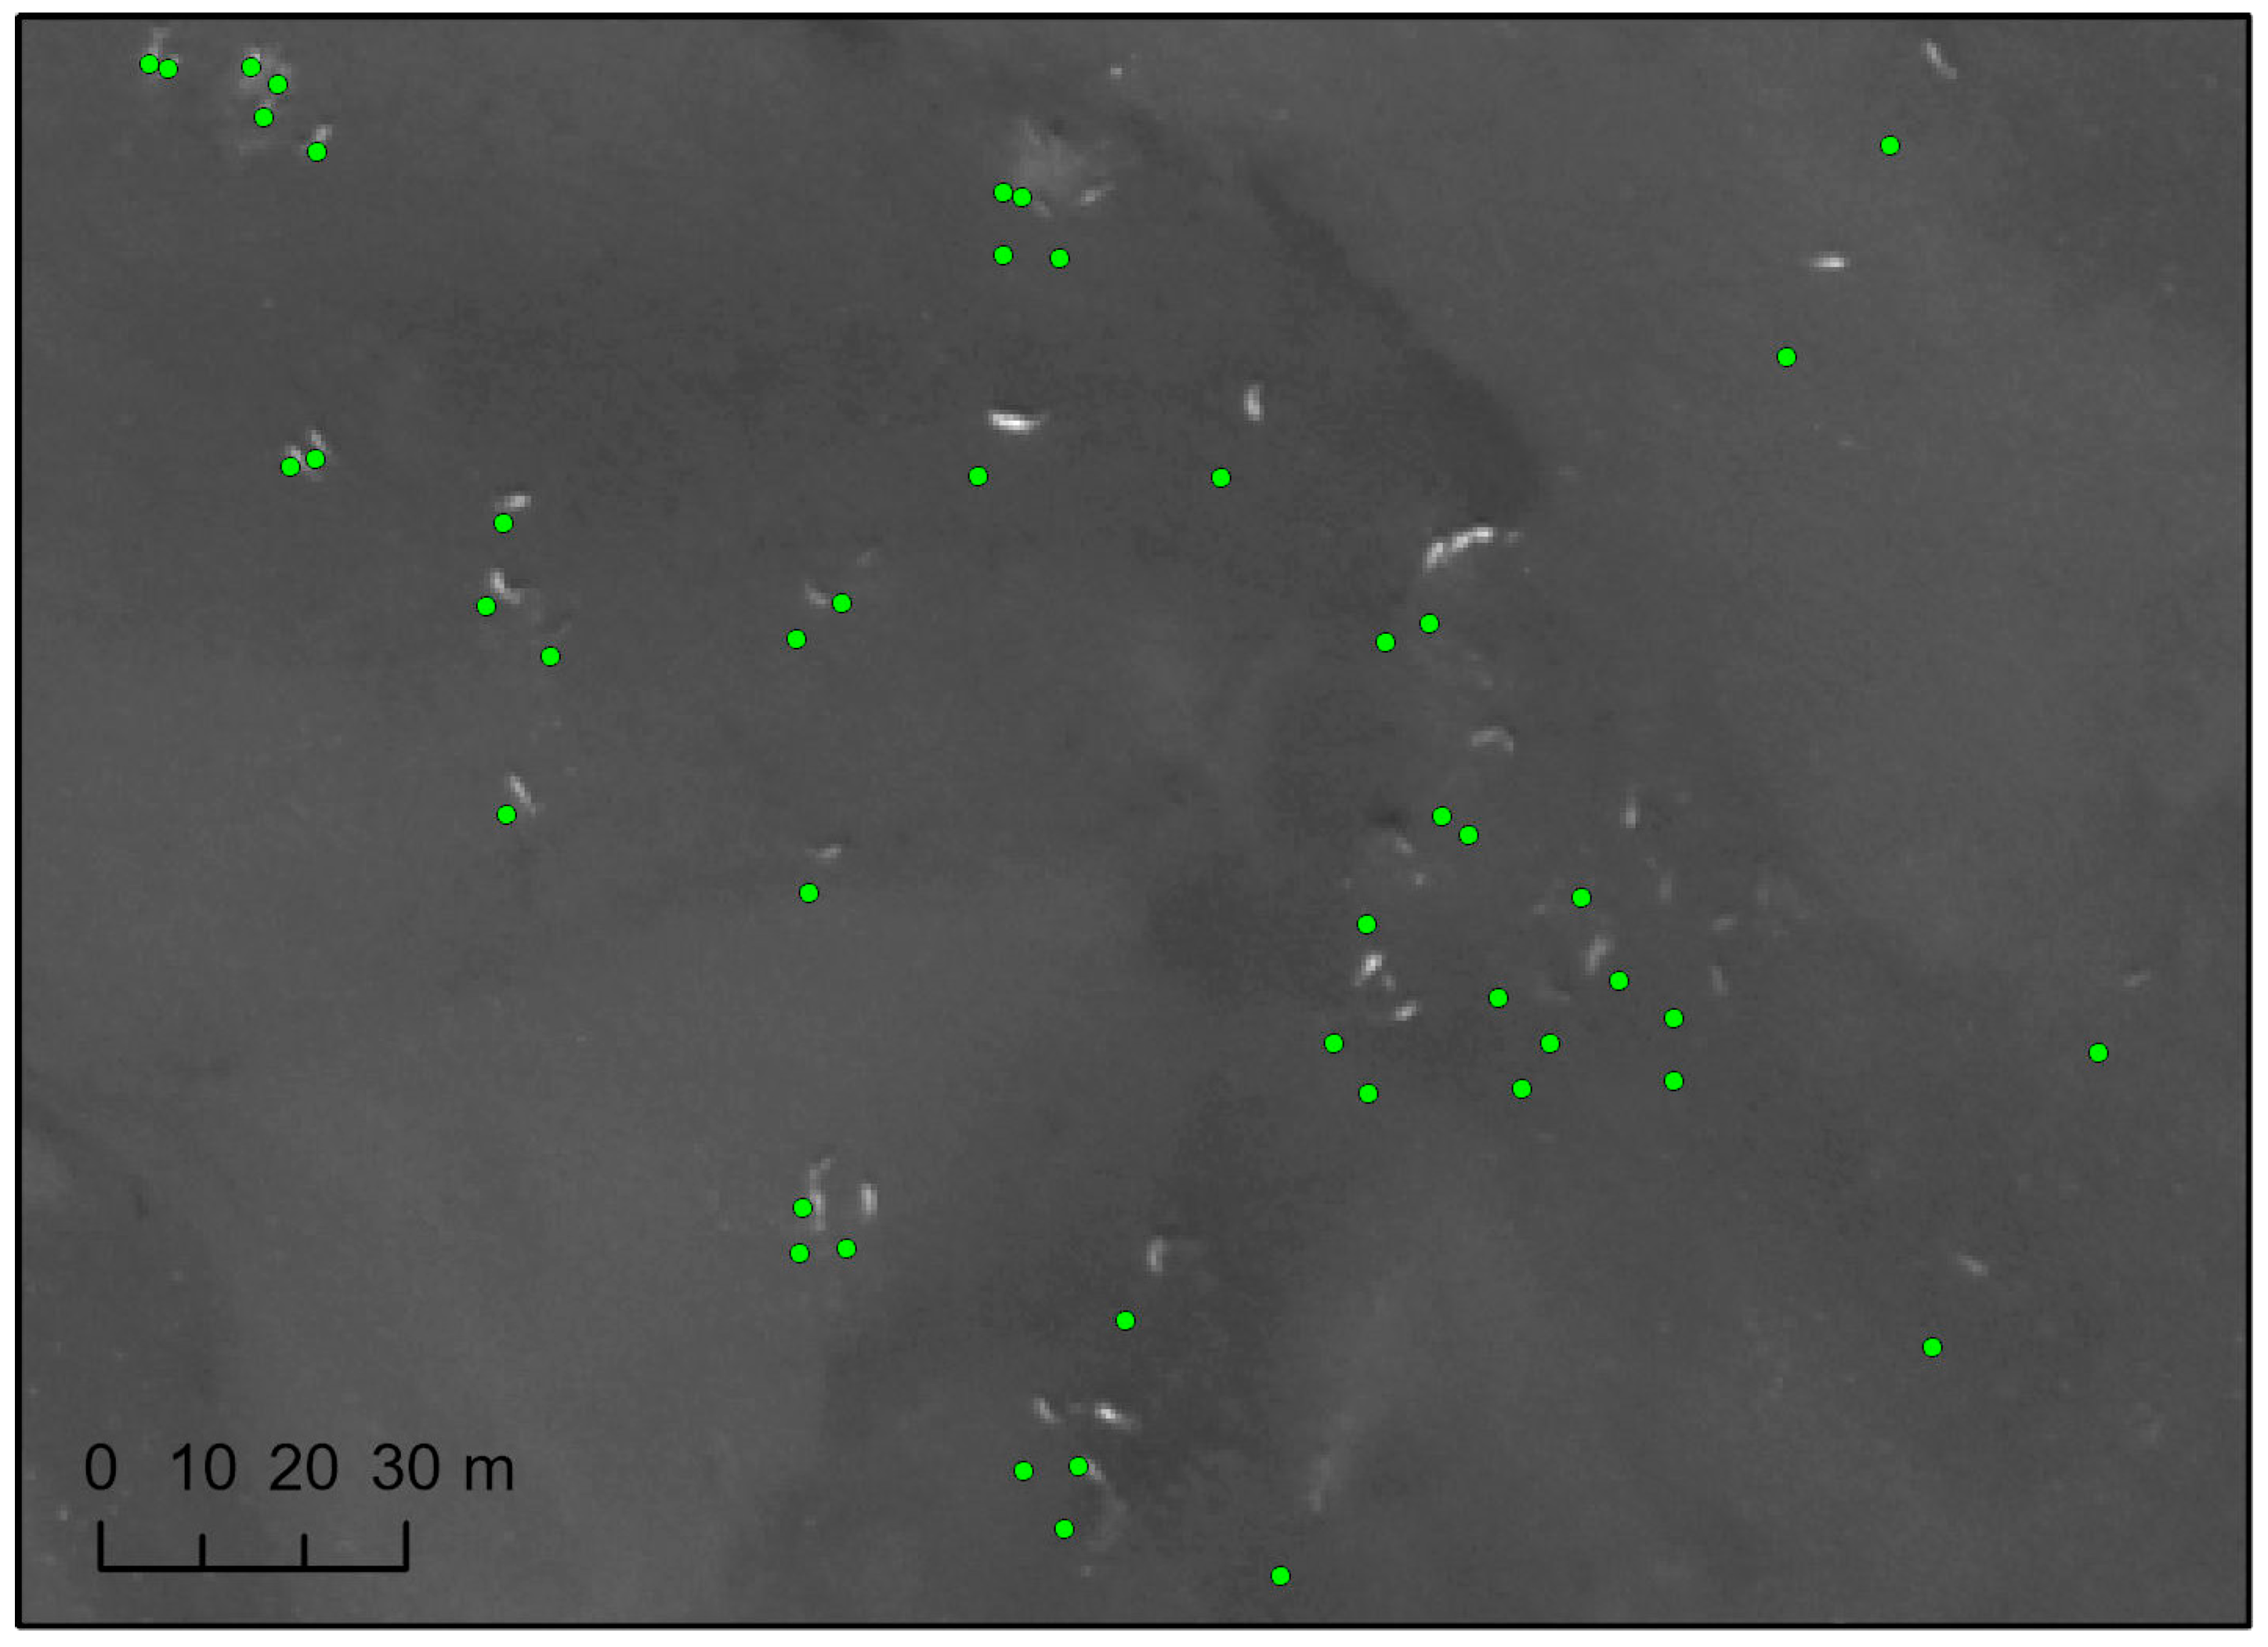