Article

Monitoring the Kotychi Lagoon in Western Peloponnese, Greece, Using Remote Sensing Techniques and Environmental Assessment

by
Dionysios N. Apostolopoulos
1,
Dionysios Giannikopoulos
1,
Alexis Ramfos
2,
Sara Faulwetter
3,
Dionisios Panagiotaras
4,
Konstantinos G. Nikolakopoulos
1 and
Pavlos Avramidis
3,*
1
GIS & Remote Sensing Laboratory, Department of Geology, University of Patras, 26504 Rio, Greece
2
Department of Biology, University of Patras, 26504 Rio, Greece
3
Laboratory of Sedimentology, Department of Geology, University of Patras, 26504 Rio, Greece
4
Department of Environment, Ionian University, M. Minotou-Giannopoulou Str., Panagoula, 29100 Zakynthos, Greece
*
Author to whom correspondence should be addressed.
J. Mar. Sci. Eng. 2023, 11(2), 411; https://doi.org/10.3390/jmse11020411
Submission received: 18 January 2023 / Revised: 3 February 2023 / Accepted: 9 February 2023 / Published: 13 February 2023

Abstract

:
The Kotychi Lagoon (western Peloponnese, Greece), together with other coastal wetlands such as Pappas, Prokopos and Lamia, is part of the wider area of the Strofylia Wetlands National Park and Protected Areas of Western Peloponnese, which has been protected by the Ramsar convention since 1971 and classified as a Natura 2000 area due to its high diversity and ecological value. This study aimed to estimate the water surface evolution of the Kotychi Lagoon using optical remote sensing techniques to record parameters and indices related to the geometrical and landscape orientation features for the 1945–2016 period and to evaluate the ecological and environmental status of the lagoon through in-situ measurement and sample analysis. High-resolution aerial photos at a scale of 1:30,000, orthomosaics, and satellite images were used and linear regression rates (LRR) were calculated to determine the changes. Seasonal sampling of water, sediment, and macrofaunal organisms in the lagoon was performed to monitor environmental and ecological parameters. The results showed that the lagoon’s water surface shrank during the 1945–2016 period, showing different rates in four segments. The shrinkage prevailed in the northeastern and southern parts of the lagoon, with rates of 17.75 and 6.46 m/year, respectively. The ecological status was determined to be poor, although nutrient input seemed to have been moderate over the study period. We conclude that applying remote sensing techniques using a combination of high-resolution images constitutes an effective and accurate method for the spatiotemporal mapping of wetlands. The ecological problems of the Kotychi Lagoon were highlighted and confirmed through complementary in-situ analyses. These problems need to be addressed by the respective managerial bodies in order to restore the lagoon to good ecological status.

1. Introduction

The water on the surface of the Earth appears as rivers, lakes, wetlands, and seas, all of which are important ecosystems supporting a variety of human needs, such as agricultural and biogeochemical activities, that must be preserved by humanity in the coming years [1]. Due to the recent climate changes, wetlands can be considered as some of the most threatened ecosystems, affected by sea level rise, storm and river flooding as well as human activities [2].
Coastal lagoons represent a transitional zone where freshwater and marine ecosystems are linked to each other [3]. They are usually oriented parallel to the shore [4,5] and formed in topographically low regions behind coasts [6]. Depending on their degree of water exchange with the sea, lagoons can be classified as choked, restricted, and leaky lagoons [7]. Choked lagoons occur on coasts where a littoral drift has emerged due to high wave action, restricted lagoons communicate with the sea through two or more inlets, and leaky lagoons have many entrance channels.
Monitoring the evolution of the water boundaries of a lagoon is essential to understand its evolution and predict future changes. For instance, alterations to the water boundaries during the seasons of the year as well as the rate of isolation from the open sea can have a devastating effect on vital natural resources, the soil, and water volume of the lagoon.
In the remote sensing research field, accurately monitoring water bodies is an essential and fundamental application in which accuracy is a prerequisite. Various mapping approaches have been developed to extract water bodies from multispectral images using relevant algorithms, such as the Normalized Difference Water Index (NDWI) introduced by ref. [8] and the Modified Normalized Difference Water Index (MNDWI) introduced by ref. [9], which improved the NDWI index and gave more accurate results applied in built-up areas by removing the relative noise. In addition, the Normalized Difference Vegetation Index (NDVI) [10,11] and the Tasseled Can Transformation (TCT) [12,13,14,15] also been used. The main drawback of these semi-automatic techniques is that they are generated on the basis of spectral information provided by the bands of satellite images, requiring very expensive high-resolution multispectral images to be acquired, especially in cases where large areas should be covered.
For this reason, in the present study, available high-resolution panchromatic and RGB orthomosaics were utilized in order to extract the water body of the wetland manually through an on-screen digitizing process where uncertainties and errors [16,17] are greatly reduced and limited to the pixel and rectification error. In addition, it was shown in a recent study [18] that the shoreline vectors extracted from high-resolution datasets have negligible uncertainty and thus are suitable for such studies.
The present study is an extensive application of several morphometric parameters and indices introduced by ref. [19] and used by ref. [20] on the Kotychi Lagoon (Figure 1), which were recently implemented as a pilot by our research team in the Prokopos lagoon [18]. These parameters are related to the geometrical characteristics of lagoons, such as the perimeter, water surface, and diameter (min and max), while four parameters have no units of measurement and are related to the landscape orientation of the lagoon, such as the restriction ratio (Pr), orientation or anisotropy parameter (Por), shore development parameter (Ds), and number of inlets or channels (CMAR).
Spatiotemporal changes of the water surface extension of the studied wetland were computed using remote sensing techniques in a geographical information system (GIS) environment, while the water shoreline evolution was examined via linear regression for the 1945–2016 period utilizing linear regression rates (LRR) from the ArcMap plugin of the Digital Shoreline Analysis System (DSAS).
In the current work, we present a survey of existing remote sensing-based approaches for monitoring the Kotychi Lagoon water body during the period 1945–2016 and the results are statistically analyzed. The study adds valuable knowledge about the historical evolution of wetlands in western Peloponnese, where limited studies have existed, since 1945 [21,22]. Moreover, a valuable database with spatiotemporal parameters was established related to the water surface alterations of the lagoon, revealing the general trend of evolution in the coming years. Thus, the local stakeholders and management authorities would be able to identify when the lagoon’s ecosystem is under environmental pressure and action is necessary to protect its balance.
In addition to the assessment of water surface changes through remote sensing, we analyzed water parameters, nutrient input, sediment characteristics, and the macrozoobenthic composition of the lagoon over three seasons. Samples were collected from a grid of stations throughout the lagoon in order to assess its spatiotemporal environmental and ecological characteristics. This information was then used to complement the information from the remote sensing analyses and allowed us to form a holistic assessment of the environmental status of the lagoon.

2. Materials and Methods
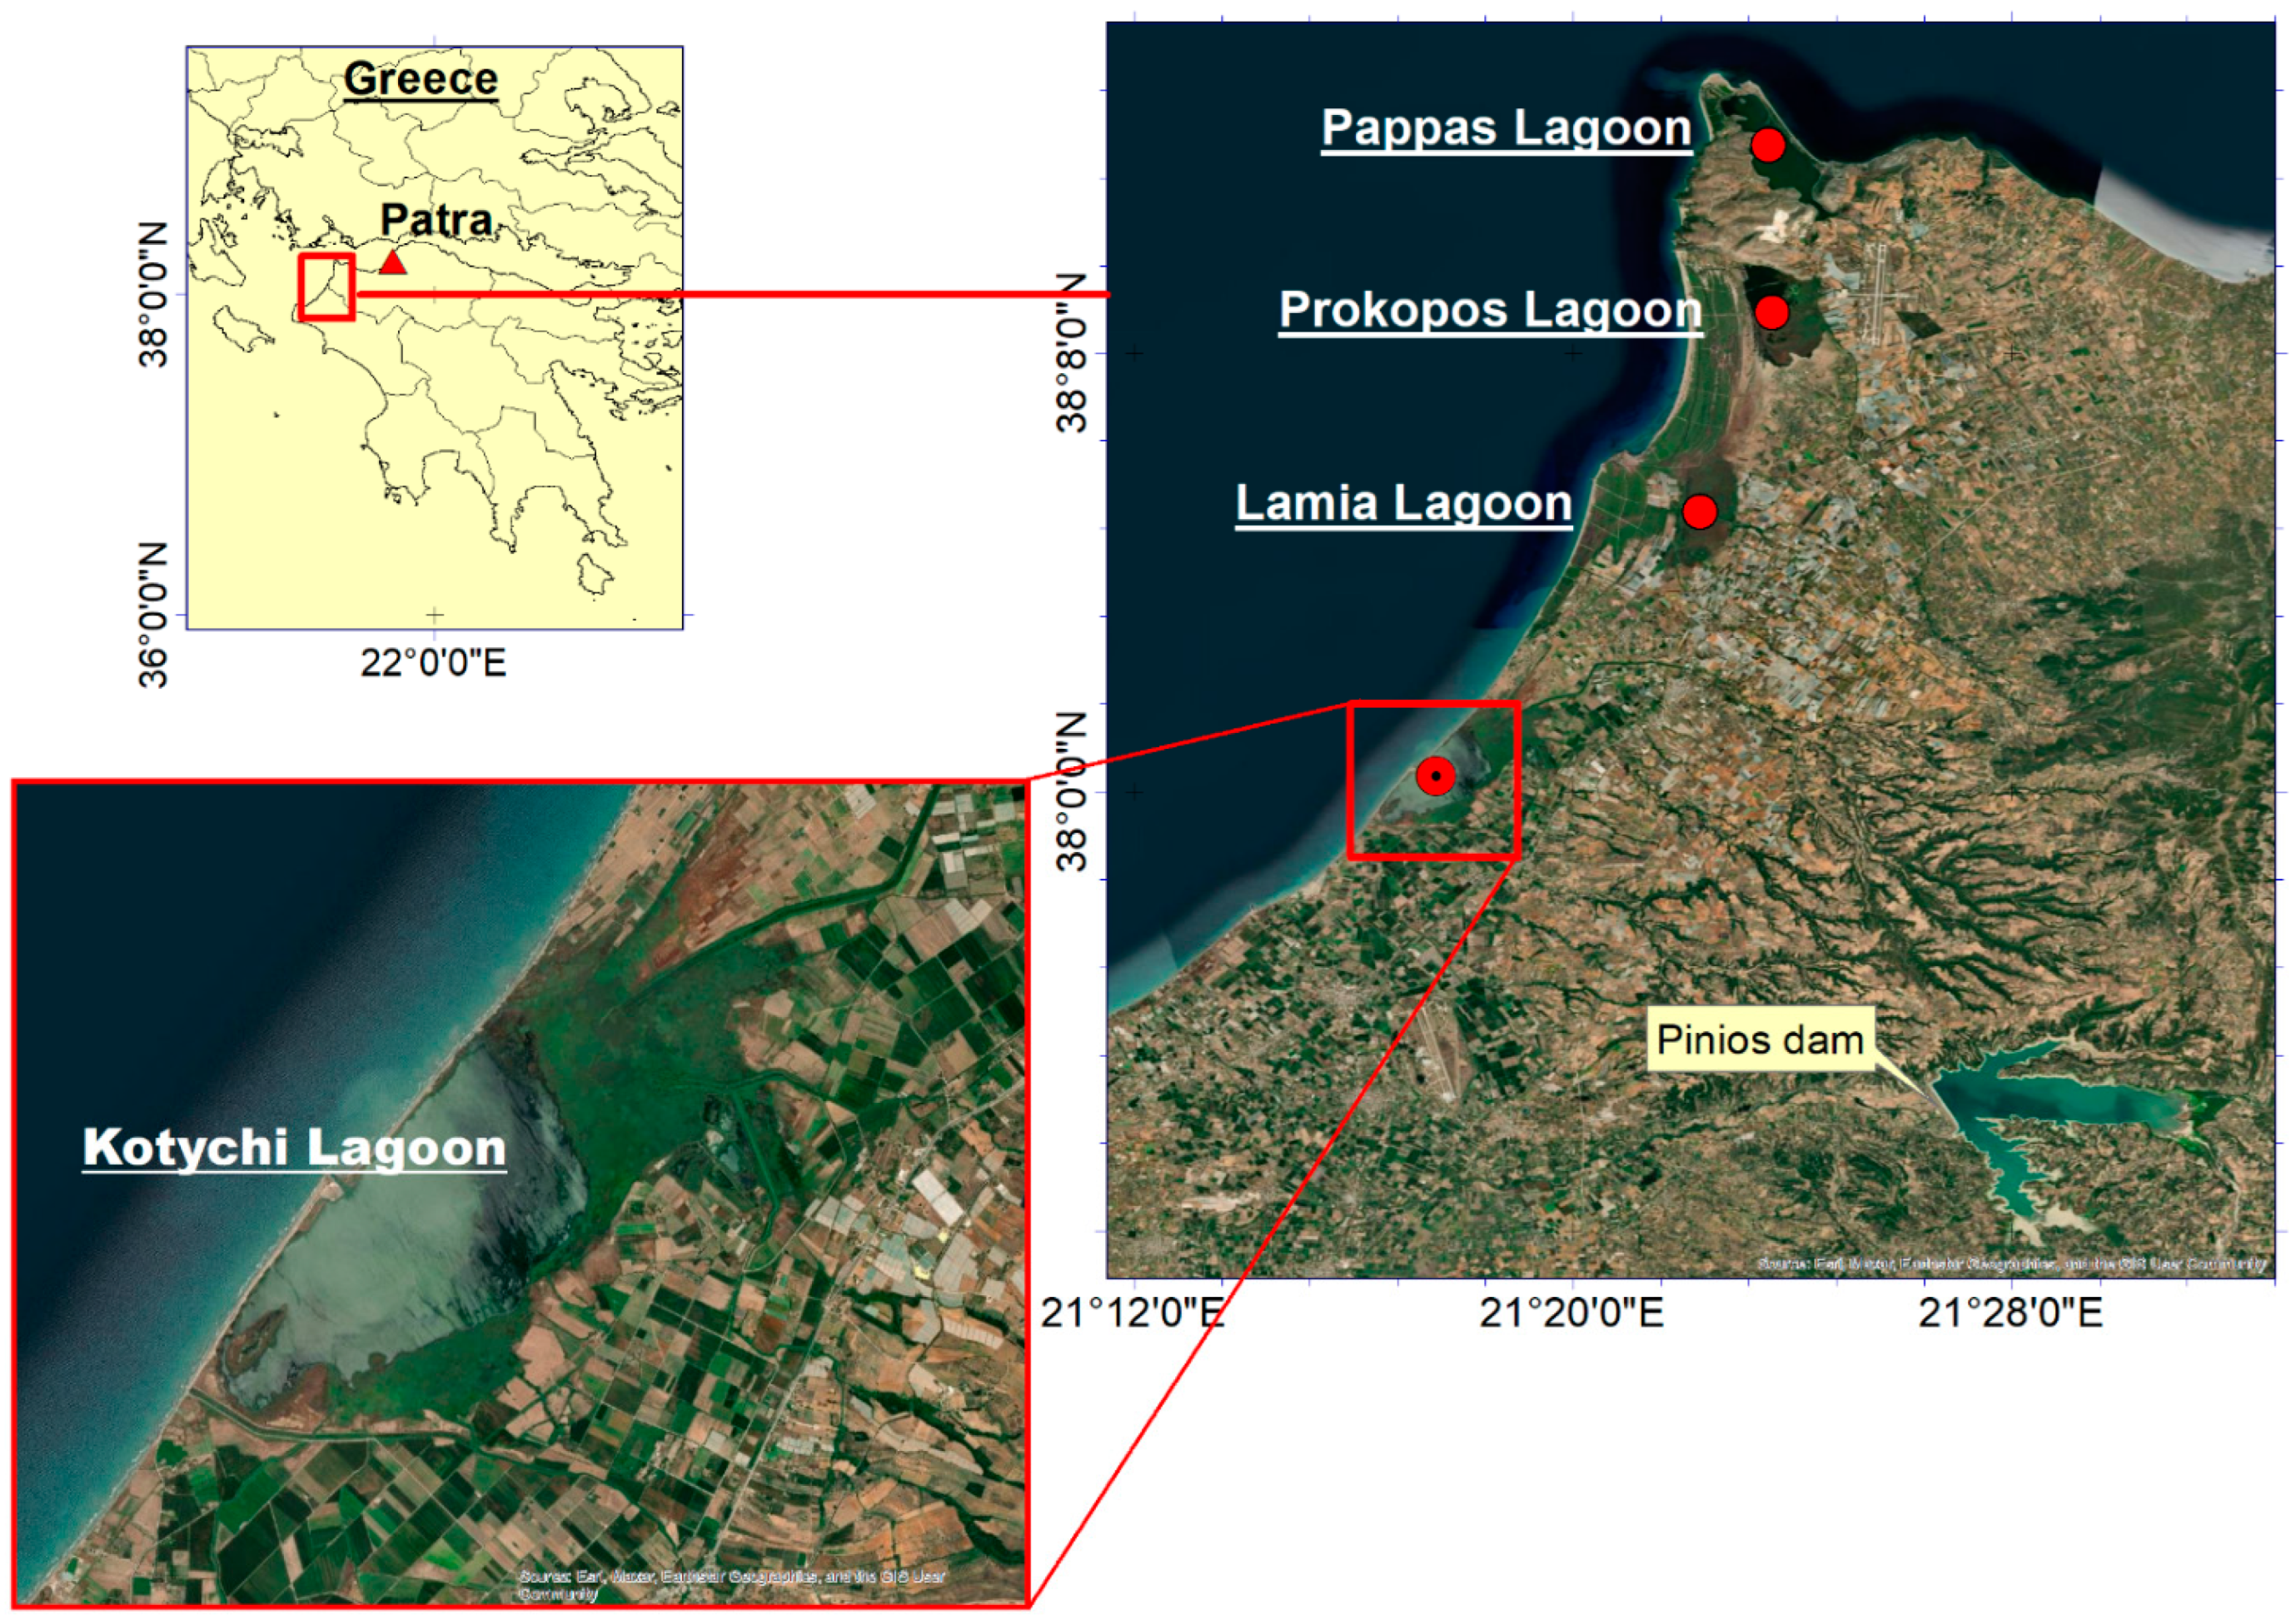
2.1. Study Area

Western Peloponnese is one of the most significant areas of Greece in terms of coastal lagoon ecosystems [23,24] and consists of important geoarchives for the study of climatic and environmental changes in relation to societal changes [25,26]. The Kotychi Lagoon is part of a series of wetlands along the coast of northwest Peloponnese, Greece, that have been protected by the Ramsar convention since 1971. The Kotychi Lagoon is listed in the Natura 2000 (E.C.) Catalogue with code GR2330006 and is characterized as a Special Protected Area with high diversity and ecological value [22]. The Kotychi Lagoon is situated in the Achaia Prefecture, and it is an important ecosystem with rare species of plants and animals and natural beauty, but it also provides space for a multitude of human activities, such as fishing, cultivation, and recreation. The wider area is supervised by the Ministry of Environment and Energy of Greece. It is believed that the lagoon formed in the prograding delta of the Palaeo-Peneus river more than 7000 years ago [27,28]. It is the largest lagoon in the Peloponnese, currently covering an area of 480 hectares depending on the annual rainfall, with a maximum depth of 1 m. It is separated from the Ionian Sea by a narrow sand strip about 5 km in length and communicates with the sea through an opening almost 200 m long and 30 m wide, while it receives freshwater input from the two remaining streams since 1987 that discharge into the lagoon and supply it with water and sediment [22]. The climate of the area is typical Mediterranean without particularly high temperatures in summer or very low temperatures in winter, with approximately 300 days of sunshine per year, thus making possible observation from optical satellites. Regarding tectonism, the study area is under a compressional regime due to major fault systems forming neotectonic blocks that exhibit diverging trends of vertical movement, while uplift rates between 0.16 and 0.67 mm/year characterize the hinterland and the coastal strip is subsiding [29,30]. The construction of the Pinios Dam in the late 60’s and the change in land use from non-irrigated to irrigated have affected the hydrological conditions of the lagoon [21]. In 1987, the lagoon was covered by swampy areas due to irrigation works that began in the early 70’s and rapidly changed the ecological and environmental situation of the lagoon [21]. Many detrimental impacts have been observed as a result of intensive agriculture, aquaculture, industry, overexploitation of the water resources, pollution due to human activities and urbanization, intense pasturing, and as overfishing. The Kotychi Lagoon is one of the most important Greek biotopes and thus its diachronic water surface alterations should be monitored in order to protect the lagoon and the wider wetlands.

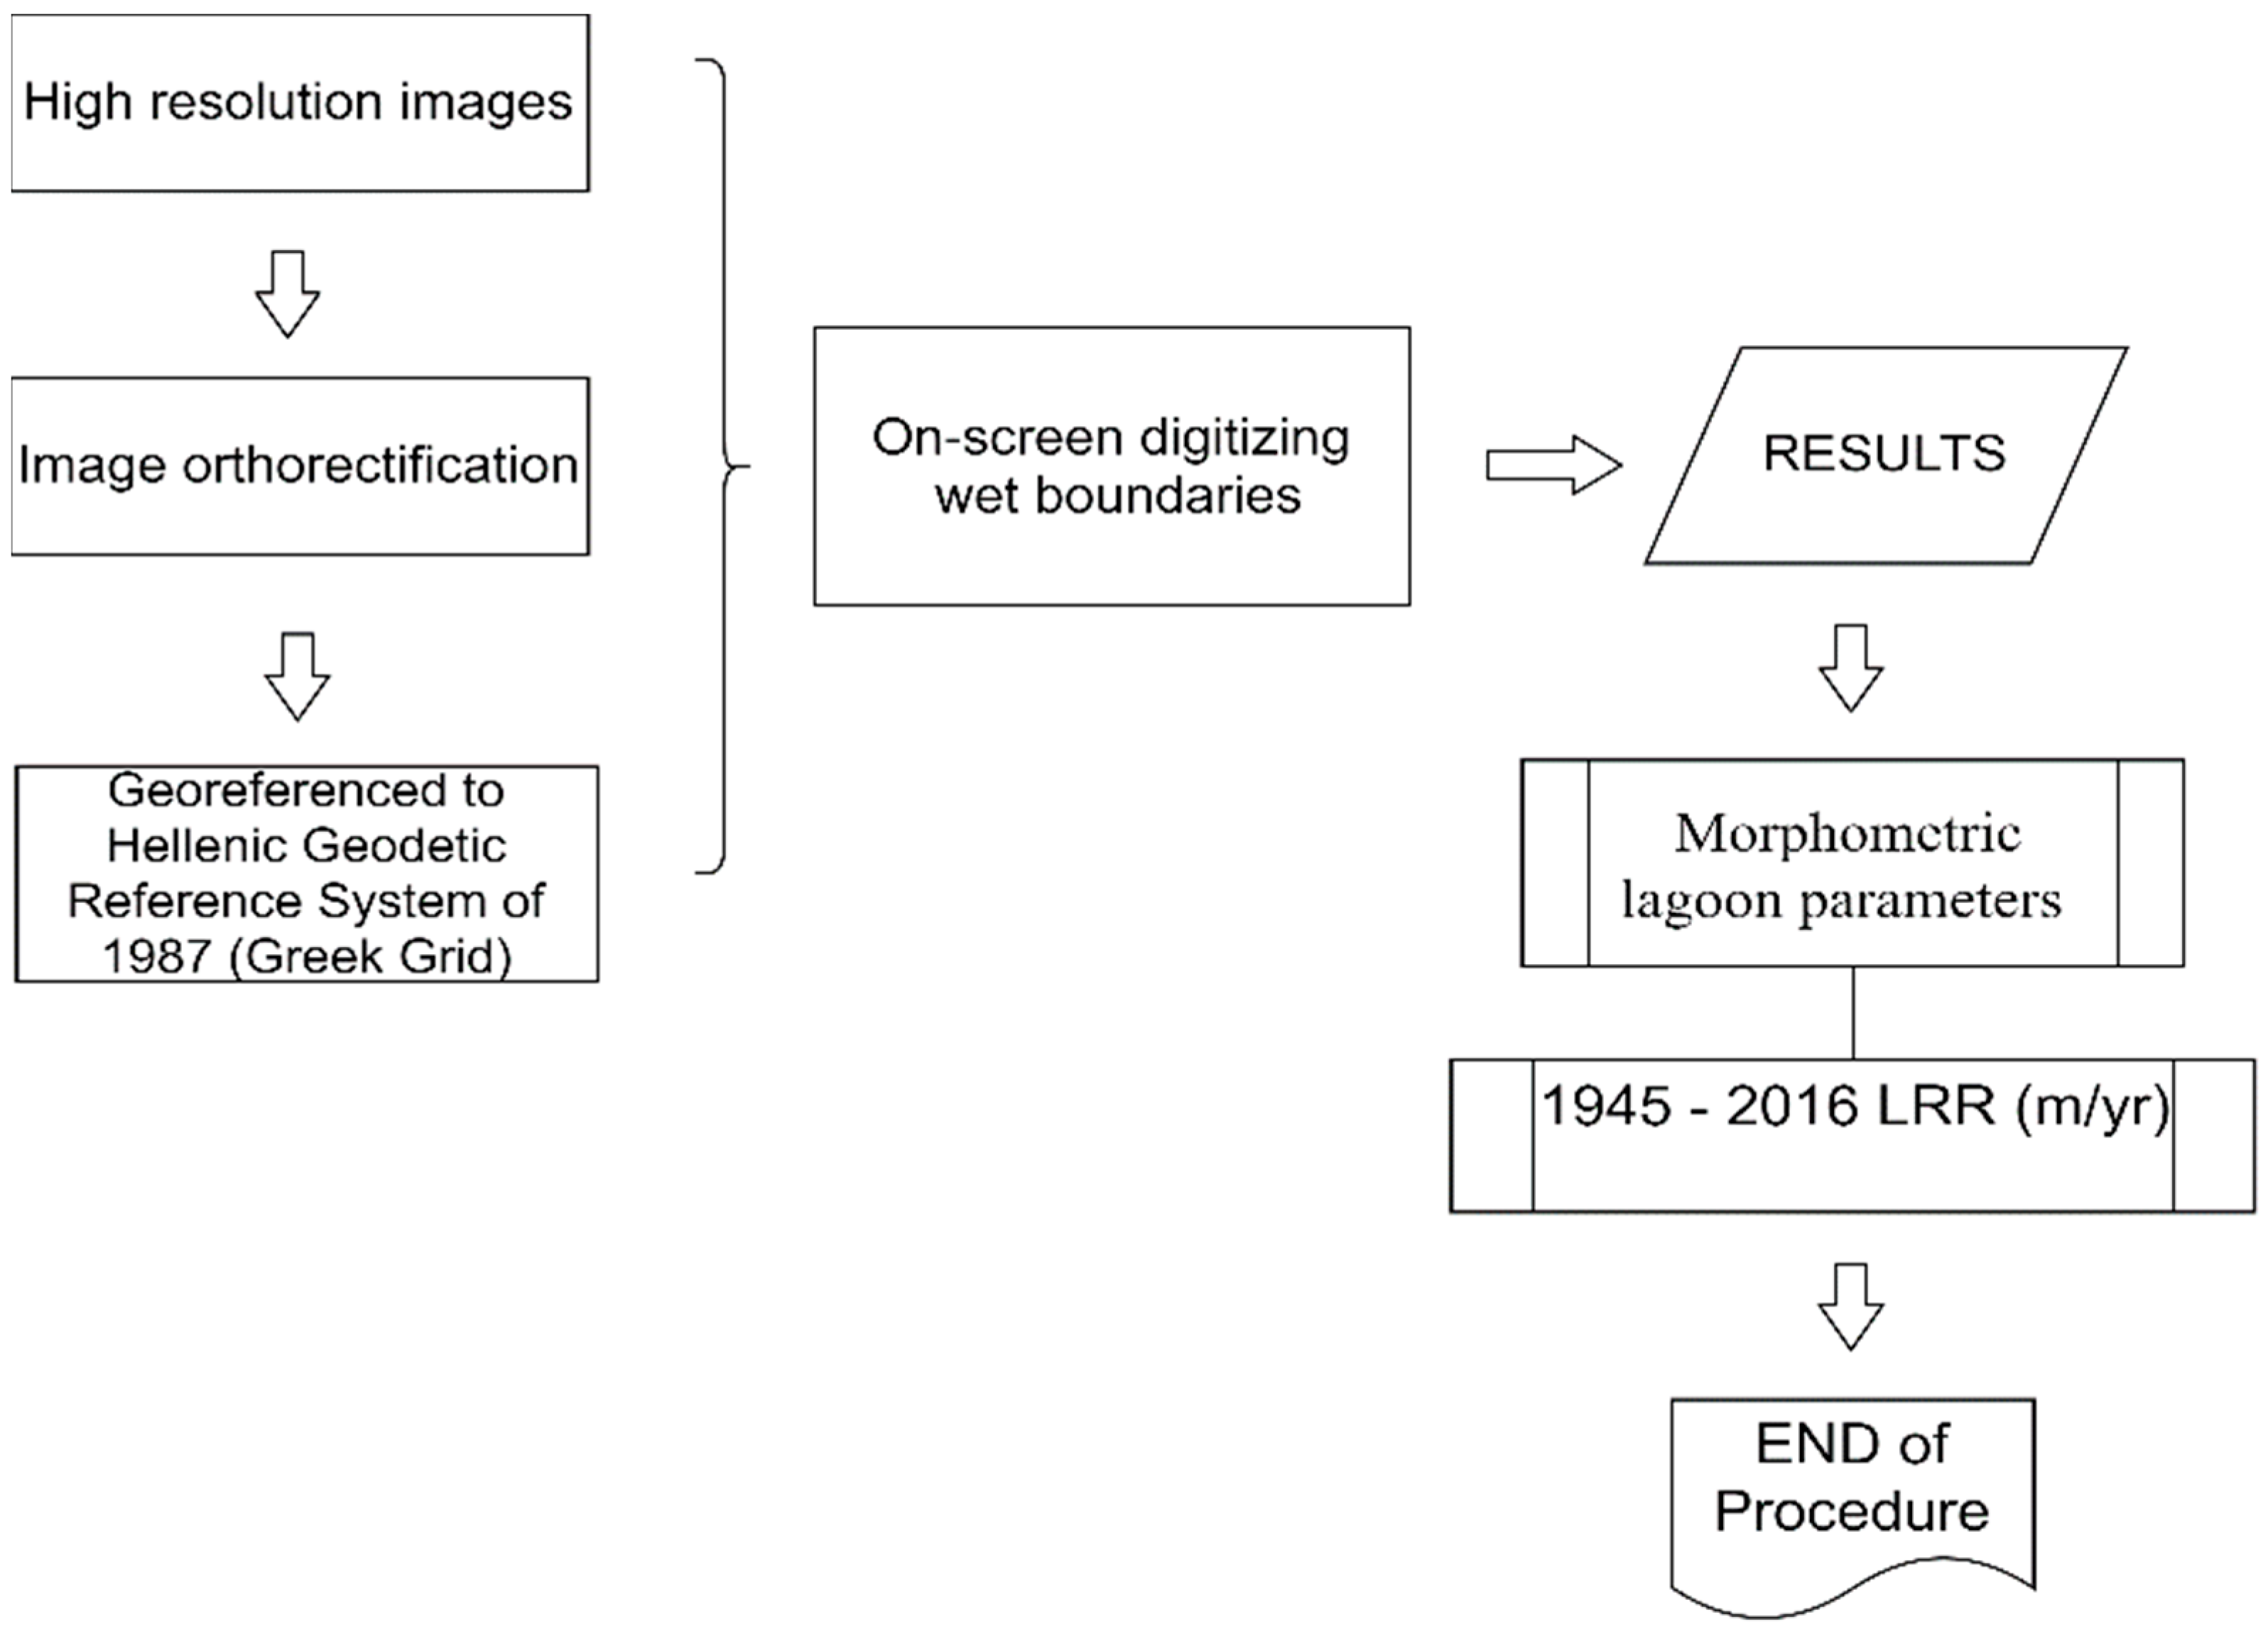
2.2. Remote Sensing Surveys

2.2.1. Materials

In the present study, different high-resolution datasets, such as high-resolution Greek official orthomosaics, aerial photos, satellite, and CORONA declassified images, with spatial resolutions ranging from 0.25 to 5 m, were combined and processed. All of the images showed 0% cloud cover over the study area and were used to digitize the polygons of the lagoon’s water surface. Official orthomosaic datasets from 1945, 2008, and 2016 with spatial resolutions of 1.0, 0.5, and 0.25 m, respectively, were the most accurate datasets for the Greek territory and were acquired through the National Greek Cadastre and Mapping Agency. We did not process these datasets any further. For the years 1960 and 1987, analogue aerial photographs at 1:30,000 scale with 60% along track overlap were accessed through the Hellenic Military Geographical Service (HMGS). For the year 2000, a panchromatic scene of the Indian Remote Sensing satellite (IRS) with a spatial resolution of 5 m was used. Finally, CORONA declassified images from 1965, 1968, and 1975 were freely downloaded from the United States Geological Survey (USGS) through the Global Visualization Viewer (GLOVIS) site (http://earthexplorer.usgs.gov/, accessed on 13 January 2023). ERDAS IMAGINE Leica Photogrammetry Suite (LPS) software was used to process the images, ArcGIS 10.8 software was used for vector generation, editing, and map composition, and DSAS v5.0 software was used for statistical analysis [31]. The DSAS functionalities were described in detail in a previous study [32]. All datasets used in the current study are presented in Table 1.

2.2.2. Quantitative Morphometric Parameter Estimation

We developed two models for controlling the evolution of the water surface of the Kotychi Lagoon. The first model concerned the multitemporal calculation of several morphodynamical parameters from 1945 to 2016 related to the geometrical characteristics, such as the perimeter, water surface, and diameter (min and max), as well as the landscape changes in the lagoon’s boundaries, such as the restriction ratio (Pr), orientation or anisotropy parameter (Por), shore development parameter (Ds), and number of inlets or channels (CMAR) (Table 2). The interpretation of these morphodynamical parameters were described in detail in a previous study [6] and are not repeated in the current paper.
We manually digitized the lagoon’s boundaries (on-screen method) for the years 1945, 1960, 1968, 1975, 1987, 1996, 2000, 2008, and 2016 in a geographic information system (G.I.S.) environment, using the wetted boundaries that were visible in the images. Then, the quantitative morphometric parameters describing the lagoon’s orientation and structure were determined and compared for each year.

2.2.3. Estimating Changes in the Kotychi Lagoon Coastal Zone

The second model concerned the estimation of the lagoon’s shoreline change during the same period (1945–2016) using the LRR statistical rates provided by the DSAS plug-in. The LRR was calculated including all the available datasets and determined by fitting a least square regression line from all shoreline positions along each transect. The inclination of the line was the linear regression rate [31]. The method had the potential to use more than two shorelines and thus overlap the disadvantages of the end point rates (EPR) [33].
Shoreline vectors were imported in a geodatabase created in the ArcGIS platform, following DSAS v5.0 requirements such as acquisition date, identity, shape, length, and uncertainty. A baseline divided into parts as the shoreline change rates were significantly different in several segments of the lagoon’s boundaries, thus LRR values were computed separately for each sector. Furthermore, transects were set every 1 m along the baseline and the LRR values (m/year) were estimated. Rates between −0.10 and +0.10 m/year were considered as no change in the coast. The tidal range was approximately 10–15 cm while the average depth was only 0.5 m [22], corresponding to a lagoon with a low beach slope. Thus, these factors did not affect the results provided by the DSAS. The overall workflow is presented in Figure 2.

2.2.4. Uncertainty Considerations

Georeferencing, digitizing, pixel, and sea level fluctuation errors are associated with the rate of the uncertainty of the shoreline position [34]. Orthomosaics and satellite images with spatial resolutions ranging from 0.25 to 5.00 m were used, while the georeferencing error for the aerial photographs and satellite images was calculated lower than 0.5 pixel. Moreover, we set the predetermined confidence level percentage provided by the DSAS for linear regression (LCI) at 90%, while the mean LCI value was assigned as a confidence band around the reported LRR values.

2.3. Physicochemical and Ecological Parameters

2.3.1. Sampling

Field sampling was performed in Kotychi Lagoon during three seasons in 2021 (2 April, 25 August, and 12 November); no samples could be collected in the winter season due to repetitive storm events that caused the sandy barrier to break and made access to the lagoon impossible. Twelve sampling stations in the lagoon were surveyed; however, not all of them were accessible during all seasons due to low water levels. At each station, depth was measured using an electronic hand-held depth meter and water transparency was measured using a Secchi disk. Physicochemical parameters of the water column (temperature, salinity, pH, and dissolved oxygen) were measured using a Hach-Lange HQ40D portable sonde. Water samples were collected by hand from the surface layer of the water column and stored in a portable cooler until their arrival at the laboratory. A surface sediment sample for granulometric and geochemical analyses was collected with a Van-Veen grab with a surface of 0.025 m2 and a separate sediment sample was collected for analysis of the macrobenthic invertebrates. The sediment for macrobenthic analysis was passed through a sieve with a 0.5 mm mesh size, preserved in 4% buffered formalin, and stained with Rose Bengal.

2.3.2. Analysis of Water Samples

Water samples were analysed for total organic carbon (TOC) and total nitrogen using a Shimadzu TOC-VCSH TOC/TN analyzer coupled to a chemiluminescence detector (TNM-1 TN unit). This created a simultaneous analysis system using oxidative combustion-infrared analysis based on DIN EN 15936 for TOC [35] and an oxidative combustion-chemiluminescence method based on ASTM D5176 for TN. Phosphates were determined following the Standard Methods protocol [36]. Concentrations of nitrates, nitrites, and ammonium were analyzed with cuvette tests (nitrates: Hach-Lange LCK 339, 0.23–13.50 mg/L NO3-N; nitrites: LCK 341 0.015–0.6 mg/L NO2-N; ammonium: LCK 304, 0.015–2.0 mg/L NH4-N).

2.3.3. Analysis of Sediment Samples

Grain size determination was performed using a Malvern Mastersizer 2000 Hydro (Laser Analysis), as all samples were fine sediments (silt and clay). TOC and TN contents of the sediment were calculated using the catalytic oxidation method for the simultaneous determination of total organic carbon and total nitrogen [37,38] and total phosphorus (TP) according to ref. [36].

2.3.4. Determination of Ecological Quality

Macrobenthic samples were transferred to a series of water baths to remove the formalin solution. Organisms were removed by hand from sediment residues under a stereomicroscope, transferred to 70% ethanol, and subsequently identified to the lowest possible taxonomic level. For identification, the most recent taxonomic literature was used and taxon names were standardized with the World Register of Marine Species [39]. To assess the ecological status of the lagoon, the following indices were calculated per sample: number of species (S), number of individuals m−1, Shannon-Wiener index (with log2 base), Pielou’s index of evenness, and the M-AMBI index [40]. For the latter, the following reference values were used for high status following the recommendations of ref. [41] for a restricted polyhaline/euhaline lagoon: AMBI: 0.05; richness: 50; and diversity: 4. The boundaries for the M-AMBI classes likewise followed the recommendations of ref. [41] and were as follows: high: >0.83; good: >0.62–0.83; moderate: >0.41–0.62; poor: 0.20–0.41; and bad: <0.20.

3. Results

3.1. Remote Sensing

Using the diachronically vectorized shorelines of the lagoon, we calculated several morphometric parameters for each year related to the geometrical characteristics and landscape orientation of the lagoon and attempted to compare them (Figure 3).

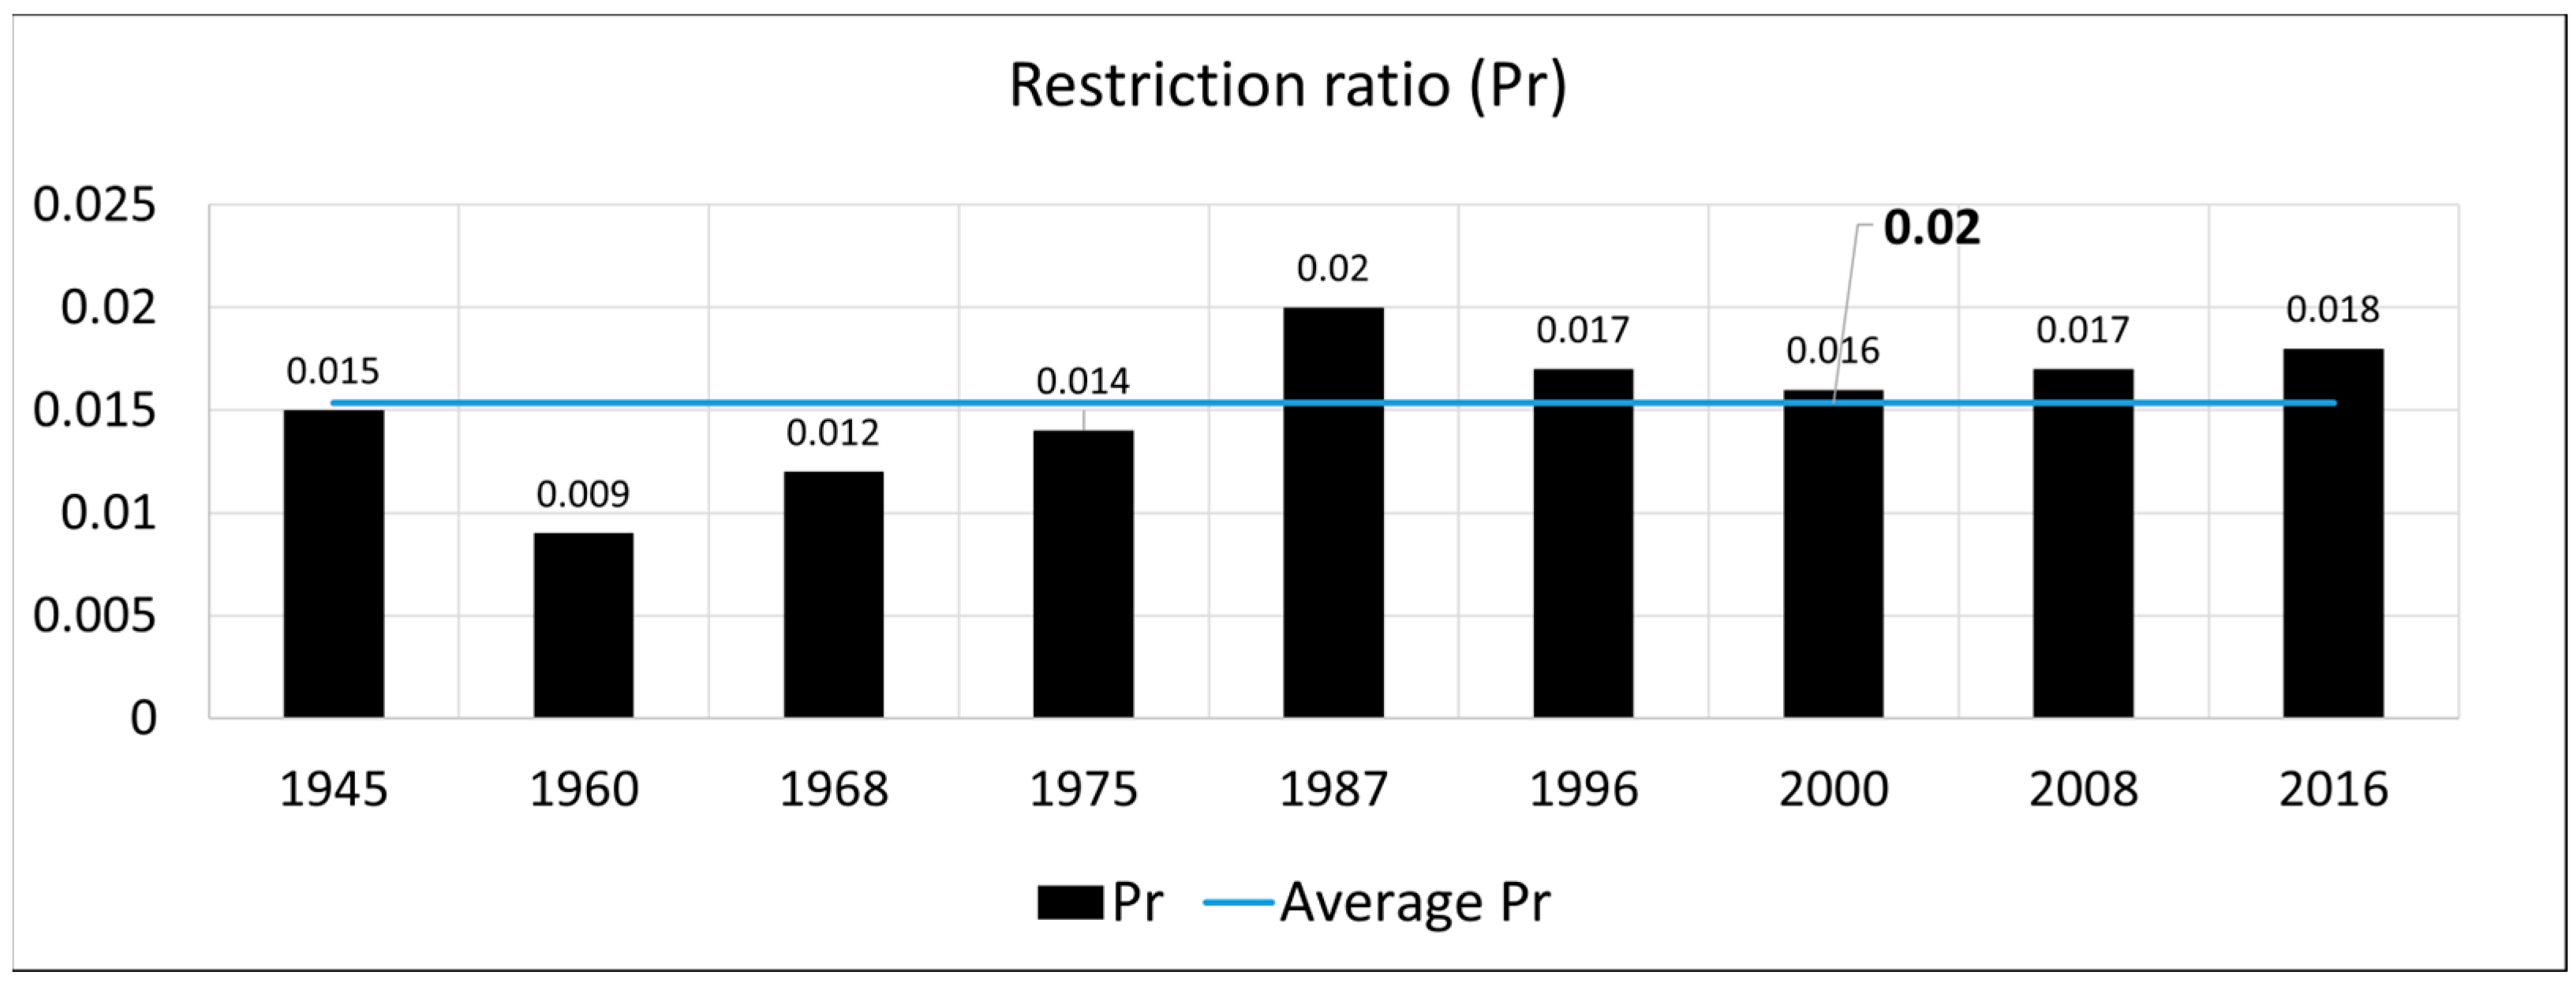
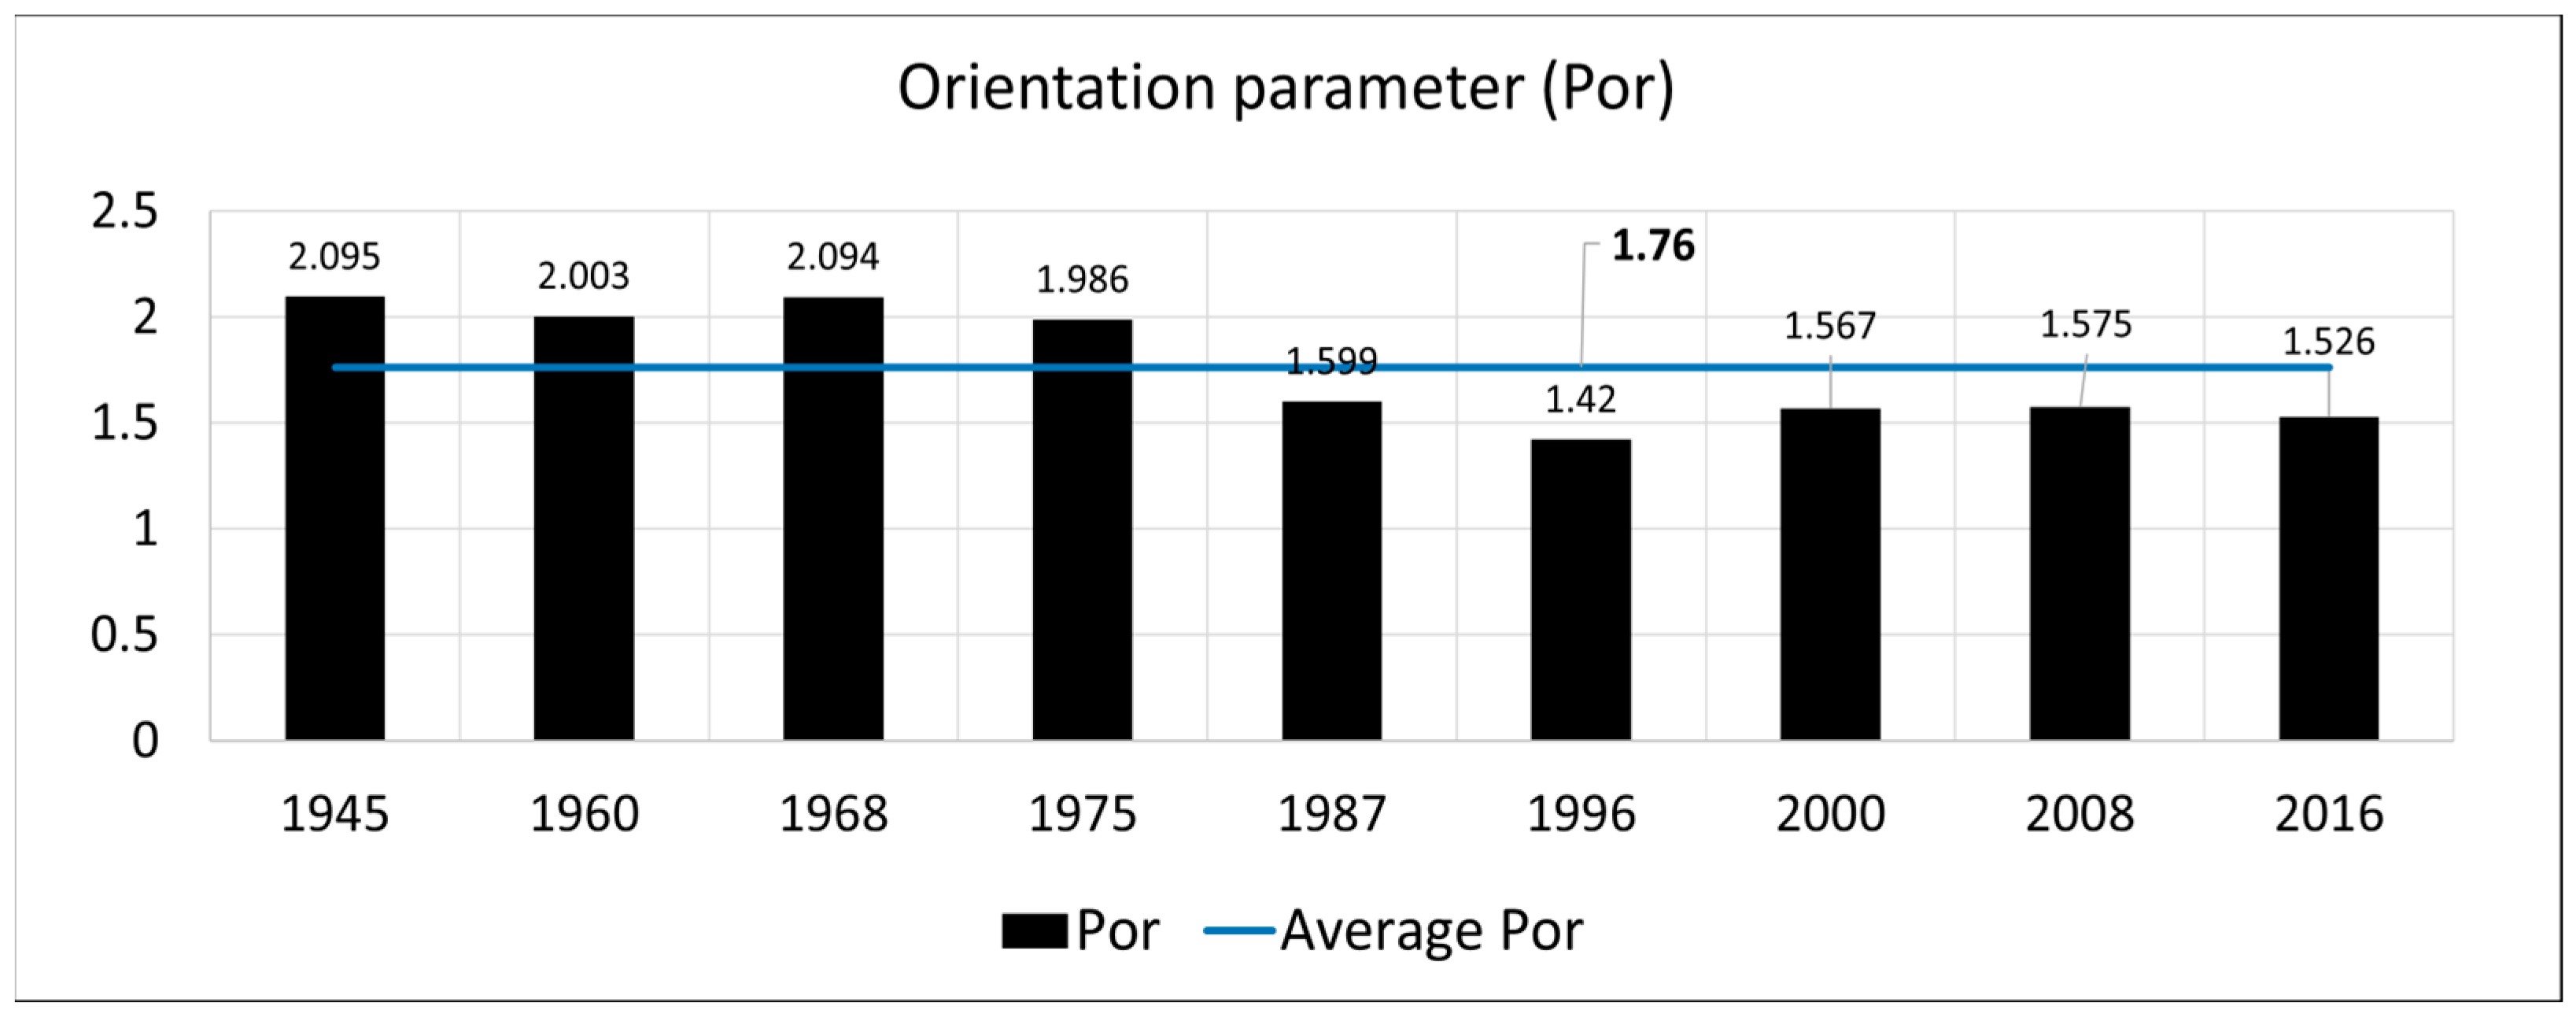
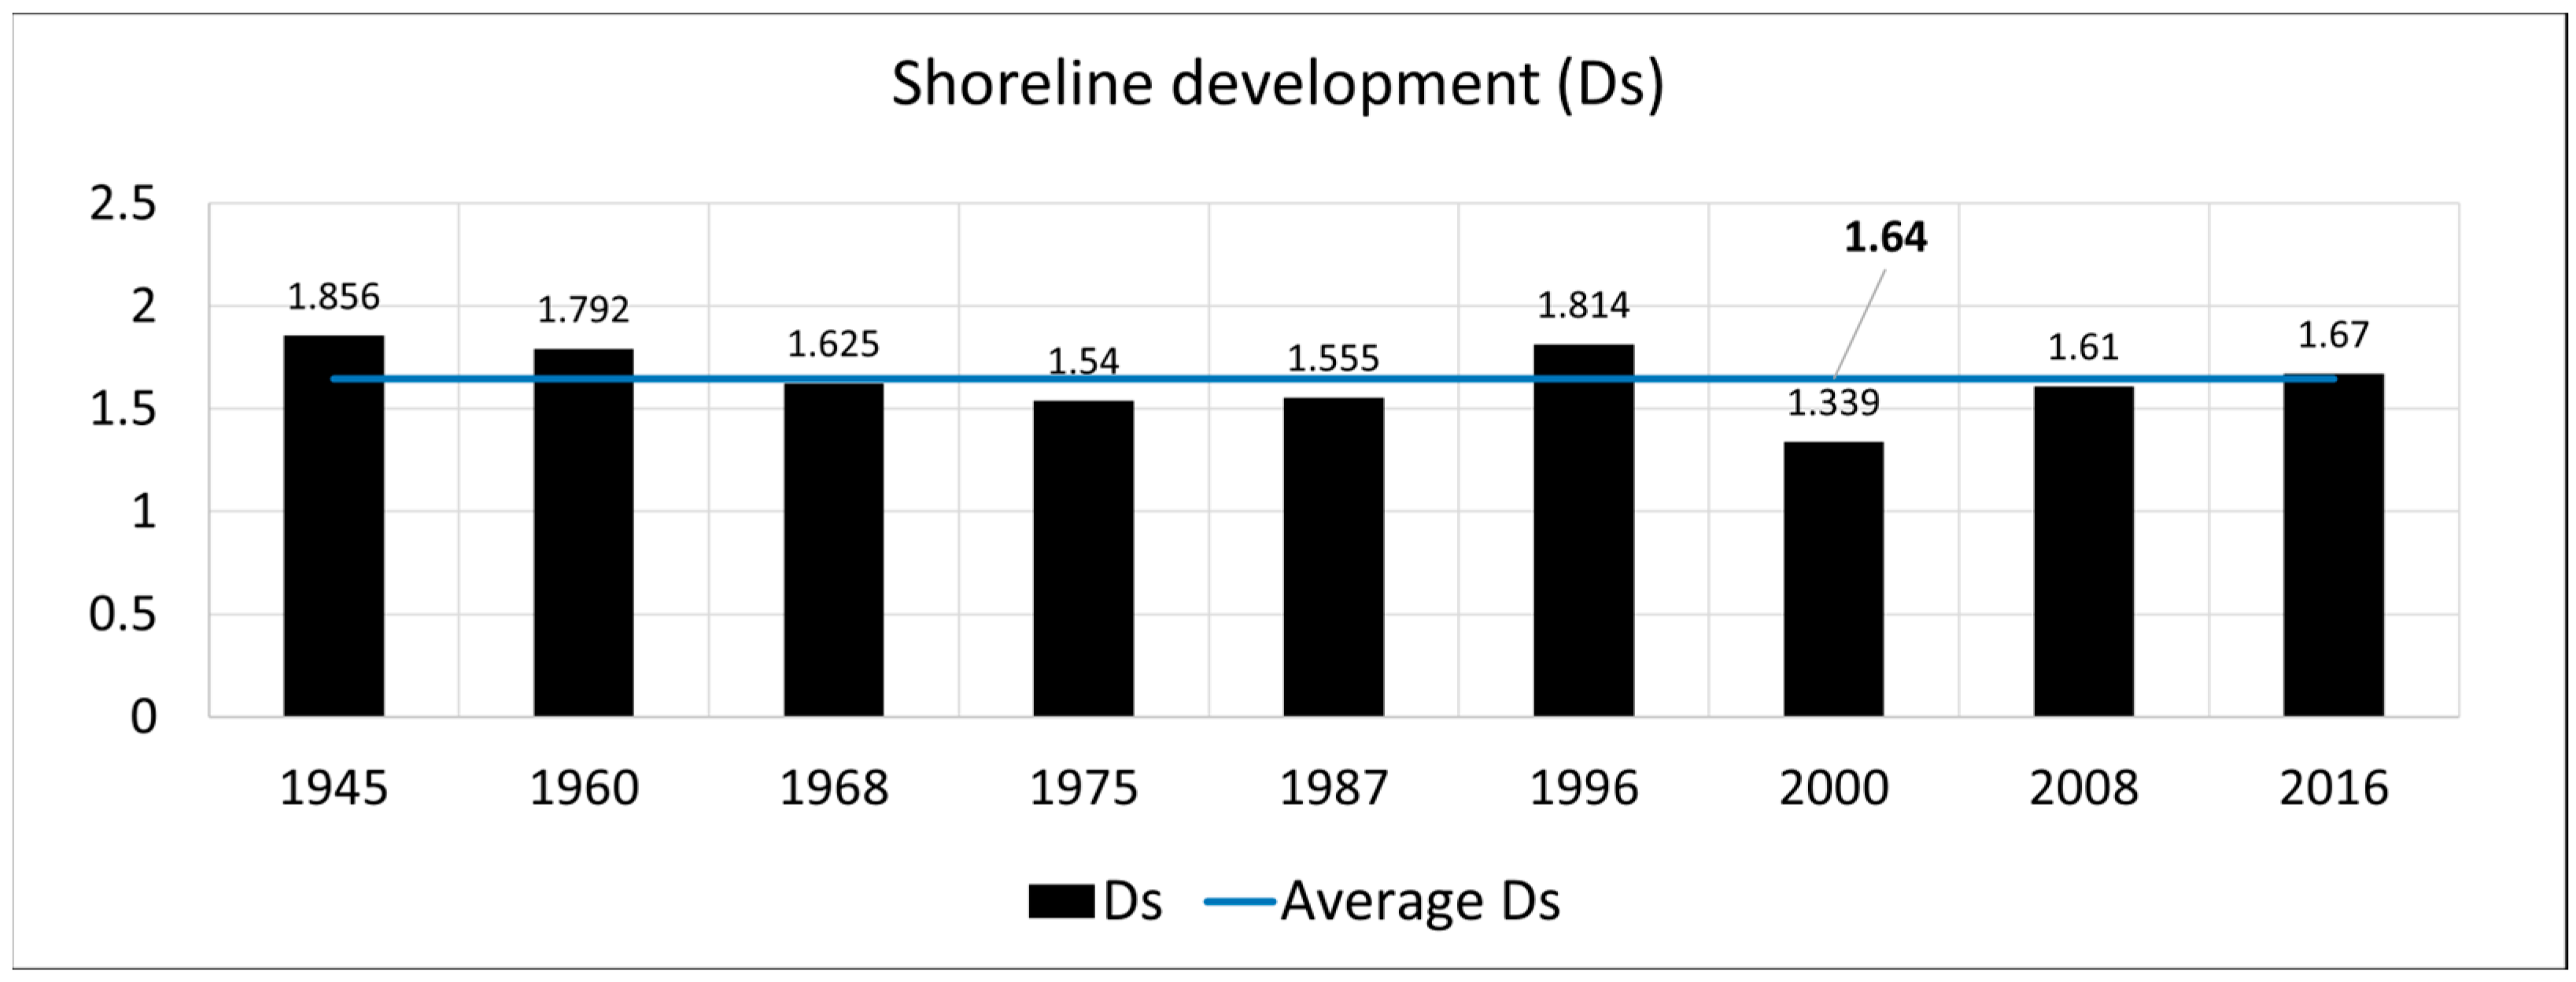
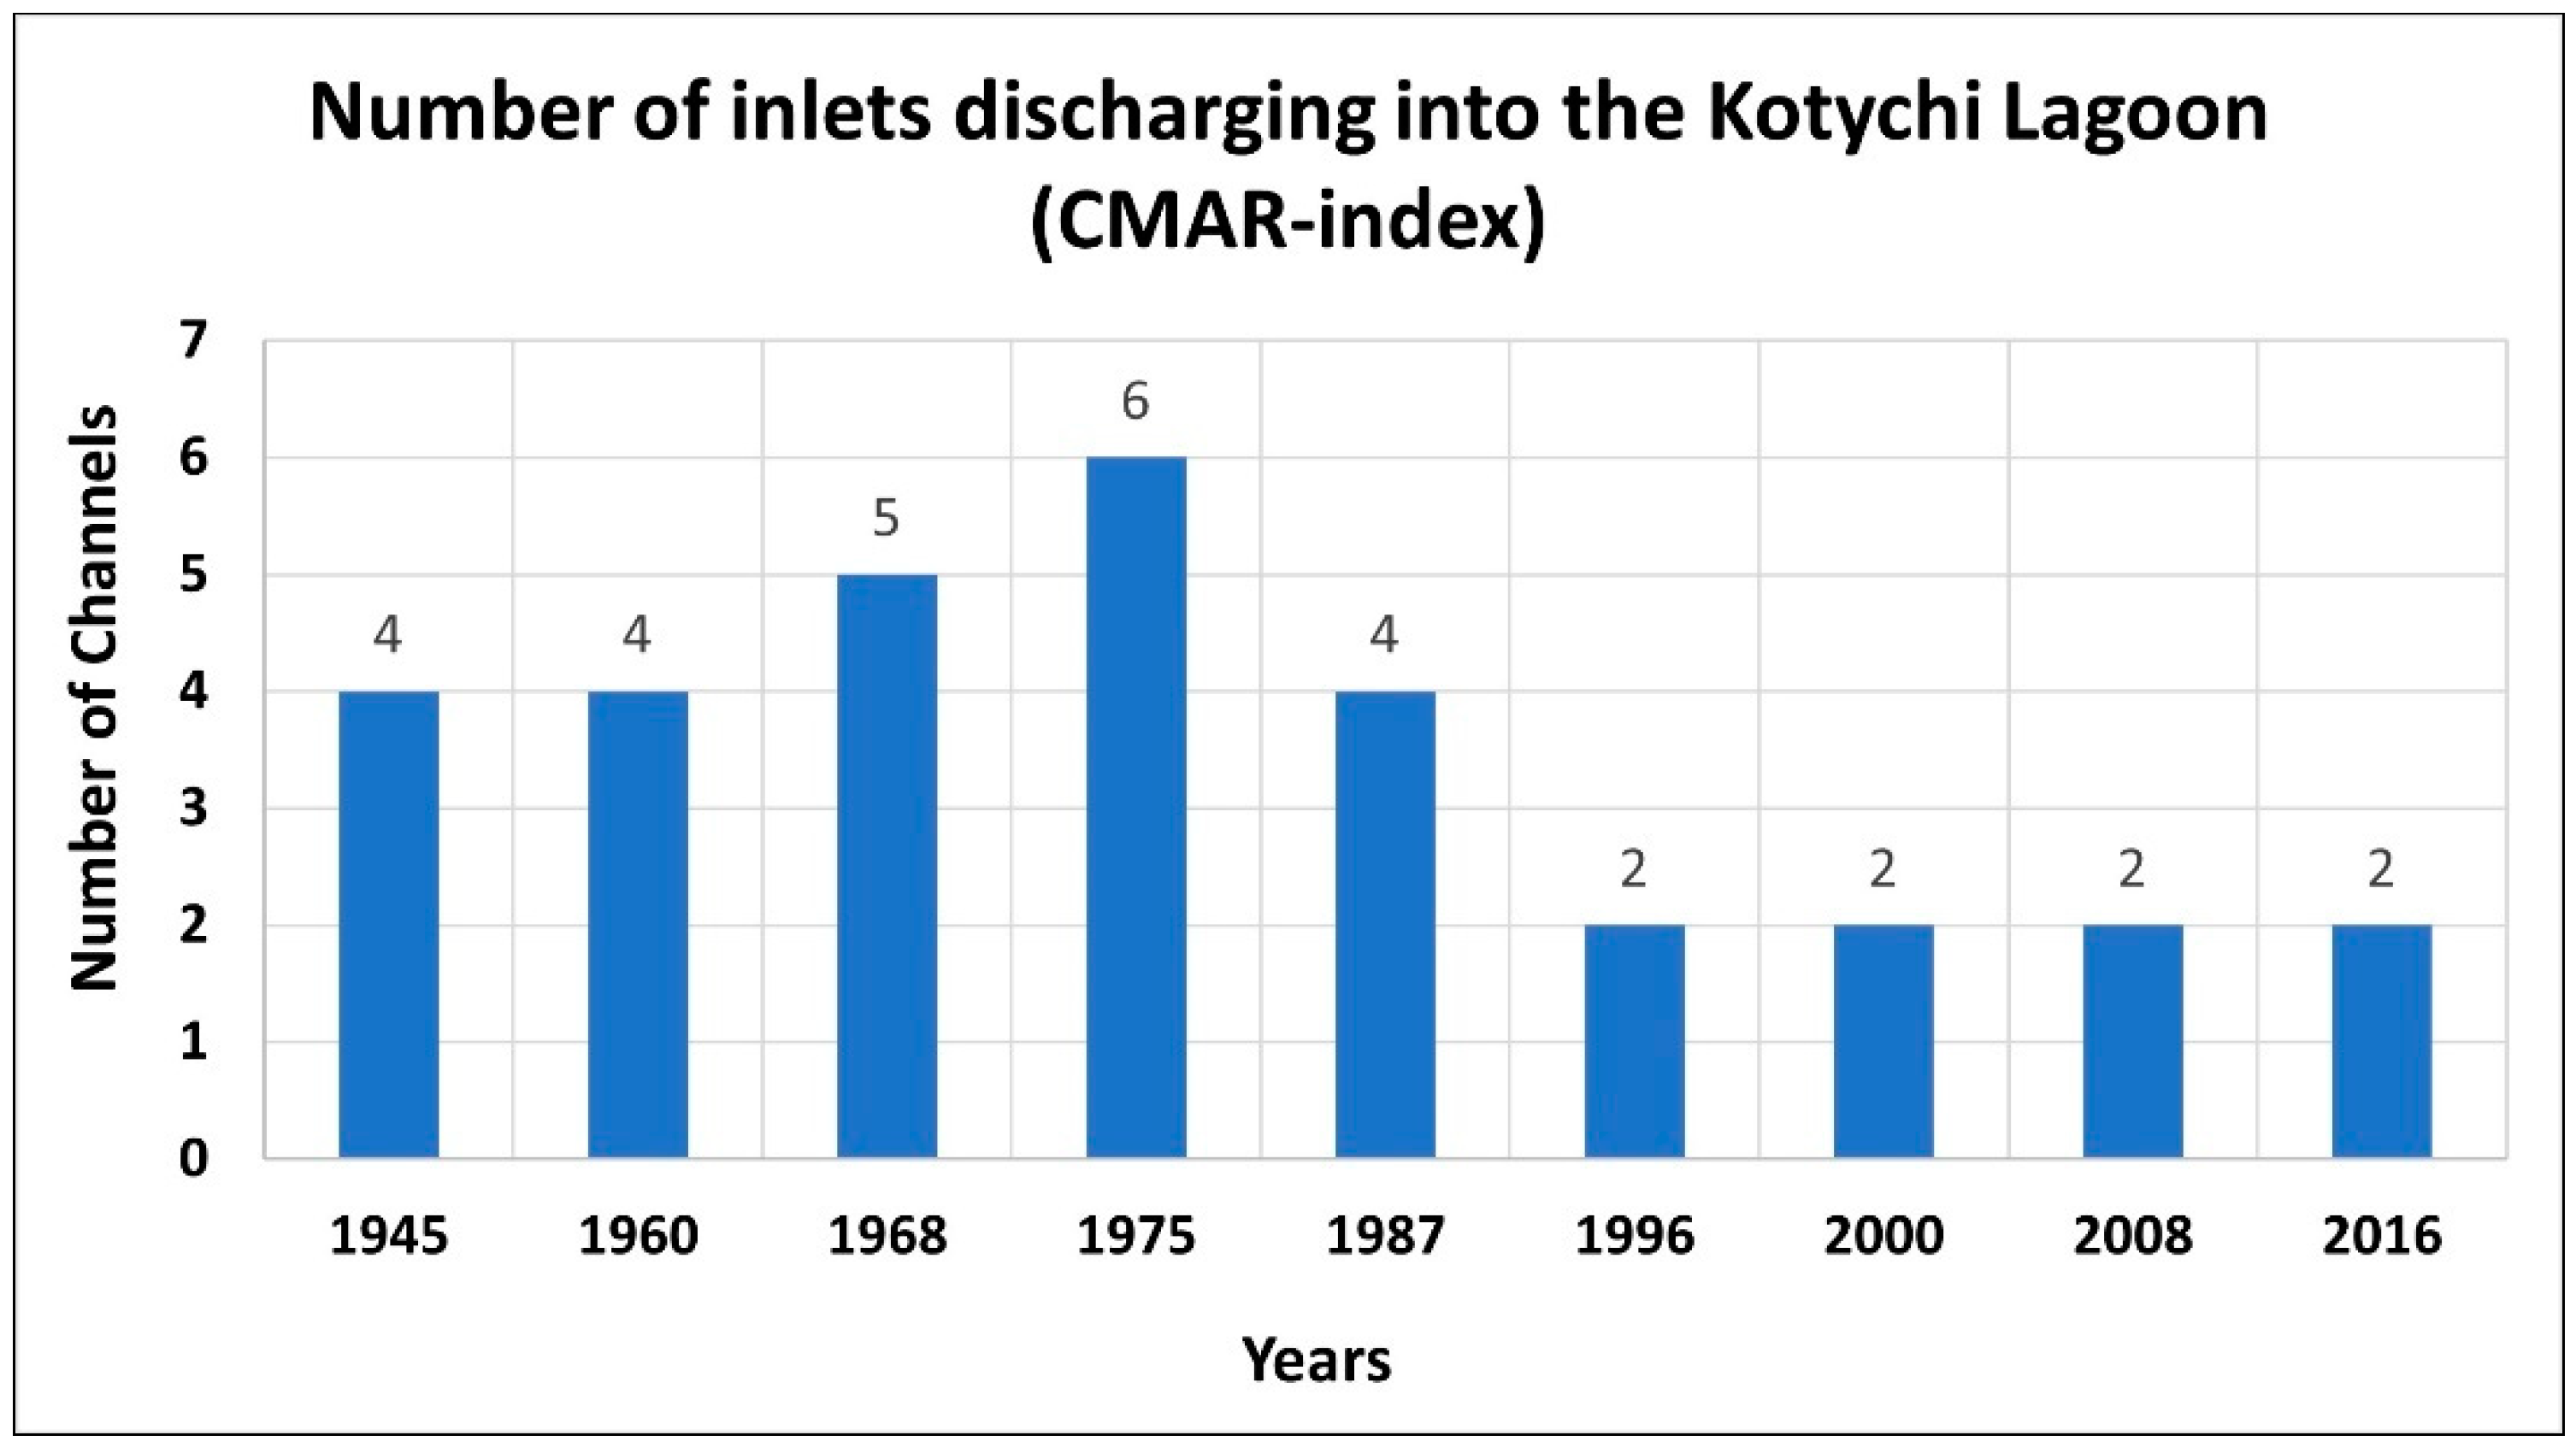
3.1.1. Estimation of Morphometric Parameters

In Figure 4, the calculated restriction ratio (Pr) values are presented. The Pr indicates if the lagoon is isolated or communicates with the sea. The Pr values ranged from 0 to 1. Values close to 0 correspond to a lagoon isolated from the open sea, while values close to 1 correspond to a lagoon that communicates with the sea [19]. For the Kotychi Lagoon, the Pr values fluctuated between 0.01 and 0.02, while the average value was 0.02, corresponding to a lagoon isolated from the sea.
The orientation parameter (Por) is related to the geometry of the lagoon. The lagoon has orthogonal dimensions if Pr ≈ 1, while it is more elongated in parallel or perpendicular to the shore direction if Por ≥ 1 or Por ≤ 1, respectively. The average Por value was 1.76, indicating that the lagoon was elongated in parallel to the shore direction (Figure 5).
In addition, the shore development parameter (Ds), which indicates the shape of the lagoon’s shoreline in comparison to the circumference of a circle with an area equivalent to that of the lagoon, had values ranging from 1.339 (min) to 1.856 (max). Ds values equal or close to 1 mean that the lagoon’s shape is closer to a circle. The mean Ds value was 1.64, corresponding to a flattened lagoon (Figure 6).
The major source of lagoonal sediments is river supply. Figure 7 shows the number of inlets (CMAR-index) diachronically discharging their water into the lagoon’s area. It is notable that only two main rivers are left to supply the lagoon with water since 1996, as the smaller channels appear to have been dammed up and turned into agricultural land.
Moreover, regarding the lagoon’s water surface area fluctuations (SLAG-index), the maximum rate was 7.55 km2 in 1945, while the minimum rate was 4.7 km2 in 2016, and the mean rate was 5.19 km2, showing that significant shrinkage had occurred during the 1945–2016 period (Figure 8). In addition, although the water surface fluctuations were close to 7.0 km2 for the 1945–1975 period, a severe redaction of the water surface had occurred since 1975, which continued until 2000. The total reduction for this period was 36%, while it seemed that the water surface area stabilized in the period 2000–2016 to a value of approximately 4.8 km2.
A similar trend in the lagoon perimeter index (DPERI) was observed in Figure 9, where the maximum value was 18.07 km in 1945, the minimum value was 10.46 km in 2000, and the mean value was 14.32 km. The statistics revealed that the perimeter length had almost stabilized to a value of approximately 12 km since 2000. The remainder of the geometrical parameters are illustrated in Table 3.
The maximum diameter of the lagoon (DMAX) ranged from 3.77 km (min) to 5.14 km (max), while the mean value was 4.30 km. The respective values corresponding to the minimum diameter of the lagoon (DMIN) were 1.25, 1.70, and 1.55 km, respectively. Finally, the perpendicular distance to the open sea coastline (DPER) ranged from 0.04 km (min) to 0.07 km (max), while the mean value was 0.05 km. The respective values of the parallel distance to the open sea coastline (DPAR) ranged from 3.54 km (min) to 4.12 km (max), while the mean value was 3.70 km.

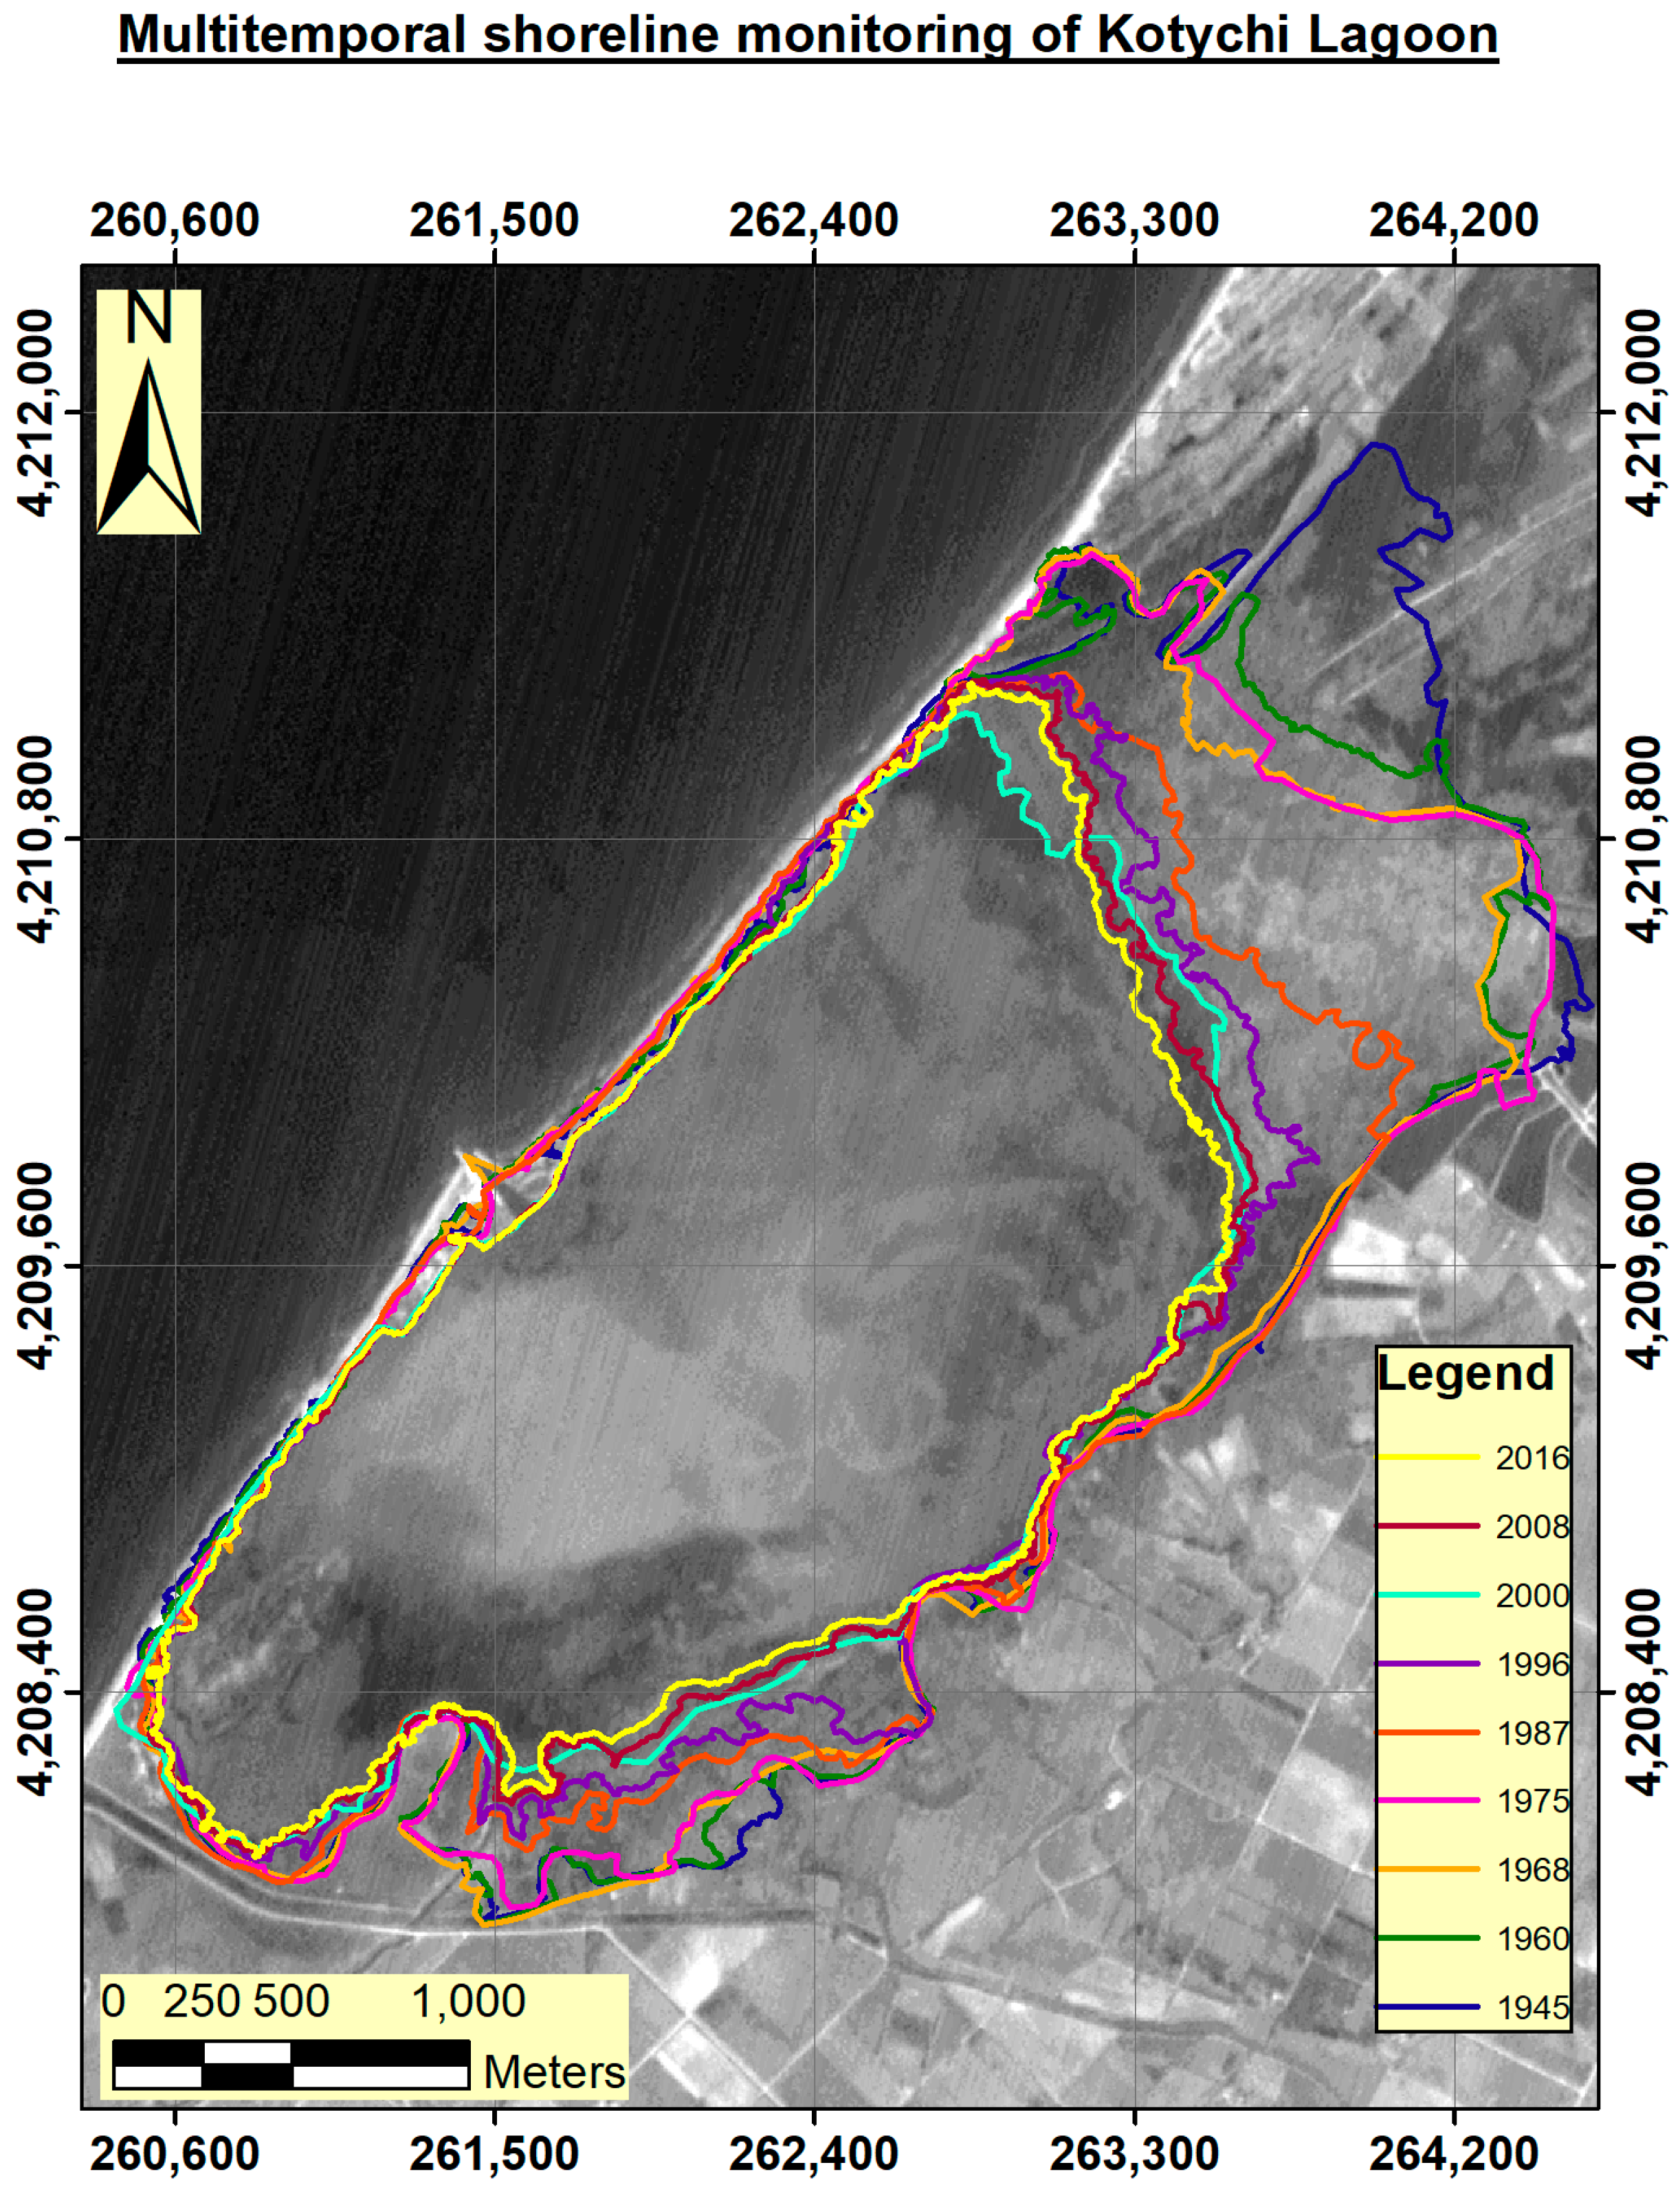
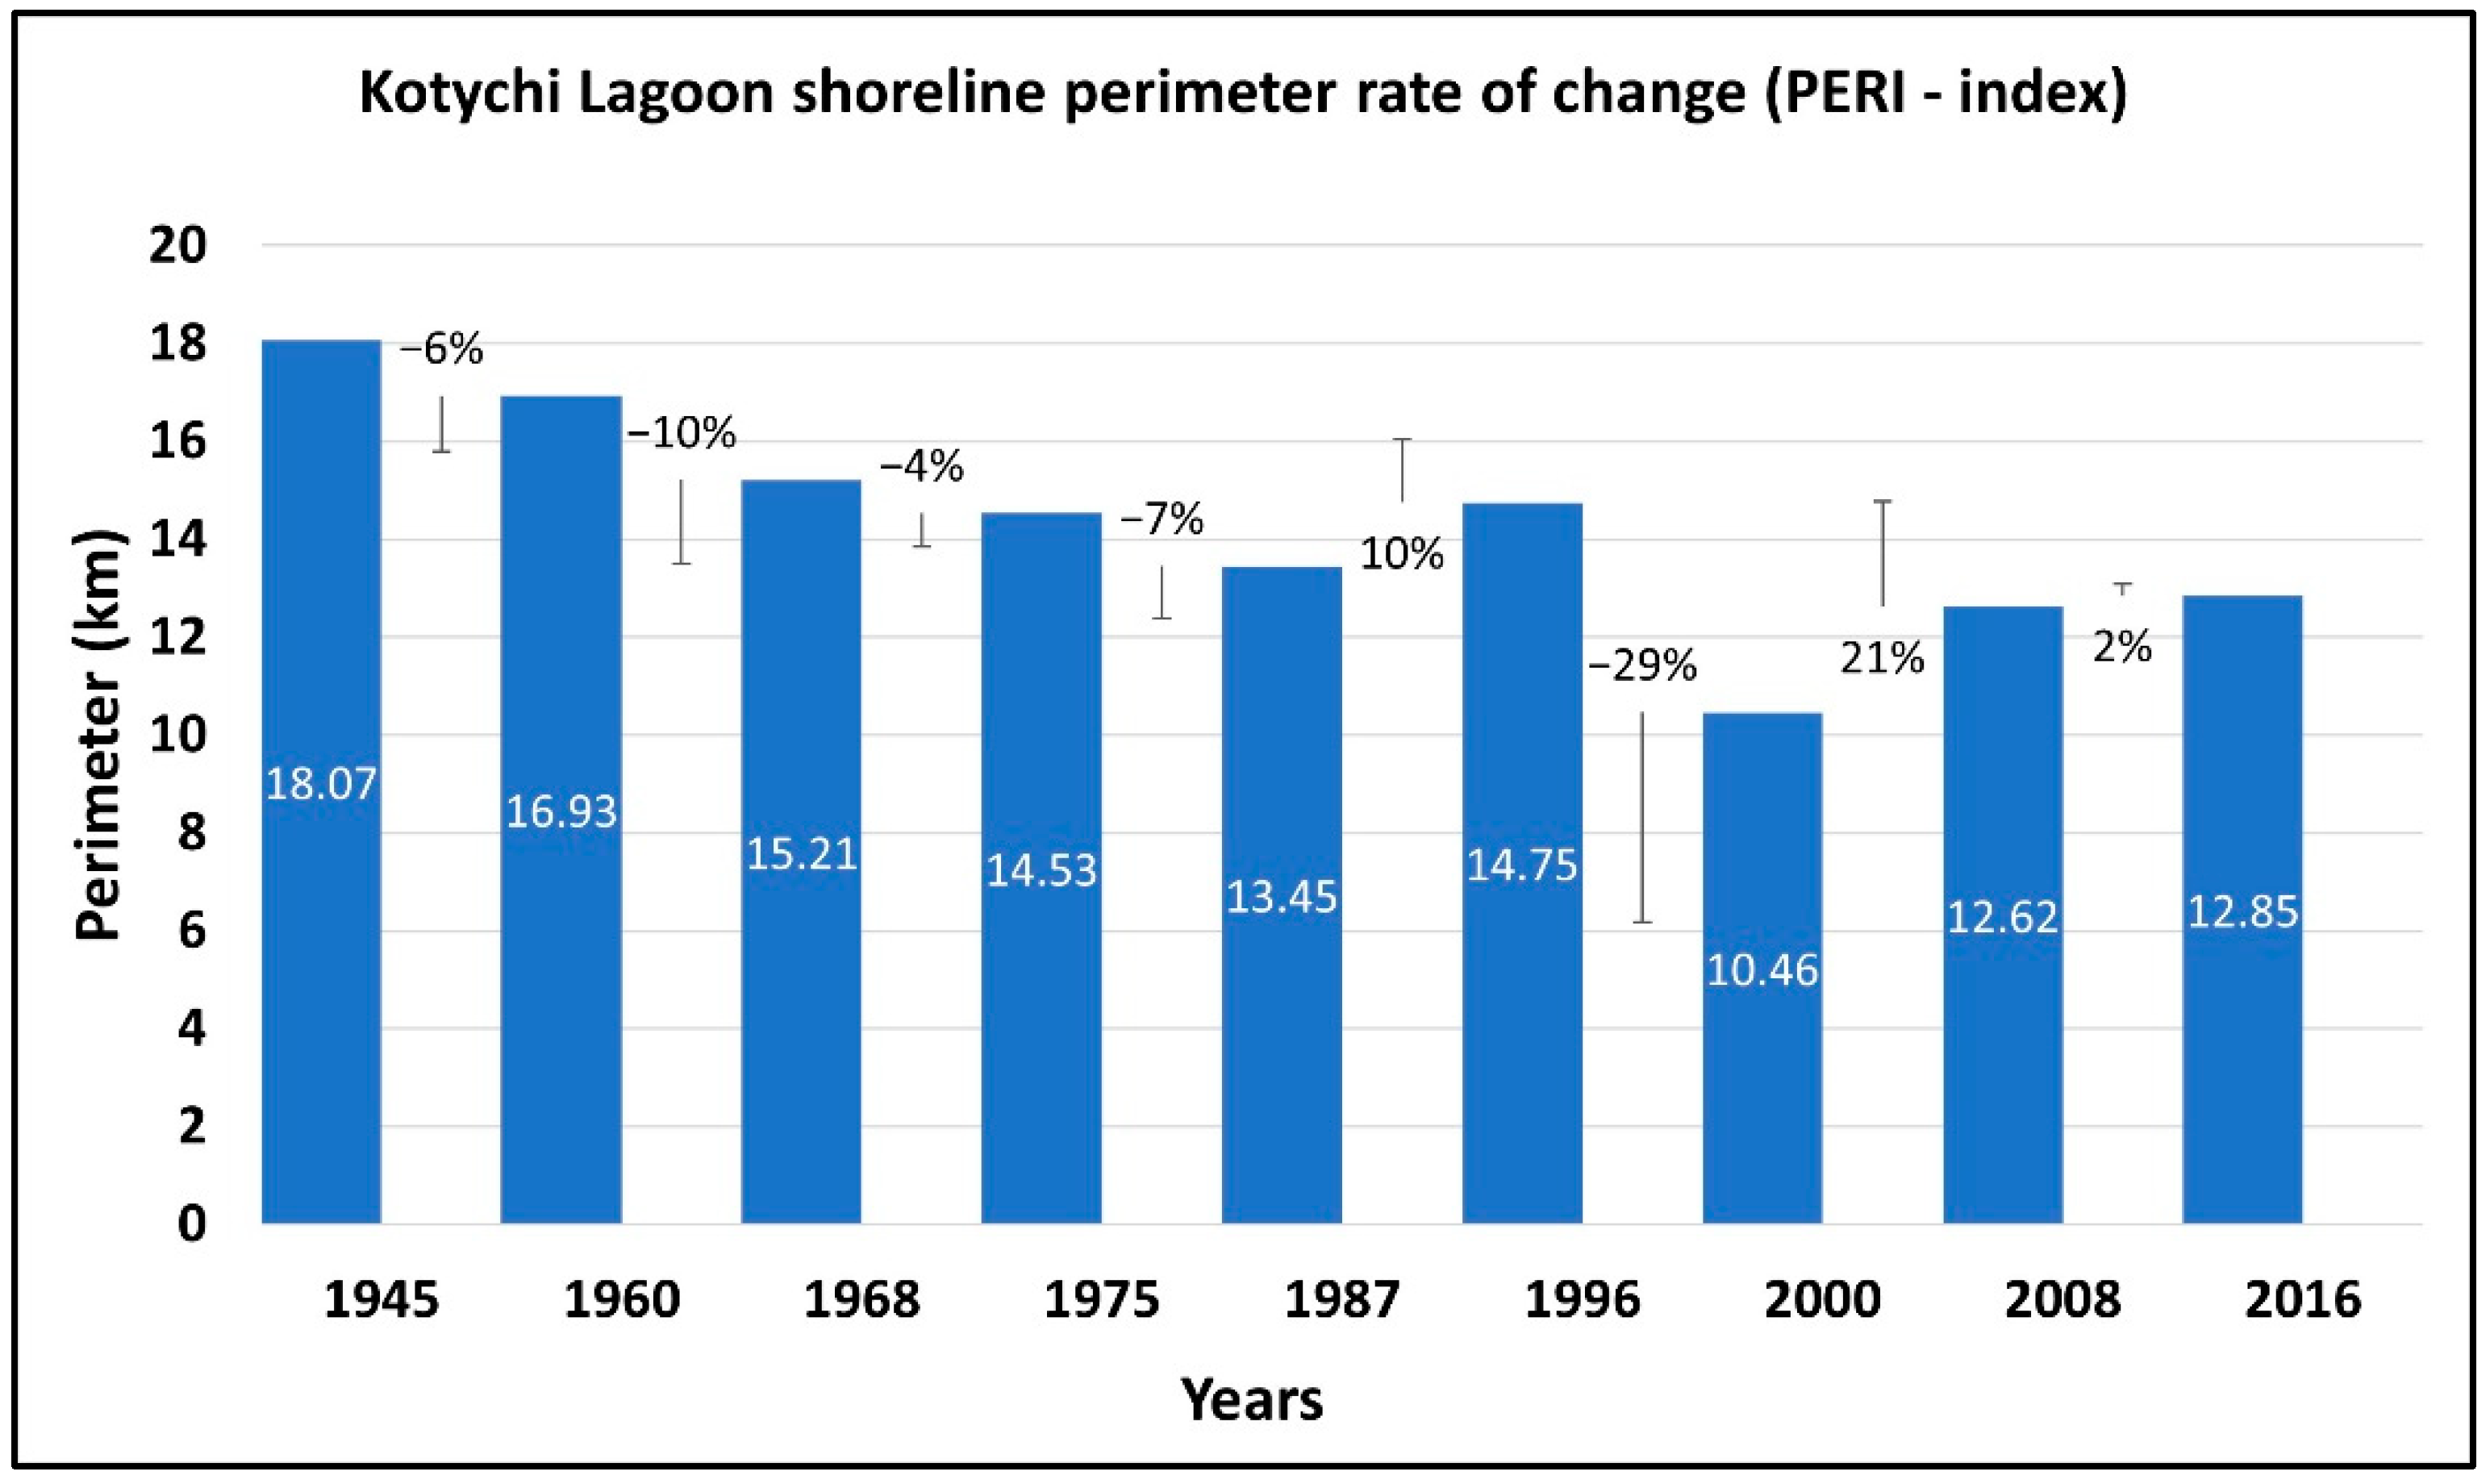
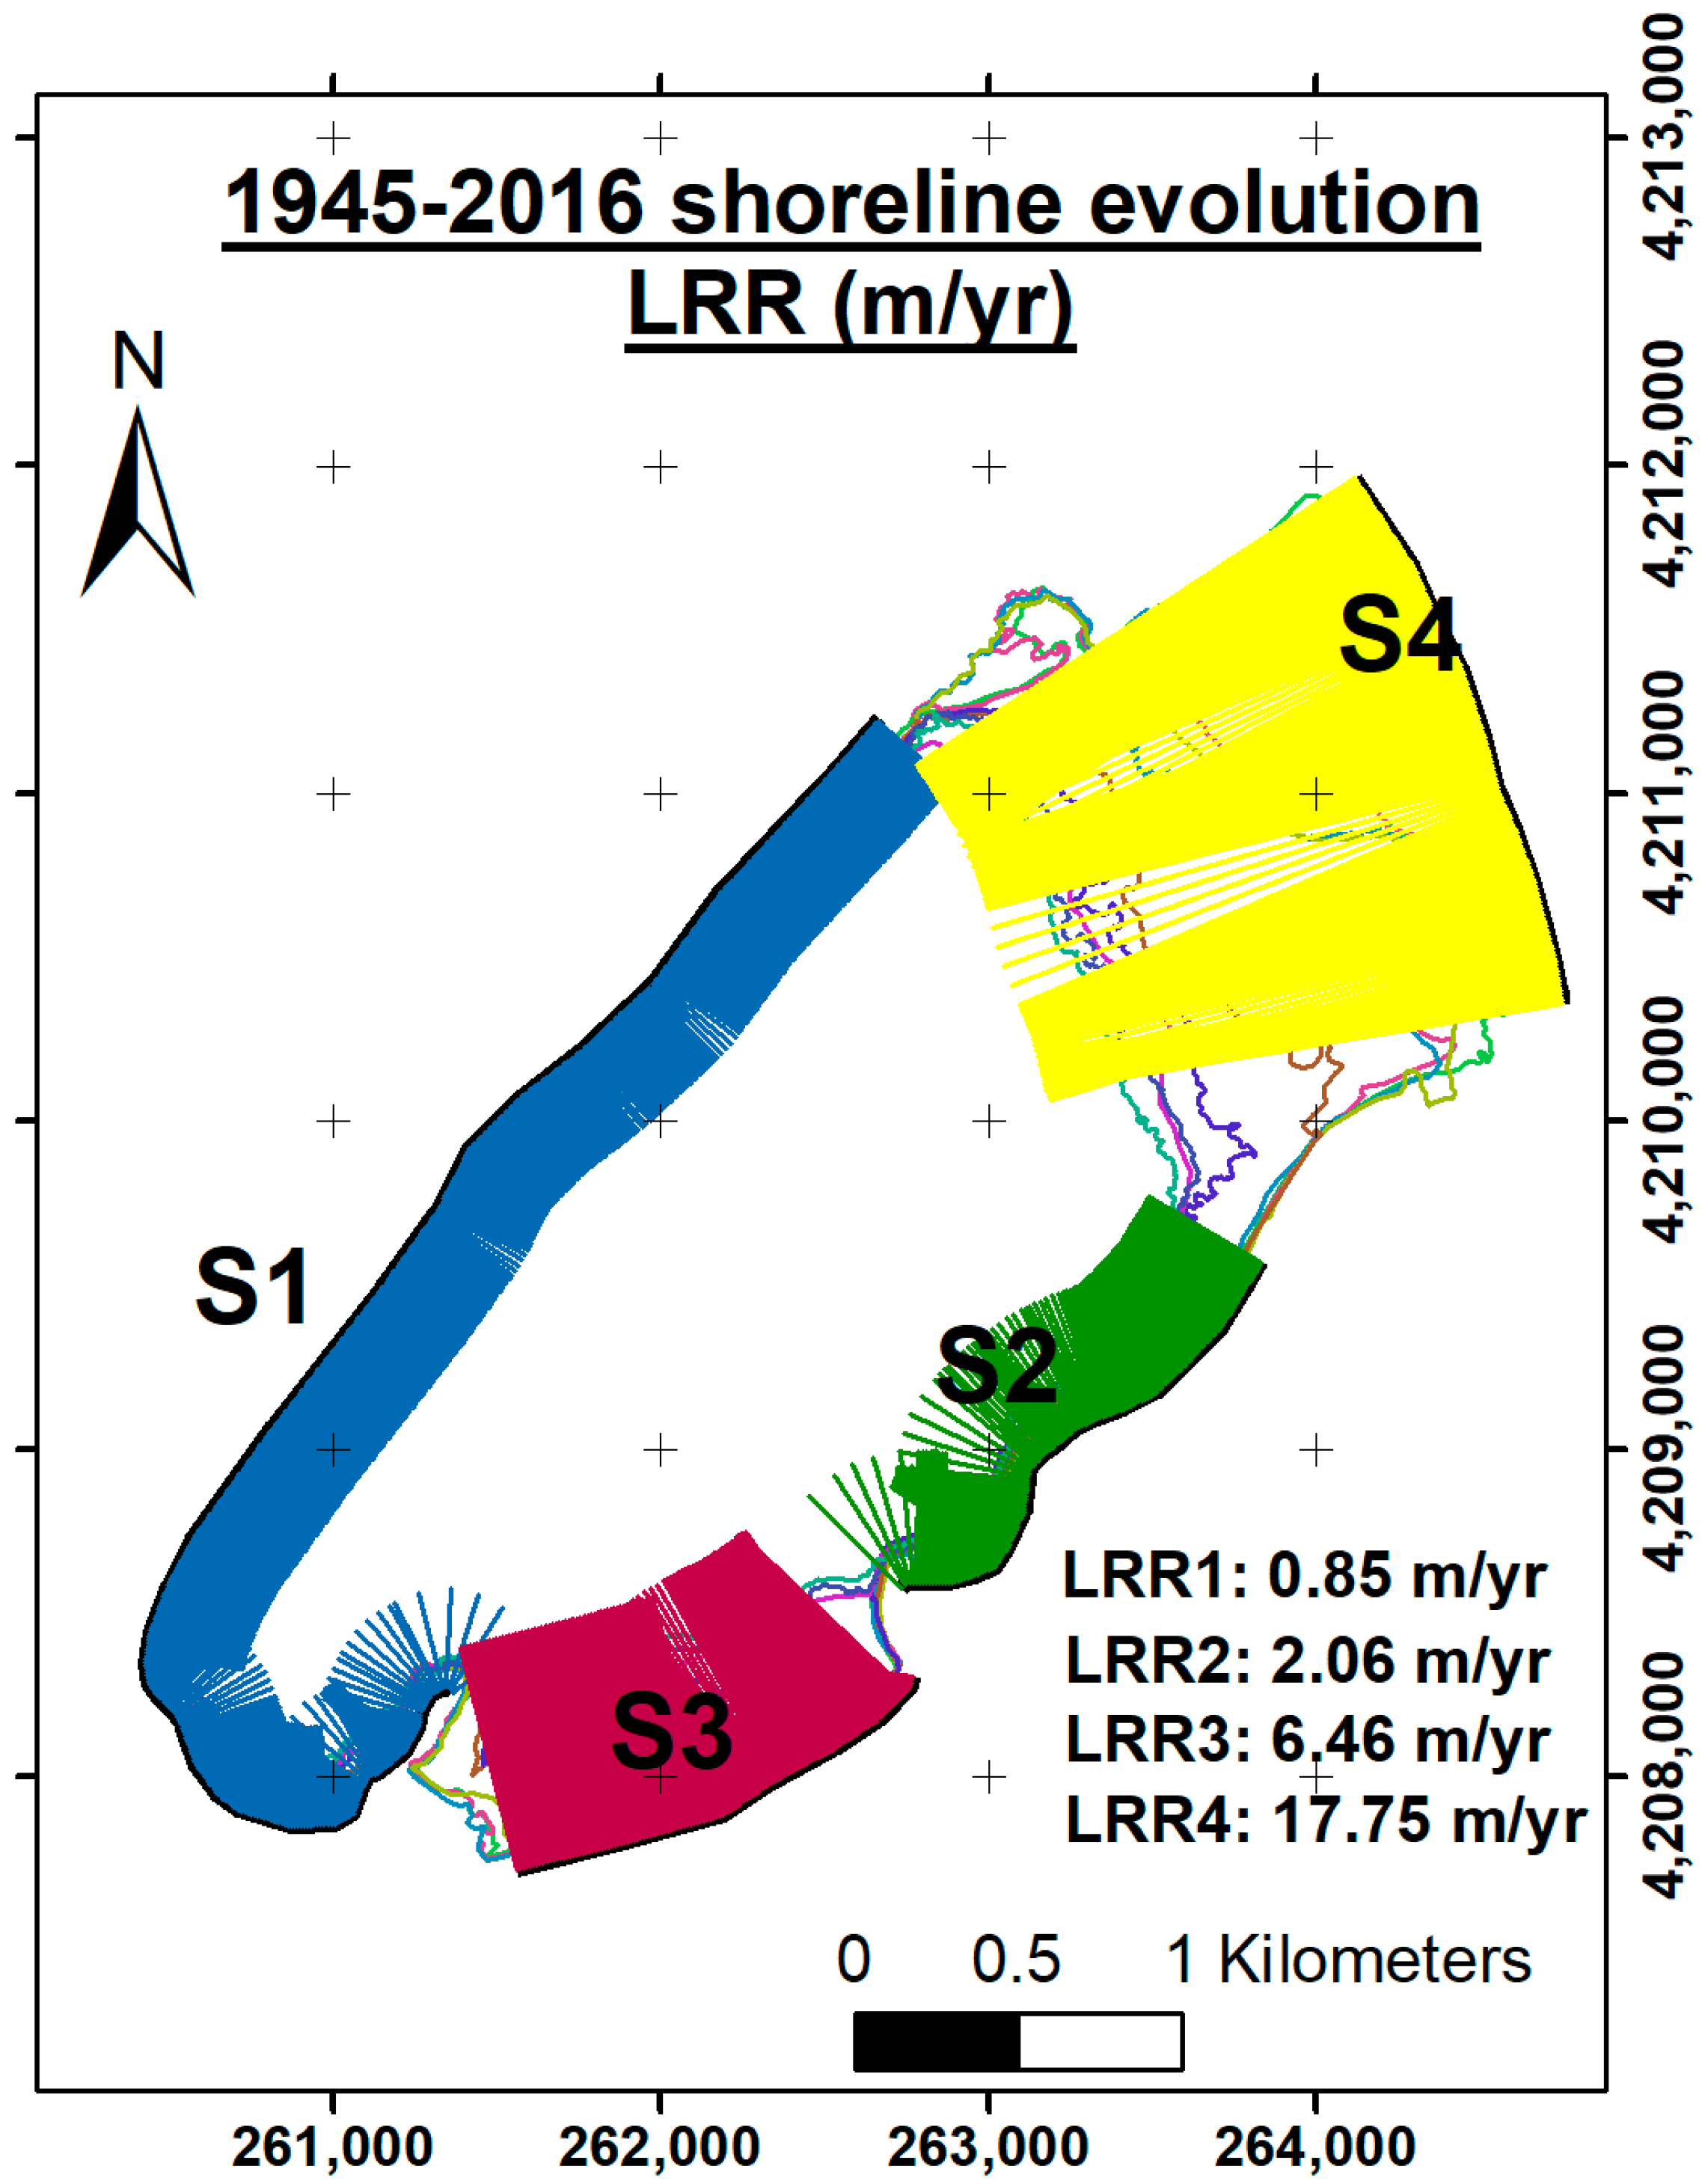
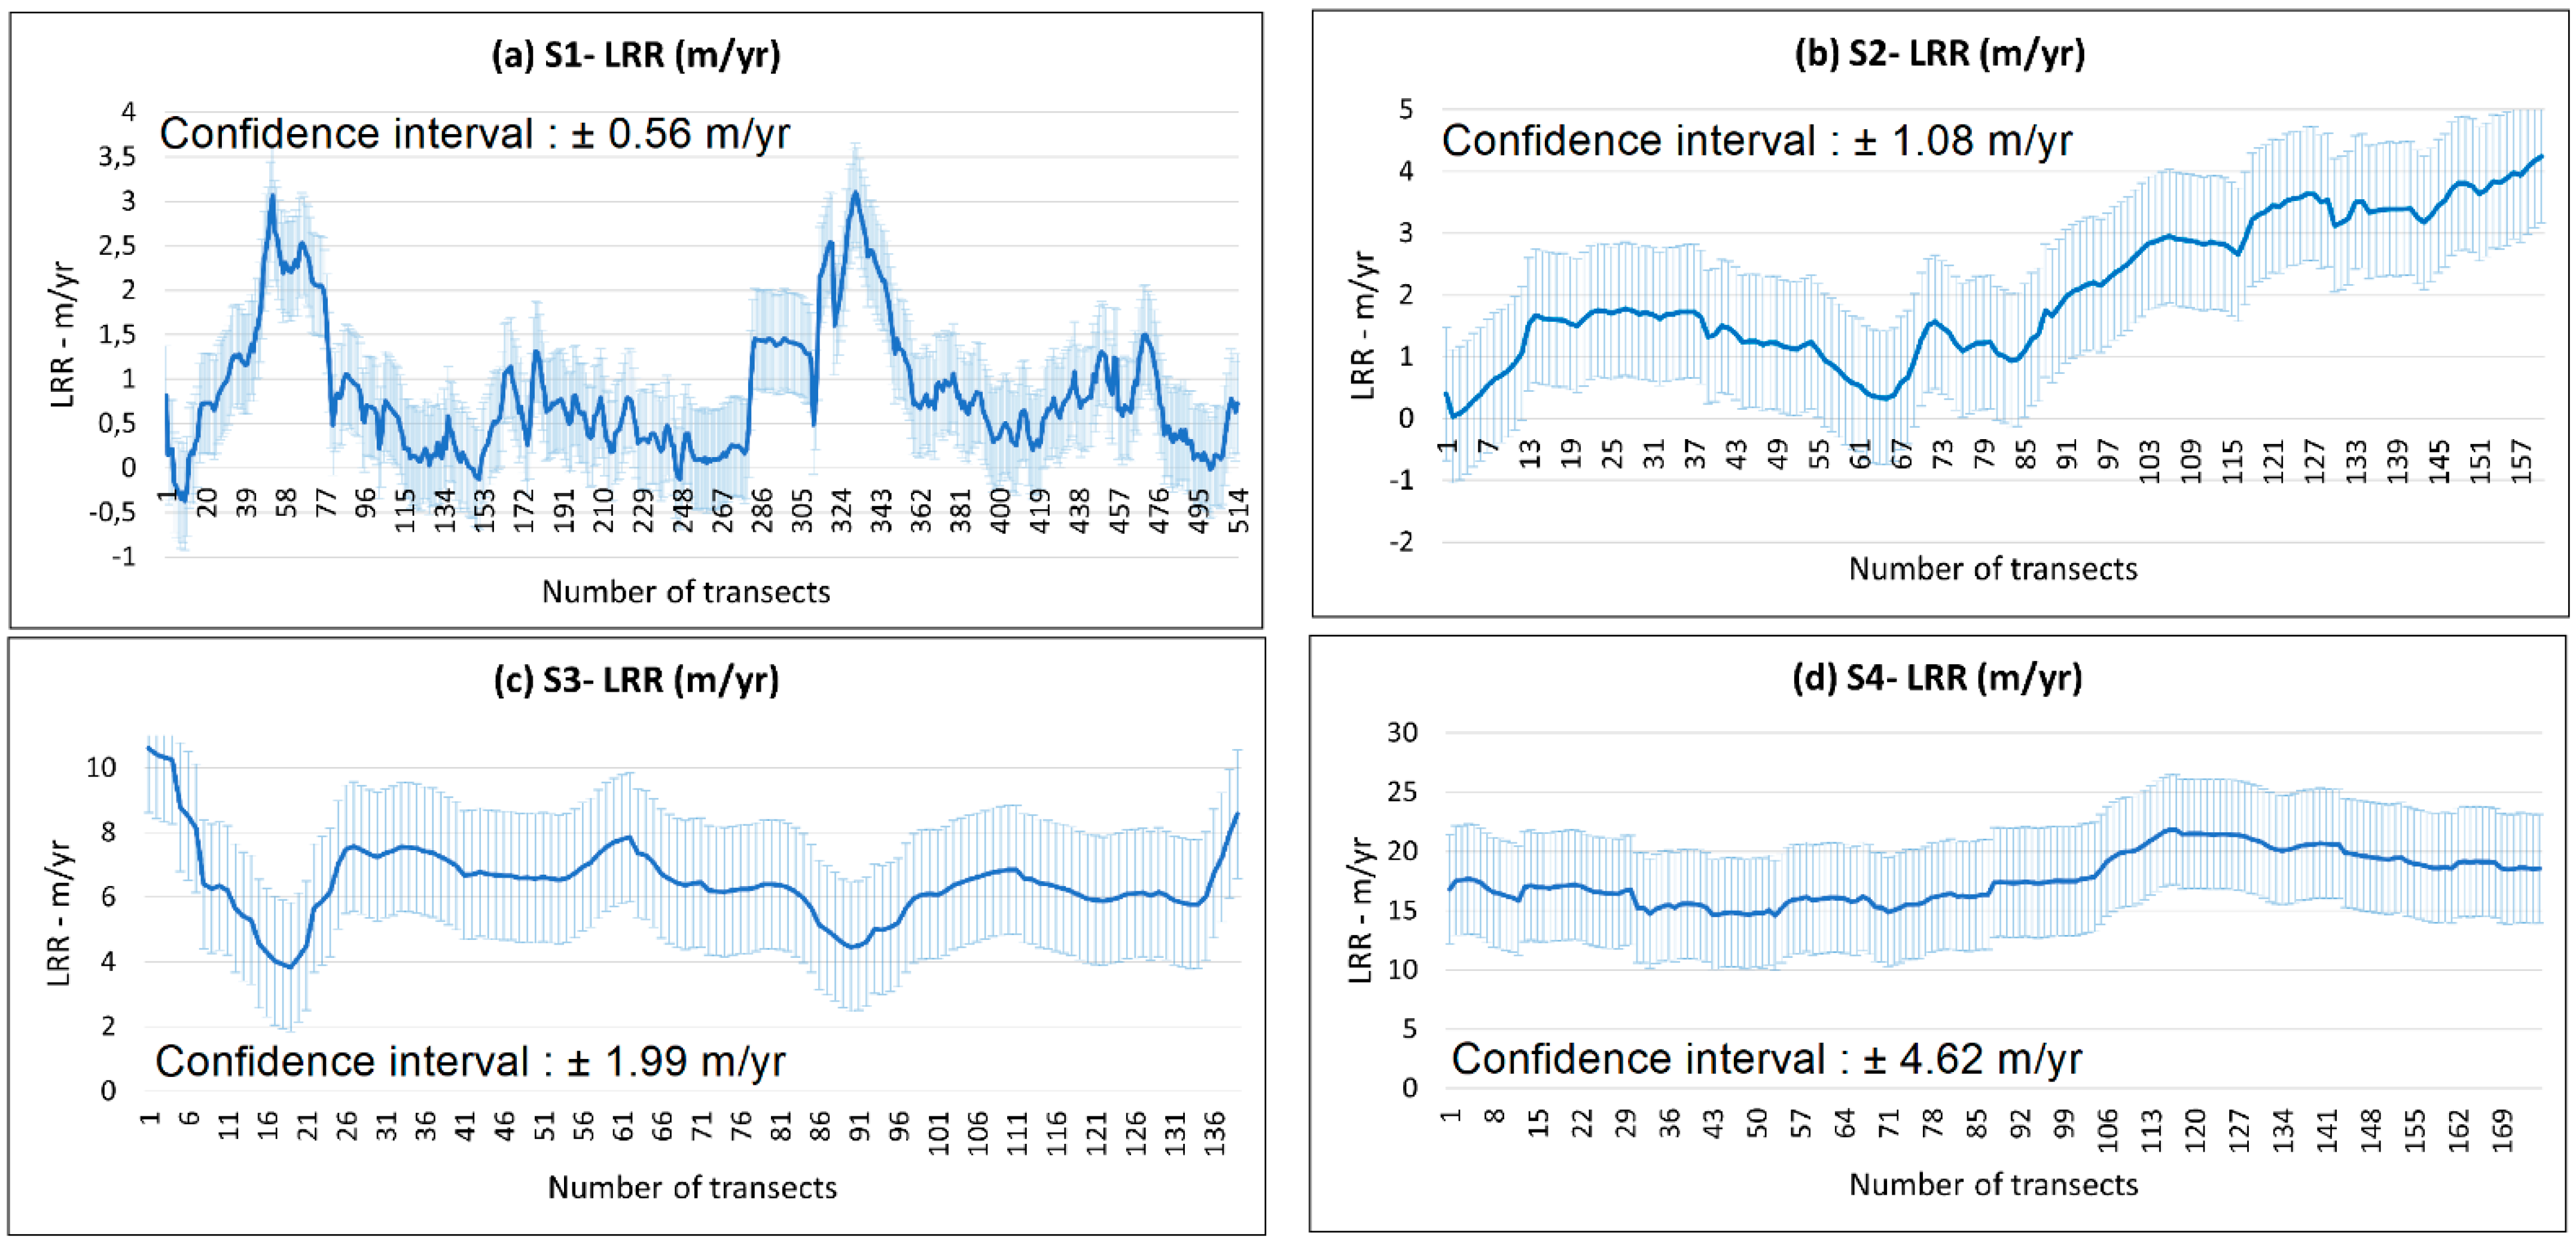
3.1.2. Kotychi Lagoon’s Littoral Zone Evolution

The shoreline change rates based on LRR, such as maximum (max) and average values, were computed for each shoreline segment and expressed for the period of 1945–2016, as shown in Table 4.
The mean LRR values in the S1 and S2 segments were 0.85 and 2.06 m/year, respectively, showing that these areas were less affected during the study period. On the other hand, the LRR value in the S3 segment was 6.46 m/year, which was higher than the previous rates, revealing that accretion prevailed in the area. Meanwhile, the LRR in the S4 segment revealed a maximum value of 17.75 m/year (Figure 10), showing that severe accretion took place in that site of the lagoon. Moreover, the LRR values in each section are presented in conjunction with the confidence band around the reported LRR values in Figure 11.

3.2. Water and Sediment Characteristics

The water temperature in Kotychi Lagoon was highest in August 2021 with a maximum of 29.3 °C and lowest in November 2021 with a minimum of 13.6 °C (mean ± SD, 23.7 ± 5.62 °C) (Table 5). Salinity showed an inverse pattern, ranging from 11.9 in August 2021 to 37.0 in April 2021 (19.6 ± 6.16). Dissolved oxygen was high overall, with an average of 8.90 mg/L (SD 2.98 mg/L); no anoxic conditions were recorded. The pH ranged from 7.96 to 8.61 (8.31 ± 0.183).
Levels of nutrients and organic matter in the water column showed a slight seasonal pattern, with values of TOC, TN, nitrates, nitrates, and ammonium being highest in summer, and phosphate levels being highest in autumn (Table 5). A similar pattern was observed for TOC, TN, and TP in the sediment: the highest average values of TOC and TN were observed in summer (TOC: 1.58 ± 0.177%, TN: 1.05 ± 0.215 mg/g), those of TP were highest in autumn (0.486 ± 0.107 mg/g). The sediments were dominated by the fine fraction throughout the year, with over 70% silt and clay content in all samples but one.

3.3. Ecological Characteristics

The macrobenthic fauna in Kotychi Lagoon was severely impoverished during the study period, with no clear seasonal pattern, except the number of taxa was lower in summer than in spring and autumn. In total, 4104 individuals belonging to 16 taxa were encountered. The highest number of taxa per sample was found in spring and autumn (8 taxa) and the lowest number of taxa (1 taxon) was found in summer (Table 5). The Shannon-Wiener index also showed low values throughout the year (mean: 1.15, min: 0, max: 2.22). Pielou’s index of evenness showed an average of 0.485 (min: 0.158, max: 0.879), indicating a moderate dominance of some species. Indeed, oligochaetes were the dominant taxon in 19 out of 27 samples, with relative abundances of >65% in all but one of these. Overall, the fauna was characterized by typical brackish water species such as oligochaetes, chironomid larvae, the amphipods Corophium orientale and Monocorophium insidiosum, the polychaetes Polydora spp. and Hediste diversicolor, as well as the bivalve Abra segmentum. The ecological quality, expressed through the M-AMBI index, was poor during all seasons, with many stations showing bad status (Table 5).

4. Discussion

This work is a continuation of the effort by our research team to diachronically calculate and record, for the first time, several parameters and indices related to the geometrical and landscape orientation features of wetlands in western Peloponnese, Greece, based on existing remote sensing approaches. In the present study, we estimated these parameters for the Kotychi Lagoon for the 1945–2016 period using high-resolution available datasets, while we have already performed the related work for the Prokopos Lagoon [6]. In addition, we tried to evaluate the diachronic shoreline changes using the LRR statistical tool of DSAS v5 software. Furthermore, we not only evaluated the evolution and status of the lagoon through remote sensing techniques but also assessed the water characteristics and ecological quality of the lagoon through in-situ measurements and sample analysis.
It was shown that during the study period, Kotychi Lagoon was isolated from the open sea and elongated in parallel to the shore. In addition, according to the Ds, Dmax, and Dmin parameters, the shape of the lagoon has remained oval since 1945. During the study period, several fluctuations in the surface and perimeter of the lagoon were observed, whereas periods of stability also occurred. The water surface was close to 7.0 km2 for the 1945–1975 period, while the surface area was reduced by 36% during the period 1975–2000, resulting in a surface area of 4.85 km2, while the water surface area almost stabilized to a value close to 4.8 km2 after the year 2000. This period coincided with the establishment of a special ecosystem management authority in 2002 by the Greek Government, named the National Park Management Body, the aim of which was the protection and sustainable development of the wider area.
In general, from 1945–2016, the lagoon’s water surface area showed significant shrinkage as it seemed to have been slowly silting up and transitioning into swampy areas and finally dry land. This shrinkage was probably due to a combination of impacts, such as intensive cultivation, construction of the Pinios Dam, and reduction of the supply channels.
Water shoreline evolution was found to have occurred at different rates of change in four segments. Two of them (Figure 12) were major and extended in the northeastern and southern parts of the lagoon adjacent to agricultural activities, supporting our assumptions about the causes of degradation mentioned above.
On the other hand, the LRR values showed that the northern part was in a stable state, as the LRR was only 0.85 m/year for the 71-year period, showing that the narrow sand strip is well protected. Meanwhile, the southeastern part experienced a 2.06 m/year rate of change, which was negligible for such a long period.
The results of our study are in accordance with previous studies of the wider area. The authors of ref. [22] compared satellite images from 1990 and 2000 combined with topographical maps and calculated that the water surface of Kotychi Lagoon had the greatest reductions in the northeastern, central, western, and southern parts of the lagoon.
Moreover, according to ref. [21], improvement works such as the dredging of a hibernation basin and five radial submerged channels during the period of 1989–1992 had a positive effect on the hydrological and ecological status of the lagoon, leading to control of the spread of swampy and land areas, which in turn improved the conditions of the ecosystem and its biological components. The results of this previous study were in accordance with those of the current study for the period 1945–1987, while there were no comparable data for 1993. In addition, these results were limited to the 1945–1993 period, whereas the geometrical and landscape orientation features of the lagoon were not investigated and thus there are no reference values to compare with those calculated in the current study.
Although there are more than 400 coastal lagoons in the Mediterranean region [42], such studies are limited in the worldwide literature. Regarding the ecological status of the Kotychi Lagoon, the present study showed a strongly degraded ecological state based on the macrozoobenthic communities. The ecological quality based on the M-AMBI index was poor to bad throughout all sampling seasons and across all stations, biodiversity was low with few species and a low Shannon-Winder index, and the fauna was strongly dominated by a few brackish water taxa. Tziortsis et al. [43] assessed the ecological status through the EEI index, which is based on aquatic vegetation, and classified the lagoon as “moderate”. Fyttis et al. [44], in a study undertaken in 2009–2011, found 28 macroinvertebrate taxa in the Kotychi Lagoon and a similarly low diversity, with a Shannon index between 1.33 and 2.57. According to the national River Basin Management Plan, which reports the results of the Water Framework Directive (WFD) (2000/60/EC) monitoring, the Kotychi Lagoon is classified as having a “good” chemical status but a “poor” ecological status, thus failing to achieve good ecological status as required by legislation. Our results showed that the lagoon seems to have degraded even more during the last years. Organic matter and nutrient concentrations are probably not sufficient to explain the low diversity, as they did not seem to be particularly elevated (e.g., average and maximum values of TOC in the sediment were 1.12% and 1.82%, respectively—according to ref. [45] this corresponds to low to intermediate impact on benthic communities). Extreme fluctuations of salinity that exert osmotic stress on benthic animals and often cause reduced diversity can also be excluded here. Thus, while nutrient inputs probably contribute to some extent to the ecological degradation, alternative causes need to be investigated and could be related to hydrological factors, e.g., low water renewal rates from the sea. These findings highlight that the Kotychi Lagoon is in severe need of appropriate management measures to improve its ecological quality.

5. Conclusions

In the present study, geometrical and landscape orientation features of the Kotychi Lagoon water surface were calculated and analyzed using remote sensing techniques. The water surface of the lagoon has been shrinking during the 1945–2016 period at different rates in four different segments. The shrinkage prevailed in the northeastern and southern parts of the lagoon with rates of 6.46 and 17.75 m/year, respectively, while further analysis should investigate the causes of this transformation. In addition, the water surface area seems to have stabilized after 2000 to a value of approximately 4.8 km2, possibly due to the establishment of the National Park Management Body, which contributed to the protection and sustainable development of the wider area. Nevertheless, the ecological status of the lagoon was determined to be poor, although nutrient input seems to have been moderate over the study period.
Applying remote sensing techniques using a combination of high-resolution aerial photos, orthophotos, and satellite images was proven to constitute a more effective and accurate dataset for the spatiotemporal mapping of wetlands. We conclude that despite the current surface area stabilization, the lagoon is under threat and its biodiversity is already diminished, thus further changes to the hydrological regime could cause further deterioration of this important ecosystem.

Author Contributions

Conceptualization, D.N.A., P.A., K.G.N., S.F., D.P. and A.R.; Methodology, D.N.A., P.A., K.G.N., S.F., D.P. and A.R.; Software, D.N.A., D.G. and S.F.; Validation, P.A., K.G.N. and S.F.; Data Curation, P.A., D.N.A., D.G., D.P. and S.F.; Writing-Original Draft Preparation, D.N.A., D.G., P.A., D.P. and S.F.; Writing-Review & Editing, P.A., K.G.N., S.F., D.P., and A.R.; Project Administration, D.N.A., P.A. and K.G.N. All authors have read and agreed to the published version of the manuscript.

Funding

This research was partially funded by the Green Fund of the Hellenic Ministry of the Environment and Energy (181.6.5/2020).

Institutional Review Board Statement

Not applicable.

Informed Consent Statement

Not applicable.

Data Availability Statement

Data are available from the authors upon request.

Acknowledgments

The authors would like to thank the Ministry of Rural Development and Food for the orthomosaics of 1996 and the National Greek Cadastre and Mapping Agency for the orthomosaics of 1945, 2008, and 2016 offered in the frame of the current study. We also thank the Management Unit of Strofylia Wetlands National Park and Protected Areas of Western Peloponnese for their assistance in field sampling.

Conflicts of Interest

The authors declare no conflict of interest.

References

  1. Karpatne, A.; Khandelwal, A.; Chen, X.; Mithal, V.; Faghmous, J.; Kumar, V. Global Monitoring of Inland Water Dynamics: State-of-the-Art, Challenges, and Opportunities. In Computational Sustainability; Studies in Computational Intelligence; Lässig, J., Kersting, K., Morik, K., Eds.; Springer International Publishing: Cham, Switzerland, 2016; pp. 121–147. ISBN 978-3-319-31858-5. [Google Scholar]
  2. Avramidis, P.; Iliopoulos, G.; Kontopoulos, N.; Panagiotaras, D.; Barouchas, P.; Nikolaou, K.; Papadopoulou, P. Depositional Environments, Sediment Characteristics, Palaeoecological Analysis and Environmental Assessment of an Internationally Protected Shallow Mediterranean Lagoon, Gialova Lagoon—Navarino Bay, Greece. Earth Environ. Sci. Trans. R. Soc. Edinb. 2014, 105, 189–206. [Google Scholar] [CrossRef]
  3. Srichandan, S.; Kim, J.Y.; Bhadury, P.; Barik, S.K.; Muduli, P.R.; Samal, R.N.; Pattnaik, A.K.; Rastogi, G. Spatiotemporal Distribution and Composition of Phytoplankton Assemblages in a Coastal Tropical Lagoon: Chilika, India. Environ. Monit. Assess. 2015, 187, 47. [Google Scholar] [CrossRef] [PubMed]
  4. Ghai, R.; Hernandez, C.M.; Picazo, A.; Mizuno, C.M.; Ininbergs, K.; Díez, B.; Valas, R.; DuPont, C.L.; McMahon, K.D.; Camacho, A.; et al. Metagenomes of Mediterranean Coastal Lagoons. Sci. Rep. 2012, 2, 490. [Google Scholar] [CrossRef] [PubMed]
  5. Kjerfve, B. Coastal Lagoon Processes; Kjerfve, B., Ed.; Elsevier: Amsterdam, The Netherlands, 1994; ISBN 0-444-88258-8. [Google Scholar]
  6. Apostolopoulos, D.N.; Avramidis, P.; Nikolakopoulos, K.G. Estimating Quantitative Morphometric Parameters and Spatiotemporal Evolution of the Prokopos Lagoon Using Remote Sensing Techniques. J. Mar. Sci. Eng. 2022, 10, 931. [Google Scholar] [CrossRef]
  7. Kjerfve, B. Comparative Oceanography of Coastal Lagoons. In Estuarine Variability; Wolfe, D.A., Ed.; Academic Press: Cambridge, MA, USA, 1986; pp. 63–81. ISBN 978-0-12-761890-6. [Google Scholar]
  8. McFeeters, S.K. The Use of the Normalized Difference Water Index (NDWI) in the Delineation of Open Water Features. Int. J. Remote Sens. 1996, 17, 1425–1432. [Google Scholar] [CrossRef]
  9. Xu, H. Modification of Normalised Difference Water Index (NDWI) to Enhance Open Water Features in Remotely Sensed Imagery. Int. J. Remote Sens. 2006, 27, 3025–3033. [Google Scholar] [CrossRef]
  10. Rasuly, A.; Naghdifar, R.; Rasoli, M. Monitoring of Caspian Sea Coastline Changes Using Object-Oriented Techniques. Procedia Environ. Sci. 2010, 2, 416–426. [Google Scholar] [CrossRef]
  11. Bera, R.; Maiti, R. Quantitative Analysis of Erosion and Accretion (1975–2017) Using DSAS—A Study on Indian Sundarbans. Reg. Stud. Mar. Sci. 2019, 28, 100583. [Google Scholar] [CrossRef]
  12. Crist, E.P.; Cicone, R.C. A Physically-Based Transformation of Thematic Mapper Data—The TM Tasseled Cap. IEEE Trans. Geosci. Remote Sens. 1984, 2, 256–263. [Google Scholar] [CrossRef]
  13. Samarawickrama, U.; Piyaratne, D.; Ranagalage, M. Relationship between NDVI with Tasseled Cap Indices: A Remote Sensing Based Analysis. Int. J. Innov. Res. Technol. 2017, 3, 13–19. [Google Scholar]
  14. Chen, C.; Fu, J.; Zhang, S.; Zhao, X. Coastline Information Extraction Based on the Tasseled Cap Transformation of Landsat-8 OLI Images. Estuar. Coast. Shelf Sci. 2019, 217, 281–291. [Google Scholar] [CrossRef]
  15. Huang, C.; Wylie, B.; Yang, L.; Homer, C.; Zylstra, G. Derivation of a Tasselled Cap Transformation Based on Landsat 7 At-Satellite Reflectance. Int. J. Remote Sens. 2002, 23, 1741–1748. [Google Scholar] [CrossRef]
  16. Anders, F.J.; Byrnes, M. Accuracy of Shoreline Change Rates as Determined from Maps and Aerial Photographs. Shore Beach 1991, 59, 17–26. [Google Scholar]
  17. Moore, L.J. Shoreline Mapping Techniques. J. Coast. Res. 2000, 16, 111–124. [Google Scholar]
  18. Apostolopoulos, D.N.; Nikolakopoulos, K.G. Identifying Sandy Sites under Erosion Regime along the Prefecture of Achaia, Using Remote Sensing Techniques. J. Appl. Remote Sens. 2022, 17, 022206. [Google Scholar] [CrossRef]
  19. Chubarenko, B.; Koutitonsky, V.; Neves, R.; Umgiesser, G. Modeling Concepts. In Coastal Lagoons: Ecosystem Process and Modeling for Sustainable Use and Development; CRC: Washigton, DC, USA, 2005; pp. 231–306. [Google Scholar]
  20. Pérez-Ruzafa, A.; Mompeán, M.C.; Marcos, C. Hydrographic, Geomorphologic and Fish Assemblage Relationships in Coastal Lagoons. In Proceedings of the Lagoons and Coastal Wetlands in the Global Change Context: Impacts and Management Issues: Selected Papers of the International Conference “CoastWetChange”, Venice, Italy, 26–28 April 2004; Viaroli, P., Lasserre, P., Campostrini, P., Eds.; Springer: Dordrecht, The Netherlands, 2007; pp. 107–125. [Google Scholar]
  21. Kalivas, D.P.; Kollias, V.J.; Karantounias, G. A GIS for the Assessment of the Spatio-Temporal Changes of the Kotychi Lagoon, Western Peloponnese, Greece. Water Resour. Manag. 2003, 17, 19–36. [Google Scholar] [CrossRef]
  22. Avramidis, P.; Bouzos, D.; Antoniou, V.; Kontopoulos, N. Application of Grain-Size Trend Analysis and Spatio-Temporal Changes of Sedimentation, as a Tool for Lagoon Management. Case Study: The Kotychi Lagoon (Western Greece). Geol. Carpathica 2008, 59, 261–268. [Google Scholar]
  23. Emmanouilidis, A.; Katrantsiotis, C.; Norström, E.; Risberg, J.; Kylander, M.; Sheik, T.A.; Iliopoulos, G.; Avramidis, P. Middle to Late Holocene Palaeoenvironmental Study of Gialova Lagoon, SW Peloponnese, Greece. Quat. Int. 2018, 476, 46–62. [Google Scholar] [CrossRef]
  24. Papatheodorou, G.; Avramidis, P.; Fakiris, E.; Christodoulou, D.; Kontopoulos, N. Bed Diversity in the Shallow Water Environment of Pappas Lagoon in Greece. Int. J. Sediment Res. 2012, 27, 1–17. [Google Scholar] [CrossRef]
  25. Katrantsiotis, C.; Kylander, M.E.; Smittenberg, R.; Yamoah, K.K.A.; Hättestrand, M.; Avramidis, P.; Strandberg, N.A.; Norström, E. Eastern Mediterranean Hydroclimate Reconstruction over the Last 3600 Years Based on Sedimentary N-Alkanes, Their Carbon and Hydrogen Isotope Composition and XRF Data from the Gialova Lagoon, SW Greece. Quat. Sci. Rev. 2018, 194, 77–93. [Google Scholar] [CrossRef]
  26. Weiberg, E.; Unkel, I.; Kouli, K.; Holmgren, K.; Avramidis, P.; Bonnier, A.; Dibble, F.; Finné, M.; Izdebski, A.; Katrantsiotis, C.; et al. The Socio-Environmental History of the Peloponnese during the Holocene: Towards an Integrated Understanding of the Past. Quat. Sci. Rev. 2016, 136, 40–65. [Google Scholar] [CrossRef]
  27. Kraft, J.C.; John, C.; Rapp, G.R.; Gifford, J.A.; Aschenbrenner, S.E.; Stanley, E. Coastal Change and Archaeological Settings in Elis. Hesperia J. Am. Sch. Class. Stud. Athens 2005, 74, 1–39. [Google Scholar]
  28. Kontopoulos, N.; Koutsios, A. A Late Holocene Record of Environmental Changes from Kotihi Lagoon, Elis, Northwest Peloponnesus, Greece. Quat. Int. 2010, 225, 191–198. [Google Scholar] [CrossRef]
  29. Fountoulis, I.; Vassilakis, E.; Mavroulis, S.; Alexopoulos, J.; Erkeki, A. Quantification of River Valley Major Diversion Impact at Kyllini Coastal Area (W. Peloponnesus, Greece) with Remote Sensing Techniques. In Proceedings of the 2nd INQUA-IGCP-567 International Workshop on Active Tectonics, Earthquake Geology, Archaeology and Engineering, Corinth, Greece, 1 January 2011; pp. 42–45. [Google Scholar]
  30. Haenssler, E.; Unkel, I.; Dörfler, W.; Nadeau, M.-J. Driving Mechanisms of Holocene Lagoon Development and Barrier Accretion in Northern Elis, Peloponnese, Inferred from the Sedimentary Record of the Kotychi Lagoon. E&G Quat. Sci. J. 2014, 63, 60–77. [Google Scholar] [CrossRef]
  31. Himmelstoss, E.A.; Henderson, R.E.; Kratzmann, M.G.; Farris, A.S. Digital Shoreline Analysis System (DSAS) Version 5.0 User Guide; Open-File Report; No. 2018-1179; U.S. Geological Survey: Reston, VA, USA, 2018. [Google Scholar]
  32. Nikolakopoulos, K.; Kyriou, A.; Koukouvelas, I.; Zygouri, V.; Apostolopoulos, D. Combination of Aerial, Satellite, and UAV Photogrammetry for Mapping the Diachronic Coastline Evolution: The Case of Lefkada Island. ISPRS Int. J. Geo-Inform. 2019, 8, 489. [Google Scholar] [CrossRef] [Green Version]
  33. Burningham, H.; French, J. Understanding Coastal Change Using Shoreline Trend Analysis Supported by Cluster-Based Segmentation. Geomorphology 2017, 282, 131–149. [Google Scholar] [CrossRef]
  34. Hapke, C.J.; Himmelstoss, E.A.; Kratzmann, M.G.; List, J.H.; Thieler, E.R. National Assessment of Shoreline Change: Historical Shoreline Change along the New England and Mid-Atlantic Coasts; Open-File Report; No. 2010-1118; U.S. Geological Survey: Reston, VA, USA, 2011. [Google Scholar]
  35. Bekiari, V.; Avramidis, P. Data Quality in Water Analysis: Validation of Combustion-Infrared and Combustion-Chemiluminescence Methods for the Simultaneous Determination of Total Organic Carbon (TOC) and Total Nitrogen (TN). Int. J. Environ. Anal. Chem. 2014, 94, 65–76. [Google Scholar] [CrossRef]
  36. APHA. Standard Methods for the Examination of Water and Waste Water, 21st ed.; American Public Health Association: Washington, DC, USA, 2005. [Google Scholar]
  37. Avramidis, P.; Nikolaou, K.; Bekiari, V. Total Organic Carbon and Total Nitrogen in Sediments and Soils: A Comparison of the Wet Oxidation—Titration Method with the Combustion-Infrared Method. Agric. Agric. Sci. Procedia 2015, 4, 425–430. [Google Scholar] [CrossRef]
  38. Avramidis, P.; Bekiari, V. Application of a Catalytic Oxidation Method for the Simultaneous Determination of Total Organic Carbon and Total Nitrogen in Marine Sediments and Soils. PLoS ONE 2021, 16, e0252308. [Google Scholar] [CrossRef] [PubMed]
  39. Worms Editorial Board. WoRMS—World Register of Marine Species. Available online: https://www.marinespecies.org/ (accessed on 13 January 2023).
  40. Muxika, I.; Borja, Á.; Bald, J. Using Historical Data, Expert Judgement and Multivariate Analysis in Assessing Reference Conditions and Benthic Ecological Status, according to the European Water Framework Directive. Mar. Pollut. Bull. 2007, 55, 16–29. [Google Scholar] [CrossRef] [PubMed]
  41. Reizopolou, S.; Penna, M.; Boix, D.; Buchet, R.; Costas, N.; Derolez, V.; Gascon, S.; Gifre, J.; Martinoy, M.; Pardo, I.; et al. Transitional Waters Mediterranean Geographic Intercalibration Group: Benthic Invertebrates Fauna Ecological Assessment Methods; Publications Office of the European Union: Luxembourg, 2018. [Google Scholar]
  42. Cataudella, S.; Crosetti, D.; Massa, F. Fishery and Aquaculture Economics and Policy Division. Mediterranean Coastal Lagoons: Sustainable Management and Interactions among Aquaculture, Capture Fisheries and the Environment; General Fisheries Commission for the Mediterranean (GFCM)—Session Report; FAO: Rome, Italy, 2015; ISBN 978-92-5-108792-3. [Google Scholar]
  43. Tziortzis, I.; Kadis, K.; Papastegiadou, E. Use of Macrophyte assemblages for the ecological evaluation of two coastal lagoons of Greece according to WFD 2000/60/EC. J. Wetl. Biodivers. 2014, 4, 97–111. [Google Scholar]
  44. Fyttis, G.; Reizopoulou, S.; Papastergiadou, E. Assessing the Ecological Quality of Coastal Lagoons of Western Greece: The Response of Benthic Communities to Environmental Variability. Int. J. Environ. Sci. Dev. 2019, 10, 91–95. [Google Scholar] [CrossRef]
  45. Hyland, J.; Balthis, L.; Karakassis, I.; Magni, P.; Petrov, A.; Shine, J.; Vestergaard, O.; Warwick, R. Organic Carbon Content of Sediments as an Indicator of Stress in the Marine Benthos. Mar. Ecol. Prog. Ser. 2005, 295, 91–103. [Google Scholar] [CrossRef] [Green Version]
Figure 1. Wetlands of western Peloponnese and the location of the study area (Kotychi Lagoon).
Jmse 11 00411 g001
Figure 2. General workflow of the proposed methodology.
Jmse 11 00411 g002
Figure 3. Multitemporal fluctuations in Kotychi Lagoon. Base map of the year 2000.
Jmse 11 00411 g003
Figure 4. Kotychi Lagoon restriction ratio (Pr) index fluctuations during the study period. The blue line represents the average Pr value.
Jmse 11 00411 g004
Figure 5. Kotychi Lagoon orientation parameter (Por) index fluctuations during the study period. The blue line represents the average Por value.
Jmse 11 00411 g005
Figure 6. Kotychi Lagoon shoreline development index (Ds) fluctuations during the study period. The blue line represents the average Ds value.
Jmse 11 00411 g006
Figure 7. Number of inlets (CMAR-index) diachronically discharging their water into the Kotychi Lagoon.
Jmse 11 00411 g007
Figure 8. Water surface area fluctuations (%) during the study period in the Kotychi Lagoon.
Jmse 11 00411 g008
Figure 9. Perimeter fluctuations (%) during the study period in the Kotychi Lagoon.
Jmse 11 00411 g009
Figure 10. Kotychi Lagoon’s LRR shoreline change rates for the 1945–2016 period separated into four different sections of change.
Jmse 11 00411 g010
Figure 11. LRR values in each section in conjunction with the confidence band (LCI90%). (a) S1 section with LCI90% of ±0.56 m/year, (b) S2 section with LCI90% of ±1.08 m/year, (c) S3 section with LCI90% of ±1.99 m/year, and (d) S4 section with LCI90% of ±4.62 m/year.
Jmse 11 00411 g011
Figure 12. Kotychi Lagoon’s major areas of shrinkage (blue arrows) during the 1945–2016 period.
Jmse 11 00411 g012
Table 1. Datasets used in current study.
Month/YearData TypeSourceReference SystemSpatial Resolution
08/2016Official Greek OrthomosaicNational Greek Cadastre and Mapping AgencyHellenic Geodetic Reference System of 1987 (Greek Grid)0.25 m
08/2008Official Greek OrthomosaicNational Greek Cadastre and Mapping AgencyHellenic Geodetic Reference System of 1987 (Greek Grid)0.50 m
05/2000IRS-Pan Satellite ImageryUnited States Geological Survey (USGS)No Reference System5 m
08/1996Official Greek OrthomosaicMinistry of Rural Development & FoodHellenic Geodetic Reference System of 1987 (Greek Grid)1 m
07/1987Analogue Aerial PhotographyHellenic Military Geographical Service (HMGS)No Reference System1 m
12/1975Declassified Satellite ImageryUnited States Geological Survey (USGS)No Reference System4 m
2/1968Declassified Satellite ImageryUnited States Geological Survey (USGS)No Reference System2 m
05/1960Analogue Aerial PhotographyHellenic Military Geographical Service (HMGS)No Reference System1 m
08/1945Official Greek OrthomosaicNational Greek Cadastre and Mapping AgencyHellenic Geodetic Reference System of 1987 (Greek Grid)1 m
Table 2. Morphometric lagoon parameters (modified after ref. [19]).
ParameterType/AbbreviationUnits
Restriction ratio Prno unit
Orientation or anisotropy parameterPorno unit
Shoreline developmentDs no unit
Lagoon surface SLAGKm2
Lagoon perimeterPERI Km
Maximum diameter of the lagoonDMAXKm
Minimum diameter of the lagoonDMINKm
Perpendicular distance to the open sea coastline DPERKm
Parallel distance to the open sea coastlineDPARKm
Number of inlets or channelsCMARno unit
Table 3. Geometrical parameters of Kotychi Lagoon.
YearDMAX (km)DMIN (km)DPER (km)DPAR (km)
19455.141.670.063.53
19604.651.670.043.66
19684.621.700.044.04
19754.601.700.044.12
19874.091.690.053.59
19964.021.590.063.54
20003.771.370.073.62
20083.921.310.053.55
20163.881.250.043.64
Min3.771.250.043.53
Max5.141.700.074.12
Mean4.301.550.053.70
Table 4. Multitemporal statistical rates for the 1945–2016 period based on LRR (m/year).
Baseline
Sectors (S)/Length
S1
(5.14 km)
S2
(1.60 km)
S3
(1.38 km)
S4
(1.75 km)
Number of transects514160139175
Mean LRR (m/year)0.852.066.4617.75
Mean LCI0.561.081.994.62
Table 5. Mean ± SD (minimum and maximum values in parenthesis) for water and sediment properties as well as ecological and biodiversity indices in Kotychi Lagoon.
ParameterApril 2021August 2021November 2021
Water parameters
Depth (m)0.4 ± 0.13
(0.2–0.5)
0.51 ± 0.03
(0.5–0.6)
0.51 ± 0.08
(0.4–0.7)
Water transparency (m)0.22 ± 0.16
(0.1–0.5)
0.28 ± 0.06
(0.2–0.4)
0.37 ± 0.08
(0.25–0.5)
Temperature (°C)16.32 ± 0.64
(15.4–17.2)
28.07 ± 0.78
(26.9–29.3)
14.89 ± 0.64
(13.6–15.7)
Salinity28.52 ± 4.97
(23–37)
17.75 ± 3.33
(11.87–21.33)
25.8 ± 2.97
(21.19–30.06)
Dissolved Oxygen (mg/L)11.76 ± 0.6
(11.02–12.6)
9.2 ± 4.4
(5.75–19.89)
7.27 ± 0.57
(6.48–8.07)
pH8.46 ± 0.09
(8.35–8.61)
8.42 ± 0.13
(8.24–8.61)
8.15 ± 0.11
(7.96–8.3)
TOC (mg/L)3.02 ± 2.11
(0.57–5.88)
9.07 ± 1.41
(6.67–11.57)
4.8 ± 1.45
(2.84–7.52)
TN (mg/L)0.38 ± 0.2
(0.05–0.65)
0.76 ± 0.18
(0.44–1.08)
0.32 ± 0.05
(0.26–0.41)
Phosphates (mg/L)0.06 ± 0.02
(0.05–0.1)
0.11 ± 0.04
(0.07–0.17)
0.16 ± 0.25
(0.05–0.68)
Nitrate (mg/L)0.25 ± 0.04
(0.23–0.32)
0.29 ± 0.08
(0.23–0.44)
0.23 ± 0
(0.23–0.23)
Nitrite (mg/L)0.01 ± 0
(0.01–0.01)
0.06 ± 0.05
(0.01–0.19)
0.01 ± 0
(0.01–0.01)
Ammonium (mg/L)0.01 ± 0
(0.01–0.01)
0.09 ± 0.03
(0.01–0.14)
0.01 ± 0
(0.01–0.01)
Sediment parameters
TOC (%)1.32 ± 0.26
(1.16–1.82)
1.58 ± 0.18
(1.27–1.81)
0.67 ± 0.12
(0.5–0.91)
TN (mg/g)0.92 ± 0.22
(0.71–1.33)
1.05 ± 0.21
(0.76–1.37)
0.44 ± 0.13
(0.28–0.64)
TP (mg/g)0.42 ± 0.06
(0.34–0.5)
0.37 ± 0.05
(0.26–0.43)
0.49 ± 0.11
(0.35–0.78)
Ecological and diversity indices
Species richness6.33 ± 1.21
(5–8)
4 ± 1.41
(1–5)
5.75 ± 1.6
(3–8)
Individuals/m23286.67 ± 2694.16
(1520–8640)
4213.33 ± 3744.54
(680–10640)
8876.67 ± 8216.57
(1400–25120)
Shannon-Wiener index1.29 ± 0.48
(0.53–1.82)
0.92 ± 0.58
(0–1.96)
1.25 ± 0.74
(0.32–2.21)
Pielou’s evenness index0.48 ± 0.15
(0.23–0.61)
0.49 ± 0.21
(0.18–0.84)
0.49 ± 0.25
(0.16–0.88)
M-AMBI0.19 ± 0.06
(0.1–0.27)
0.15 ± 0.06
(0.06–0.25)
0.2 ± 0.1
(0.06–0.35)
Ecological statusPoorPoorPoor
Disclaimer/Publisher’s Note: The statements, opinions and data contained in all publications are solely those of the individual author(s) and contributor(s) and not of MDPI and/or the editor(s). MDPI and/or the editor(s) disclaim responsibility for any injury to people or property resulting from any ideas, methods, instructions or products referred to in the content.

