Article

CFD Analysis and Wind Tunnel Experiment for Ventilation Ducts with Structural Elements Inside

Faculty of Engineering, “Dunarea de Jos” University of Galati, 47 Domnească Street, 800008 Galati, Romania
*
Author to whom correspondence should be addressed.
J. Mar. Sci. Eng. 2023, 11(2), 371; https://doi.org/10.3390/jmse11020371
Submission received: 9 January 2023 / Revised: 25 January 2023 / Accepted: 3 February 2023 / Published: 7 February 2023
(This article belongs to the Special Issue Marine Renewable Energy and the Transition to a Low Carbon Future)

Abstract

:
Ventilation ducts with a high cross-sectional area are frequently built as structural ducts that include inside transversal structural beams. In this way, the cross-sectional area requested is respected, but the transverse structural elements will have a big impact on the airflow, with eventually additional noise and vibration and a high amount of energy wasted across the beams. From this perspective, the aim of this study is to evaluate the impact of the transversal beams inside the ventilation ducts, to analyze different alternatives for airflow improvement using computational fluid dynamics (CFD) simulation, and to check the simulation results in the wind tunnel with an experimental model. The results of the experimental measurements have highlighted the high-pressure drop and, consequently, the high energy wasted across the transversal structural beams. It was found that the airflow downstream of the beam is changing the flow direction, and high turbulences and vortices are initiated in the shadow of the beam. According to the CFD analysis, the ventilation system can be improved by adding airflow deflectors in the beam area. In this way, the high turbulences are reduced, the vortices and backflow are canceled, and the pressure losses across the beam area of the ventilation duct are reduced by up to 90% compared with the beam without a deflector. Therefore, the energy wasted in the beam area can be reduced by up to 90%.

1. Introduction

The ventilation system has an important share in the power consumption of modern ships. Regarding the ventilation system, two independent directions should be analyzed to reduce energy consumption:
(a)
Reducing the airflow. A solution applicable for periodically unattended machinery spaces [1,2,3] is to reduce the airflow by using direct adiabatic cooling in hot and dry outside environmental conditions [4]. In the case of ventilation for an accommodation area, the airflow can be reduced by changing the philosophy of the system and using a small air conditioning unit for fresh air and local heat exchangers, as Mihai and Rusu [5] have proposed in their study.
(b)
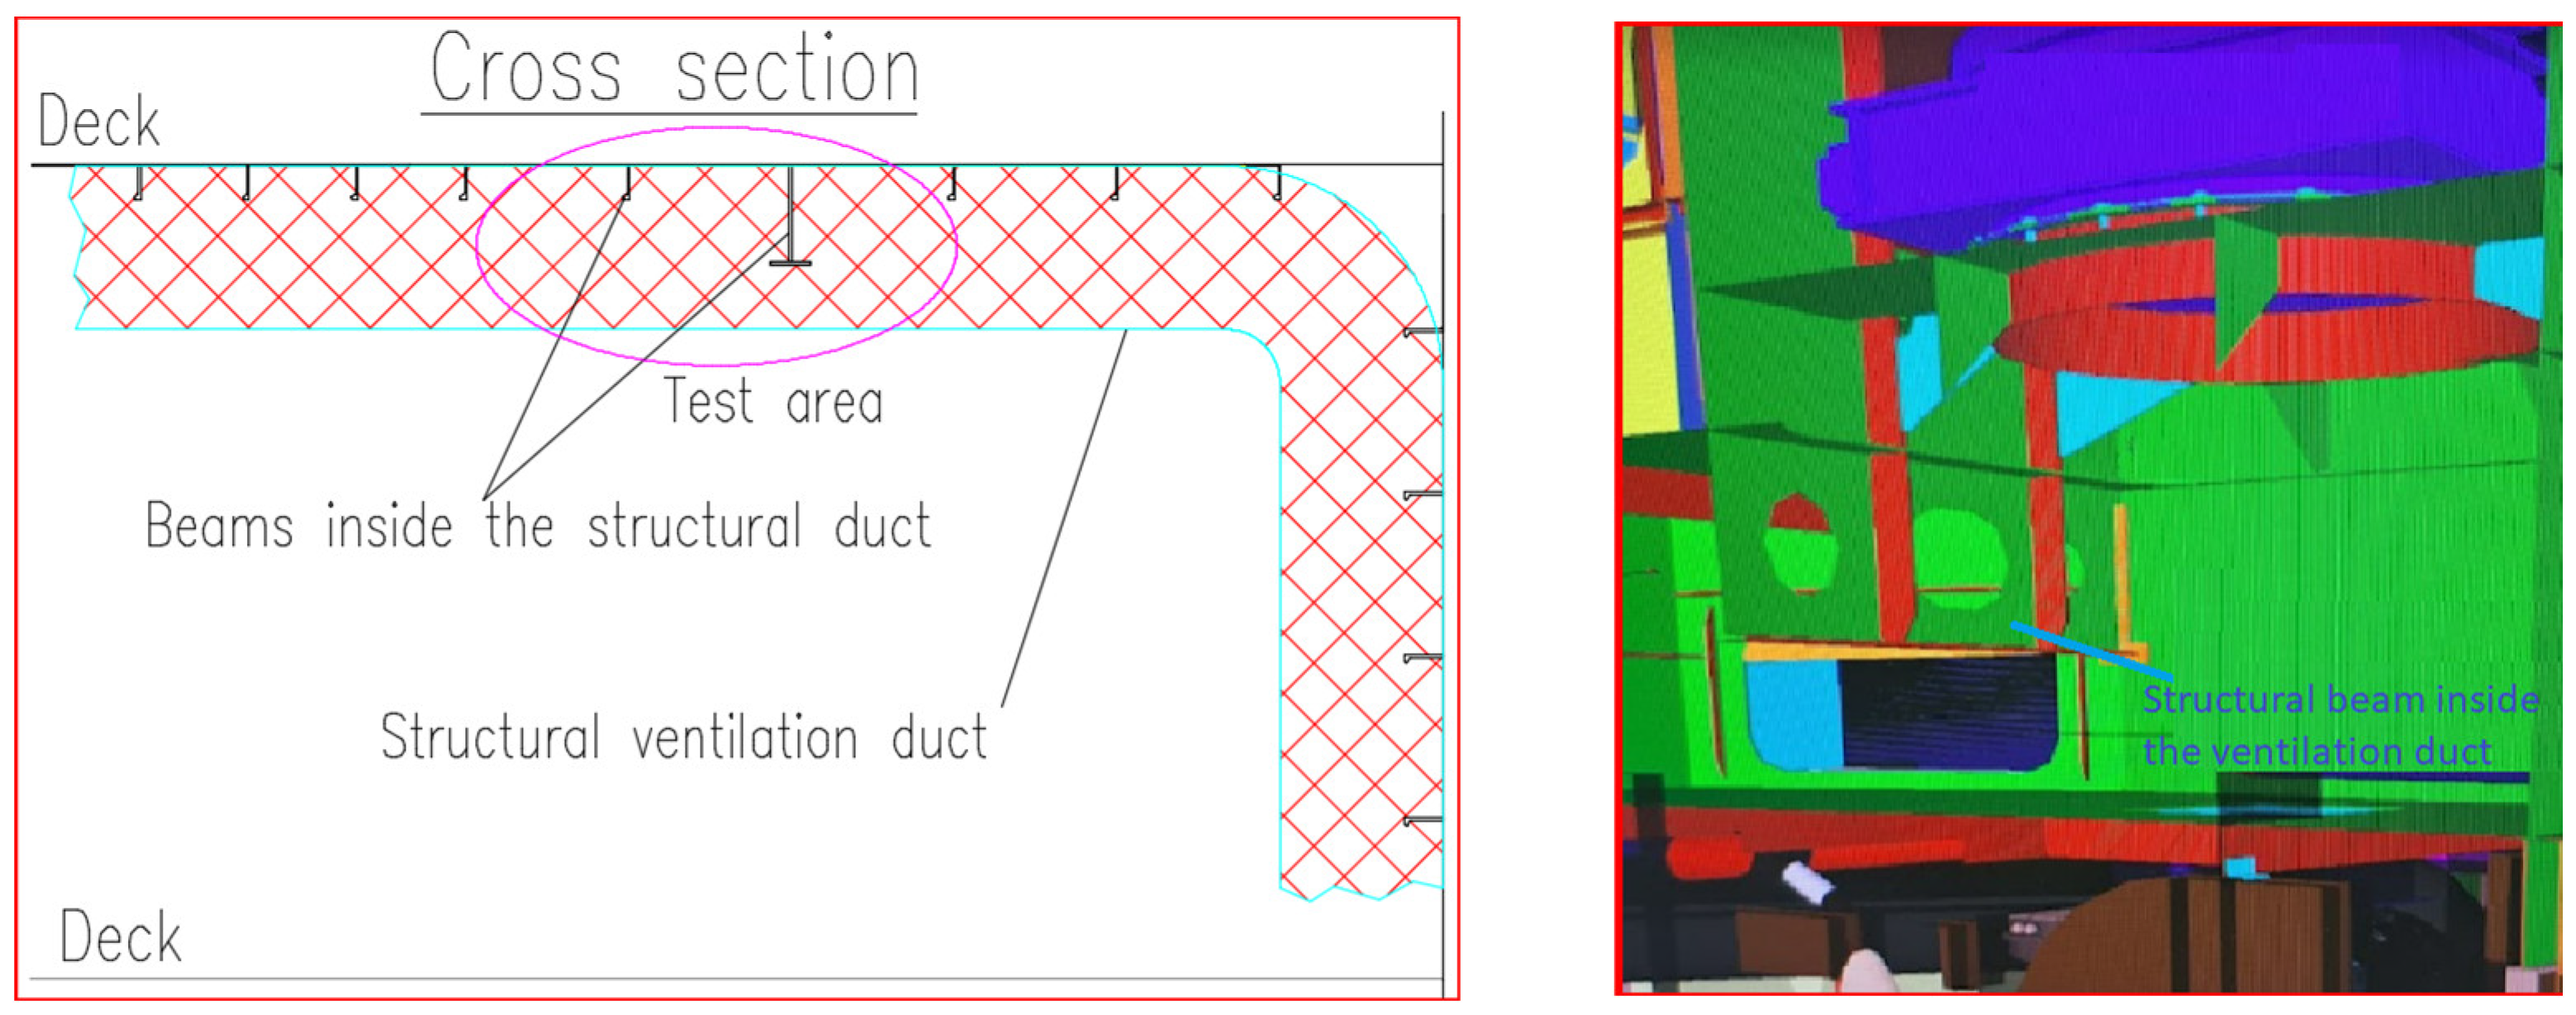
Reducing the total pressure drop across distribution ducts. This can be achieved by reducing the air speed across the ventilation duct, reducing the number of bends, reducing the length of the distribution ducts [6], and improving the airflow inside the ventilation ducts with a large cross-section. In the case of structural ducts, a big improvement can be made by adding air deflectors in the area of the structural beam or, if possible, providing holes into the structural beam.
In this study, the influence of the structural beam inside the structural ventilation ducts is analyzed, with special attention focused on the pressure losses in the area of the transversal beams.
Regarding the length of the ventilation ducts, it can be reduced by choosing the best solution for the arrangement of the rooms, especially for the rooms which are provided with high airflow and large ventilation ducts. In general, a high amount of air is requested for the engine room, galley, and hazardous spaces according to Classifications Societies’ requirements [7,8,9], as highlighted by Mihai et al. [10]. Another constraint is that the ventilation ducts from these rooms passing through the accommodation area, or ventilation ducts from hazardous spaces passing through other non-hazardous spaces, should be built from steel with thicknesses of 3 to 5 mm, according to SOLAS [11].
In the case of the engine room and emergency generator room ventilation, according to the Load Line [12] requirements, the openings must be led to a proper height above the deck so that the ventilation system can be kept without closing the appliances in any weather conditions. This should also be considered when the room location is chosen in order to have a straight vertical duct from the outside louver to the engine room area and short distribution ducts inside the engine room. This solution can reduce the pressure drop and, consequently, the pressure of the fan from 600–1000 Pa to only 200–300 Pa. In this way, if the pressure drop is reduced by 50%, from about 600 Pa to about 300 Pa, the electrical power of the fan and, consequently, the energy consumption can be reduced by about 50% [13,14,15].
Regarding the galley, it should be mentioned that this is a room with a high risk of fire located in the accommodation area, which has a large ventilation system. According to the SOLAS requirements [11], the ventilation ducts from the galley can pass through the accommodation area by using steel ducts only. In general, the owner prefers to have the room located close to the mess room, provision rooms, and freezer rooms, as indicated in the example presented in Figure 1, to have a good flow for preparing food, meal serving, and cleaning. In order to comply with these requirements, sometimes the galleys do not have external bulkheads or decks. Therefore, the ventilation ducts are routed through adjacent rooms from the accommodation and cross the main structural beams. Taking into consideration that the free height inside these rooms cannot be reduced, some compromises are made in the ventilation system, and the structural ventilation ducts with structural beams inside are used, as indicated in Figure 1 and Figure 2, instead of steel ducts located below the structural beams.
In this case, the ship’s structural beams of different sizes are caught inside the structural ventilation duct, as is highlighted in examples from Figure 2.
These transversal structural elements have a big impact on the airflow by increasing the turbulences and generating an air jet with high air velocity above the beams. Consequently, the total pressure losses across the ventilation ducts will increase.
In the last years, multiple studies have been carried out for the optimization of ventilation systems by using CFD analyses. The best alignment between the CFD model used and the experimental data depends on different variables. In the case of the main cabin ventilation, Yingchun Xie et al. [16] pointed out that the Standard k-ε model and shear stress transport (SST) k-ω model provided the best results, and the Standard k-ε model has been adopted for their study. Tasdemir and Bayraktar [17] have used a Standard k-ε model for improving the ventilation of the engine room. Such Standard k-ε model was also used by Chang et al. [18] to optimize the ventilation systems for the underground mine. Tai et al. [19] used the RNG k-ε model to investigate the louver angles and positions of cross ventilation in a generic isolated building. The realizable k-ϵ turbulence model was used by Zheng et al. [20] for CFD simulations of “wind flow and mean surface pressure for buildings with balconies”. The k-ϵ turbulence model has been successfully used in many CFD simulations of wind flow around the buildings [21,22,23,24,25,26]. Smyk et al. [27] have concluded that the deflectors can reduce turbulences and influence flow stabilization. Pakawhat and Yottana [28], using the Standard k-ϵ turbulence CFD model, found that 75% of the total pressure drop across the rectangular intake ventilation duct concentrates in a small area with measuring equipment. After the CFD calculation and the improvement achieved for the airflow, the pressure drop in that area was reduced by 71%. Therefore a large improvement in terms of energy consumption was obtained. The authors have concluded that the concept of their research should be applied to other systems or industries.
Enam et al. [29] investigated the effect of grilles blockage on airflow using the standard k-ε turbulence models. As was expected, the velocity drops, and the pressure losses increase when the blockage ratio increases.
Kubas et al. [30] calculated the pressure drop across the air silencer and, using the experimental measurements, concluded that the CFD k-ϵ realizable model gave the most accurate results.
From this perspective, the main purpose of our study is to show the impact of the transversal structural beams inside the ventilation ducts and to analyze the possible solution to improve the airflow and reduce the pressure losses inside the ventilation ducts. By reducing the pressure losses, energy consumption will be reduced. According to the CFD analysis performed with the standard k-ε model was also used with good results in other studies [16,17,18] and validated for this study with some experimental measurements in the wind tunnel, it can be concluded that the transversal structural beams inside the ventilation duct must be provided with air deflectors or holes. The air deflectors will reduce the turbulences downstream of the beam, cancel the big vortices and the backflow in the lower part of the ventilation duct, and finally, reduce the pressure losses across the beam by up to 90%. If the beams can be provided with holes, these could also reduce the pressure losses, but the positive impact is smaller than the one obtained by the air deflector. Finally, it is concluded that by making 30% holes into the beam from the total area, the pressure losses across the beam will be twice as high as the pressure losses across the beam provided with air deflectors.

2. Materials and Methods

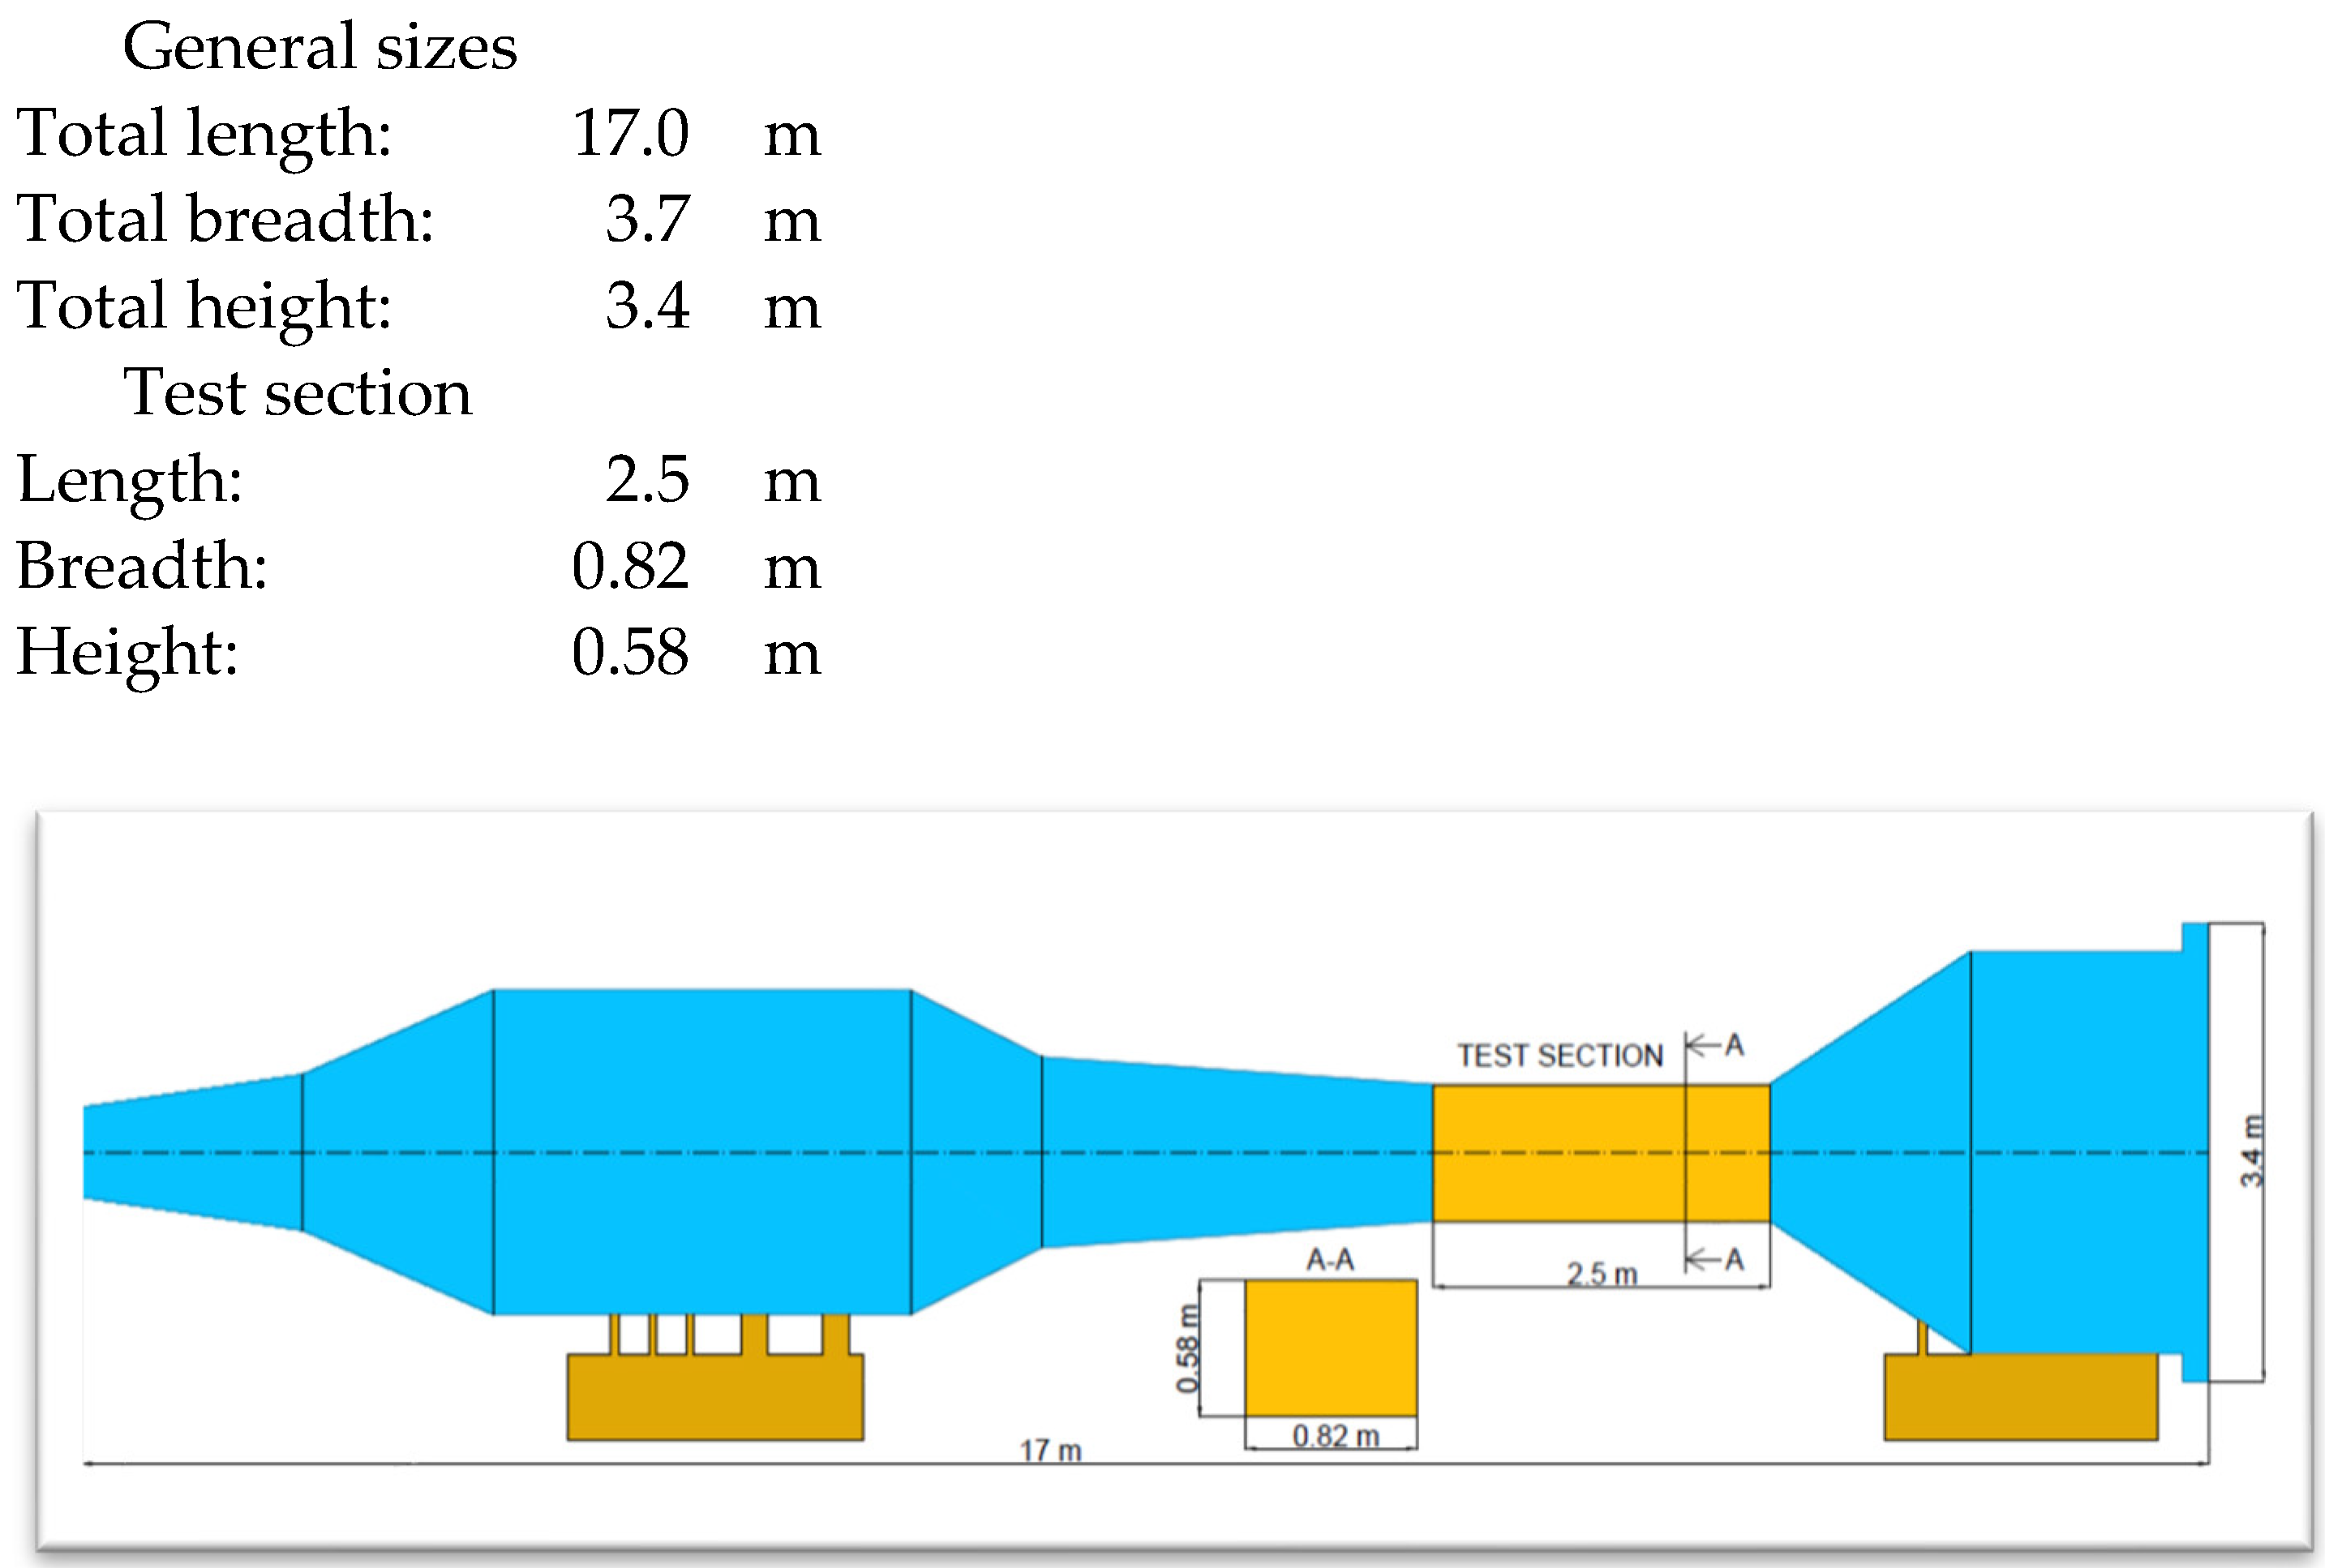
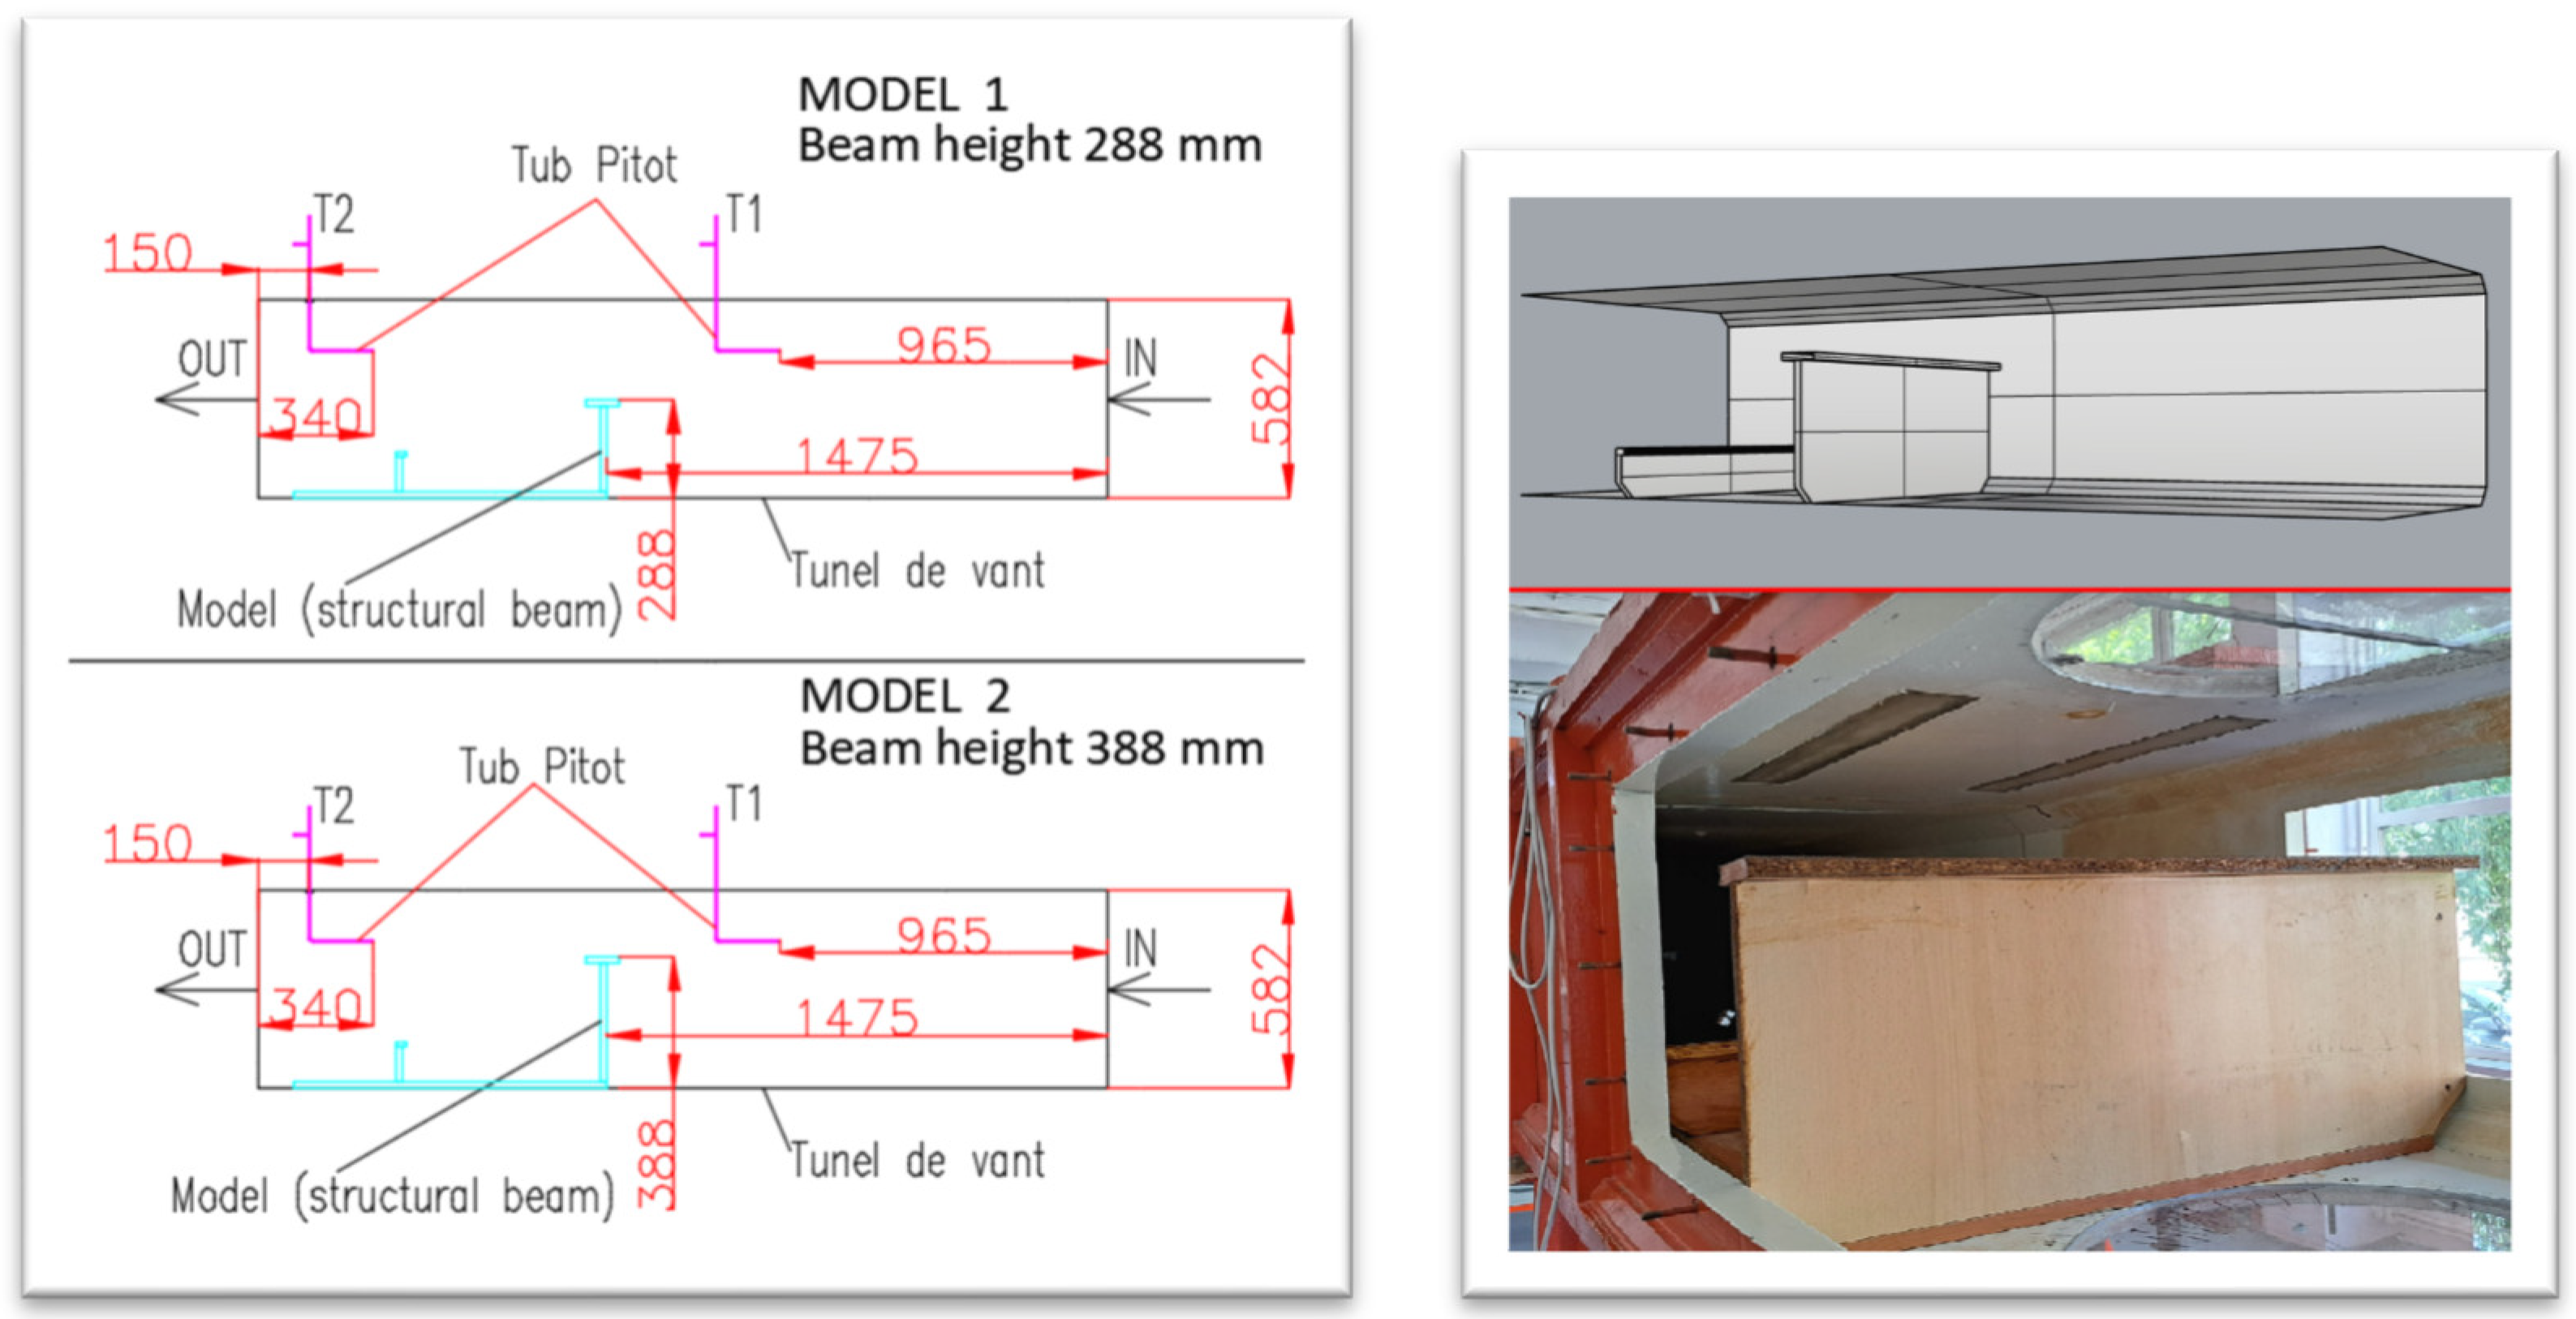
2.1. Wind Tunnel and Experimental Model

In order to evaluate the impact of the transversal beams inside the ventilation ducts, the experimental measurements have been carried out using the facilities from the laboratory of the Naval Architecture Faculty from the “Dunarea de Jos” University of Galati.
In these experiments, the wind tunnel itself simulates the ventilation duct, and the model analyzed is the structural beam installed inside the test section. The experiments have been carried out for two heights of the structural beam. The first one has a height lower than half of the height of the wind tunnel, while the second one has a height greater than half of the tunnel height.
The wind tunnel has the following characteristics, indicated also in Figure 3:
The wind tunnel has an axial fan with an electric motor of 55 kW, 1450 rpm, 400 V, 32 A, and 50 Hz, and with variable speed controlled by a frequency drive. During the measurements, the speed is controlled at fixed steps. The wind tunnel is provided with an open recirculation system inside the laboratory, as shown in Figure 4.
The sketch of the wind tunnel test area with the model installed inside is indicated in Figure 5, where the position of the measuring points T1 located upstream of the beam is indicated; respectively, T2 is located downstream of the beam. The IN/OUT refer to the test area only and are added to show the airflow direction. The CFD model is extended 5 m downstream of the testing area by keeping the cross section.
The measuring points in the wind tunnel cross sections are referenced to the centerline and to the ceiling of the wind tunnel, as indicated in Figure 6.

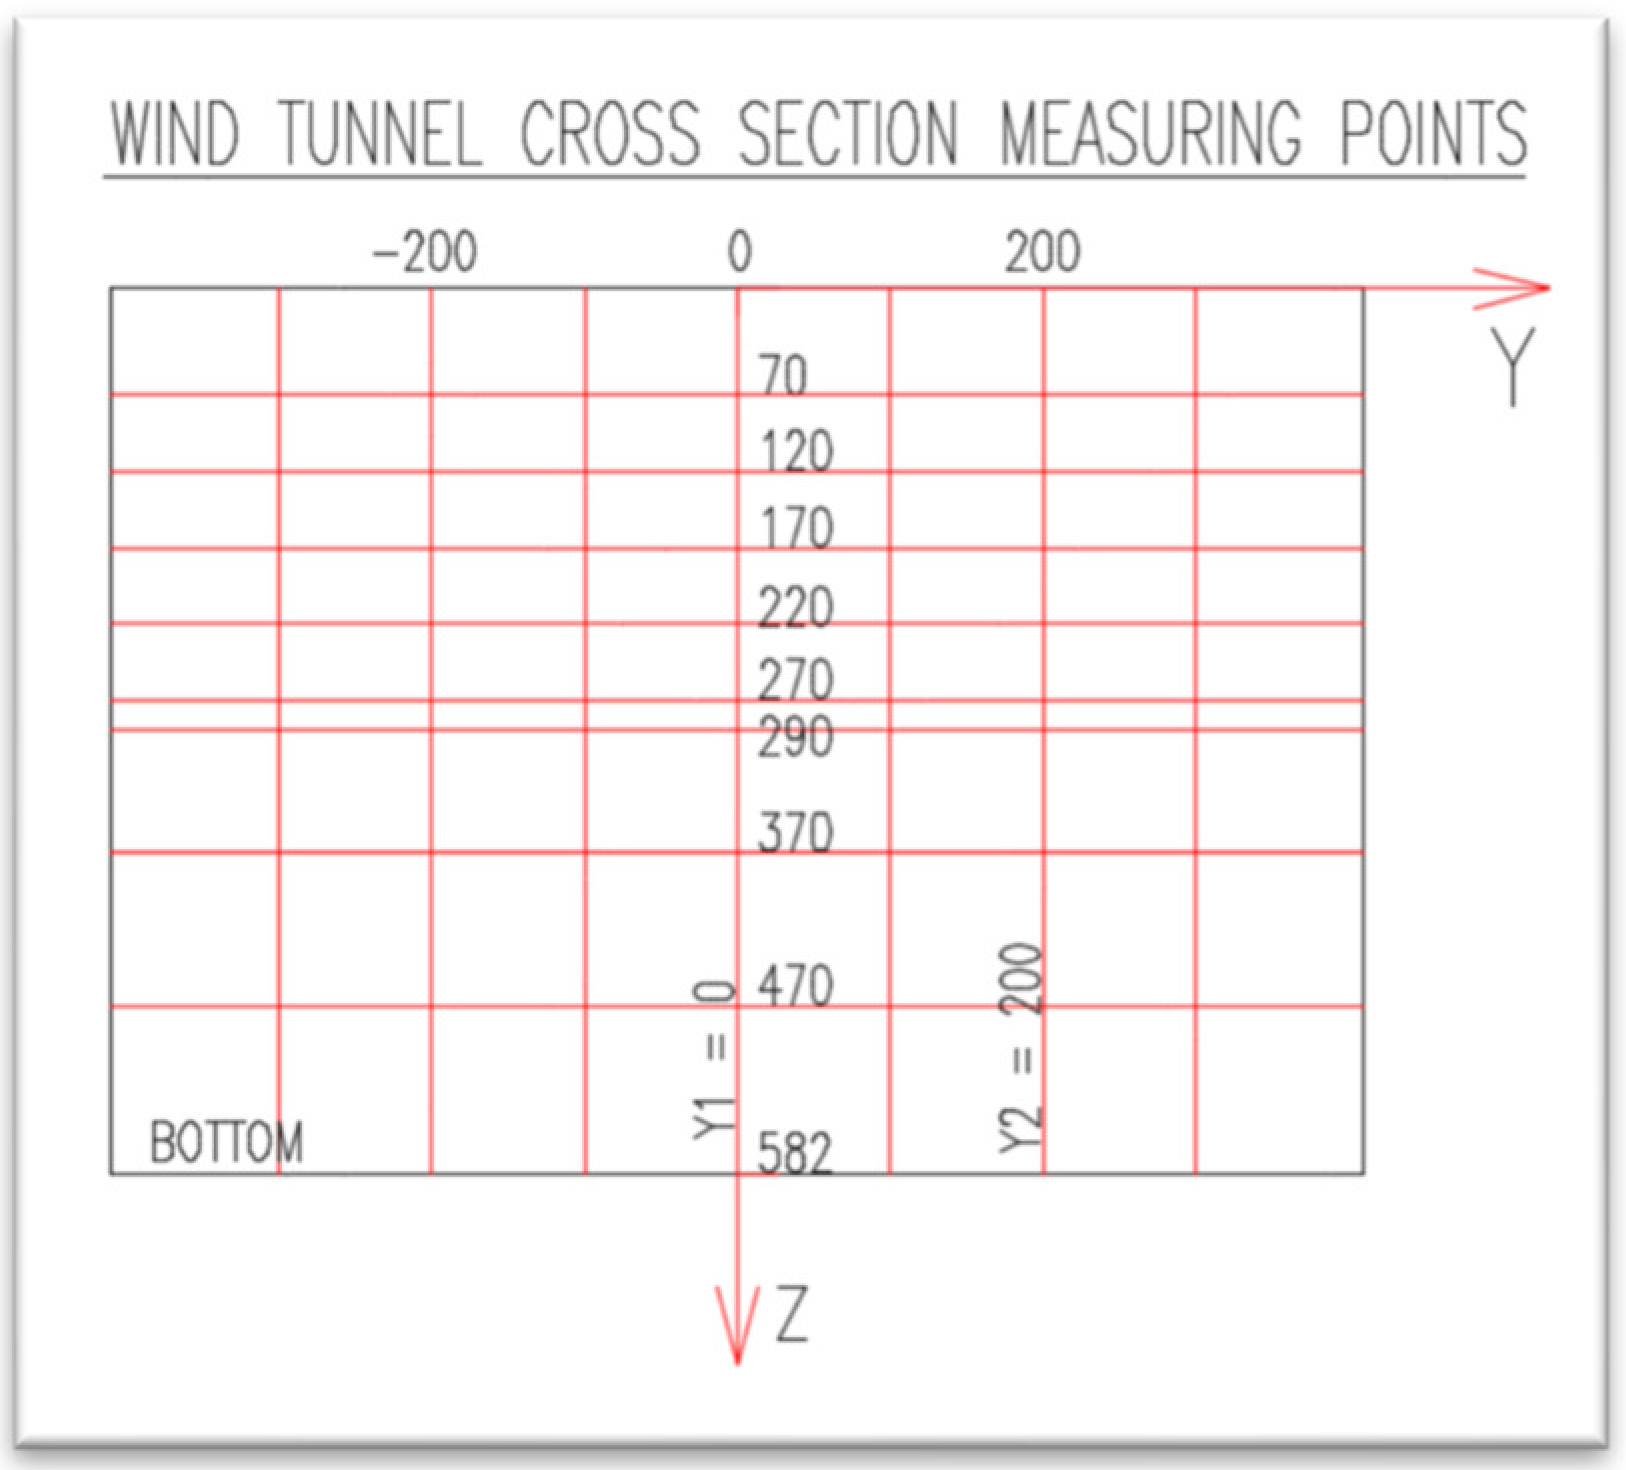
2.2. Experimental Measurements and Measuring Devices Used

Multiple measurements were made to determine the airspeed in the wind tunnel for various fan speeds, without the model (without the beam inside) and then with the model fixed inside the tunnel. The pressure and air velocity have been measured using the following measuring instruments:
  • Temperature and relative humidity (RH) data logger (Figure 7) type PeakTech 5185 [31].
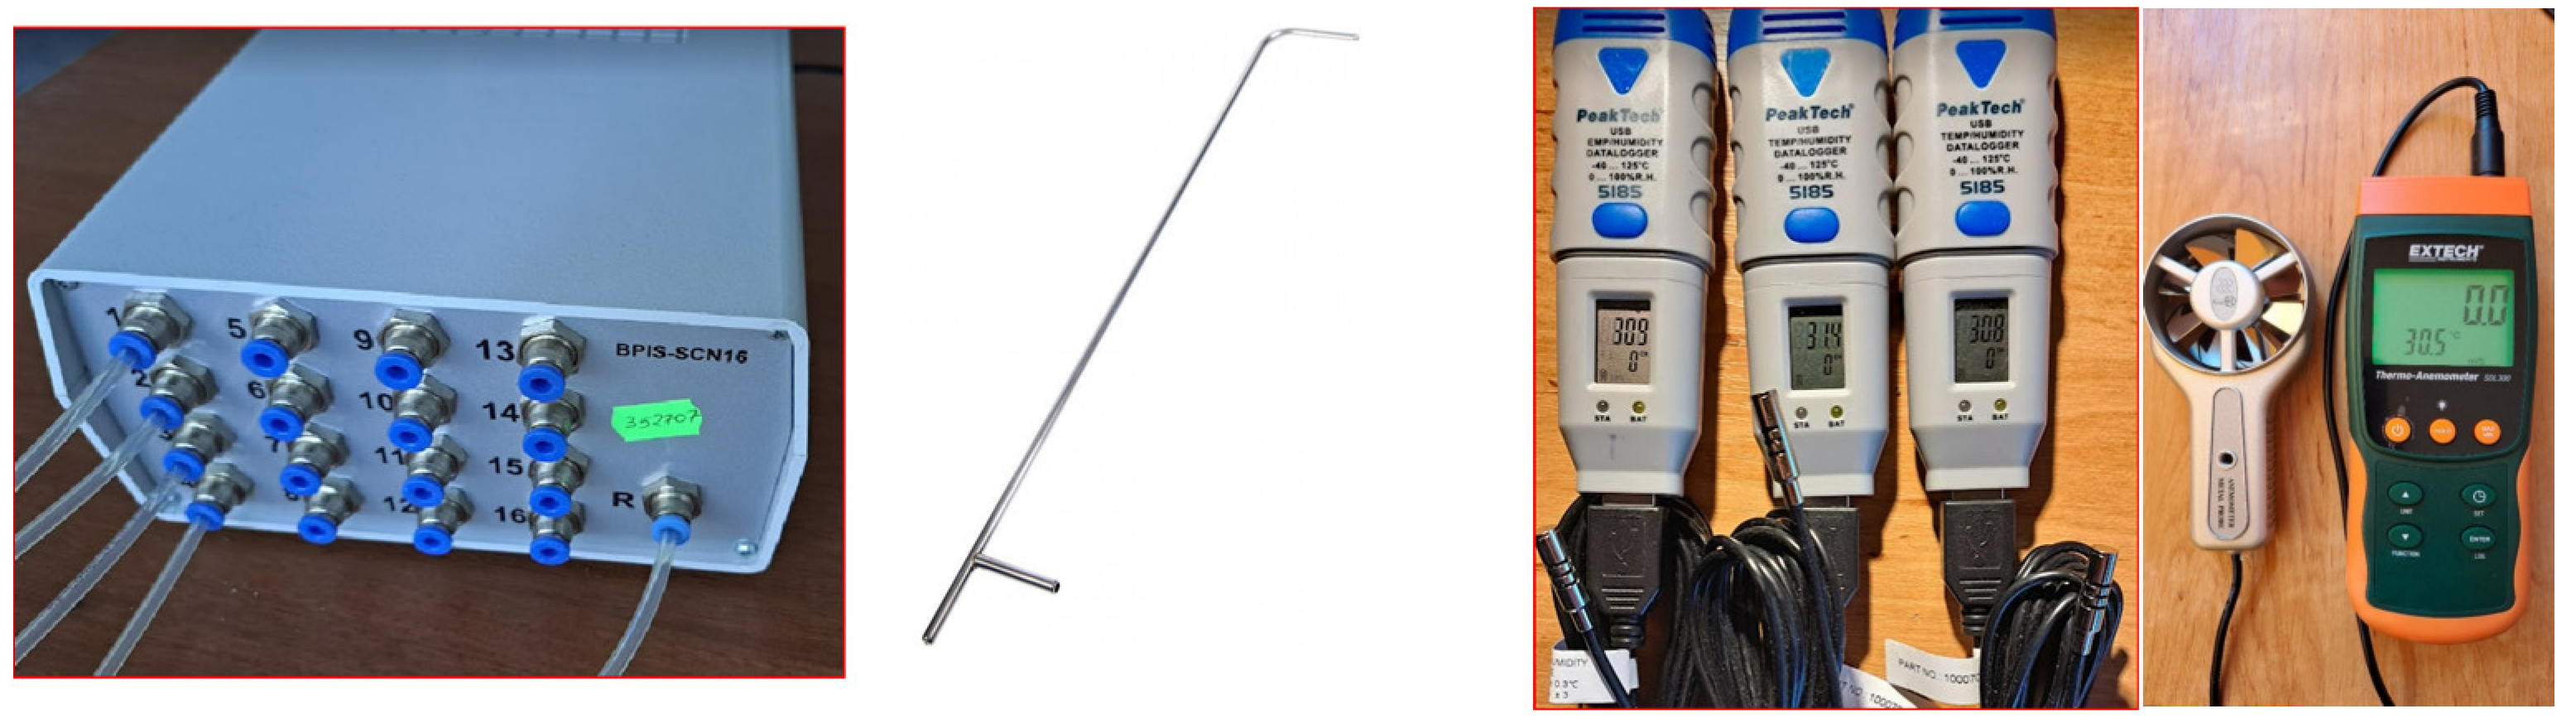
    During the measurements, the air had the following characteristics measured with three temperature and humidity data loggers:
    PeakTech 5185-1: 30.9 °C 50.7%;
    PeakTech 5185-2: 30.8 °C 51.0%;
    PeakTech 5185-3: 31.4 °C 50.1%.
    Based on the measured values for temperature and humidity, the following air characteristics were adopted for calculations:
    Average temperature: 31 °C;
    Relative humidity: 51%;
    Air density: 1151 kg/m3 (as referenced [32,33]).
  • Pitot tubes, together with the electronic scanner with 16 pressure points type BPIS-SCN16 indicated in Figure 7, have a precision of ±1.5%, according to the maker data sheet.
    The air velocity (v) is calculated with Formula (1) [34], using the dynamic pressure (pd) indicated by the Electronic Pressure Scanner as the difference between the total pressure (pt) and the static pressure (ps) measured with the Pitot tubes:
    v = 2   ×   pd ρ
    where ρ is the air density [34].
    pd = pt ps
  • The thermo-anemometer type SDL300 (Figure 7), which has a precision of ±2% for air velocity of 0.4 m/s to 35 m/s and 0.8 °C for temperature less than 80 °C [35].
In order to check the precision of the equipment used, the results were recorded three times, in the same conditions, with a time step of 10 s. The precision of the Pitot tubes with the electronic scanner was between 0.4% to 3.1%. It was noted that for some measurements, it was higher than the one indicated by the maker (1.5%), but for this experiment, it was accepted that the air turbulences in the measuring area were high and had an influence on the results of the measurements [36,37].
The measurements performed with the thermo-anemometer have small differences between different measurements in the same conditions, which can be explained by the inertia of the metal vane and the average data recorded. However, there are some differences between the pitot tube and the thermo-anemometer, which are between 3% to 9%.
The air velocities were measured at different points located between 50 mm and 350 mm under the ceiling of the tunnel in section T1 for different speed steps of the fan. The average air velocity for each step of the fan was calculated, and the values are given in Table 1.
Based on the air velocity indicated in Table 1, it can be observed that the air velocity and airflow at the entrance of the wind tunnel decrease drastically for the same fan speed after adding the model (structural beam) inside the test area of the wind tunnel. Thus, after placing the model in the test area, it creates a sufficiently high-pressure loss so that the air velocity and airflow rate at the tunnel entrance decrease to approximately 35% of the nominal flow rate without the model. These results highlight the major negative impact of a transversal beam inside the ventilation duct.
When the beam height is reduced to 288 mm, the air velocity increases to 8.1 m/s (49%), as indicated in Table 2 below.
Regarding the airflow downstream of the beam (area T2), it is noticed that the air velocity has a large variation between the upper and lower sides, as seen in Table 3 below.
According to the data recorded, there is a jet of air in the upper part of the tunnel where the air velocity increases to over 20 m/s in the case of fan speed “IC20” and to over 16 m/s in the case of the fan speed “IC16”. At the bottom, the air velocity has values between 1 and 4 m/s in the case of fan speed “IC20”, and between 0.4 and 3.8 m/s in the case of the fan speed “IC16”. It should be noted that there is an area with zero speed in the shadow of the beam, and the direction of the flow is reversed at the bottom of the tunnel. The reverse flow is also highlighted by the wool wires mounted on the model, as can be seen in Figure 8. Therefore, the air flows only in the upper part of the ventilation duct, then the height of the ventilation duct in the shadow of the beam is not used by the airflow as it should be.

2.3. CFD Simulations

The CFD simulation is performed at the natural scale of the model and the natural scale of the test section of the wind tunnel, which simulates the ventilation duct. The calculations were carried out using ANSYS Fluent and considering different turbulent models and tetrahedral mesh with different sizing (coarse, medium, and fine) with high smoothing. Taking into consideration that there are no notable differences in the results for medium and fine mesh, the final calculation has been made with a medium-size mesh.
The 3D model used in the CFD calculation is performed according to Figure 5, which was extended 5 m downstream of the test area. Therefore, the total length of the 3D model is 7.5 m, 2.5 m to simulate the wind tunnel test area, plus 5 m downstream of the test area. The beam is located at a distance of 1.47 m from the air inlet connection. The CFD analysis was performed for two heights of the structural beam: one of 288 mm and another one of 388 mm. All the CFD analyses were performed with the solution method SIMPLE as a pressure–velocity coupling with the best results for the steady-state model. The air temperature of 31 °C, RH 51%, the density of 1.151 kg/m3, and viscosity of 1.872 kg/ms are used as the fluid, similar to the environmental conditions recorded during the experimental test. A uniformly distributed inlet air velocity of 7.9 m/s was set.
The wall shell is steel with a no-slip shear condition and constant wall roughness of 0.5 with no thermal transfer. The inlet is provided with constant and uniformly distributed velocity with a turbulent intensity of 5% and a turbulent viscosity ratio of 10.

3. Results

The objective of this paper is to analyze the influence of the transversal structural beams inside the ventilation ducts with a focus on the additional pressure drop across the beam and the energy wasted to pass the airflow through this section of the ventilation duct. By using a tetrahedral medium mesh size, the results of a CFD analysis with the standard k-ε model, shear stress transport (SST) k-ω model, and standard k-ω model are quite similar. The variable k-kl-ω has some differences in the area with high velocity.

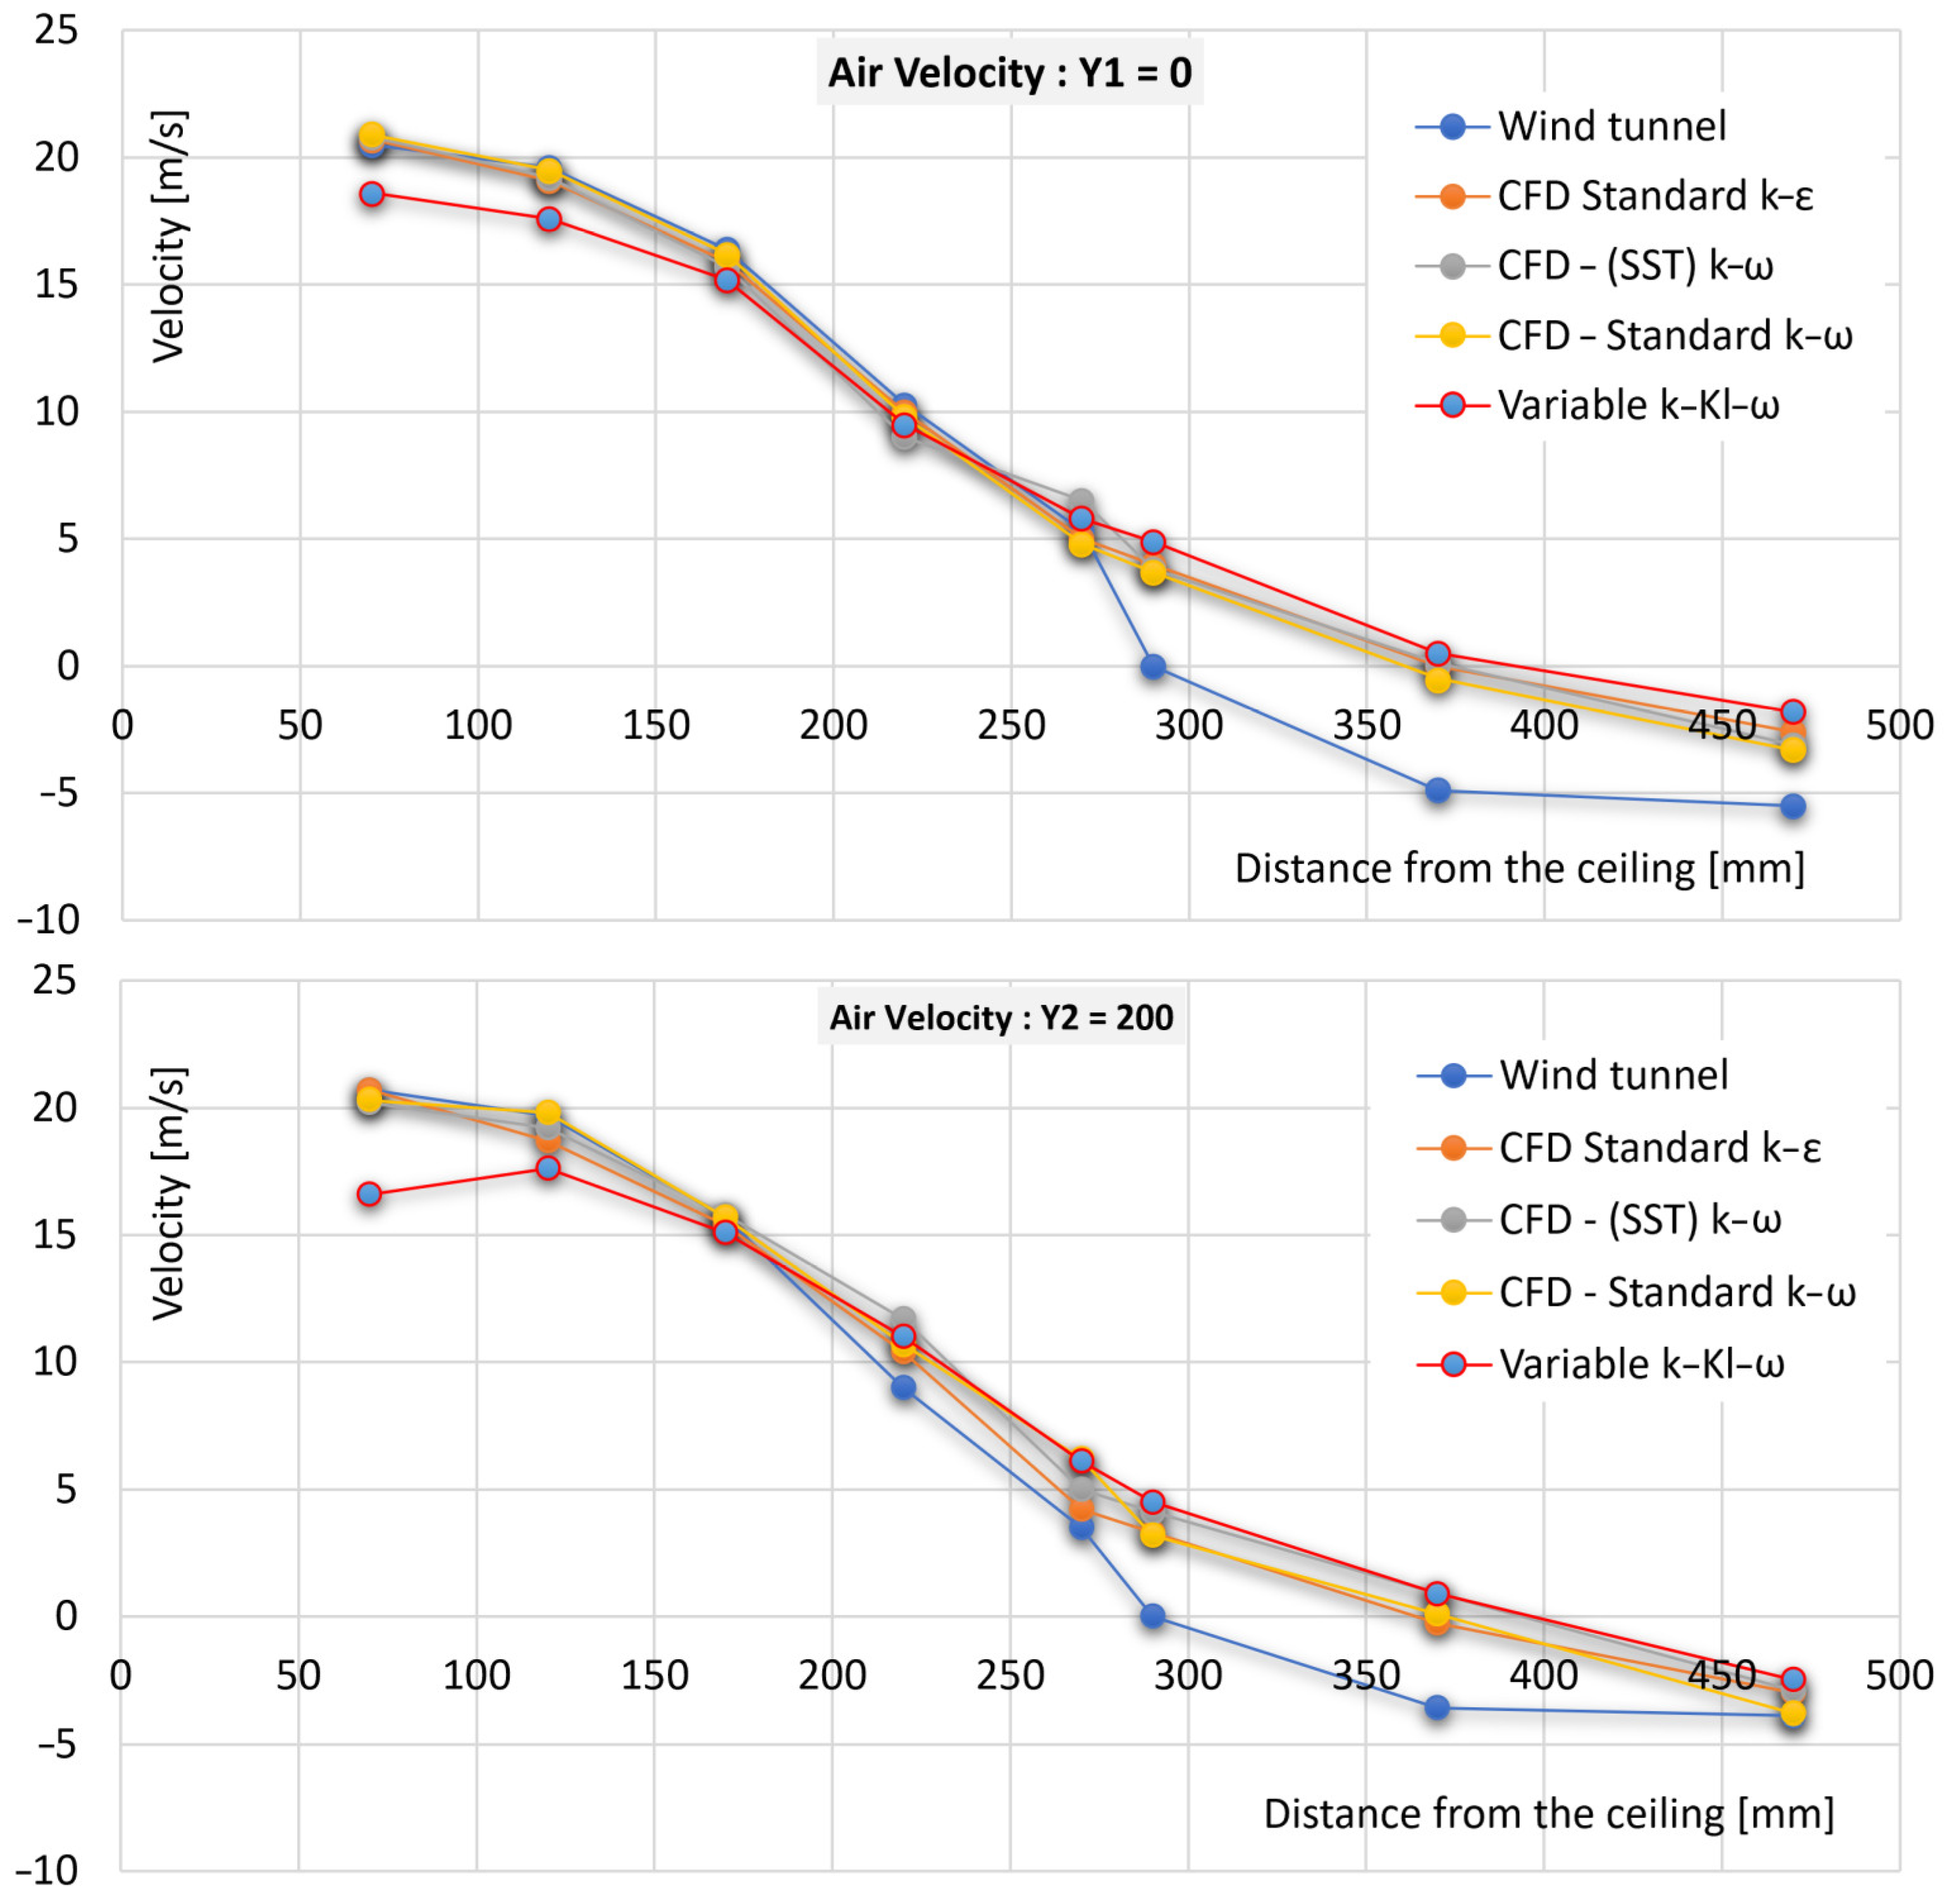
3.1. CFD Results vs. Experimental Measurements

The air velocity recorded during the experimental measurements on the wind tunnel in the two measuring areas, T1 (upstream of the model) and, respectively, T2 (downstream of the model), are compared with the data obtained after the CFD calculation in the same measuring points. As seen in Figure 9, in the upper part of the tunnel, the air velocity obtained from the CFD calculation very well matches the data recorded during the experimental measurements. In the lower part of the tunnel, small differences were found between the velocities calculated with different CFD models, but the results are quite different from the ones recorded during the wind tunnel experiment. These differences are explained by the low accuracy of the experiment’s measurements in this area. The accuracy of the experimental measuring in the lower part of the wind tunnel is not conclusive because, for small variations on the x- and z-axis, the air velocity has different values, as seen in Figure 10. The air velocity could not be measured in that area.

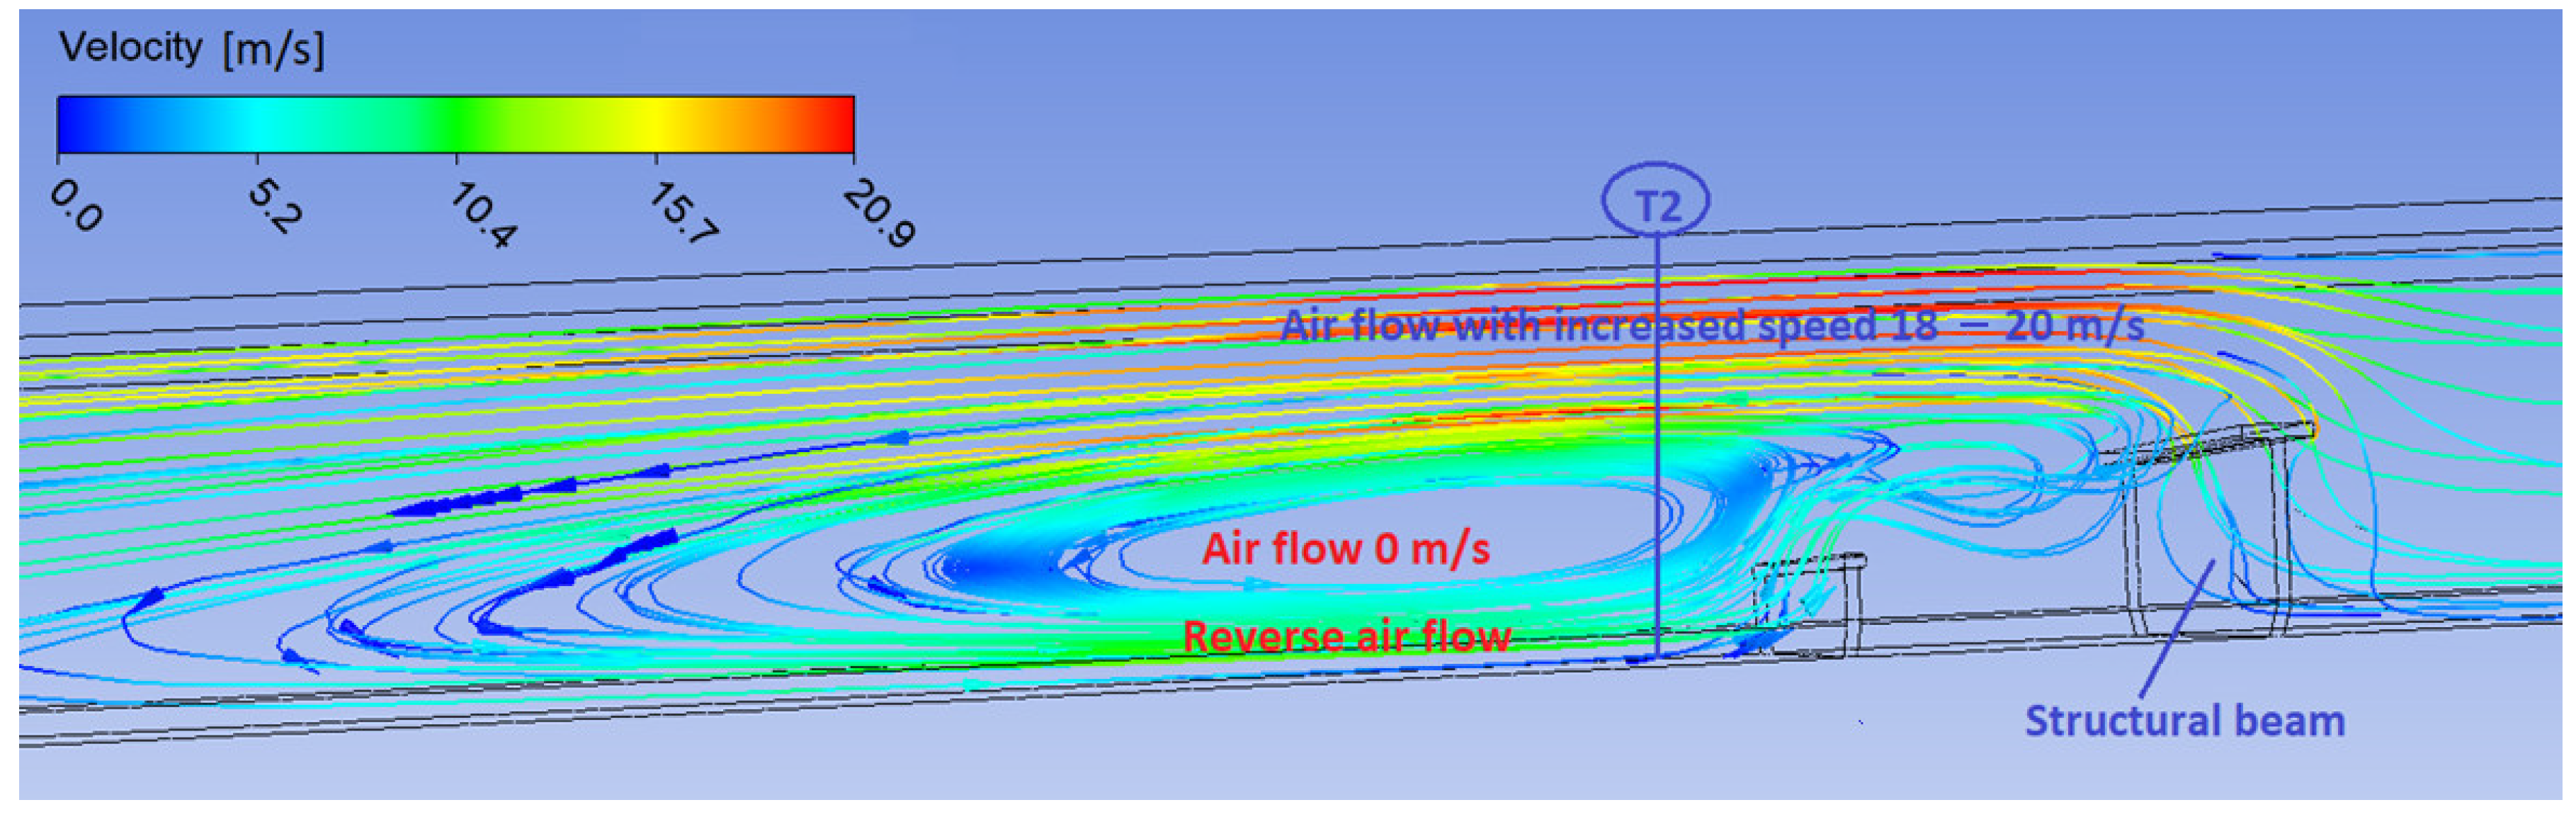
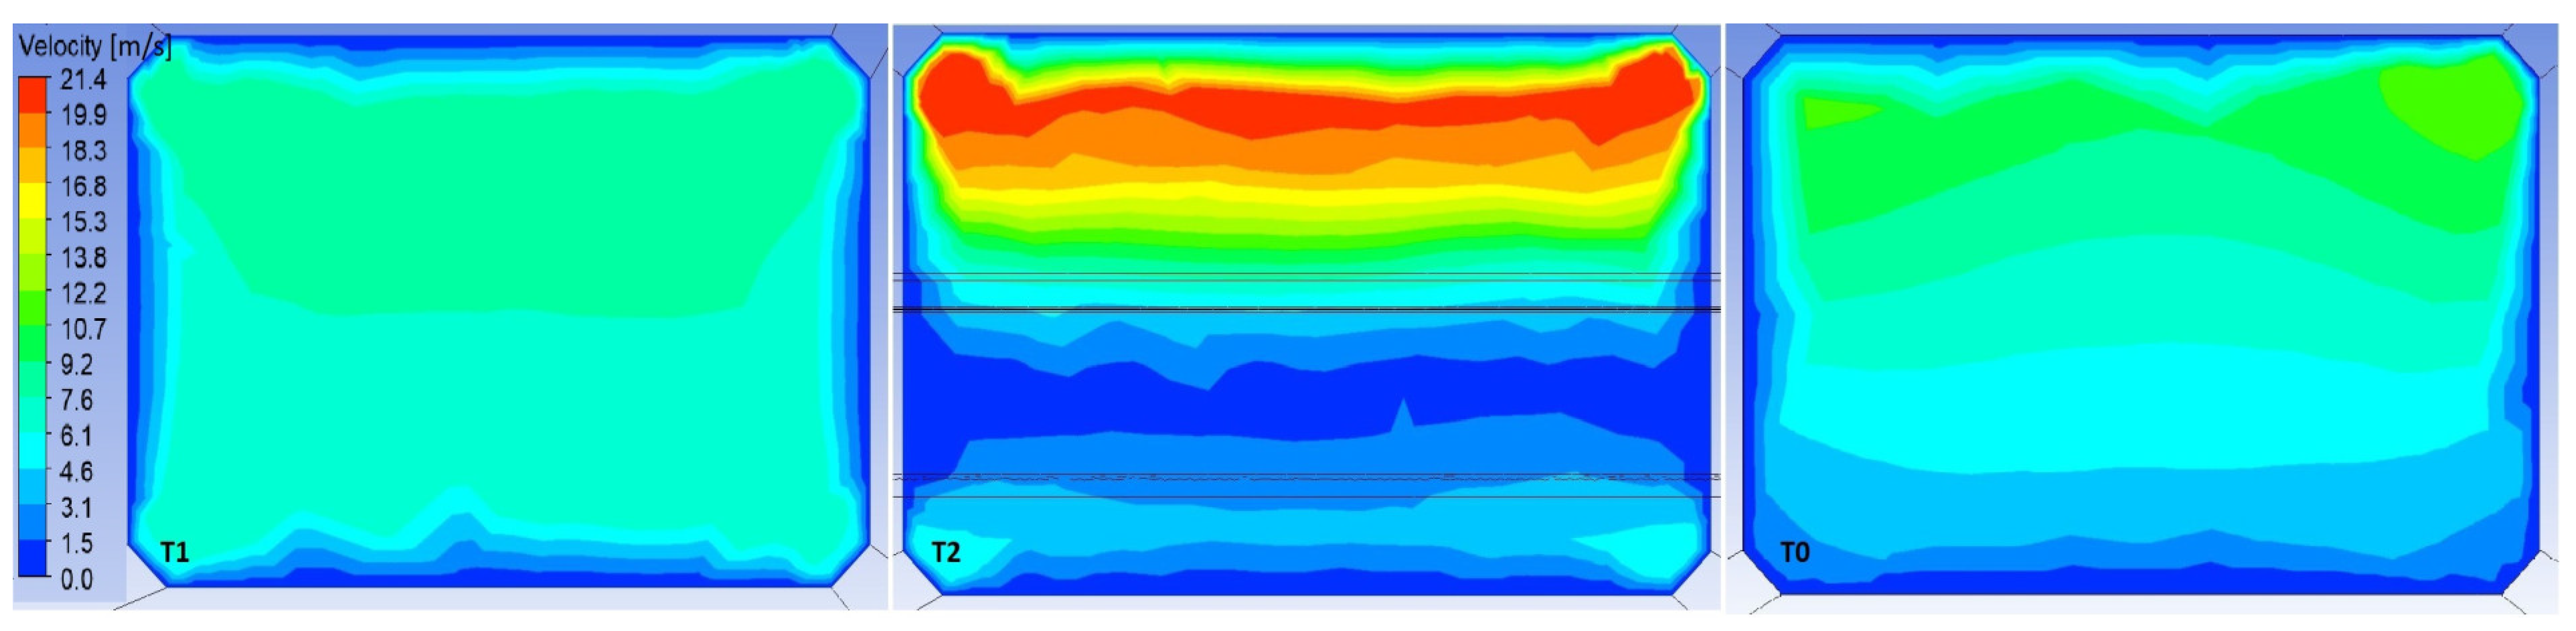
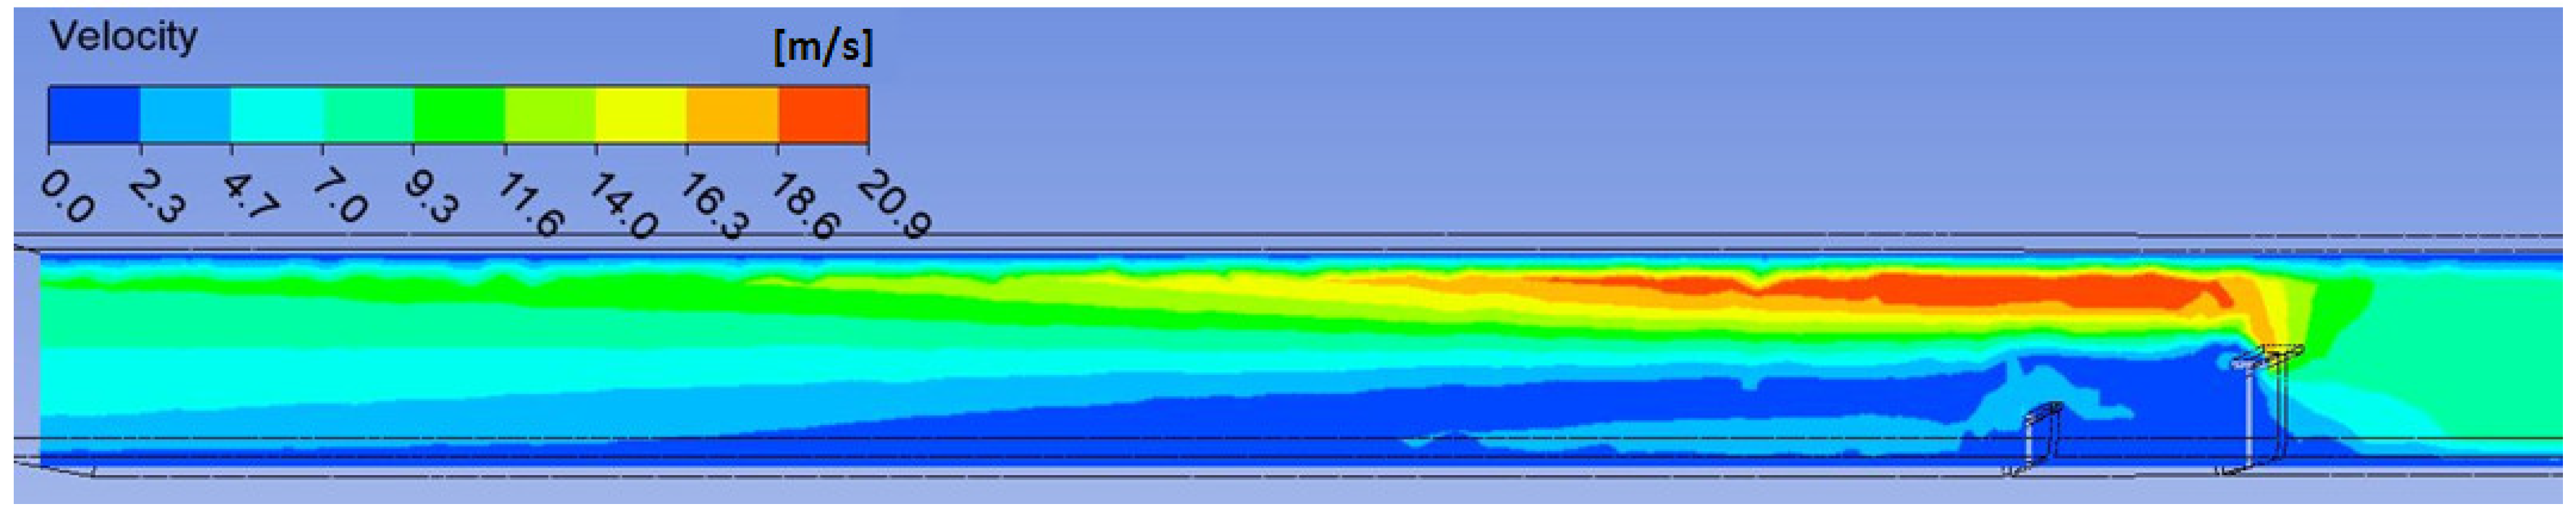
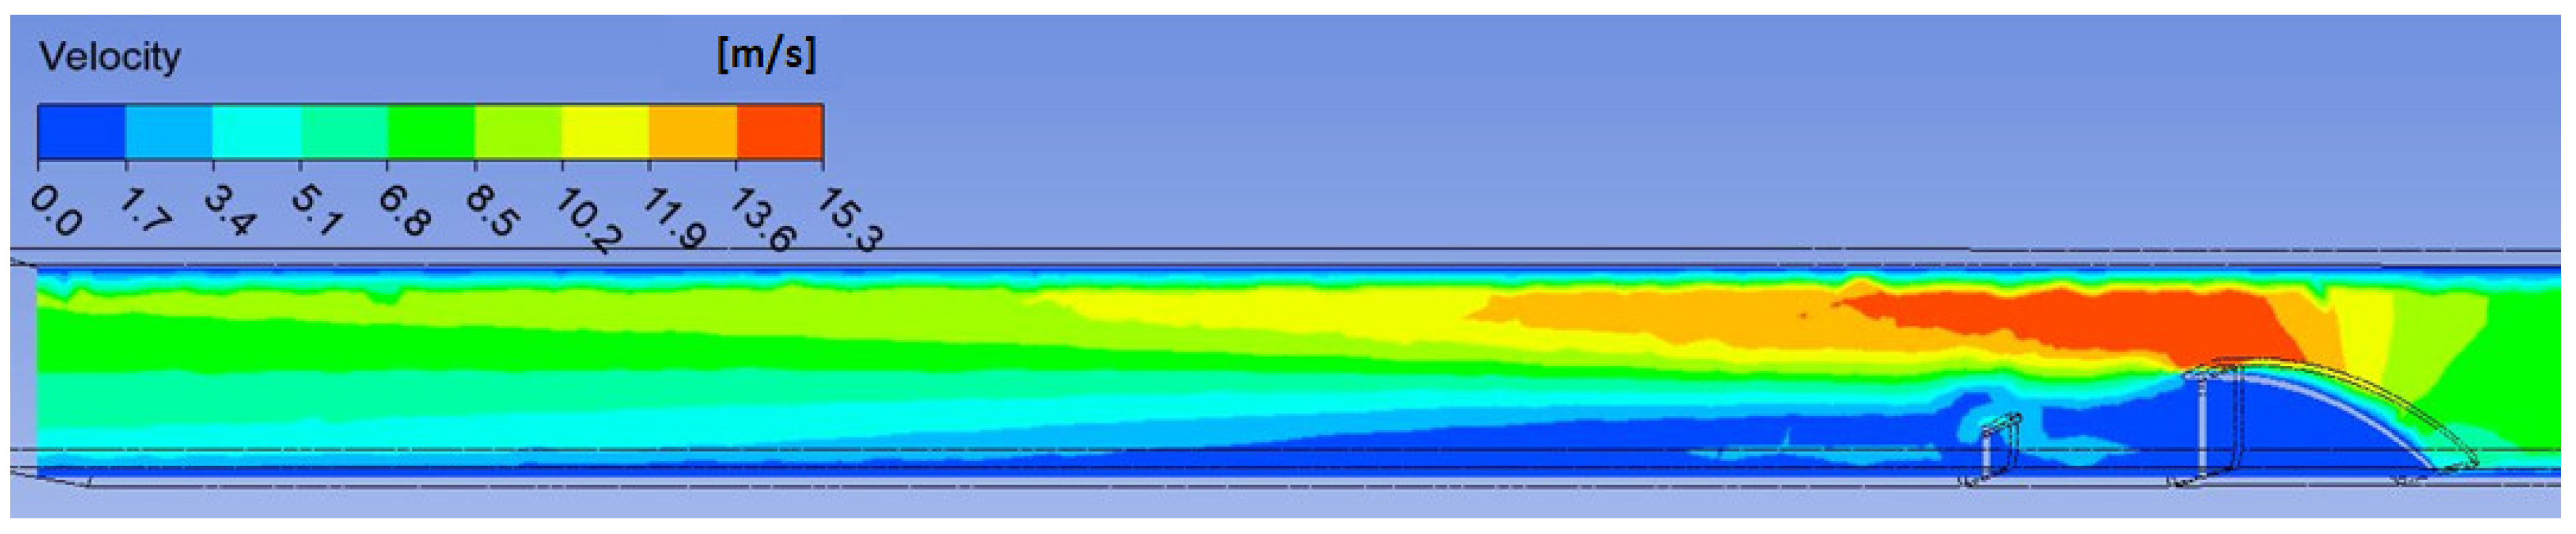
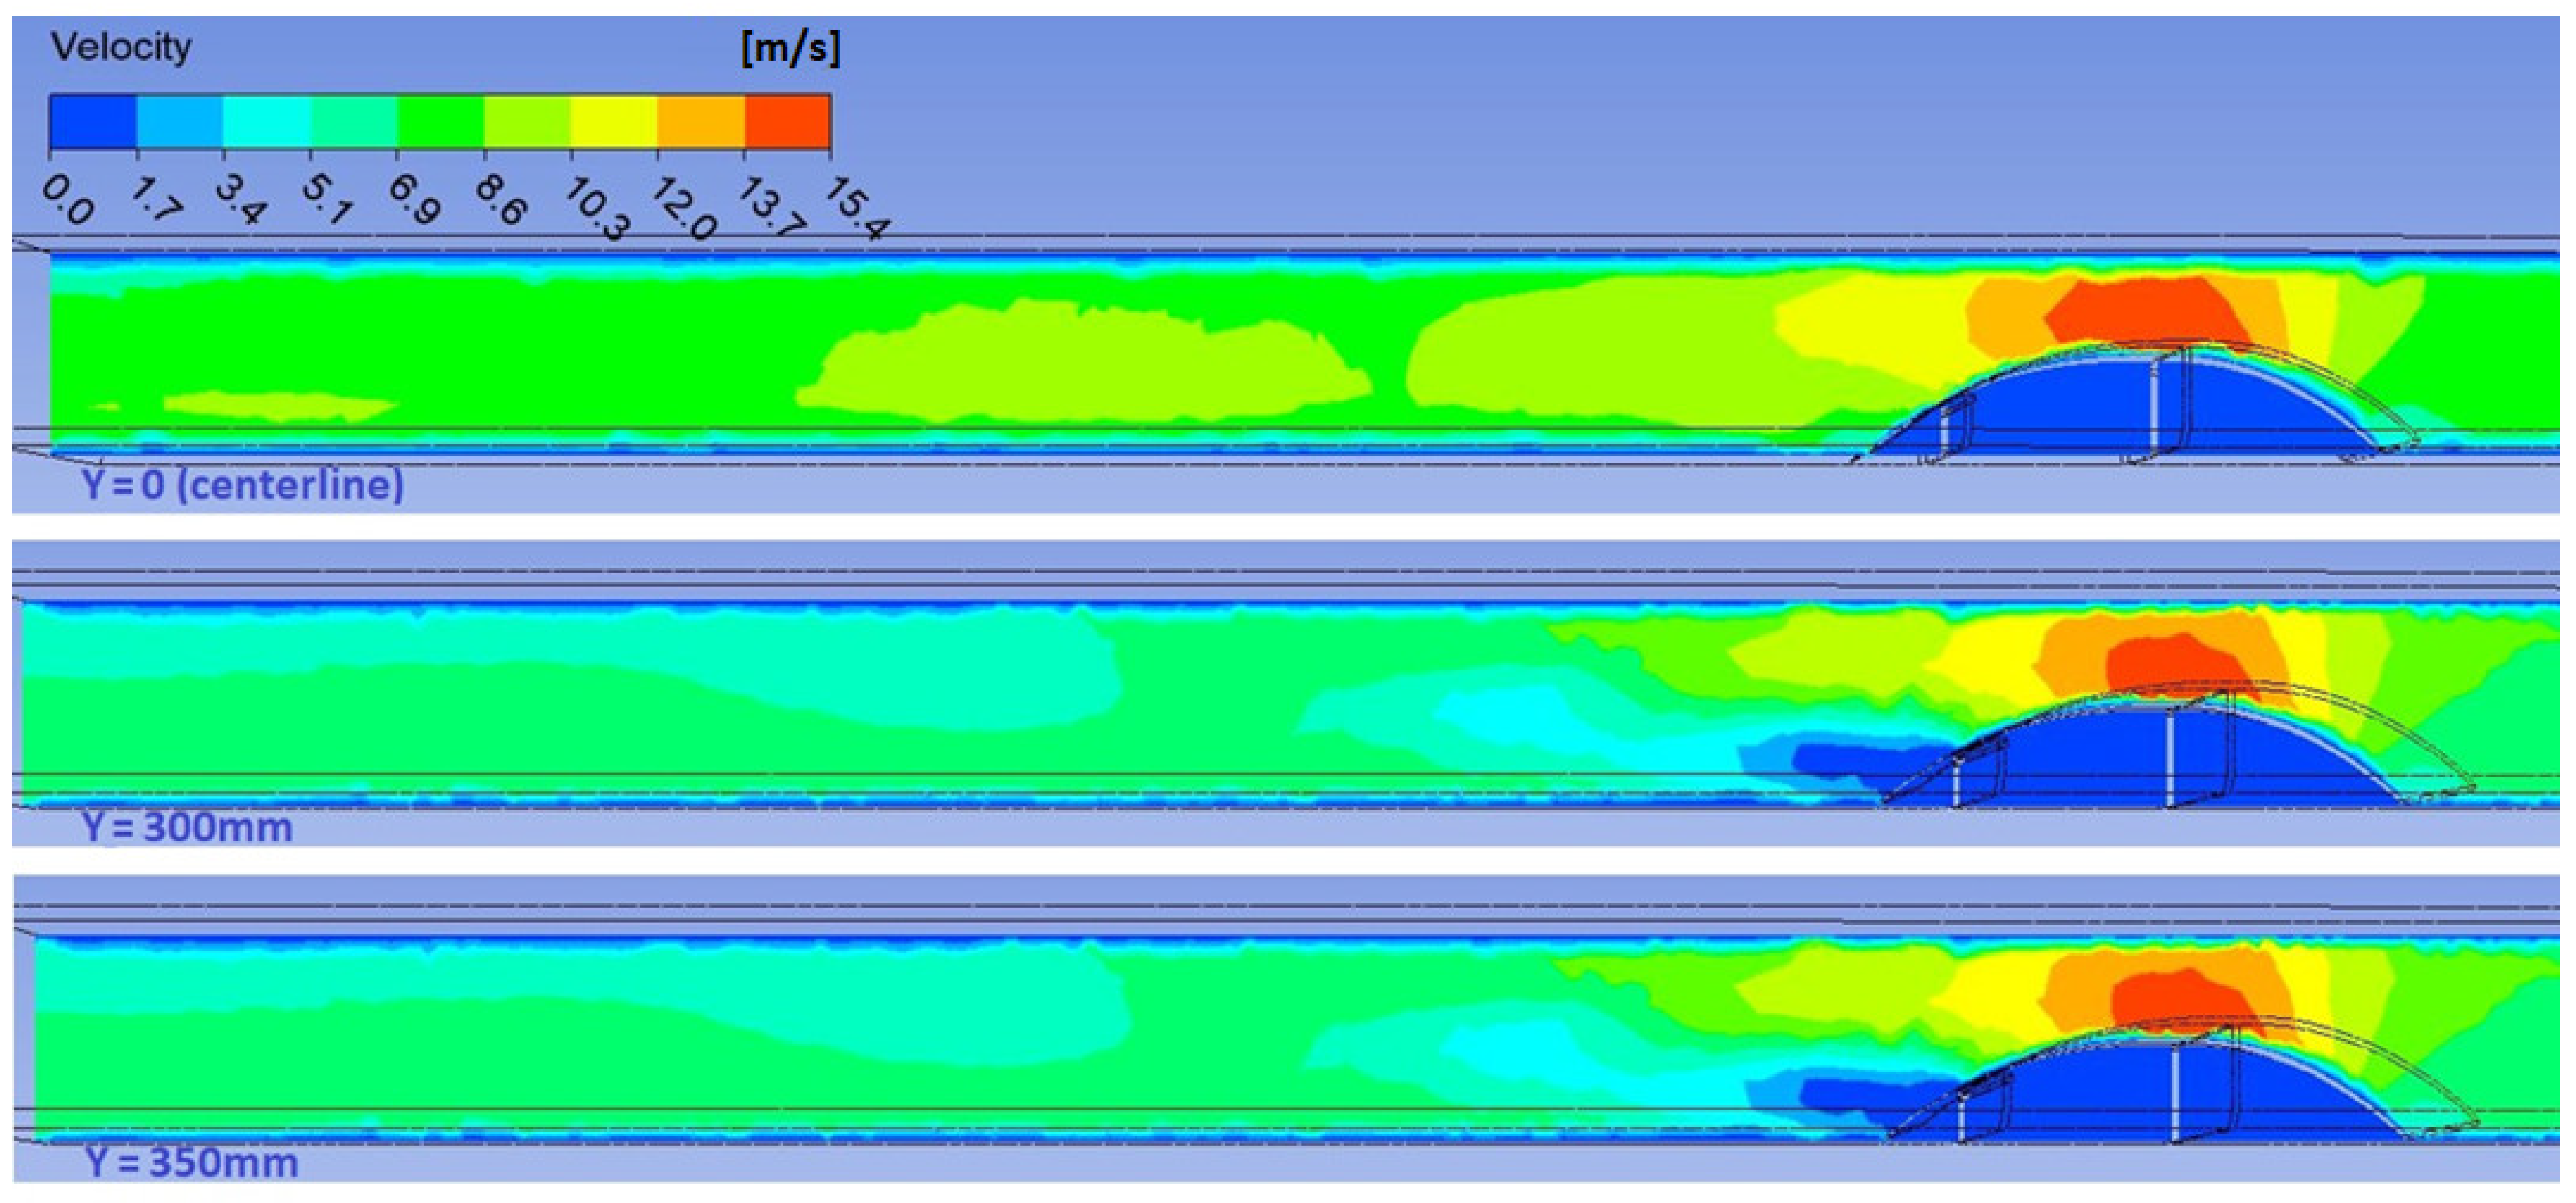
3.2. The Influence of the Structural Beam on the Airflow and the Pressure Drop

According to the experimental data, the air velocity in the upper part of the tunnel is increasing from about 8 m/s upstream of the beam to 18–20 m/s downstream of the beam. At the same time, in the lower part of the tunnel, in the shadow of the beam, the airflow is changing direction (as also seen in Figure 10) due to the ejector effect on the structural beam. Therefore, the structural beam greatly impacts the airflow inside the ventilation duct by increasing the velocity by about 2.5 times in the upper part of the ventilation duct. Furthermore, the turbulences are highly increased, a big air vortex is initiated, and the reverse airflow gets in the beam shadow with a length of about 2.5 m.
The air jet formed in the beam area needs a long strait duct to be dispersed, and the air velocity continues to be uneven for more than 10 beam heights. The low air velocity, highlighted in blue in the figure, can be observed for a long distance in the shadow of the beam.
Even after 6 m of the strait ventilation duct, the airflow in the lower part of the duct is still below 4 m/s, as seen in Figure 11 (measuring area T0). The air velocity upstream of the beam (measuring area T1) is almost constant at 7.9 m/s, while downstream of the beam (measuring area T2 and T0), there are large differences in the air velocity and turbulences that increase the pressure losses.
Based on these effects of the beam on the airflow, it is expected that an important amount of energy is to be wasted in this area of the duct. In order to check the amount of energy wasted due to the structural beams inside the ventilation duct, the total pressure drop across the ventilation duct is calculated for the airflow of 13,200 m3/h. Table 4 presents the total pressure drop for the beam height of 288 mm, and Table 5 shows the total pressure drops for the beam size of 388 mm, considering different alternatives for the beams with and without deflectors or holes.

3.3. Measures to Improve the Flow and Pressure Drop

Taking into consideration that the structural beam located inside the ventilation ducts has a big influence on the airflow and pressure drop, it is not recommended to have transversal structural beams inside the ventilation ducts. However, the structural ducts cannot be avoided due to the height and the arrangement of the rooms. As a consequence, air deflectors should be provided, or the height of the ventilation duct should be smoothly reduced to bypass the structural beam. We shall analyze the next two alternatives for improving the airflow across the ventilation duct with transversal beams inside. One with an air deflector upstream of the beam and the second with a deflector both upstream and downstream of the beam.

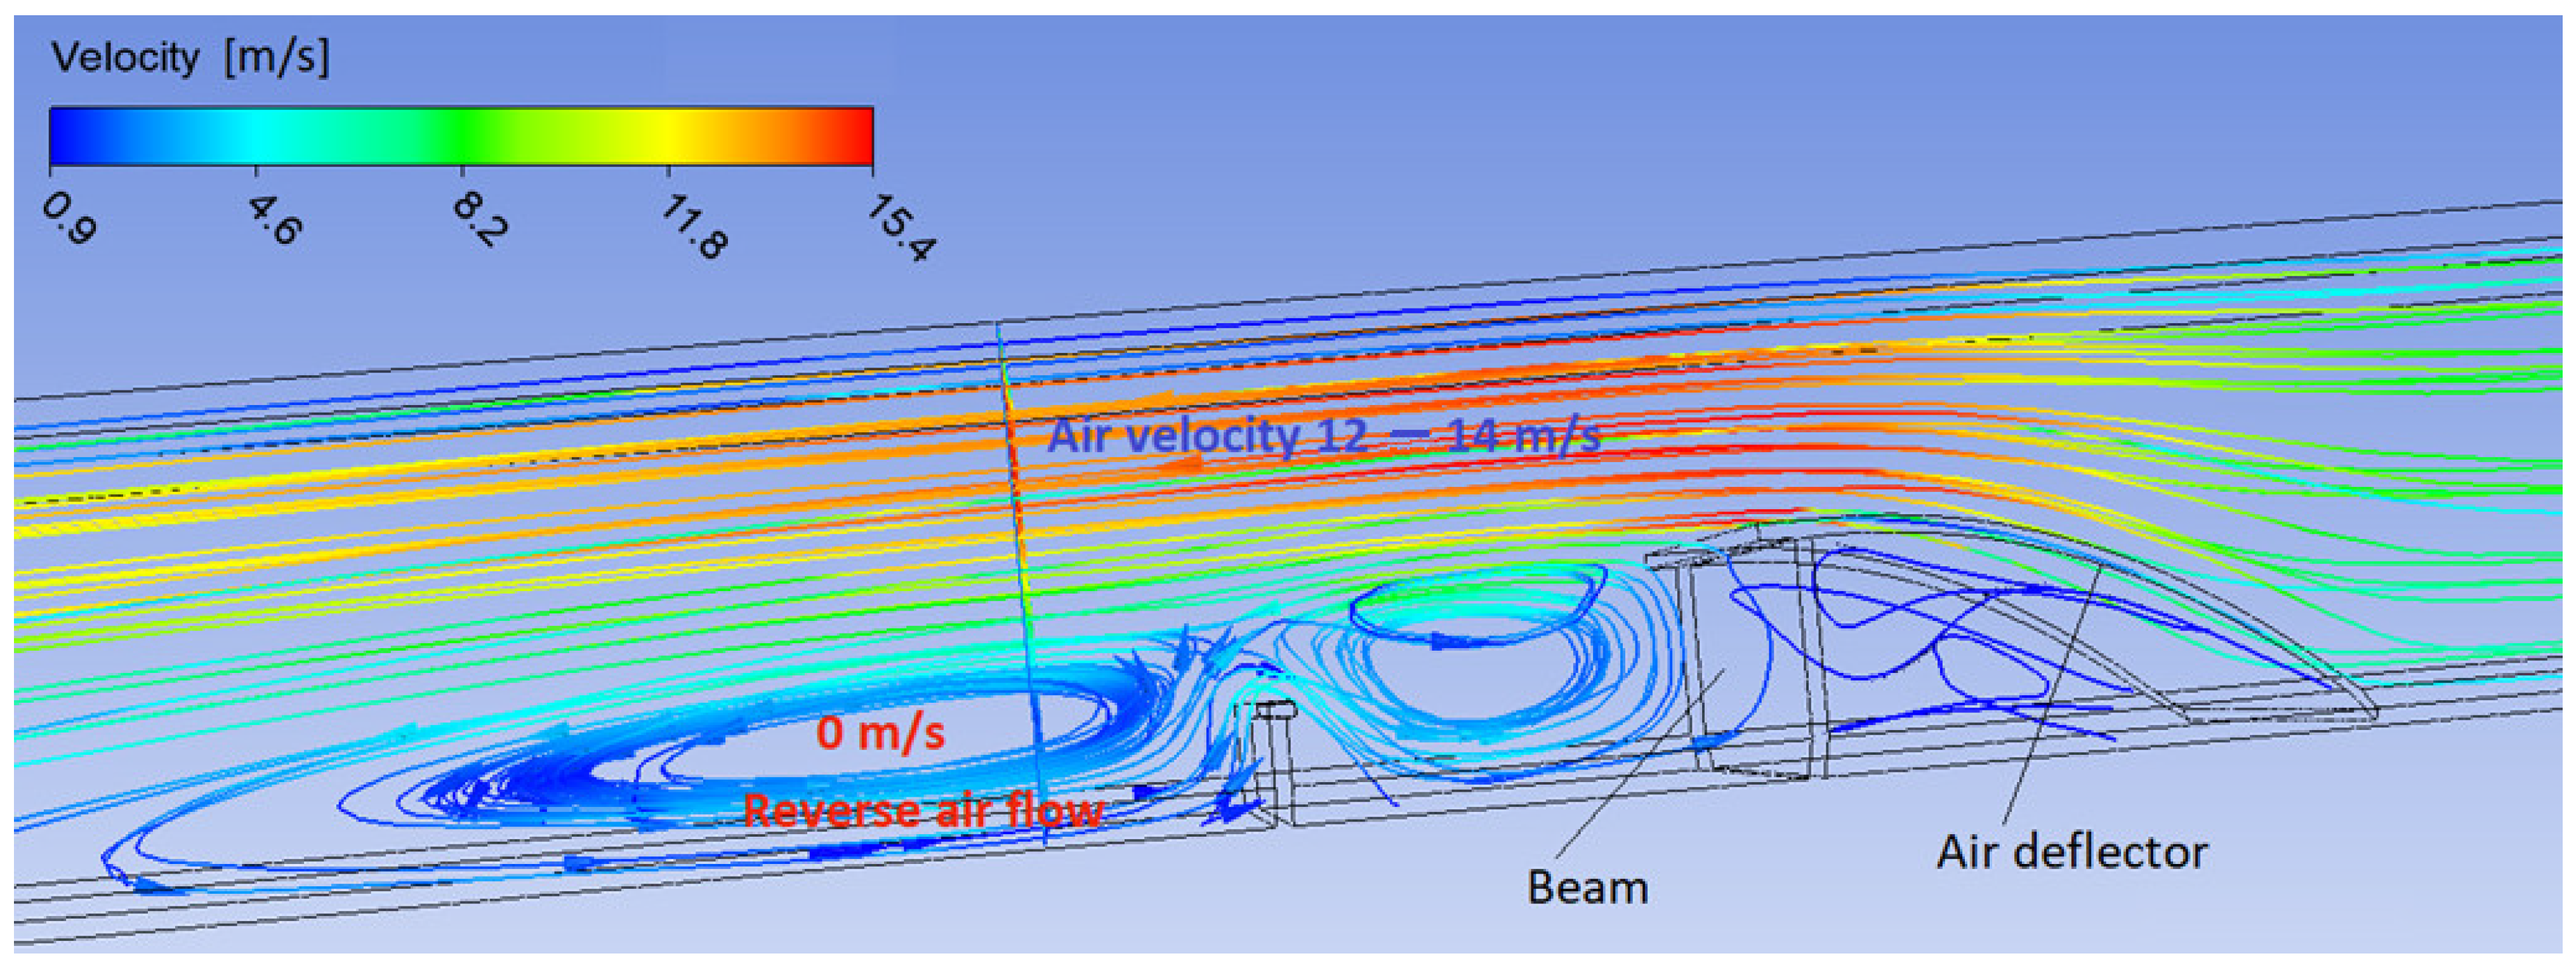
3.3.1. Improving the Airflow and Pressure Drop by Adding an Air Deflector Upstream the Beam

By adding an air deflector upstream of the beam, the cross-sectional area of the air jet increases, and the air velocity in that area goes down from 18–20 m/s to 12–14 m/s, as highlighted in Figure 12. The air vortices still form downstream of the beam.

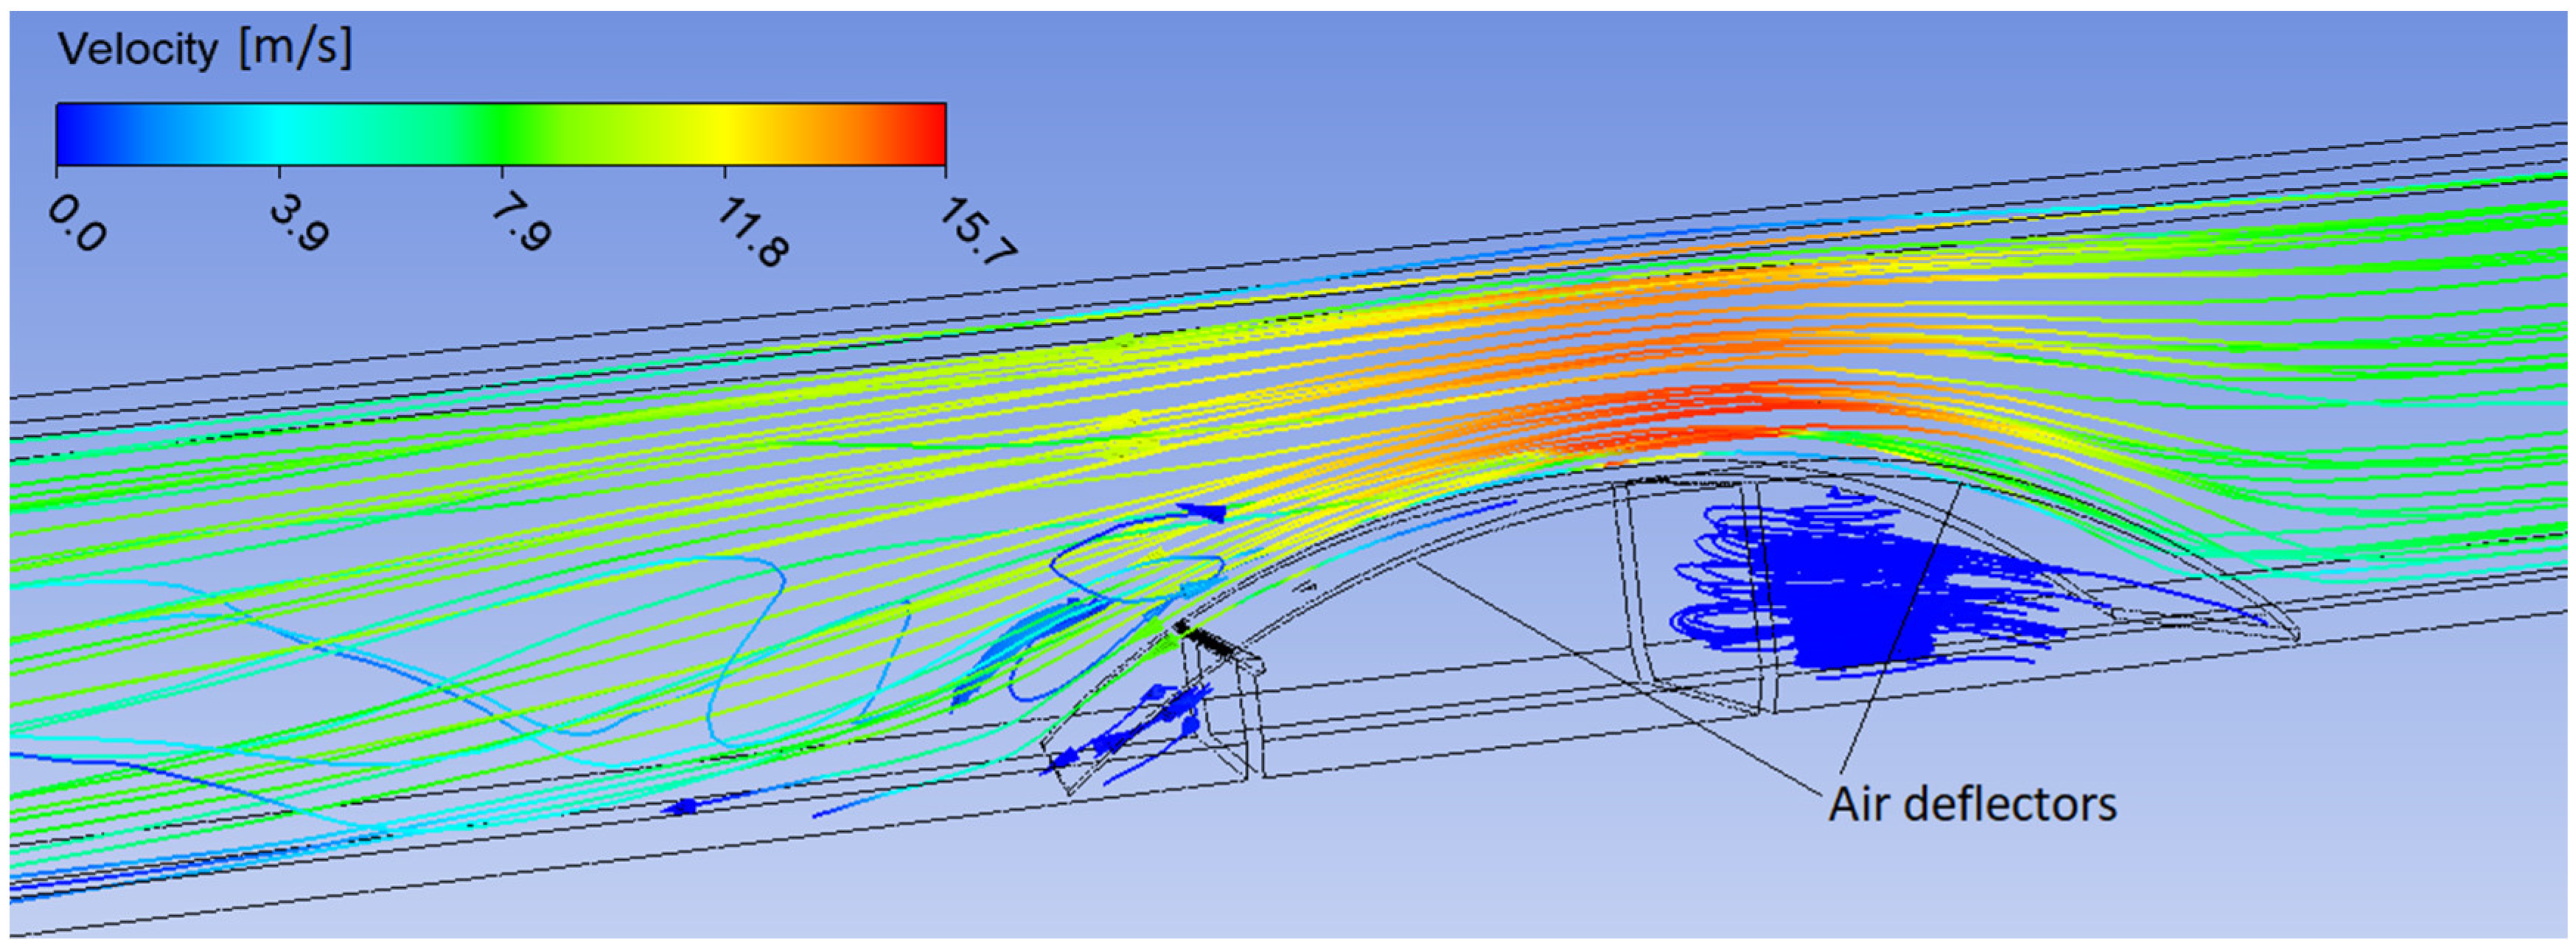
3.3.2. Improving the Airflow and Pressure Drop by Adding Air Deflectors Upstream and Downstream of the Beam

The airflow and streamlines are highly improved if the air deflectors are added also downstream of the beam. As Figure 13 illustrates, the issue with the big vortices and backflow is solved by adding a deflector downstream of the beam, and the streamlines fool the air deflector.
The low air velocity for long distances in the shadow of the beam can be seen in Figure 14, where the results without an air deflector are illustrated. As can be seen in Figure 15, the air velocity will continue to be uneven downstream of the beam, but the length and height of the area with low air velocity are reduced compared with the beam without an air deflector (see Figure 14). Consequently, the airflow is highly improved, and the total pressure drop is reduced from 133 Pa to 31 Pa.
The airflow increases to 15 m/s in the area of the beam due to the reduced cross section, but the airflow follows the shape of the deflector, and the velocity goes down to the constant value of about 8 m/s when the cross section increases. The velocity of the airflow is almost constant downstream of the deflector in the centerline, as seen in Figure 16. There is a small area close to the side bulkheads of the ventilation duct downstream of the air deflector where the air velocity is going down below 4 m/s, but only for a short distance. Overall, the air deflectors upstream and downstream of the beam have a big positive impact on the airflow, and the total pressure drop is improved from 133 Pa to about 9.6 Pa. In addition, the noise and vibration could be improved by canceling the high turbulences and by removing the big vortices.

3.4. The Energy Saving by Improving the Airflow across the Structural Beam

The power of the fan can be reduced by decreasing the airflow or by reducing the total pressure drop of the ventilation system and choosing a fan with lower pressure. In the case of an airflow of 13,200 m3/h used in the experimental model, this cannot be further reduced, and the galley ventilation is arranged according to Figure 1. In this case, we can calculate the energy saved if the two structural beams are improved with air deflectors compared to the structural beam without air deflectors.
In this respect, the power of the fan is calculated using the following equation [13,14,15], estimating a medium efficiency of the fan of 70%. In practice, the efficiency of the fan may be lower. Therefore, more energy could be saved by adding deflectors on the structural beam.
P = dp   q / η
where:
  • P = power consumption (W, Nm/s);
  • dp = total pressure increases in the fan (Pa, N/m2);
  • q = air volume flow delivered by the fan (m3/s);
  • η = global efficiency (mechanical and electrical).
In Table 6, the power of the fan with the airflow of 13,200 m3/h is calculated for the supply and exhaust ventilation ducts of the galley room indicated in Figure 1. Four alternatives with and without beams inside are analyzed. In the last column, the energy saved is indicated for different alternatives compared with the alternative of the beams without deflectors or holes.
According to the results presented in Table 6, the energy wasted across the structural beam can be highly improved by adding a deflector that can be easily built from a thin steel plate and fixed inside the structural ventilation duct upstream and downstream of the beam. It is concluded that the air deflector can save over 115 MWh/30 years in case of deflectors installed only upstream of the beam and over 130 MWh/30 years in case the deflectors are installed on both sides of the structural beams. The calculation is made considering an average running time of 10 h per day of the galley ventilation system with two beams inside.
In case the beam height is bigger than half of the ventilation duct, the airflow downstream the beam has the same turbulences, vortices, and backflow in the lower part of the ventilation duct, but the total pressure drops are increased. The calculation is made considering the same cross section of the ventilation duct and the fan capacity of 13,200 m3/h but with a beam height of 388 mm. According to the results indicated in Table 7, the energy wasted across the structural beam can be highly improved by adding air deflectors. Considering the average working time of 10 h per day, it should be mentioned that in 30 years of vessel operation, the energy saved by the air deflectors for two beams can be about 425 MWh.
Another possibility to reduce the pressure drop is to provide holes in the structural beam, but deciding the location and the area of the holes, structural strength analyses will be necessary. In case the hole area on the structural beam is about 30% of the total area of the beam, there will be a good improvement in the pressure drop, but the energy wasted across the beam will double compared with the beam provided with air deflectors. However, if the beam is provided with holes in 30% of the total area, the energy saved in 30 years of operation, 10 h/day, will be about 375 MWh compared with the beam without holes or air deflectors.

4. Conclusions

Based on the results of the CFD analysis, confirmed by wind tunnel experimental measurements, it can be concluded that the ventilation ducts with structural elements inside must be carefully analyzed and designed in order to keep a good distribution of the air velocity, to reduce the air turbulences and backflows, and, finally, to keep the pressure losses as low as possible. Therefore, with a relatively small effort and costs, it is possible to obtain great benefits for the operation of the ship by reduction of energy consumption, especially for the ventilation systems with high flow rates. In addition, by reducing the pressure losses in the ventilation systems, the capacity of the fans will also be reduced, and consequently, the construction cost will be reduced by installing smaller and cheaper equipment.
According to the results presented above, the pressure losses in the beam area can be reduced by up to 90% if the beam is provided with air deflectors located upstream and downstream, compared with the beam without an air deflector. The improvement in the pressure drop is from 420 Pa to 49 Pa in the case of a beam height of 388 mm and from 133 Pa to 9.6 Pa in the case of a 288 mm beam height. Therefore, the energy wasted across the beam can also be reduced by up to 90%. In addition, the air deflectors will reduce the turbulences of the air and the vortices, then the noise and vibration could also be reduced.
If the beam is provided with holes, this improves the airflow and reduces the pressure drop, but the efficiency will be lower than the efficiency of the air deflectors, and the structure strength should be analyzed.
Another solution to improve the ventilation system and save energy is to reduce the number of elbows and the length of the ventilation duct. This can be achieved during the concept design by choosing a good location for all rooms with a high amount of airflow, such as the engine room, emergency generator room, large hazardous spaces, galley, etc., and by assuring the necessary spaces for the straight vertical ventilation ducts led from external louvers to the room, in the area where the horizontal ventilation ducts can be reduced at minimum.
Taking into account the results of the present work, in future research, the following topics are intended to be analyzed:
-
the position of the fan relating to the ventilation duct and inlet/outlet louvers;
-
the air distribution inside the engine rooms using horizontal distribution ducts versus air distribution without horizontal ventilation ducts inside but providing inlets and outlets with increased air velocity and air deflectors to direct the airflow for good circulation inside the room.

Author Contributions

Conceptualization, investigation, visualization, methodology, and writing—original draft preparation, V.M.; supervision, formal analysis, writing—review and editing, L.R. All authors have read and agreed to the published version of the manuscript.

Funding

This work was carried out in the framework of the research project CLIMEWAR (Climate change Impact Evaluation on future Wave conditions at the Regional scale for the Black and Mediterranean Seas’ marine system), supported by a grant from the Ministry of Research, Innovation, and Digitization, CNCS—UEFISCDI, project number PN-III-P4-PCE-2021-0015, within PNCDI III.

Institutional Review Board Statement

Not applicable.

Informed Consent Statement

Not applicable.

Data Availability Statement

Not applicable.

Acknowledgments

The authors gratefully acknowledge the support of “Dunarea de Jos” University of Galati with ANSYS CFD software and hp computer, and the Faculty of Naval Architecture from the “Dunarea de Jos” University of Galati for using the facilities of Wind Tunnel Laboratory.

Conflicts of Interest

The authors declare no conflict of interest.

Abbreviations

AcronymMeaning
RHRelative humidity
kWKilo watt (1000 watt)—power
MWMegawatt (1000 kW)—power
rpmRevolution per minute—power
VVolts
AAmps
HzHertz
vAir velocity
pdDynamic pressure
ptTotal pressure
psStatic pressure
PPower consumption (W)
dpTotal pressure increases in the fan (Pa, N/m2)
qAirflow delivery by the fan (m3/s)
ηTotal efficiency (mechanical and electrical)
SOLASInternational Convention for Safety of Life at Sea
ISOInternational Organization for Standardization
CFDComputational Fluid Dynamics

References

  1. RINA. Part F Vol.1—Additional Class Notations. Rules for the Classification of Ships; RINA: Genoa, Italy, 2023; pp. 59–61. Available online: https://www.rina.org/en/rules (accessed on 24 January 2023).
  2. Bureau Veritas. Part F Additional Class Notations; Bureau Veritas Marine & Offshore: Paris, France, 2022; Available online: https://erules.veristar.com/dy/data/bv/pdf/467-NR_PartF_2022-07.pdf (accessed on 1 December 2022).
  3. DNV. Rules for Classification: Ship. Part 6 Additional Class Notations Chapter 2 Propulsion, Power Generation and Auxiliary Systems. 2022. Available online: https://standards.dnv.com/explorer/document/376B18602F2A4CAD89C296AC8ABC853E/26 (accessed on 1 December 2022).
  4. Mihai, V.; Rusu, L. Improving the Ventilation of Machinery Spaces with Direct Adiabatic Cooling System. Inventions 2022, 7, 78. [Google Scholar] [CrossRef]
  5. Mihai, V.; Rusu, L. An Overview of the Ship Ventilation Systems and Measures to Avoid the Spread of Diseases. Inventions 2021, 6, 55. [Google Scholar] [CrossRef]
  6. Mihai, V.; Rusu, L.; Presura, A. Ventilation of engine rooms in diesel engines ships. In Annals of “Dunărea de Jos” of Galati, Fascicle XI, Shipbuilding; Galati University Press: Galati, Romania, 2020; Volume 43, pp. 69–78. [Google Scholar] [CrossRef]
  7. Bureau Veritas. Methanol & Ethanol Fuelled Ships. 2022. Available online: https://marine-offshore.bureauveritas.com (accessed on 11 October 2022).
  8. Bureau Veritas. Ammonia-Fuelled Ships Tentative Rules; Bureau Veritas: Neuilly-sur-Seine, France, 2022; Available online: https://erules.veristar.com/dy/data/bv/pdf/671-NR_2022-07.pdf (accessed on 8 October 2022).
  9. DNV AS. Section 14 Gas Fuelled Ship Installations—Gas Fuelled Ammonia; DNV: Bærum, Norway, 2022; Available online: https://rules.dnv.com/docs/pdf/DNV/RU-SHIP/2022-07/DNV-RU-SHIP-Pt6Ch2.pdf (accessed on 8 October 2022).
  10. Mihai, V.; Rusu, L.; Presură, A. Main requirements for ventilation of different rooms on the ships. In Annals of ”Dunarea de Jos” University of Galati. Fascicle XI Shipbuilding; Galati University Press: Galati, Romania, 2022; Volume 45, pp. 21–30. [Google Scholar] [CrossRef]
  11. International Maritime Organization—IMO. SOLAS—International Convention for the Safety of Life at Sea; Lloyd’s Register Rulefinder 2020, Version 9.33—Fix, 2018; International Maritime Organization: Lambeth, London, 2018; Available online: https://www.imorules.com/SOLAS.html (accessed on 6 October 2022).
  12. International Maritime Organization—IMO. Load Lines, 1966/1988—International Convention on Load Lines, 1966, as Amended by the Protocol of 1988; Lloyd’s Register Rulefinder 2020, Version 9.33—Fix, 2014; International Maritime Organization: Lambeth, London, 2014; Available online: https://www.imorules.com/LL.html (accessed on 9 October 2022).
  13. Novenco. Novenco® Zerax® Axial Fans Standard, Hot Smoke, Atex and ex Pure Competence in Air. Available online: www.novenco-building.com (accessed on 26 December 2022).
  14. Engineering ToolBox. Fans—Efficiency and Power Consumption. 2003. Available online: https://www.engineeringtoolbox.com/fans-efficiency-power-consumption-d_197.html (accessed on 21 January 2023).
  15. Fan, M. Fan Shaft Power Calculation. 2018. Available online: http://www.mayafanfrp.com/fan-shaft-power-or-fans-motor-requirement-calculation.php (accessed on 26 December 2022).
  16. Xie, Y.; Zheng, Z.; Wang, H.; Xu, Z.; Liu, G.; Malekian, R.; Li, Z. Analysis of a main cabin ventilation system in a jack-up offshore platform Part I: Numerical modelling. Appl. Sci. 2019, 9, 3185. [Google Scholar] [CrossRef]
  17. Tasdemir, C.; Bayraktar, S. CFD Analysis of Ventilation System for an ENGINE ROOM. In Proceedings of the 1st International Ship and Marine Technology Congress (SHIP-MAR 2016), Dhaka, Bangladesh, 9–10 December 2016; Available online: https://www.researchgate.net/profile/Seyfettin-Bayraktar/publication/312289286_CFD_ANALYSIS_OF_VENTILATION_SYSTEM_FOR_AN_ENGINE_ROOM/links/58787f7608ae329d6228e3b2/CFD-ANALYSIS-OF-VENTILATION-SYSTEM-FOR-AN-ENGINE-ROOM.pdf (accessed on 28 December 2022).
  18. Chang, P.; Xu, G.; Zhou, F.; Mullins, B.; Abishek, S.; Chalmers, D. Minimizing DPM pollution in an underground mine by optimizing auxiliary ventilation systems using CFD. Tunn. Undergr. Space Technol. 2019, 87, 112–121. [Google Scholar] [CrossRef]
  19. Tai, V.C.; Kai-Seun, J.; Mathew, P.; Moey, L.; Cheng, X.; Baglee, D. Investigation of varying louver angles and positions on cross ventilation in a generic isolated building using CFD simulation. J. Wind. Eng. Ind. Aerodyn. 2022, 229, 105172. [Google Scholar] [CrossRef]
  20. Zheng, X.; Montazeri, H.; Blocken, B. CFD simulations of wind flow and mean surface pressure for buildings with balconies: Comparison of RANS and LES. Build. Environ. 2020, 173, 106747. [Google Scholar] [CrossRef]
  21. Montazeri, H.; Blocken, B. CFD simulation of wind-induced pressure coefficients on buildings with and without balconies: Validation and sensitivity analysis. Build. Environ. 2013, 60, 137–149. [Google Scholar] [CrossRef]
  22. Allegrini, J.; Kubilay, A. Wind sheltering effect of a small railway station shelter and its impact on wind comfort for passengers. J. Wind. Eng. Ind. Aerodyn. 2017, 164, 82–95. [Google Scholar] [CrossRef]
  23. Defraeye, T.; Carmeliet, J. A methodology to assess the influence of local wind conditions and building orientation on the convective heat transfer at building surfaces. Environ. Model. Softw. 2010, 25, 1813–1824. [Google Scholar] [CrossRef]
  24. Montazeri, H.; Montazeri, F. CFD simulation of cross-ventilation in buildings using rooftop wind-catchers: Impact of outlet openings. Renew Energy 2018, 118, 502–520. [Google Scholar] [CrossRef]
  25. Blocken, B.; Janssen, W.; van Hooff, T. CFD simulation for pedestrian wind comfort and wind safety in urban areas: General decision framework and case study for the Eindhoven University campus. Environ. Model. Softw. 2012, 30, 15–34. [Google Scholar] [CrossRef]
  26. Tominaga, Y.; Stathopoulos, T. Numerical simulation of dispersion around an isolated cubic building: Comparison of various types of k–ɛ models. Atmos. Environ. 2009, 43, 3200–3210. [Google Scholar] [CrossRef]
  27. Smyk, E.; Mrozik, D.; Wawrzyniak, S.; Peszyński, K. Tubular Air Deflector in Ventilation Ducts. In Proceedings of the 23rd International Conference on Engineering Mechanics, Svratka, Czech Republic, 15–18 May 2017; pp. 15–18. Available online: http://dlibra.pbs.edu.pl/Content/1335/PDF/Smyk_Tubular_air_2017.pdf (accessed on 22 January 2023).
  28. Khumkhreung, P.; Khunatorn, Y. CFD Modeling of Air Stream Pressure Drop inside Combustion Air Duct of Coal-Fired Power Plant with and without Airfoil. World Acad. Sci. Eng. Technol. Int. J. Mech. Mechatron. Eng. 2017, 11, 1140–1143. Available online: https://www.semanticscholar.org/paper/CFD-Modeling-of-Air-Stream-Pressure-Drop-inside-Air-Khumkhreung-Khunatorn/39a7017ddd115d81ac4381f2bd7eab3ceb1b93f5 (accessed on 22 January 2023).
  29. Enam, S.; Muhammad, M.; Sidik, N.A.C. Numerical Investigation on The Effect of Grille Blockage Ratio on Air Flow Characteristics of Air Vents. CFD Lett. 2022, 14, 32–41. [Google Scholar] [CrossRef]
  30. Kubas, Š.; Kapjor, A.; Vantúch, M.; Caja, A. Determination of pressure loss of silencers during air transport in air conditioning. Transp. Res. Procedia 2021, 55, 707–714. [Google Scholar] [CrossRef]
  31. PeakTech. Prüf- und Messtechnik GmbH—Gerstenstieg 4—DE-22926 Ahrensburg/and Germany, Data Logger: Temperature/Humiditu—Operation Manual. Available online: https://www.peaktech.de/uk/PeakTech-P-5185-USB-Datalogger-Temperature-and-Humidity/P-5185 (accessed on 27 December 2022).
  32. Air in Motion. Mollier Diagram Calculator. 2022. Available online: https://afim-dehumidifier.com/en/mollier-chart-air-calculator (accessed on 27 December 2022).
  33. Rietschel, H.; Raiss, W. Tehnica Incalzirii si Ventilarii; Ghitescu, D., Klodnischi, L., Eds.; Editura Tehnica Bucuresti: Bucuresti, Romania, 1967. [Google Scholar]
  34. Obreja, D. Experimental techniques in the wind tunnel of naval architecture faculty. In Annals of ”Dunarea de Jos” University of Galati. Fascicle XI Shipbuilding; Galati University Press: Galati, Romania, 2021; Volume 44, pp. 5–10. [Google Scholar] [CrossRef]
  35. Extech Instruments. Metal Vane Thermo-Anemometer/Datalogger. 2010. Available online: https://www.extech.com/products/SDL300 (accessed on 27 December 2022).
  36. Cui, C.; Cai, W.; Chen, H. Airflow measurements using averaging Pitot tube under restricted conditions. Build. Environ. 2018, 139, 17–26. [Google Scholar] [CrossRef]
  37. Pochwała, S.; Pospolita, J. Analysis of applicability of flow averaging Pitot tubes in the areas of flow disturbance. Metrol. Meas. Syst. 2016, 23, 71–84. [Google Scholar] [CrossRef]
Figure 1. Typical arrangement for galley ventilation using structural ducts with transversal beams inside.
Jmse 11 00371 g001
Figure 2. Examples of structural ventilation ducts with ship structural beams inside.
Jmse 11 00371 g002
Figure 3. Sketch of the wind tunnel used.
Jmse 11 00371 g003
Figure 4. Wind tunnel natural view.
Jmse 11 00371 g004
Figure 5. Sketch for measuring points of the experimental model (Model 1 with a beam height of 288 mm and Model 2 with a beam height of 388 mm).
Jmse 11 00371 g005
Figure 6. Measuring points. Cross section of the wind tunnel.
Jmse 11 00371 g006
Figure 7. Measuring devices: Electronic scanner with 16 measurement pressure points; Pitot tubes, temperature, and relative humidity (RH) data logger; The thermo-anemometer type SDL300.
Jmse 11 00371 g007
Figure 8. The wool wires mounted on the model showing the reverse flow.
Jmse 11 00371 g008
Figure 9. Air velocity at measuring area T2 (downstream of the model), at Y = 0 (centerline) and Y = 200 mm; beam size of 288 mm; average inlet velocity of 7.9 m/s.
Jmse 11 00371 g009
Figure 10. Streamlines; CFD model with a beam size of 288 mm without deflectors.
Jmse 11 00371 g010
Figure 11. Air velocity; cross sections for the measuring areas T1, T2, and T0 (outlet located at 6 m downstream of the beam); CFD model with a beam size of 288 mm.
Jmse 11 00371 g011
Figure 12. Streamlines; CFD model with a beam size of 288 mm with deflector upstream the beam.
Jmse 11 00371 g012
Figure 13. Streamlines; CFD model with a beam size of 288 mm with air deflectors upstream and downstream of the beam.
Jmse 11 00371 g013
Figure 14. Air velocity; beam without deflectors; longitudinal section in centerline (CFD model with a beam size of 288 mm, inlet air velocity of 7.9 m/s).
Jmse 11 00371 g014
Figure 15. Air velocity, beam with deflector upstream the beam; longitudinal section in the centerline (CFD model with a beam size of 288 mm, inlet air velocity of 7.9 m/s).
Jmse 11 00371 g015
Figure 16. Air velocity; beam with deflector upstream and downstream the beam; longitudinal sections in the centerline, 300 mm and 350 mm from centerline (CFD model with a beam size of 288 mm and an inlet air velocity of 7.9 m/s).
Jmse 11 00371 g016
Table 1. The average velocity in measuring area T1; beam height of 388 mm.
Fan Speed StepVelocity without Model [m/s]Velocity with Model [m/s]
IC108.02.8
IC129.73.7
IC1411.44.0
IC1613.45.1
IC1814.85.5
IC2016.65.9
Table 2. The average velocity in measuring area T1; beam height of 288 mm.
Fan Speed StepVelocity without Model [m/s]Velocity with Model [m/s]
IC2016.68.1
Table 3. The air velocity in measuring area T2; beam height of 288 mm; fan step IC20 (the data recorded with thermo-anemometer type SDL300).
Air Velocity [m/s]Distance from the Center of the Tunnel
4003002001000−100−200−300−400
Distance from the ceiling of the tunnel702020.920.720.520.520.720.720.520
12019.92019.920.419.619.719.719.919.7
17017.516.716.316.616.415.715.716.416.6
22014.310.811.111.710.3999.312.1
27094.165.45.33.53.54.49
290600000006
370−3.2−2.4−3.7−4.5−4.9−3.6−3.6−2.5−3.4
470−2.1−1.6−3.9−5−5.5−3.9−3.9−2.8−2.6
Table 4. Total pressure drops for a beam size of 288 mm and an air inlet velocity of 7.9 m/s (the height of the beam is less than half of the ventilation duct height).
Description of the CFD ModelPressure Drops
With beam, without deflectors133 Pa
With beam, improved with upstream air deflectors31 Pa
With beam, improved with upstream and downstream air deflectors9.6 Pa
Without beam3.9 Pa
Table 5. Total pressure drops for a beam size of 388 mm and an air inlet velocity of 7.9 m/s (the height greater than half of the ventilation duct height).
Description of the CFD ModelPressure Drops
With beam, without deflectors420 Pa
With beam, without deflectors, but with about 30% holes90 Pa
With beam, improved with upstream and downstream air deflectors49 Pa
Without beam3.9 Pa
Table 6. Calculation of the power and energy needed to pass the air through the supply and exhaust ventilation ducts with a beam of 288 mm.
Alternative for Ventilation DuctsAirflow
m3/h
Press. Drop
Pa
Power
kW
Energy
kWh/30 year
Energy Save
kWh/30 year
Beams without deflectors13,2002661.39152,5700
Beams with deflectors upstream13,200620.3235,561117,009
Beams with deflectors up and downstream13,20019.20.1011,013141,557
Ventilation ducts without beams13,2007.80.044474148,096
Table 7. Calculation of the power and energy needed to pass the air through the supply and exhaust ventilation ducts with a beam of 388 mm.
Alternative for Ventilation DuctsAirflow
m3/h
Press. Drop
Pa
Power
kW
Energy
kWh/30 year
Energy Save
kWh/30 year
Beams without deflectors13,2008404.40481,8000
Beam with about 30% holes 13,2001800.94103,243378,557
Beams with deflectors up and downstream13,200980.5156,210425,590
Ventilation ducts without beams13,2007.80.044474477,326
Disclaimer/Publisher’s Note: The statements, opinions and data contained in all publications are solely those of the individual author(s) and contributor(s) and not of MDPI and/or the editor(s). MDPI and/or the editor(s) disclaim responsibility for any injury to people or property resulting from any ideas, methods, instructions or products referred to in the content.

