Essay

Horizontal Bearing Capacity and Reliability of Piles in Coastal Soft Soil Considering the Time-Varying Characteristics

1
Key Laboratory of Special Environment Road Engineering of Hunan Province, Changsha University of Science & Technology, Changsha 410114, China
2
School of Civil Engineering, Changsha University of Science & Technology, Changsha 410114, China
*
Author to whom correspondence should be addressed.
J. Mar. Sci. Eng. 2023, 11(2), 247; https://doi.org/10.3390/jmse11020247
Submission received: 16 December 2022 / Revised: 9 January 2023 / Accepted: 13 January 2023 / Published: 18 January 2023

Abstract

:
In order to study the influence of the creep of soft soil and the corrosion damage of reinforced concrete on the horizontal bearing behavior of piles, the novel p-y curve model was established considering the time-varying characteristics of soil parameters. The attenuation law of the bending stiffness of reinforced concrete piles under chloride erosion was analyzed by introducing the bending stiffness reduction factor. The limit state function of pile reliability analysis was then established considering the time-varying characteristics. The reliability index of a pile under horizontal displacement failure mode was obtained using the quadratic response surface method. Finally, the sensitivity analysis of random variables (cohesion, internal friction angle, concrete cover, and chloride concentration) on the time-varying reliability of a pile under horizontal displacement failure mode was carried out. The influence of the distribution types of soil parameters on the time-varying reliability was considered. The results show that the load-bearing characteristics of the horizontally loaded pile are impacted significantly by the time-varying characteristics of the soil. The maximum horizontal displacement of the pile increases nonlinearly with the increase in service time. When the horizontal displacement failure mode occurs, the variability in the internal friction angle has a significant impact on the reliability of the pile. The reliability index decreases nonlinearly with an increase in service time. When the soil parameters obey the extreme value type I distribution, the corresponding reliability index is greater than that of log-normal distribution and normal distribution.

1. Introduction

Soft soil exists widely in the southeast coastal areas of China. When a pile is constructed in coastal soft soil areas, they have to bear the horizontal forces caused by wind loads and/or earthquakes. Shao et al. [1] and Zhuang et al. [2] found that with the increase in service time, the bearing capacity of a pile in coastal soft soil areas will decrease under chloride erosion. Wang et al. [3] believed that the creep of soft soil will have a similar effect on a pile.
In past decades, experimental and theoretical analyses have been carried out on the stress and deformation characteristics of the horizontal load-bearing pile in soft soil areas. Matlock [4] proposed a p-y curve model for the stress and deformation of a pile under short-static loads based on a field test result for soft clay foundations. Sullivan et al. [5] improved a unified method suitable for analyzing the p-y curve theory of piles in clay. Fu et al. [6] proposed a multi-spring beam-column model suitable for monopile designs in soil conditions in China. Yang et al. [7] employed the variational method to investigate the issue of laterally loaded piles in two-layer soils. Conte et al. [8] proposed a three-dimensional finite element method to predict the response of reinforced concrete piles to horizontal loads considering the nonlinear effect of the soil–pile interaction. He et al. [9] used the p-y curve suitable for soft soil to describe the nonlinear relationship between the pile–soil interface force and displacement. In recent years, a lot of research has been carried out on piles under horizontal cyclic loading. For example, Basack et al. [10] showed that lateral cyclic loading has a stiffening effect on loose sand, which increased the pile capacity and reduced the pile head displacement. Cheng et al. [11] established a novel cyclic p-y elastoplastic model developed to capture soil stiffness degradation. Basack et al. [12] conducted model tests and numerical simulations of steel pipe pile groups in soft soil. The degradation of the lateral capacity of the pile group and the pattern of the degradation with variations in the cyclic loading parameters were studied. Muszyński et al. [13] processed the field test data and studied the change in the stiffness of horizontal pile stiffness in the course of cyclic loading. Generally, the design life of structural piles is 50–100 years. Due to the creep of soft soil, the shear strength of soft soil will decay with time [3,14]. This indicates that the shear parameters have time-varying characteristics.
The corrosion model study of many chlorides on reinforced concrete structures, such as Zhu et al. [15], developed a comprehensive model for the carbonation and chloride intrusion in concrete. Florea et al. [16] established a combination model of various hydrates and chlorides in slag cement. Moreover, Loser et al. [17] found that permeability is the decisive parameter of chloride resistance. Feng et al. [18] and Kozubal et al. [19,20] investigated the time-dependent reliability of concrete structures in corrosive environments. All of these proved that reinforced concrete structures will be corroded in a chloride environment, which will lead to the deterioration of strength and the attenuation of pile bending stiffness; these indicate that the bearing capacity has time-varying characteristics.
At present, some scholars have studied time-varying effects in engineering. For example, Dang et al. [21] proposed a method to estimate structures’ time-varying reliability and associated uncertainty estimation with a significantly reduced time and complexity based on using deep learning neural networks. Xu et al. [22] used the Monte Carlo simulation method to investigate the failure probability of reinforced concrete square piles, predicting the service life. Wang et al. [23] deduced the weakening model of concrete resistance and reinforcement resistance over time. Wu et al. [24] analyzed the time-varying reliability of a loess slope in the Three Gorges Reservoir based on the water–soil coupling theory. Deepthi et al. [25] established the time-dependent reliability model to estimate pavement reliability, considering the strength degradation with time, and the varying failure probability of pavement structures with time was analyzed.
The above research proves that the influence of time-varying effects on engineering cannot be ignored. However, the time-varying effects of the soft soil creep and reinforced concrete corrosion on piles are rarely studied at present. Therefore, the p-y curve model was established considering the time-varying characteristics of soft soil. The bending stiffness reduction coefficient of a pile by chloride erosion was introduced to analyze the bending stiffness attenuation law. The time-varying reliability of a pile under horizontal displacement failure mode was investigated. The influences of random variables (cohesion, internal friction angle, concrete cover, and chloride concentration) on the time-varying reliability of the pile were further analyzed, and the relationship between shear strength and the reliability index of soil was discussed considering the distribution types of soil parameters. The ultimate service life of the pile was then predicted based on the target reliability index.

2. Time-Varying Model of Horizontal Loaded Pile in a Soft Soil Area

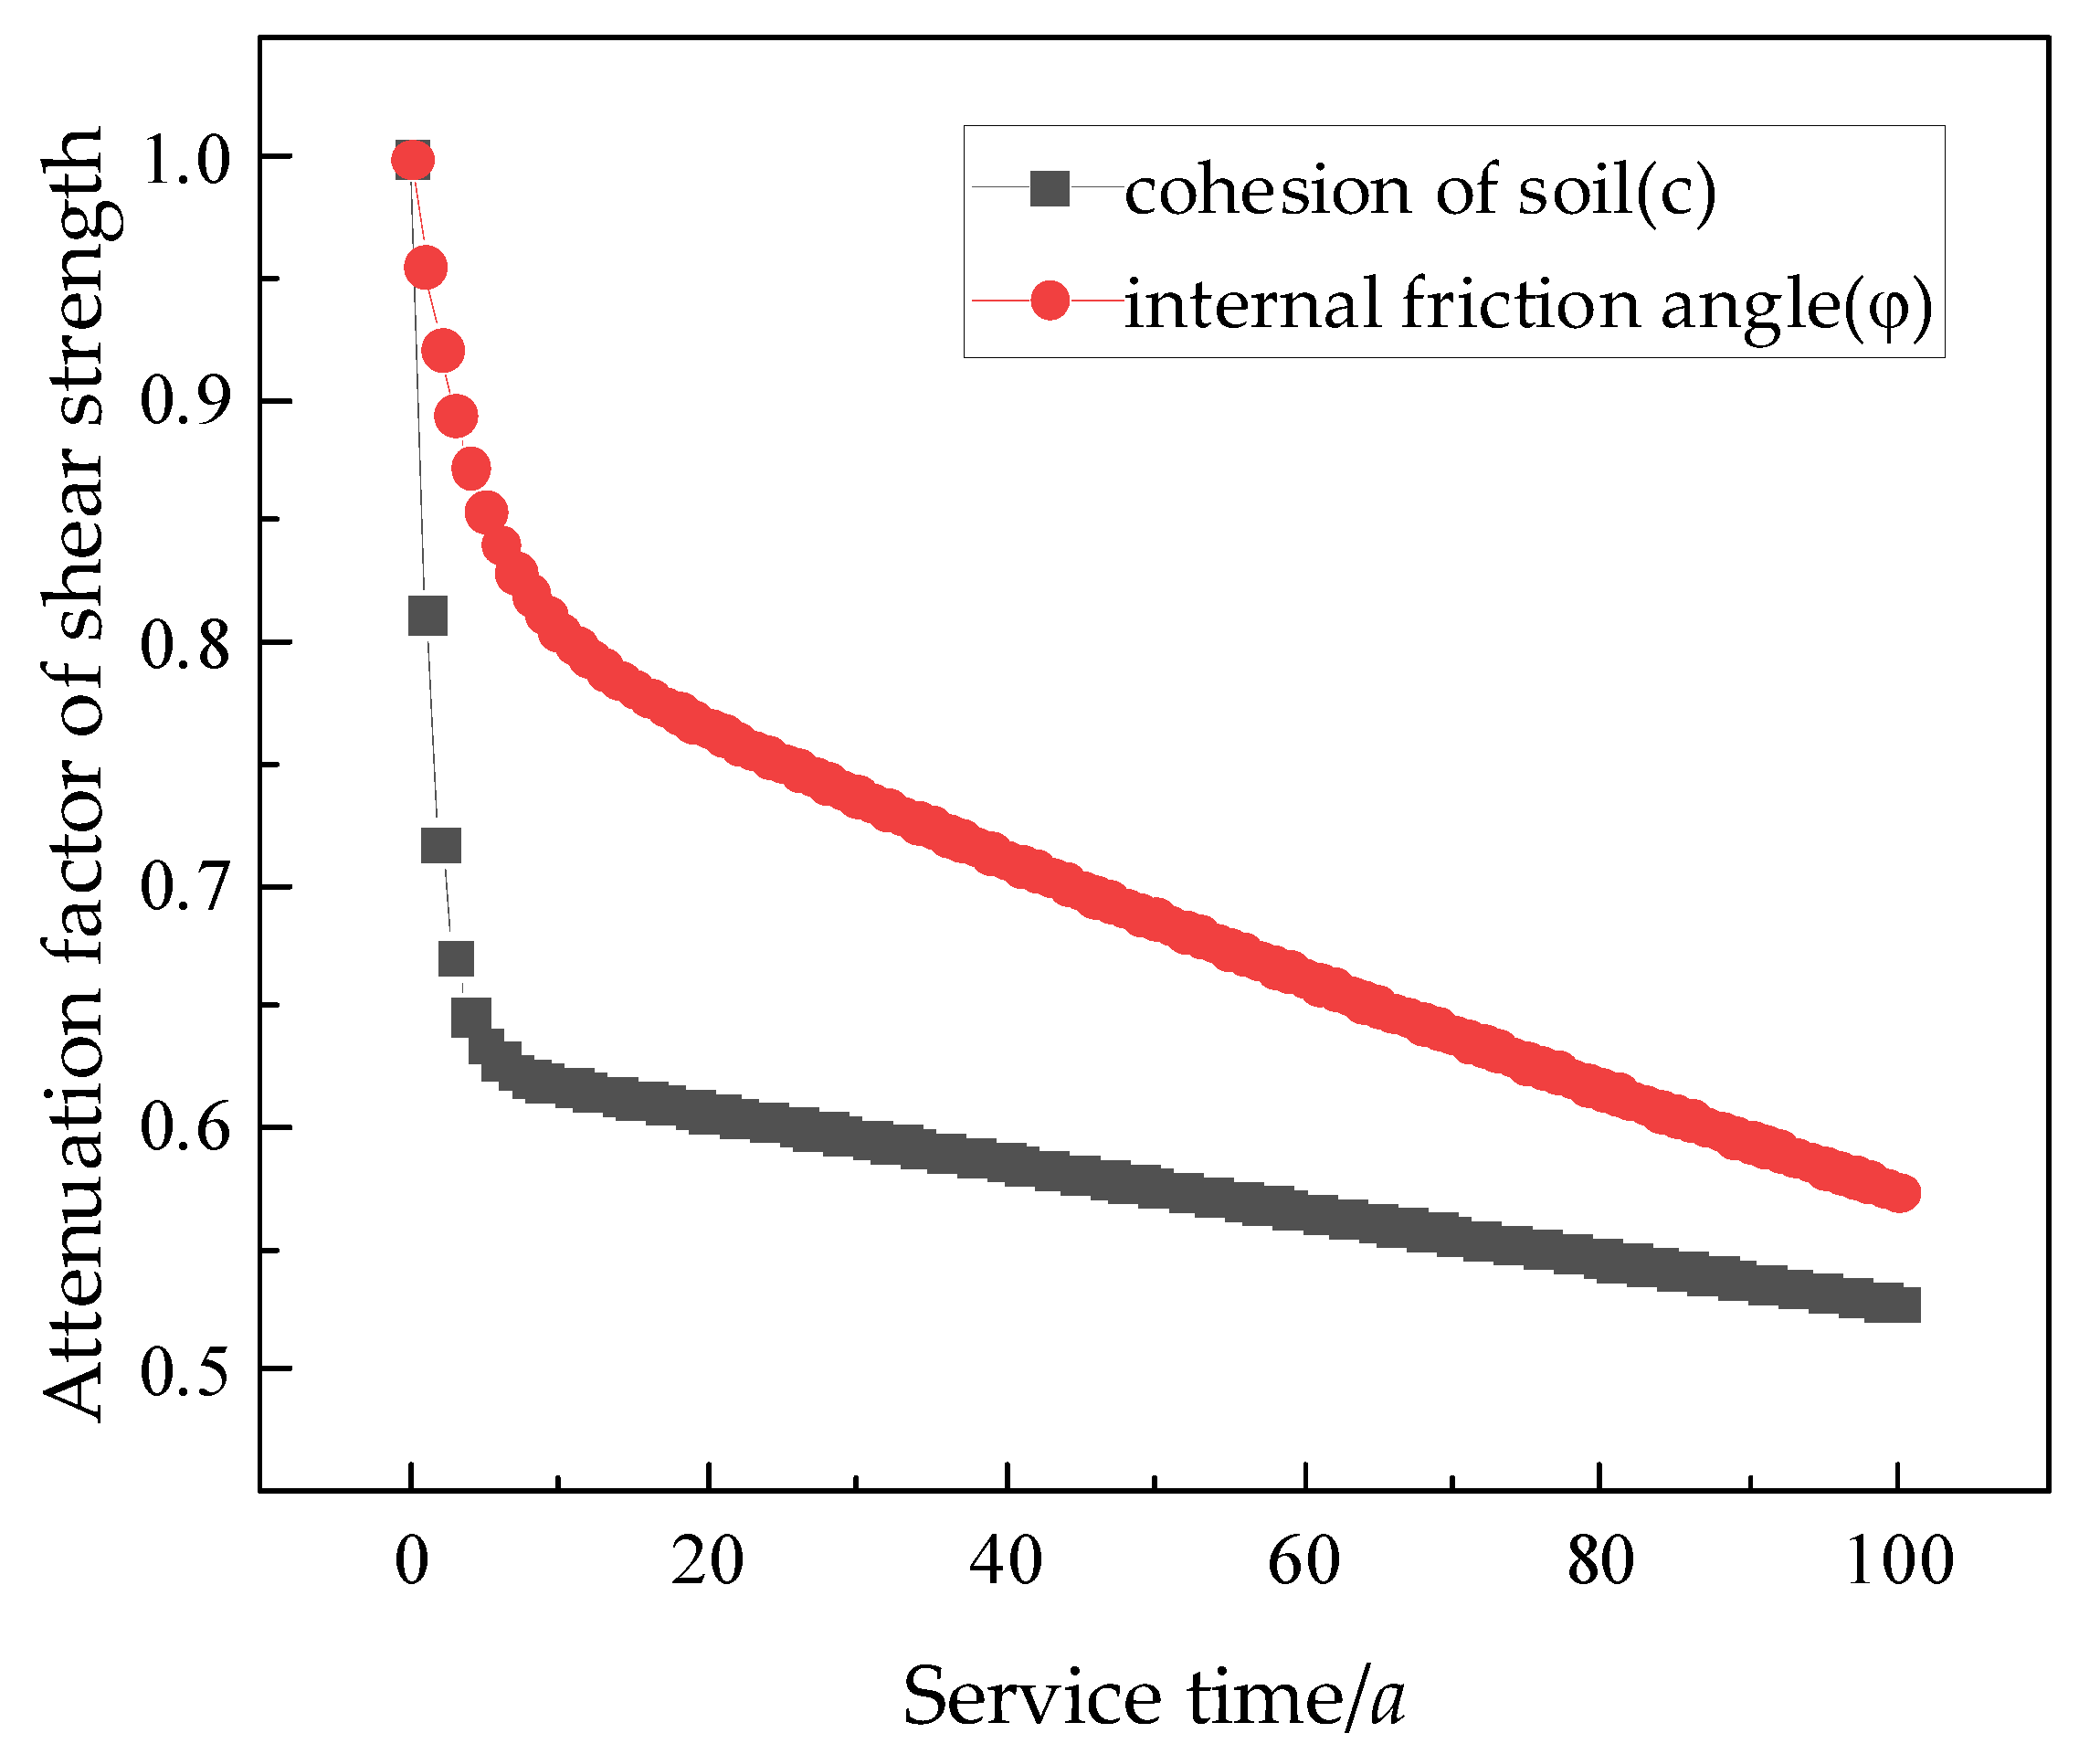
2.1. Time-Varying Characteristics of the Soft Soil

Normally, the shear strength of soil will change with time. Therefore, the strength index has obvious time-varying characteristics [3,14]. The expression of soil shear strength index changing with time has been investigated [26], which can be written as
c ( t ) = α c ( t ) c ( t 0 ) φ ( t ) = α φ ( t ) φ ( t 0 )
where c(t) is the cohesion of soil at time t, φ(t) is the internal friction angle of soil at time t, c(t0) is the origin of cohesion, φ(t0) is the origin of internal friction angle, αc(t) is the attenuation factor of cohesion, and αφ(t) is the attenuation factor of the internal friction angle.
The expression of shear strength attenuation factor for a silty soft soil obtained by using a creep test can be expressed as [3]
α c ( t ) = 0.6284 e 0.00175 t + 0.3716 e 0.7023 t α φ ( t ) = 0.8206 e 0.00358 t + 0.1794 e 0.2609 t
Based on Equation (2), the variation in the shear strength attenuation factor for soft clay is shown in Figure 1.

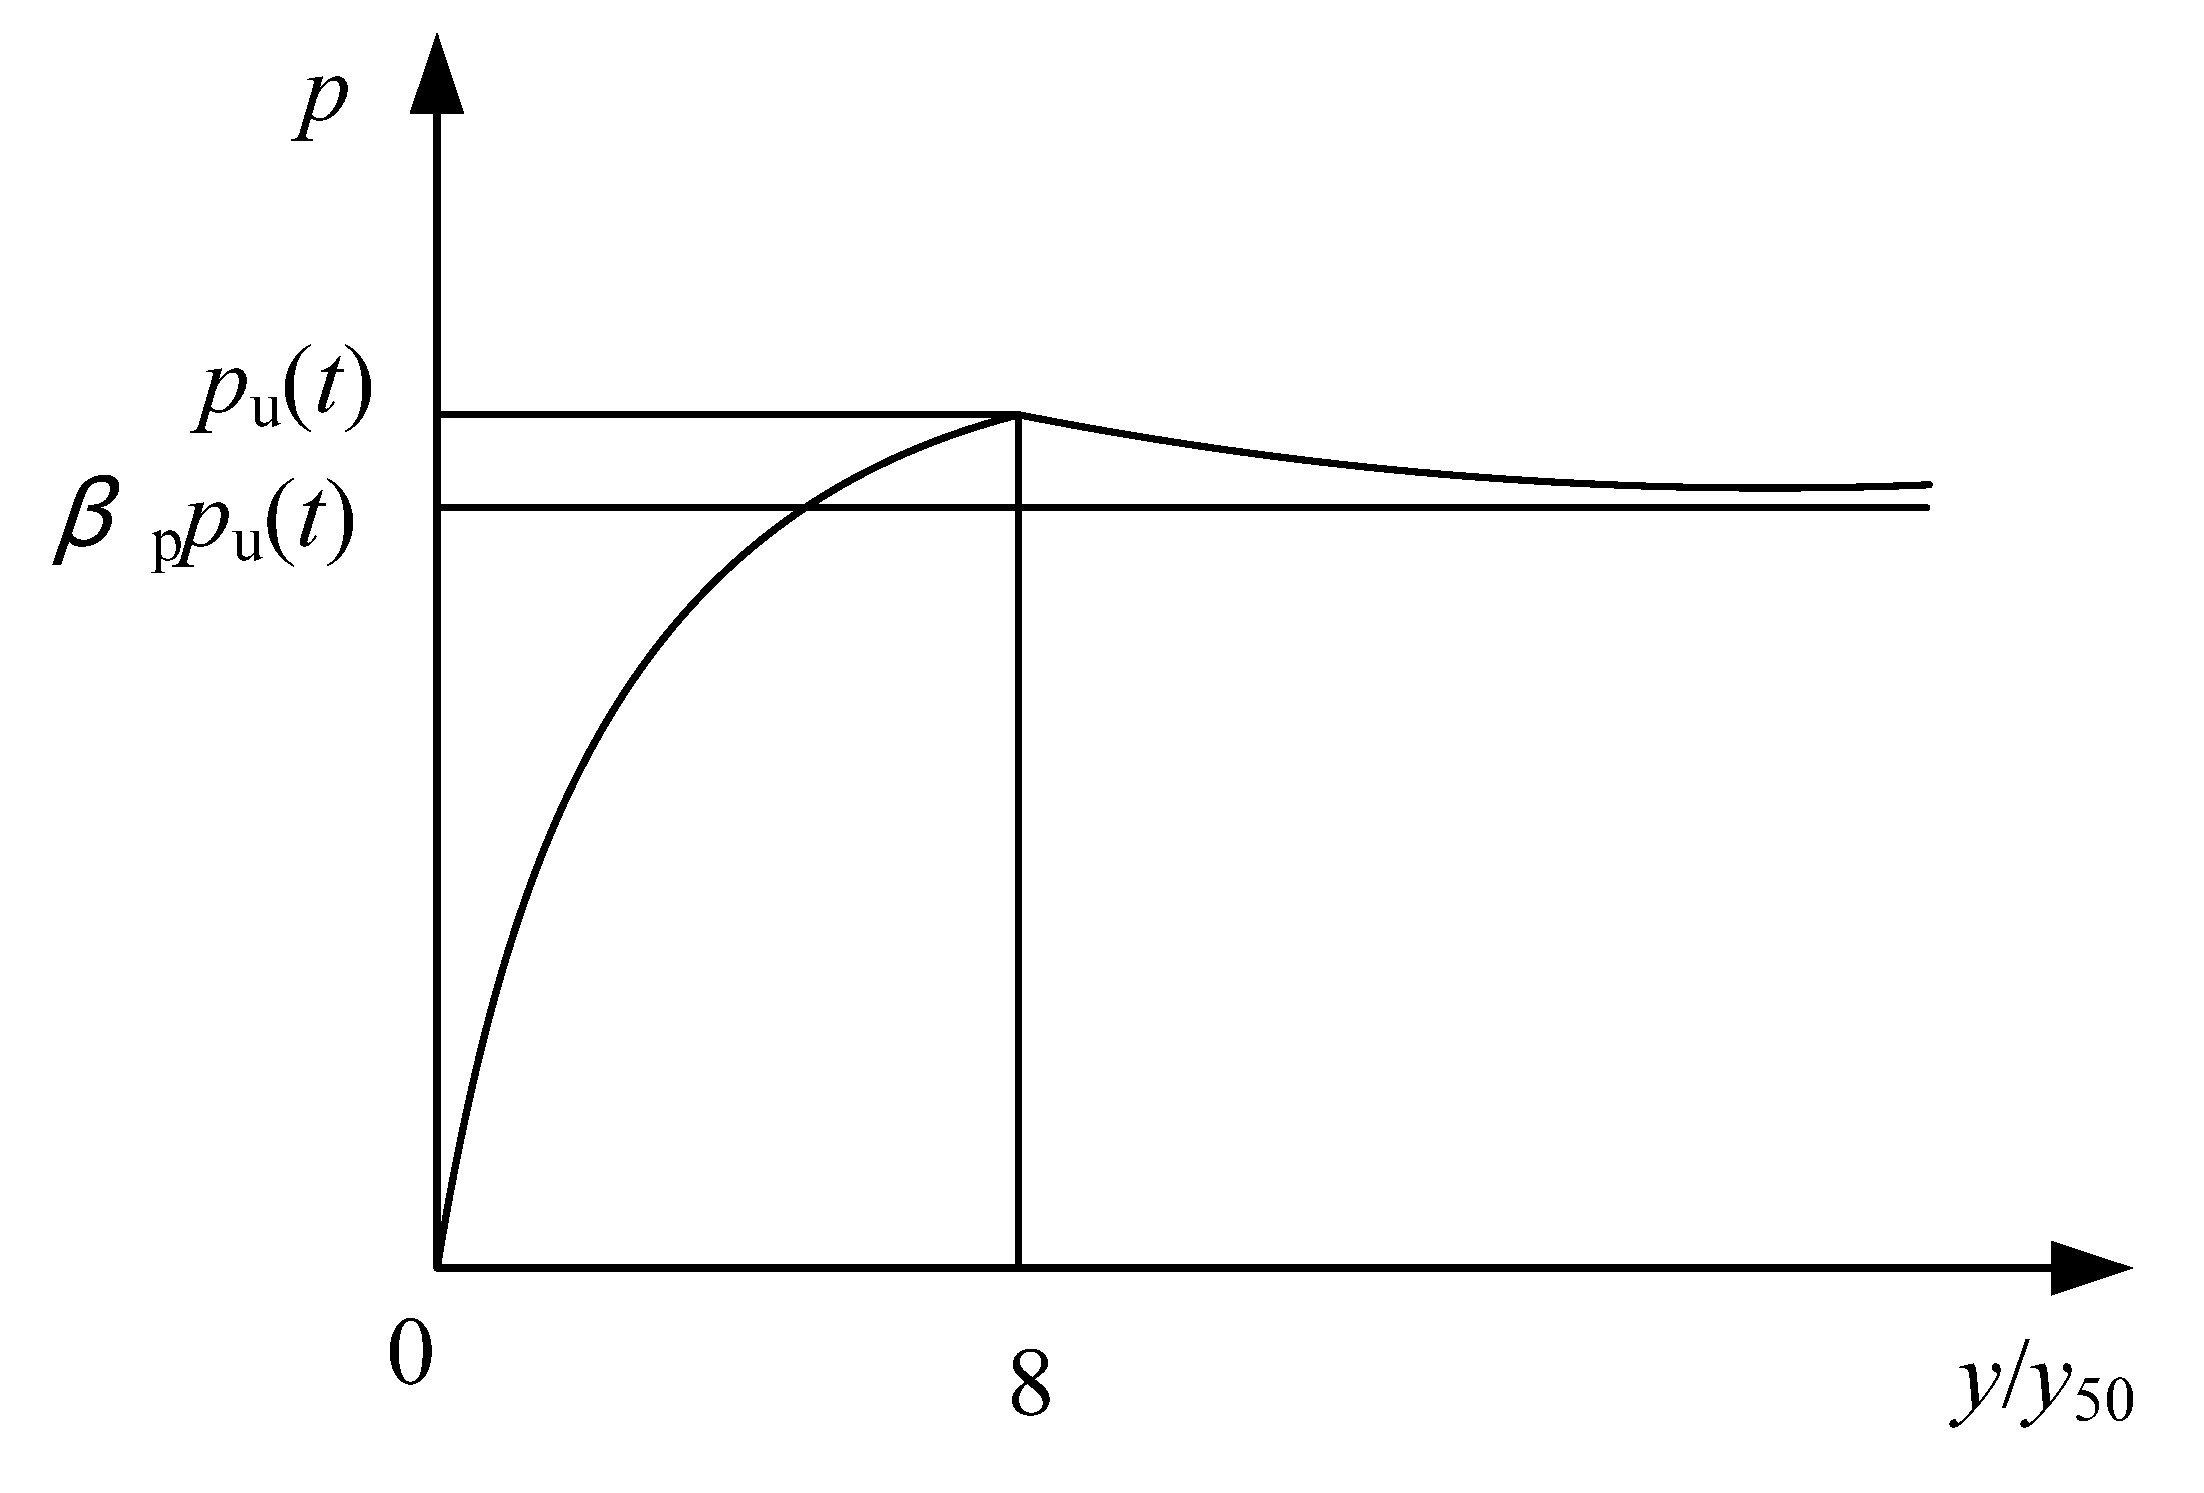
2.2. The p-y Curve Model Considering Time-Varying Characteristics

For a horizontally loaded pile in a soft soil area, the interaction of the pile–soil is characterized as significantly nonlinear. It is difficult to accurately analyze the creep characteristic of soft soil and the bearing behavior of piles using the “m” method. In order to consider the time-varying characteristics of the shear strength of soft soil, the p-y curve is modified [9], which is shown in Figure 2.
In the initial stage, the soil resistance increases nonlinearly with the increase in the y/y50. When the soil resistance reaches the peak value, the soil resistance decreases with the increase in the y/y50, and gradually approaches βppu(t). The relationship between p/pu(t) and the y/y50 can be calculated as:
p p u ( t ) = ( y / y 50 ) [ a p + c p ( y / y 50 ) ] [ a p + b p ( y / y 50 ) ]
where pu(t) is the ultimate soil resistance changing with time. The relationship can be shown as [27]:
p u ( t ) = min ( a u + b u z ) δ 1 b   9 b c ( t ) + γ z tan φ ( t )
where au = 1.212, bu = 0.6631/b. γ is the soil weight, b is the pile diameter, z is the distance from the calculation point to the pile top, and δ1 is the passive earth pressure, which can be expressed as
δ 1 = γ z tan 2 ( 45 ° + φ ( t ) 2 ) + 2 c ( t ) tan ( 45 ° + φ ( t ) 2 )
where ap, bp, and cp are undetermined parameters, which can be calculated as
a p = 4 ( β p 1 + 1 β p ) β p b p = 1 1 β p 2 β p c p = 2 β p 2 1 β p 4 β p
where βp is the lateral soil resistance softening ratio, which is related to the property of the soil and can be obtained by field test or laboratory test.
The y50 is the horizontal displacement when the soil reaction load reaches half of the ultimate resistance, which can be expressed as [27]
y 50 = 0.0158 a v 1.15 b 0.75
where av is the coefficient of compressibility of the soil.

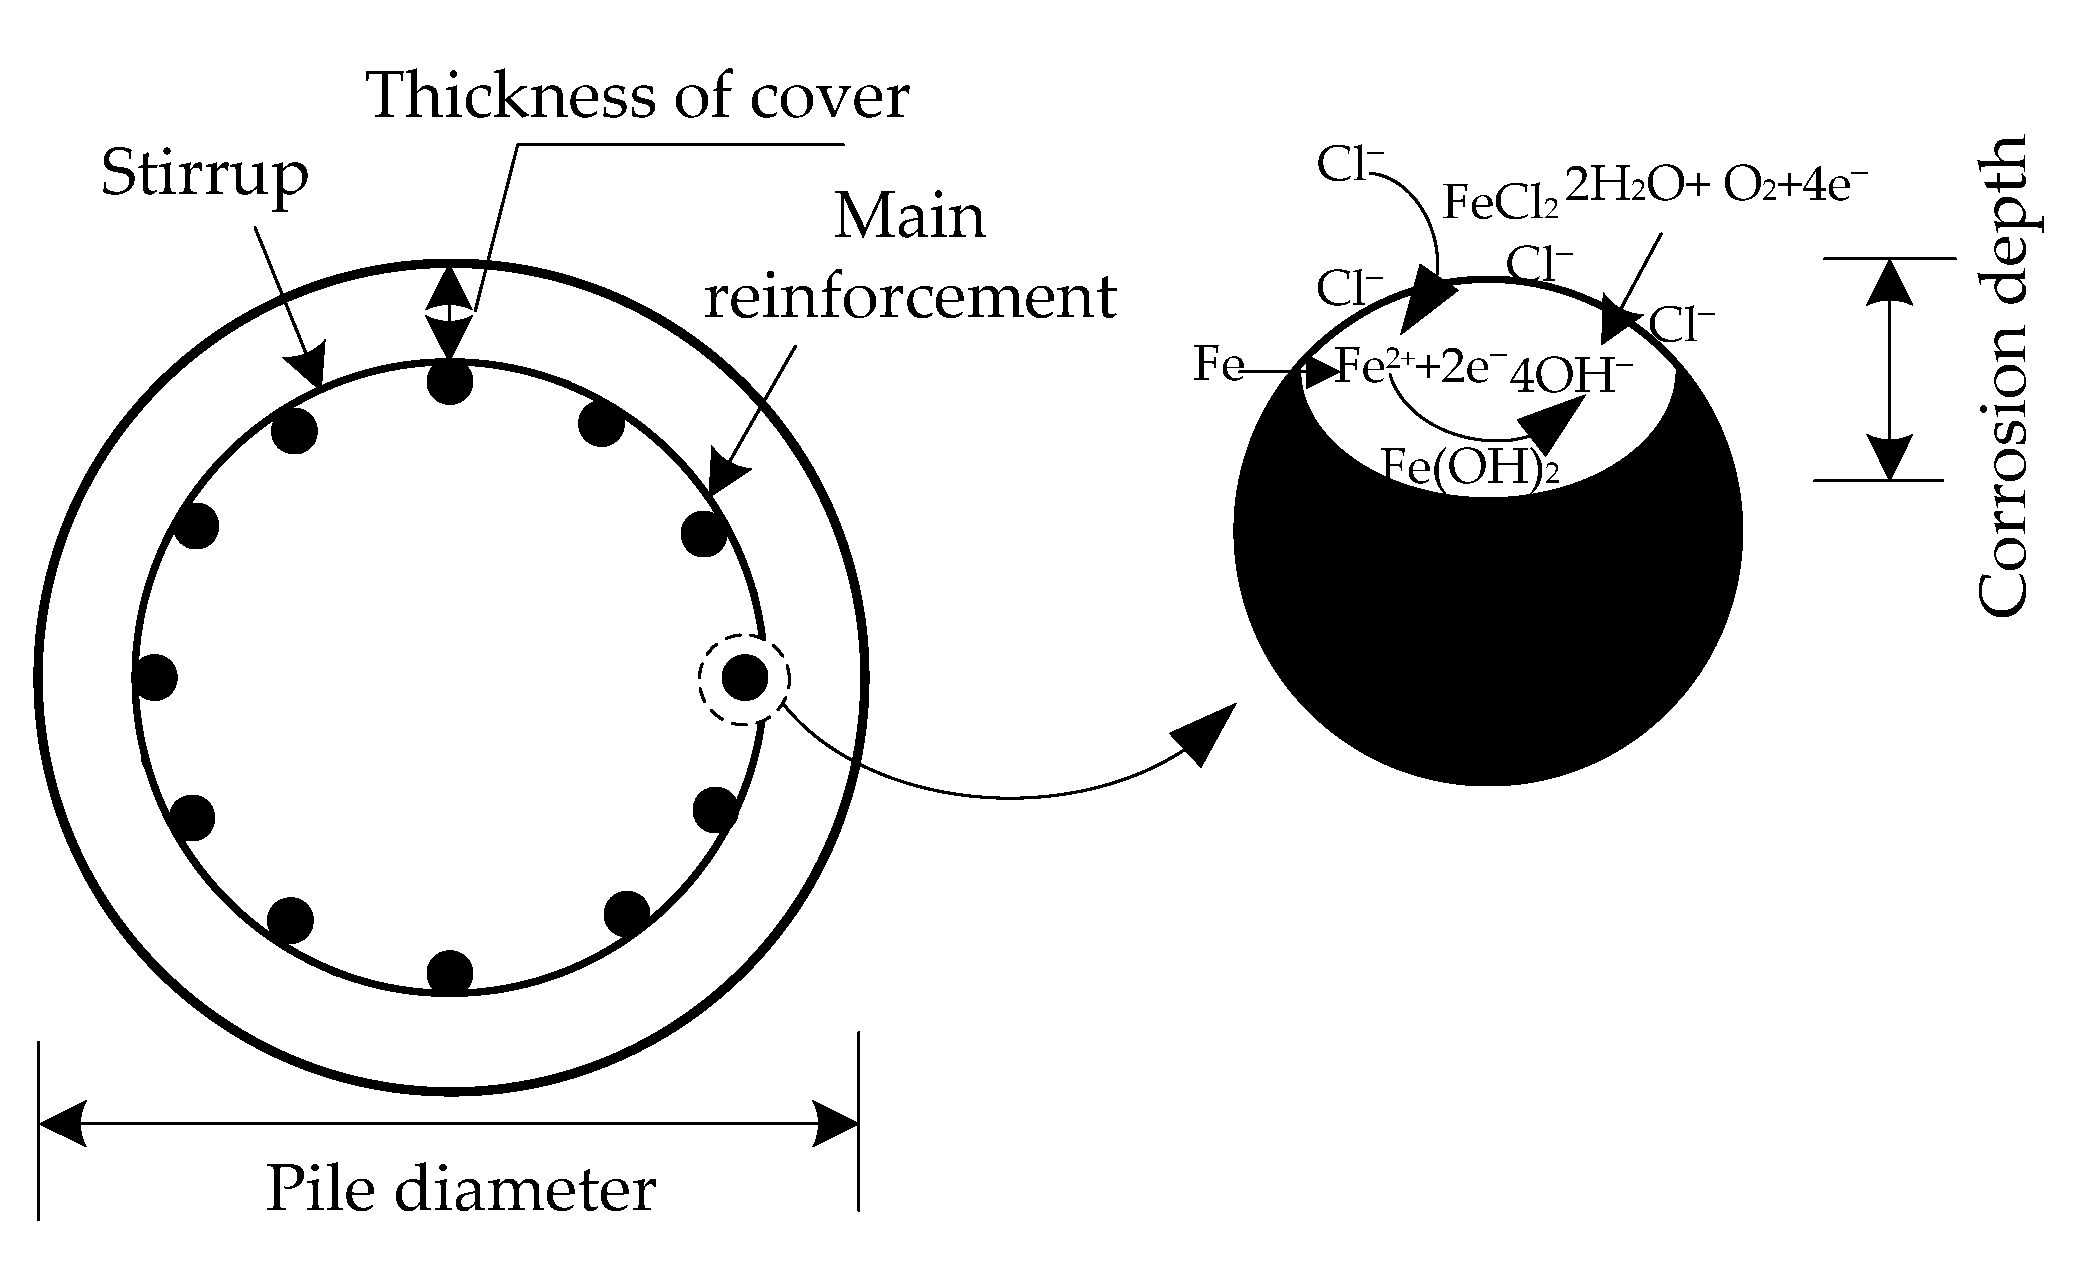
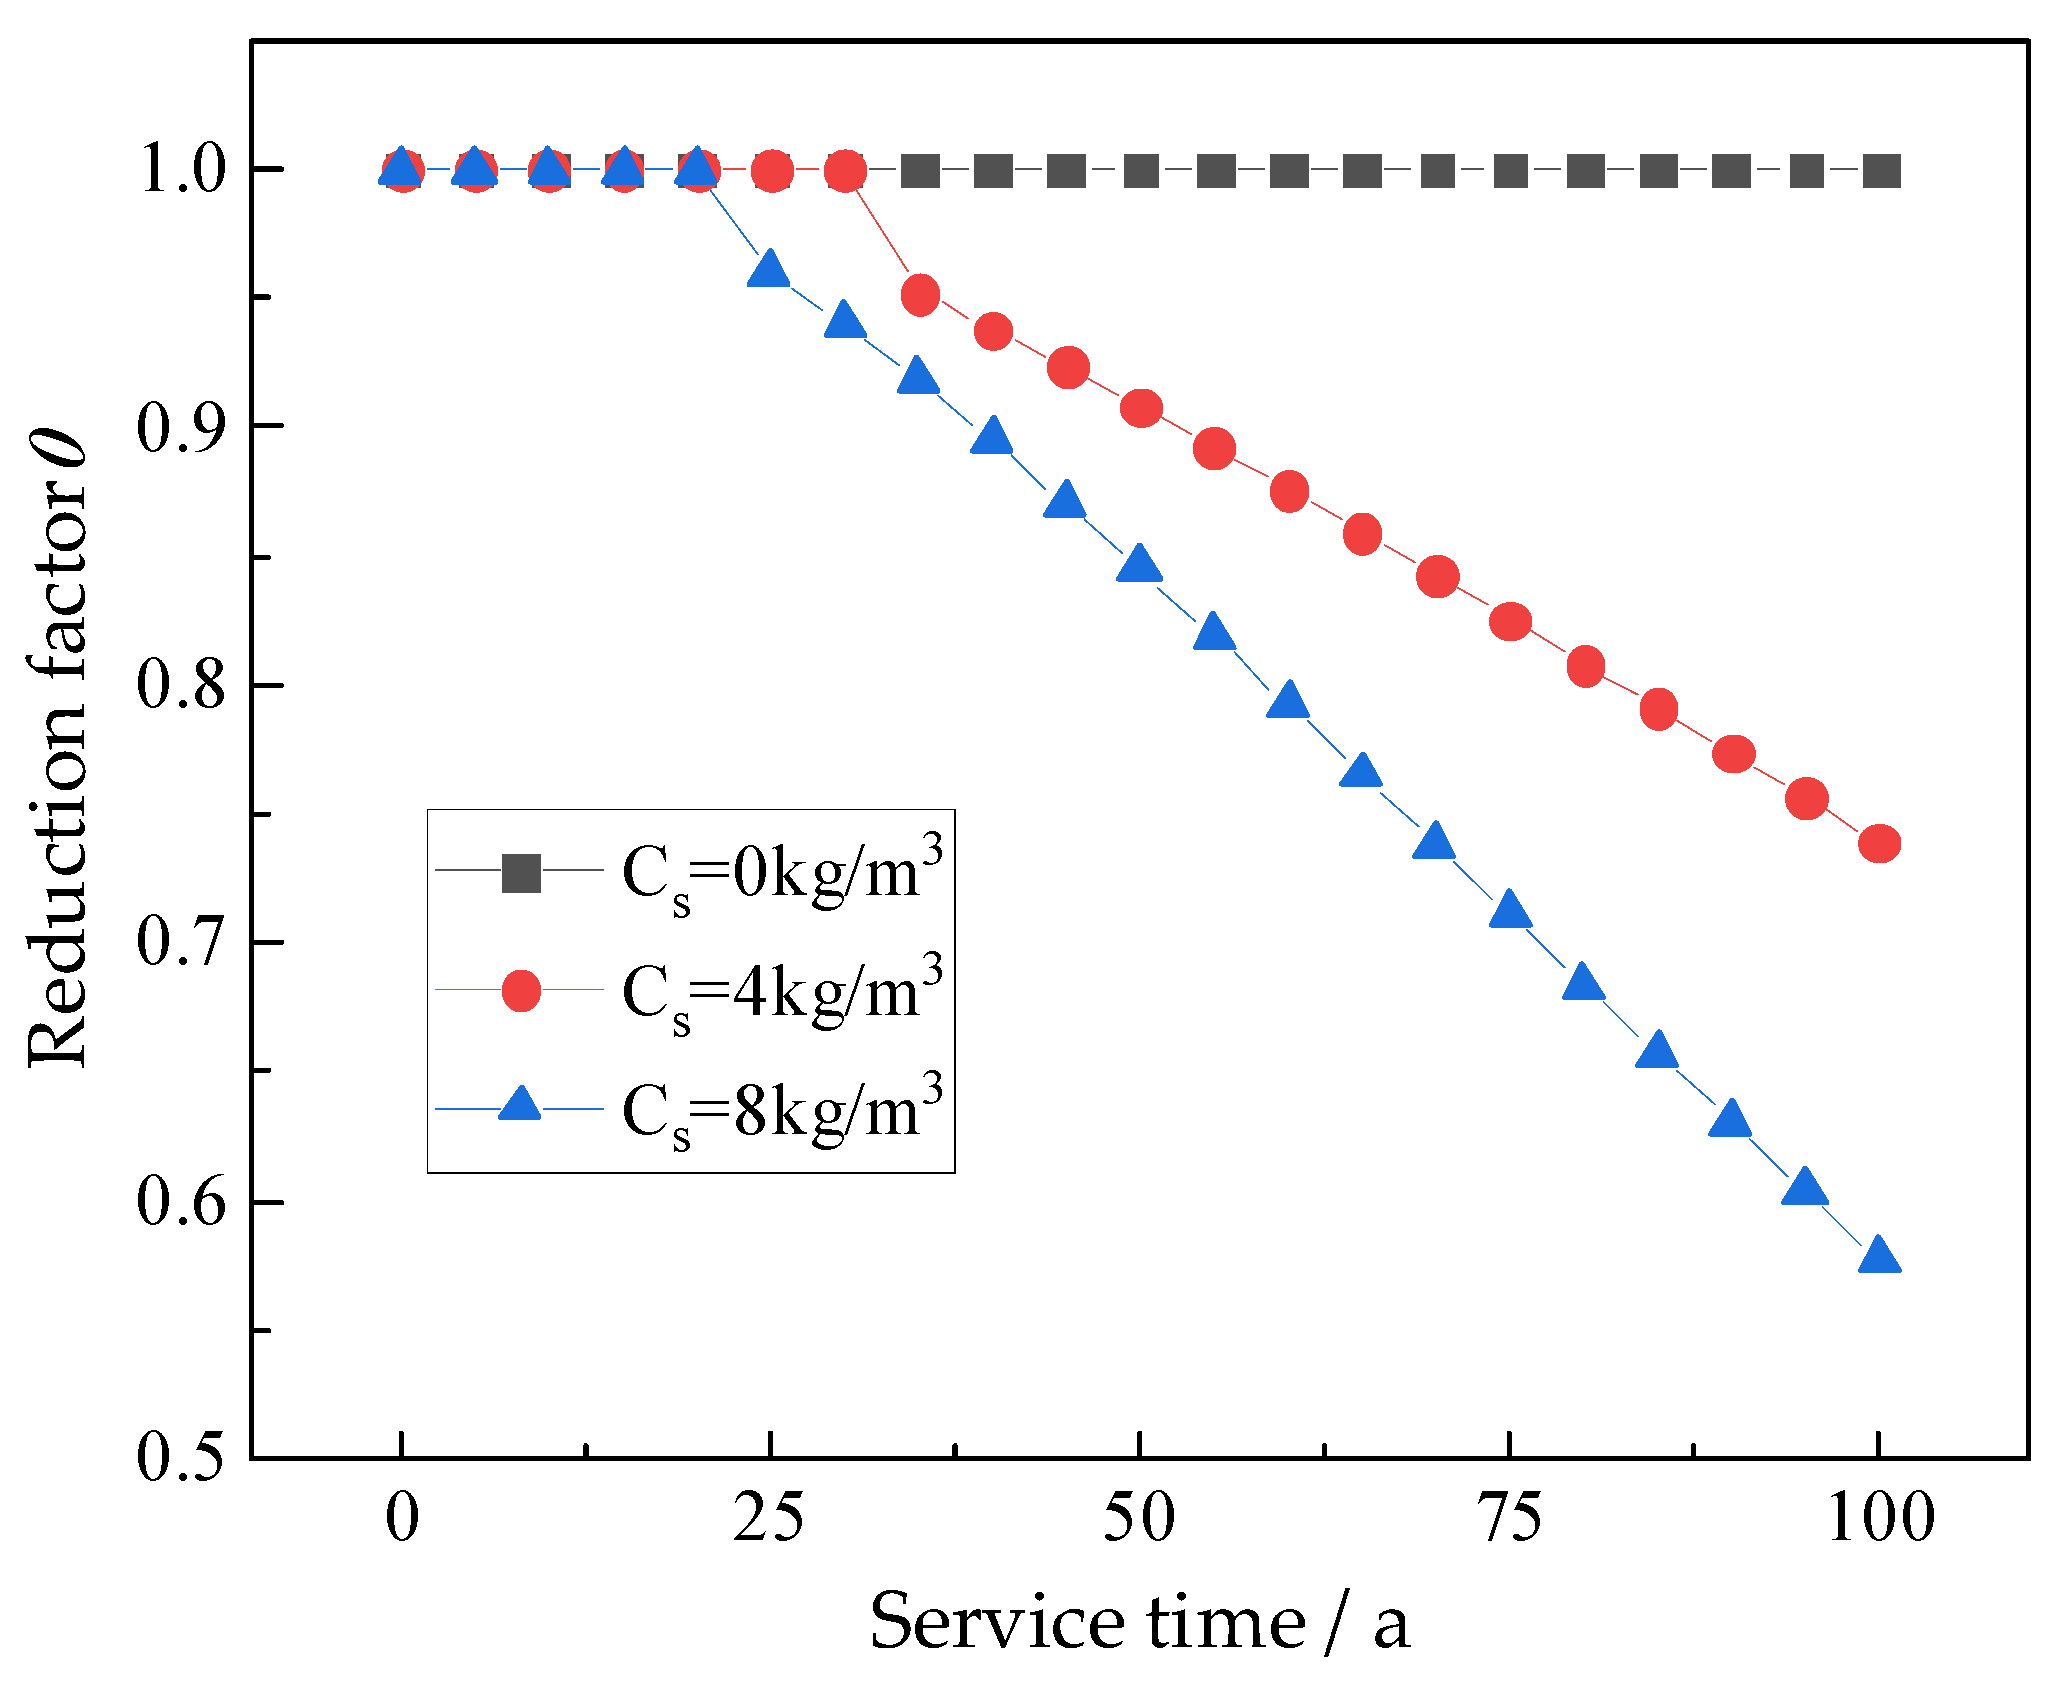
2.3. Time-Varying Characteristics of the Bending Stiffness of the Pile

When a reinforced concrete pile is constructed in coastal areas, the steel bar in the pile is easily corroded by chloride. Consequently, the bending stiffness of the pile will deteriorate and decrease. The corrosion mechanism of chloride can be described, as shown in Figure 3. In order to consider the influence of chloride corrosion on the bending stiffness of the pile, the bending stiffness (EI) of the pile can be corrected by adding a reduction factor η [1].
E p I p = η E I
where EpIP is the bending stiffness of the corroded reinforced concrete pile. EI is the initial bending stiffness of a reinforced concrete pile. η is a reduction factor, that can be calculated as
η = 1 A A i η i
where A is the total cross-sectional area of the tensile steel bar, Ai is the cross-sectional area of the i-th tensile steel bar after corrosion, and ηi is the stiffness reduction factor of the i-th steel bar caused by the corrosion. When the concrete cover of the pile body has no rust expansion crack, ηi = 1. When the rust expansion crack appears, the expression of the ηi can be calculated as
η i = 1.0   0 d i < 0.1 ( 3.7 7 d i ) / 3   0 . 1 d i < 0.25 0.65 d i 0.25  
where di is the corrosion depth of the i-th steel bar. The corrosion depth (d) of steel under the action of chloride can be expressed as
d = 2.949 × 10 10 0 t i corr ( t ) d t
where icorr is the corrosion current density of a steel bar. Liu et al. [28,29] obtained the relationship between the chloride concentration on the surface of steel bar, the temperature, and concrete resistivity:
i corr = 0.926 exp [ 7.98 + 0.7771 ln ( 1.69 C ) 3006 T 1.16 × 10 4 R + 2.24 t 0.215 ]
where T is the surface temperature of the rebar, t is the steel corrosion time, C is the chloride concentration on the reinforcement surface, and R is the resistance value of the concrete cover, which can be expressed as
R = exp 8.03 0.549 ln ( 1 + 1.69 C )
When the material does not contain a chloride component, the diffusion of chloride obeys the simplified Fick‘s second law, which can be expressed as [30]:
C x C s = [ 1 e r f ( p 2 D t ) ]
where Cx is the chloride concentration at position p from the concrete’s surface at time t, Cs is the chloride concentration on the concrete’s surface, D is the effective diffusion coefficient of chloride in concrete, and erf(x) is the error function, which can be expressed as
e r f ( x ) = 2 π 0 x e x 2 d x

3. Horizontal Bearing Capacity and Reliability Analysis of the Pile

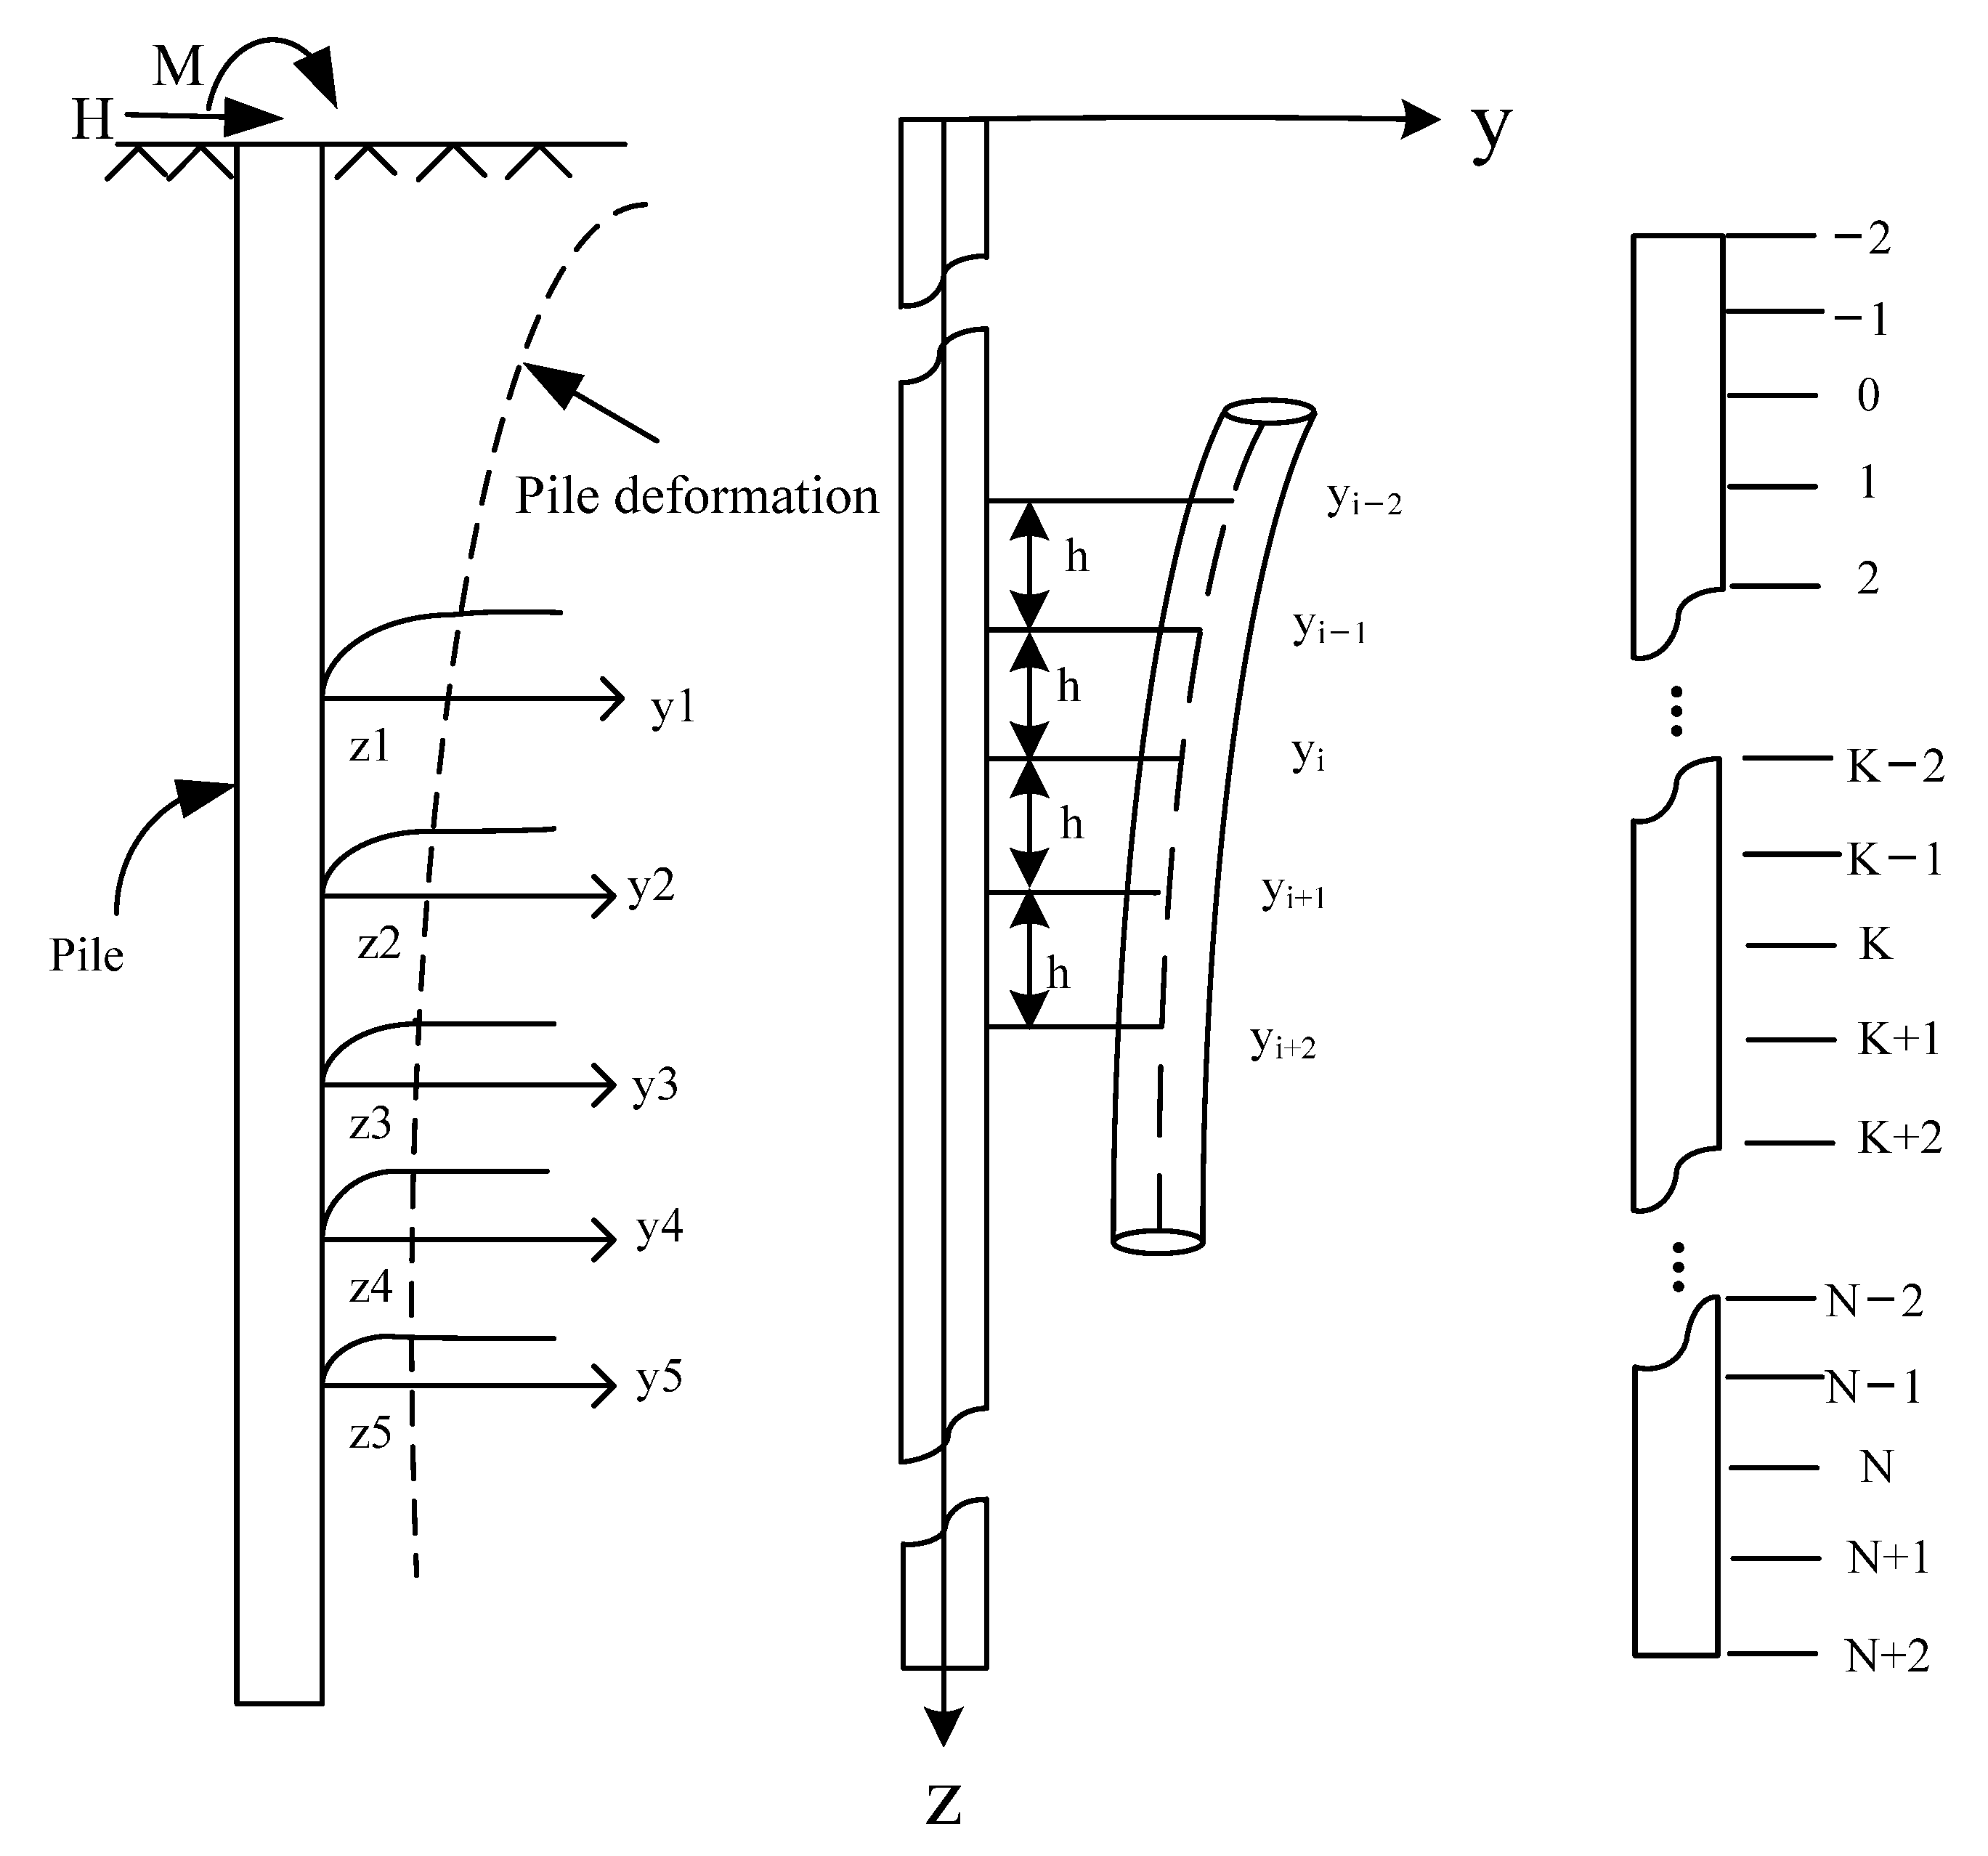
3.1. Analysis of Horizontal Bearing Capacity of the Pile

According to the distribution of soil condition, the pile is divided into N sections, and two virtual nodes are added at the position of the top and bottom of the pile using the principle of central difference method. The deformation and difference diagram of the pile under horizontal load is shown in Figure 4.
The deflection differential equation of each node under the horizontal load can be established by a simplified analysis of the pile, considering the time-varying characteristics of the pile and soil. This can be expressed as
E p I p d 4 y d z 4 + b p ( y , z , t ) = 0
where p(y,z, and t) is soil resistance considering the time-varying characteristics of soft soil. By transforming Equation (16) into the differential scheme, the simplified deflection differential equation of each node is obtained as
y i 2 4 y i 1 + 6 y i 4 y i + 1 + y i + 2 + h 4 b p ( y , z , t ) E p I p = 0
Based on the boundary conditions of the pile foundation, the finite difference method is used to solve the equation using MATLAB. The computational process can be found in the reference documentation [31].

3.2. Reliability Analysis

When the reliability of engineering structure is analyzed, the Monte Carlo method and the first-order second-moment method are used frequently. However, the explicitly expressed objective function should be carried out in the first-order second-moment method, and a large number of simulation tests should be performed to obtain relatively accurate results when the Monte Carlo method is used. However, the objective function of horizontal displacement of the pile is described as a nonlinear implicit expression. The response surface method can select the appropriate number of sample points, fitting the analytical formula to approximate the alternative performance function. Therefore, the quadratic response surface method is used to calculate the reliability index, and the Monte Carlo method is used for certificating. For the structure with random variable X, the quadratic response surface function can be expressed as
Z = g ( X ) = a 0 + i = 1 n b i X i + i = 1 n c i X i 2
where a0, bi, and ci are undetermined coefficients. When the random variable is n, the number of undetermined coefficients is 2n + 1.
When the quadratic response surface method is solved, the mean point μXi is generally taken as the initial value point, and the experimental point (xi) is taken around the value of μXi. The relationship can be expressed as:
x i = μ X i ± f δ X i
where δXi is the standard deviation. When f is greater than 0, the value is taken at about 2 [32].
When the experimental point (xi) is obtained according to Equation (19), it is then iterated continuously to approach the real limit state surface (g(X) = 0).
When the limit state function is obtained by fitting, the reliability index (β) and the checking point (x*) can be solved using the first-order second-moment method.
β = g ( x i ) + i = 1 n g ( x i ) X i ( μ X i x i ) i = 1 n g ( x i ) X i 2 δ X i 2  
x = μ X i + β δ X i cos θ X i
where cosθXi is the sensitivity coefficient, and its expression can be written as
cos θ X i = g ( x i ) X i δ X i i = 1 n g ( x i ) X i 2 δ X i 2
When the checkpoint (x*) is calculated, the next new expansion point (x) can be interpolated
x = μ X i + g ( μ X i ) g ( μ X i ) g ( x ) ( x μ X i )
The relationship between the failure probability (pf) and reliability index (β) can be expressed as:
p f = 1 Φ ( β ) = 1 2 π β exp ( u 2 2 ) d u
where Φ(x) is the cumulative distribution function obeying the standard normal distribution.
The basic steps of the quadratic response surface method can be expressed as
  • The initial iteration point is assumed, taking the mean (μX).
  • The experimental point (xi) is selected around the mean point (μX).
  • The estimated values of the performance function are calculated at each expansion point (gi(i = 1,2…,2n + 1)).
  • The undetermined coefficients (a0, bi, and ci) are solved.
  • The reliability index (β) and the checkpoint (x*) are calculated.
  • The estimated values of the performance function are calculated at the checking point (x*).
  • The new (x) is obtained using interpolation.
  • The steps (3) to (7) are repeated until |xx*| < ε, and the values of ε are 1 × 10⁻⁶ usually.
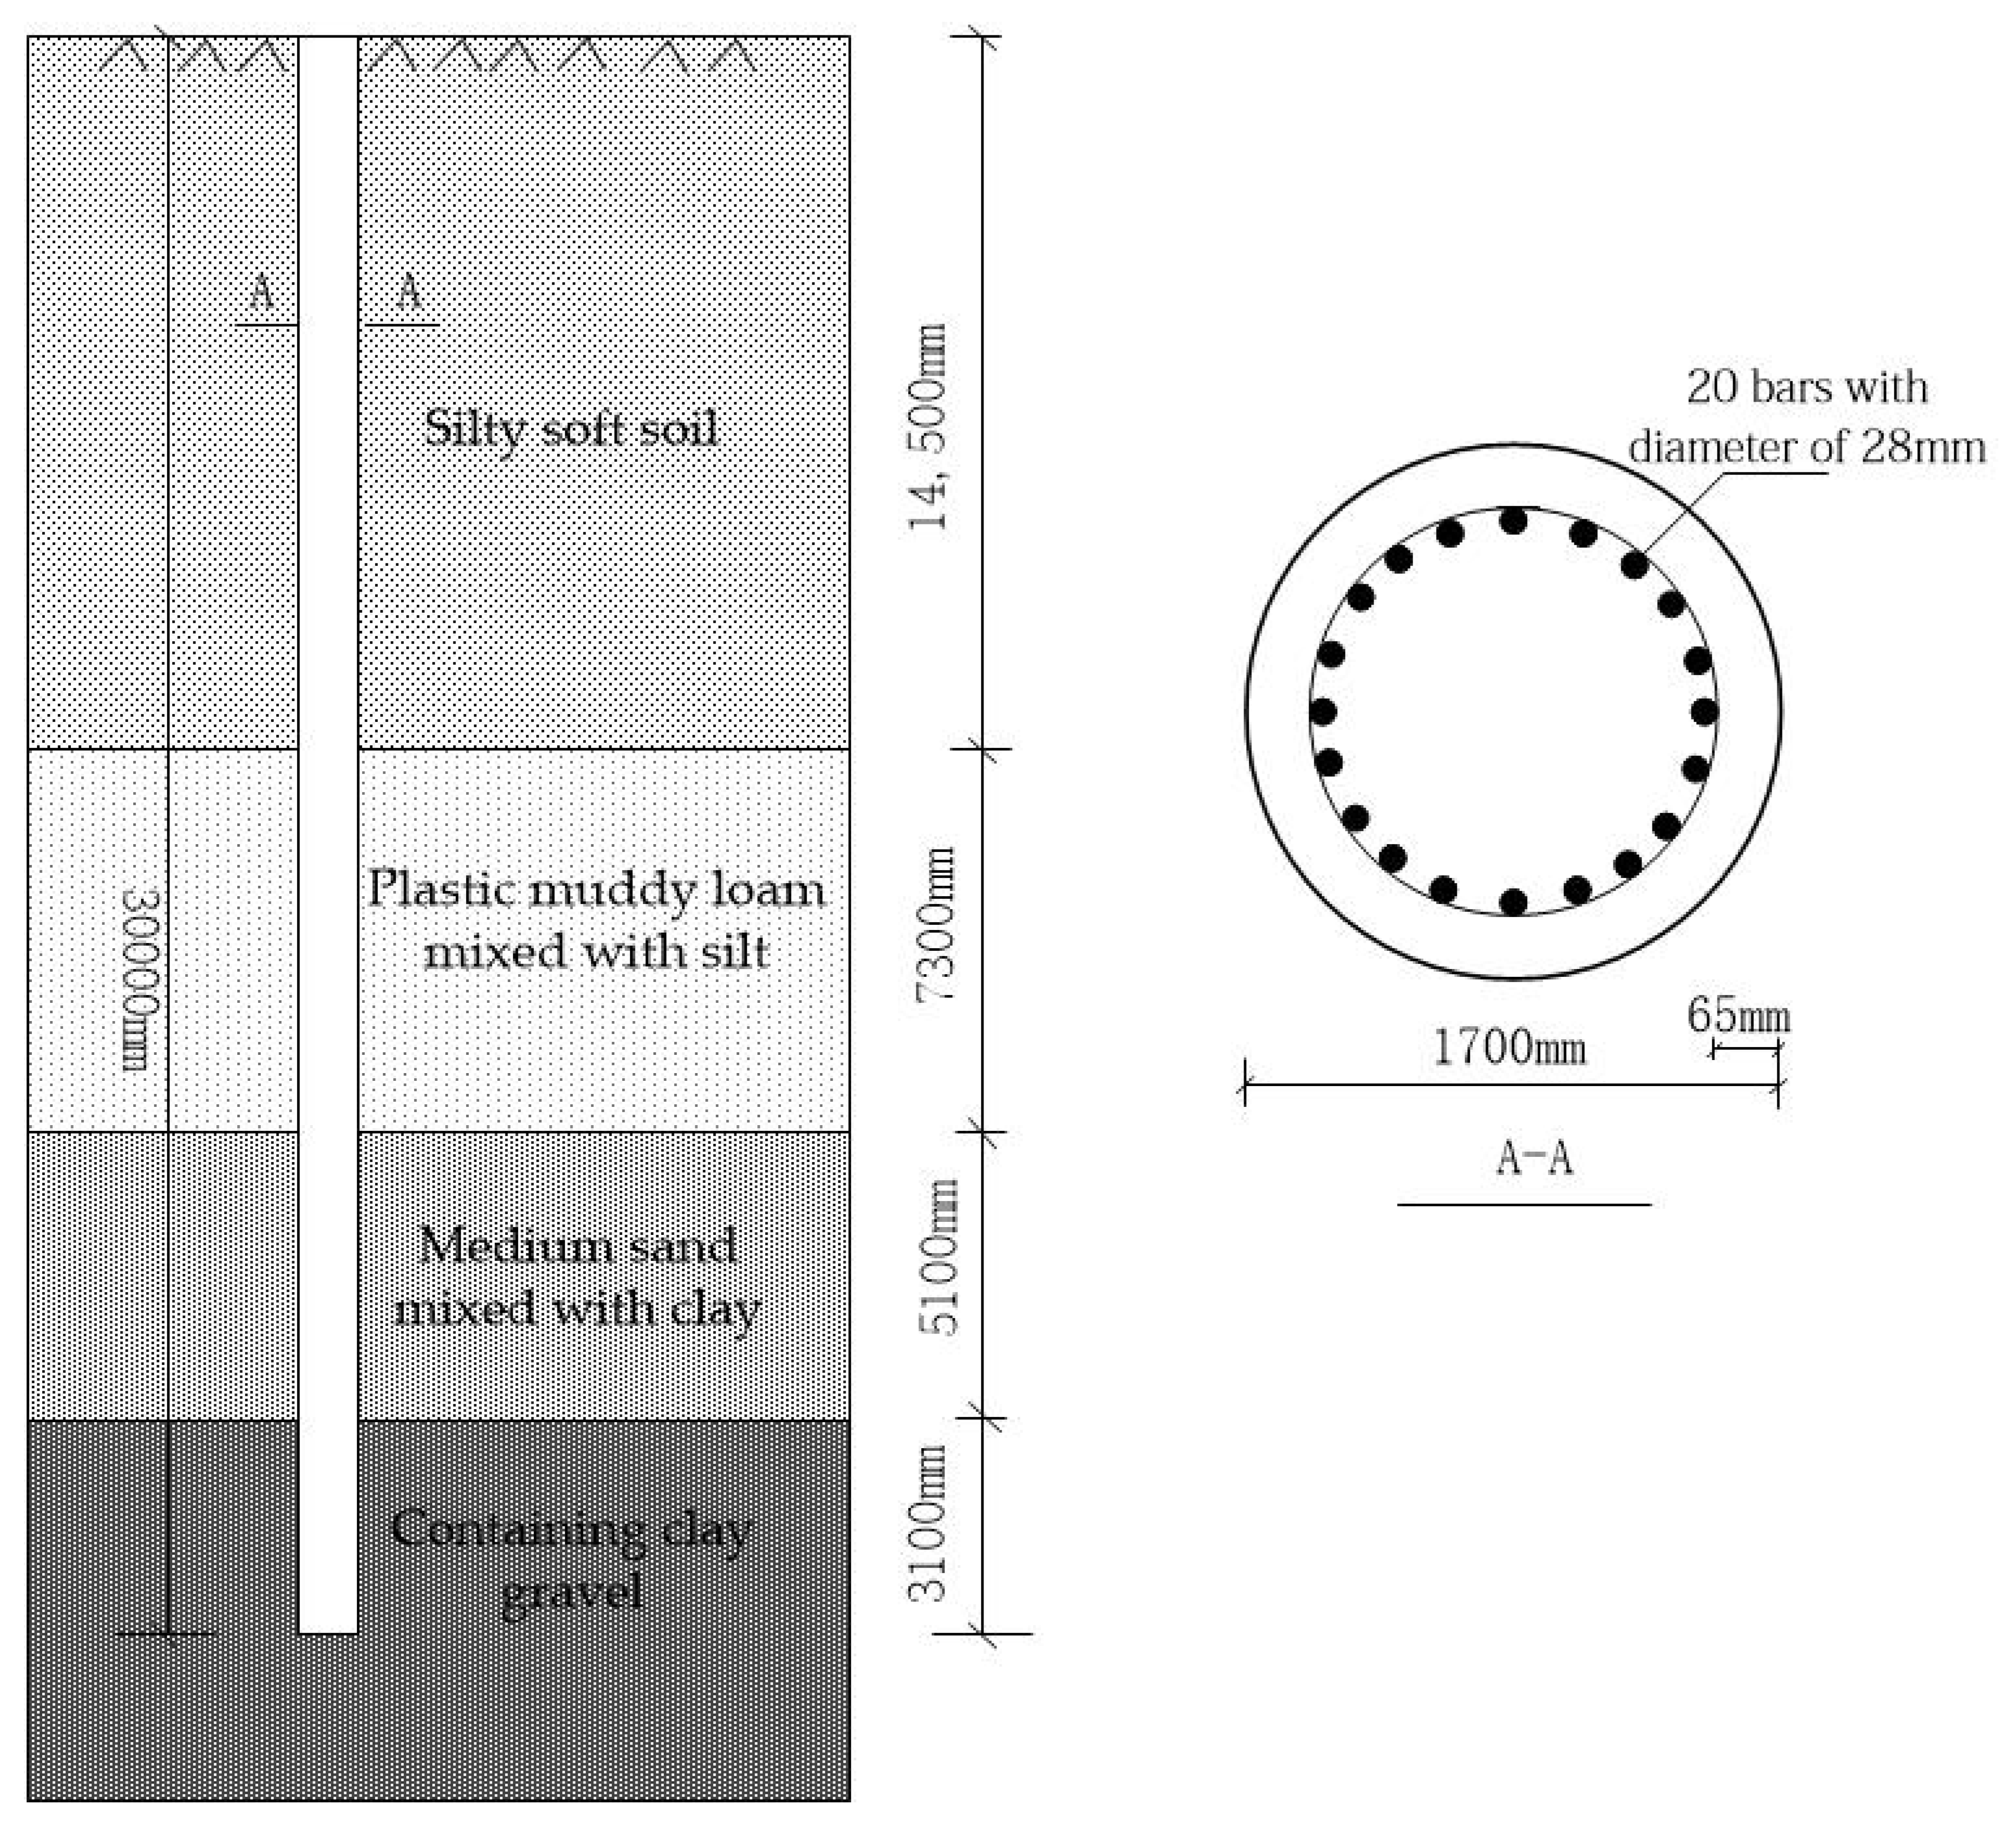
4. Case Study

A reinforced concrete pile is constructed in soft clay in a coastal city. The soil depth is 40 m. The physical and mechanical properties of the foundation soil are shown in Table 1. C30 concrete is used for constructing the pile. The length of the pile is 30 m, the diameter of the pile is 1.7 m, and the elastic modulus of the pile is 30 GPa. Twenty steel bars (HRB400) with a diameter of 28 mm are used as the main reinforcement. The concrete cover is 65 mm. The horizontal load is 150 kN, the initial bending moment is 420 kN·m, the ultimate bearing capacity of the pile is 30,352 kN·m, and the maximum allowable displacement of the pile is 10 mm. The reinforcement of the pile is shown in Figure 5.
The chloride diffusion coefficient is 1.0 × 10⁻¹² m2/s, and the surface temperature of rebar is 296 K. It is assumed that cohesion (c), internal friction angle (φ), concrete cover (B), and chloride concentration (Cs) obey the normal distribution, the mean values are 20 kPa, 5°, 65 mm, and 8 kg/m3, respectively, and the coefficient of variation is 0.1.

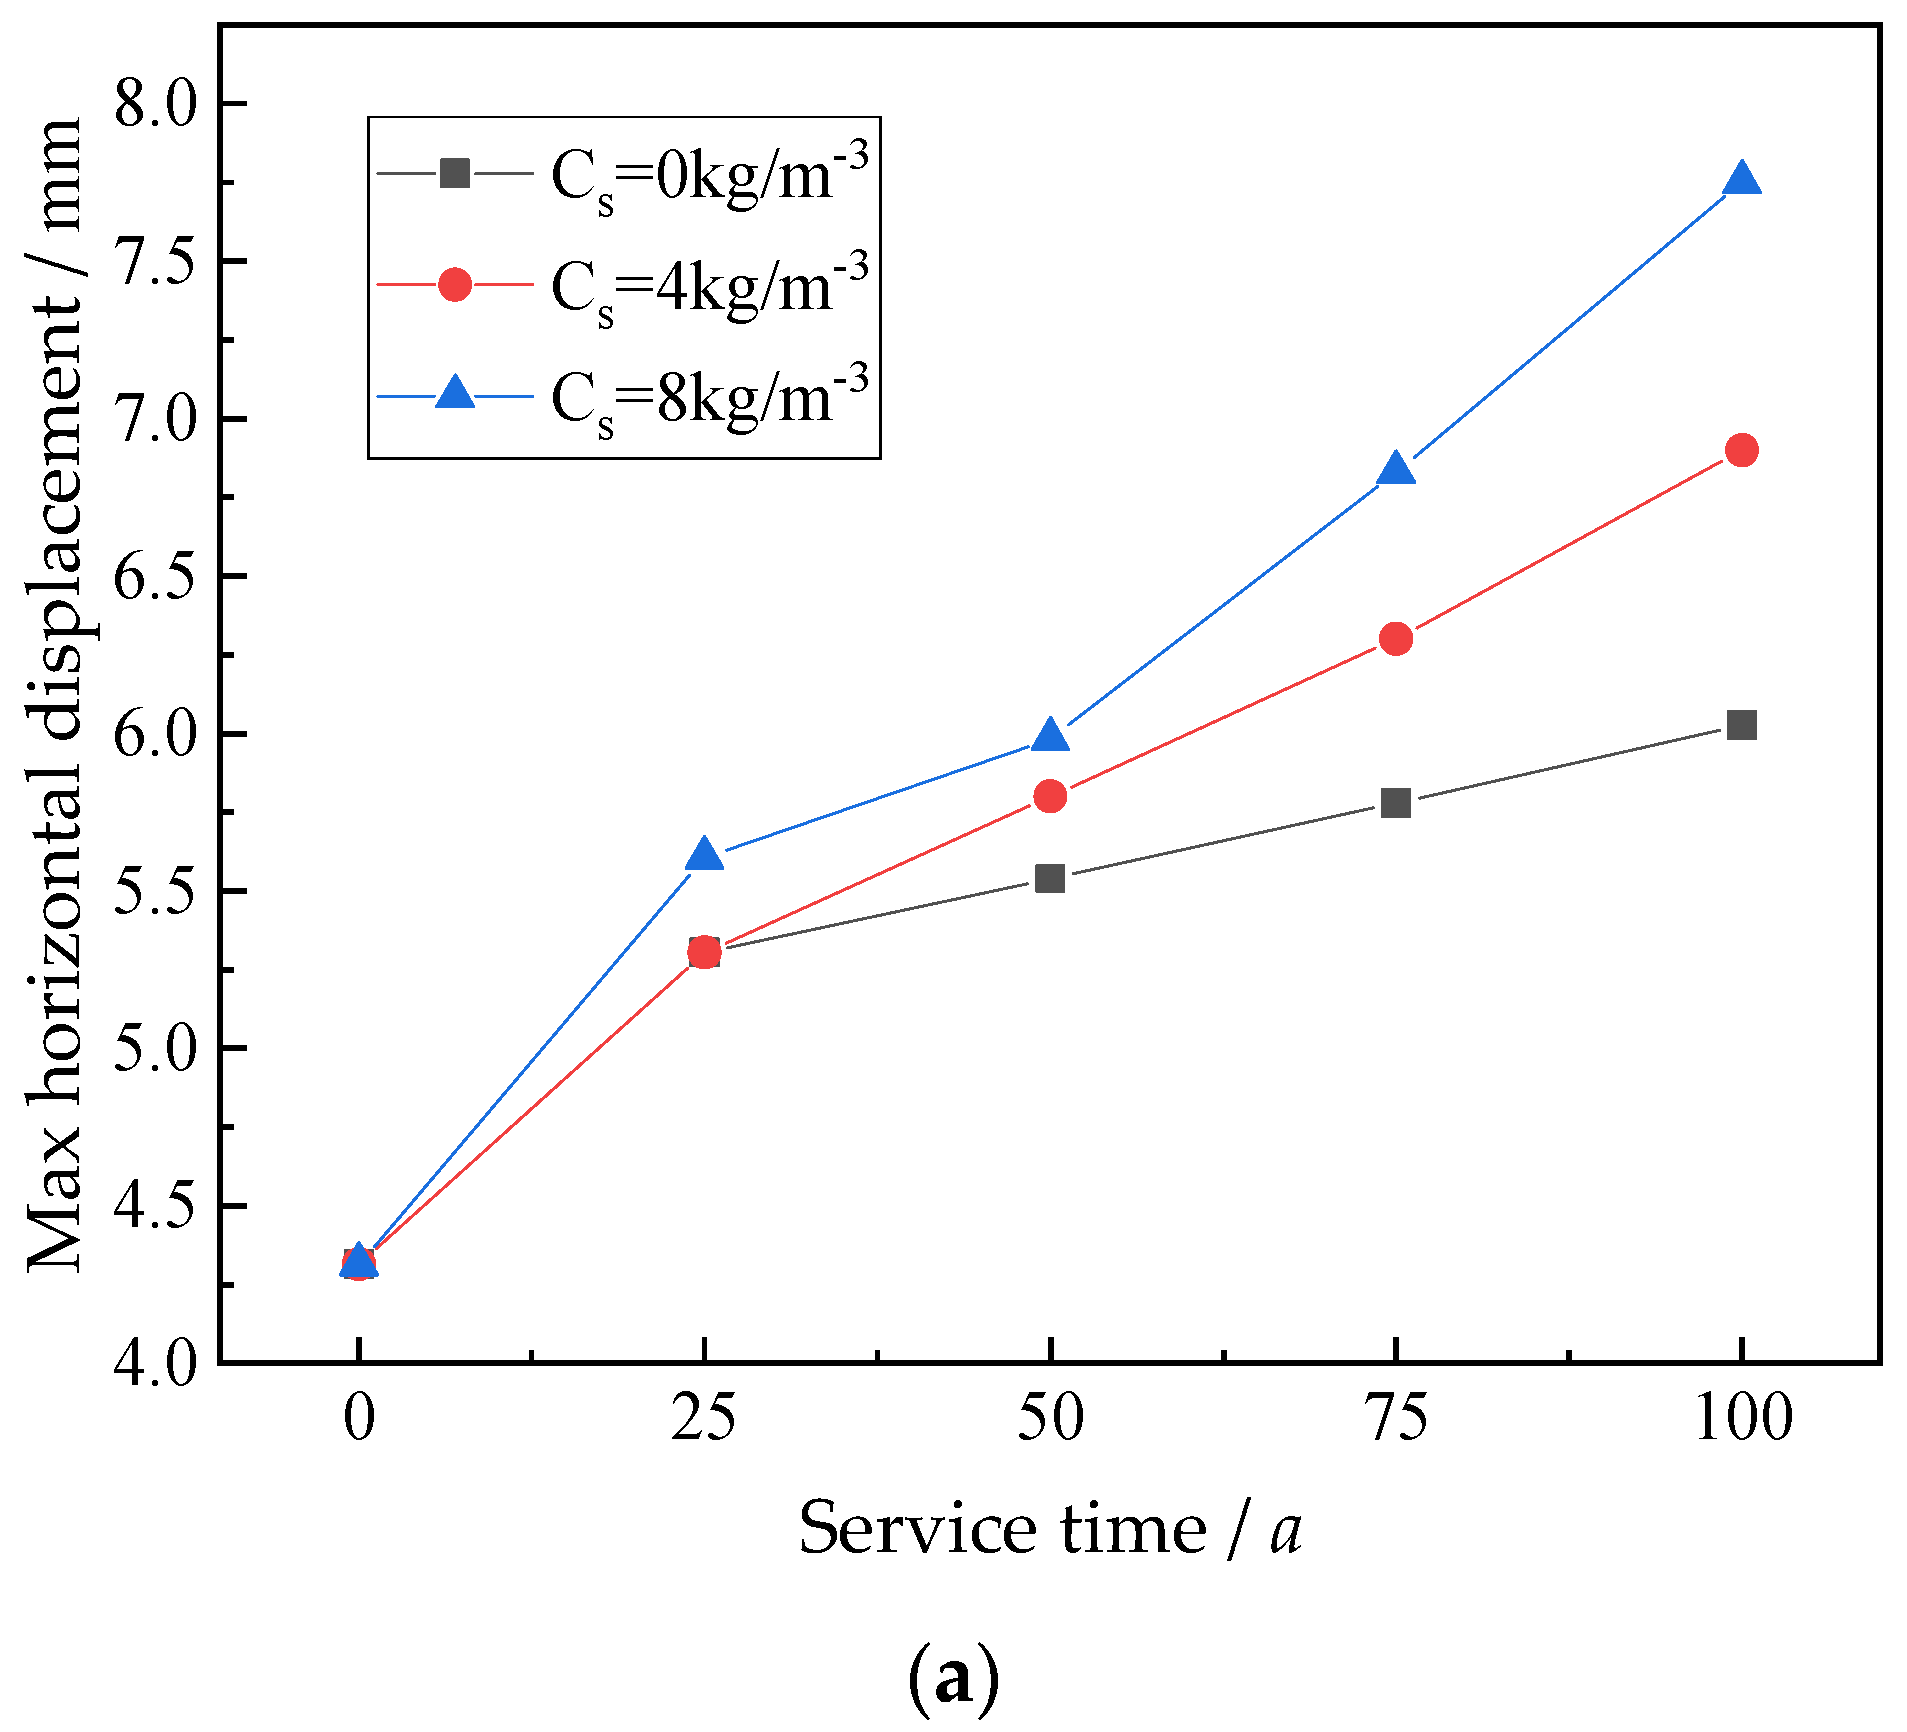
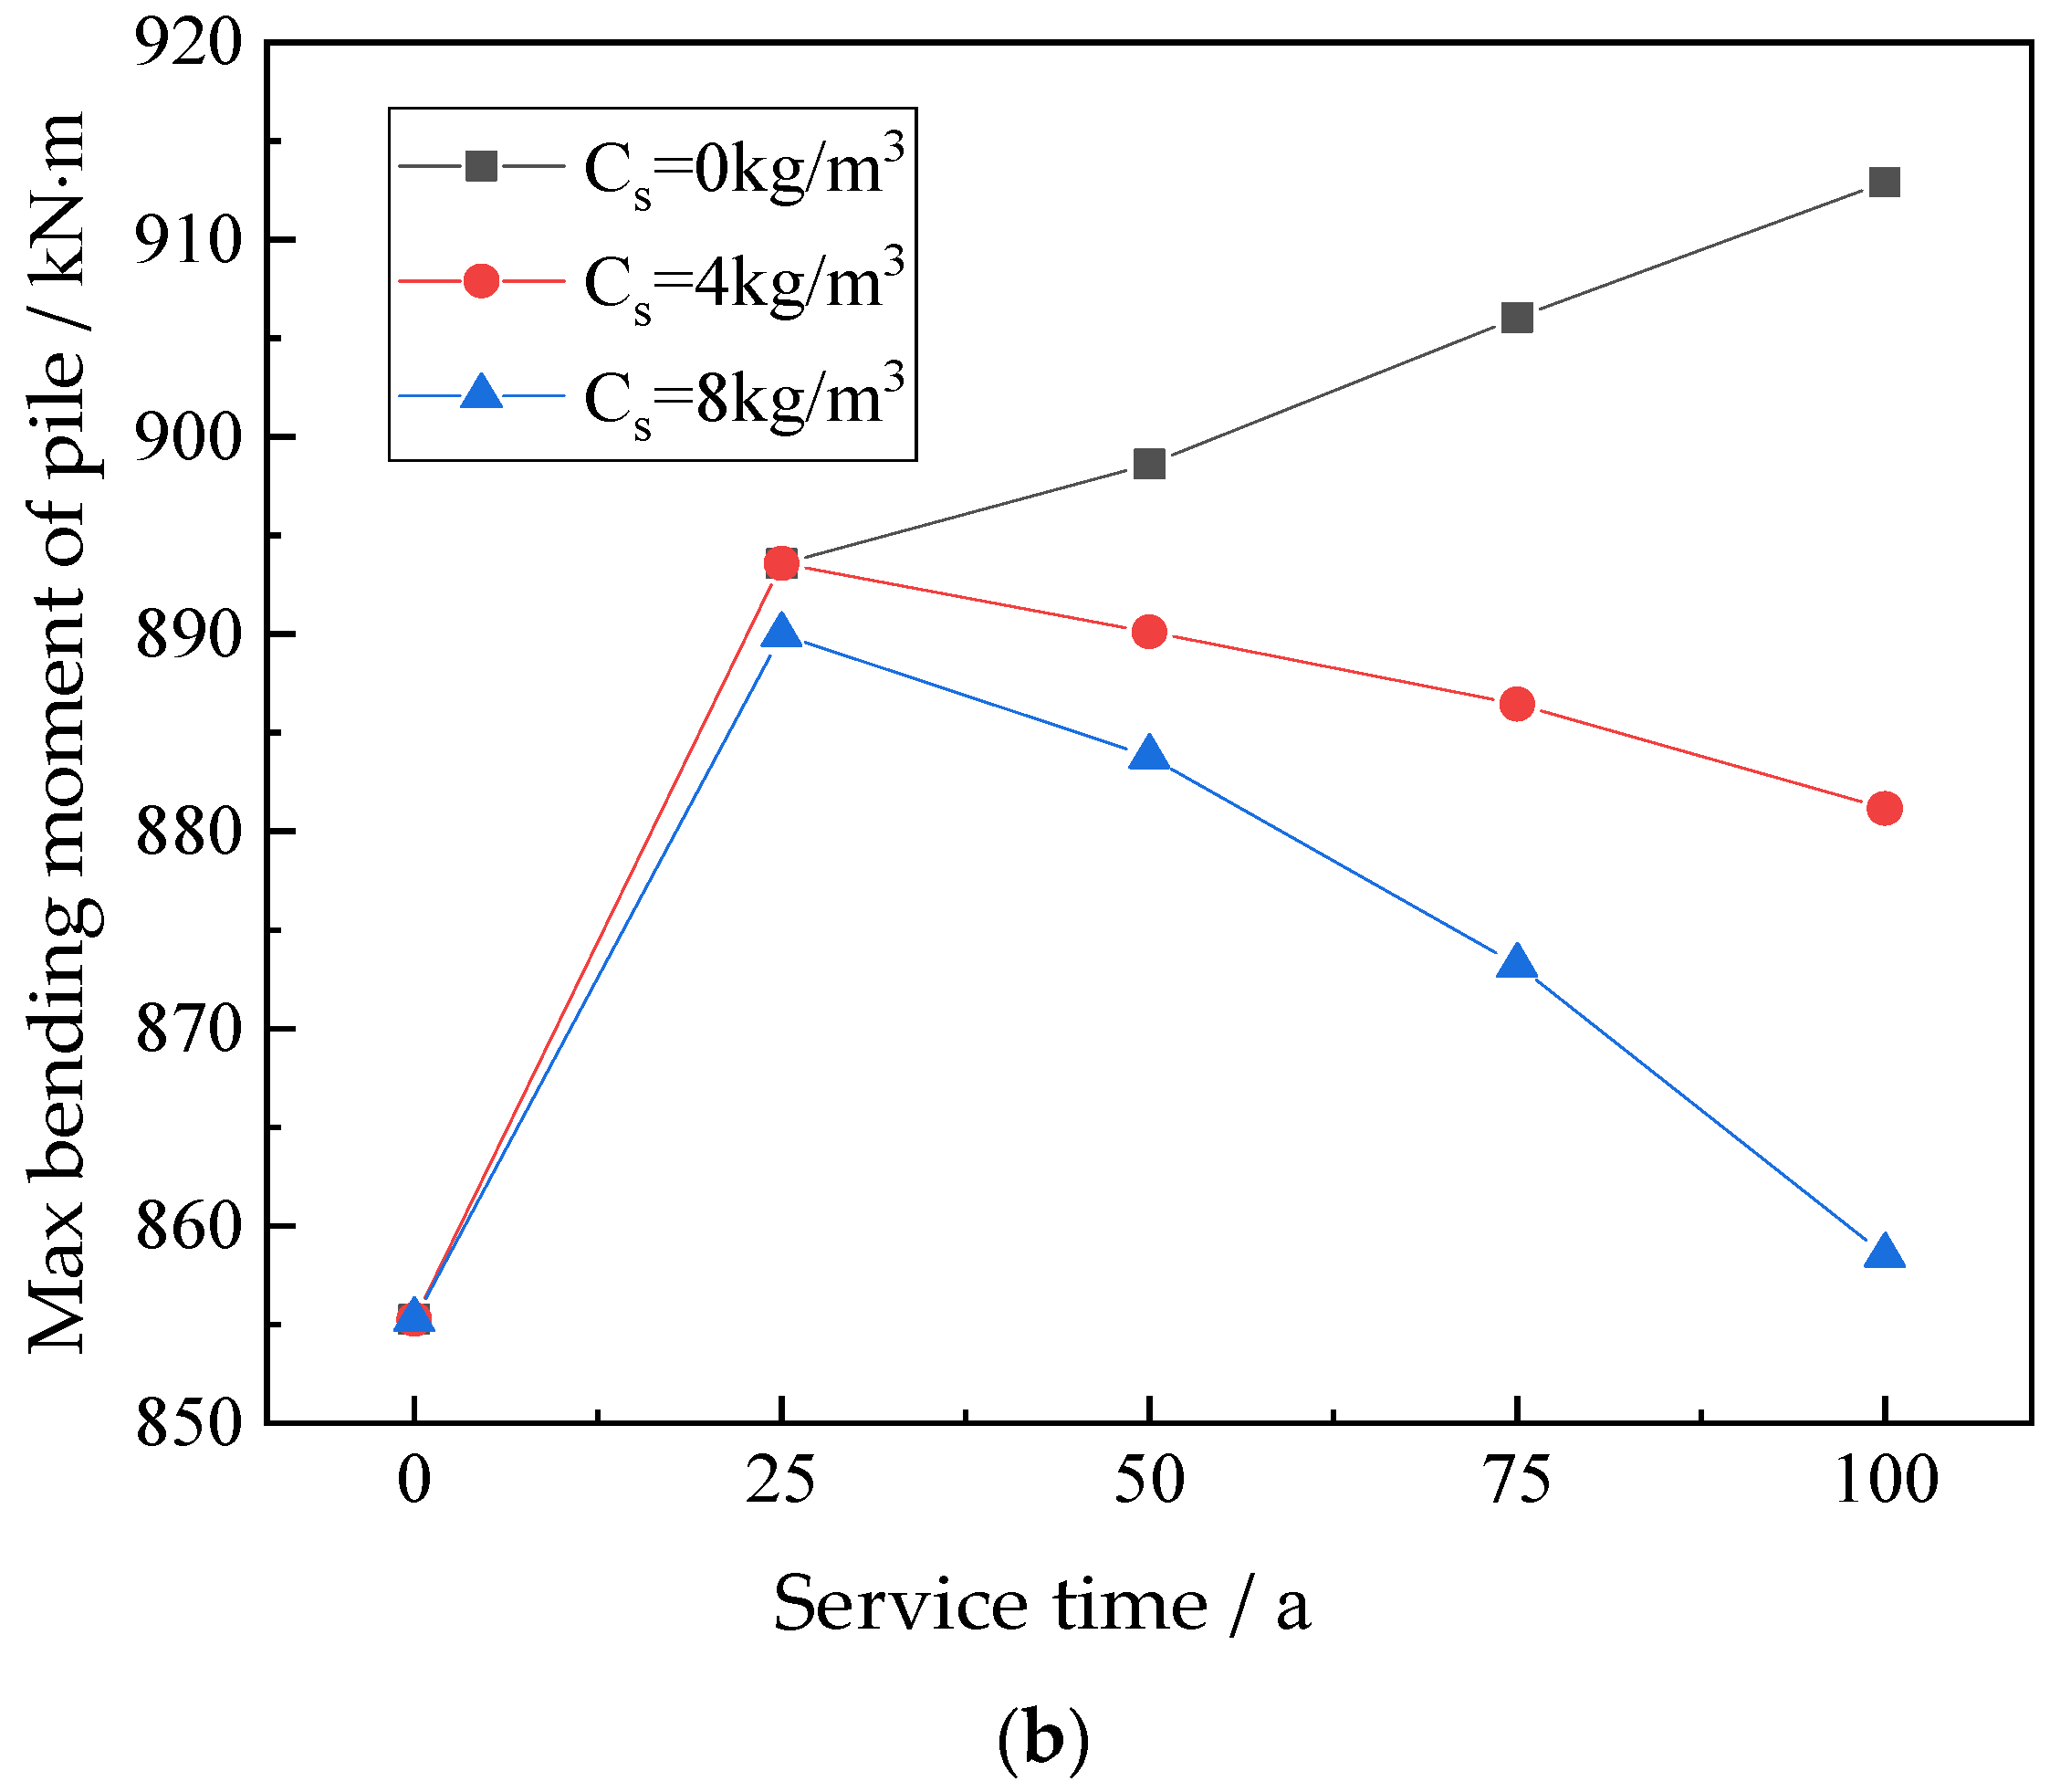
4.1. Analysis of Time-Varying Characteristics of the Horizontal Bearing of the Pile

Generally, the chloride concentration of reinforced concrete piles depends on the environment. The closer to the coast, the greater the chloride concentration. The chloride concentration on the surface of the pile reconstructed in coastal and ocean areas can be taken as 4 kg/m3 and 8 kg/m3, respectively [1,33]. The relationship between the bending stiffness reduction factor (η) and time under different chloride concentrations is shown in Figure 6. The relationship between the horizontal displacement of the pile and the maximum bending moment changing with service time is shown in Figure 7.
As shown in Figure 6, a similar attenuation law of pile bending stiffness is created by different environments. When the critical concentration of chloride on the surface of the steel bar is 0.65 kg/m3 [30], the initial corrosion time of the pile is the 34th year and 22nd year with the conditions of chloride concentration of 4 kg/m3 and 8 kg/m3, respectively.
As shown in Figure 7, the horizontal displacement of a pile increases with service time. Taking the chloride concentration of 8 kg/m3 as an example, the initial horizontal displacement of 4.3 mm increases to 5.4 mm, 6.1 mm, 6.8 mm, and 7.8 mm, at the service times of 25 years, 50 years, 75 years, and 100 years, respectively. The displacement increases by 81.4% in the 100th year. Furthermore, the greater the chloride concentration on the pile surface, the greater the horizontal displacement. When the service time is 50 years, and the chlorine ion concentration of the pile surface is 0 kg/m3, 4 kg/m3, and 8 kg/m3, the corresponding horizontal displacement is 5.5 mm, 5.8 mm, and 6.0 mm, respectively.
In the 25th year, the chloride concentration on the surface of the pile is 4 kg/m3. Since the chloride concentration on the surface of the steel bar in the pile is less than the critical value, the bending stiffness of the pile shows unchanging characteristics. The maximum bending moment and the horizontal displacement are equal to that of the chloride concentration of 0 kg/m3.
When the chloride concentration is 0 kg/m3, the maximum bending moment of the pile increases with the increase in service time. If the maximum bending moment at the initial state is 855 kN·m, at the service time of 25 years, 50 years, 75 years, and 100 years, that changes to 894 kN·m, 899 kN·m, 06 kN·m, and 913 kN·m, respectively. The maximum bending moment increases by only 6.7% after 100 years of service.
When the pile is put into a chloride environment, the maximum bending moment increases with the increase in service time in the early stages. Due to the bending stiffness decaying rapidly and nonlinearly with service time, the growth rate of horizontal displacement is less than the decreased rate of bending stiffness, and the maximum bending moment decreases with time. It can be summarized that the time-varying characteristics of soil have a great influence on the horizontal displacement of the pile, especially for the pile with the characteristics of sensitive deformation; if the time-varying characteristics are ignored, potential safety hazards can be induced easily.

4.2. Time-Varying Reliability Analysis of a Pile under Horizontal Displacement Failure Mode

With the tiny change in the maximum bending moment of the pile that will be induced during service, and the value is much smaller than the ultimate bending capacity, when the failure of material is used as the objective for the reliability index, the pile can be considered reliable during service. Consequently, the horizontal displacement of the pile is used as a failure mode when the time-varying reliability is analyzed. Compared with the Monte Carlo method, the quadratic response surface method is used to calculate the time-varying reliability index of a pile in the ocean when considering horizontal displacement failure mode. The results are shown in Table 2.
It can be seen from Table 2 that the results calculated by the quadratic response surface method and the Monte Carlo method show the same changing trend, and the value is almost consistent. The reasonable result of the self-compiled quadratic response surface method is verified. The reliability index of the horizontal displacement failure mode significantly decreases nonlinearly with time. Up to the 100th year, the reliability index is lower than that of the target value of 4.7, indicating that it is necessary to consider the time-varying characteristics in the reliability analysis of the horizontal displacement of the pile.

4.2.1. Impact of Time-Varying Characteristics on Safety Margin

In order to explore the influence of pile–soil time-varying characteristics on the safety margin frequency distribution, a total of 4 × 10⁴ groups of random variables obeying the normal distribution were extracted and substituted into the limit state function expression. The frequency distribution curve for horizontal displacement failure mode is shown in Figure 8.
It can be seen from Figure 8 that the safety margin frequency distribution of horizontal displacement is significantly affected by the time-varying characteristics of the soil. Compared to the PDF curves with a service time of 0 years and 100 years, the coverage range of the safety margin changes from 2–6 mm to −3–1 mm, and the relative frequency corresponding to the extreme value gradually increases. It can also be summarized from the CDF curve that the longer the service life, the lower the safety margin at the same cumulative frequency, which also indicates the declining law of the reliability index of the pile.
As discussed above, the law of safety margin frequency distribution is basically consistent with that of the reliability index, which proves the necessity and rationality of considering the time-varying characteristics of the pile and soil during the solving process for the horizontal displacement of the pile.

4.2.2. Influence of Parameter Variability on the Reliability of the Pile

To analyze the influence of the uncertainty of soil parameters (internal friction angle and cohesion) and steel corrosion damage parameters (concrete cover and chloride concentration) on the reliability of the pile, the relationship between the variation coefficient of the parameters and the reliability index is shown in Figure 9. The reliability index decreases with an increase in the coefficient of variation of a random variable.
The influence of random variables on the reliability index of the pile can be ranked as follows: internal friction angle > cohesion > concrete cover > chloride concentration. Taking a service time of 50 years as an example, the variation coefficients of internal friction angle and chloride concentration increase from 0.1 to 1.0, and the change in the rate of reliability index is 6.8 and 2.3, respectively.
In the 25th year of service, as there is only a slight influence of steel corrosion damage on bending stiffness, only a tiny change in the corresponding reliability index will be induced by the damage from steel corrosion. With the increase in service life, the reliability index of the pile under horizontal displacement failure mode continues to decrease. However, the change rate declines. When the variation coefficient of the internal friction angle is greater than 0.6, the corresponding reliability index remains almost unchanged, indicating that the corresponding variability parameter has a tiny influence on the reliability of the pile.
In short, with the increase in service time, the rate of decrease in the reliability index reduces with the decrease in the coefficient of variation. The uncertainty of parameters has a significant influence on the time-varying reliability of the horizontal displacement of the pile. The value, calculation, and source of parameters need to be verified in the calculation of the horizontal displacement of the pile.

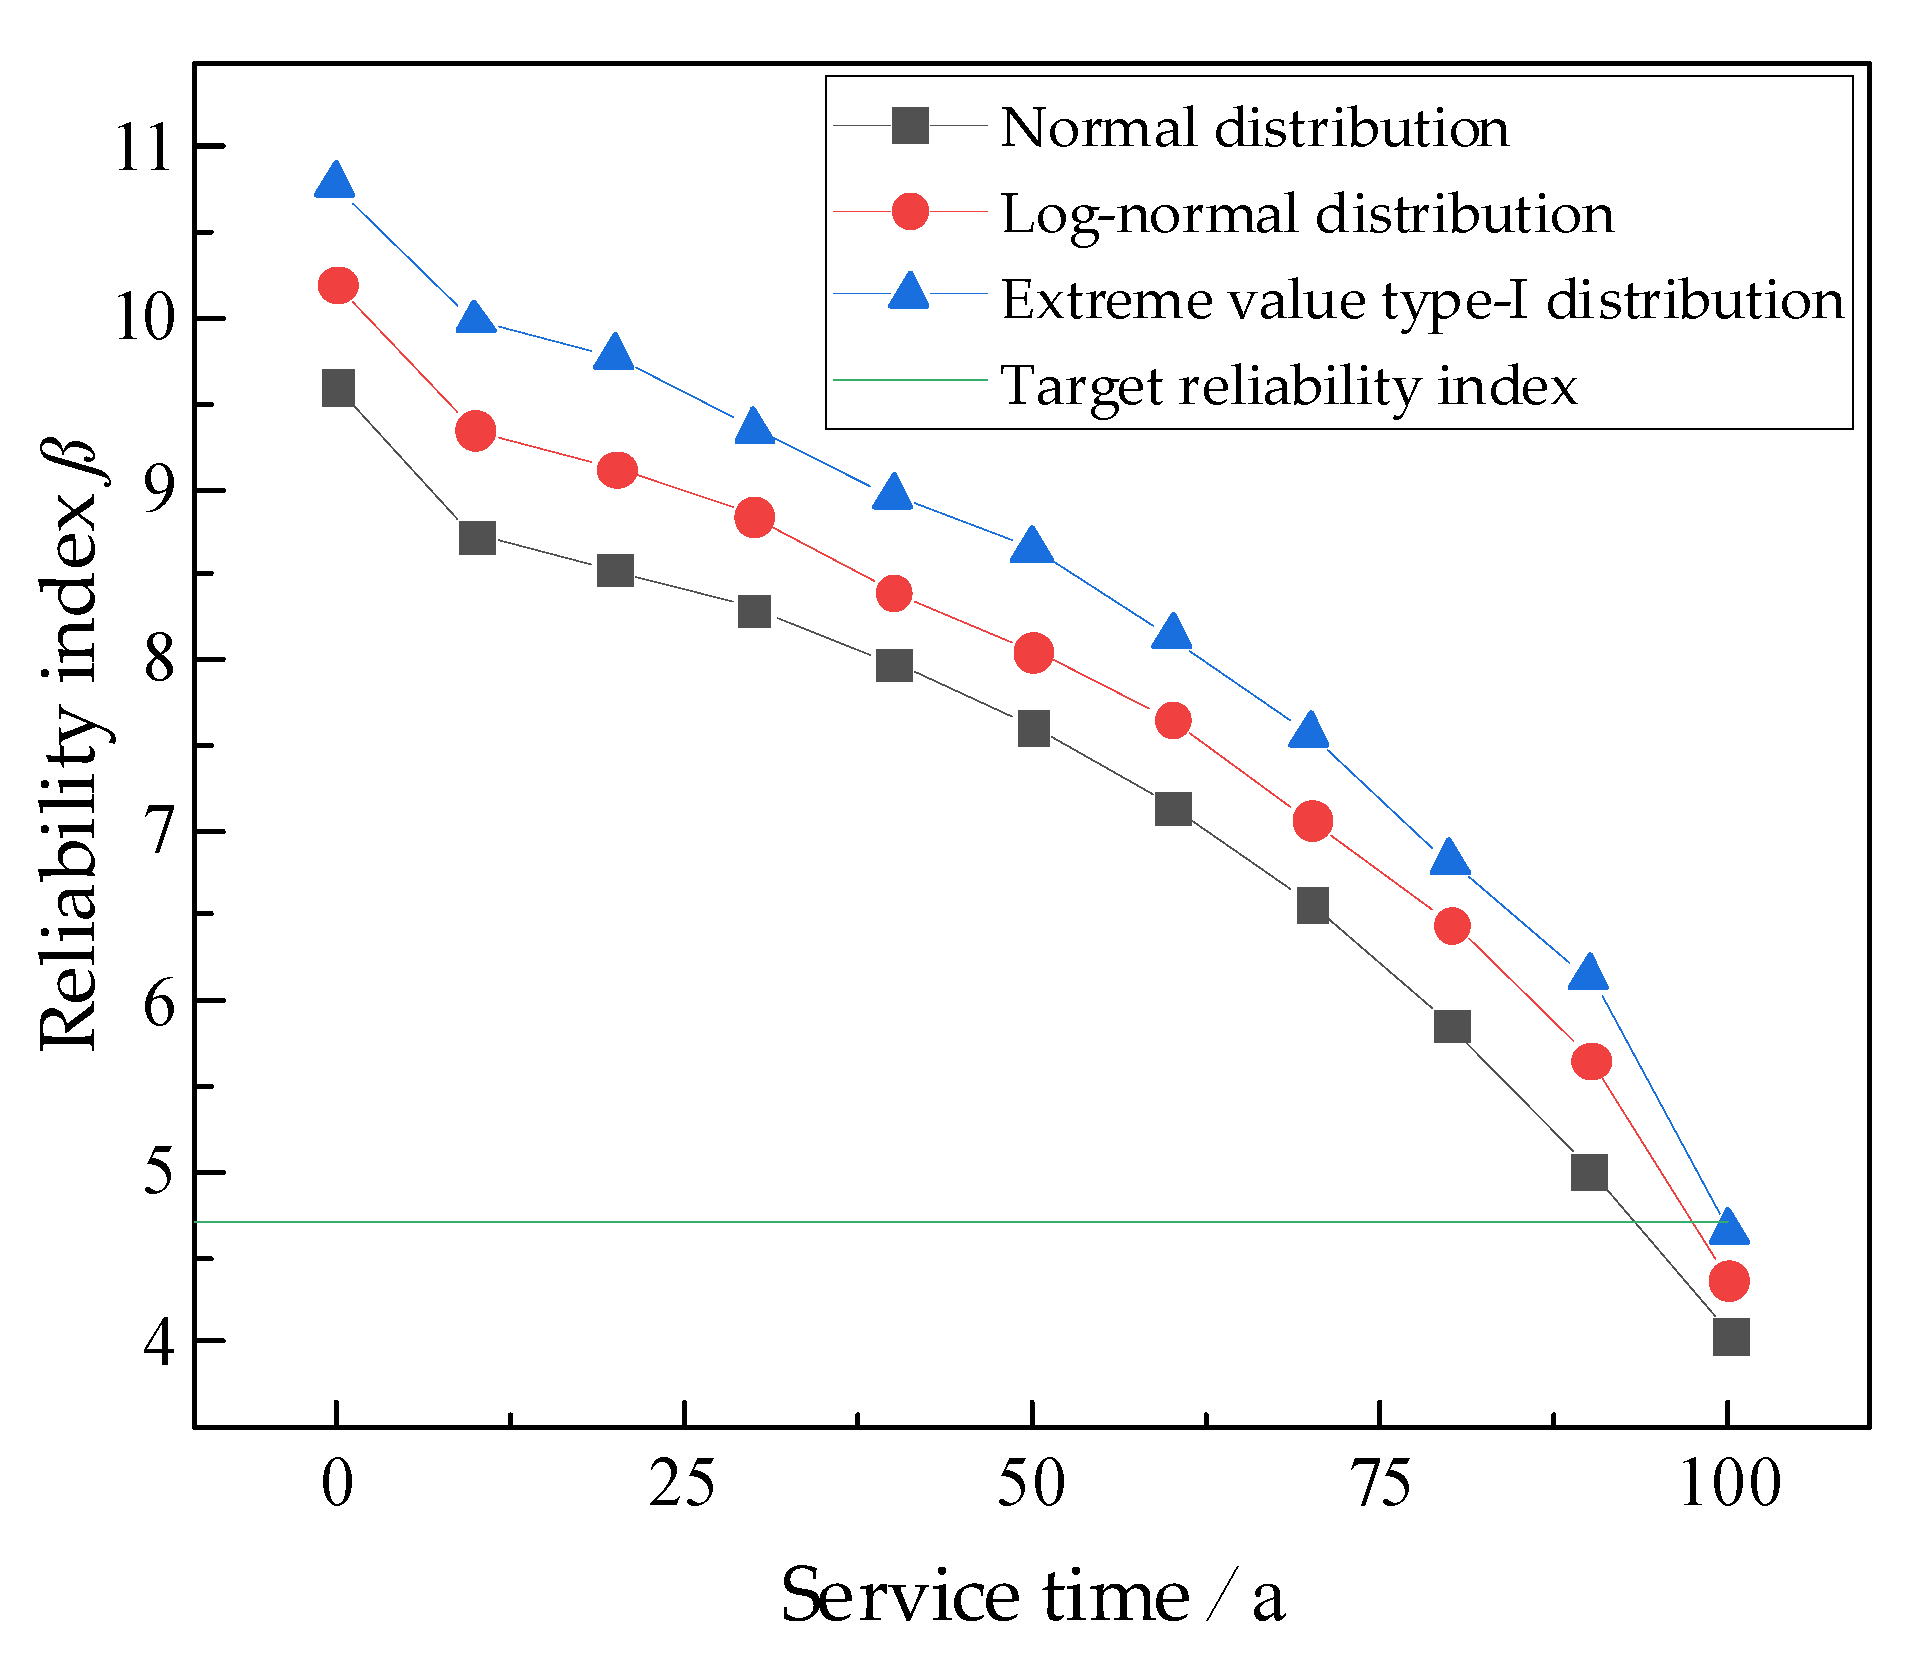
4.2.3. Influence of Parameter Distribution Mode on the Reliability of the Pile

Ordinarily, the reliability of the pile is always impacted by the distribution pattern of the parameters. Vu et al. [34] and Dianty et al. [35] found that the concrete cover and the chloride concentration obey normal distribution. Langejan et al. [36] revealed that the shear strength index (cohesion and internal friction angle) obeys the normal distribution or the log-normal distribution. However, if those obey the extreme value type I distribution, a 20% to 30% error will be caused using the normal random variable [37].
Therefore, the influence of the normal distribution, the log-normal distribution, and the extreme value type I distribution of the shear strength index on the horizontal reliability of the pile were compared assuming the same mean and standard deviation. The results are shown in Figure 10. The reliability indexes corresponding to different distribution types of parameters decrease nonlinearly with increasing time.
When the shear strength index obeys the normal distribution, the log-normal distribution, and the extreme value type I distribution, the reliability index decreases to 5.56, 5.83, and 6.14, respectively, after 100 years of service. This indicates that the reliability index is impacted obviously by the distribution pattern of the random variables. When the shear strength index obeys the extreme value type I distribution, the calculated reliability index is greater than that of log-normal distribution and normal distribution during the service life.
Taking 100 years of service as an example, when the shear strength index obeys the extreme value type I distribution, the reliability index is 4.64, while that of the normal distribution and log-normal distribution are 4.04 and 4.37, respectively.
If the service life of the pile is predicted by the target reliability index when the shear strength index obeys the extreme value type I distribution, log-normal distribution, and normal distribution, the service life is 96 years, 95 years, and 93 years, respectively. Those results indicate that the reliability of the pile is not only related to the service time but also directly related to the distribution of the parameters. Therefore, the distribution of the parameters should be considered when the pile is constructed.

5. Conclusions

(1)
The time-varying characteristics of soft soil and bending stiffness have a significant influence on the horizontal bearing capacity of the pile. In the early stages, it is mainly affected by the creep of soft soil, and in the later stages, the attenuation of the bending stiffness of the pile becomes the main influencing factor. With the increase in service time, the change value of the maximum bending moment of the pile decreases, the maximum horizontal displacement increases nonlinearly, the concentrated area of safety margin of horizontal displacement decreases gradually, and the reliability index of the horizontal displacement failure mode decreases gradually.
(2)
The larger the coefficient of variation of random variables, the lower the reliability index under horizontal displacement failure mode. Among the random variables, the internal friction angle has the greatest influence on the reliability index. When the coefficient of variation of the internal friction angle is greater than 0.6, the reliability index gradually tends to be stable. When the service time only reaches the 25th year, the influence of the parameters of steel corrosion damage has a slight effect on the reliability of the pile.
(3)
The reliability index is impacted significantly by the distribution types of random variables under the failure mode of horizontal displacement. When the soil parameters obey the extreme value type I distribution, the corresponding reliability index is greater than that of the log-normal distribution and the normal distribution. If the target reliability index is used to predict the working life of the pile, the result obtained from the extreme value type I distribution is greater than that of the log-normal distribution and the normal distribution.
(4)
Finally, the reliability calculation model for the laterally loaded pile is established. However, the above research results are based on my hypothesis and can provide some reference for similar construction.

Author Contributions

Conceptualization, P.Y., K.W. and L.C.; methodology, P.Y. and K.W.; software, J.W. and Y.Z.; validation, K.Y.; data curation, Y.Z., J.W. and K.Y.; writing—original draft preparation, P.Y., K.W. and L.C.; writing—review and editing, P.Y., K.W. and L.C. All authors have read and agreed to the published version of the manuscript.

Funding

This research was funded by the National Natural Science Foundation of China (52178311, 52078055, and 52004036), the Innovative Program of Key Disciplines with Advantages and Characteristics of Civil Engineering of Changsha University of Science & Technology (18ZDXK12), the Scientific Research Fund of the Education Department of Hunan Province (20A001), and the Open Fund of Key Laboratory of Special Environment Road Engineering of Hunan Province (Changsha University of Science & Technology) (kfj180502).

Institutional Review Board Statement

Not applicable.

Informed Consent Statement

Not applicable.

Data Availability Statement

Data are contained within the article.

Acknowledgments

The authors would like to thank the students in the studio for their support in completing this paper.

Conflicts of Interest

The authors declare no conflict of interest.

References

  1. Shao, W.; Shi, D.; Jiang, J.; Chen, Y. Time-dependent lateral bearing behavior of corrosion-damaged RC pipe piles in marine environments. Constr. Build. Mater. 2017, 157, 676–684. [Google Scholar] [CrossRef]
  2. Zhuang, N.; Zhou, Y.; Ma, Y.; Liao, Y.; Chen, D. Corrosion activity on CFRP-strengthened RC piles of high-pile wharf in a simulated marine environment. Adv. Mater. Sci. Eng. 2017, 2017, 7185452. [Google Scholar] [CrossRef] [Green Version]
  3. Wang, Y.Z.; Ge, H.B.; Wu, L.J. Time-variant reliability analysis of bank slope of open type wharf on piles considering the effect of soft soil creep on strength. Mar. Sci. 2018, 42, 88–97. [Google Scholar]
  4. Matlock, H. Correlations for design of laterally loaded piles in soft clay. In Proceedings of the 11th Offshore Technology Conference, Houston, TX, USA, 21 April 1970; pp. 577–594. [Google Scholar]
  5. Sullivan, W.R.; Reese, L.C.; Fenske, C.W. Unified method for analysis of laterally loaded piles in clay. In Numerical Methods in Offshore Piling; Thomas Telford Publishing: London, UK, 1980; pp. 135–146. [Google Scholar]
  6. Fu, D.; Zhang, Y.; Aamodt, K.K.; Yan, Y. A multi-spring model for monopile analysis in soft clays. Mar. Struct. 2020, 72, 102768. [Google Scholar] [CrossRef]
  7. Yang, K.; Liang, R. Numerical solution for laterally loaded piles in a two-layer soil profile. J. Geotech. Geoenviron. 2006, 132, 1436–1443. [Google Scholar] [CrossRef]
  8. Conte, E.; Troncone, A.; Vena, M. Nonlinear three-dimensional analysis of reinforced concrete piles subjected to horizontal loading. Comput. Geotech. 2013, 49, 123–133. [Google Scholar] [CrossRef]
  9. He, Z.J.; Lei, H.C.; Xia, Z.Q.; Zhao, L.H. Analysis of settlement and internal force displacement of single pile in multilayer soft soil foundation. Rock Soil Mech. 2020, 41, 655–666. [Google Scholar]
  10. Basack, S.; Karami, M.; Karakouzian, M. Pile-soil interaction under cyclic lateral load in loose sand: Experimental and numerical evaluations. Soil Dyn. Earthq. Eng. 2022, 162, 107439. [Google Scholar] [CrossRef]
  11. Cheng, X.; El Naggar, M.H.; Lu, D.; Wang, P.; Tu, W. A cyclic p-y elastoplastic model applied to lateral loaded pile in soft clays. Can. Geotech. J. 2022. [Google Scholar] [CrossRef]
  12. Basack, S.; Nimbalkar, S. Measured and predicted response of pile groups in soft clay subjected to cyclic lateral loading. Int. J. Geomech. 2018, 18, 04018073. [Google Scholar] [CrossRef]
  13. Muszyński, Z.; Rybak, J. Horizontal displacement control in course of lateral loading of a pile in a slope. IOP Conf. Ser. Mater. Sci. Eng. 2017, 245, 032002. [Google Scholar] [CrossRef]
  14. Chen, C.F.; Qin, H.J. Stability analysis of slope considering the time and depth effect of strength parameters. J. Huanan Univ. 2009, 36, 1–6. [Google Scholar]
  15. Zhu, X.; Zi, G.; Cao, Z.; Cheng, X. Combined effect of carbonation and chloride ingress in concrete. Constr. Build. Mater. 2016, 110, 369–380. [Google Scholar] [CrossRef]
  16. Florea, M.V.A.; Brouwers, H.J.H. Modelling of chloride binding related to hydration products in slag-blended cements. Constr. Build. Mater. 2014, 64, 421–430. [Google Scholar] [CrossRef] [Green Version]
  17. Loser, R.; Lothenbach, B.; Leemann, A.; Tuchschmid, M. Chloride resistance of concrete and its binding capacity—Comparison between experimental results and thermodynamic modeling. Cem. Concr. Compos. 2010, 32, 34–42. [Google Scholar] [CrossRef]
  18. Feng, D.C.; Xie, S.C.; Li, Y.; Jin, L. Time-dependent reliability-based redundancy assessment of deteriorated RC structures against progressive collapse considering corrosion effect. Struct. Saf. 2021, 89, 102061. [Google Scholar] [CrossRef]
  19. Kozubal, J.; Steshenko, D.; Wyjadlowski, M. Lateral loaded pile durability in case of chloride corrosion. Int. Multidiscip. Sci. GeoConf. SGEM 2016, 3, 155–162. [Google Scholar]
  20. Kozubal, J.; Wyjadłowski, M.; Steshenko, D. Probabilistic analysis of a concrete column in an aggressive soil environment. PLoS ONE 2019, 14, e0212902. [Google Scholar] [CrossRef] [Green Version]
  21. Dang, H.V.; Trestian, R.; Bui-Tien, T.; Nguyen, H.X. Probabilistic method for time-varying reliability analysis of structure via variational Bayesian neural network. In Structures; Elsevier: Amsterdam, The Netherlands, 2021; Volume 34, pp. 3703–3715. [Google Scholar]
  22. Xu, Q.; Shi, D.; Shao, W. Service life prediction of RC square piles based on time-varying probability analysis. Constr. Build. Mater. 2019, 227, 116824. [Google Scholar] [CrossRef]
  23. Wang, J.; Ji, H.G.; Wang, J.J.; Zhang, Z.J. Residual Life Predication of Reinforced Concrete Elements Based on Time-Varying Reliability. In Advanced Materials Research; Trans Tech Publications Ltd.: Stafa-Zurich, Switzerland, 2011; Volume 163, pp. 3258–3262. [Google Scholar]
  24. Wu, Y.; Miao, F.; Li, L.; Xie, Y.; Chang, B. Time-varying reliability analysis of Huangtupo Riverside No. 2 Landslide in the Three Gorges Reservoir based on water-soil coupling. Eng. Geol. 2017, 226, 267–276. [Google Scholar] [CrossRef]
  25. Deepthi, D.; Sivakumar, B.G.L.; Lekshmi, S. Time-Dependent Reliability Analysis of Pavement Structures under Fatigue Loading. In Geotechnical Safety and Risk V; IOS Press: Amsterdam, The Netherlands, 2015; pp. 358–363. [Google Scholar]
  26. Liu, T.H.; Lin, T. Soft Rock Engineering Design Theory and Construction Practice; China Construction Industry Press: Beijing, China, 2001; pp. 135–141. [Google Scholar]
  27. Zhang, S.Y. Study on P-Y Curves of Laterally Loaded Pile under Static Loading. Master’s Thesis, Hehai University, Nanjing, China, 2001. [Google Scholar]
  28. Liu, Y.; Weyers, R.W. Modeling the Dynamic Corrosion Process in Chloride Contaminated Concrete Structures. Cem. Concr. Res. 1998, 28, 365–379. [Google Scholar] [CrossRef]
  29. Liu, Y. Modeling the Time-To-Corrosion Cracking of the Cover Concrete in Chloride Contaminated Reinforced Concrete Structures. Ph.D. Thesis, Virginia Polytechnic Insitute and State University, Blacksburg, VA, USA, 1996. [Google Scholar]
  30. Ma, Y.L.; Zhang, A.L. Durablity life prediction of concrete structure based on the regulated reliability index under chloride environment. China Civ. Eng. J. 2006, 39, 36–41. [Google Scholar]
  31. Yin, P.B.; Nie, D.L.; Yang, Z.H.; He, W.; Jia, W.W. The p-y curve and computation method of the horizontal bearing capacity of piles in sloping ground. Chin. J. Rock Mech. Eng. 2018, 37, 996–1003. [Google Scholar]
  32. Zhang, M. Analysis of Structural Reliability; Science Press: Beijing, China, 2009; pp. 116–118. [Google Scholar]
  33. Song, H.W.; Lee, C.H.; Ann, K.Y. Factors influencing chloride transport in concrete structures exposed to marine environments. Cement Concrete Comp. 2008, 30, 113–121. [Google Scholar] [CrossRef]
  34. Vu, K.A.; Stewart, M.G. Predicting the likelihood and extent of reinforced concrete corrosion-induced cracking. J. Struct. Eng. 2005, 131, 1681–1689. [Google Scholar] [CrossRef]
  35. Dianty, M.A.; Yahaya, A.S.; Ahmad, F. Probability distribution of engineering properties of soil at telecommunication sites in Indonesia. Int. J. Sci. Res. Knowl. 2014, 2, 143–150. [Google Scholar]
  36. Langejan, A. Some aspects of the safety factor in soil mechanics, considered as a problem of probability. In Proceedings of the Sixth International Conference on Soil Mechanics and Foundation Engineering, Montreal, QC, Canada, 8–15 September 1965; pp. 500–502. [Google Scholar]
  37. Yan, C.F.; Liu, D.Y.; Zhang, J.H.; Zhu, K.S. The susceptibility analysis of reliability for the probability distribution types of parameters in strength criterion. Chin. J. Rock Mech. Eng. 1999, 18, 36–39. [Google Scholar]
Figure 1. Relationship between the attenuation factor of soil shear strength and time.
Jmse 11 00247 g001
Figure 2. The p-y curve in consideration of time-varying characteristics.
Jmse 11 00247 g002
Figure 3. Diagram of a cross-section of reinforced concrete pile and reinforcement corrosion mechanism.
Jmse 11 00247 g003
Figure 4. Deformation and difference diagram of the pile under horizontal load.
Jmse 11 00247 g004
Figure 5. Site pile simplification and reinforcement.
Jmse 11 00247 g005
Figure 6. The relationship between reduction factor and service time.
Jmse 11 00247 g006
Figure 7. Stress and deformation diagrams for the pile under different chloride concentrations. (a) Relationship curve between the maximum horizontal displacement of the pile and service time. (b) Relationship curve between the maximum bending moment of the pile shaft and service time.
Jmse 11 00247 g007aJmse 11 00247 g007b
Figure 8. The influence of time-varying characteristics on the safety margin frequency distribution of horizontal displacement. (a) PDF curve. (b) CDF curve.
Jmse 11 00247 g008aJmse 11 00247 g008b
Figure 9. Influence of the variation coefficient of a parameter on the reliability index. (a) Relationship curve between cohesion and time-varying reliability. (b) Relationship curve between internal friction angle and time-varying reliability. (c) Relationship curve between the concrete cover and time-varying reliability. (d) Relationship curve between chloride concentration and time-varying reliability.
Jmse 11 00247 g009aJmse 11 00247 g009b
Figure 10. Influence of the parameter distribution mode on time-varying reliability.
Jmse 11 00247 g010
Table 1. Physical and mechanical properties of foundation soil.
LayerDepth/mCohesive/kPaInternal Friction Angle/°Soil Weight/kN/m3Coefficient of Compressibility/MPa
Silty soft soil0–14.5205.08.90.51
Plastic muddy loam mixed with silt14.5–21.8344.07.10.86
Medium sand mixed with clay21.8–26.9513.59.00.10
Containing clay gravel>26.9\4018.00.18
Table 2. Calculation results for the reliability index of the pile.
Service Time t/aQuadratic Response Surface MethodMonte Carlo MethodError 1/%
09.609.125.26
258.418.113.70
507.607.91−3.92
756.235.915.41
1004.044.32−6.48
Disclaimer/Publisher’s Note: The statements, opinions and data contained in all publications are solely those of the individual author(s) and contributor(s) and not of MDPI and/or the editor(s). MDPI and/or the editor(s) disclaim responsibility for any injury to people or property resulting from any ideas, methods, instructions or products referred to in the content.

