Article

An Approach for the Validation of a Coastal Erosion Vulnerability Index: An Application in Sicily

1
Department of Engineering (DI), University of Palermo, Viale delle Scienze, Building 8, 90128 Palermo, Italy
2
Department of Earth and Sea Sciences (DiSTeM), University of Palermo, Via Archirafi, 22, 90123 Palermo, Italy
3
Italian Institute for Environmental Protection and Research (ISPRA), Via Vitaliano Brancati 48, 00144 Rome, Italy
*
Author to whom correspondence should be addressed.
J. Mar. Sci. Eng. 2023, 11(1), 23; https://doi.org/10.3390/jmse11010023
Submission received: 7 November 2022 / Revised: 14 December 2022 / Accepted: 21 December 2022 / Published: 24 December 2022
(This article belongs to the Special Issue Natural and Human Impacts in Coastal Areas)

Abstract

:
In recent decades, coastal erosion phenomena have increased due to climate change. The increased frequency and intensity of extreme events and the poor sediment supply by anthropized river basins (dams, river weirs, culverts, etc.) have a crucial role in coastal erosion. Therefore, an integrated analysis of coastal erosion is crucial to produce detailed and accurate coastal erosion vulnerability information to support mitigation strategies. This research aimed to assess the erosion vulnerability of the Sicilian coast, also including a validation procedure of the obtained scenario. The coastal vulnerability was computed by means of the CeVI (Coastal Erosion Vulnerability Index) approach, which considers physical indicators such as geomorphology and geology, coastal slope, sea storms, wave maxima energy flux and sediment supply to river mouths. Each indicator was quantified using indexes which were assessed considering transects orthogonal to the coastline in 2020. These transects were clustered inside natural compartments called littoral cells. Each cell was assumed to contain a complete cycle of sedimentation and not to have sediment exchange with the near cells. Physical parameters were identified to define a new erosion vulnerability index for the Sicilian coast. By using physical indexes (geological/geomorphological, erosion/sediment supply, sea storms, etc.), the CeVI was calculated both for each littoral cell and for the transects that fall into retreating/advancing coastal areas. The vulnerability index was then validated by comparing CeVI values and the coastline change over time. The validation study showed a direct link between the coastline retreat and high values of CeVI. The proposed method allowed for a detailed mapping of the Sicilian coastal vulnerability, and it will be useful for coastal erosion risk management purposes.

1. Introduction

The last IPCC report, AR6 [1], highlighted that climate change is already influencing weather and climate variables. From 1950 to the present day, the planet has experienced both an increase in maximum temperatures and an increase in the frequency and intensity of extreme events. Indeed, one of the Earth’s environments that has already suffered from climate change is the coastal environment [2,3]. Coasts are highly dynamic and ever-changing systems, especially in correspondence with beaches, where changes are easily visible through the advancing/retreat of the shoreline [4].
Coastal area dynamics depend on several physical phenomena such as wave motion, tidal fluctuation, and currents. To these natural effects, direct and indirect anthropic effects should be added, which modify the fragile balance of the coastal environment [4].
Additionally, continental processes play a predominant role in coastal dynamics, reducing or increasing river mouth sediment transport and, therefore, sediment distribution along the coastline. For example, the effects of river weirs include a shortage of sediment supply along the coast, shoreline beach retreat and the consequent loss of beaches [5,6,7,8].
In many cases, anthropization processes modify the natural and environmental characteristics of coastal areas, making these environments complex and dynamic systems [9]. Indeed, in these environments, many socio-economic activities take place, often at odds with each other.
European coastal areas are characterized by a high anthropization degree [10,11]; in fact, almost half of the population of the European Union lives within 50 km of the coastline, and coastal resources produce much of the economic wealth of the European Union. In other words, the effects on the coast due to urbanization, productive settlements and land or sea infrastructure increase coastal vulnerability to flooding and erosion [12,13].
Coastal vulnerability is a spatial concept that identifies people and places susceptible to perturbations resulting from coastal threats, such as coastal storms and erosion phenomena [14]. Vulnerability values are frequently associated with coastal risk—in fact, they are part of the conventional procedures in consolidated practice in many management plans [15]. Risk computation is performed through the well-known formula R = P · V · E [16,17,18], where R is the risk, which expresses the expected loss of human life, injuries, and property, due to a particular event; P is the hazard or the probability that in a given area, a potentially harmful event occurs with a certain intensity within a given time; V represents the vulnerability or the aptitude of a particular element to withstand the effects according to the intensity of the event; and finally, E is the exposure value, referring to the element that must endure the event [19,20].
Vulnerability assessments can be performed through different methodologies, and these are often chosen according to the purpose of the application. In fact, a coast can be vulnerable to various physical phenomena, such as erosion, flooding caused by rising average sea levels, tsunamis, storm surges, etc. [21].

The Evolution of Coastal Vulnerability Indexes
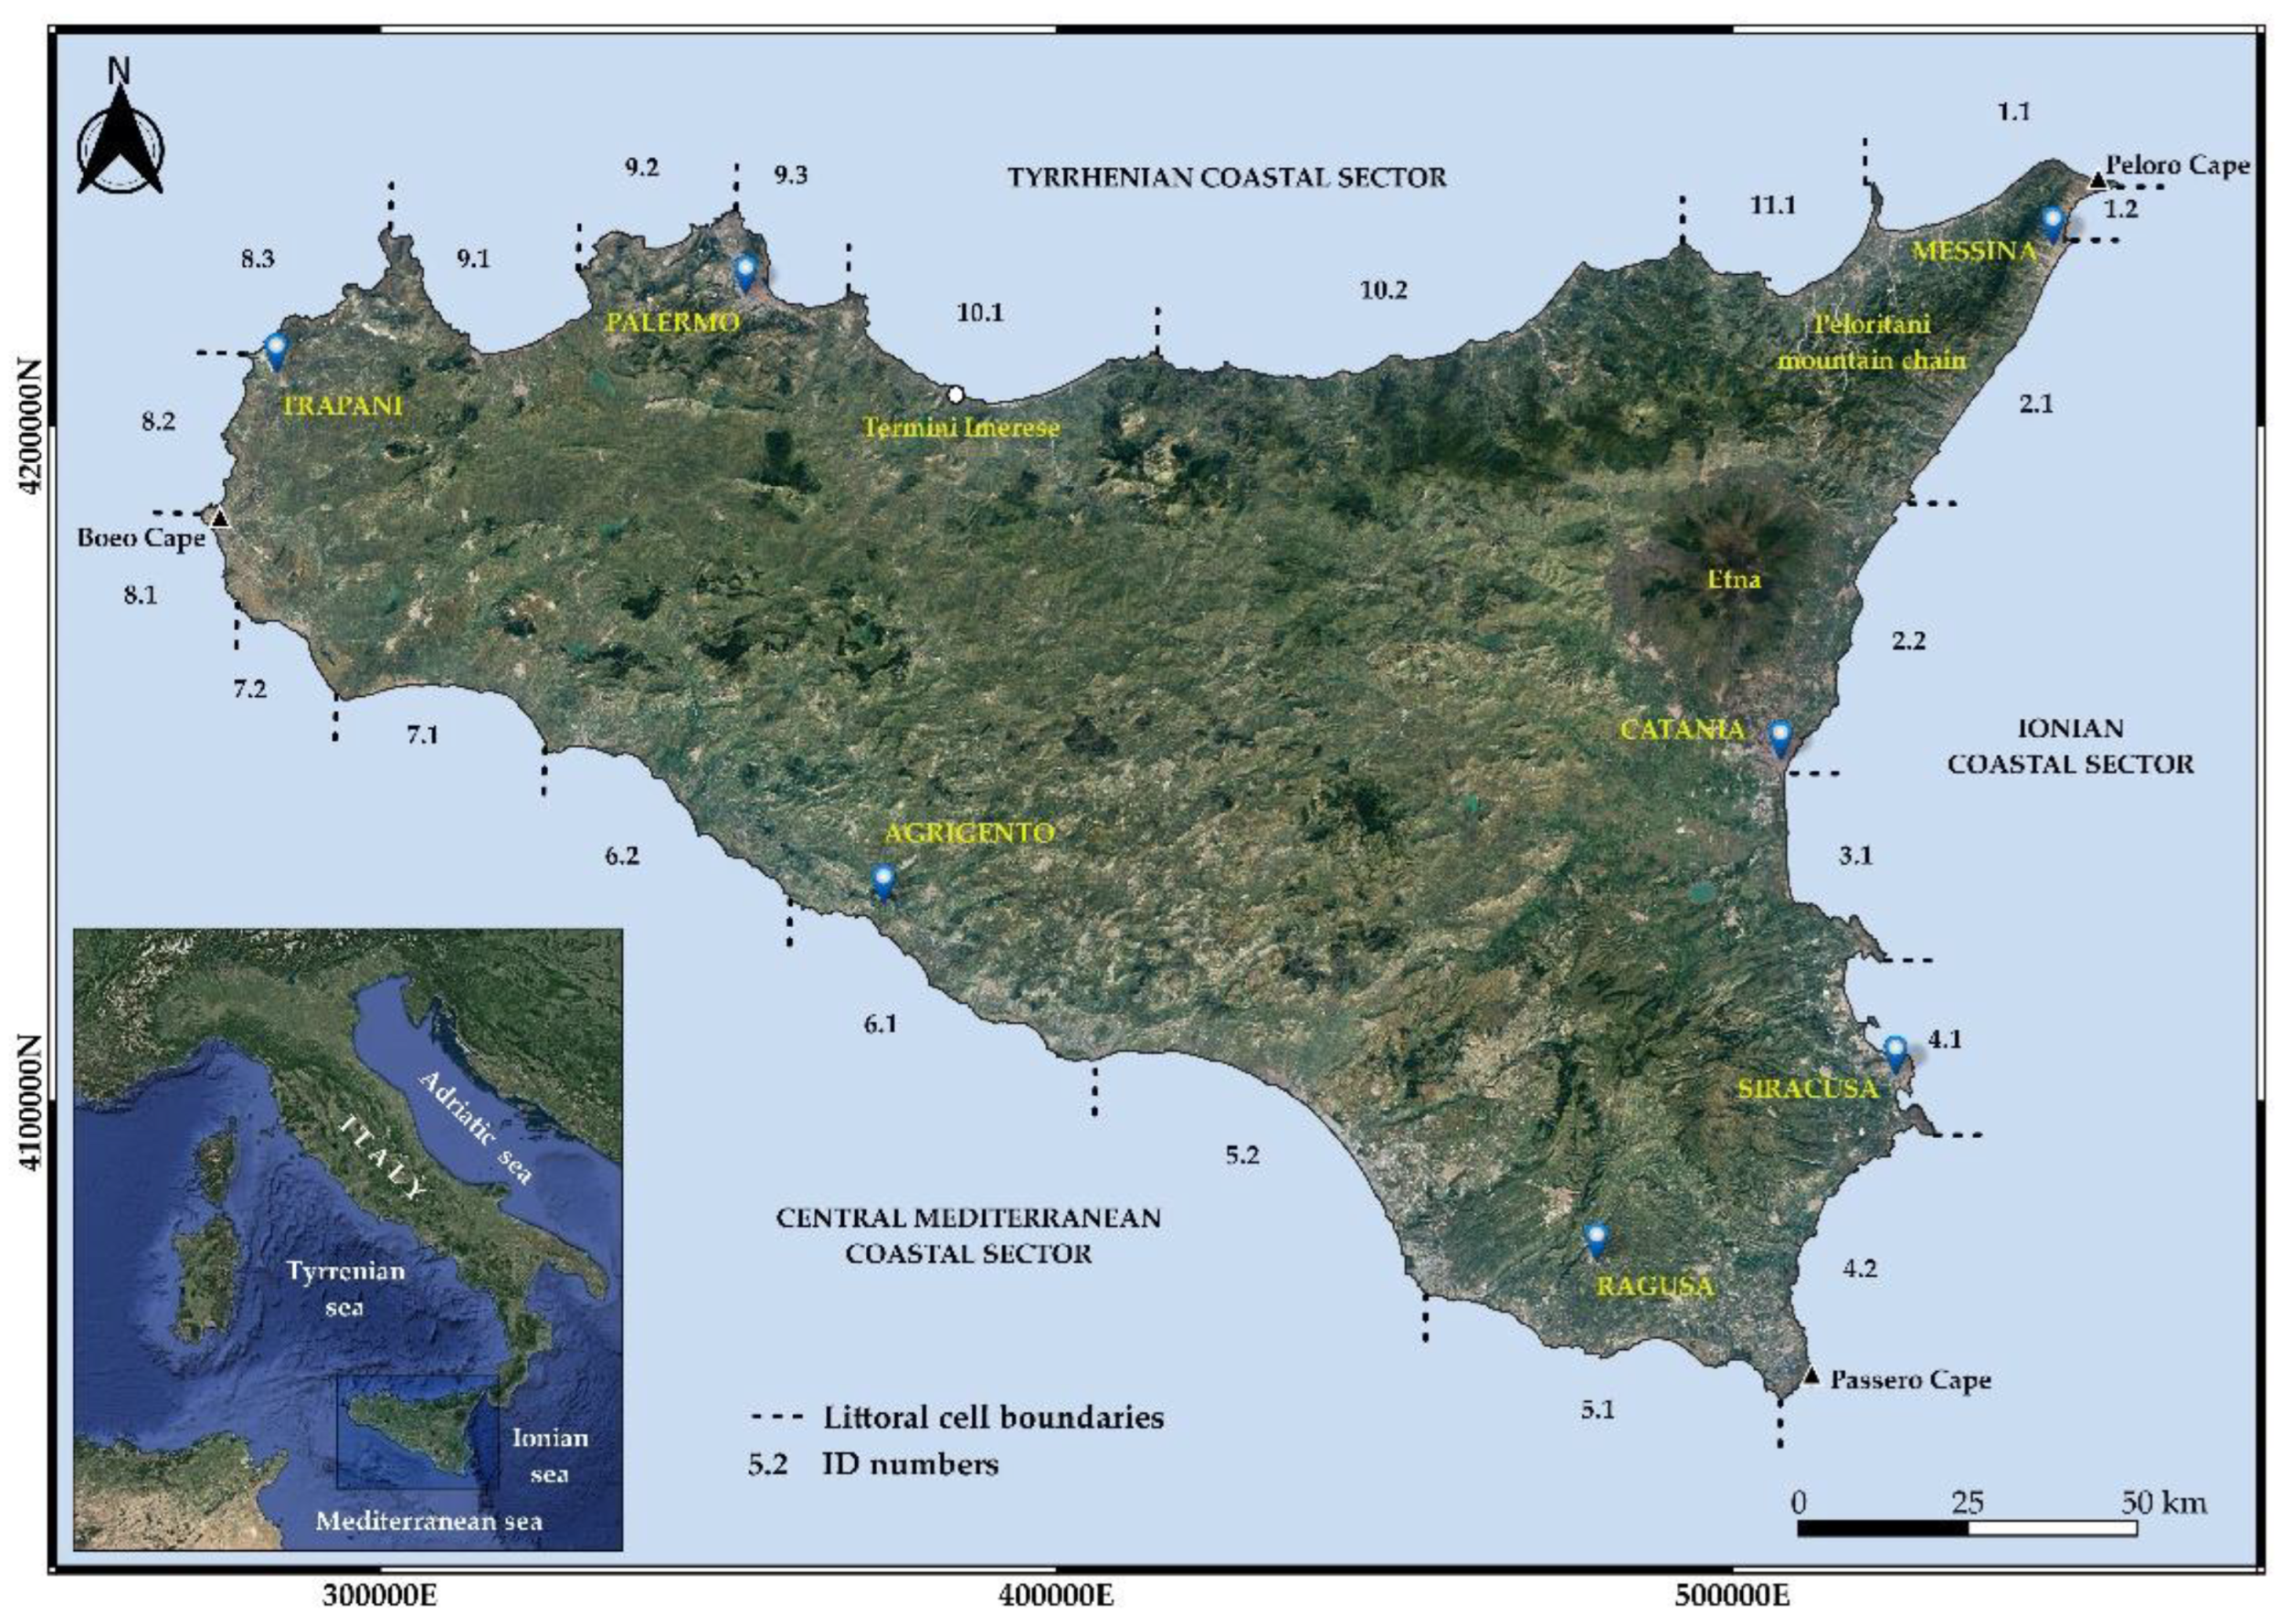
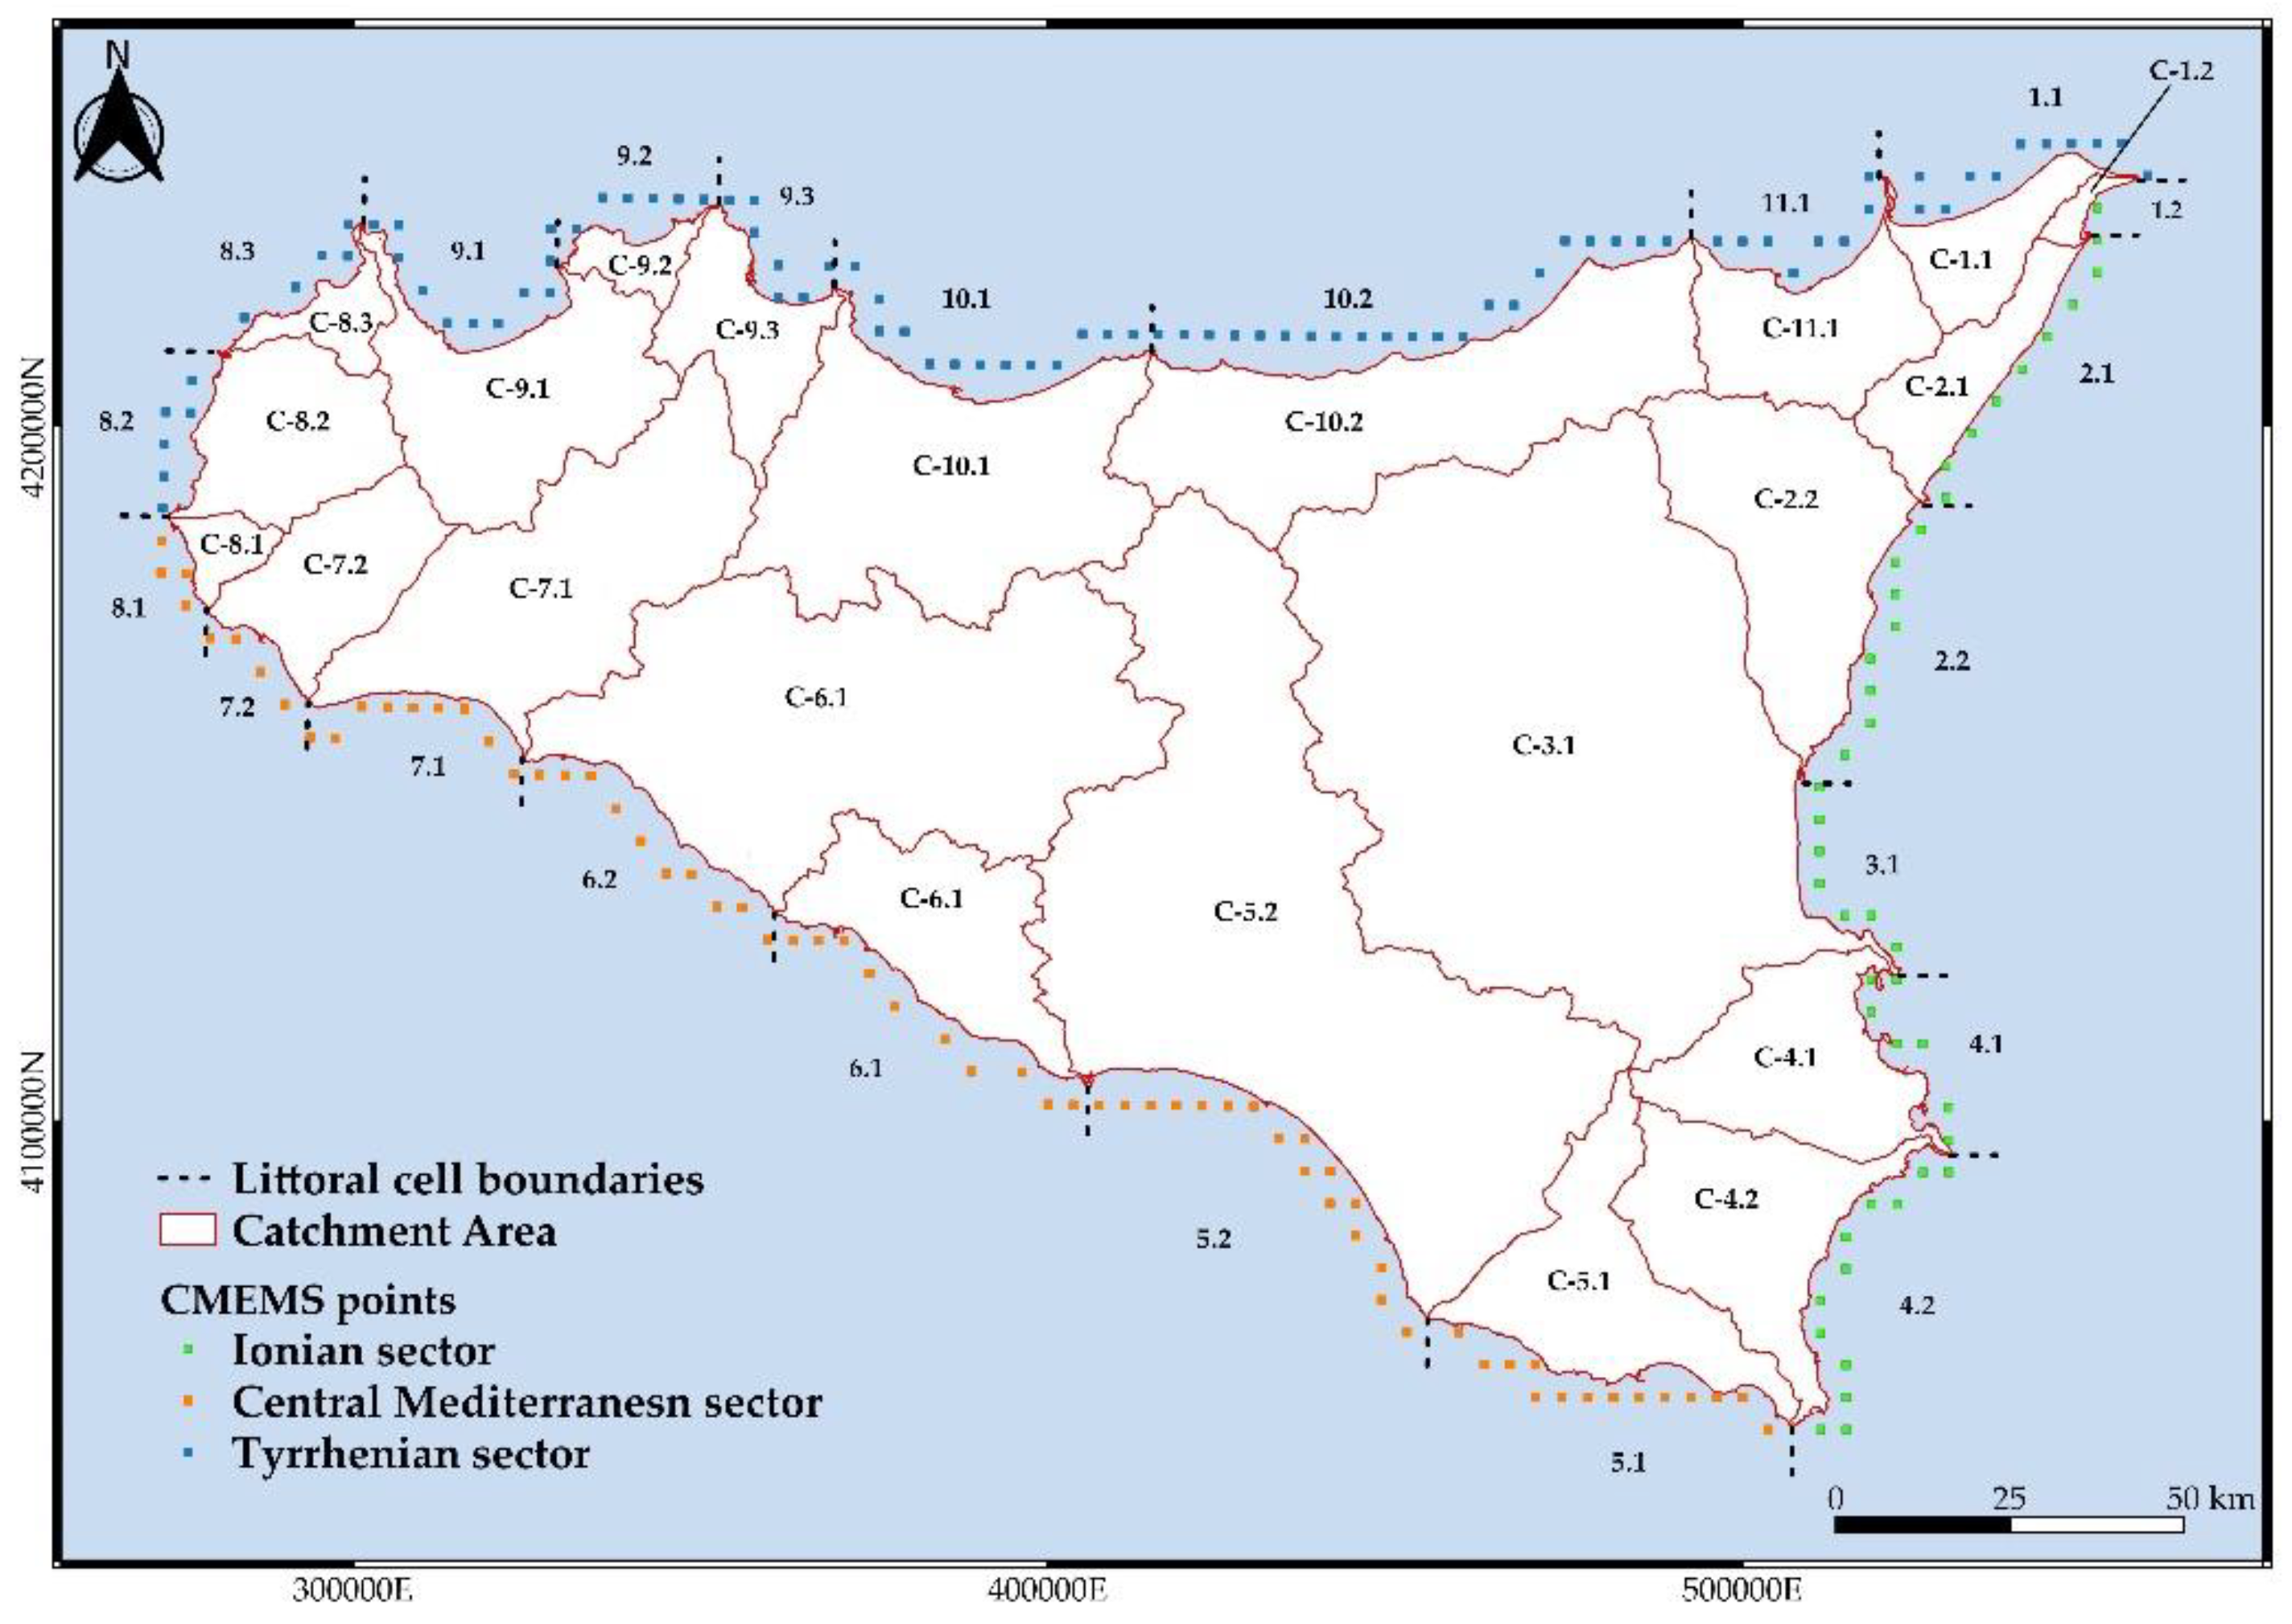
Many authors calculate coastal vulnerability by referring to a classic “Coastal Vulnerability Index” (CVI), which measures the potential effects of erosion and marine flooding in a coastal area.
The classical method [21,22,23] for the estimation of CVI, which was introduced by the United States Geological Survey (USGS) [24], requires four steps: the first concerns the choice of descriptive variables (e.g., geomorphology, shoreline changes, beach slope, tide and significant wave height), the second concerns the classification of variables through the definition of semi-quantitative scores according to a scale ranging from 1 to 5 (1 indicates a low contribution to the coastal vulnerability of a specific variable and 5 indicates a high contribution), the third concerns the aggregation of the variables into a single CVI index (equal to the square root of the product of the classified variables divided by the total number of variables), and finally the fourth and conclusive step involves the classification of the CVI values in n different groups using the n percentiles as limits.
Although widespread, this procedure does not consider socio-economic aspects such as the number of people affected, potentially damaged infrastructure and economic costs [25]. There are two possible approaches to consider the socio-economic aspects: using another index associated with the CVI or using descriptive variables regarding these aspects. Armaroli et al. [26] estimated coastal vulnerability through another index, the “Social and Economic Status Vulnerability Index (ISEV)”, which considers the effects of coastal phenomena on the social and economic status of the citizens who live in these areas [27]. The classic methods (e.g., Bruun’s rule, [28,29,30]) have progressively evolved, improving the assessment of physical and non-physical factors, as well as associated uncertainties (e.g., USGS-CVI, [31,32,33]).
In 2010, Mc Laughlin et al. [34] highlighted the importance of coastal vulnerability assessment for management plans. The authors noted that the calculation of coastal vulnerability due to erosion depends strongly on the aggregation of various parameters (indicators), which, when spatially analyzed, allow the estimation and mapping of the vulnerability. These indicators/parameters are usually applied on a global, national, and regional scale, causing various degrees of simplification and aggregation of information. The desirable simplification degree depends on the management scale; therefore, a higher resolution is required on the local scale than on the regional one. De La Vega-Leinert et al. [30] studied coastal risk and therefore calculated different vulnerability indices, each linked to different observation scales, from the national to the local scale. Their results highlighted the importance of the spatial scale in the assessment of the CVI. If, on the one hand, the vulnerability index method may be applied to the different observation scales, on the other hand, the selection of parameters for calculating vulnerability must consider the scale. Mc Laughlin et al. [34] developed a multi-scale CVI, specifically addressing erosion impacts. The index integrates three sub-indices: (i) a coastal characteristic sub-index, which describes the resilience and coastal susceptibility to erosion, (ii) a coastal forcing sub-index, which characterizes the forcing variables contributing to wave-induced erosion, and (iii) a socio-economic sub-index, describing targets potentially at risk.
The aim of the Di Paola et al.’s [33] research was to verify the vulnerability indices obtained with two different methodologies, namely that of USGS and Gornitz [21] and that of Thieler and López et al. [23,35]. The first calculates the coastal vulnerability index (CVI) using geological and physical parameters, while the second, instead, calculates a “coastal impact” indicator, introducing, for its estimate, new parameters such as wave motion, run-up, and long-term and seasonal erosion indexes. The authors, applying the two methods in the same coastal area, observed different results. This is mainly due to the distinctiveness of the methods used. Therefore, considering the results, the authors emphasize that the choice of a methodology for assessing the vulnerability of a given coastal area must be based on the available information and the physical characteristics of the area under study.
Additionally, Koroglu et al. [14] compared different methodologies [21,22,23,35] in order to calculate the vulnerability index. Indeed, the authors’ objective was to choose a method to calculate the CVI in a univocal way. Their results promote Shaw’s method [22] as the one that comes closest to reality. However, their study highlights the need to generate unique classes for the parameters that allow the calculation of the CVI and for the CVI parameters. In fact, the method applied for calculating CVI for a specific region with specific hydro-geomorphological conditions is not necessarily applicable to other regions.
In the same year, Ružić et al. [9] presented a new vulnerability assessment methodology developed to analyze the Croatian Eastern Adriatic coast (CEAC), which has an extremely complex geomorphology. The vulnerability analysis was carried out to define adequate risk management strategies for rocky coasts. The method was based on the segmentation of the coastline and the assignment of vulnerability values to each coastal segment. The parameters they used to calculate the CVI included the geological fabric, the slope of the coast, the width of the emerged beaches, the significant wave height and land use. This methodology was adapted and improved for the local rocky coast but can be used worldwide on other complex rocky coastlines.
Furlan et al. [36] calculated a new vulnerability index, the Multi-Dimensional Coastal Vulnerability Index (MDim-CVI). This index, created to estimate the vulnerability to flooding caused by sea-level rise, integrates a composite set of physical, environmental, and socio-economic indicators. In particular, the authors consider a set of geomorphological vulnerability indicators (e.g., height above sea level, distance from the coast, coastal evolution trend), exposure and adaptability (e.g., sensitive segments of the population, GDP, land use patterns). The methodology was applied to a reference time horizon representing the current climatic and land use conditions and a future scenario, integrating both climate projections and data simulating the potential evolution of the system’s environmental and socio-economic characteristics.
Parthasarathy et al. [37] redefined the parameters required to determine the coastal vulnerability index, according to the physical and socio-economic conditions of the coast, by establishing a set of six parameters: the geomorphology, the relative value of the elevation of the sea, the coast slope, the shoreline change value, the mean tide interval, and the mean wave height. The authors also reviewed the various topics of study and the various variables considered for calculating the vulnerability index.
Coastal vulnerability is in general related both to the socio-economic interests and physical resilience of the involved population/structures and natural system, respectively. In particular, the proneness of a coastal sector to be modified by the interaction of natural phenomena such as marine and river processes can be investigated by analyzing some of their controlling physical static and dynamic factors. With this perspective in mind, in this paper, a new approach for assessing erosion vulnerability was applied to the Sicilian coast, based on the analysis of five geomorphological and hydraulic parameters through coastal transects grouped by littoral cells and the reconstruction of a coastline change signal. A set of transects that were regularly spaced and perpendicular to the coastline were first traced, and a subset of those marking coastal advancement/retreat were selected. For each of these, a vulnerability index was then calculated based on an expert-based classification of the five selected indicators. Finally, a validation procedure was applied by comparing the obtained vulnerability classification with the coastline changes in the intersected polygons which were delimited by crossing the coastline position in two different epochs. At the same time, to estimate the potential role of the river sediment supply along the coast, models including/not including the related controlling factors (derived by the WaTEM model) were compared.
The following sections give details about the study area, materials and methods, results, and discussion. Finally, a conclusion section refocuses the attention on the most critical points and supporting evidence of the research.

2. Study Area

Sicily is the largest island in the Mediterranean Sea, and its coast is about 1600 km long. Coastal environments have great variability in terms of geology, morphology, marine climate, anthropization, etc. About 30% of the total Sicilian coastline is rocky, divided into low carbonatic shelves and high rocky headlands. The remaining 70% of the Sicilian coastline comprises low coasts with sandy and/or pebble beaches. The latter are the majority in terms of length and often suffer from erosion phenomena. Such a circumstance is observed by the coastal population, causing pressure on the local authorities to solve these issues.
In this paper, the Sicilian coastline was classified into three macro-coastal sectors: the Tyrrhenian coast between Boeo Cape and Peloro Cape, the Ionian coast between Peloro Cape and Passero Cape, and finally, the Central Mediterranean coast between Passero Cape and Boeo Cape. (Figure 1).
The continental shelf facing the Tyrrhenian coastal sector has a width of about 7 km. From Boeo Cape to Palermo, the coast is characterized by a sequence of high rocky (carbonatic) coasts and sandy beaches limited landward by sea terraces and escarpments. In some cases, the coast becomes low and rocky. The coast near Palermo is mainly artificial due to its high urbanization (harbors, coastal structures, old demolition waste, etc.). In the eastern direction, towards Termini Imerese, the coastal landscape becomes flat with large alluvial areas. These areas are limited seaward due to wide beaches. Looking eastward, the coast is mainly characterized by narrow beaches separated by reliefs. The last sector near Peloro Cape derives from the dismantling of the Peloritani chain, which has produced a system of alluvial plains, which are connected to the sea through large beaches disconnected by high headlands.
The Central Mediterranean coastal sector has an average continental shelf that is 20 km wide. The coast is characterized by several large sandy beaches bounded landward by large alluvial deposits. The north-west coast sectors are made up of marly active and inactive cliffs, while the south-east coast (near Passero Cape) is characterized by carbonatic cliffs which often enclose pocket beaches.
Finally, the Ionian coastal sector has a 5 km wide continental shelf, smaller than the other two macro-coastal sectors. From Peloro Cape to the Catania urban area, the coast is similar to the Tyrrhenian coast because of the proximity of the Peloritani mountain chain. Additionally, this sector hosts wide beaches and rocky headlands (generally carbonatic rocks). In the Catania gulf, the geological substratum of the coast changes, becoming mainly volcanic with basaltic rocks. Additionally, in this case, near Catania city, the coast is mainly armored. From the Catania Gulf to Passero Cape, the coast is characterized by a succession of narrow beaches and carbonate headlands. Carbonate reliefs bound the beaches landward. In this sector, small coastal marshes are protected areas due to their natural importance.
In summary, the Sicilian coastal morphotypes can be classified as: (a) reflective pebble beaches on the eastern Tyrrhenian coast and Northern Ionian coast; (b) dissipative sandy beaches on the Mediterranean coast; (c) complex coastal areas such as marshes, littoral arrows, etc.; (d) active and inactive cliffs, mostly distributed on the Agrigento, Siracusa and Catania coasts; and (f) anthropized coasts where manmade structures characterize the coastline.
The Sicilian coast was segmented into 22 s-level littoral cells (LCs) to analyze the coastal dynamics and assess the erosion vulnerability. Littoral cells usually belong to a specific hierarchic order, at the first, second and third levels. Technicians and researchers choose the hierarchic order according to the study scale. The littoral cells or sediment cells contain sediment sources, transport paths and sinks. Each littoral cell is isolated from an adjacent cell and can be managed as a unit. In Sicily, there are 11 main littoral cells divided into 22 sub-cells named, respectively, first- and second-level cells. The first level of littoral cells has only natural boundaries, and the second level can include artificial boundaries (big harbors, sea work, etc.). Such a hierarchic classification is sufficient for regional study purposes because details are not needed at a large scale. Littoral cells are coded by two numbers such that the first number identifies the littoral cell of the first hierarchic order and the second number identifies the littoral cell of the second hierarchic order. For example, LC 5.2 means that we are observing the littoral cell of the second hierarchic order of number 2 belonging to the littoral cell of the first hierarchic order of number 5.

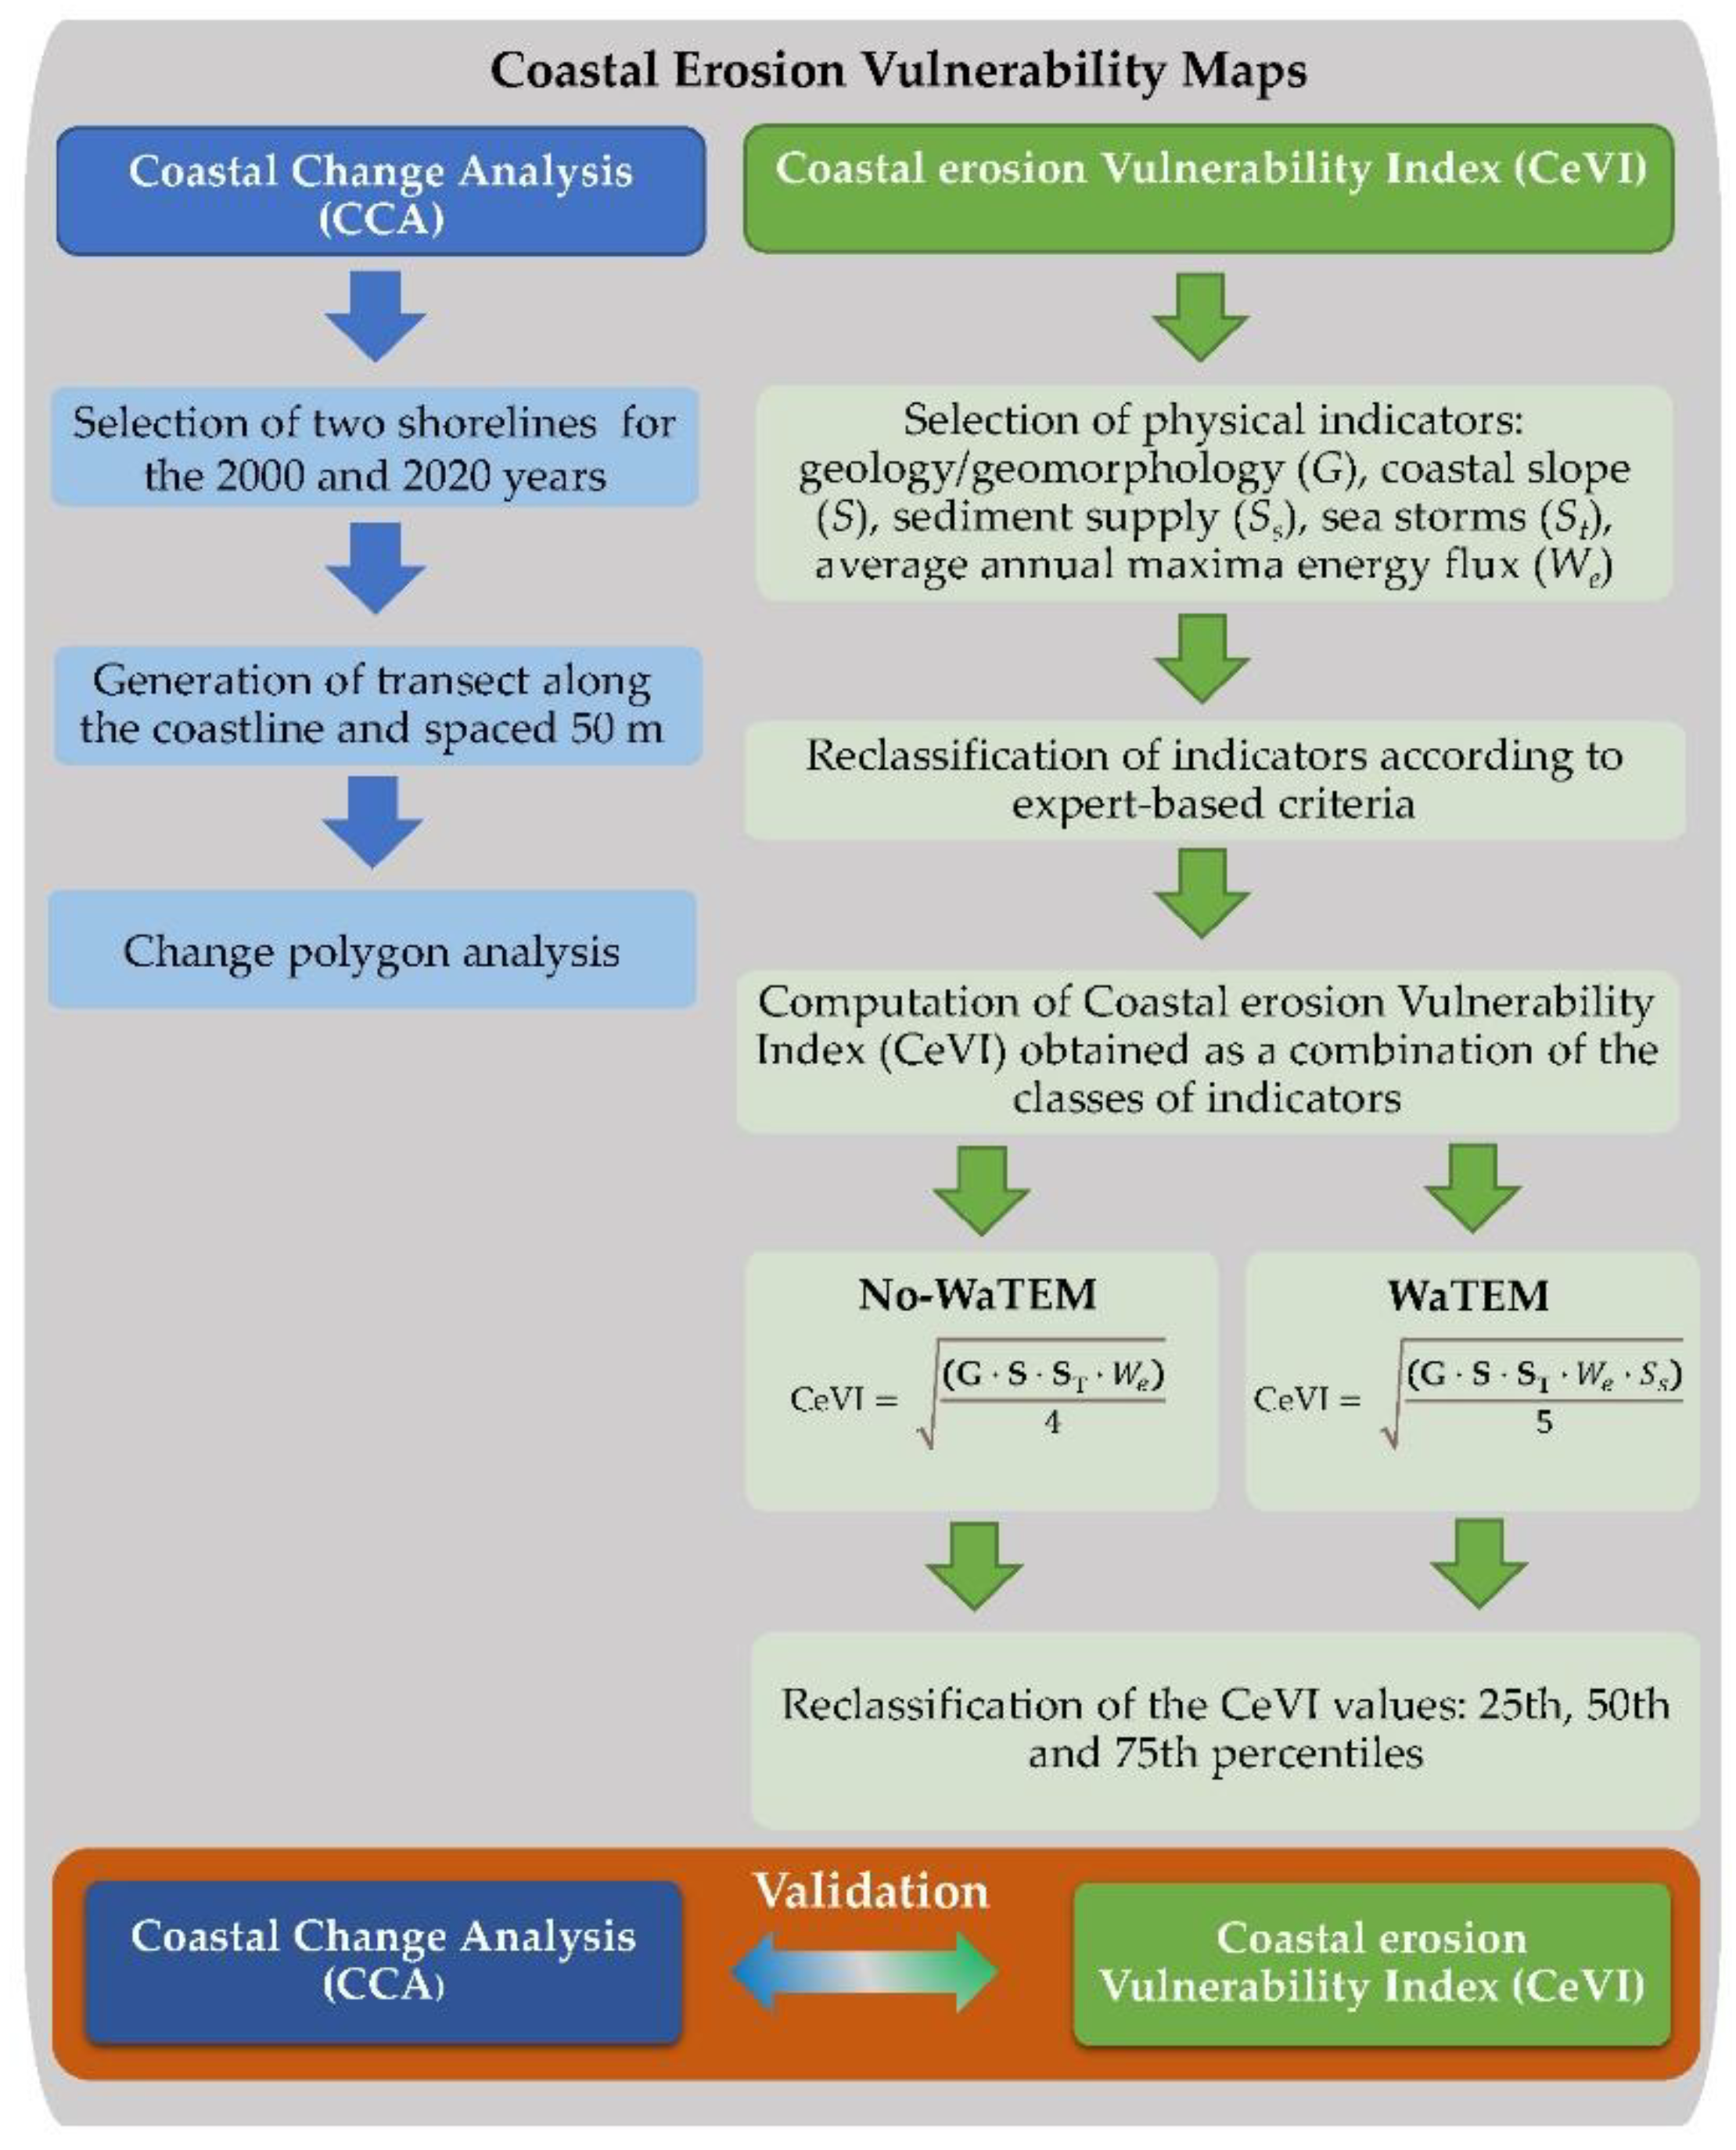
3. Materials and Methods

To assess the coastal vulnerability conditions, 500 m transects crossing the Sicilian coastline were generated with a 50 m interval between them, for a total of 23,680 transects. The CeVI evaluation was then applied to the 10,558 transects (Figure 2), which cross the polygons that originated at coastline intersections. Transects where the shift between the two coastlines (years 2000 and 2020) was lower than the threshold of 6 m (pixel resolution value) were excluded from the analysis. This segmentation aimed at ranking different sections of coastline based on vulnerability and helped to determine high-priority areas for vulnerability reduction.
According to the approach which was adopted in this study, the following heuristic method was applied (Figure 3): (1) a set of indicators which potentially control coastal erosion phenomena were computed and assigned to each transect; (2) each indicator was then reclassified according to expert-based criteria, and an overall Coastal Erosion Vulnerability Index was then obtained as a combination of the classes of the five indicators; (3) the estimated CeVIs were then compared with the observed coastal advancement/retreat signal; and finally, (4) to explore the importance of the sediment supply, which is not among the commonly used factors in models, included (complete) and not-included (leave-out) models were prepared and compared.

3.1. CeVI Indicators

Five physical indicators were used to assess the Sicilian coast’s erosion vulnerability index: (1) a geological/geomorphological indicator (G), (2) a coastal slope indicator (S), (3) an erosion/sediment supply indicator (Ss), (4) a sea storm indicator and (St), and (5) an average annual maxima energy flux indicator (We) (Table 1). The coastal physical and environmental indicators (G, S, Ss) represent the resistance or susceptibility of coastlines to physical variations, and the wave climate-related indicators (St, We) represent the coastal forcing. As reported in the last column of Table 1, the indicators were calculated and assigned to littoral cells (LC: Ss, St and We) or coastal transects (CT: G and S).
The physical indicators have different data formats and were obtained directly or indirectly by calculating them from other parameters supplied by specific operational services. In particular, geomorphologic and geologic parameters were obtained from ISPRA (Italian Institute for Environmental Protection and Research), the coastal slope was computed from a 2 m × 2 m Digital Elevation Model (DEM) provided by the Sicilian SITR (Regional Territorial Information System), the sediment supply was obtained by analyzing data from ESDAC (European Soil Data Centre), and finally the parameters linked to the sea were obtained by analyzing the data provided by CMEMS (Copernicus Marine Environment Monitoring Service).
The sediment supply, the number of sea storms, and the wave energy flux indicators, computed directly from the raw data, were calculated for each littoral cell. A quartile re-classification was then applied, thus obtaining four intervals for each parameter, with these intervals expressing vulnerability ordinal scores in the range from 1 (lowest vulnerability) to 4 (highest vulnerability).
The vulnerability scores of the indicators for the littoral cells were then assigned to each included coastal transect. In contrast, the geomorphology, geology, and coastal slope indicators were separately computed for each coastal transect.
Figure 4a shows a stretch of the Sicilian coastline, belonging to 5.2 LC, with the two different shorelines (2000–2020) and related transects. An ID identifies each transect, linked to the columns of the table in Figure 4b where the scores of all the adopted indicators are reported (Figure 4b). As the last three columns of Figure 4b report the indicators related to the same littoral cell, they have the same values (Ss = 3, We = 2 and St = 1).

3.1.1. Geomorphology and Geology

Coastal geomorphology and the nature of the outcropping rocks play an important role in assessing coastal vulnerability because they express both its erodibility and the resistance degree to erosion [38]. Generally, the presence of low coasts and unconsolidated sediments (e.g., beaches, estuaries, lagoons, deltas, etc.) offers the least resistance to erosion and, therefore, very high vulnerability compared with higher coasts formed by substrates (consolidated sedimentary or crystalline rocks) [24].
The ISPRA (Italian Institute for Environmental Protection and Research) Coastal Geoportal was used to define the geomorphology and geology characteristics of the Sicilian coast (https://sinacloud.isprambiente.it (accessed on 23 December 2022)), by downloading the “coastline 2020” shapefile. This vector corresponds to the coastline of the whole Italian littoral corresponding to the year 2020, classifying the coast in terms of geomorphological and geological settings. In particular, three macro-elements are defined: natural, artificial, and fictional. The first is divided into high and rocky coasts and low coasts (sandy beaches, gravelly beaches, and gravelly beaches with boulders). The second divides the coast considering the presence of defense works, harbors, beach clubs, etc. Finally, fictional coasts are the stretches of coast that connect the start and end points of maritime work.
For each coastal transect, the geomorphological and geological information was derived from the intersection of the coastal transect with the “coastline 2000” shapefile. Subsequently, vulnerability scores were assigned based on the relative erodibility of different landform types, varying from high cliffs to sandy beaches.

3.1.2. Coastal Slope

The coastal slope, expressed as a percentage, is one of the indicators of coastal vulnerability. On a gently sloping coast, the environment is dissipative, and the sea storm energy can produce consistent sediment transport phenomena. On the other hand, on steeply sloping coasts, the waves dissipate their energy by breaking on the rocks. It is important to highlight that the slope is only an indicator, and the overall results are related to several aspects. Clearly, very steep coasts can exist that are vulnerable, and conversely, gently sloping coasts that are not vulnerable can exist. This is because the results are related to the combination of all of the indicators.
The first step was to compute the subaerial coastal plain slope from the 2m x 2m DEM provided by the regional geo-information system. The value was calculated for the centroid of each transect. In particular, the mean value within a 25 m radius for each centroid was calculated. The vulnerability ranges related to the coastal slope parameters were chosen considering previous studies carried out on the Mediterranean coast. The mean slope was classified into ranges—from 0% to 2% (very high), from 2% to 4% (high), from 4% to 8% (moderate) and >8% (low)—following those proposed by McLaughlin et al. [32].

3.1.3. Sediment Supply by River Basins

River sediment supply is critical in a dynamic and complex multi-functional system such as a coastal area. An alteration of the transfer of river sediment to littoral sediment budgets causes an increase or reduction in sediment discharge. To express this factor with an indicator, the quantitative estimates of net soil erosion and deposition rate obtained from the application of the spatially distributed sediment delivery model WaTEM/SEDEM (from this point forward named WaTEM) at the European scale were used (Borrelli et al. [39]). Source data were directly acquired from the ESDAC (European Soil Data Centre) database as a 25 m-pixel-size layer based on the RUSLE (Revised Universal Soil Loss Equation) model and a transport capacity routing algorithm.
By applying SAGA-GIS tools (zonal grid statistics), the contributing fluvial basins feeding the catchment area of each littoral cell were first identified. The sediment delivery budget at each littoral cell was then calculated as a sum of negative (soil loss) or positive (deposition) pixel values obtained from the WaTEM layer.
Finally, using quartile ranges, four vulnerability classes were obtained from 1 (lowest vulnerability) to 4 (highest vulnerability).
It is worth noting that the more negative the value, i.e., the more sediment lost from the basin, the greater the expected sediment supply towards the coastline underlying the same basin. Therefore, low values of sediment supply correspond to a low vulnerability class.

3.1.4. Sea Storm and Average of Annual Maxima Energy Flux

The Copernicus Marine Environment Monitoring Service (CMEMS) provides oceanographic products and services, and it aims to routinely make available quality-assured products on the past, present, and future state of the sea. The Copernicus data are useful for several studies, such as coastal flooding and wave conditions at sea, environmental assessments, and climate studies. To characterize the wave motion climate around the Sicilian coasts, the CMEMS dataset was used. Wave parameters were obtained from “MEDSEA_MULTIYEAR_WAV_006_012” data (https://resources.marine.copernicus.eu—last accessed on 18 October 2022), which offer a reanalysis dataset and an interim dataset covering the period after the reanalysis until one month before the present. The reanalysis dataset is a multi-year wave reanalysis starting from January 1993, composed of hourly wave parameters at 1/24° (about 4 km) horizontal resolution, covering the Mediterranean Sea. In particular, the parameters extracted from the CMEMS dataset are the spectral significant wave height (Hm0), wave period at spectral peak/peak period (Tp), and mean wave direction (θ).
The CMEMS dataset is computed using the wind data from the ECWMF (European Centre for Medium-Range Weather Forecasts) with a spatial resolution of 0.5° × 0.5°. Figure 5 shows the CMEMS points around the Sicilian coasts and the related catchment areas.
The wave climate of the Sicilian coast was analyzed for the time interval of the present study.
Two hundred and two points were extracted from the CMEMS reanalysis dataset (Figure 5). The need to select a parameter characterizing each coastal stretch required spatial averaging. In particular, a mean value was assigned to each coastal littoral cell, obtaining Hm0, Tp, and θ.
The spatial average of the wave parameters was used to assign wave climate to the given coastal cell. These wave climate parameters are the basis for computing the CVI indicators regarding the wave climate. In particular, the following indicators were taken into consideration: the number of sea storms and the average of the annual maxima energy flux.
Sea storms were defined using the approach proposed by Boccotti, P. [40]. Therefore, a Mediterranean Sea storm was defined as a sequence of sea states in which the spectral significant wave height (Hm0) exceeds the threshold of 1.5 m and does not fall below this for a continuous-time interval greater than 12 h. The number of sea storms registered in the period from 2000 to 2020 was computed for each LC (see Table 2).
The wave energy flux plays a key role in vulnerability assessment. To consider its variations, the annual average maximum was computed. For each studied year and for each littoral cell, the maximum value of wave energy flux was computed (P). Thus, these maxima were averaged over time, obtaining a unique value for each cell.
The values of the number of sea storms in the study period vary between a minimum of 14 for the 1.2 littoral cell (Ionic sector) and a maximum of 661 for the 7.2 littoral cell (Mediterranean sector), with an average value of around 352; in general, the highest average values are found along the Central Mediterranean coast, whereas the lowest are in the Ionic sector.
The average of the annual maximal energy flux has a maximum value of 143.83 kW/m for the 8.3 littoral cell in the Tyrrhenian sector, while the minimum value, 19.98 kW/m, is in the same littoral cell, in which the lowest number of sea storms occur.

3.2. CeVI Computation

Once each coastal transect had been assigned a vulnerability class from 1 (low vulnerability) to 4 (high vulnerability) for each indicator (Table 3), the overall Coastal Erosion Vulnerability Index (CeVI) was calculated by applying the same scheme of the commonly adopted version proposed by Gornitz V [21], as the square root of the product of the indicators, divided by the number of indicators n (Equation (1)):
C e V I = ( G · S   · S s · S t   · W e ) n
where G, S, Ss, St and We are the physical indicators presented in Section 3.1.
The overall CeVI values were then re-classified into the 25th, 50th and 75th percentiles representing the CeVI’s range of classes: class 1, low vulnerability (0–25th percentile); class 2, medium vulnerability (25–50th percentile); class 3, high vulnerability (50–75th percentile); and class 4, very high vulnerability (>75th percentile).
To calculate the CeVI values and to analyze the role of sediment supply, two approaches were followed. The first did not consider the contribution of sediments coming from river catchments (No-WaTEM; Ss = 0), whereas the second considered it (WaTEM). Therefore, in the No-WaTEM model, the indicators used to calculate CeVI were G, S, St, and Wa, whilst the WATEM model computed CeVI using G, S, St, and Wa and Ss. By means of the WaTEM and No-WaTEM models, the CeVI value was computed for each transect. Once we obtained the CeVI values, they were classified into 4 vulnerability classes (class 1: 0–25th percentile; class 2: 25th–50th percentile; class 3: 50th–75th percentile and class 4: >75th percentile).

3.3. Validation

Unlike previous applications of the vulnerability index, which typically include historical coastline evolution data (erosion/accretion trend) as an indicator of the potential impact of climate change [35], in this study the observed 2000/2020 coastline change rate (m/y) was rather used to validate the proposed CeVI methodology.

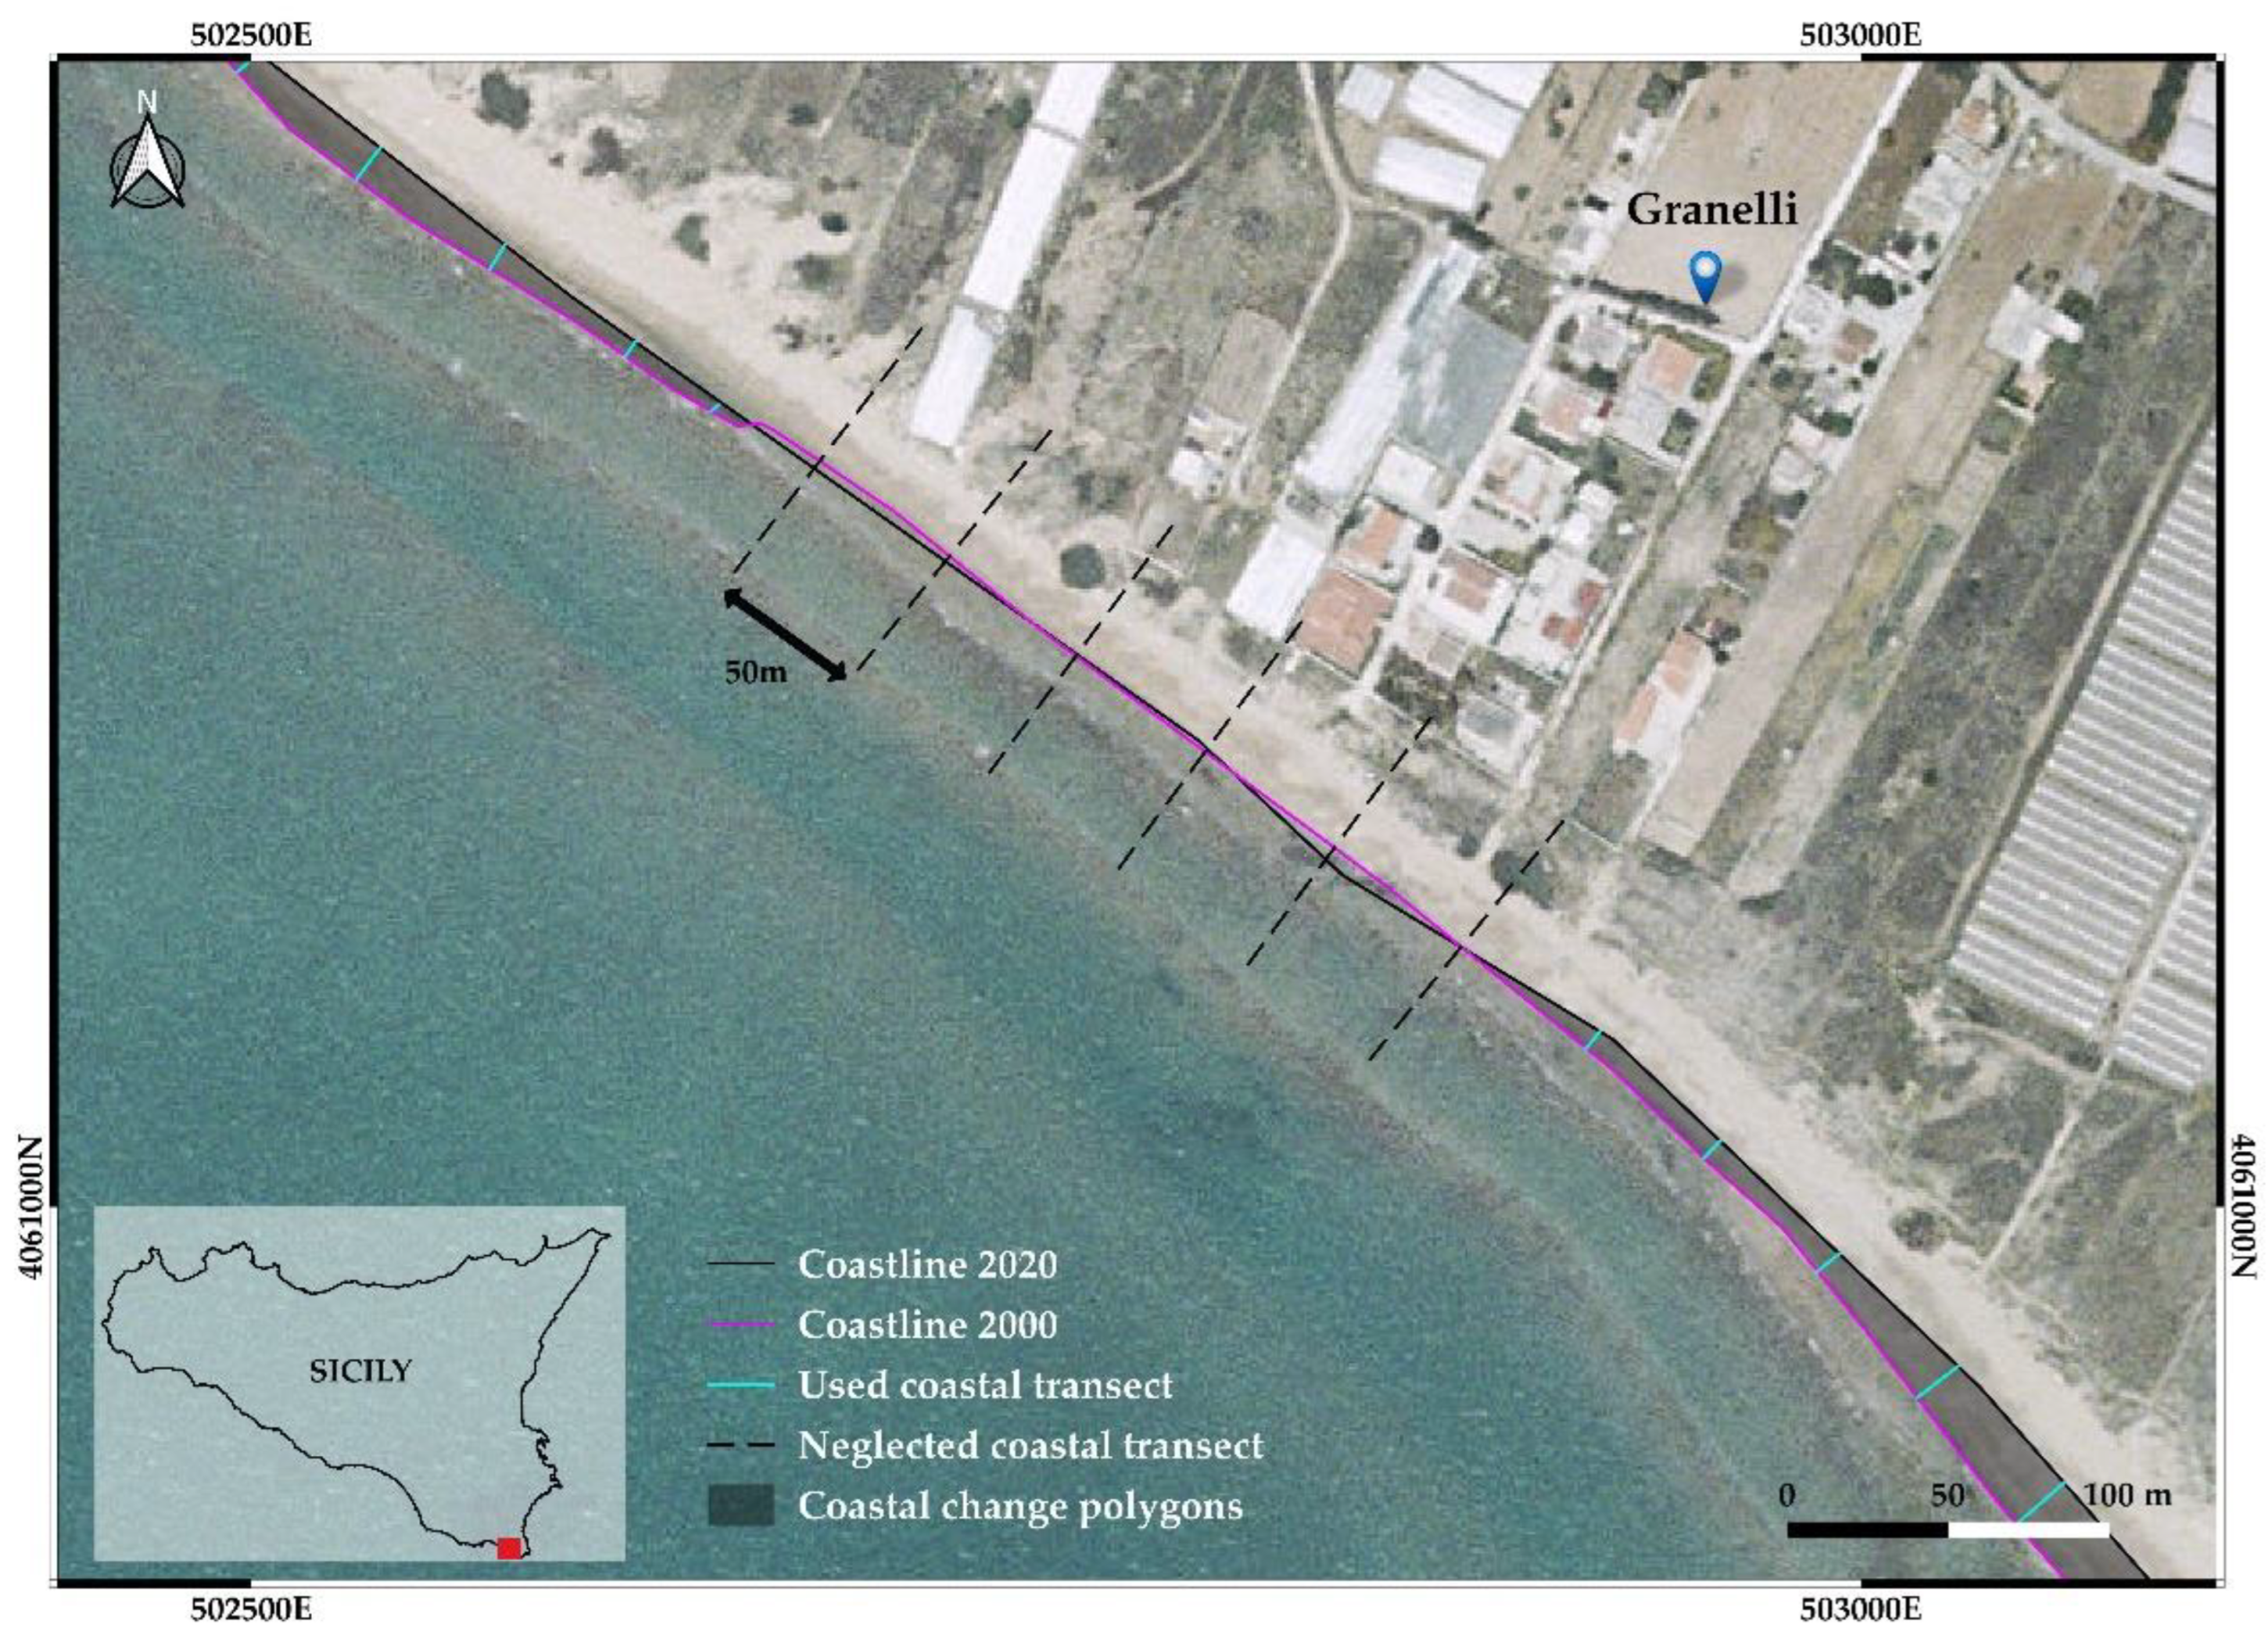
3.3.1. Coastline Change Analysis (CCA)

The coastal change analysis was performed using the two shorelines extracted for the years 2000 and 2020. These polylines are the result of the identification and vectorization of the shoreline by satellite images. Both the shorelines in 2000 and 2020 were obtained from the ISPRA database (https://sinacloud.isprambiente.it/portal/apps/sites/#/coste (accessed on 23 December 2022).
ISPRA, to obtain the shoreline, chose the wet and dry limit as a specific geo-indicator [41]. Indeed, among the different geo-indicators that can be identified in the aerial and/or satellite images (instantaneous rise line of the wave motion on the beach, vegetation line of the dune closest to the sea, erosion step of the beach, storm line, resurgence line of the water, maximum breaking line, etc.), the wet/dry limit is the one most easily recognizable in aerial and satellite images.
Despite being influenced by the sea climate, the wet/dry limit is a stable geo-indicator of the shoreline, and for this reason is more reliable than the indicator known as the instantaneous run-up limit. The use of the wet/dry limit, although among the most reliable for the location of the shoreline, does not, however, exclude the presence of uncertainties related to the exact position of the border. This obviously also applies to all of the other geo-indicators.
The coastline intersections produced the change polygons which were used for the coastal change analysis. To assess the Sicilian coastal change, the polygon approach was adopted: the coastline intersections generated a series of change polygons which defined retreating or advancing coastal areas. Each area is equal to the coastal length multiplied by its width. On these geometric bases, the area between two coastlines corresponds to the change in area and the width is interpreted as the average shift in the shoreline in time (the period between the two shorelines) [42]. Positive areas (advancing) and negative areas (retreating) are linked to the shoreline cross points. The sum of these areas reflects the total coast area change over time. The coastline change analysis was carried out using QGIS software.

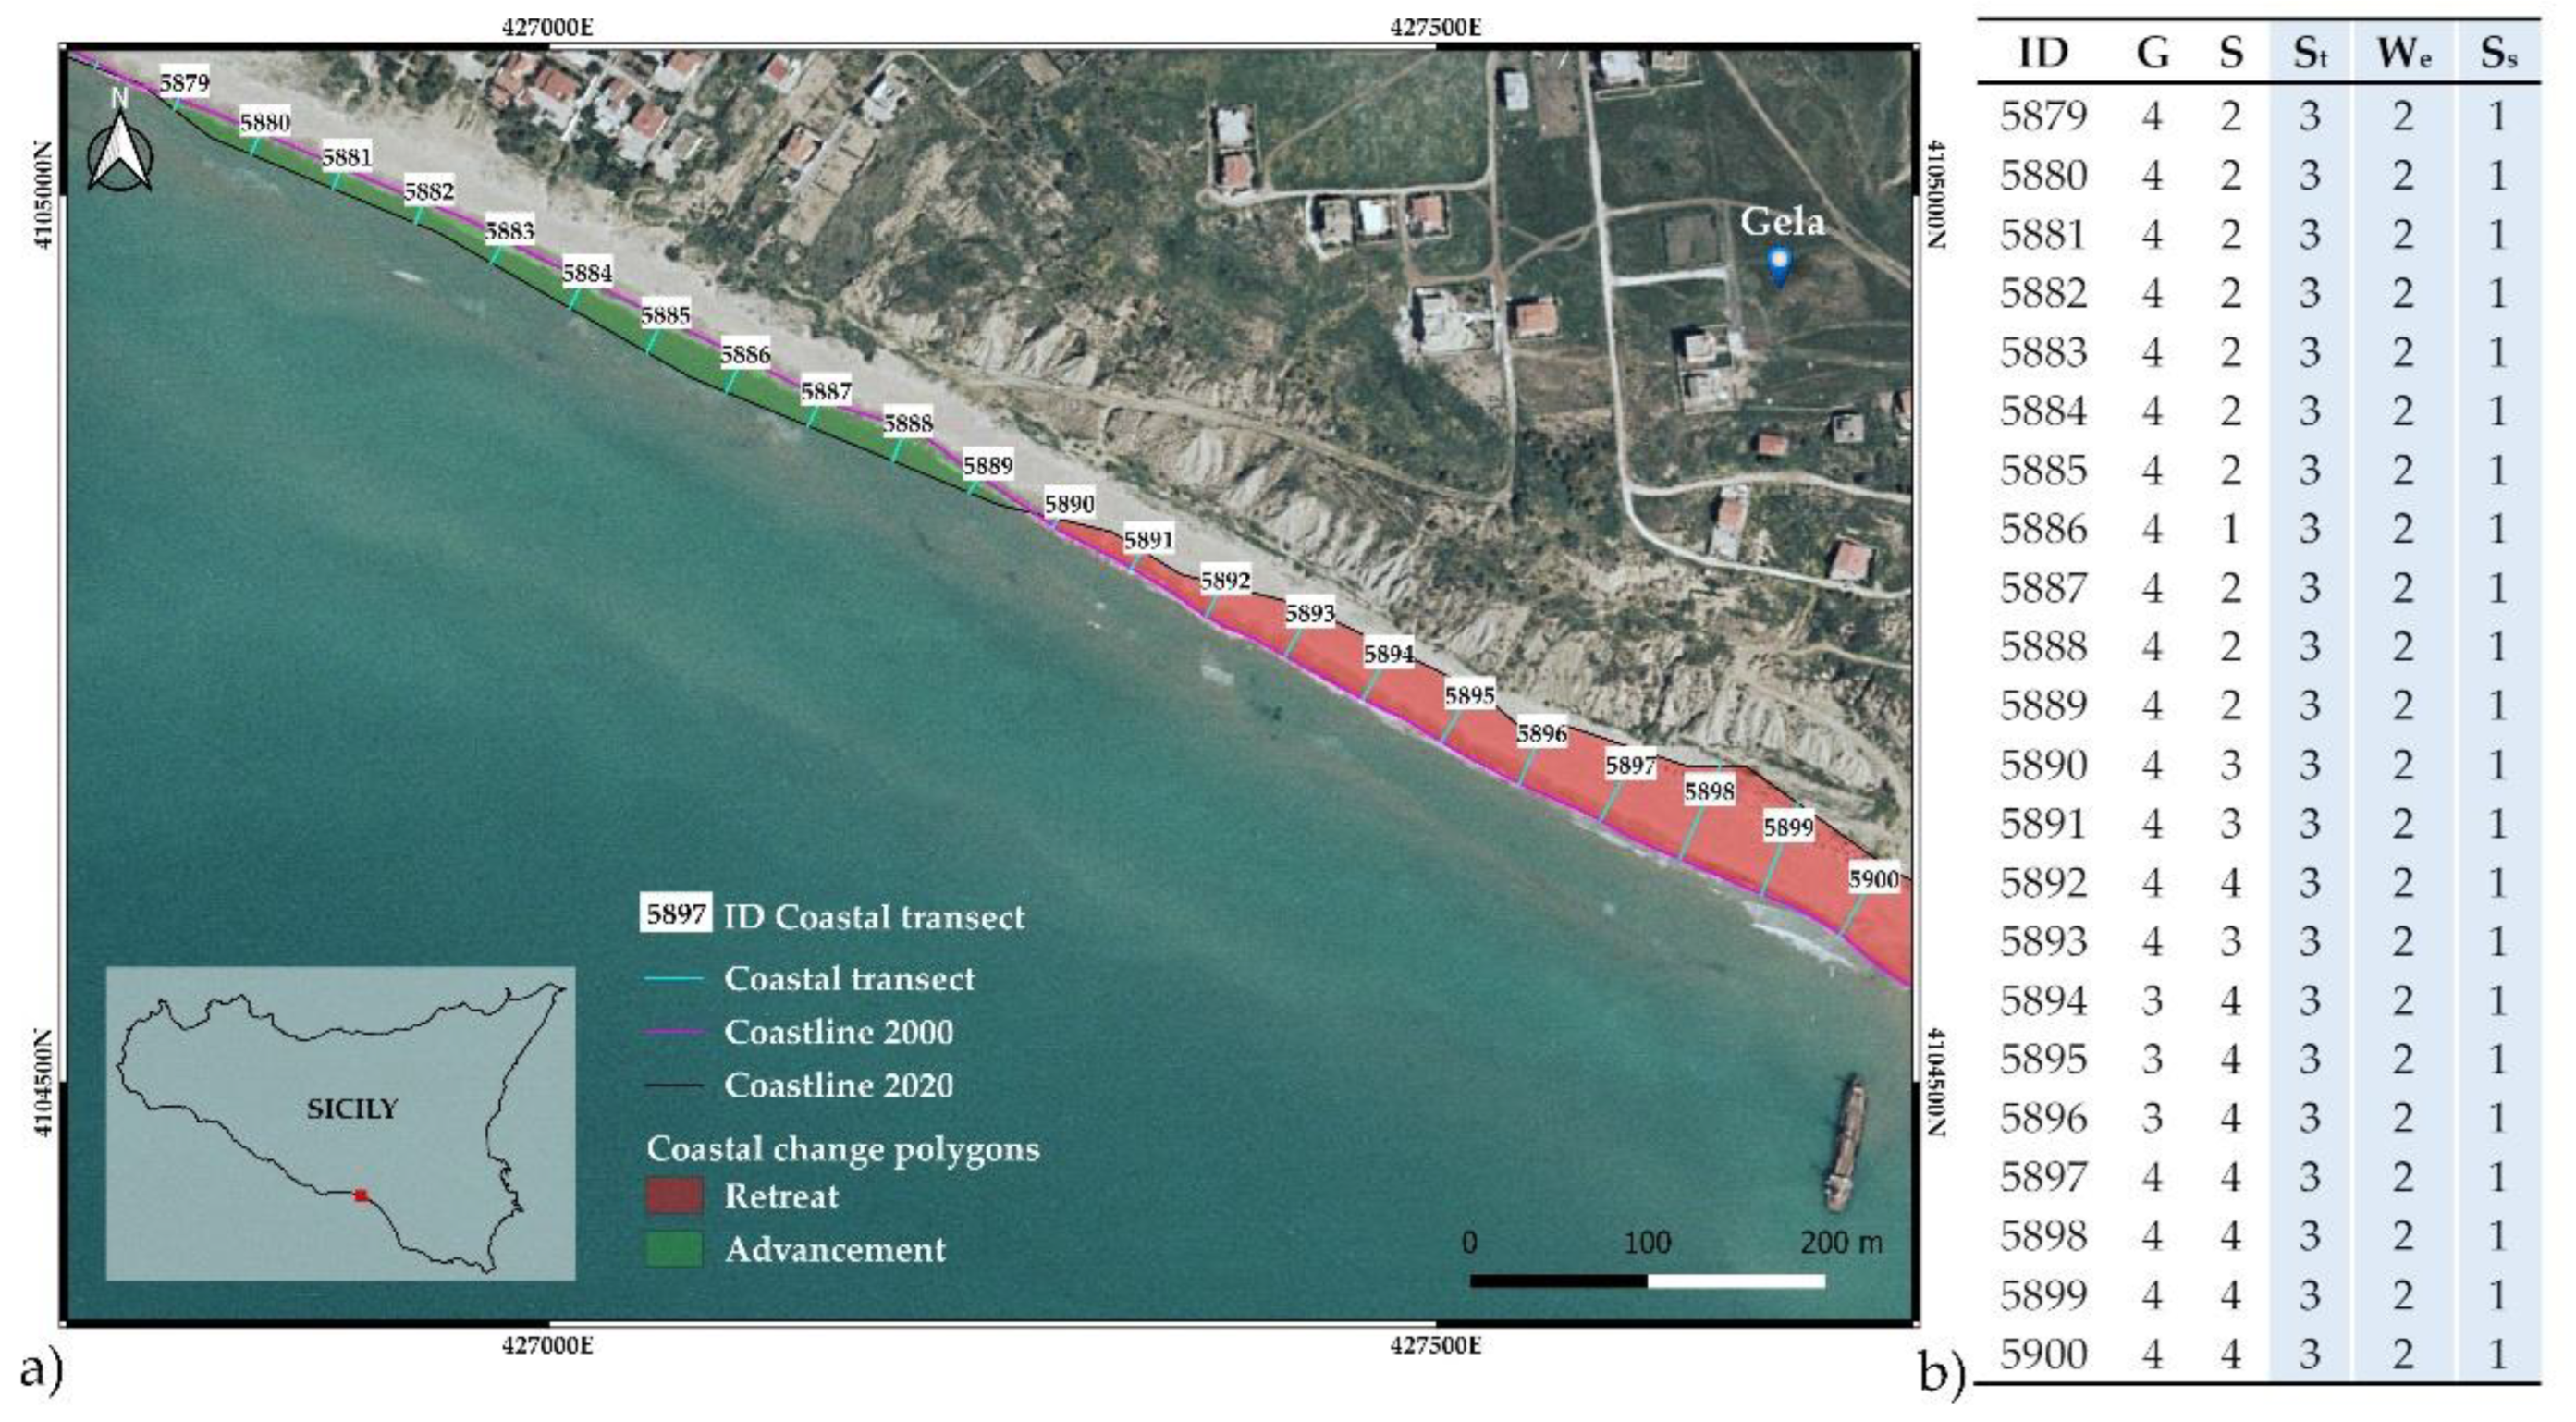
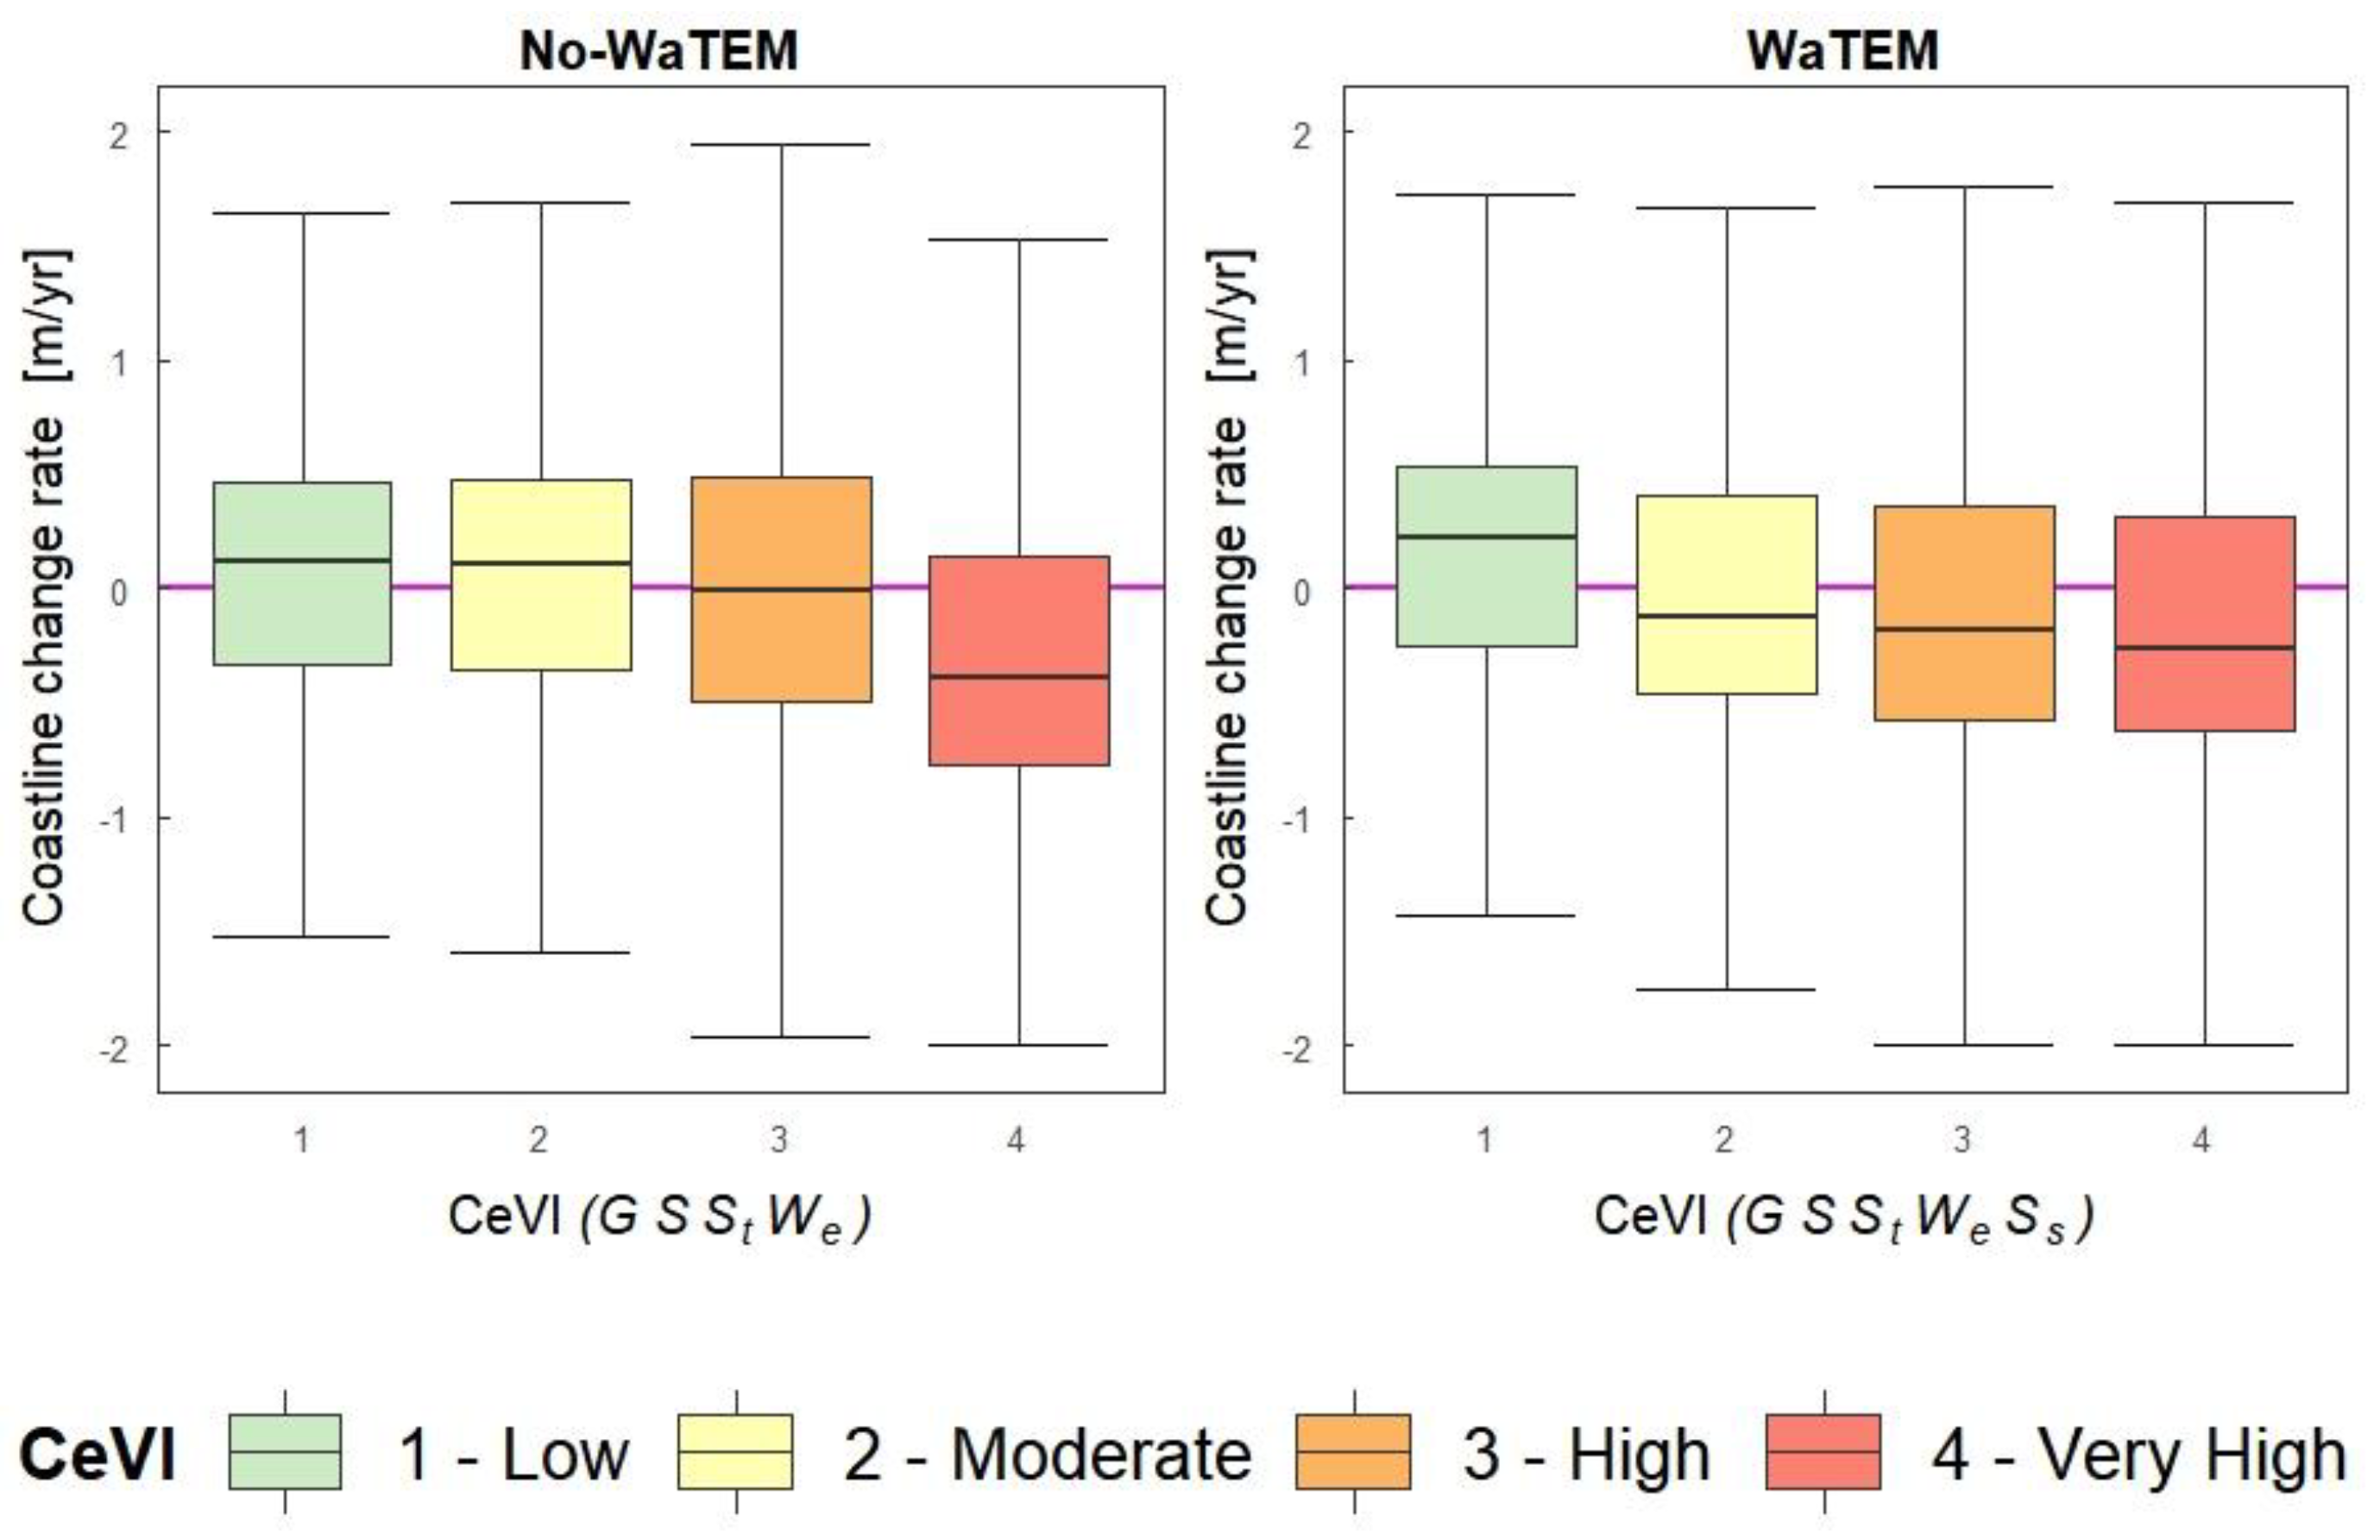
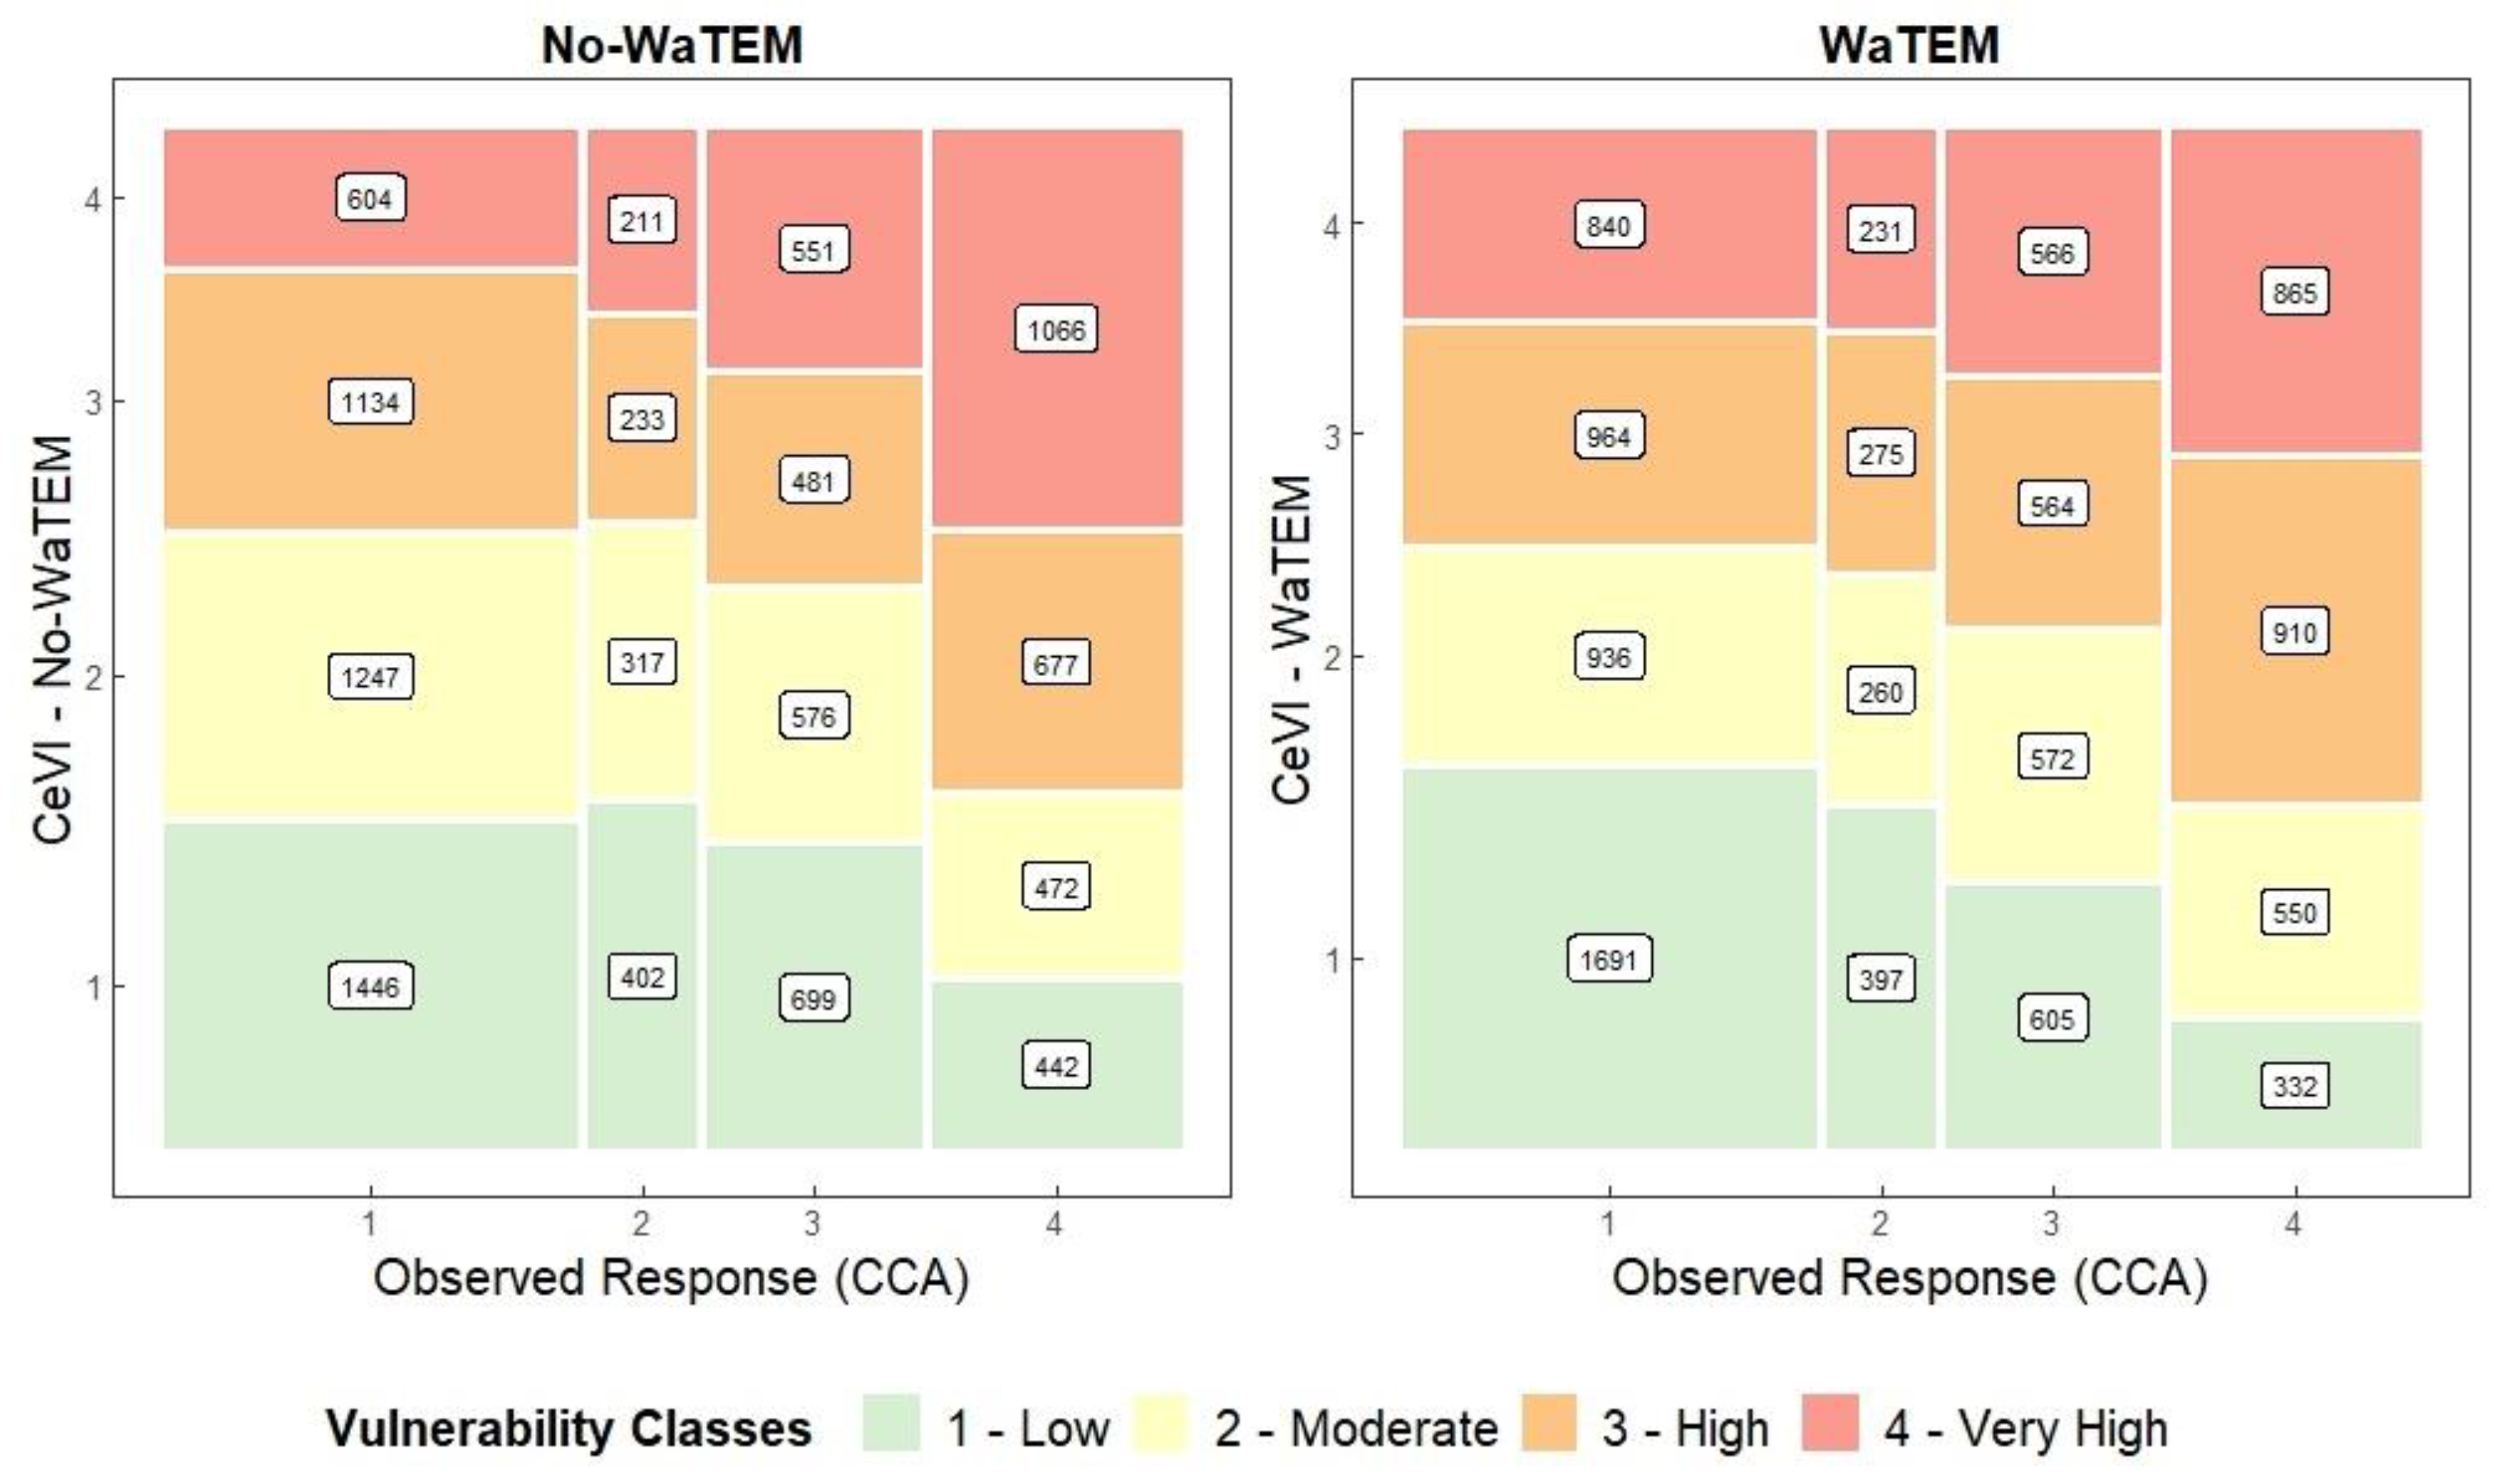
3.3.2. CCA and CeVI Comparison

To calculate the response value in terms of retreat or advance (meters), the coastal transects were intersected with polygons obtained from the CCA, and the coastline change rate (CCA—m/y) was derived as positive or negative values indicating accretion or erosion rates.
Then, the historical coastline evolution data were classified as low, medium, high, and very high vulnerability (Table 4). The threshold for class 4 was selected as corresponding to the first quartile of retreat, whilst classes 1 to 3 were split considering the estimated error of 0.150 (3 m/20 years) that we assumed in the estimation of the coastline change rate.
A validation procedure of the overall CeVI values was applied to compare the vulnerability values of the coastline variation (CCA) and the overall CeVI values; this comparison provides a qualitative and relative assessment of the CeVI procedure effectiveness. Theoretically, transects with a high vulnerability class for coastline variation should have a high CeVI class and transects with a low vulnerability class for coastline variation should correspond to a low CeVI class.

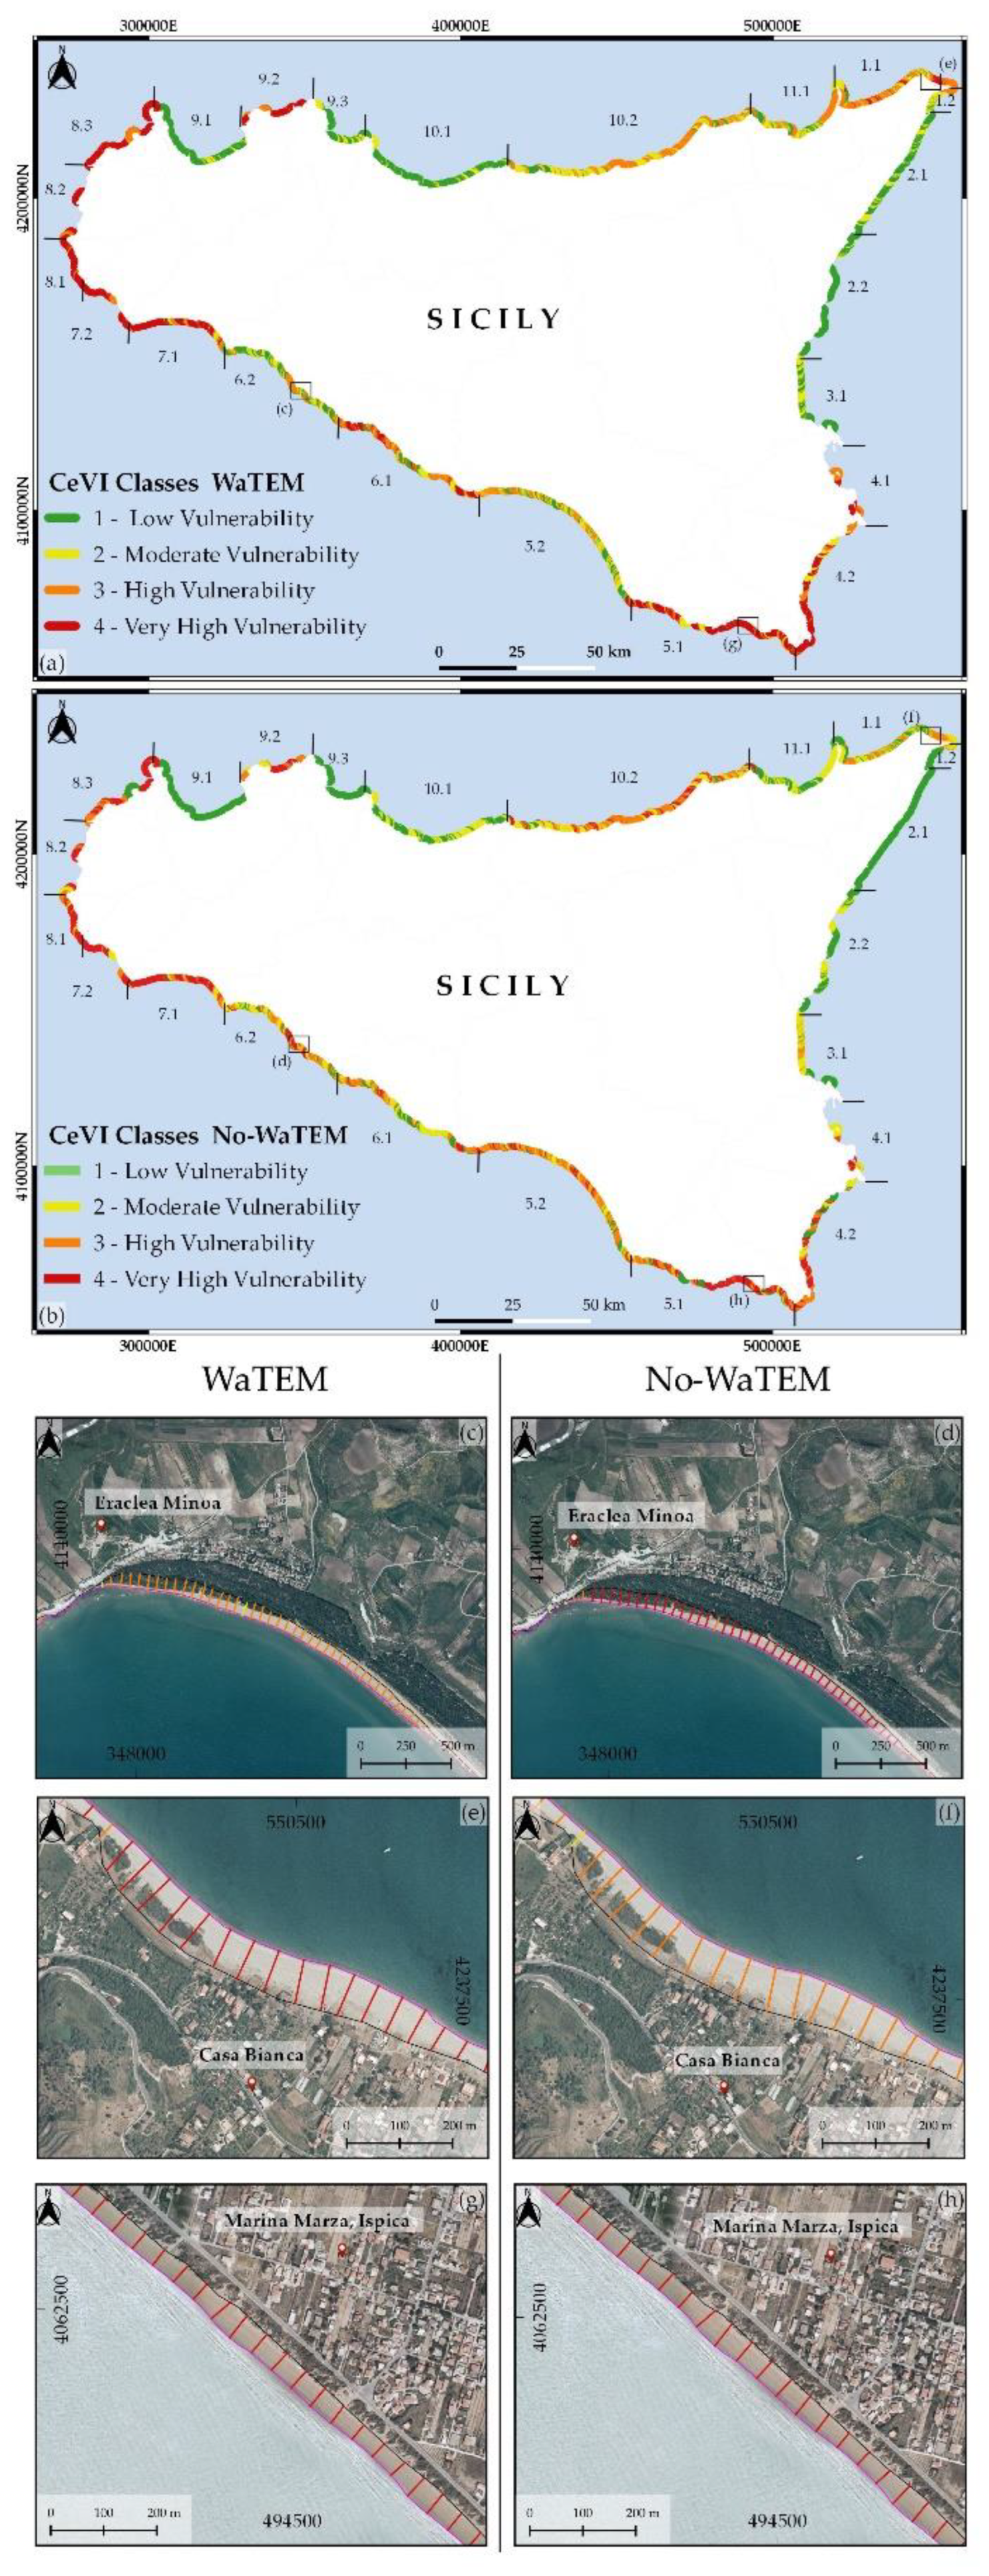
4. Results and Discussion

The graphs obtained from the results of the WaTEM and No-WaTEM models are shown in Figure 6, where the classes of CeVI and the coastal change rate expressed in m/year are plotted. The boxplots show the distribution of coastline change rate measured along the transects (m/year) for the four CeVI classes and the magenta line refers to the reference coastline. For this reason, a median above the magenta line suggests coastal advancement, whereas a median below the magenta line indicates coastal retreat. The whiskers of the boxplots, for each class, represent the variability of the transects for each class.
In both the adopted models (No-WaTEM and WaTEM), a gradual shift towards coastline retreat was recorded by moving from low to high vulnerability. In particular, the No-WaTEM and WaTEM models discriminate classes 1 to 3 from class 4 (p value < 2e-16), and class 1 from classes 2 to 4 (p value < 2e-16), respectively. At the same time, a similar behavior arises employing the reclassified CCA classification according to Table 4. Figure 7 shows the coupling among the four different classes of CeVI and CCA, reported by counts.
Specific considerations for each LC can be done when looking at the maps of both approaches (Figure 8).
The erosion vulnerability map obtained by WaTEM model shows low-vulnerability coastal units in the central Tyrrhenian coastal sector (10.1 LC) and in the central (3.1 LC) and northern Ionian coastal sector (2.2 and 2.1 LCs). However, in the 2.1 and 3.0 LCs, there are coastal stretches with moderate vulnerability (class 2). High-vulnerability coastal areas are located on the eastern Tyrrhenian side, including littoral cells 10.2, 11.1 and 1.1. Moreover, small coastal stretches are also found in 5.2 LC. The Sicilian coasts with very high vulnerability fall in the south-eastern side of the central Mediterranean sector (5.1 and 4.2 LCs) and on the opposite side in the western sector, including the 7.1, 7.2, 8.1, 8.2 and 8.3 LCs.
Figure 8b shows the vulnerability erosion map obtained by the No-WaTEM model, with the difference compared to the map shown in Figure 8a.
In the Tyrrhenian sector, the vulnerability class in LC 10.2 increases from class 3 for the WaTEM model to class 4. This is explained because the WaTEM model assesses high sediment supply (Ss = 1). In this way, the CeVI value decreased from 4 to 3. Another case in the Tyrrhenian sector is LC 1.1, where low sediment supply (Ss = 3) produces an increase in the CeVI value corresponding to high erosion vulnerability.
In the Central Mediterranean sector, in LC 5.2, it is possible to observe an increasing (of one class, e.g., from 2 to 3) trend of the CeVI values. In this case, the WaTEM model suggests low vulnerability.
On the southern Ionian coast (LC 3.1), the vulnerability index increases from 2 to 3. In this case, using the WaTEM model, the CeVI vulnerability values are lower. The subplots from Fig 8c to Fig 8h show a magnification of some representative coastal stretches. Eraclea Minoa beach has a logarithmic spiral shape, and during recent years, it was struck by erosion phenomena [43]. This dissipative beach is located far from defense structures and harbors, and for this reason the longitudinal sediment transport is not influenced. Nevertheless, the sediment supply load provided by the Platani river (at the northern part of the beach) is not sufficient to guarantee the sediment balance. This logarithmic spiral beach is characterized by intense wave diffraction causing high sediment transport effects. Considering the WaTEM model (Figure 8c), this beach has a high vulnerability (class 3), and this is due to the values of the indicators (e.g., S = 4; Ss = 1, St = 3; We = 2 and G = 4). With the No-WaTEM approach (Figure 8d), the class vulnerability increases.
Casa Bianca beach (Messina) (Figure 8e) is a dissipative sandy beach between two headlands, and it is about 1.5 km long and about 22 m wide. The very high vulnerability values observed in this beach can be caused by a combination of two effects—the high mean values of longitudinal sediment transport and the low sediment load from the catchment areas. The WaTEM model (Figure 8e) shows very high vulnerability (class 4) obtained by indicators such as S = 4; Ss = 3, St = 2; We = 2 and G = 2. The No-WaTEM model decreases the vulnerability index from class 4 to class 3 (Figure 8f).
Another case of very high coastal vulnerability is located on the rectilinear and dissipative sandy beach of Ispica (Ragusa) (Figure 8g). This beach is part of Pozzallo Gulf, where, on the north-western side, there is the Pozzallo harbor, which could trap longitudinal sediment transport. Additionally, in this case, the vulnerability values can be related to littoral currents and low sediment supply from rivers. The WaTEM model (Figure 8g) indicates very high vulnerability (class 4) obtained by indicators such as S = 4; Ss = 3, St = 2; We = 2 and G = 2. The No-WaTEM approach (Figure 8h) decreases the vulnerability index from class 4 to class 3. The results of the validation provide a qualitative and relative assessment of the CeVI procedure’s effectiveness. The obtained validation results seem to confirm that the CeVI approach is suitable for estimating coastal erosion vulnerability on a regional scale. As expected, a loss in resolution power between the four vulnerability classes was observed for the intermediate classes (2 and 3), which that suggests better results could be achieved by using higher-resolution source layers or by exploiting a larger coastal change validation signal. However, the aim of this research was to test if by simply downloading and processing already available data (each one with its source resolution) a useful model could have been obtained. In this sense, the clear discrimination, down to a validation step, between the extreme classes (1 and 4) can be considered a point of strength for the method.
As regards the role of sedimental supply, a very puzzling scenario arose for the Sicilian coastline in the validation period. In fact, the WaTEM model highlighted some cases where the coast is retreating, but the sediment supply is significant. This can be explained in two ways: (a) the sediment supply is lost because the coastal dynamics transport it away beyond the closure depth; (b) the assessed sediment does not reach the river mouth because natural and/or anthropic features (dams, lakes, etc.) trap the sediment transport. This second hypothesis is linked to the WaTEM’s characteristics, in that it computes the sediment transport in hillslopes and rivers without considering erosion/deposition phenomena, which can trap the sediment eroded in the catchment in its routing to the river mouth, such as dams, lakes or transversal river structures. The comparison between No-WaTEM and WaTEM models poses limits in those areas characterized by natural and/or anthropogenic sediment interruptions to the hydrographic connectivity.

5. Conclusions

This research shows a new approach to the regional assessment of coastal erosion vulnerability. In particular, a new approach named CeVI was used which considers different physical variables including morphological and hydraulic effects. The result of this approach is a new map of the coastal erosion vulnerability of Sicily.
Differing from the approaches adopted in the literature which include coastal changes among the vulnerability factors, in the proposed method, coastal changes are conceptually moved to the validation of a vulnerability model which is totally dependent on factors related either to the forcing and the resilience of the coastal areas.
According to the regional scale which was assumed in this research, the insights into the general picture of the coastal vulnerability conditions raise some basic research issues, including: the role of the morpho-dynamic connectivity both from the catchment to the river mouth (for sediment supply) and from adjacent littoral cells; the need for a higher-resolution database for characterizing the sea weather conditions; and the need for an accurate database of natural/anthropic sediment traps. To this end, the regional map which was obtained seems to be reliable and suitable for indicating those specific areas where more detailed modelling is required.

Author Contributions

Conceptualization, G.M., G.A., C.L.R., G.C. and E.R.; methodology, G.M., G.A., C.L.R., and E.R.; morphological models, C.M., G.A. and E.R.; hydraulic models, C.L.R. and M.B.; validation, G.A., C.M., E.R.; formal analysis G.M., G.A., C.L.R., C.M., M.B., E.R. and G.C.; data curation, G.M., G.A., C.L.R., C.M. and M.B.; writing—original draft preparation, G.M., G.A., C.L.R. and E.R.; writing—review and editing, G.M., G.A., C.L.R. and E.R.; visualization, G.M., G.A., C.L.R. and E.R., supervision, E.R., G.C, and G.M. All authors have read and agreed to the published version of the manuscript.

Funding

This research received no external funding.

Institutional Review Board Statement

Not applicable.

Informed Consent Statement

Not applicable.

Data Availability Statement

Data sharing is not applicable to this article.

Conflicts of Interest

The authors declare no conflict of interest.

References

  1. Masson-Delmotte, V.; Zhai, P.; Pirani, A.; Connors, S.L.; Péan, C.; Berger, S.; Caud, N.; Chen, Y.; Goldfarb, L.; Gomis, M.I.; et al. Climate Change 2021: The Physical Science Basis; Contribution of Working Group I to the Sixth Assessment Report of the Intergovernmental Panel on Climate Change; IPCC: London, UK; New York, NY, USA, 2021; p. 2391.
  2. Seneviratne, S.I.; Zhang, X.; Adnan, M.; Badi, W.; Dereczynski, C.; Di Luca, A.; Ghosh, S.; Iskandar, I.; Kossin, S.; Lewis, S.; et al. Weather and Climate Extreme Events in a Changing Climate. In Climate Change 2021: The Physical Science Basis; Contribution of Working Group I to the Sixth Assessment Report of the Intergovernmental Panel on Climate Change; IPCC: London, UK; New York, NY, USA, 2021; pp. 1513–1766. [Google Scholar]
  3. Masselink, G.; Russell, P. Impacts of Climate Change on Coastal Erosion. MCCIP Sci. Rev. 2013, 2013, 71–86. [Google Scholar] [CrossRef]
  4. Bird, E.C.F. Coastal Geomorphology: An Introduction, 2nd ed.; John Wiley & Sons: Chichester, UK; Hoboken, NJ, USA, 2008; ISBN 978-0-470-51729-1. [Google Scholar]
  5. Shroder, J.F.; Ellis, J.T.; Sherman, D.J. Coastal and Marine Hazards, Risks, and Disasters, 1st ed.; Hazards and Disasters Series; Elsevier: Waltham, MA, USA, 2015; ISBN 978-0-12-396483-0. [Google Scholar]
  6. Mortimore, R.N.; Duperret, A. (Eds.) Coastal Chalk Cliff Instability; Geological Society Engineering Geology Special Publication; Geological Society of London: London, UK, 2004; ISBN 978-1-86239-150-5. [Google Scholar]
  7. Dean, R.G.; Dalrymple, R.A. Coastal Processes: With Engineering Applications; Cambridge University Press: Cambridge, UK; New York, NY, USA, 2002; ISBN 978-0-521-49535-6. [Google Scholar]
  8. Maanan, M.; Robin, M. (Eds.) Sediment Fluxes in Coastal Areas; Springer: Dordrecht, The Netherlands, 2015; ISBN 978-94-017-9259-2. [Google Scholar]
  9. Ružić, I.; Jovančević, S.D.; Benac, Č.; Krvavica, N. Assessment of the Coastal Vulnerability Index in an Area of Complex Geological Conditions on the Krk Island, Northeast Adriatic Sea. Geosciences 2019, 9, 219. [Google Scholar] [CrossRef] [Green Version]
  10. European Commission. Towards a European Integrated Coastal Zone Management (ICZM) Strategy: General Principles and Policy Options: A Reflection Paper; Office for Official Publications of the European Communities: Luxembourg; Bernan Associates: Lanham, MD, USA, 1999; ISBN 978-92-828-6463-0.
  11. European Environment Agency. Climate Change, Impacts and Vulnerability in Europe 2016: An Indicator Based Report; Publications Official of the European Union: Luxembourg, 2017.
  12. Anfuso, G.; Del Pozo, J.Á.M. Assessment of Coastal Vulnerability Through the Use of GIS Tools in South Sicily (Italy). Environ. Manag. 2009, 43, 533–545. [Google Scholar] [CrossRef] [PubMed] [Green Version]
  13. Pranzini, E.; Wetzel, L.; Williams, A.T. Aspects of Coastal Erosion and Protection in Europe. J. Coast. Conserv. 2015, 19, 445–459. [Google Scholar] [CrossRef]
  14. Koroglu, A.; Ranasinghe, R.; Jiménez, J.A.; Dastgheib, A. Comparison of Coastal Vulnerability Index Applications for Barcelona Province. Ocean Coast. Manag. 2019, 178, 104799. [Google Scholar] [CrossRef]
  15. Williams, A.T.; Micallef, A. Beach Management: Principles and Practice; Earthscan: London, UK; Sterling, VA, USA, 2009; ISBN 978-1-84407-435-8. [Google Scholar]
  16. Kron, W. Flood Risk = Hazard • Values • Vulnerability. Water Int. 2005, 30, 58–68. [Google Scholar] [CrossRef]
  17. Merlotto, A.; Bértola, G.R.; Piccolo, M.C. Hazard, Vulnerability and Coastal Erosion Risk Assessment in Necochea Municipality, Buenos Aires Province, Argentina. J. Coast. Conserv. 2016, 20, 351–362. [Google Scholar] [CrossRef]
  18. Lim, C.; Kim, T.K.; Lee, S.; Yeon, Y.J.; Lee, J.L. Assessment of Potential Beach Erosion Risk and Impact of Coastal Zone Development: A Case Study on Bongpo–Cheonjin Beach. Nat. Hazards Earth Syst. Sci. 2021, 21, 3827–3842. [Google Scholar] [CrossRef]
  19. Lo Re, C.; Manno, G.; Ciraolo, G. Tsunami Propagation and Flooding in Sicilian Coastal Areas by Means of a Weakly Dispersive Boussinesq Model. Water 2020, 12, 1448. [Google Scholar] [CrossRef]
  20. Lo Re, C.; Manno, G.; Basile, M.; Ferrotto, M.F.; Cavaleri, L.; Ciraolo, G. Tsunami Vulnerability Evaluation for a Small Ancient Village on Eastern Sicily Coast. J. Mar. Sci. Eng. 2022, 10, 268. [Google Scholar] [CrossRef]
  21. Gornitz, V. Global coastal hazards from future sea level rise. Palaeogeogr. Palaeoclimatol. Palaeoecol. 1991, 89, 379–398. [Google Scholar] [CrossRef]
  22. Shaw, J.; Taylor, R.B.; Forbes, D.L.; Ruz, M.H.; Solomon, S. Sensitivity of the Coasts of Canada to Sea-Level Rise; Geological Survey of Canada: Ottawa, ON, Canada, 1998; p. 505. [Google Scholar]
  23. Thieler, R. Open-File Report; U.S. Department of the Interior: Washington, DC, USA, 2000.
  24. Gornitz, V.; Kanciruk, P. Assessment of Global Coastal Hazards from Sea Level Rise; Oak Ridge National Laboratory: Oak Ridge, TN, USA, 1989. [Google Scholar]
  25. Ramieri, E.; Hartley, A.; Barbanti, A.; Santos, F.D.; Gomes, A.; Hilden, M.; Laihonen, P.; Marinova, N.; Santini, M. Methods for Assessing Coastal Vulnerability to Climate Change; ETC CCA Technical Paper; European Topic Centre on Climate Change Impacts, Vulnerability and Adaptation: Bologna, Italy, 2011. [Google Scholar]
  26. Armaroli, C.; Duo, E. Validation of the Coastal Storm Risk Assessment Framework along the Emilia-Romagna Coast. Coast. Eng. 2018, 134, 159–167. [Google Scholar] [CrossRef] [Green Version]
  27. Tapsell, S.M.; Penning-Rowsell, E.C.; Tunstall, S.M.; Wilson, T.L. Vulnerability to Flooding: Health and Social Dimensions. Philos. Trans. R. Soc. Lond. Ser. A Math. Phys. Eng. Sci. 2002, 360, 1511–1525. [Google Scholar] [CrossRef] [PubMed]
  28. Bruun, P. Sea-Level Rise as a Cause of Shore Erosion. J. Waterw. Harb. Div. 1962, 88, 117–130. [Google Scholar] [CrossRef]
  29. IPCC. IPCC Technical Guidelines for Assesing Climate Change Impacts and Adaptations; Carter, T.R., Ed.; Department of Geography, University College London: London, UK; Center for Global Environmental Research, National Institute for Environmental Studies: Tsukuba, Japan, 1995; ISBN 978-0-904813-11-1.
  30. Dolan, H.D.; Walker, J. Understanding Vulnerability of Coastal Communities to Climate Change Related Risks. J. Coast. Res. 2006, 3, 1316–1323. [Google Scholar]
  31. Gornitz, V.M.; Daniels, R.C.; White, T.W.; Birdwell, K.R. The Development of a Coastal Risk Assessment Database: Vulnerability to Sea-Level Rise in the US Southeast. J. Coast. Res. 1994, SI-12, 327–338. [Google Scholar]
  32. Nicholls, R.J.; Tol RS, J.; de la Vega-Leinert, A.C. SURVAS Expert Workshop on European Vulnerability and Adaptation to Impacts of Accelerated Sea-Level Rise (ASLR). In Proceedings of the Potential Accelerated Sea-Level Rise (ASLR) Impacts: A SURVAS Guide through Vulnerability Assessment Methodologies and Tools, University of Hamburg, FHRC, Middlesex University, Hamburg, Germany, 19 June 2000. [Google Scholar]
  33. Di Paola, G.; Iglesias, J.; Rodríguez, G.; Benassai, G.; Aucelli, P.; Pappone, G. Estimating Coastal Vulnerability in a Meso-Tidal Beach by Means of Quantitative and Semi-Quantitative Methodologies. J. Coast. Res. 2011, 61, 303–308. [Google Scholar] [CrossRef]
  34. Mclaughlin, S.; Cooper, J.A.G. A Multi-Scale Coastal Vulnerability Index: A Tool for Coastal Managers? Environ. Hazards 2010, 9, 233–248. [Google Scholar] [CrossRef]
  35. López Royo, M.; Ranasinghe, R.; Jiménez, J.A. A Rapid, Low-Cost Approach to Coastal Vulnerability Assessment at a National Level. J. Coast. Res. 2016, 320, 932–945. [Google Scholar] [CrossRef]
  36. Furlan, E.; Pozza, P.D.; Michetti, M.; Torresan, S.; Critto, A.; Marcomini, A. Development of a Multi-Dimensional Coastal Vulnerability Index: Assessing Vulnerability to Inundation Scenarios in the Italian Coast. Sci. Total Environ. 2021, 772, 144650. [Google Scholar] [CrossRef]
  37. Parthasarathy, K.S.S.; Deka, P.C. Remote Sensing and GIS Application in Assessment of Coastal Vulnerability and Shoreline Changes: A Review. ISH J. Hydraul. Eng. 2021, 27, 588–600. [Google Scholar] [CrossRef]
  38. Thieler, E.R.; Hammar-Klose, E.S. National Assessment of Coastal Vulnerability to Sea-Level Rise: Preliminary Results for the U.S. Atlantic Coast; U.S. Geological Survey Open-File Report 99-593; U.S. Geological Survey: Woods Hole, MA, USA, 1999.
  39. Borrelli, P.; Van Oost, K.; Meusburger, K.; Alewell, C.; Lugato, E.; Panagos, P. A Step towards a Holistic Assessment of Soil Degradation in Europe: Coupling on-Site Erosion with Sediment Transfer and Carbon Fluxes. Environ. Res. 2018, 161, 291–298. [Google Scholar] [CrossRef] [PubMed]
  40. Boccotti, P. Idraulica Marittima; UTET: Torino, Italy, 2004; ISBN 978-88-7750-874-4. [Google Scholar]
  41. Boak, E.H.; Turner, I.L. Shoreline Definition and Detection: A Review. J. Coast. Res. 2005, 214, 688–703. [Google Scholar] [CrossRef] [Green Version]
  42. Smith, M.J.; Cromley, R.G. Measuring Historical Coastal Change Using GIS and the Change Polygon Approach: Measuring Historical Coastal Change. Trans. GIS 2012, 16, 3–15. [Google Scholar] [CrossRef]
  43. Manno, G.; Lo Re, C.; Basile, M.; Ciraolo, G. A New Shoreline Change Assessment Approach for Erosion Management Strategies. Ocean Coast. Manag. 2022, 225, 106226. [Google Scholar] [CrossRef]
Figure 1. Sicilian macro-coastal sectors divided into littoral cells of the second level. For each littoral cell, the first number identifies the first hierarchic order and the second number identifies the second hierarchic order. For example, LC 5.2 means a littoral cell of the second hierarchic order of number 2 belonging to the littoral cell of the first hierarchic order of number 5. (Reference System: WGS84-UTM33N-EPSG: 32633).
Jmse 11 00023 g001
Figure 2. Example of coastal transect generation (Littoral Cells 5.1). Black dashed lines show the transects neglected in CeVI assessment, while cyan lines mark those used to assess CeVI indicators. The red box on the south of Sicily represents the study area. The background image is the orthophoto “Volo IT2000” related to the year 2000. (Reference System RS: WGS84 UTM33N—EPSG: 32633).
Jmse 11 00023 g002
Figure 3. Flow chart related to the new method applied.
Jmse 11 00023 g003
Figure 4. A coastal stretch of the Sicilian southern sector from LC 5.2. The orthophoto image corresponds to the year 2002 (ISPRA). Subplot (a) shows the polygons and related transects named with an ID. Subplot (b) shows a table linked to the indicator values for each transect. The red box on the south of the isle of Sicily represents the study area. The background image is the orthophoto “Volo IT2000” related to the year 2000 (EPSG: 32633).
Jmse 11 00023 g004
Figure 5. Sicilian hydrograph catchments related littoral cells and relative CMEMS points (EPSG: 32633).
Jmse 11 00023 g005
Figure 6. Boxplot for No-WaTEM and WaTEM models. The first shows a median value decrement of the CCA values corresponding to the CeVI classes 3 e 4. The second shows a decrement median value of the CCA for all the CeVI classes.
Jmse 11 00023 g006
Figure 7. Mosaic plot of the CeVI (No-WaTEM and WaTEM models) and CCA (calculated by polygonal approach) classes. The colors green, yellow, orange, and red correspond, respectively, to the classes CeVI low (1), moderate (2), high (3) and very high (4). The size of each box is relative to the number of cases of coupling (reported also as number).
Jmse 11 00023 g007
Figure 8. The Sicilian coastal erosion vulnerability maps obtained by using, respectively, the WaTEM (subplot a) and the No-WaTEM (subplot b) models. (Subplots c,d) show the Eraclea Minoa beach (Trapani) vulnerability classes computed, respectively, with the WaTEM and No-WaTEM models. (Subplots e,f) show the Casa Bianca beach (Messina) vulnerability classes computed, respectively, with the WaTEM and No-WaTEM models. (Subplots g,h) show the Ispica beach (Ragusa) vulnerability classes computed, respectively, with the WaTEM and No-WaTEM models. The four vulnerability classes, from 1 (low vulnerability) to 4 (very high vulnerability), are depicted, respectively, by four colors: green, yellow, orange and red.
Jmse 11 00023 g008
Table 1. Data sources of the parameters used in CeVI assessment. (LC—Littoral Cells, CT—Coastal Transects).
Physical IndicatorsData
Type
Reprocessed
Data
Data
Source
Assessed
Using
Geomorphology and Geology (G)Shapefile-ISPRA (Italian Institute for Environmental Protection and Research)CT
Coastal slope (S)Raster fileDEM 2 × 2—SITR Regional Territorial Information System) CT
Sediment supply by river basins (Ss)Raster fileWaTEM/SEDEM—ESDAC (European Soil Data Centre) LC
Sea storms (St)NETCDF fileCMEMS (Copernicus Marine Environment Monitoring Service) LC
Average of annual maxima energy flux (We)NETCDF fileCMEMS (Copernicus Marine Environment Monitoring Service) LC
Table 2. Computed values of the sea state for each Sicilian macro sector.
Coastal SectorsLittoral
Cells
Sea Storms
(2000–2020)
P (kW/m)
Ionian1.21419.98
2.110350.65
2.216383.33
3.116884.17
4.1335119.41
4.2279101.20
Central
Mediterranean
5.150579.14
5.242176.12
6.146876.20
6.246072.60
7.160293.14
7.2661111.95
8.1658137.94
Tyrrhenian8.246490.01
8.3589143.83
9.118153.57
9.2518110.94
9.312643.65
10.122861.53
10.235590.39
11.120754.27
1.125068.32
Table 3. Coastal vulnerability ranges for each physical indicator. UM—Unit of Measurement.
Physical
Indicators
UMCoastal Erosion Vulnerability Index Ranking
1—Low2—Moderate3—High4—Very High
Geomorphology and Geology (G)nominalHigh rock cliffs, Coastal embankment with construction, Harbor areaLow rock cliffs, Artificial shoreline (walk, quay) without beaches, Coastal defense, Gravel beaches with bouldersGravel beaches, Estuaries, Sand beaches with bouldersSand beaches
Coastal slope (S)%>842< 2
Sediment supply by river basins (Ss) Mg ha · year <−1.3 × 10⁷−3.9 × 10⁶−1.7 × 10⁶>−1.7 × 10⁶
Sea storms (St)count<187.5345495> 495
Average of annual maxima energy flux (We) kW m <63.2381.2399.19>99.19
Table 4. Coastal erosion vulnerability classification.
Observed ResponseCoastal Erosion Vulnerability Classification
1—Low2—Moderate3—High4—Very High
CCA (m/year)>+0.150 ≤+0.150<−0.150<−0.510
Disclaimer/Publisher’s Note: The statements, opinions and data contained in all publications are solely those of the individual author(s) and contributor(s) and not of MDPI and/or the editor(s). MDPI and/or the editor(s) disclaim responsibility for any injury to people or property resulting from any ideas, methods, instructions or products referred to in the content.

