
Experimental Study of the Dynamic Performance of Steel Catenary Riser within the Touchdown Zone


Abstract
:1. Introduction
2. Development of Test Platform and Experimental Equipment
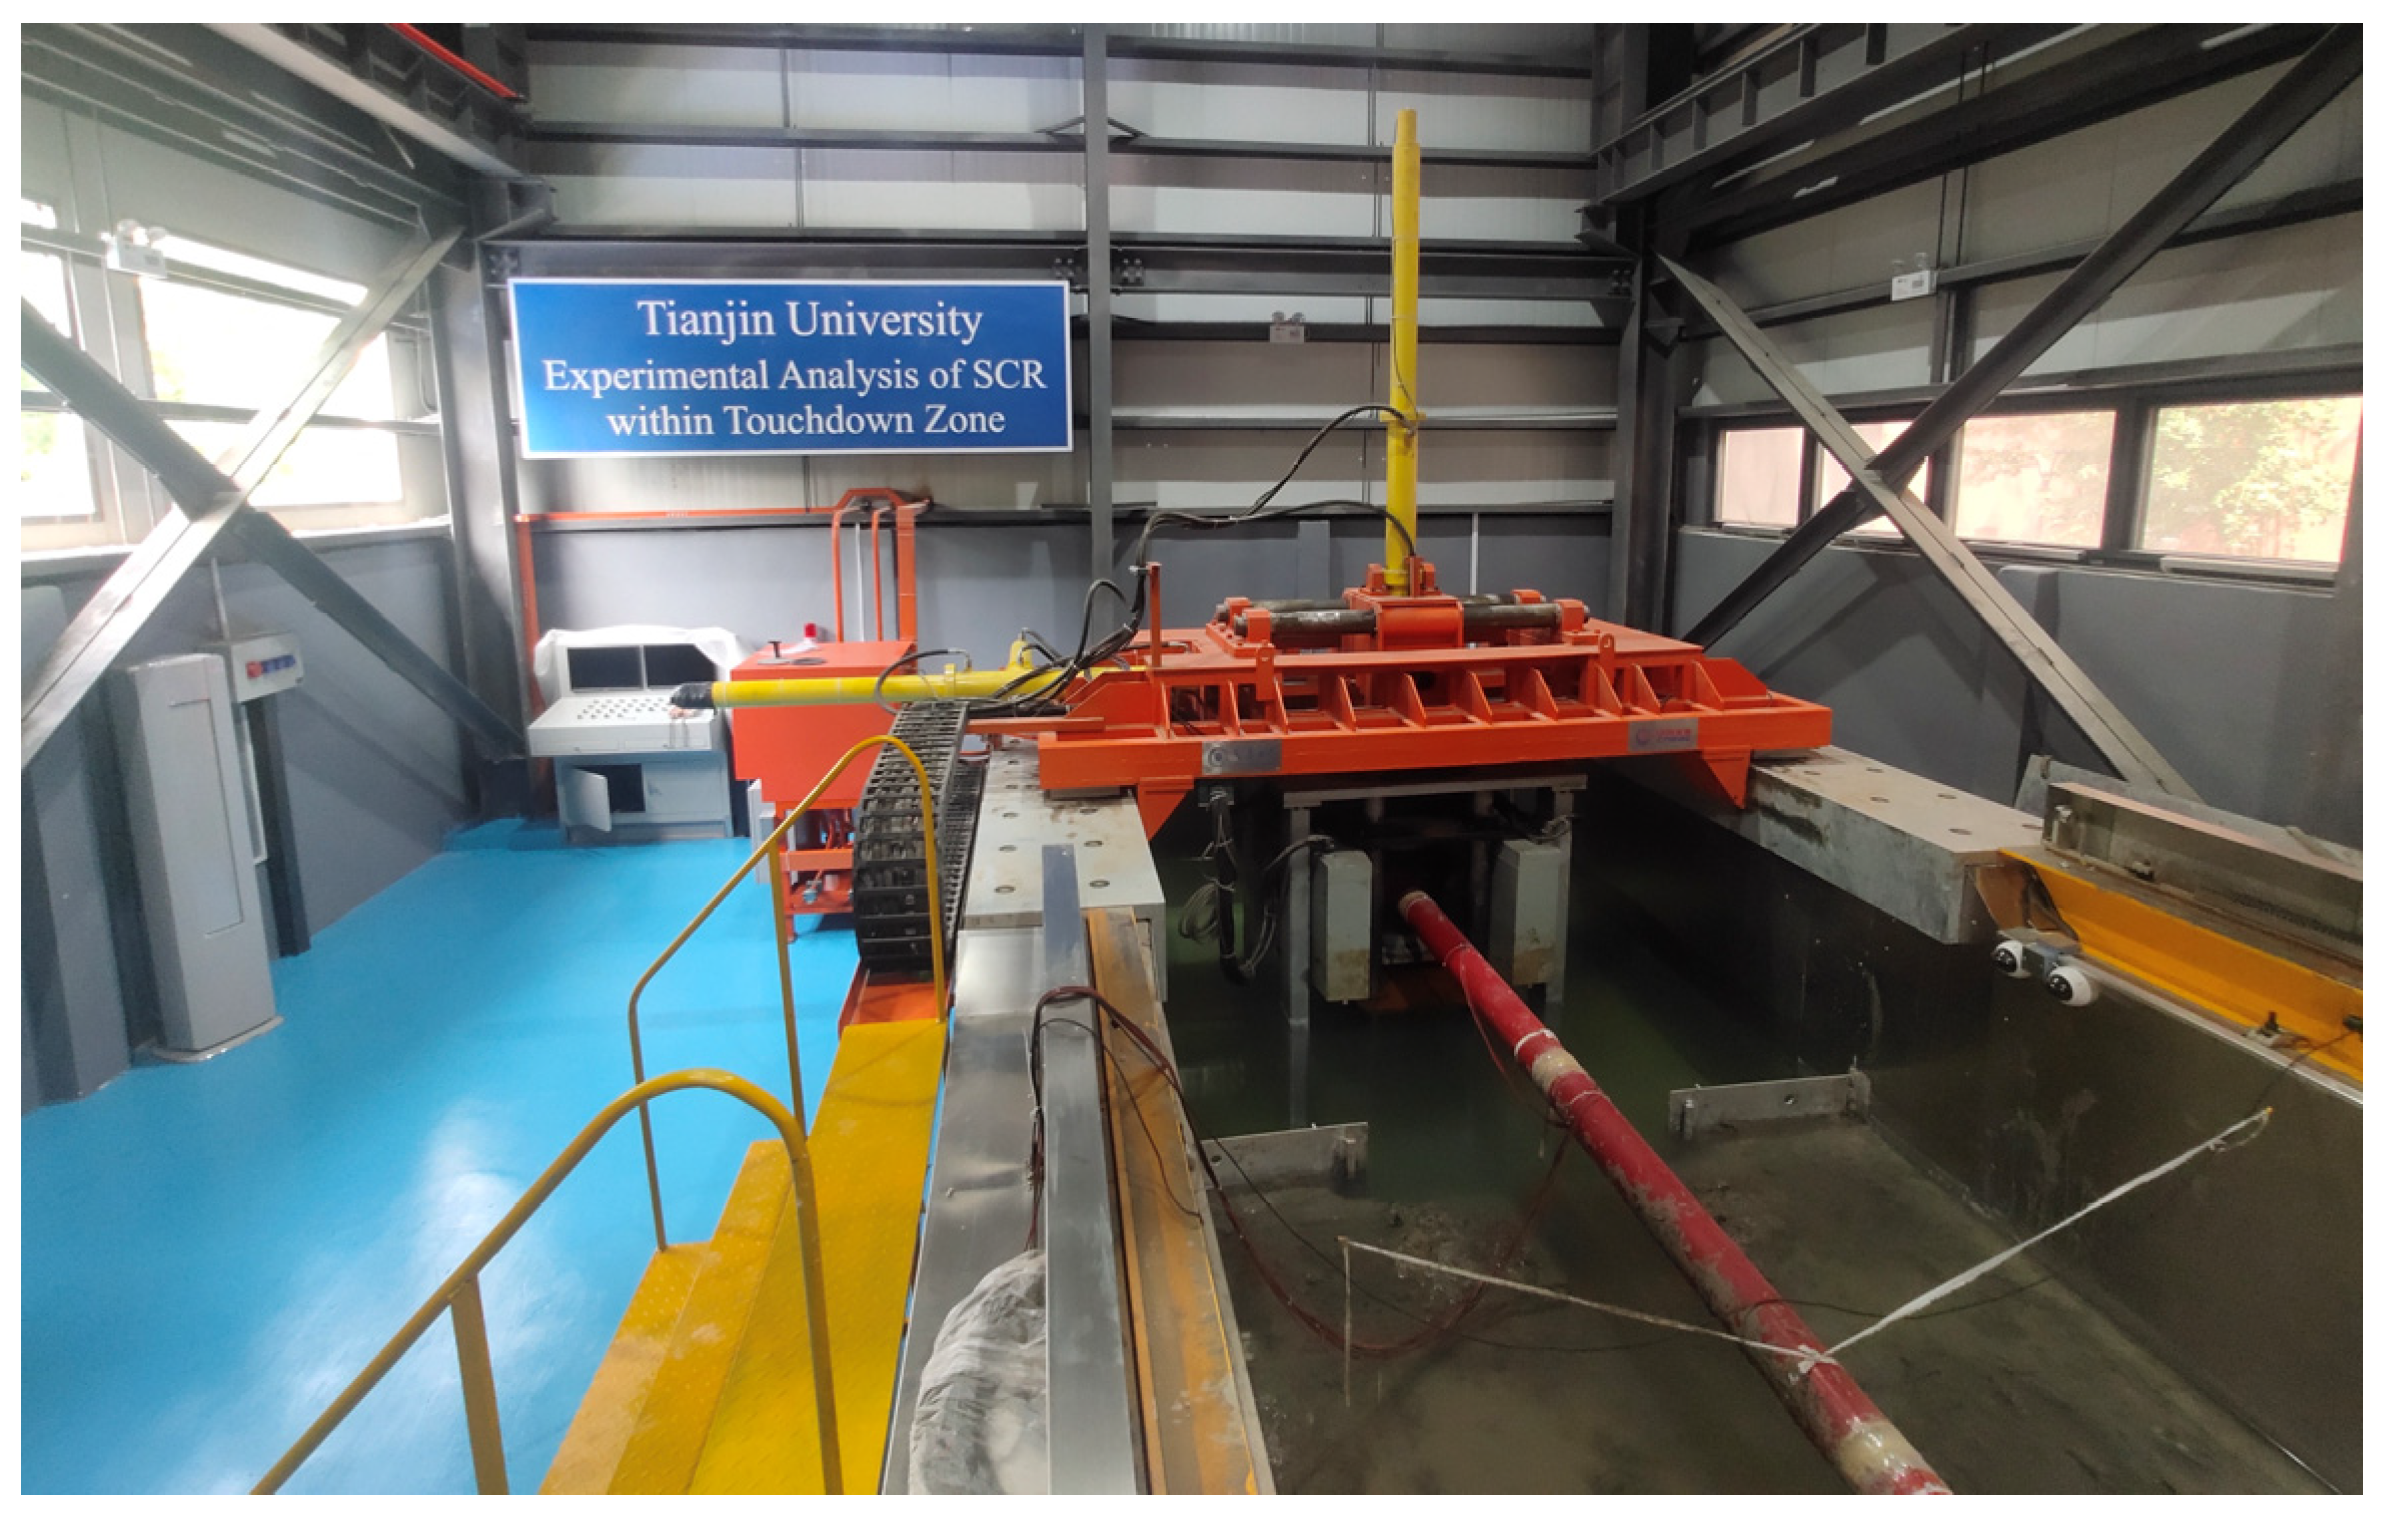
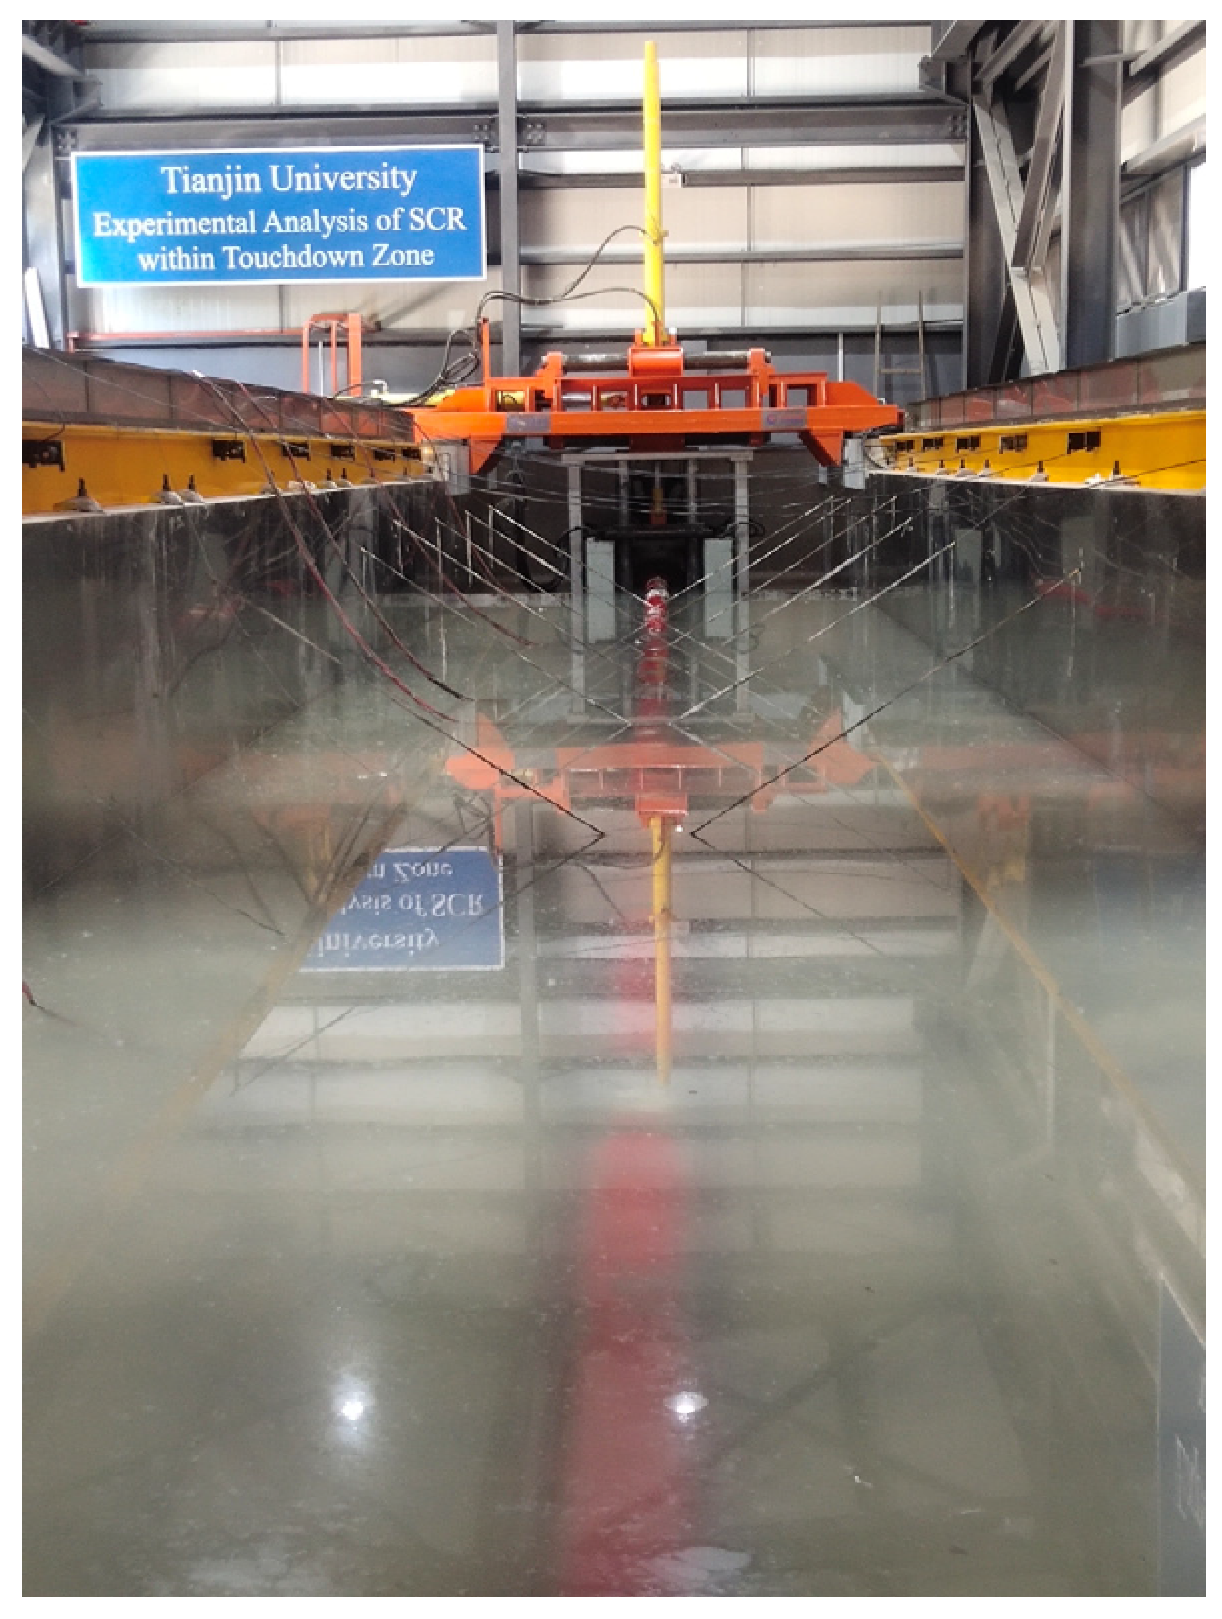
2.1. Layout of the Test Platform
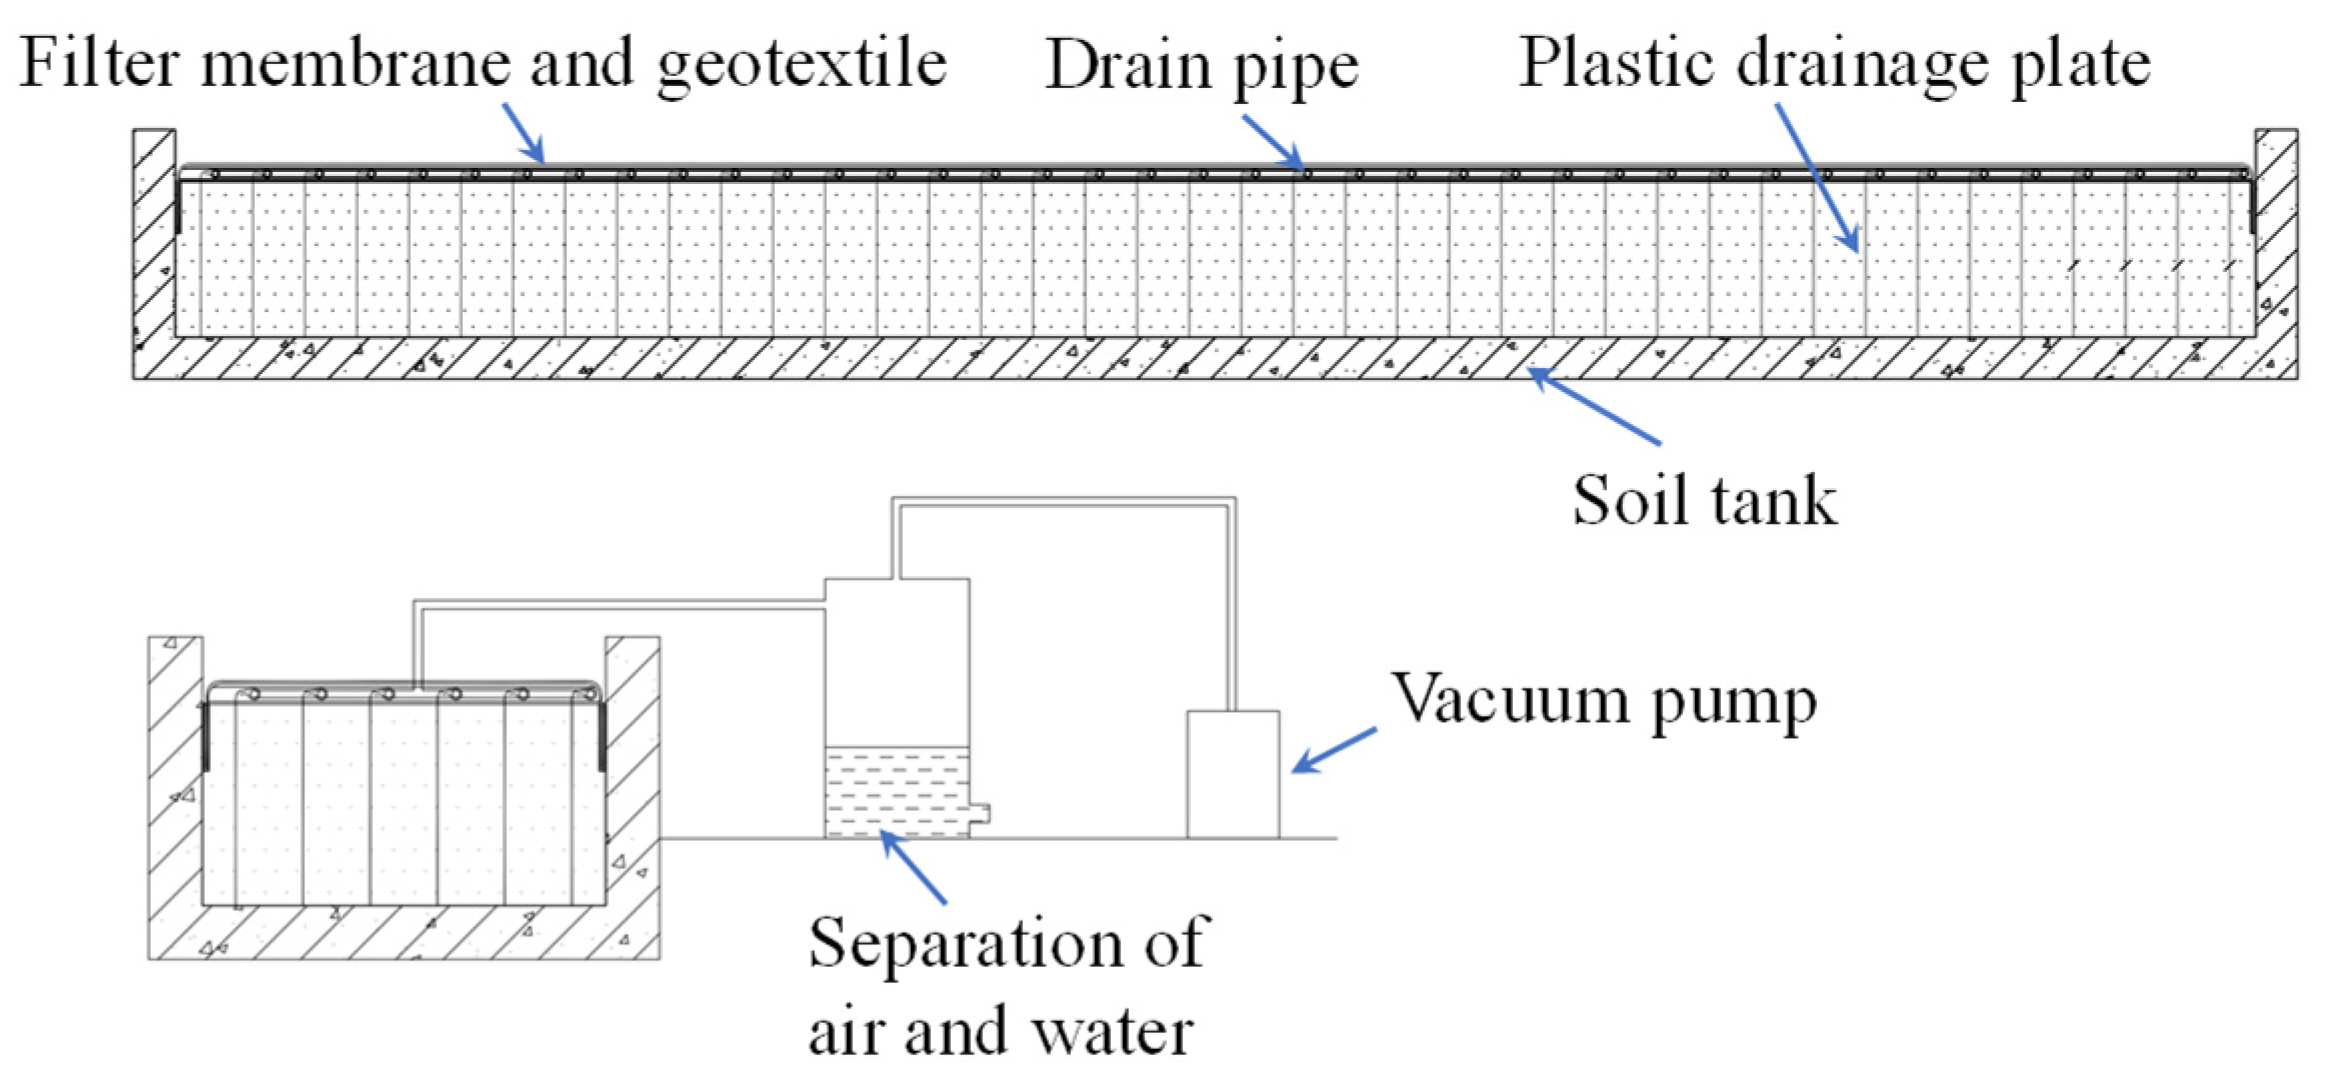
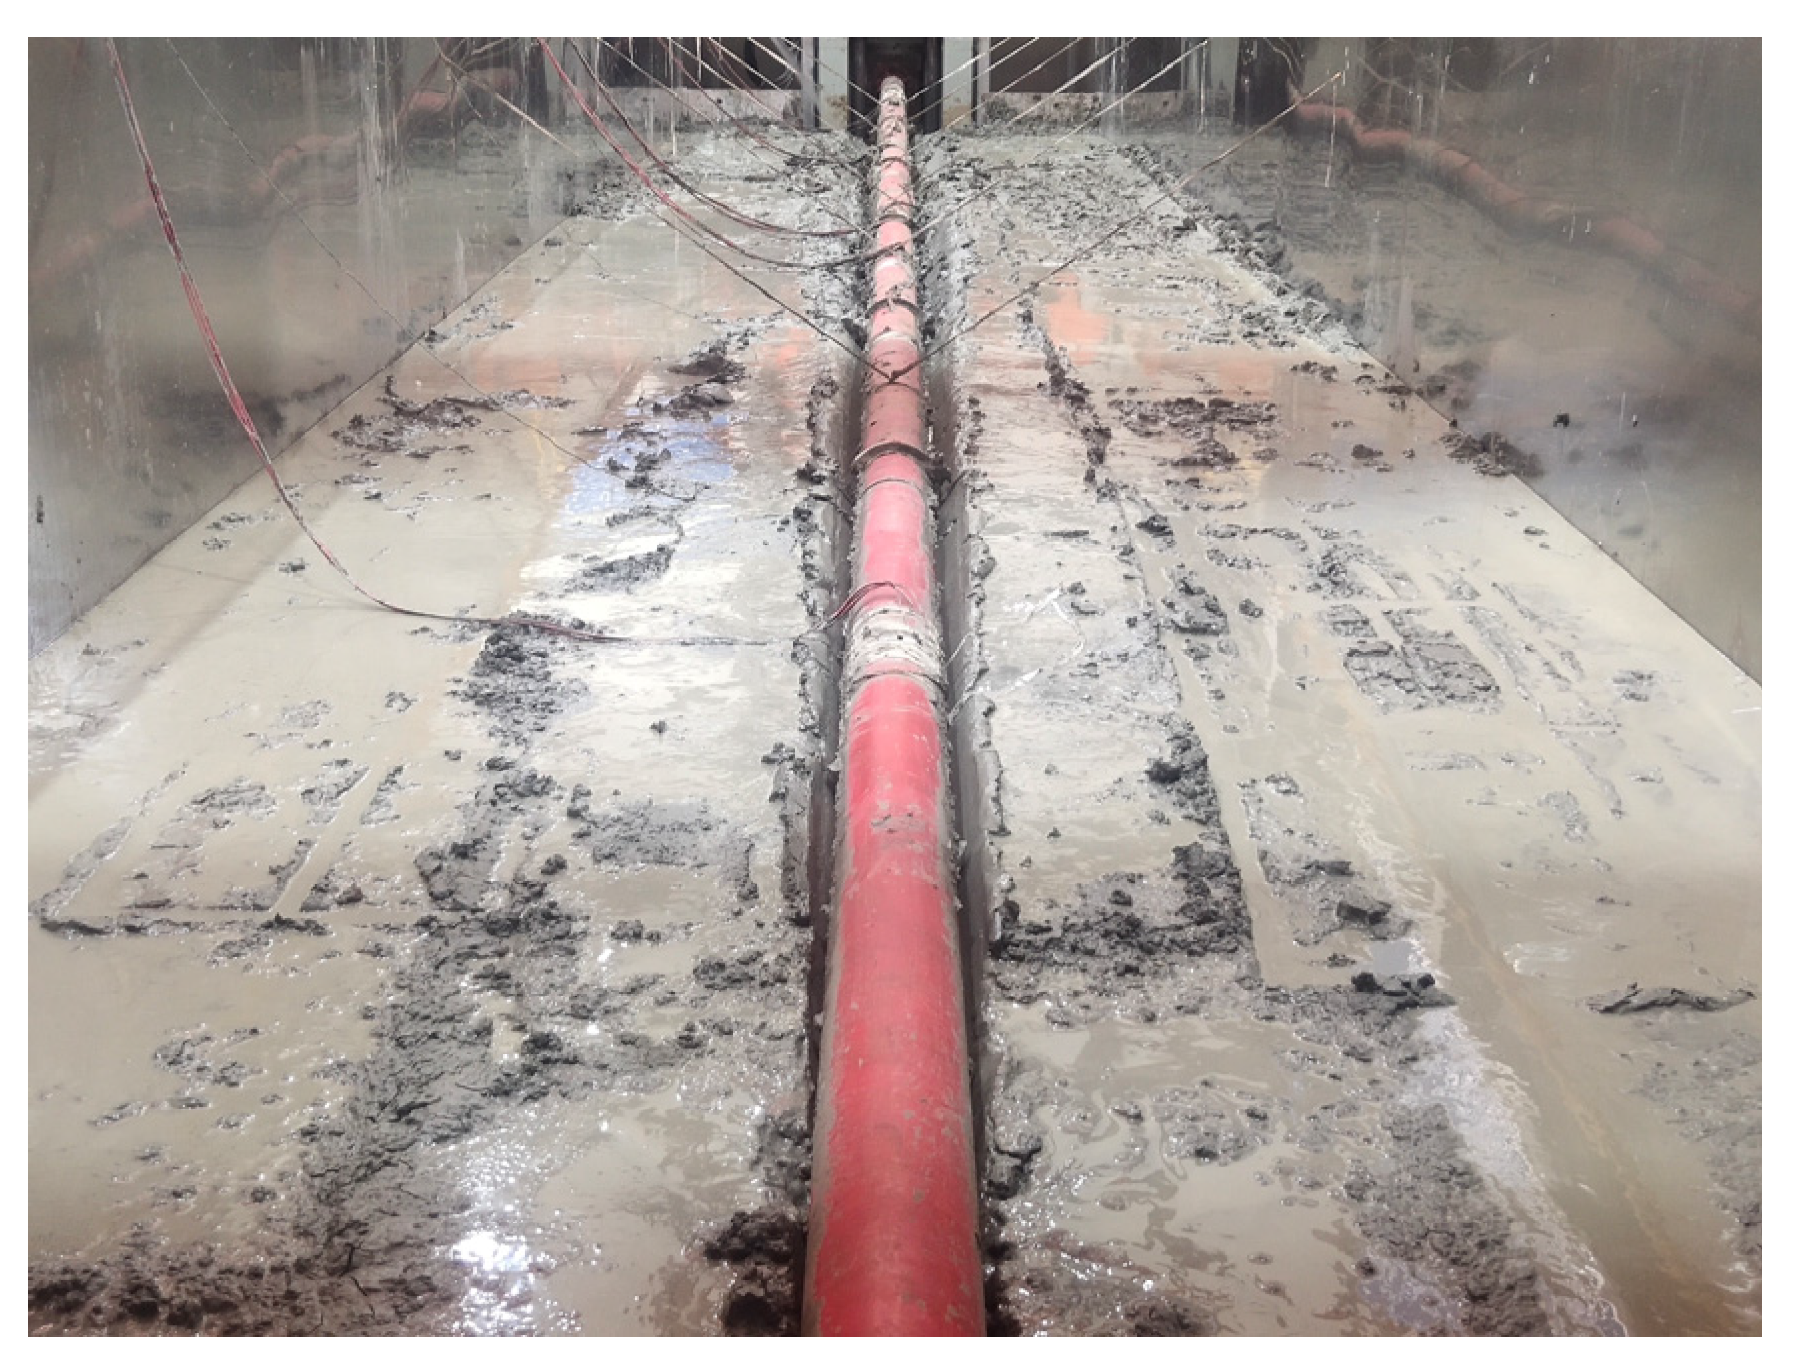
2.2. Soil Tank
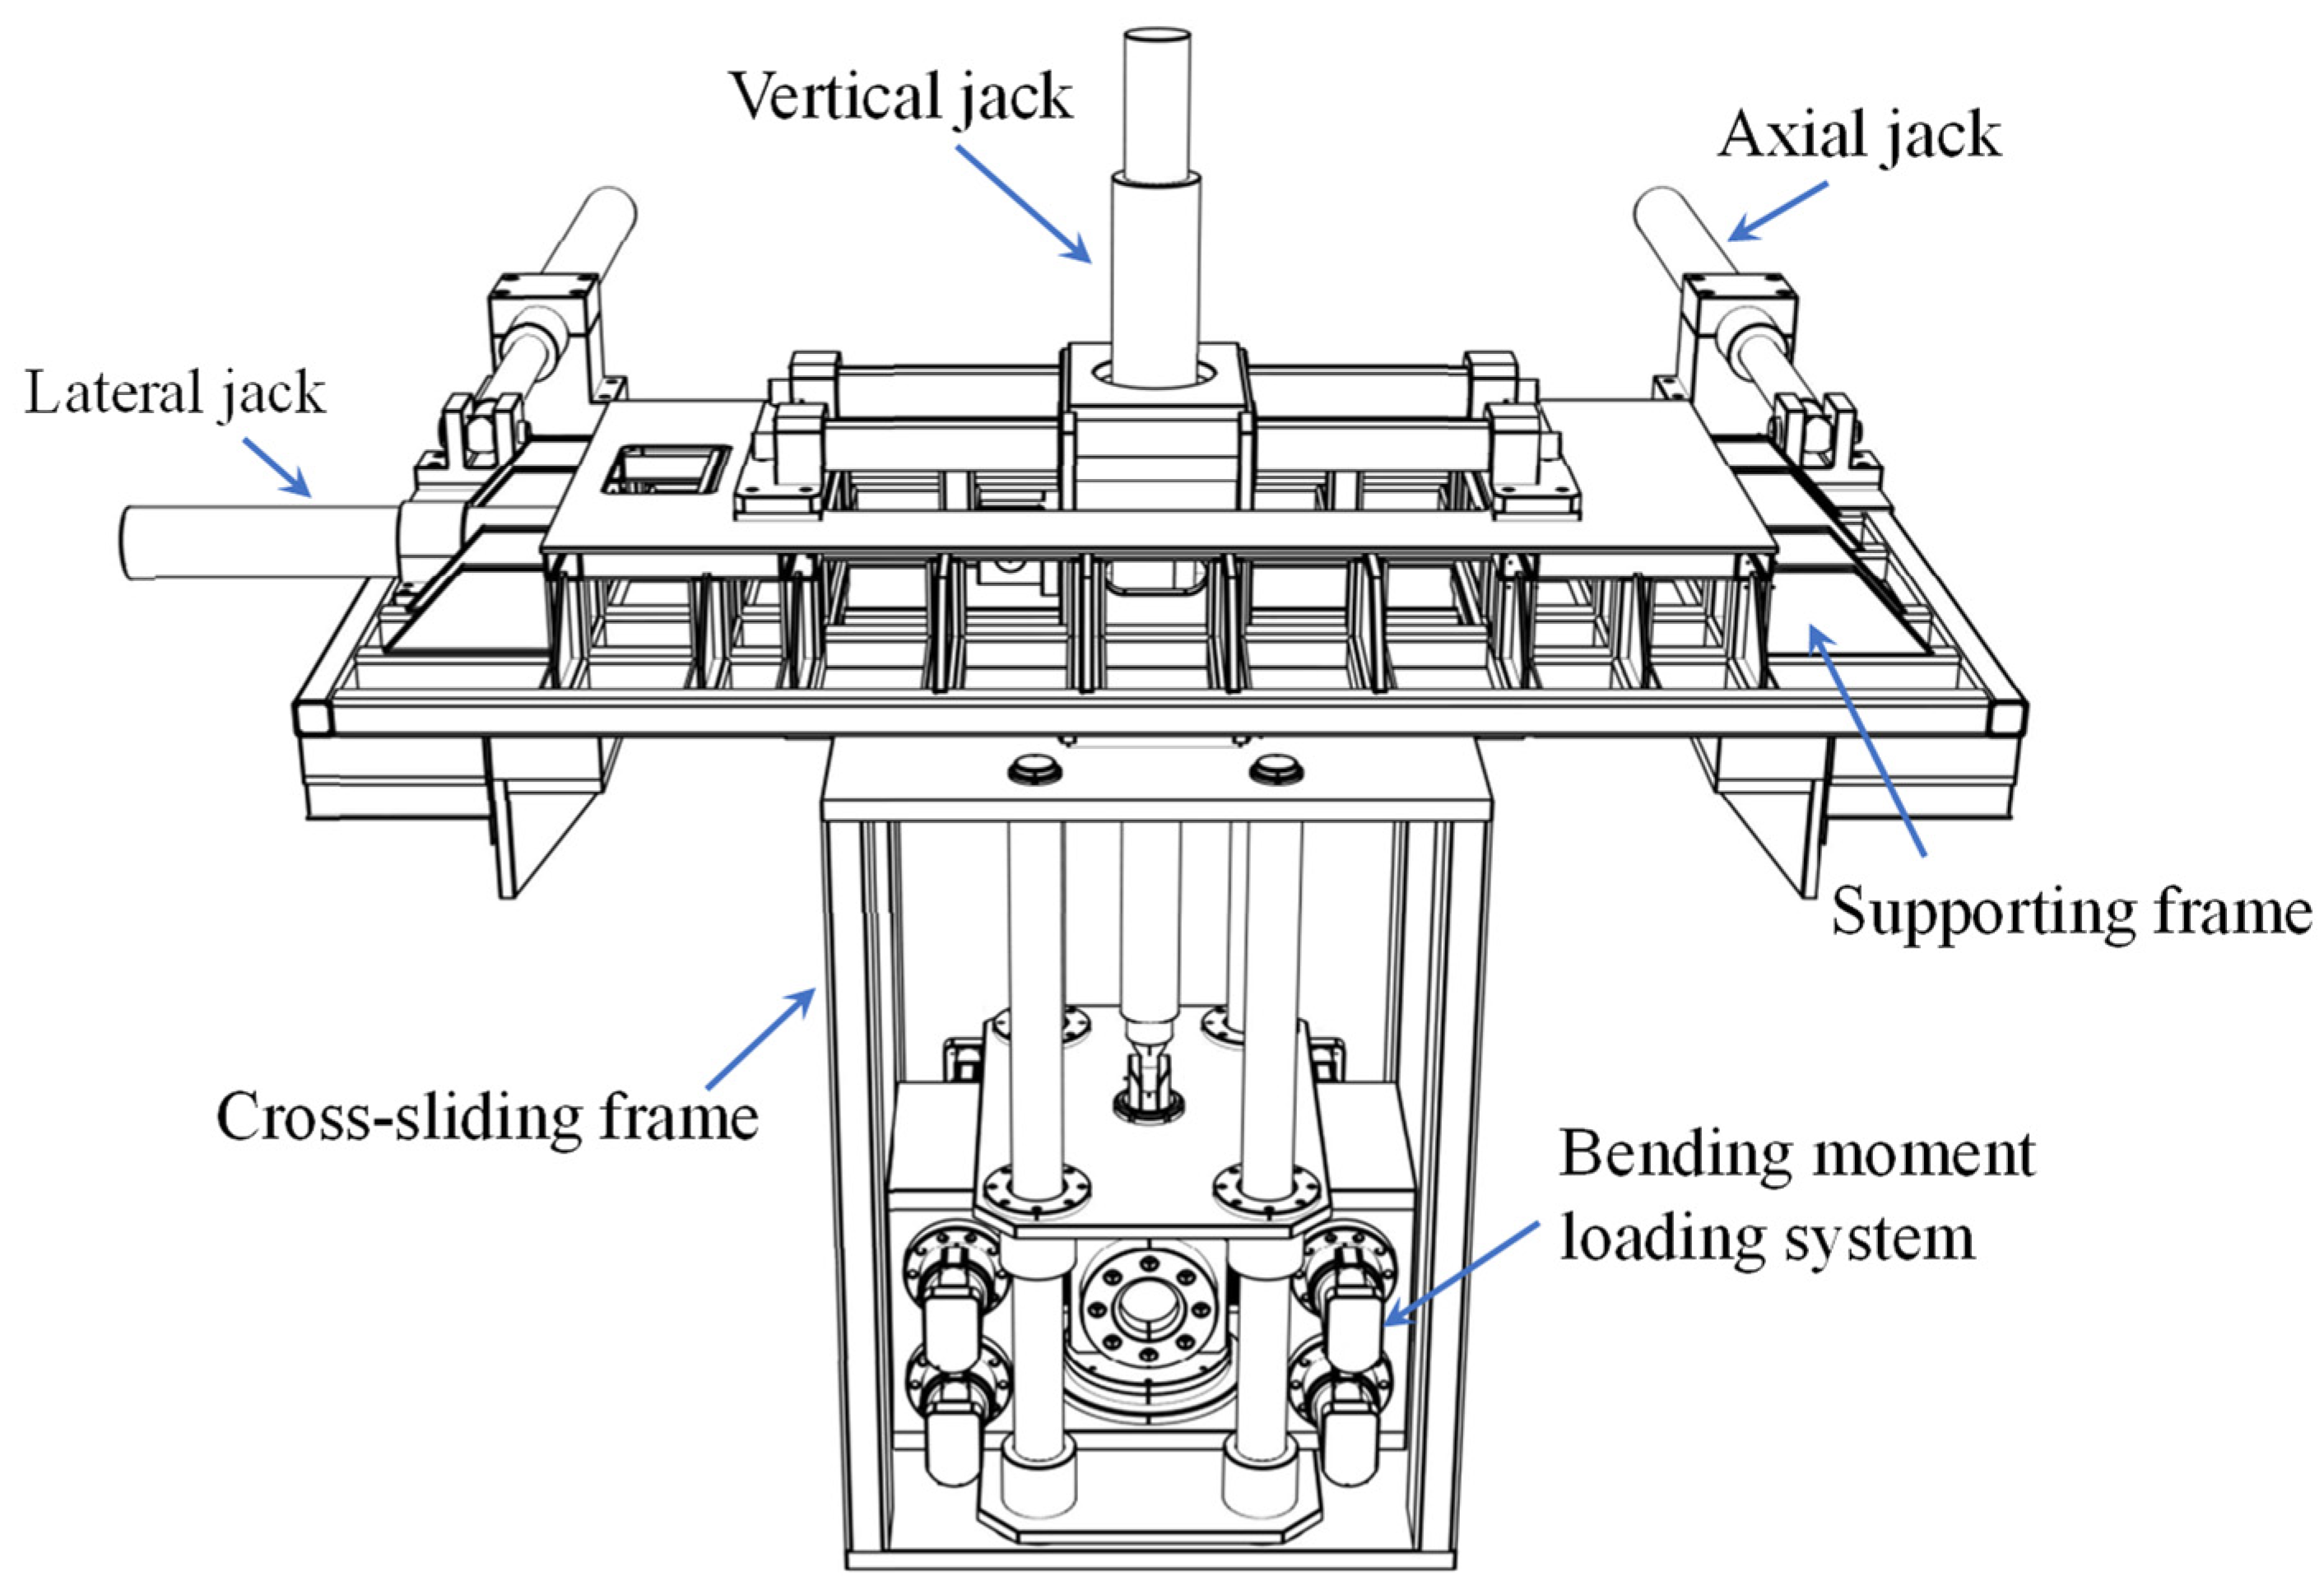
2.3. Loading System
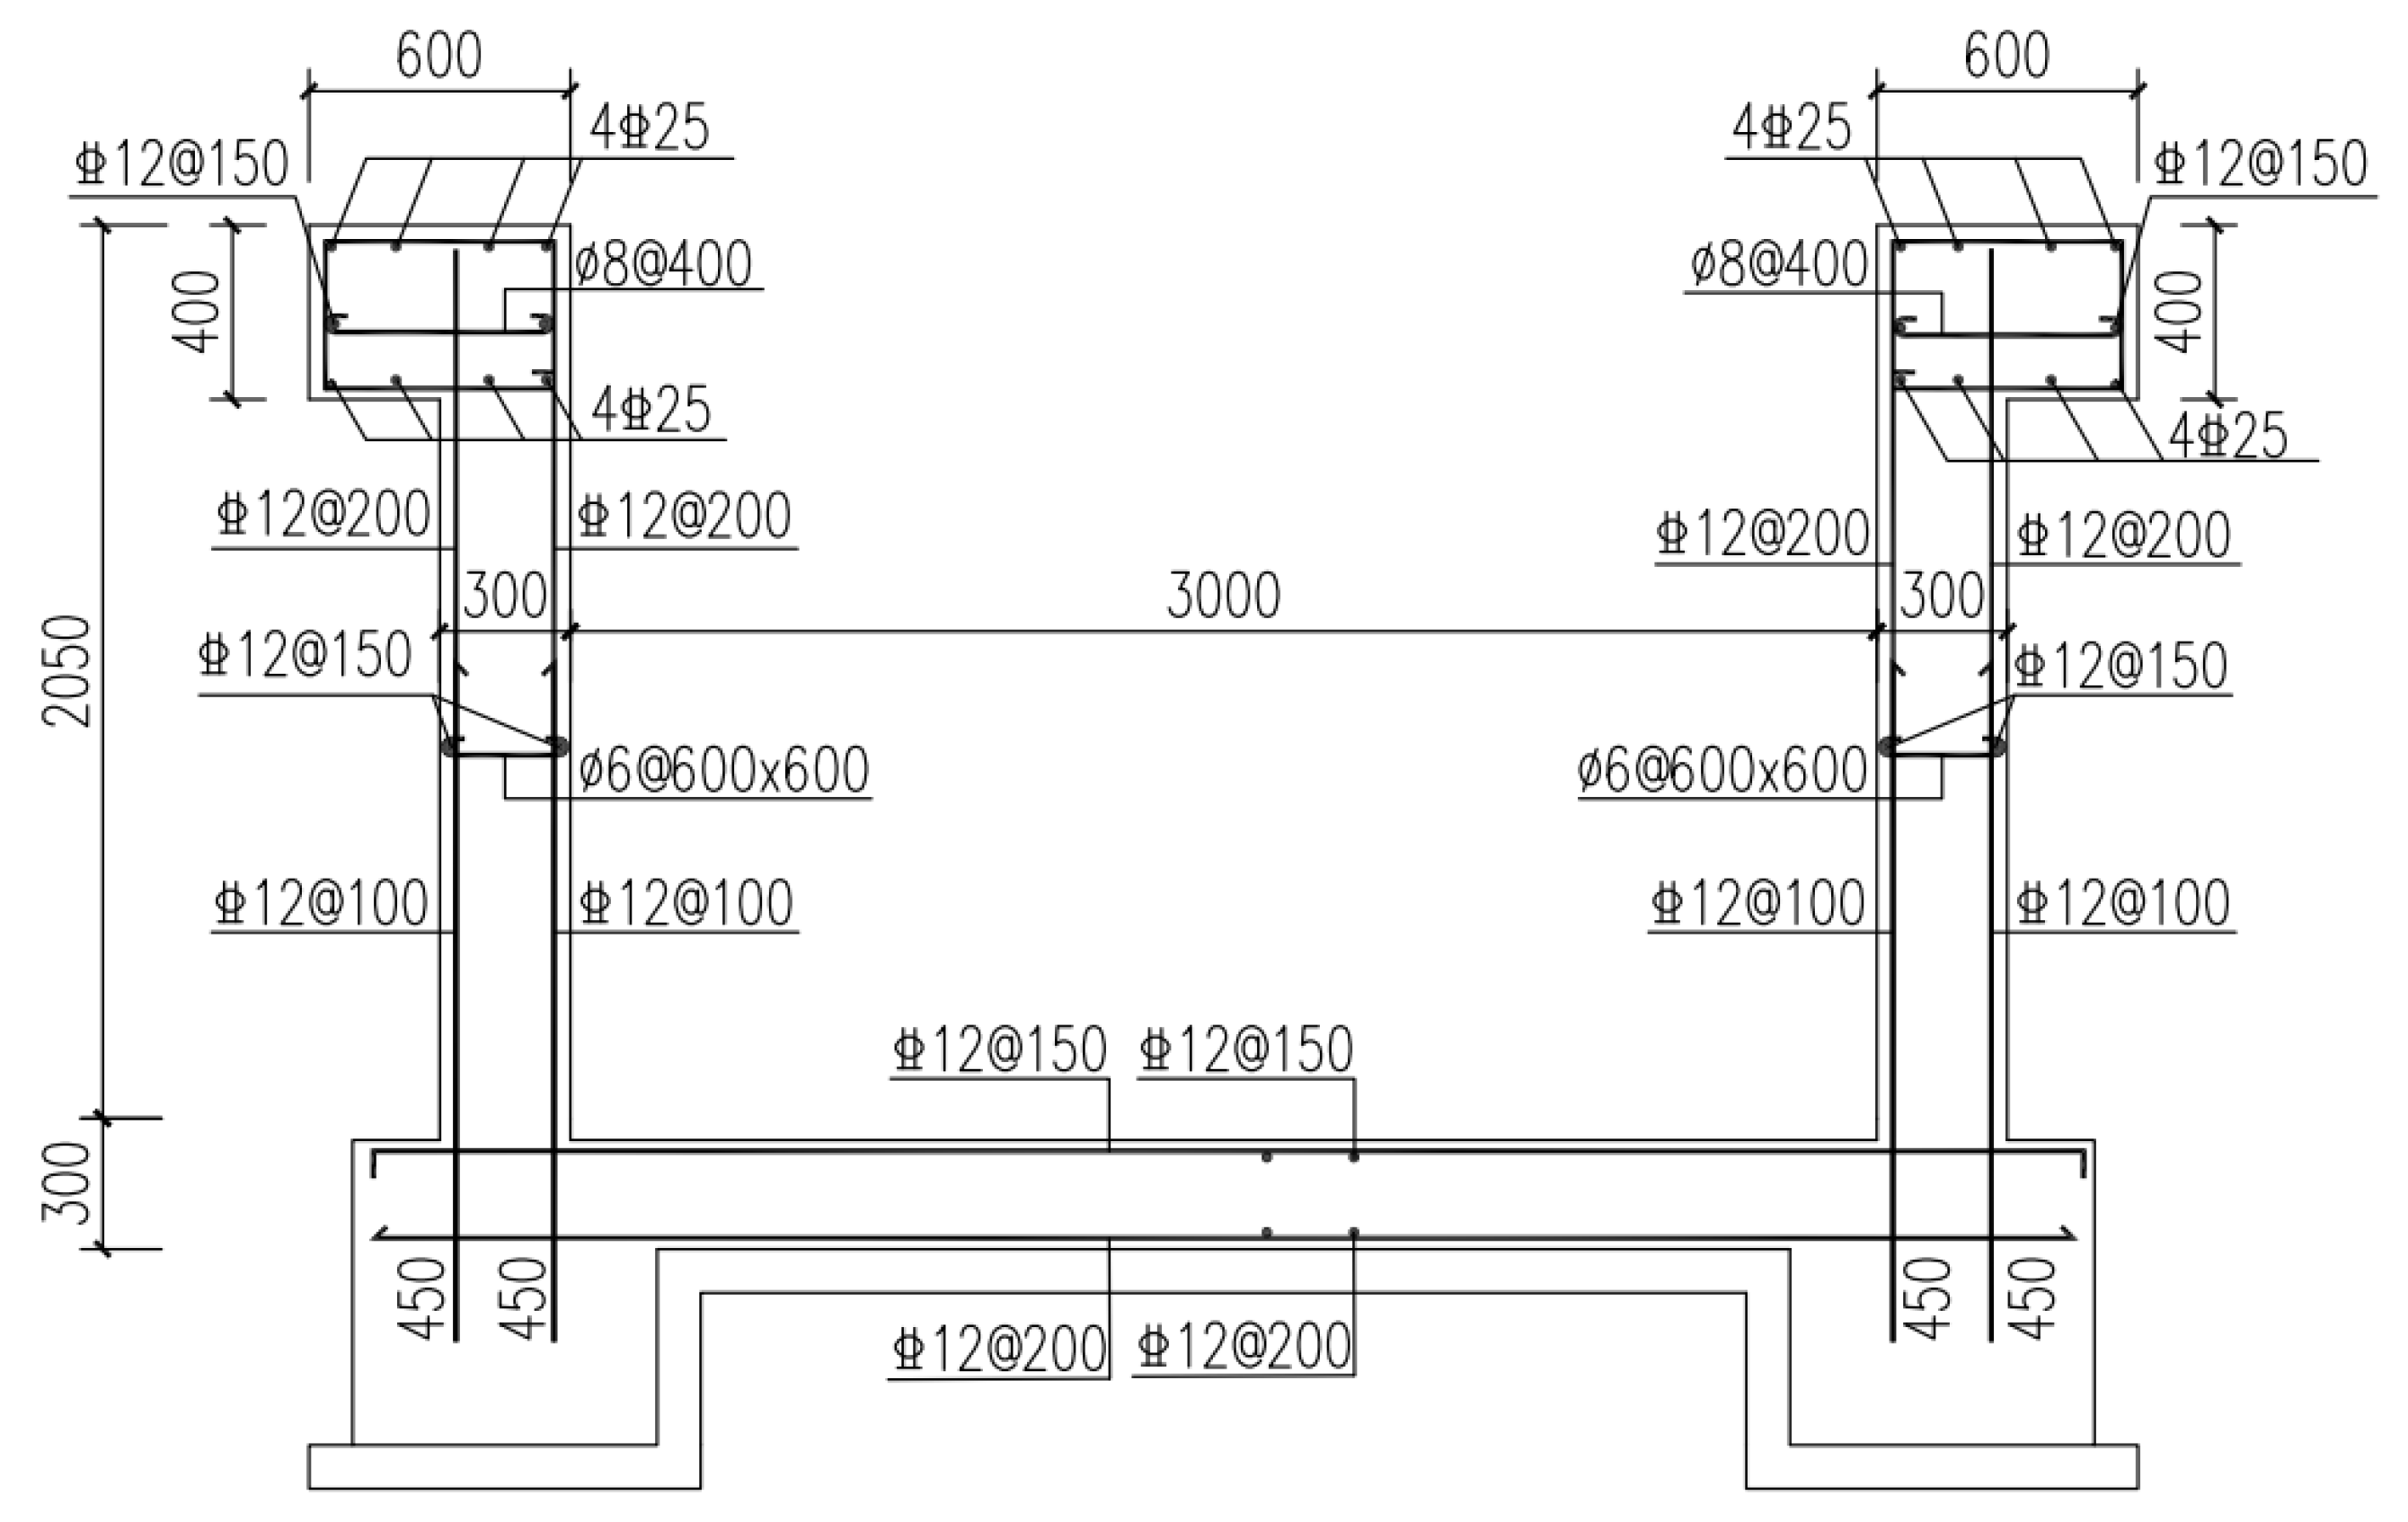
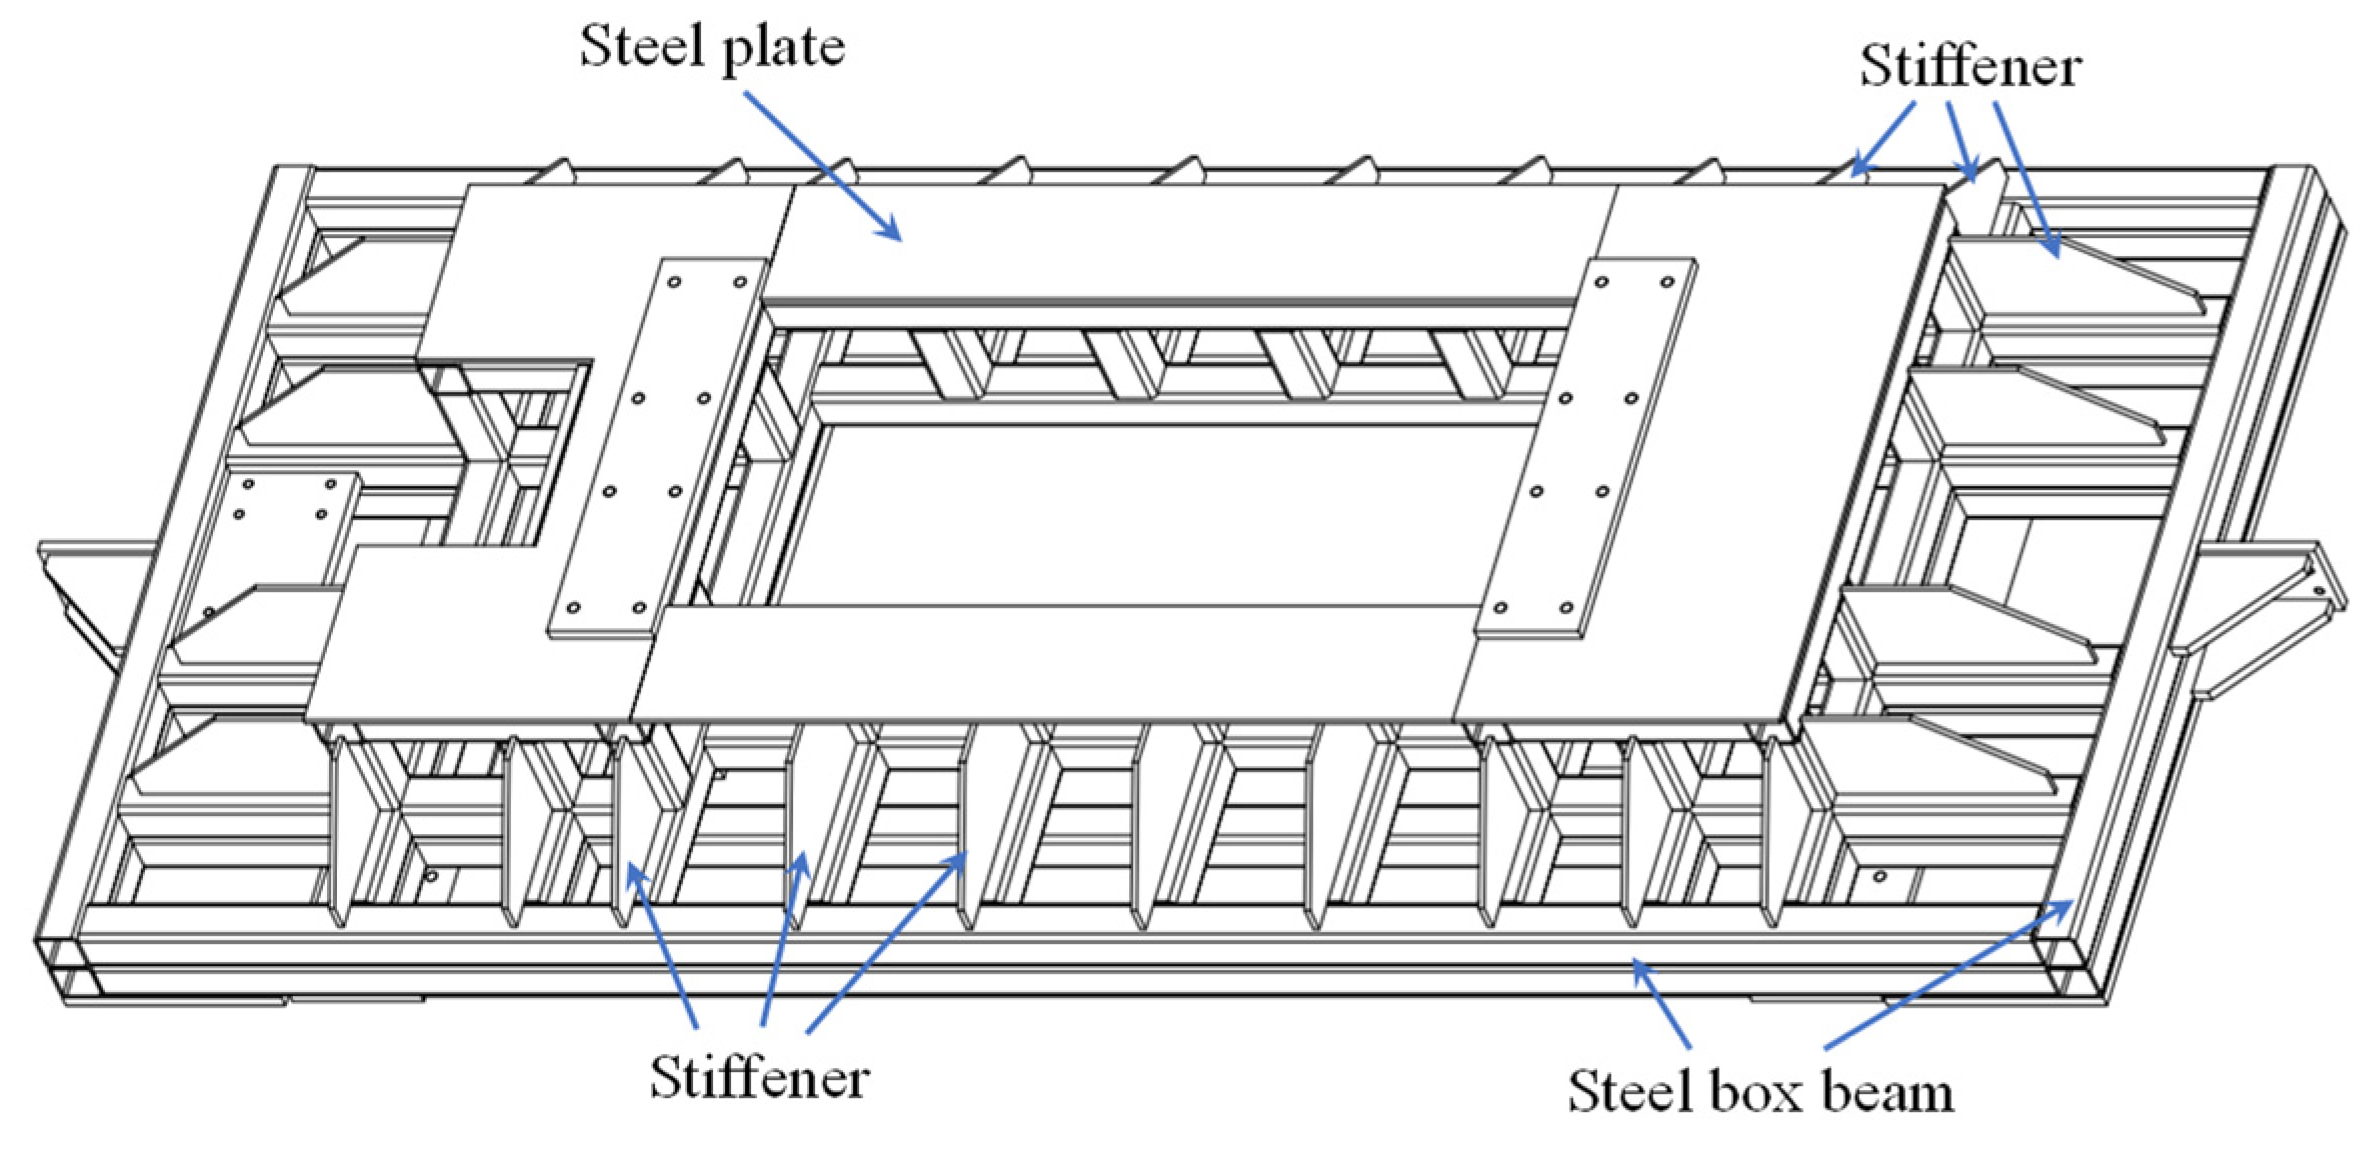
2.3.1. Supporting Frame
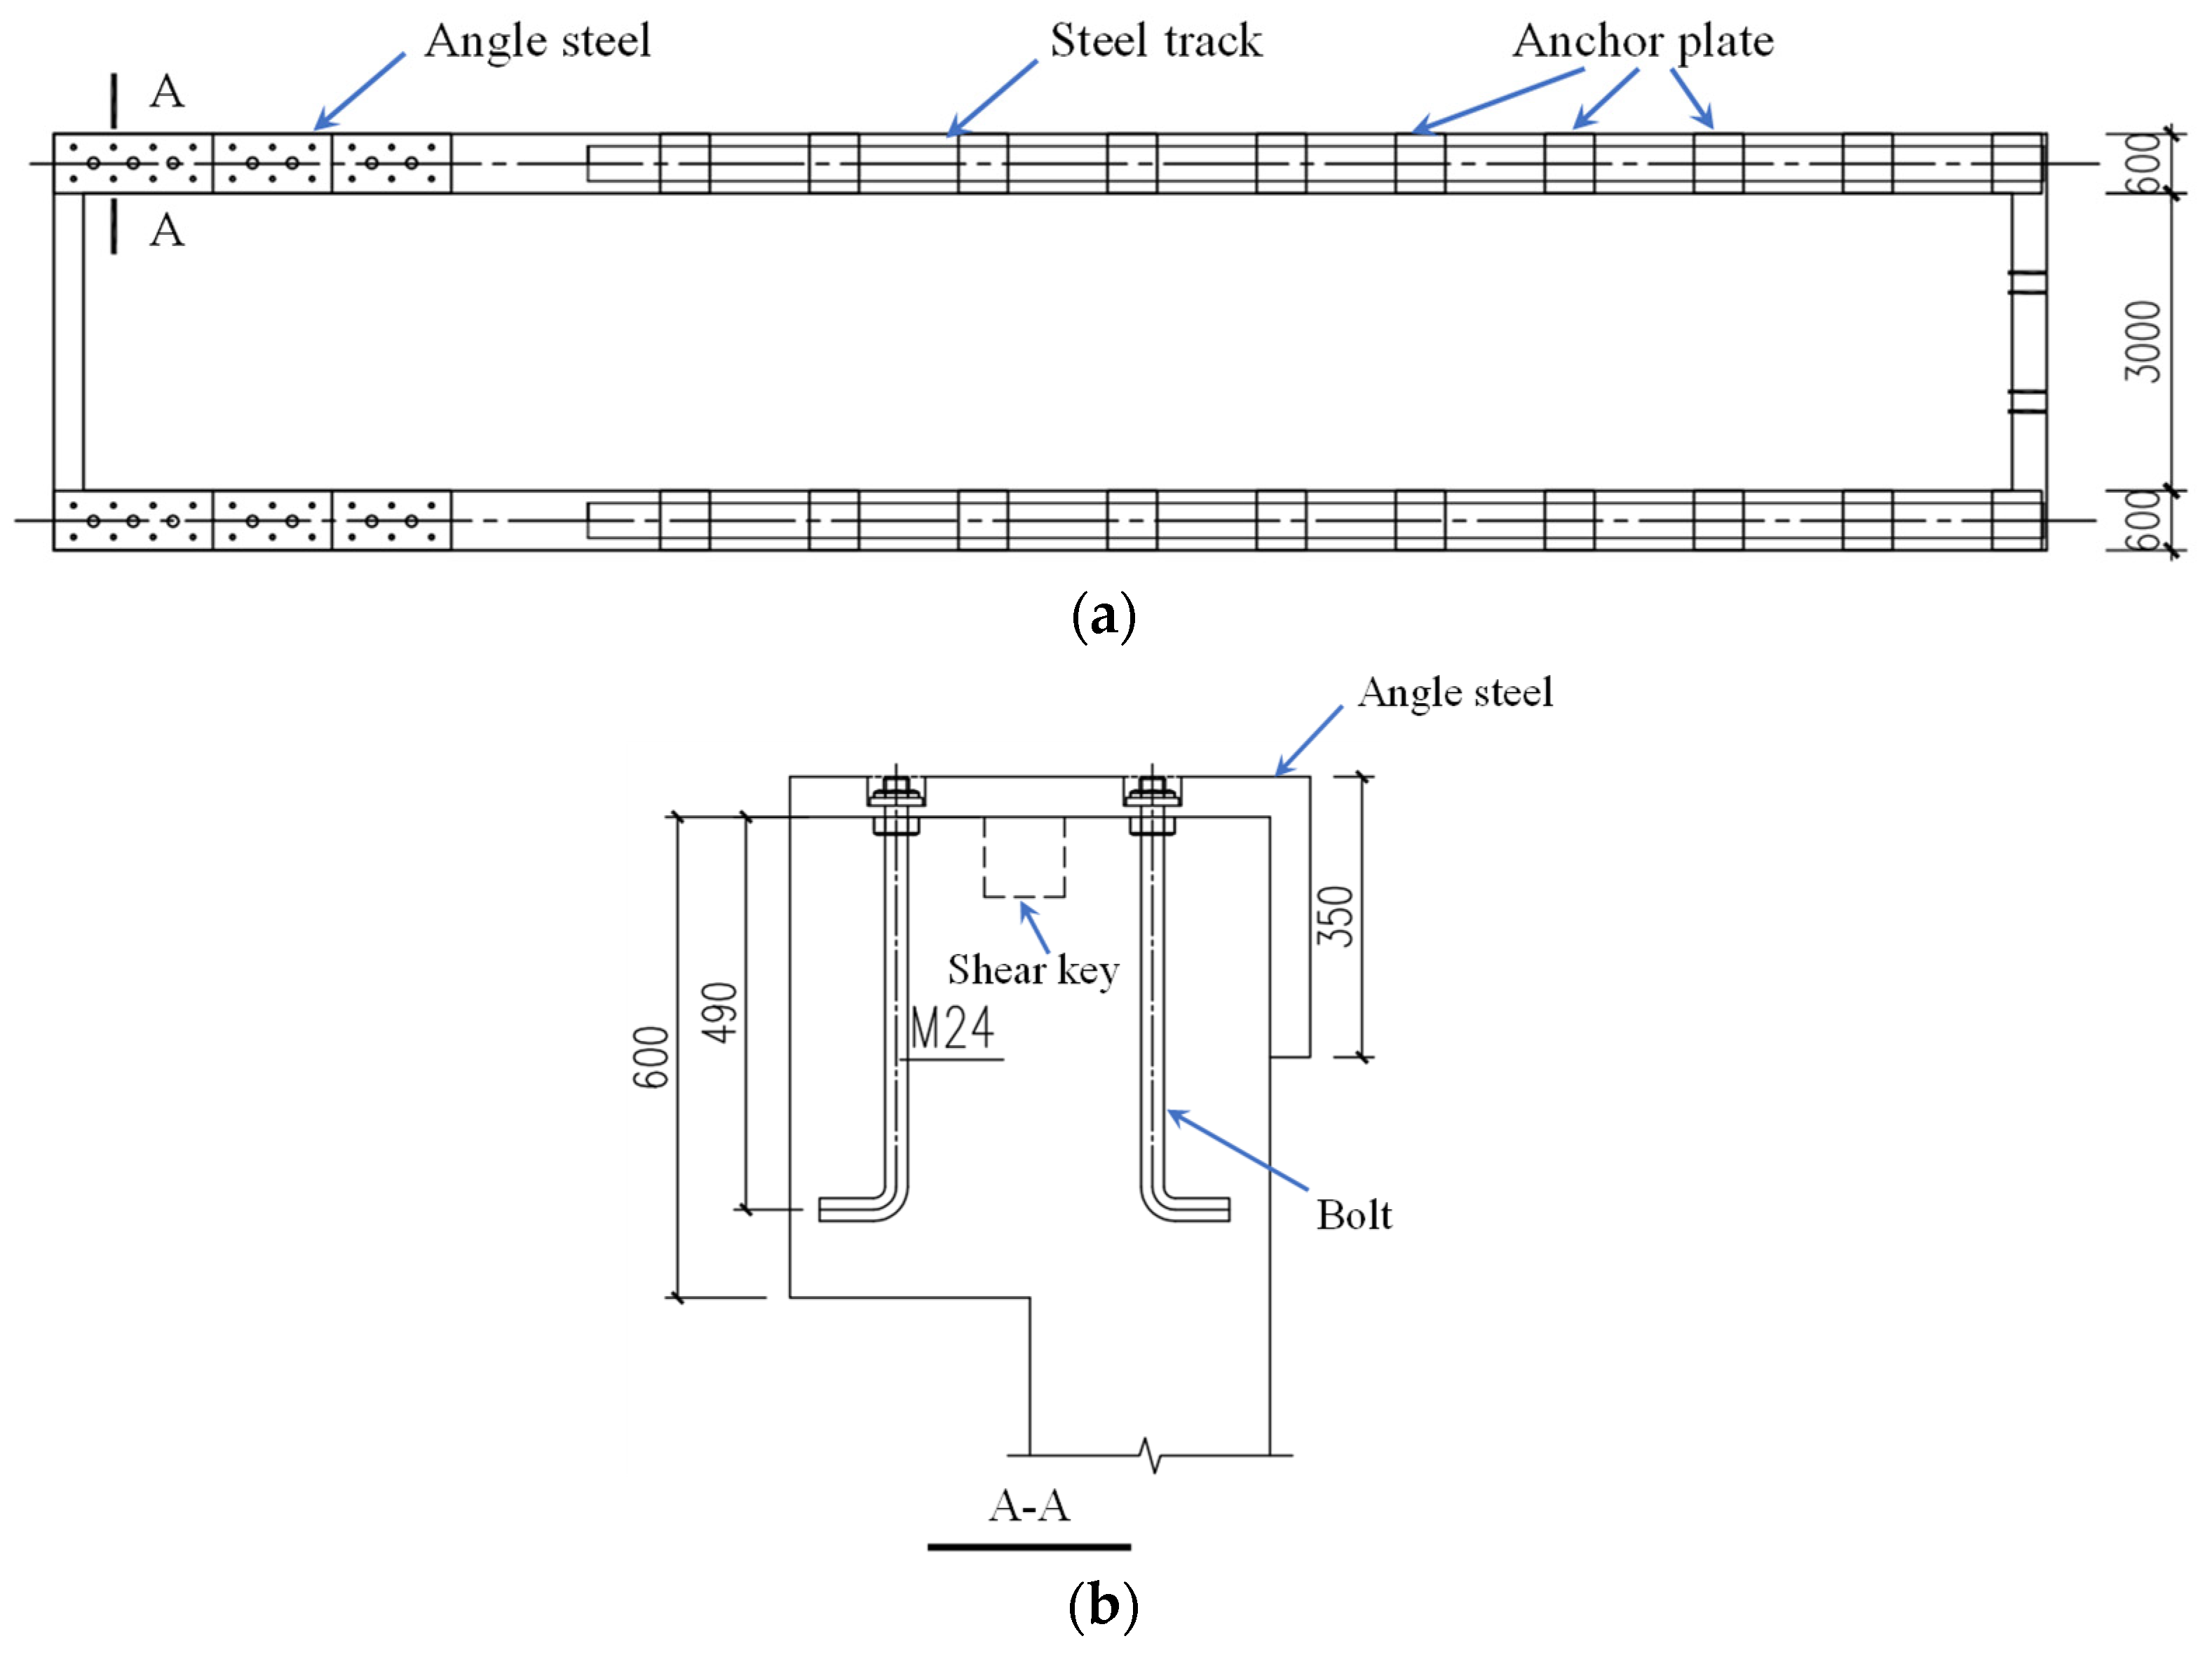
2.3.2. Cross-Sliding Frame
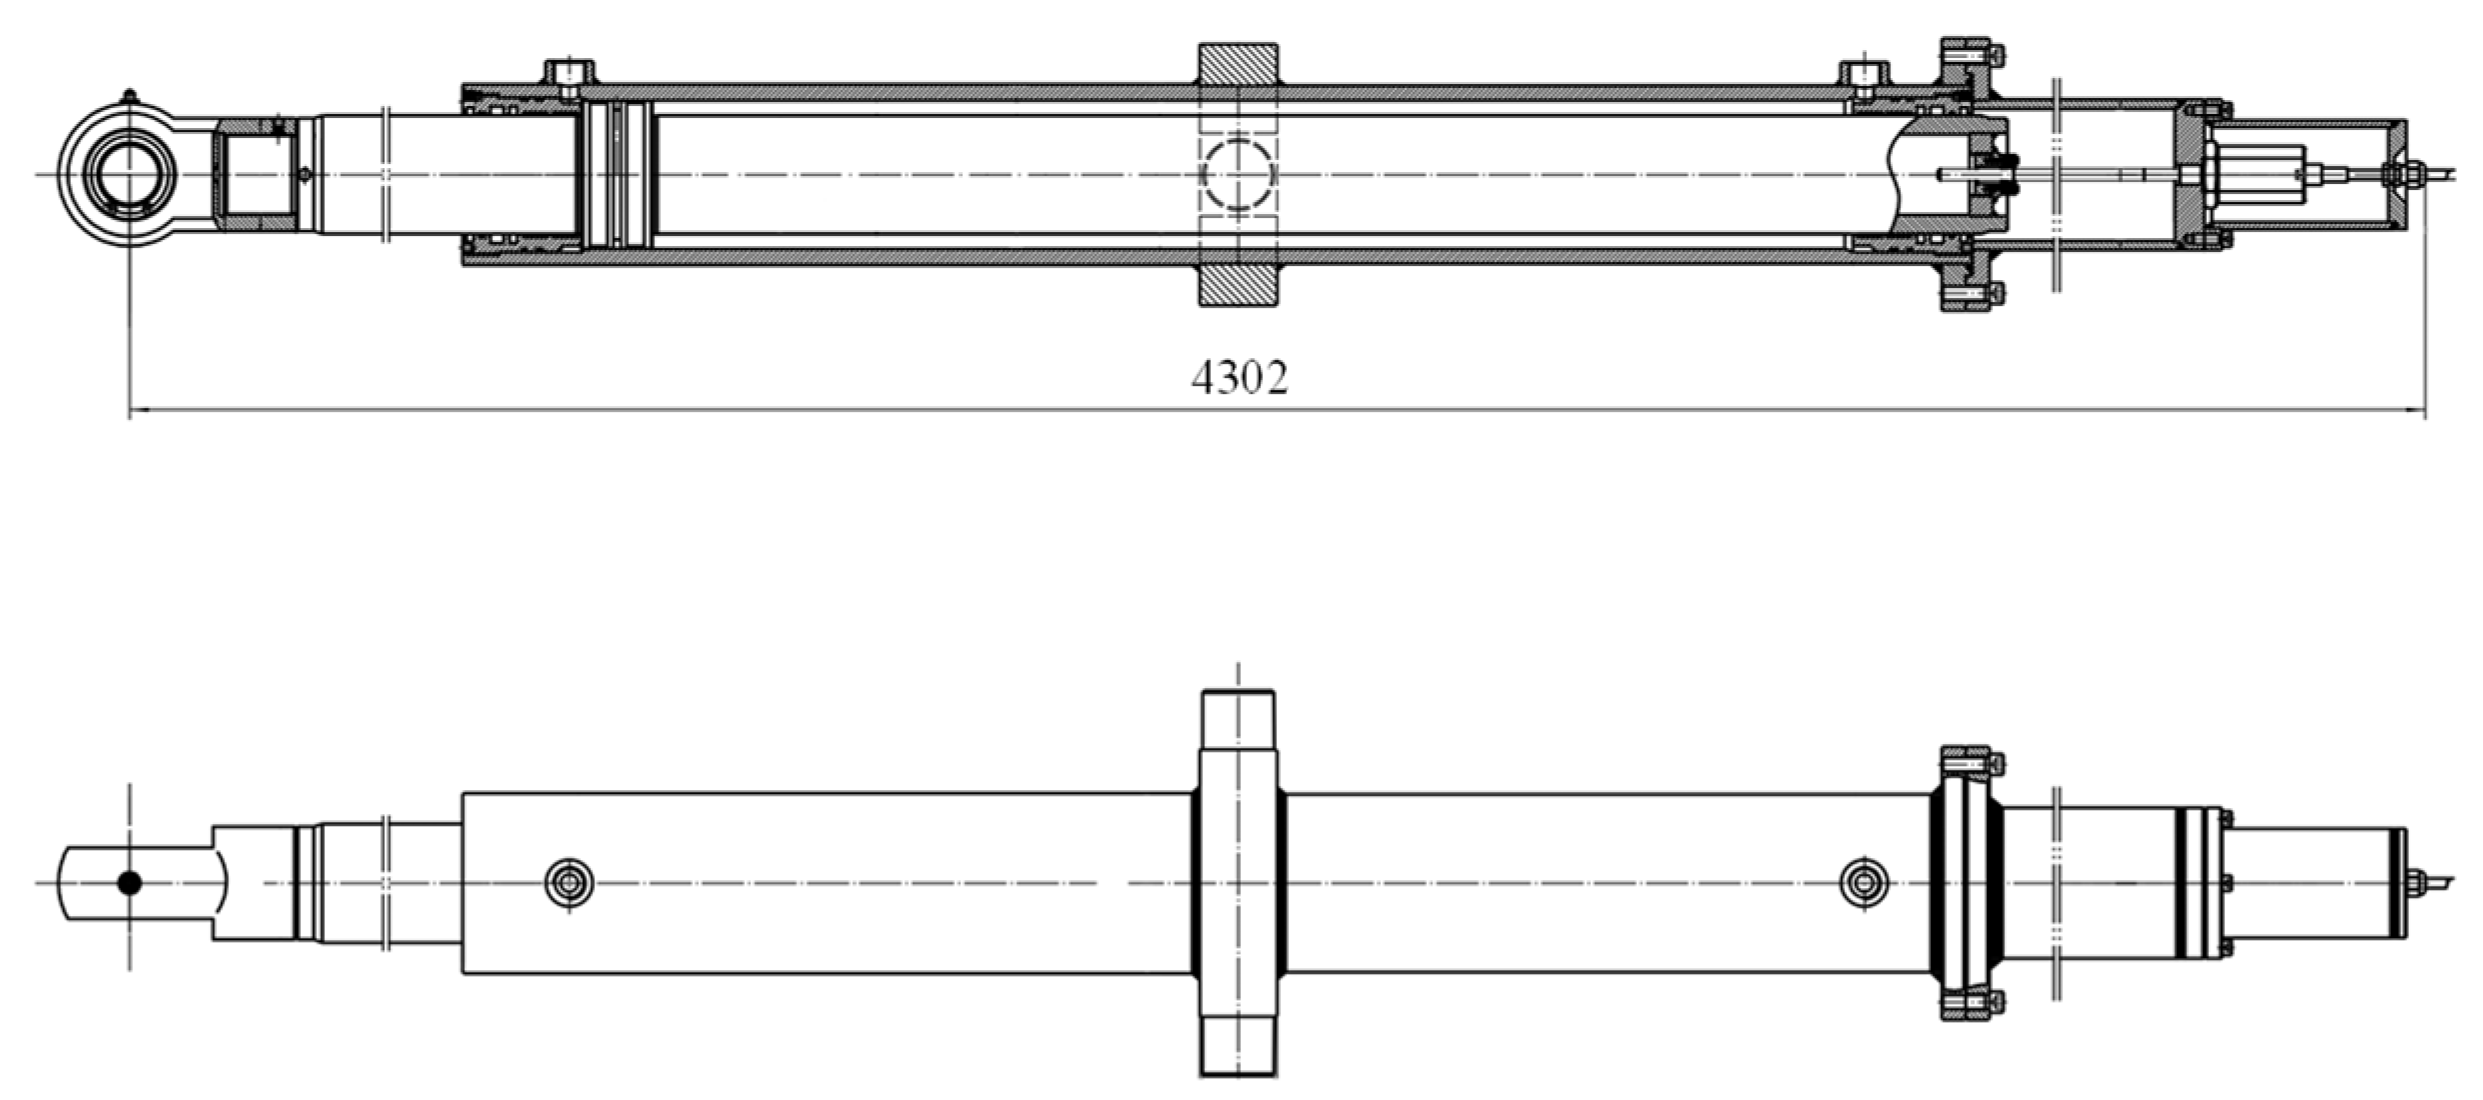
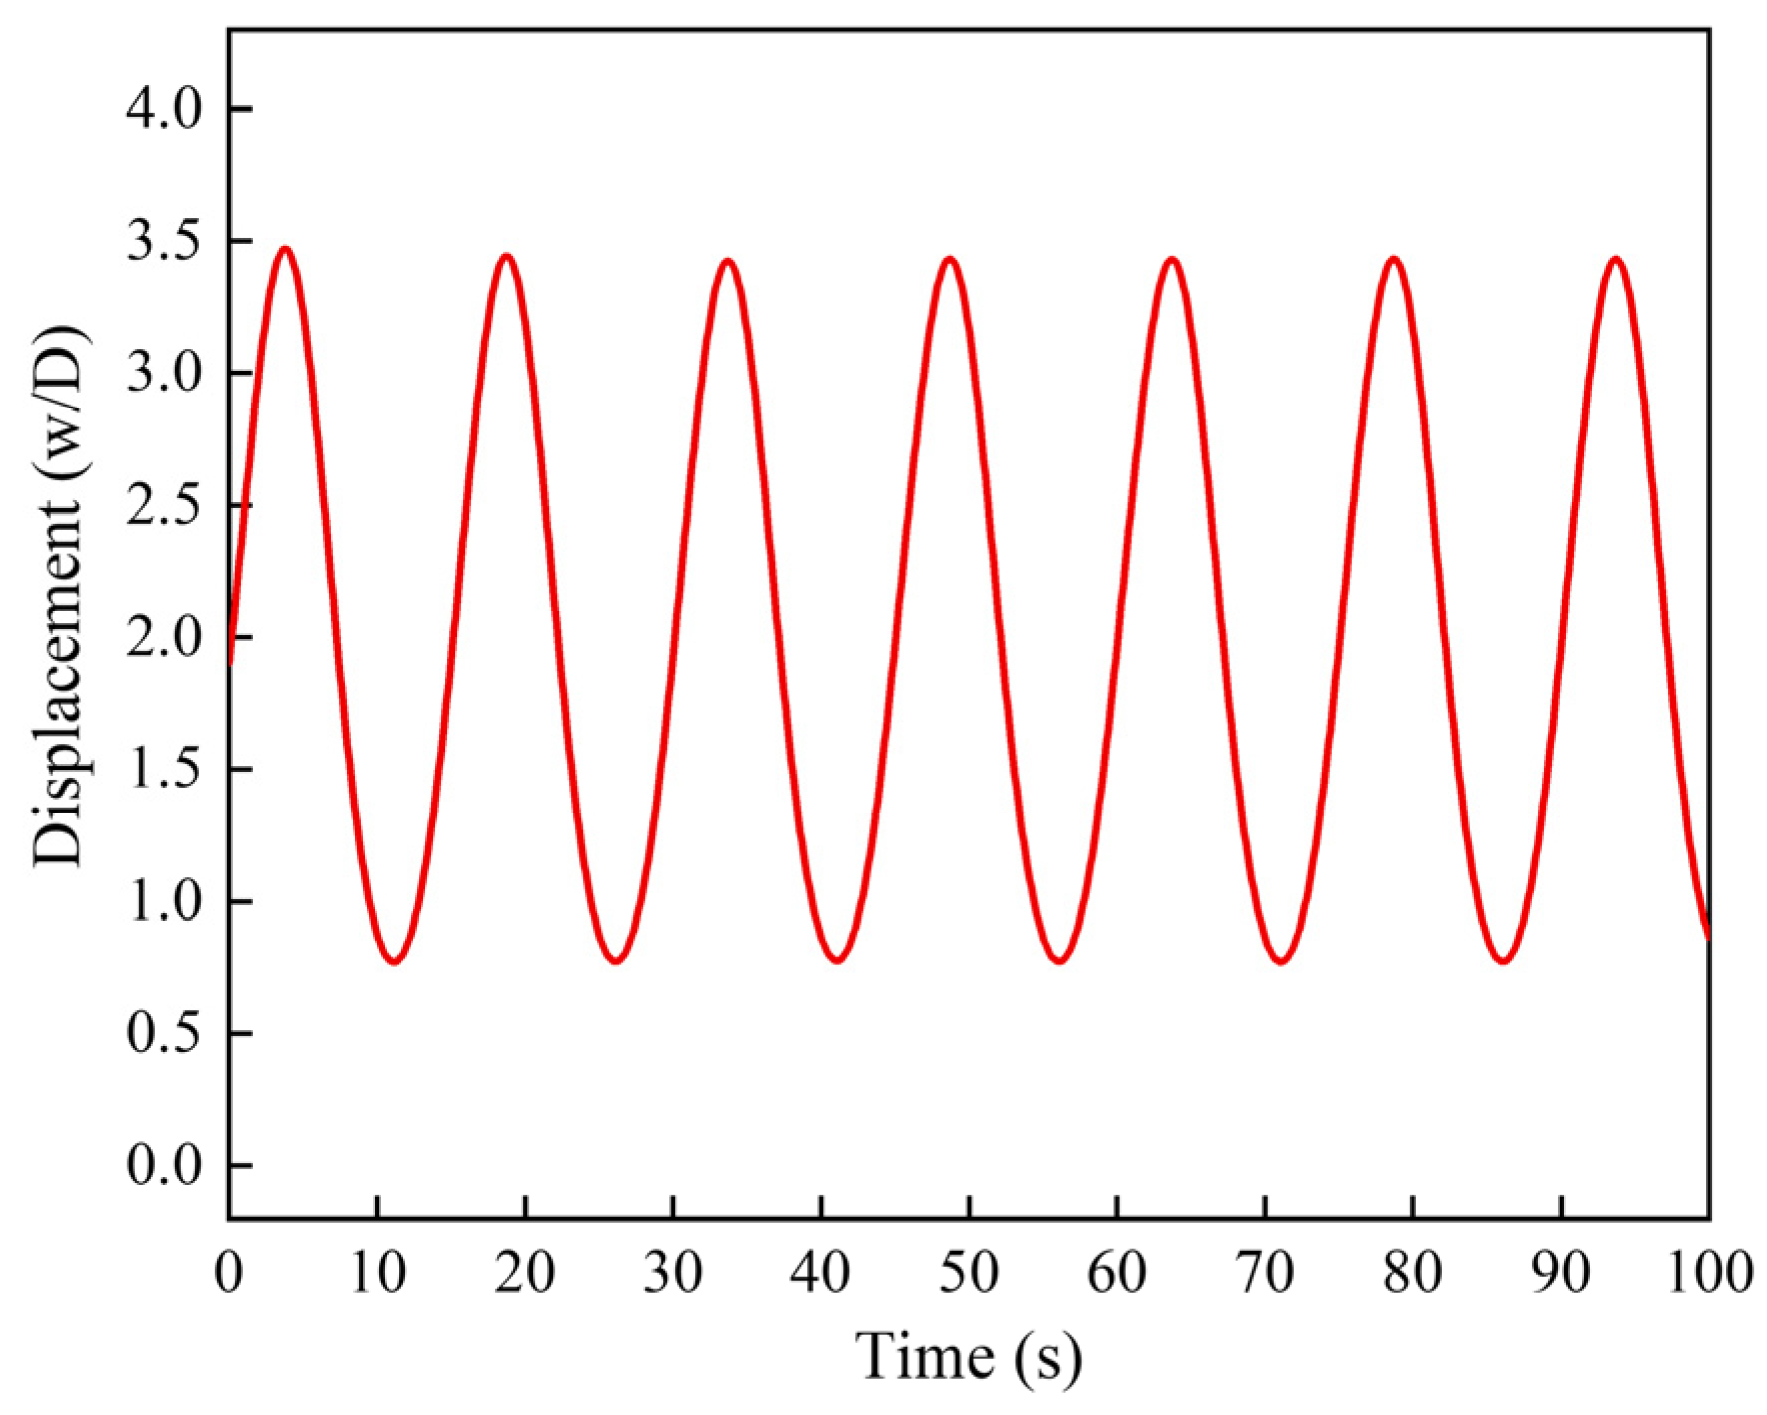
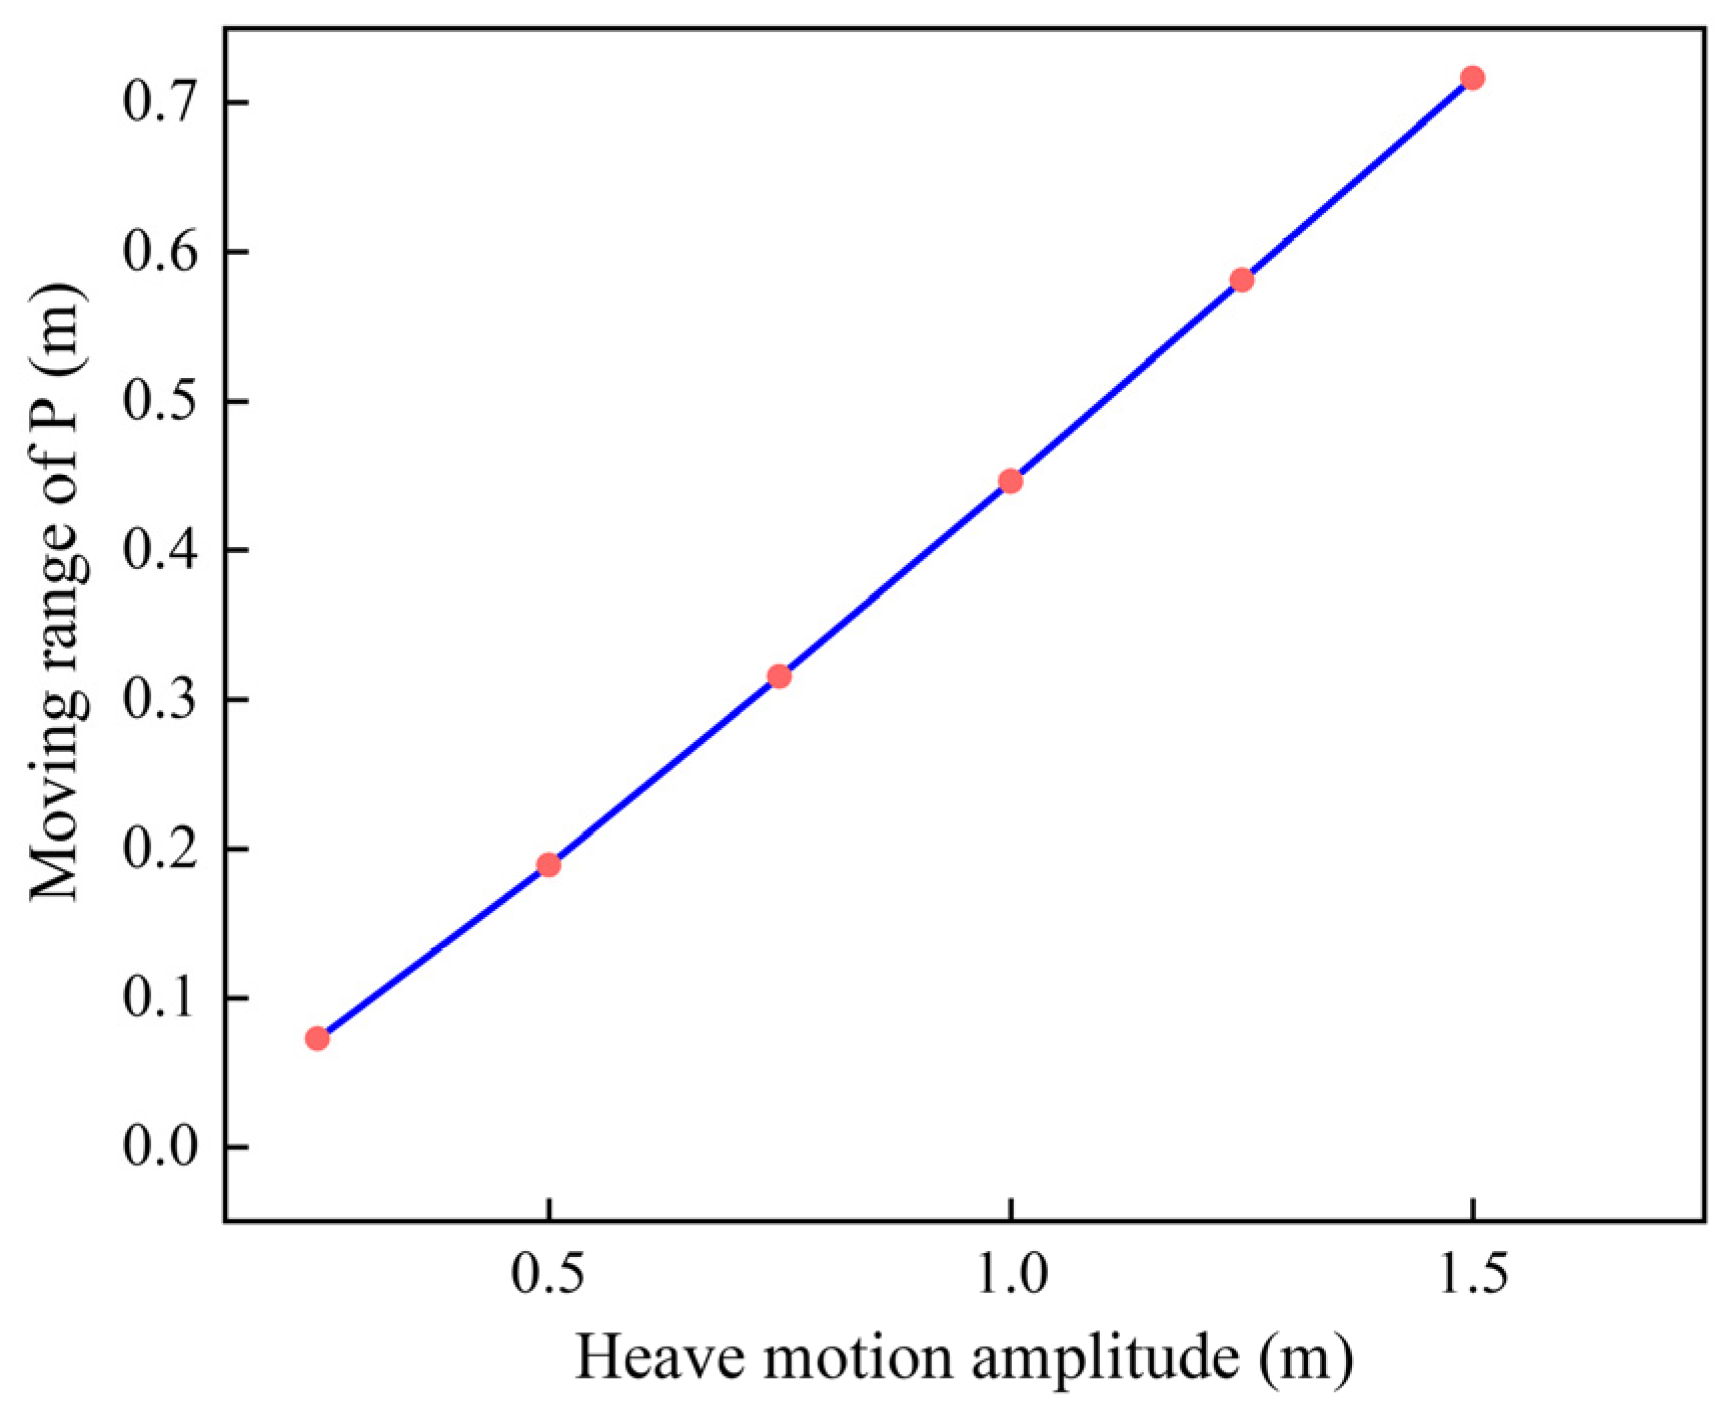
2.3.3. Displacement Loading System
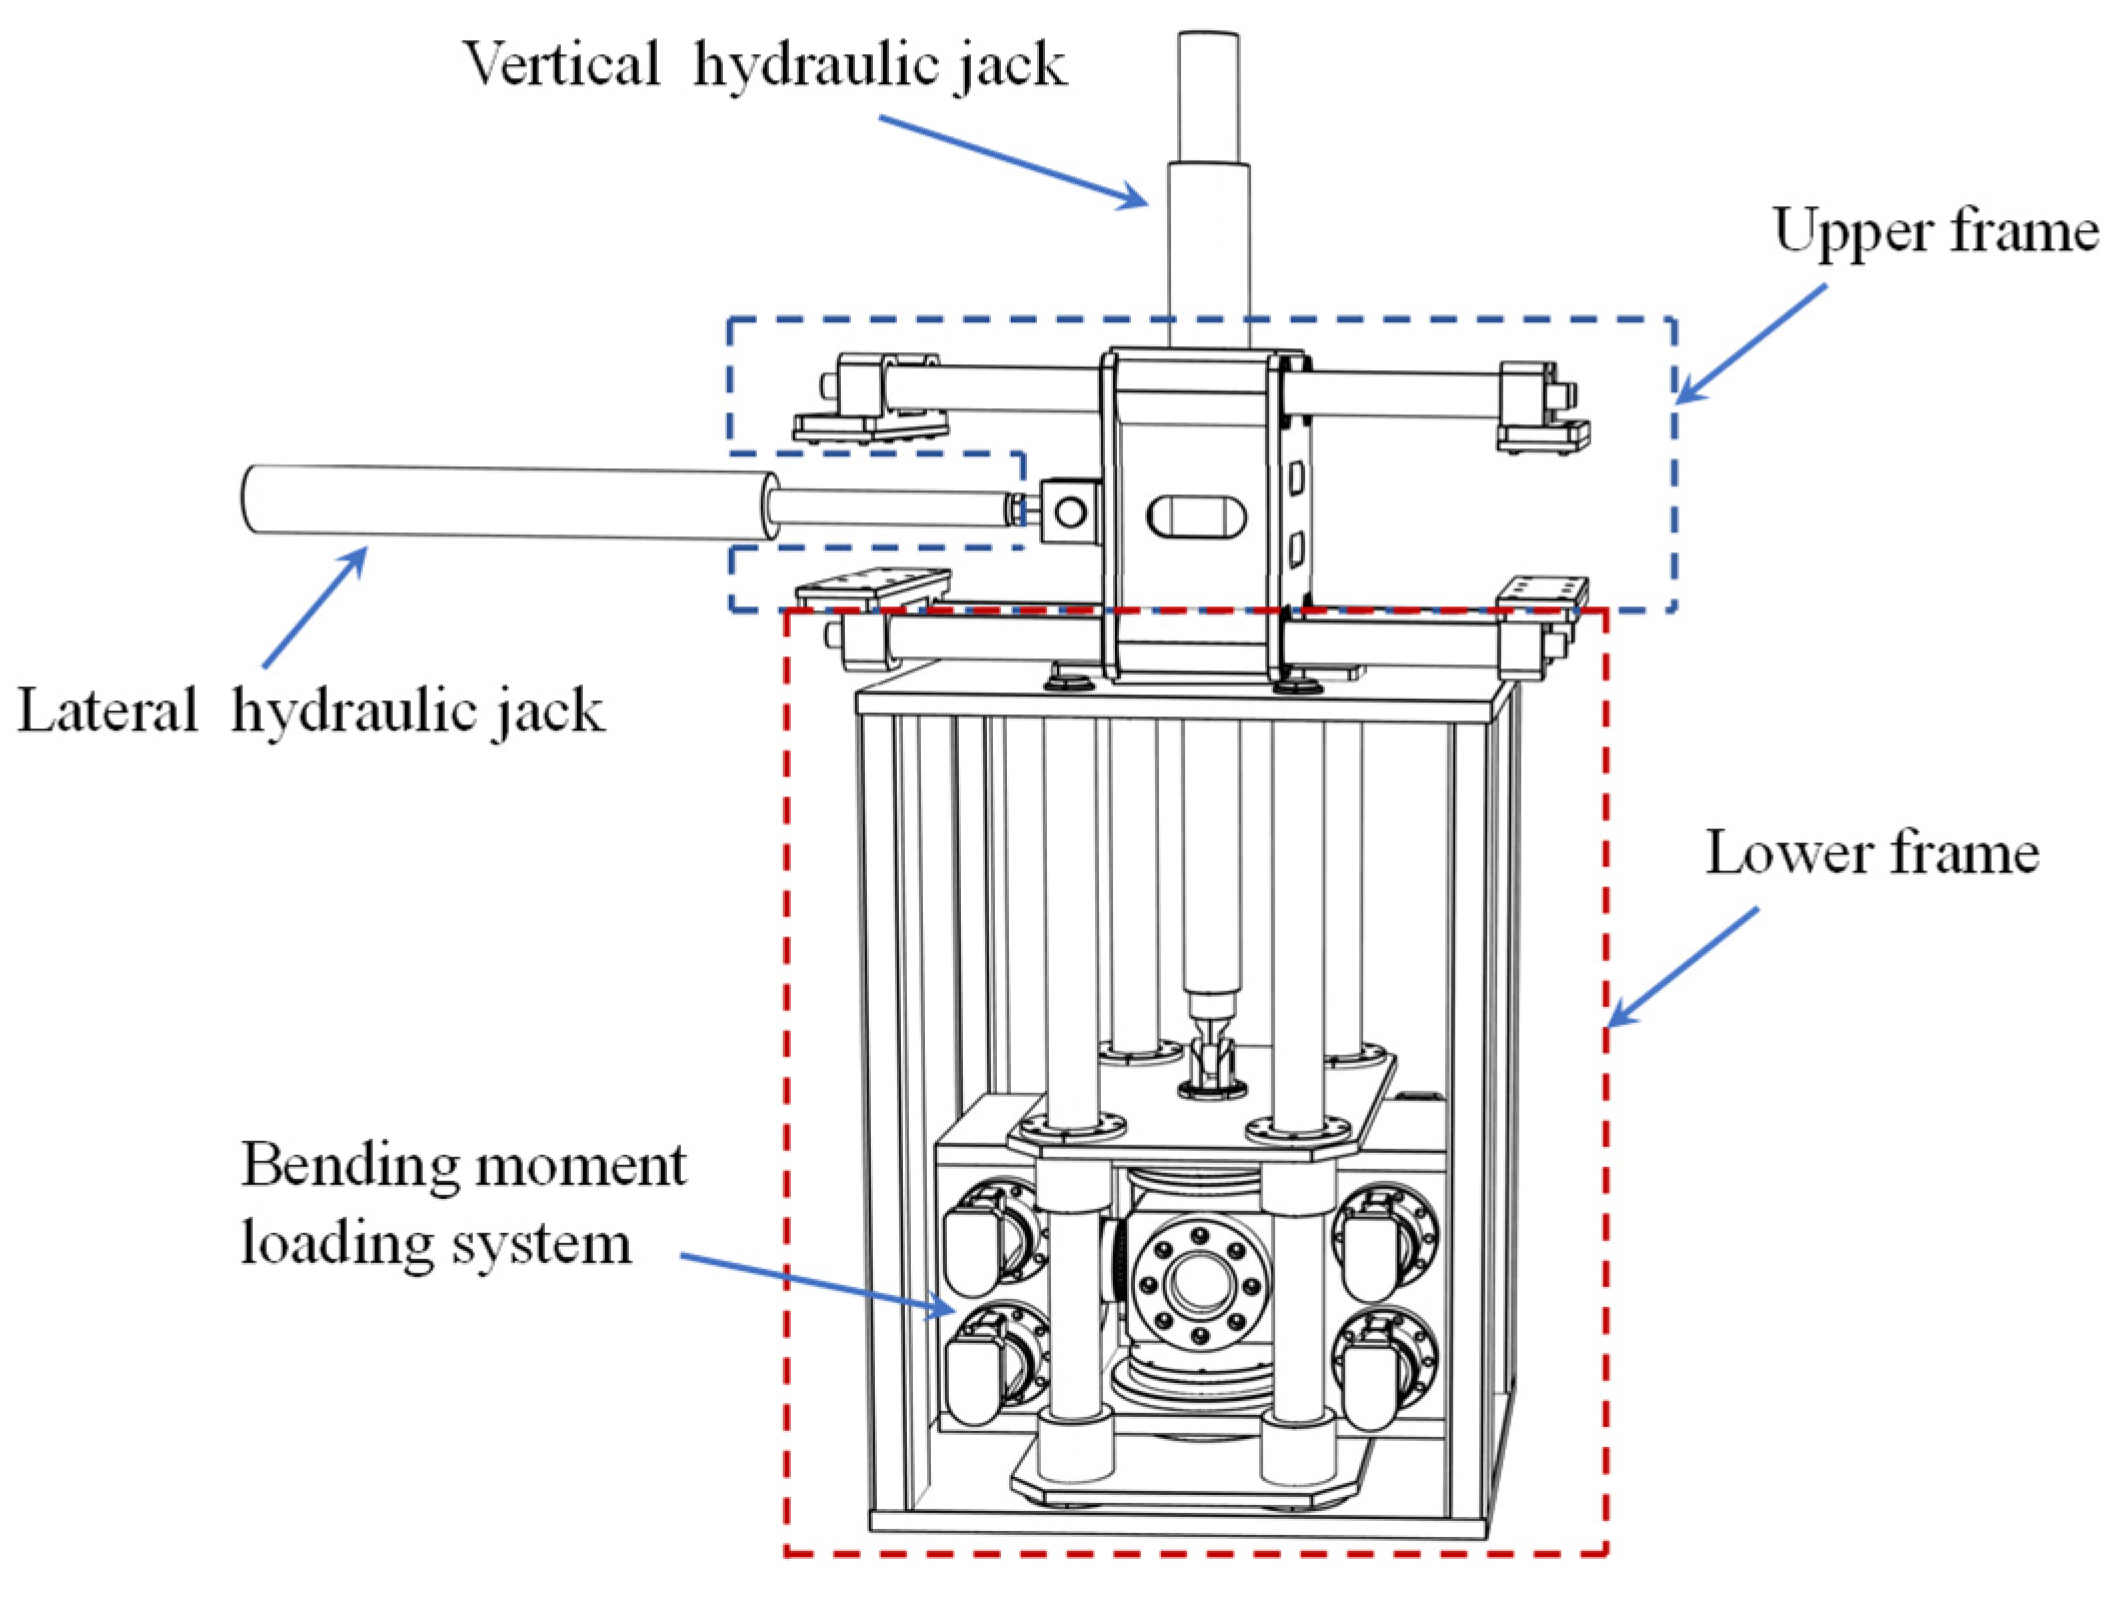
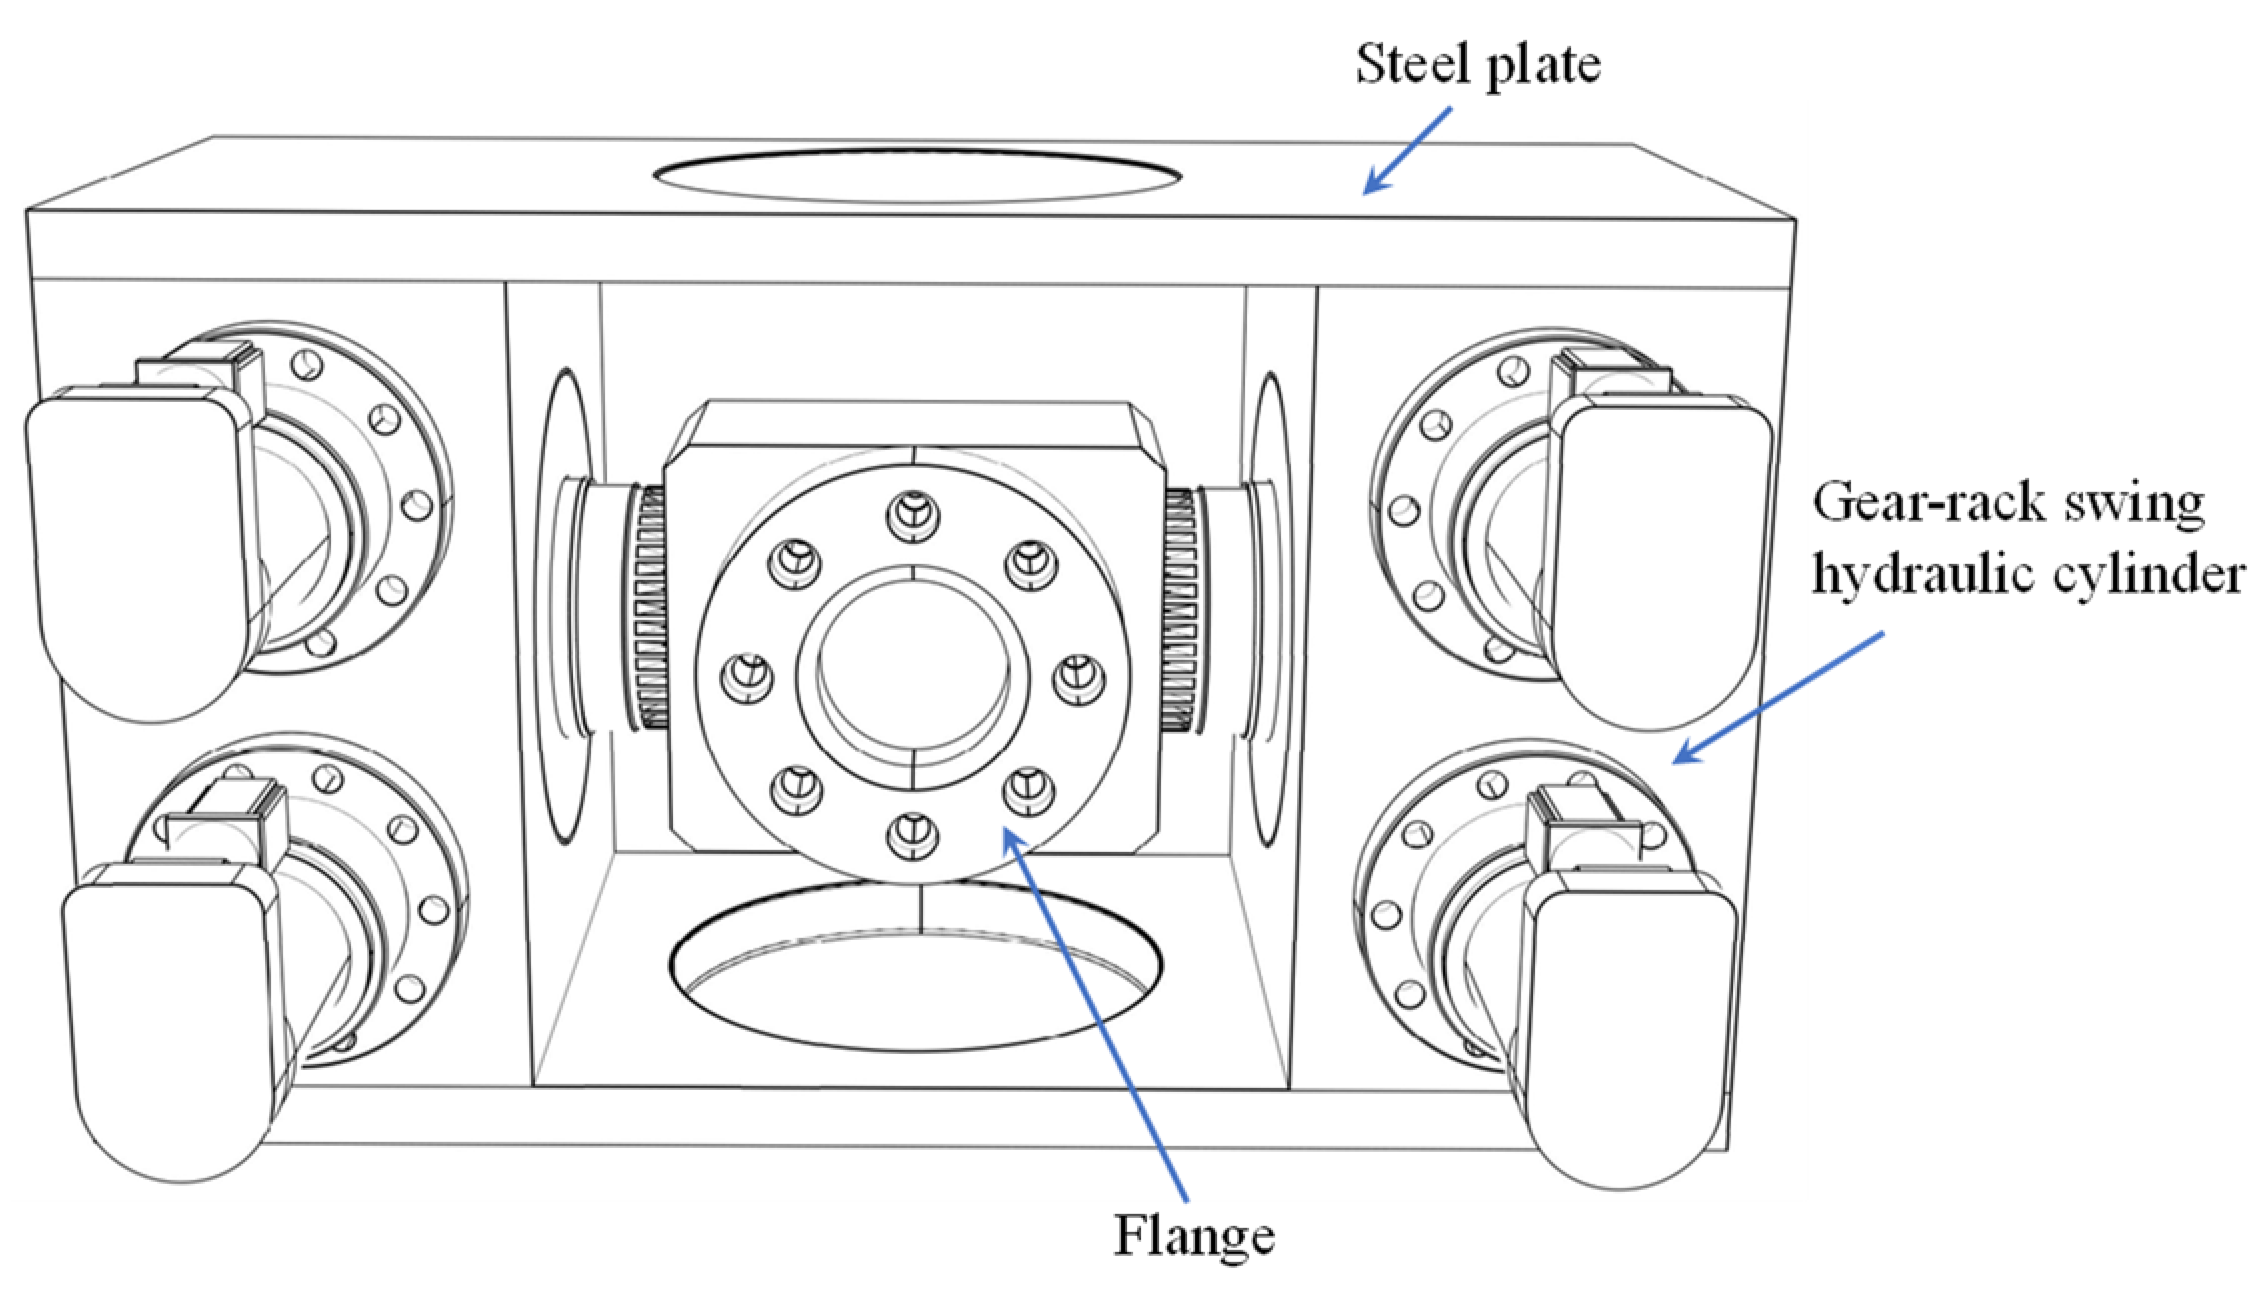
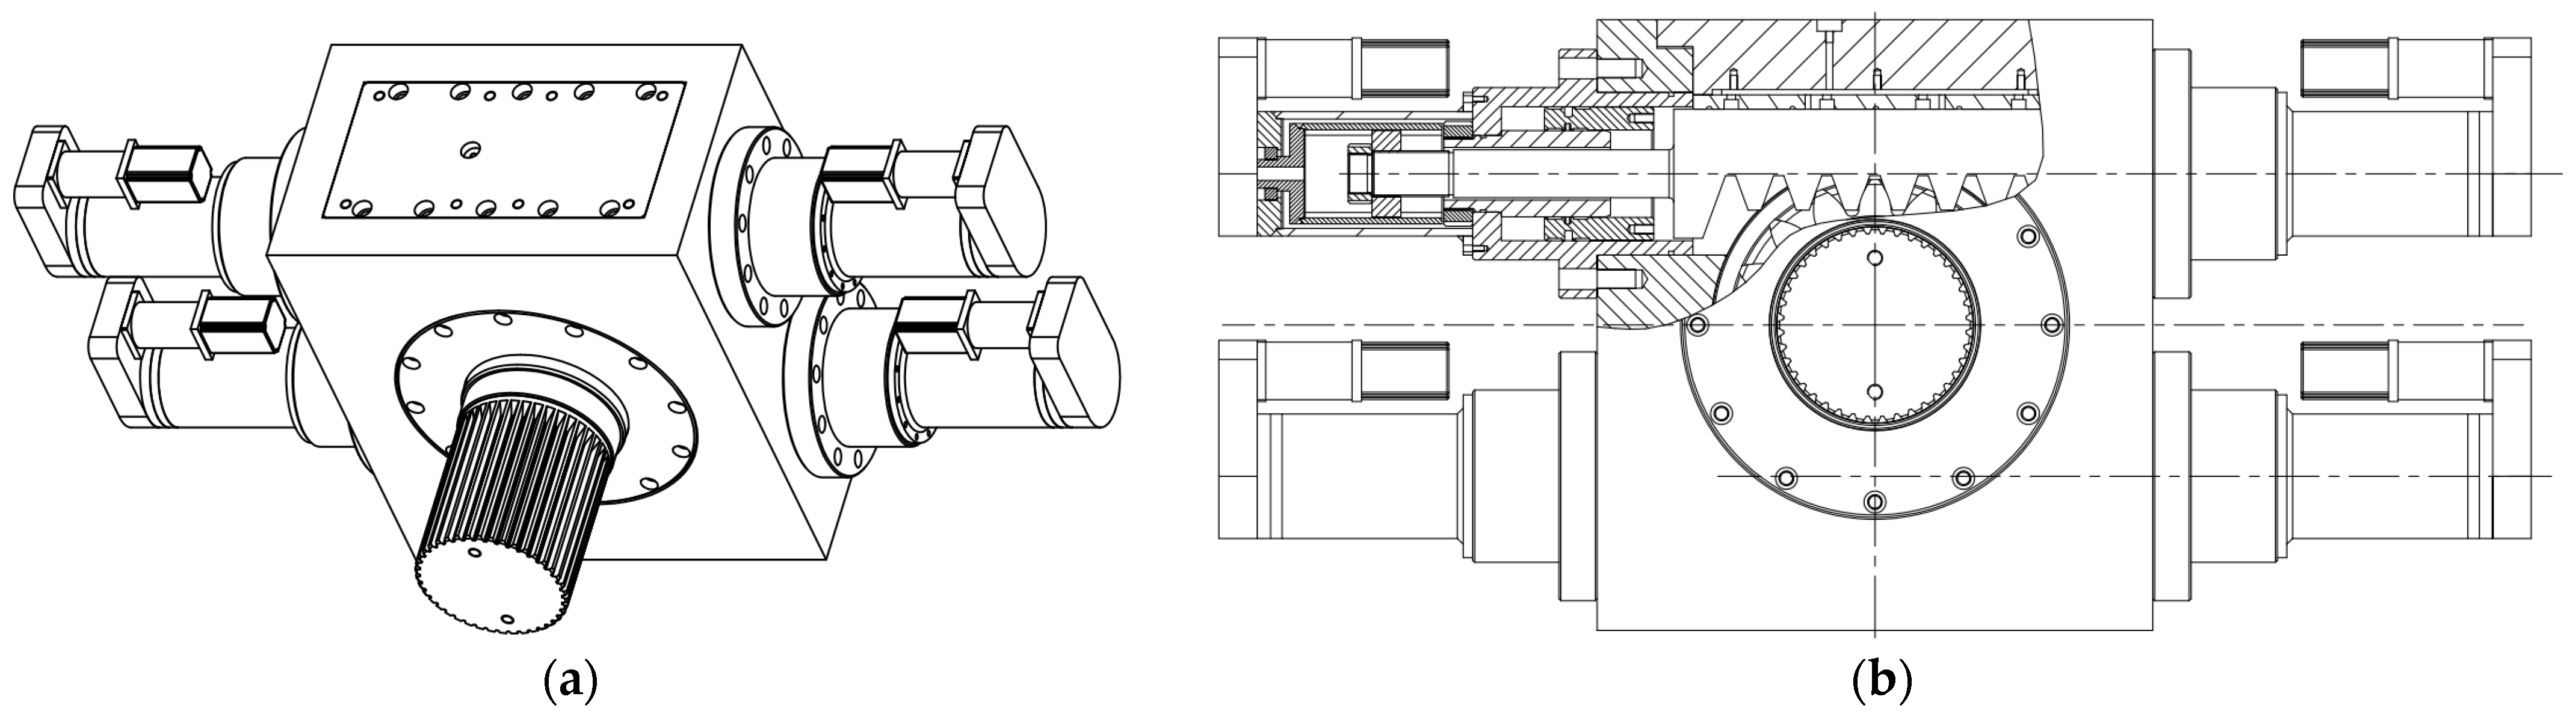
2.3.4. Bending Moment Loading System
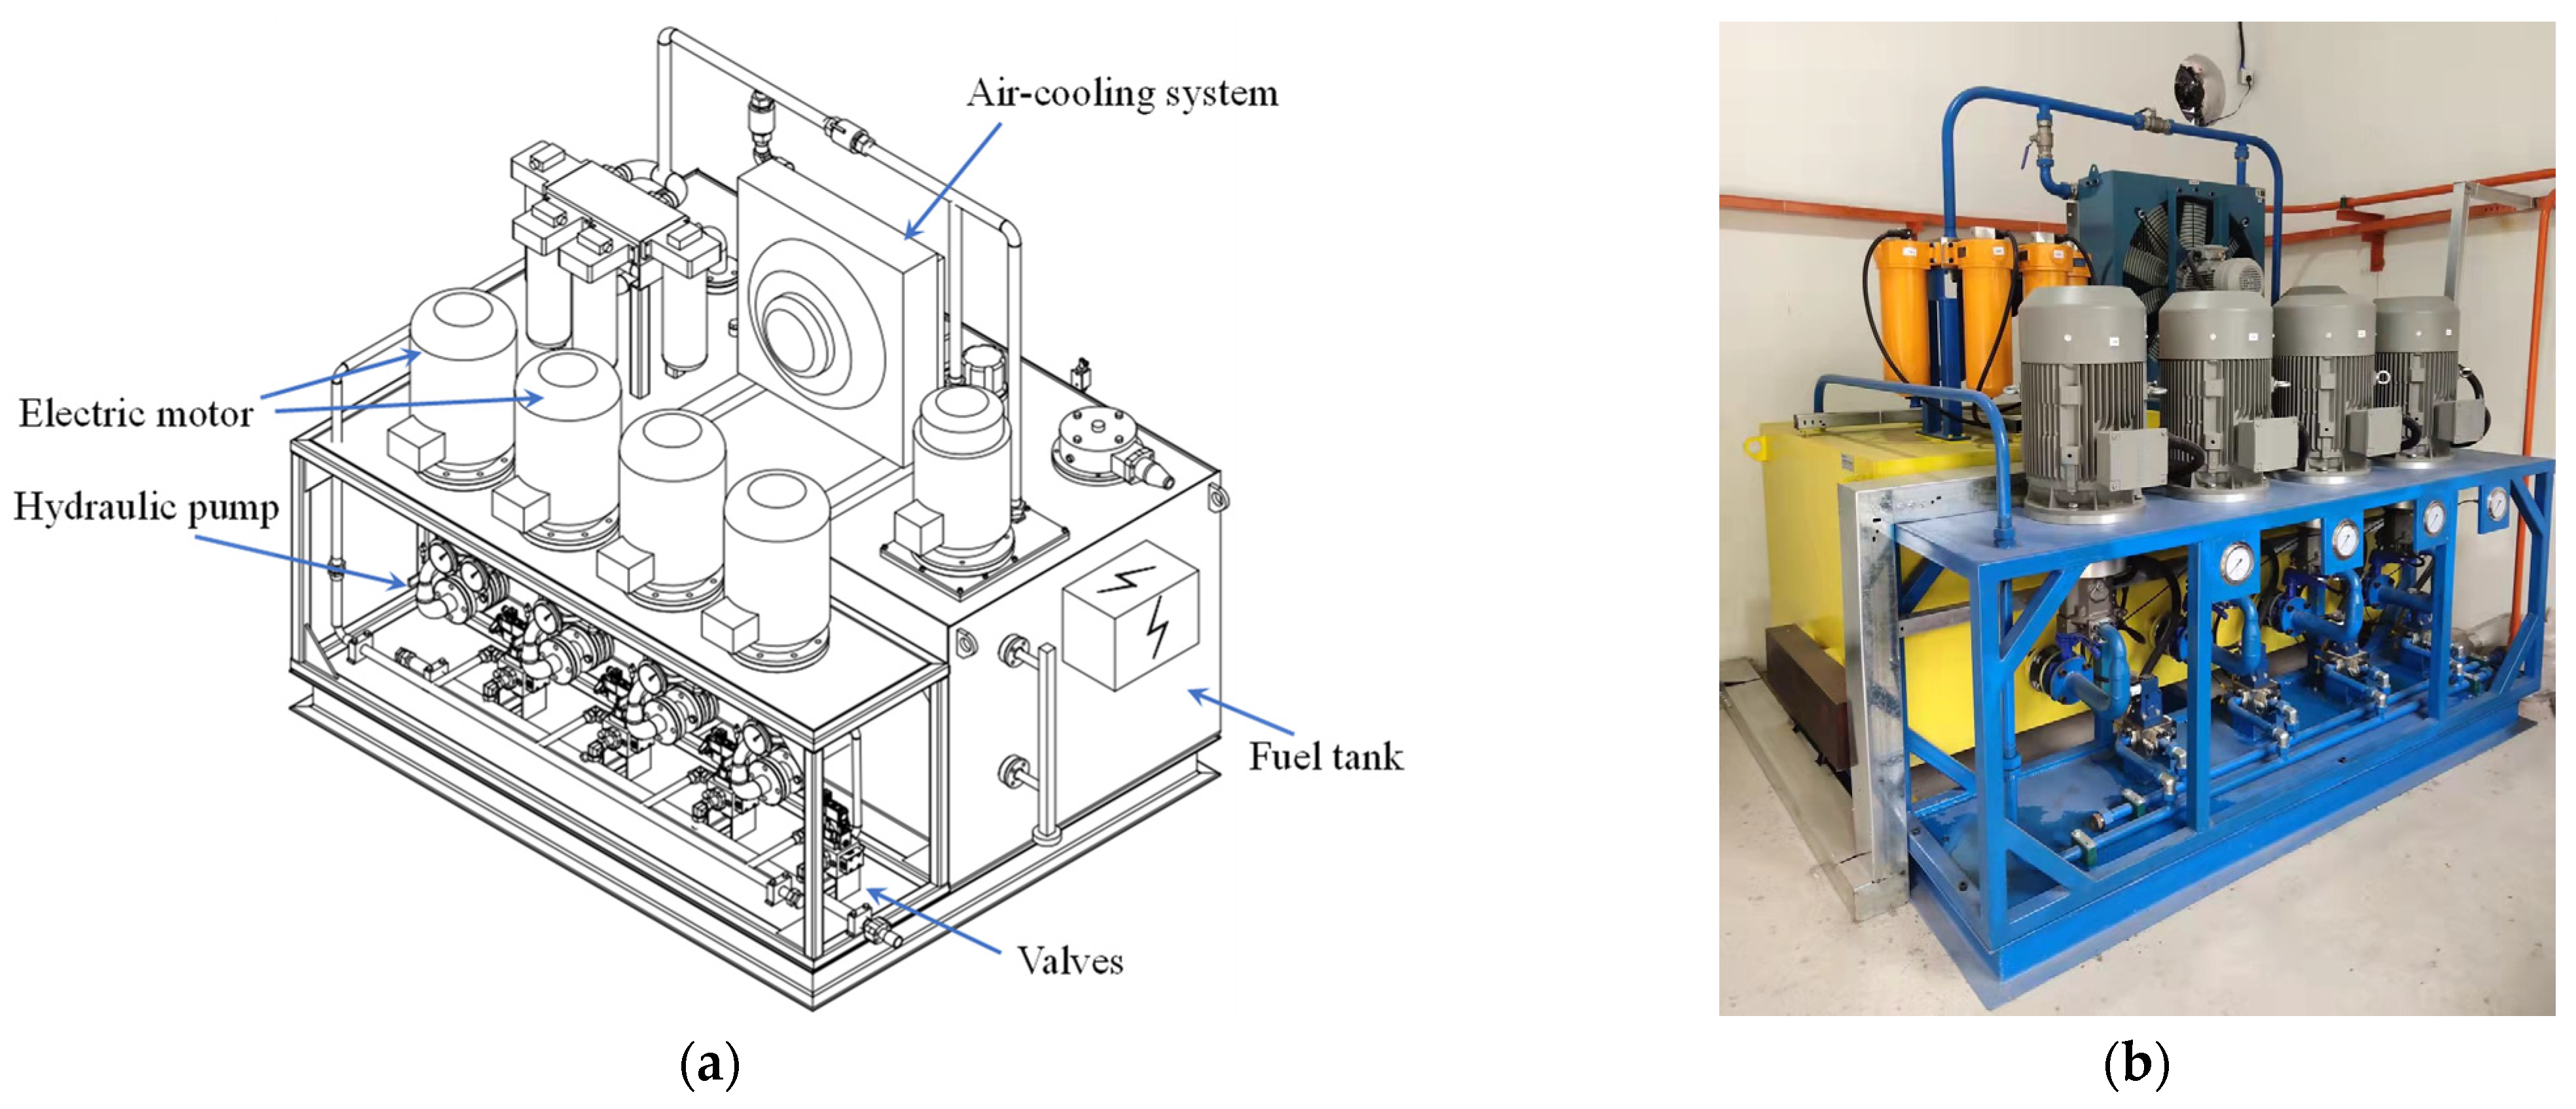
2.3.5. Hydraulic Power Units and Control System
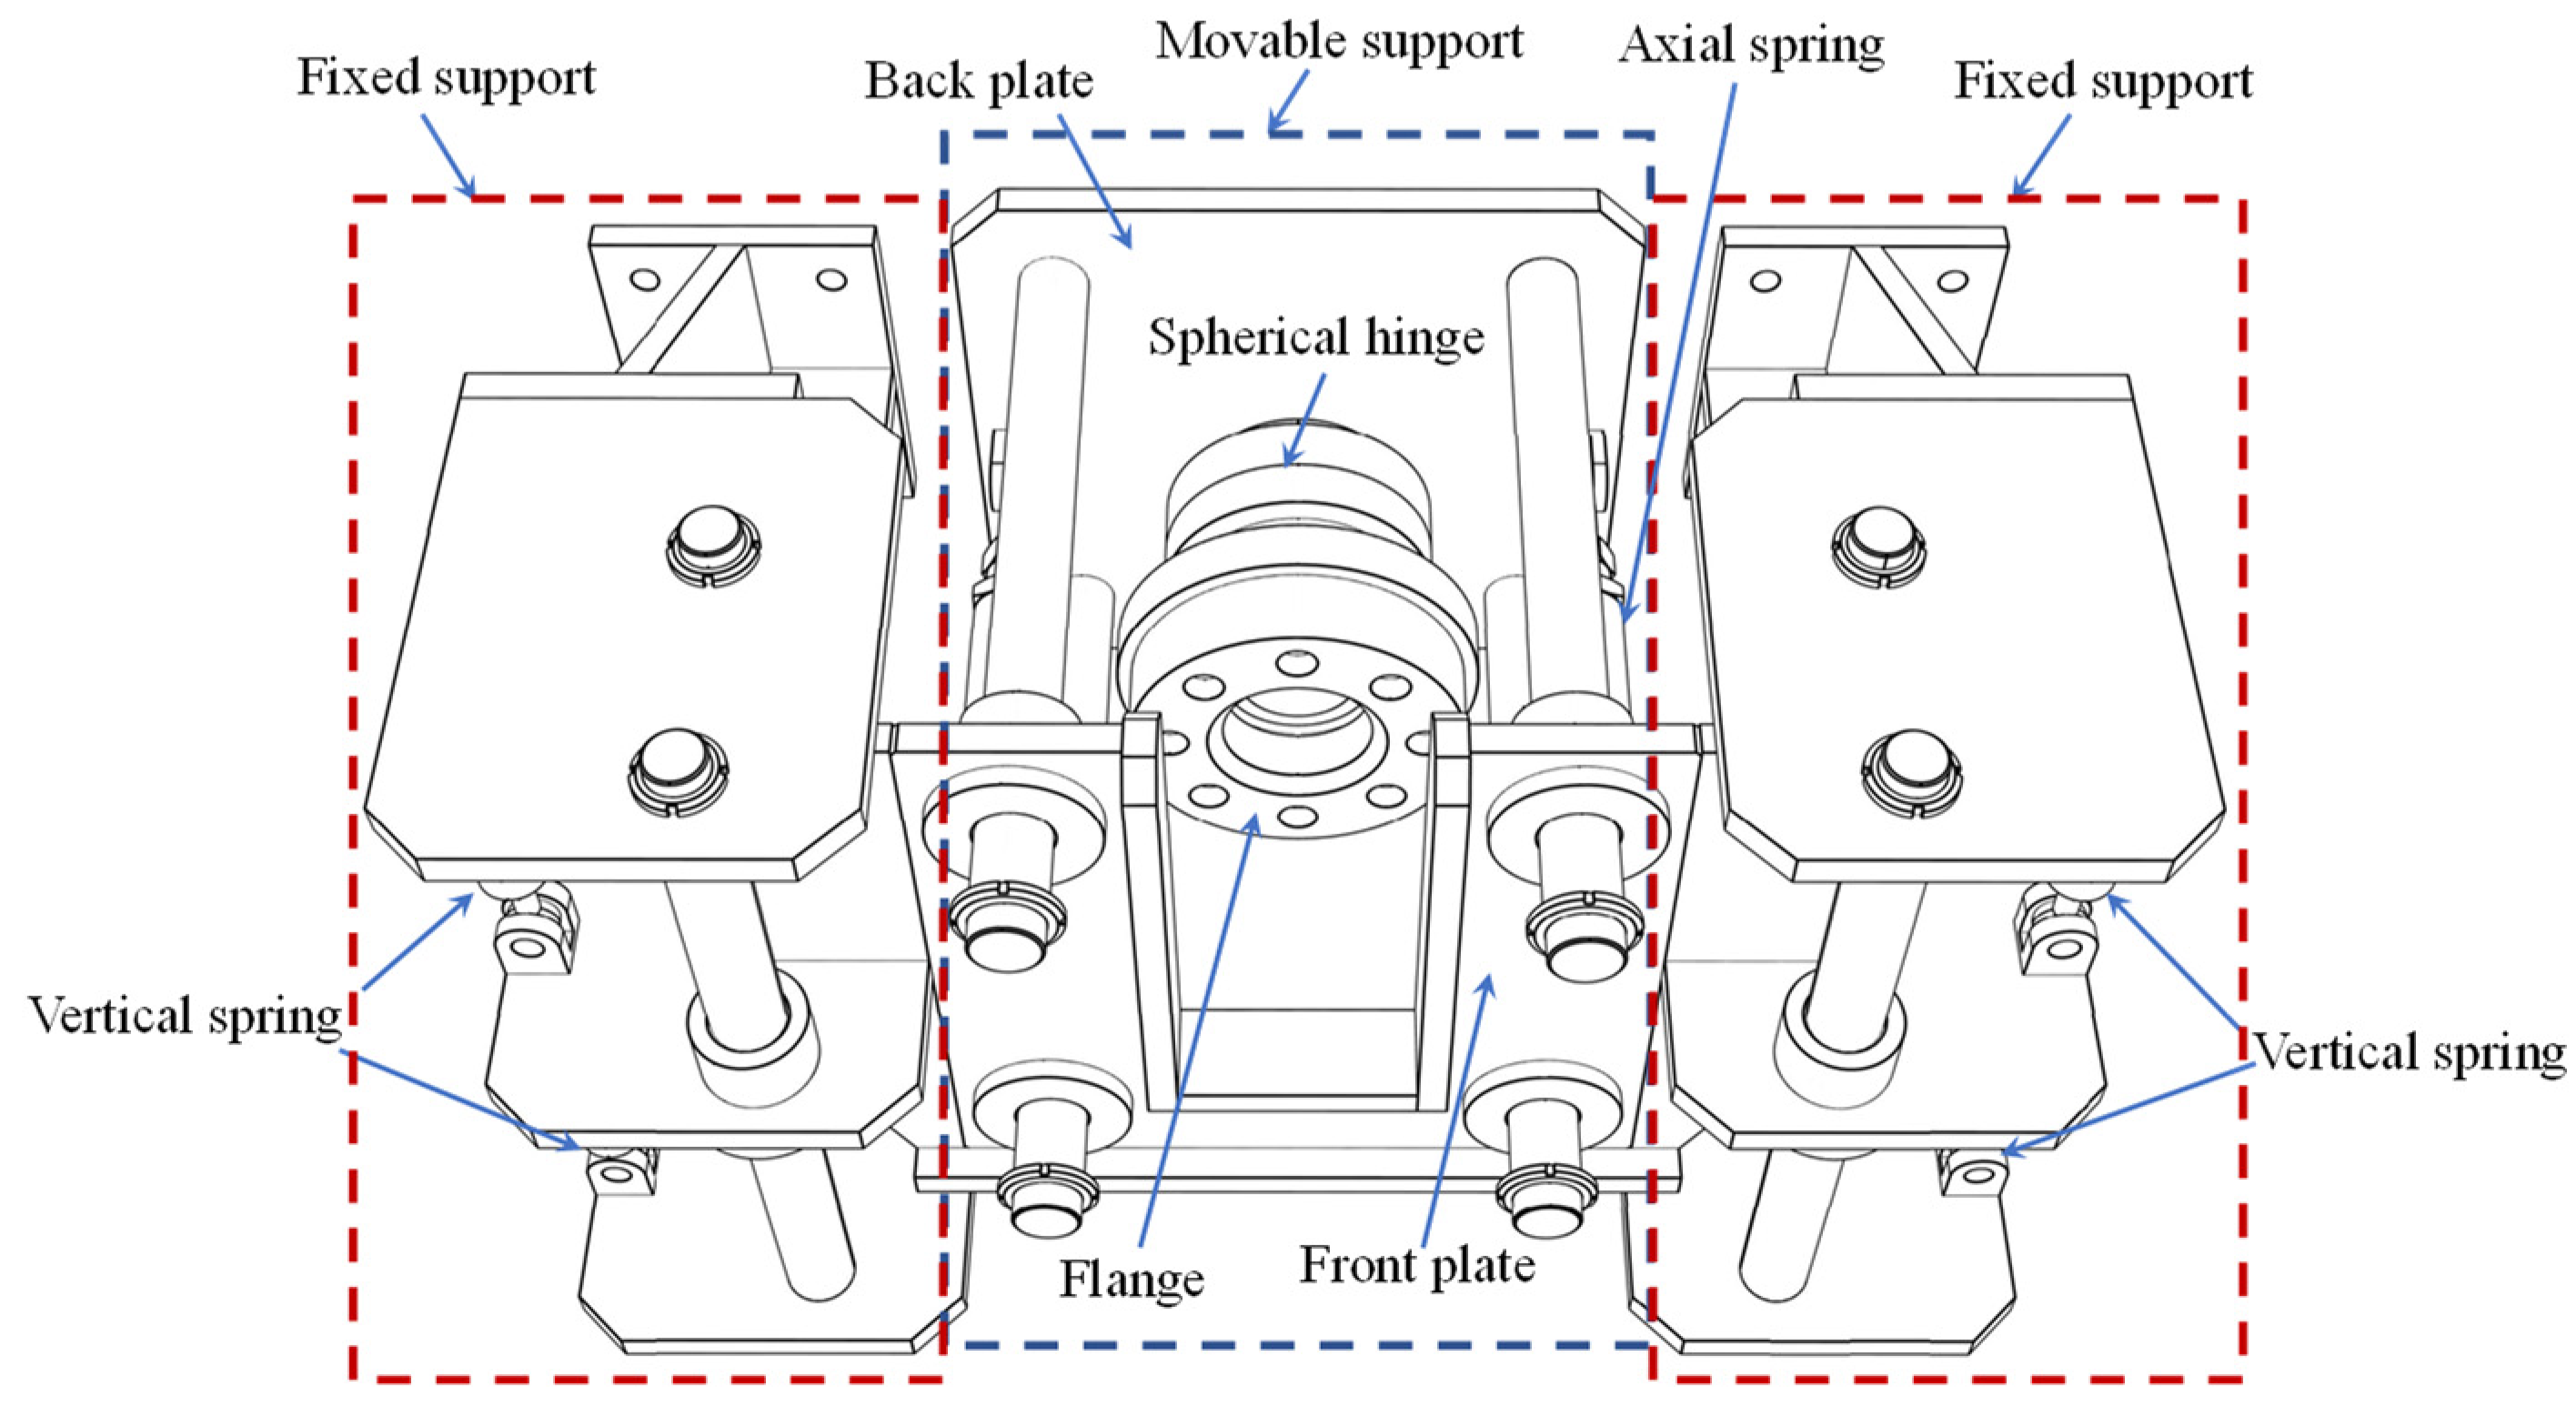
2.3.6. Elastic Support
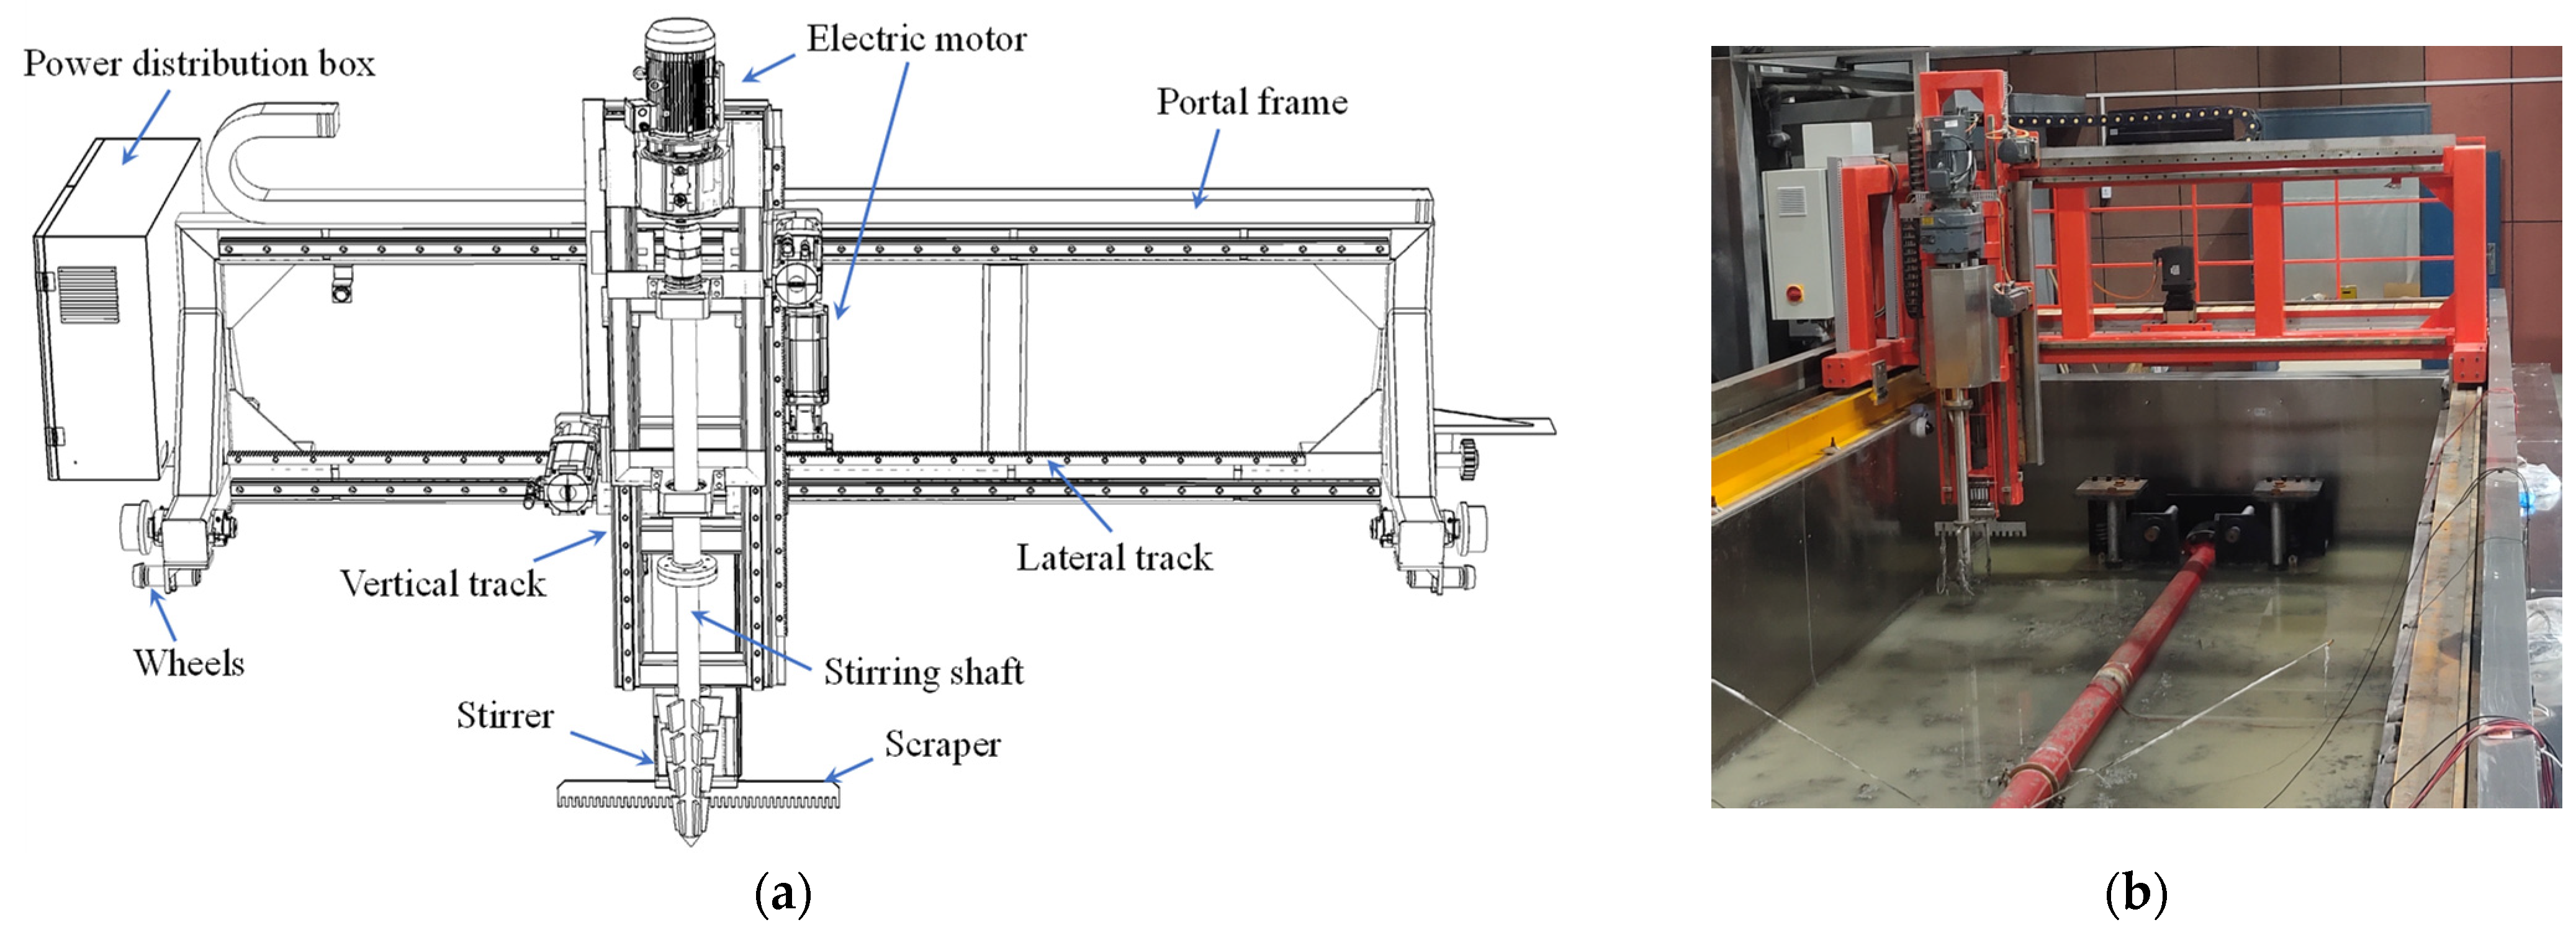
2.4. Soil Stirring System
3. Experiment Setup and Procedures
3.1. Determination of Experimental Parameters
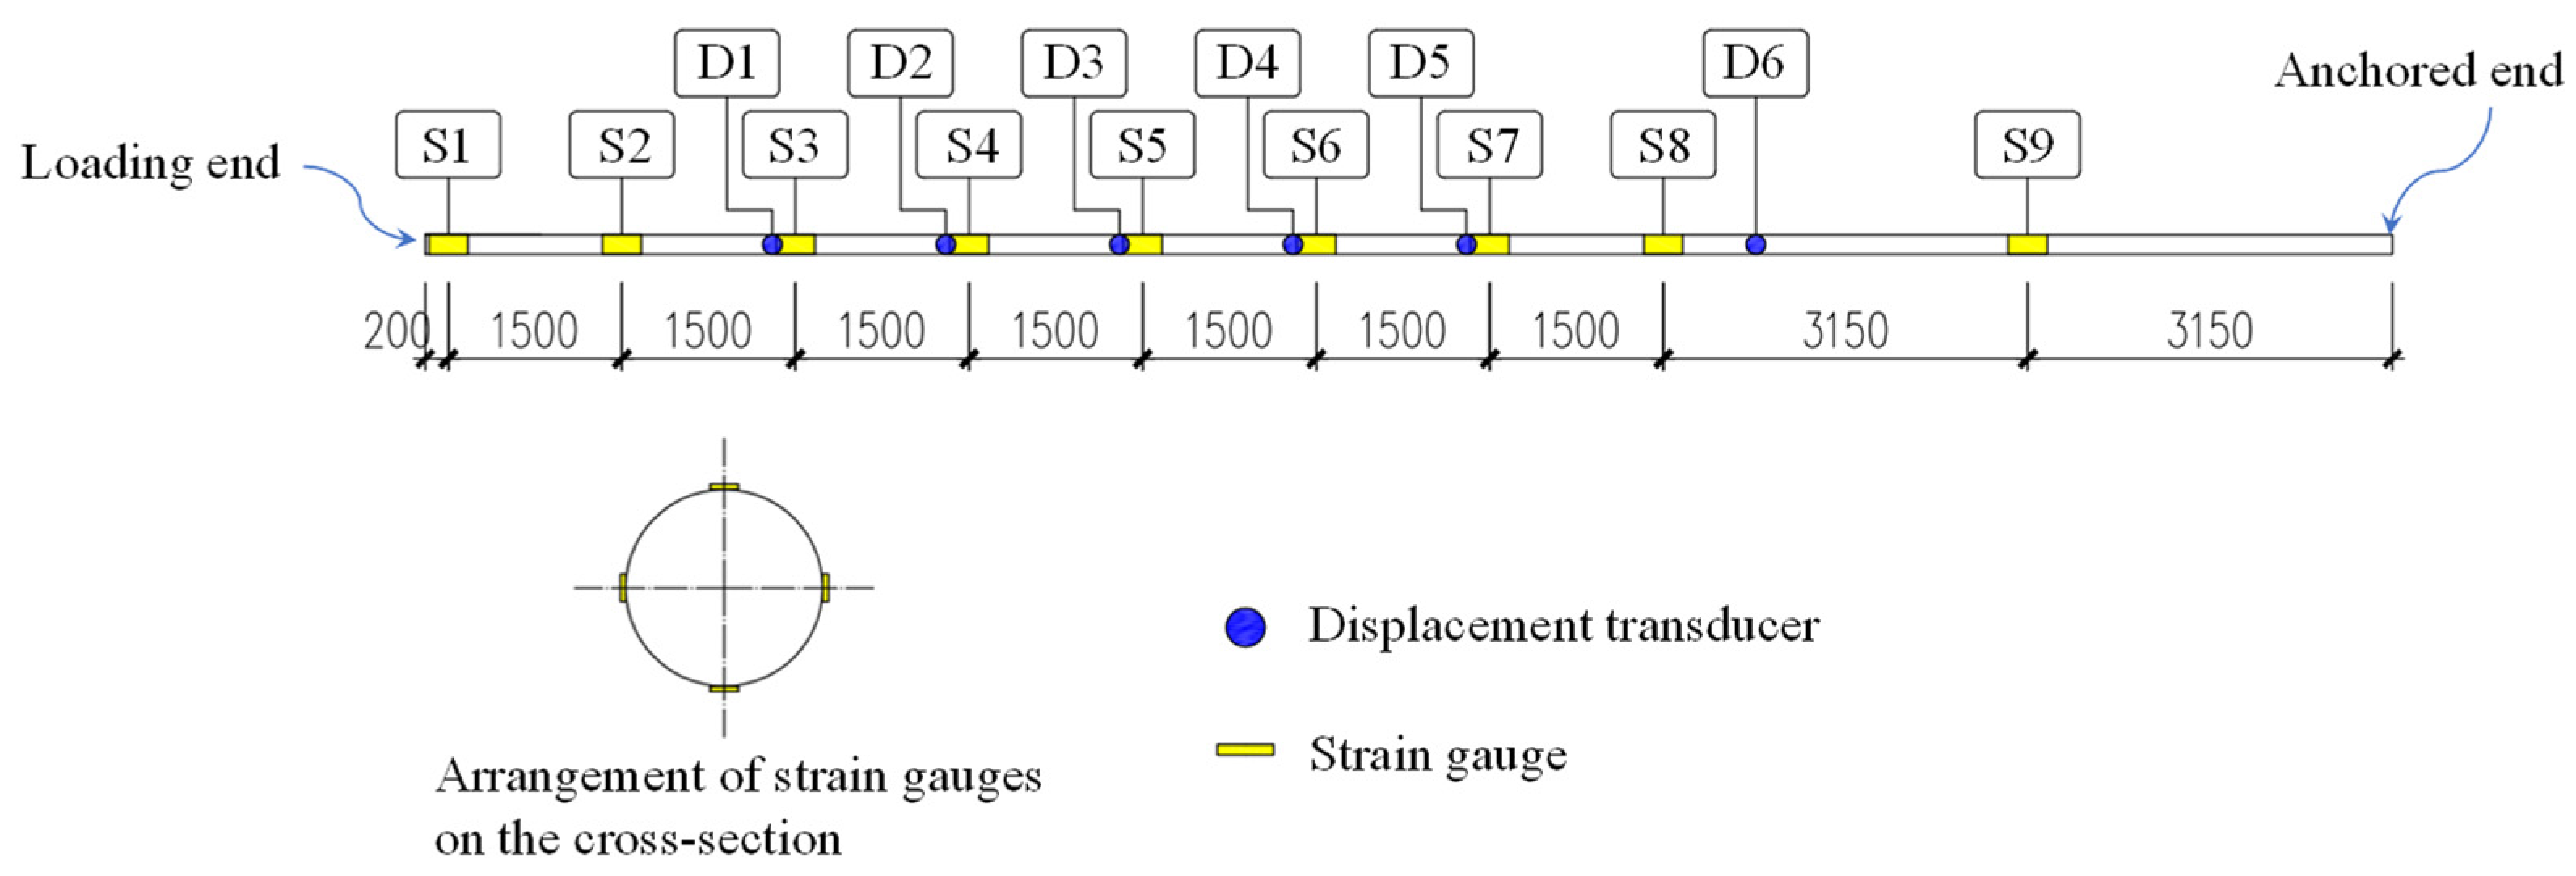
3.2. Layout of Instrumentation
3.3. Test Procedures
4. Experiment Results and Analysis
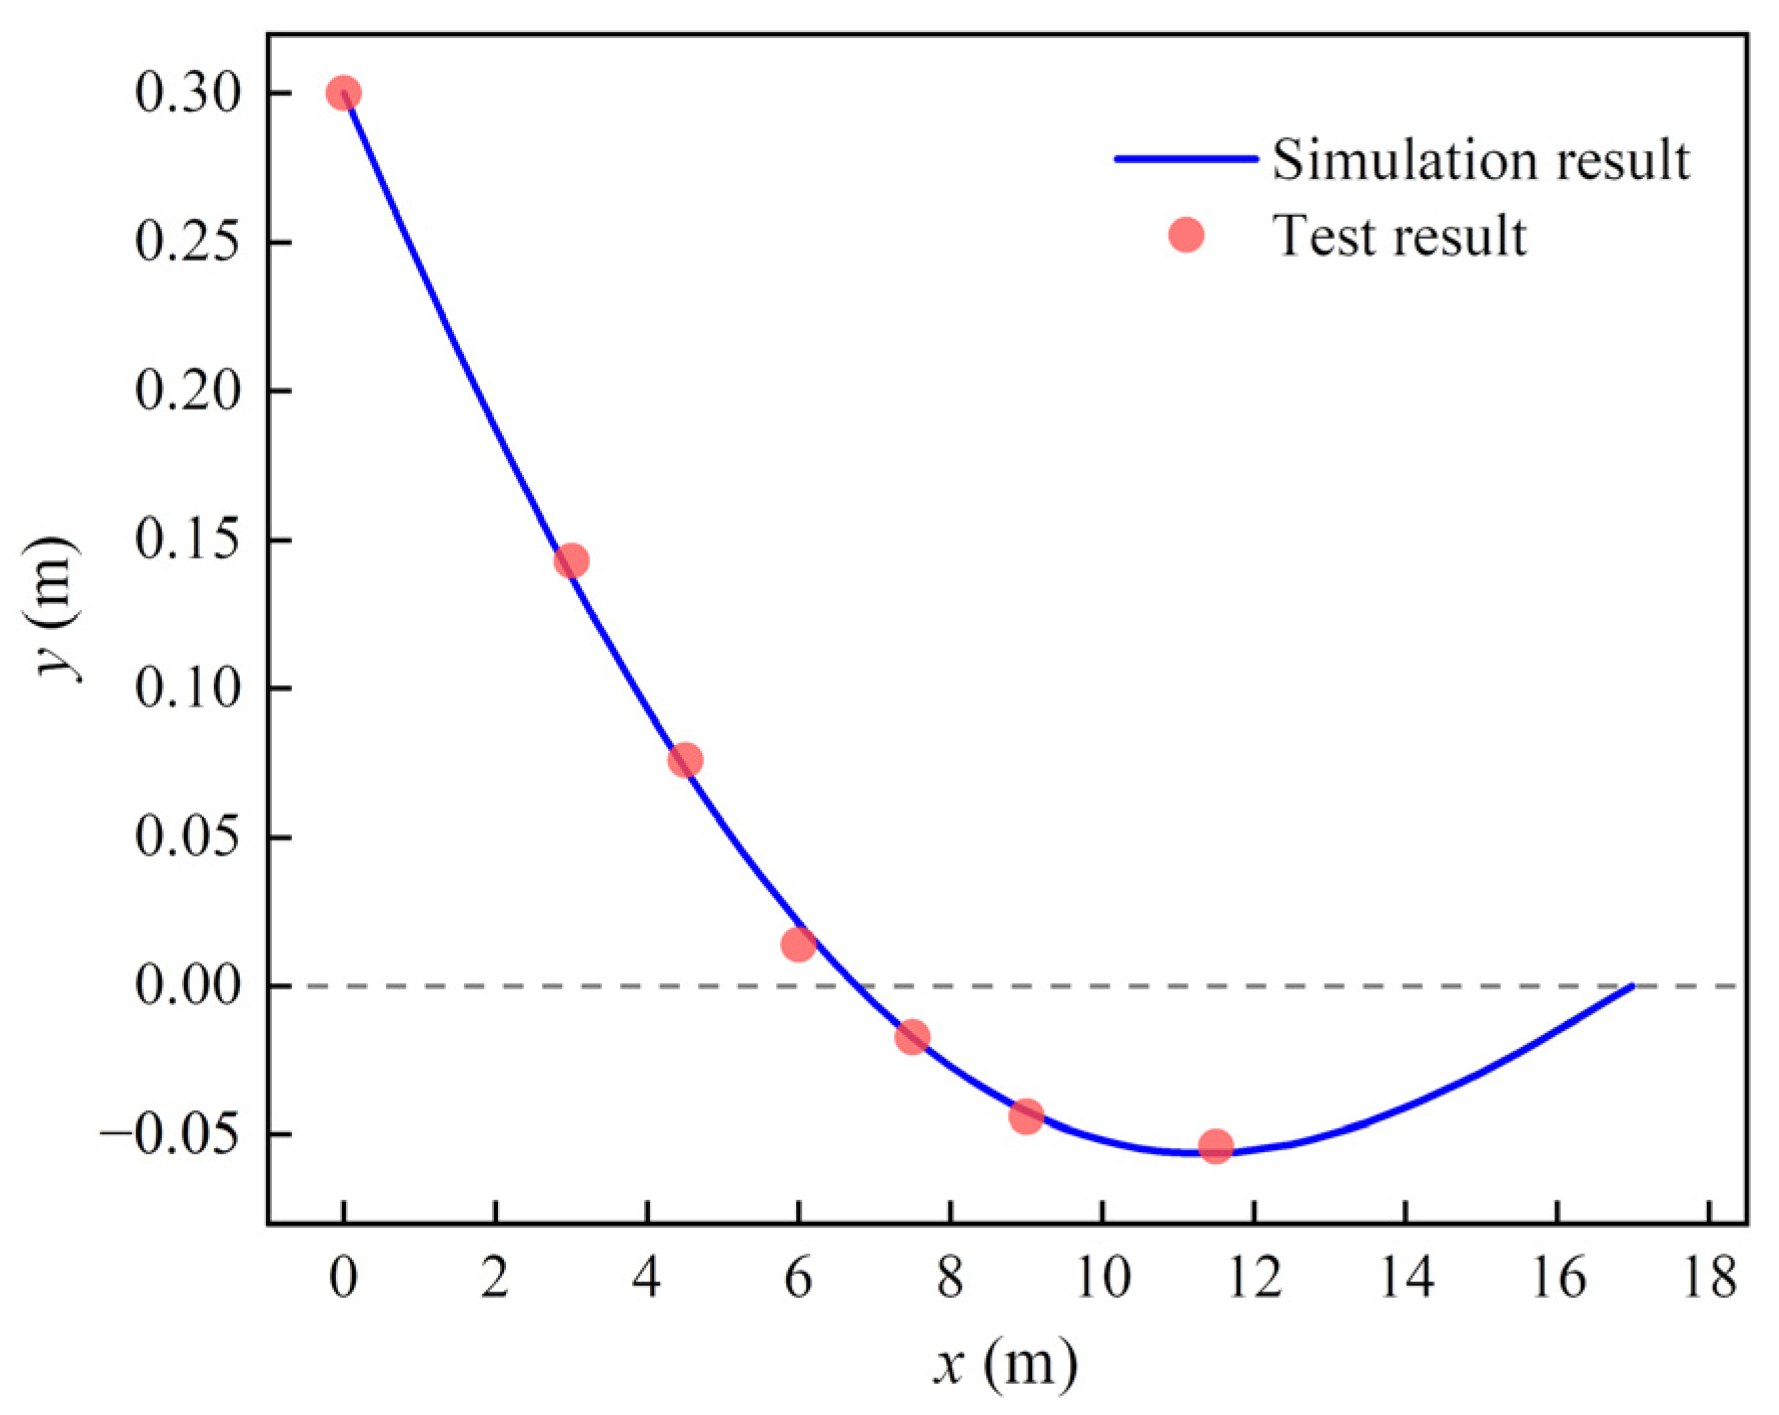
4.1. Static Loading Stage and Numerical Comparison
4.2. Cyclic Vertical Displacement Loading
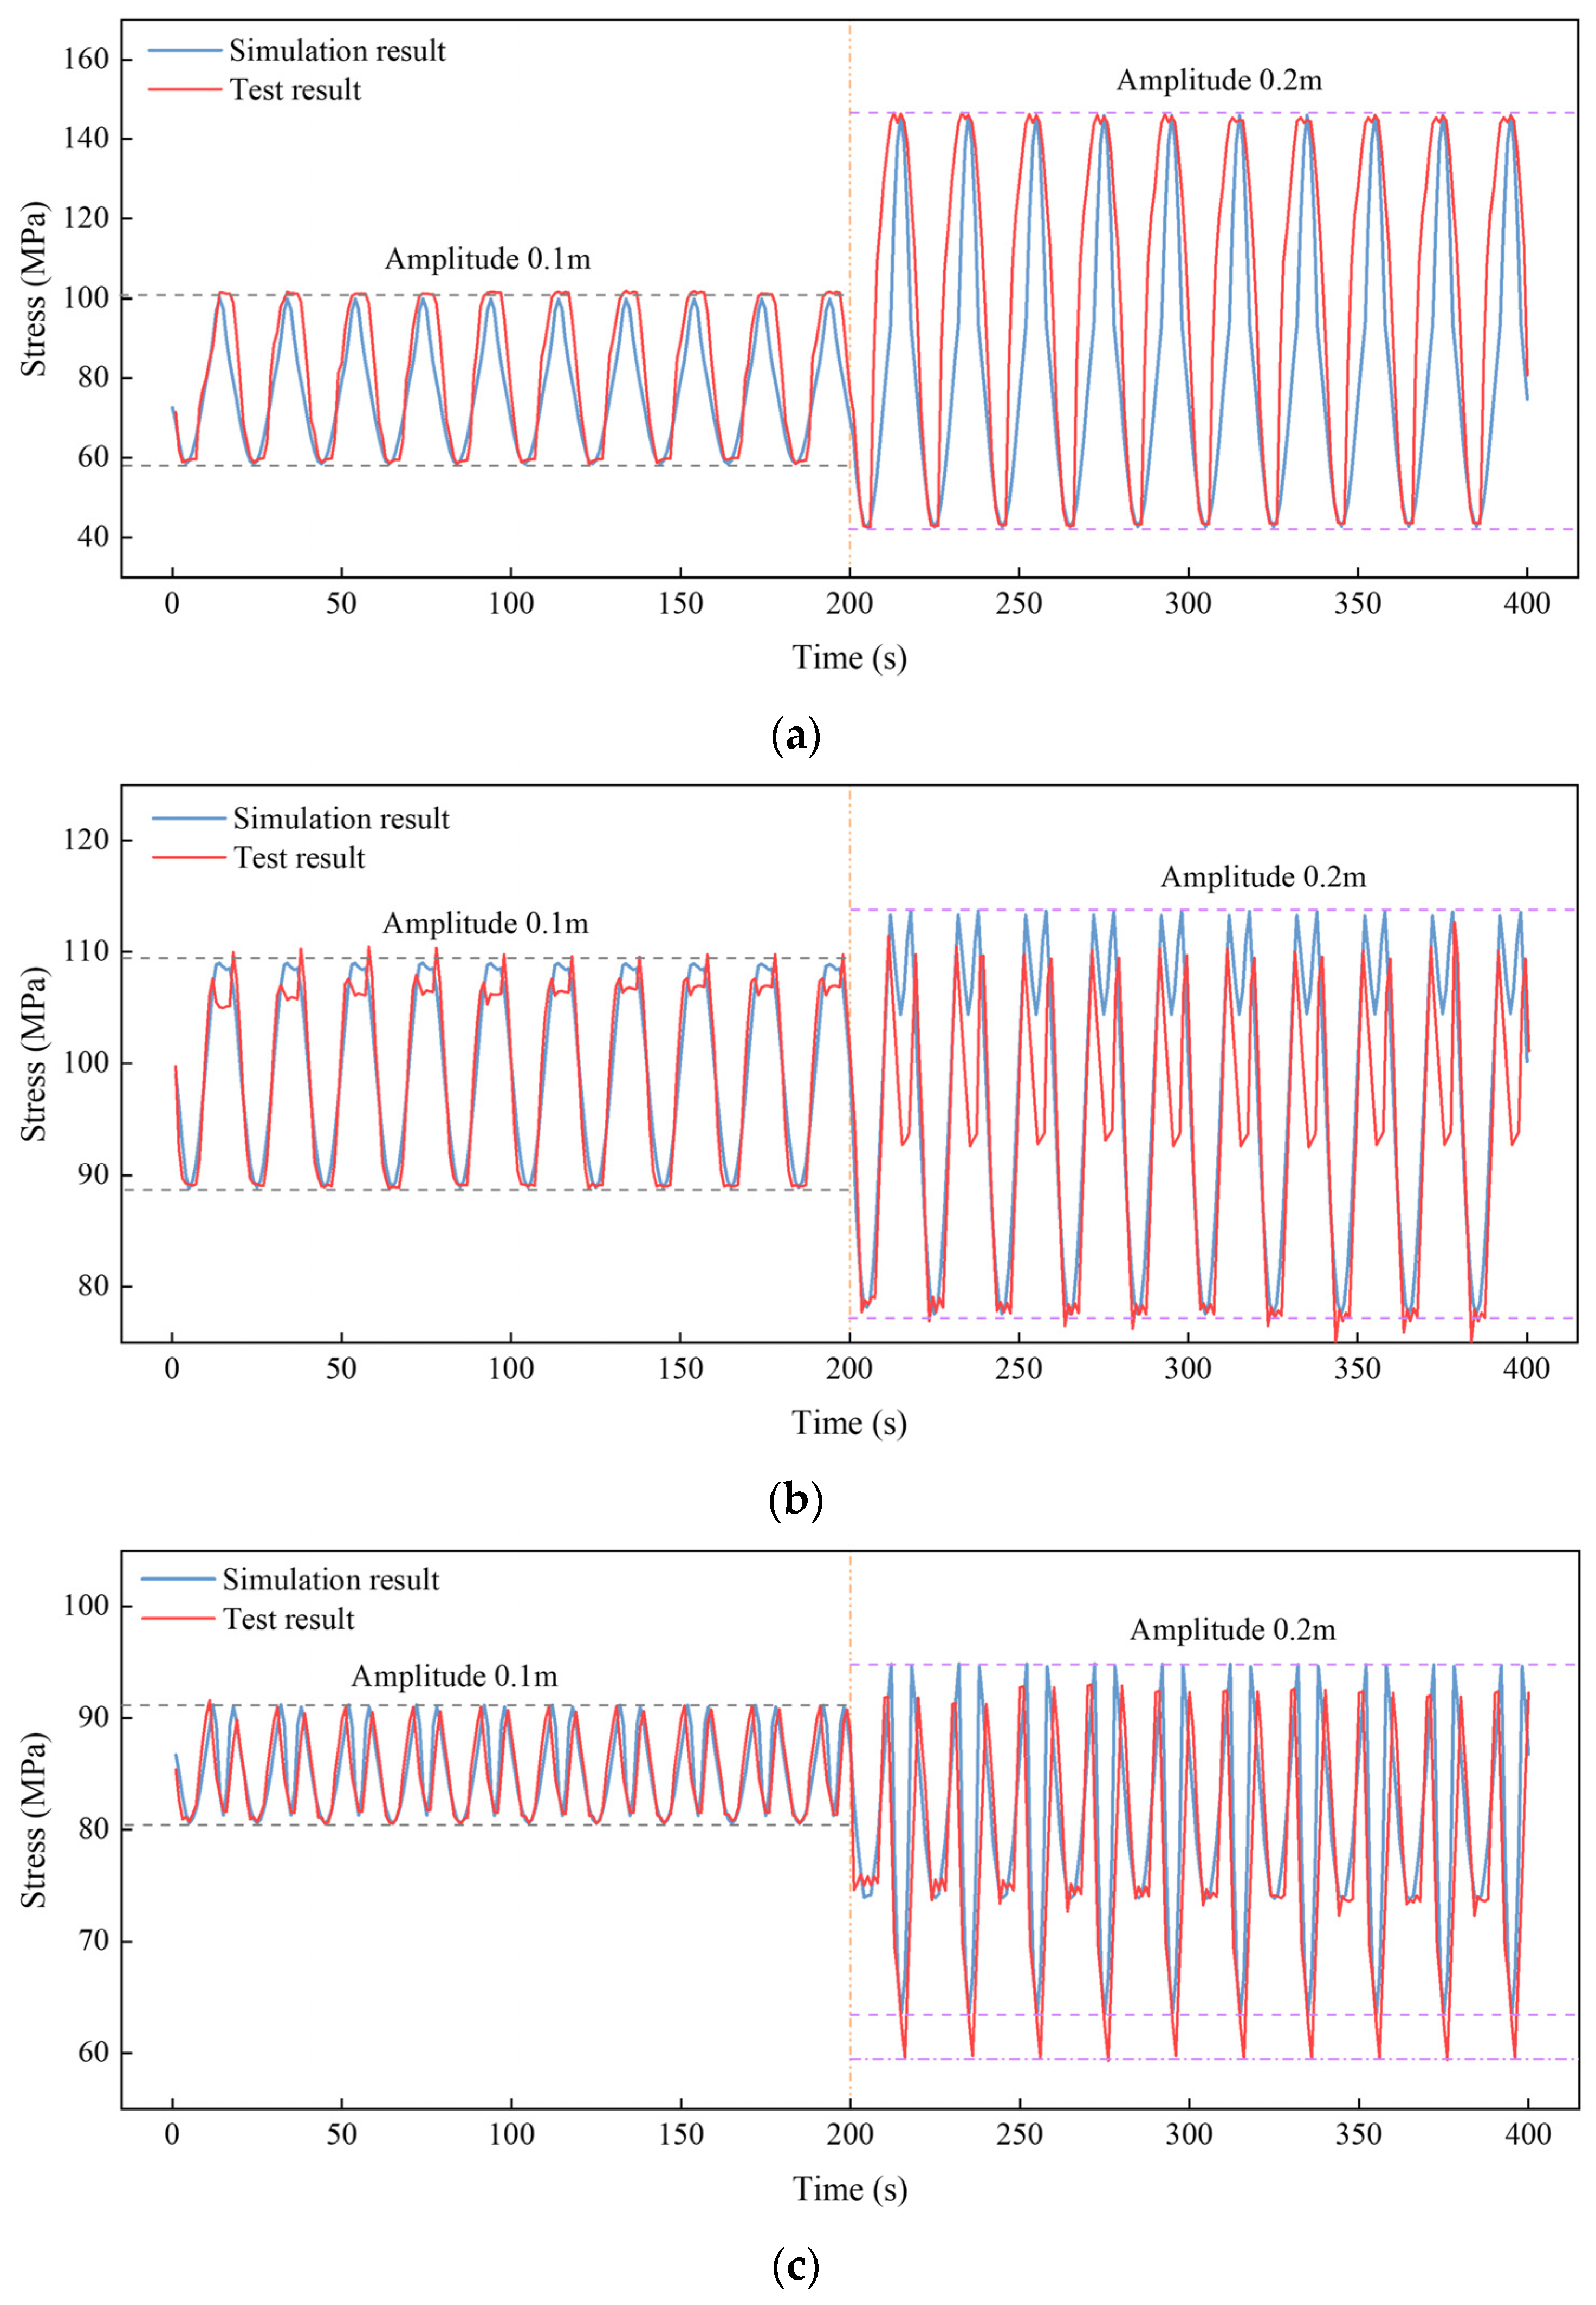
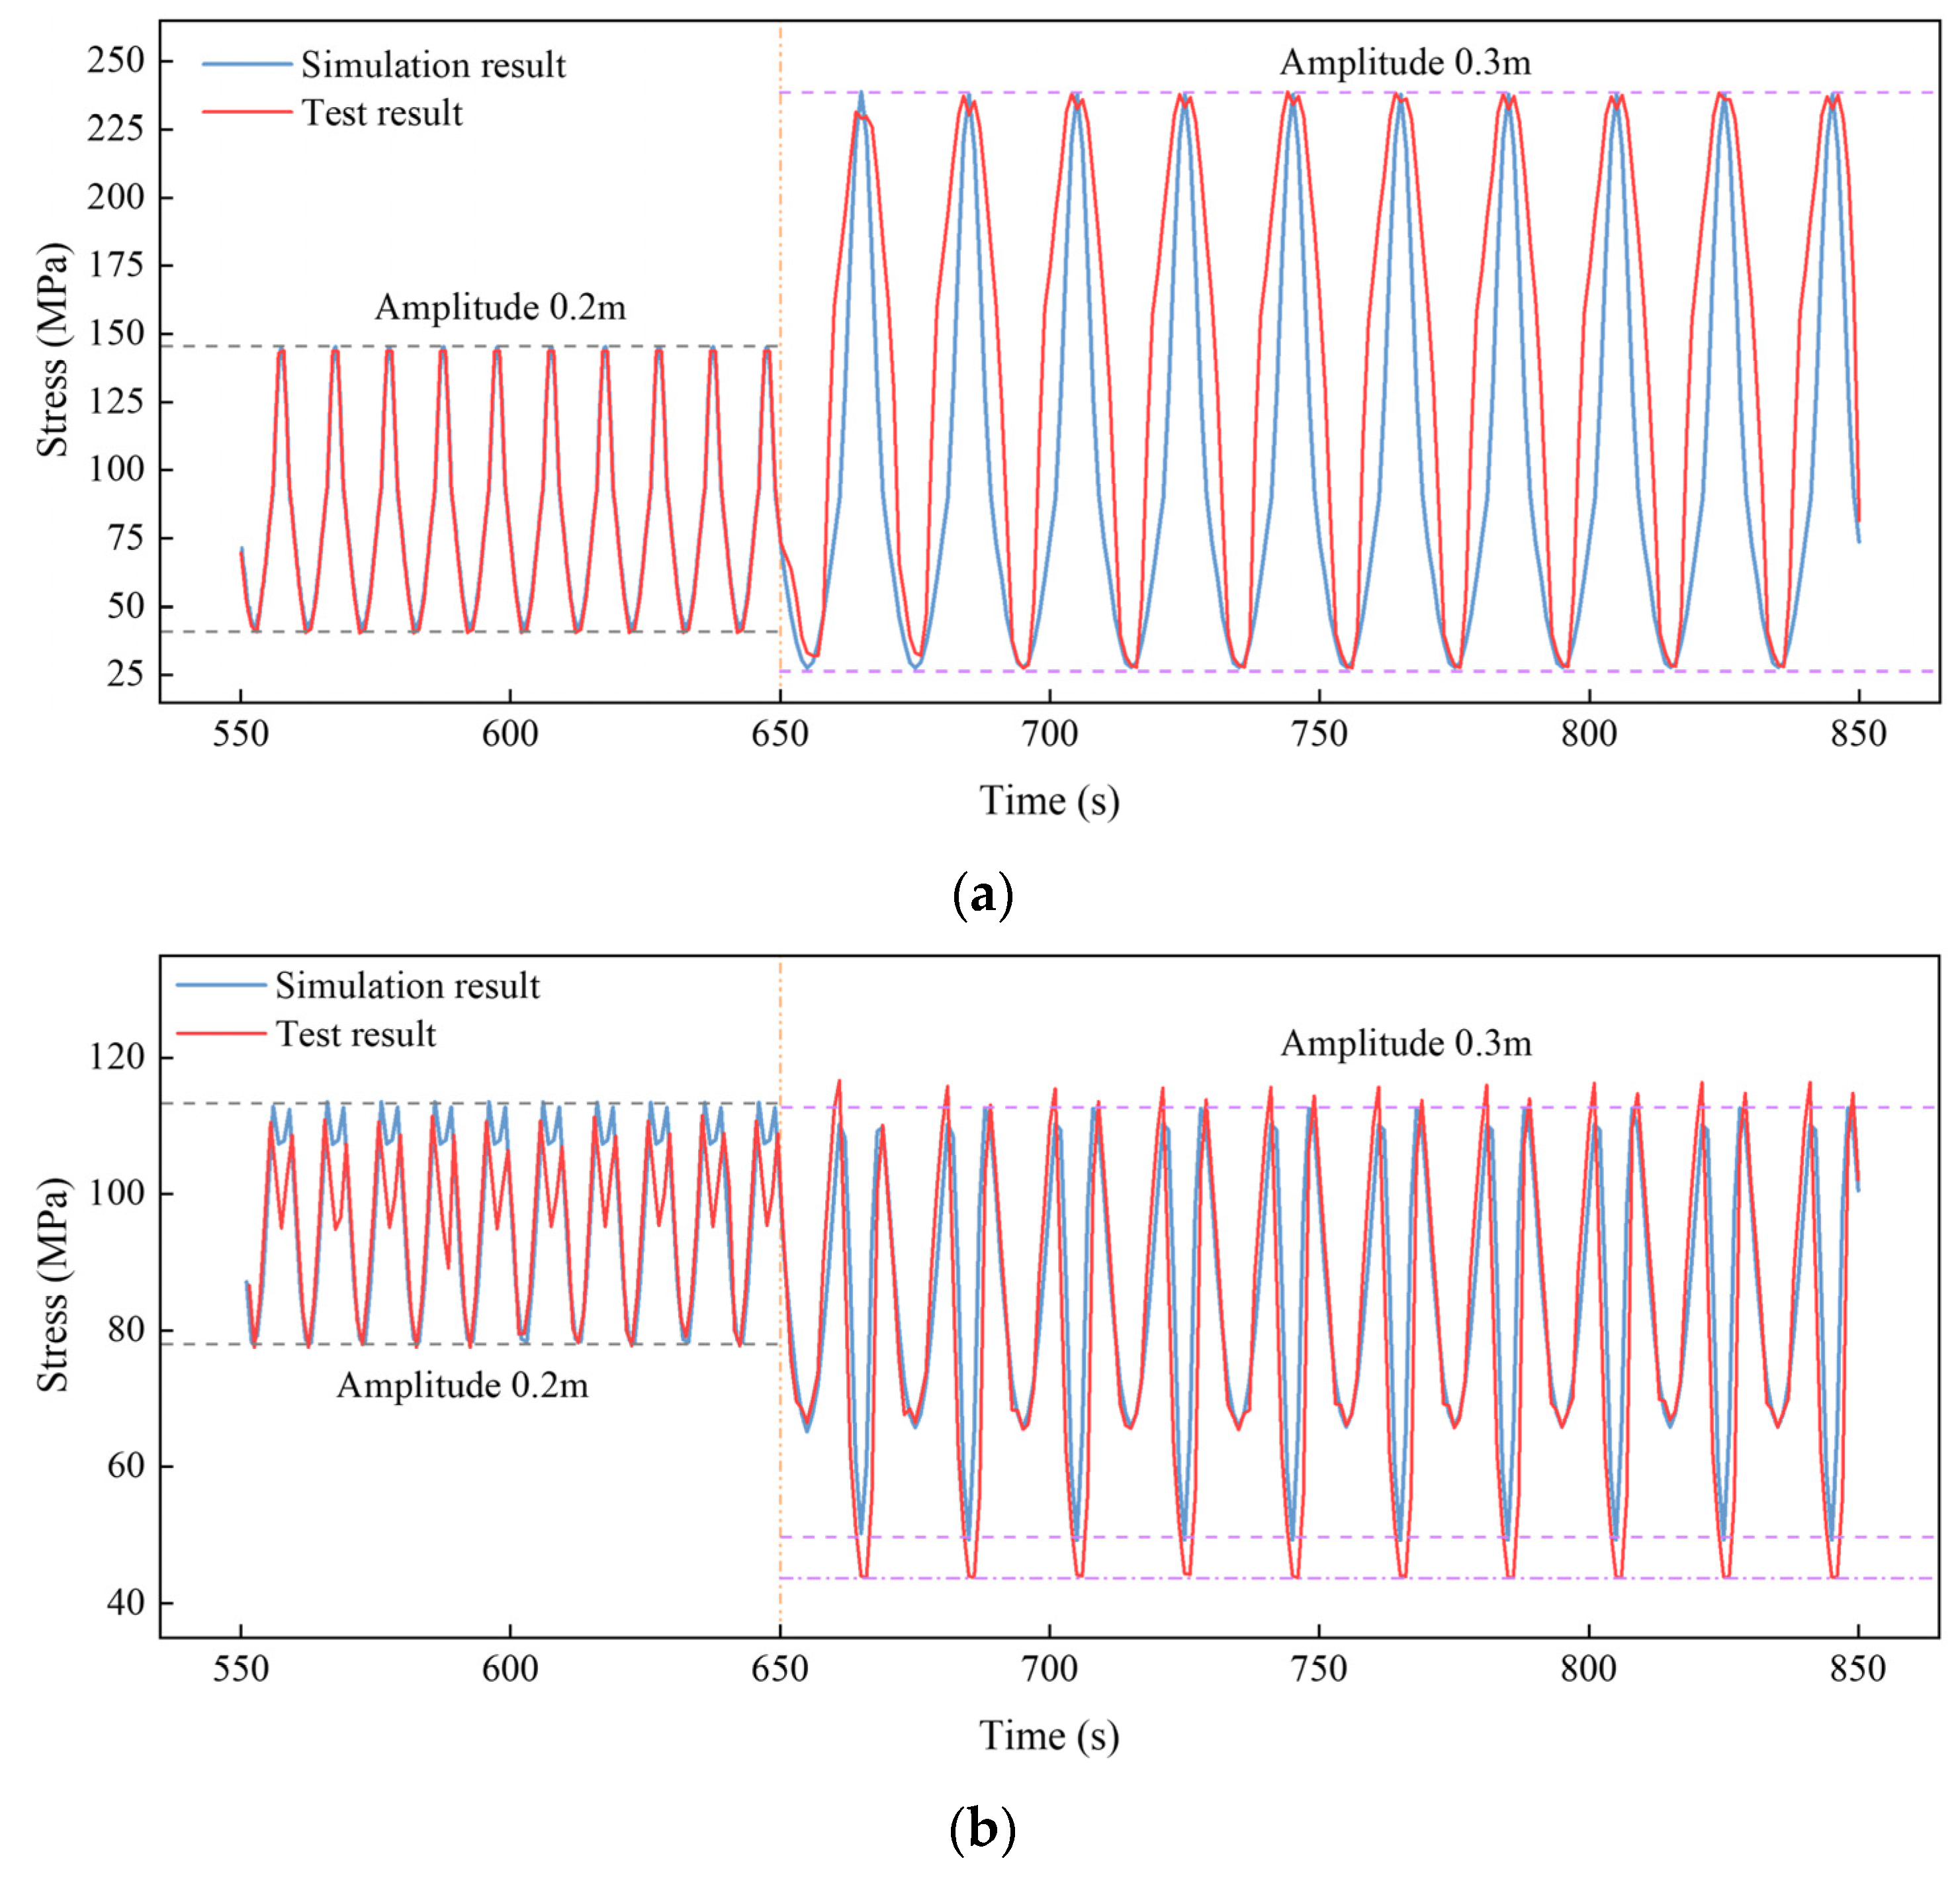
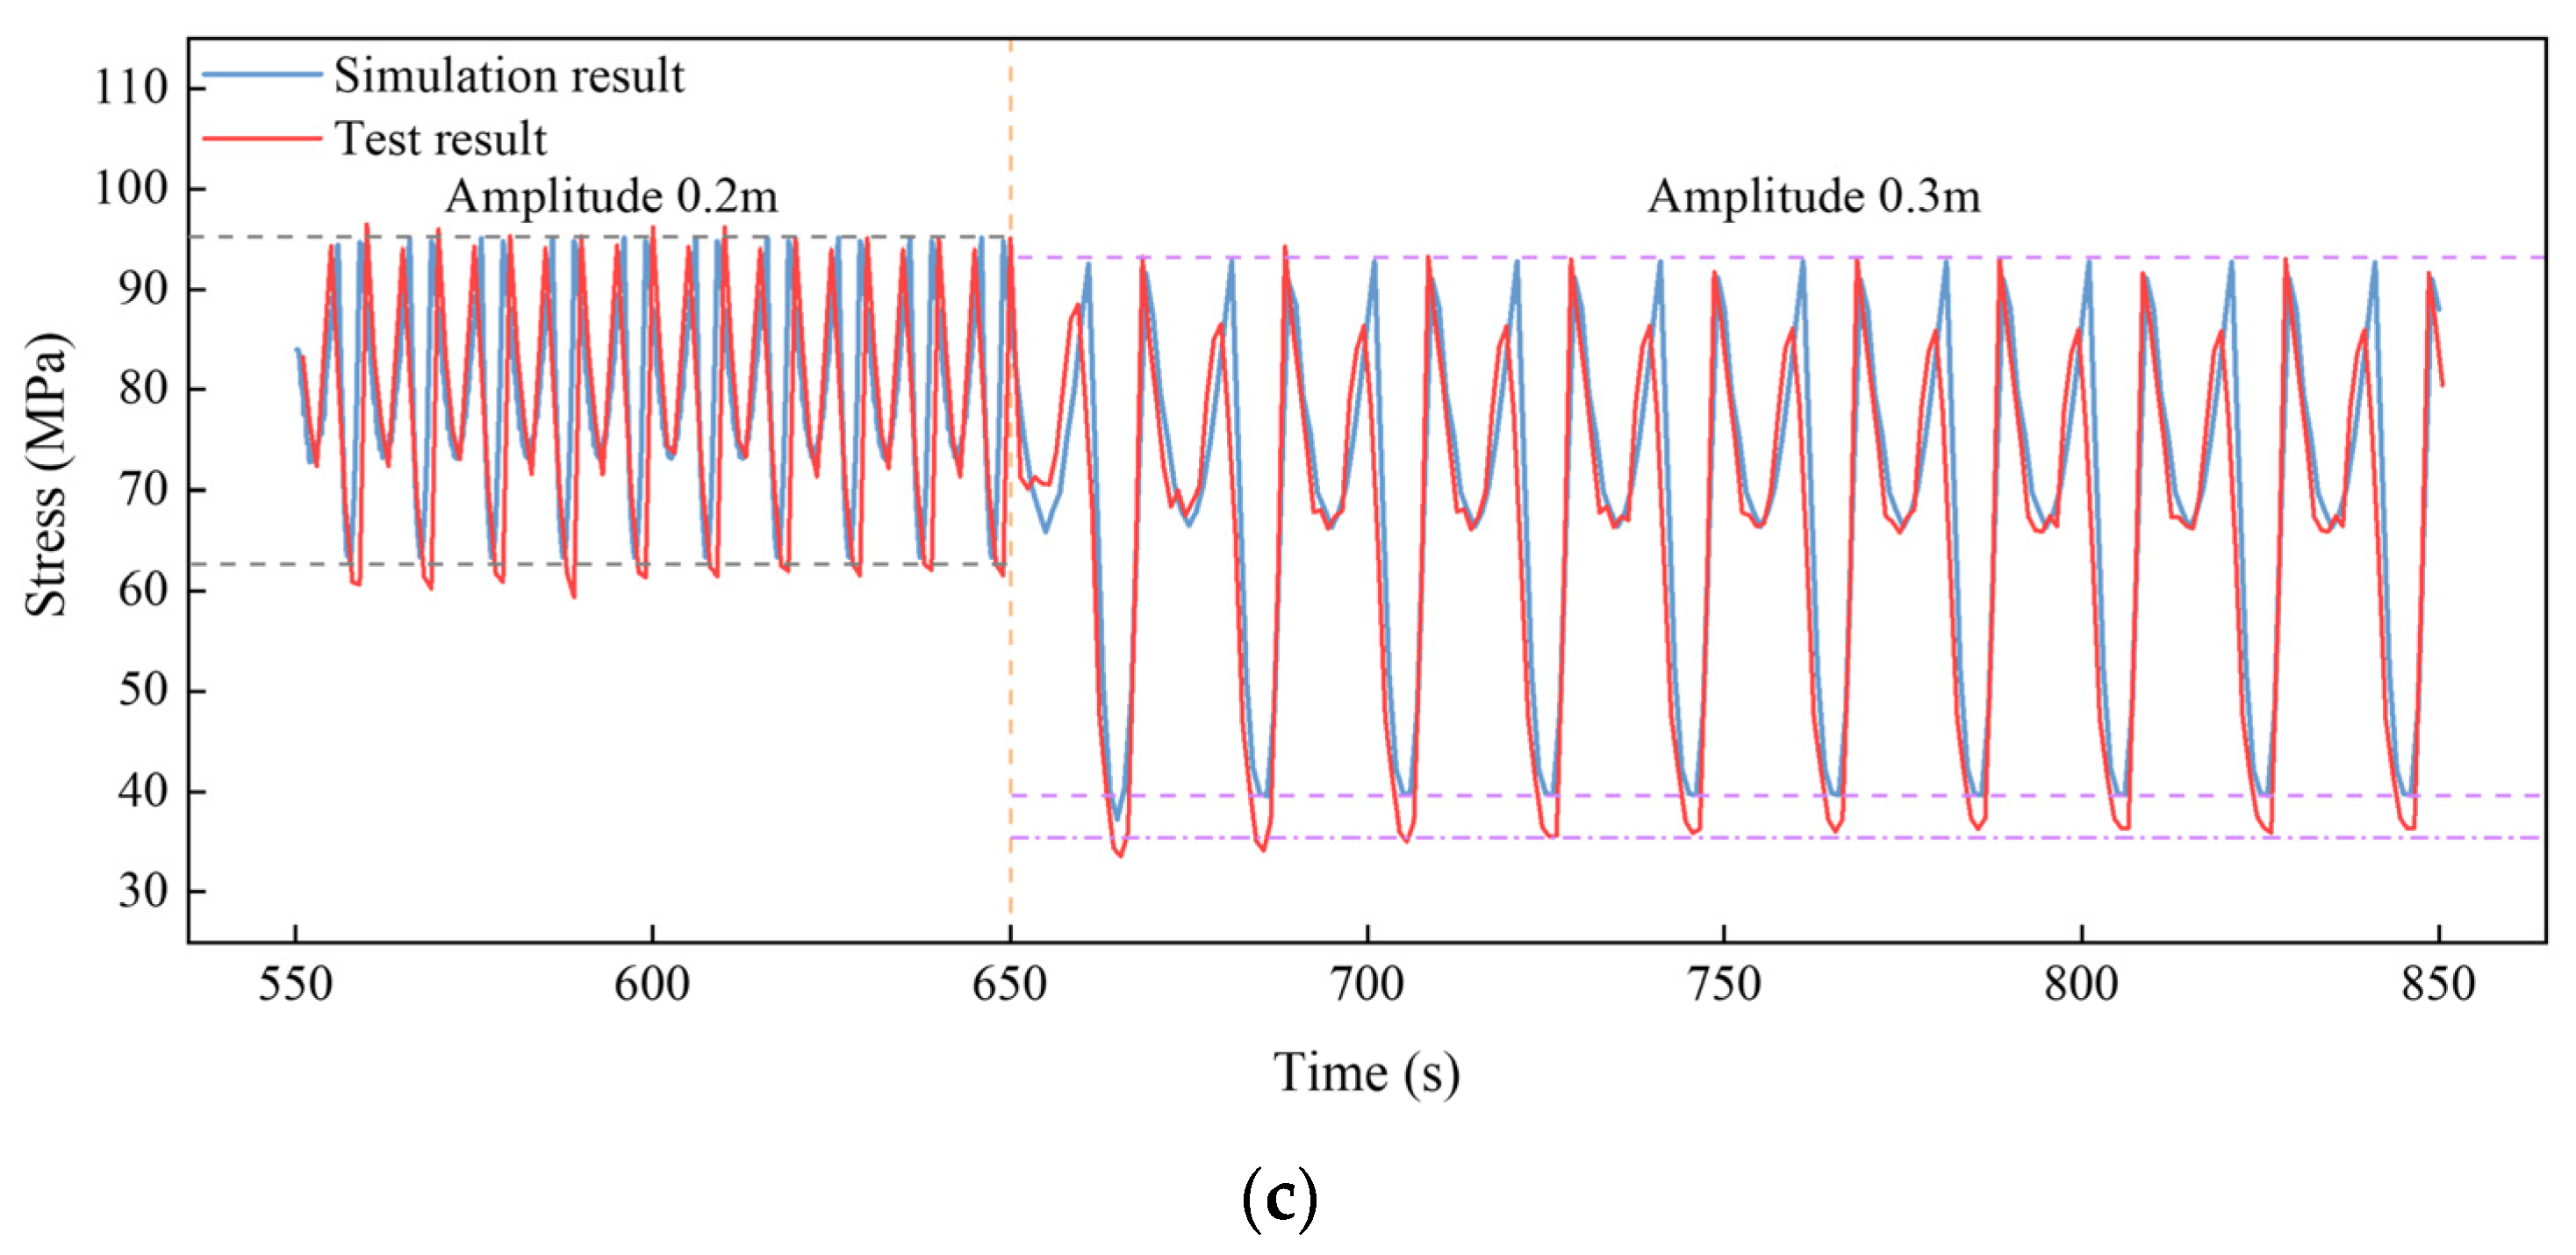
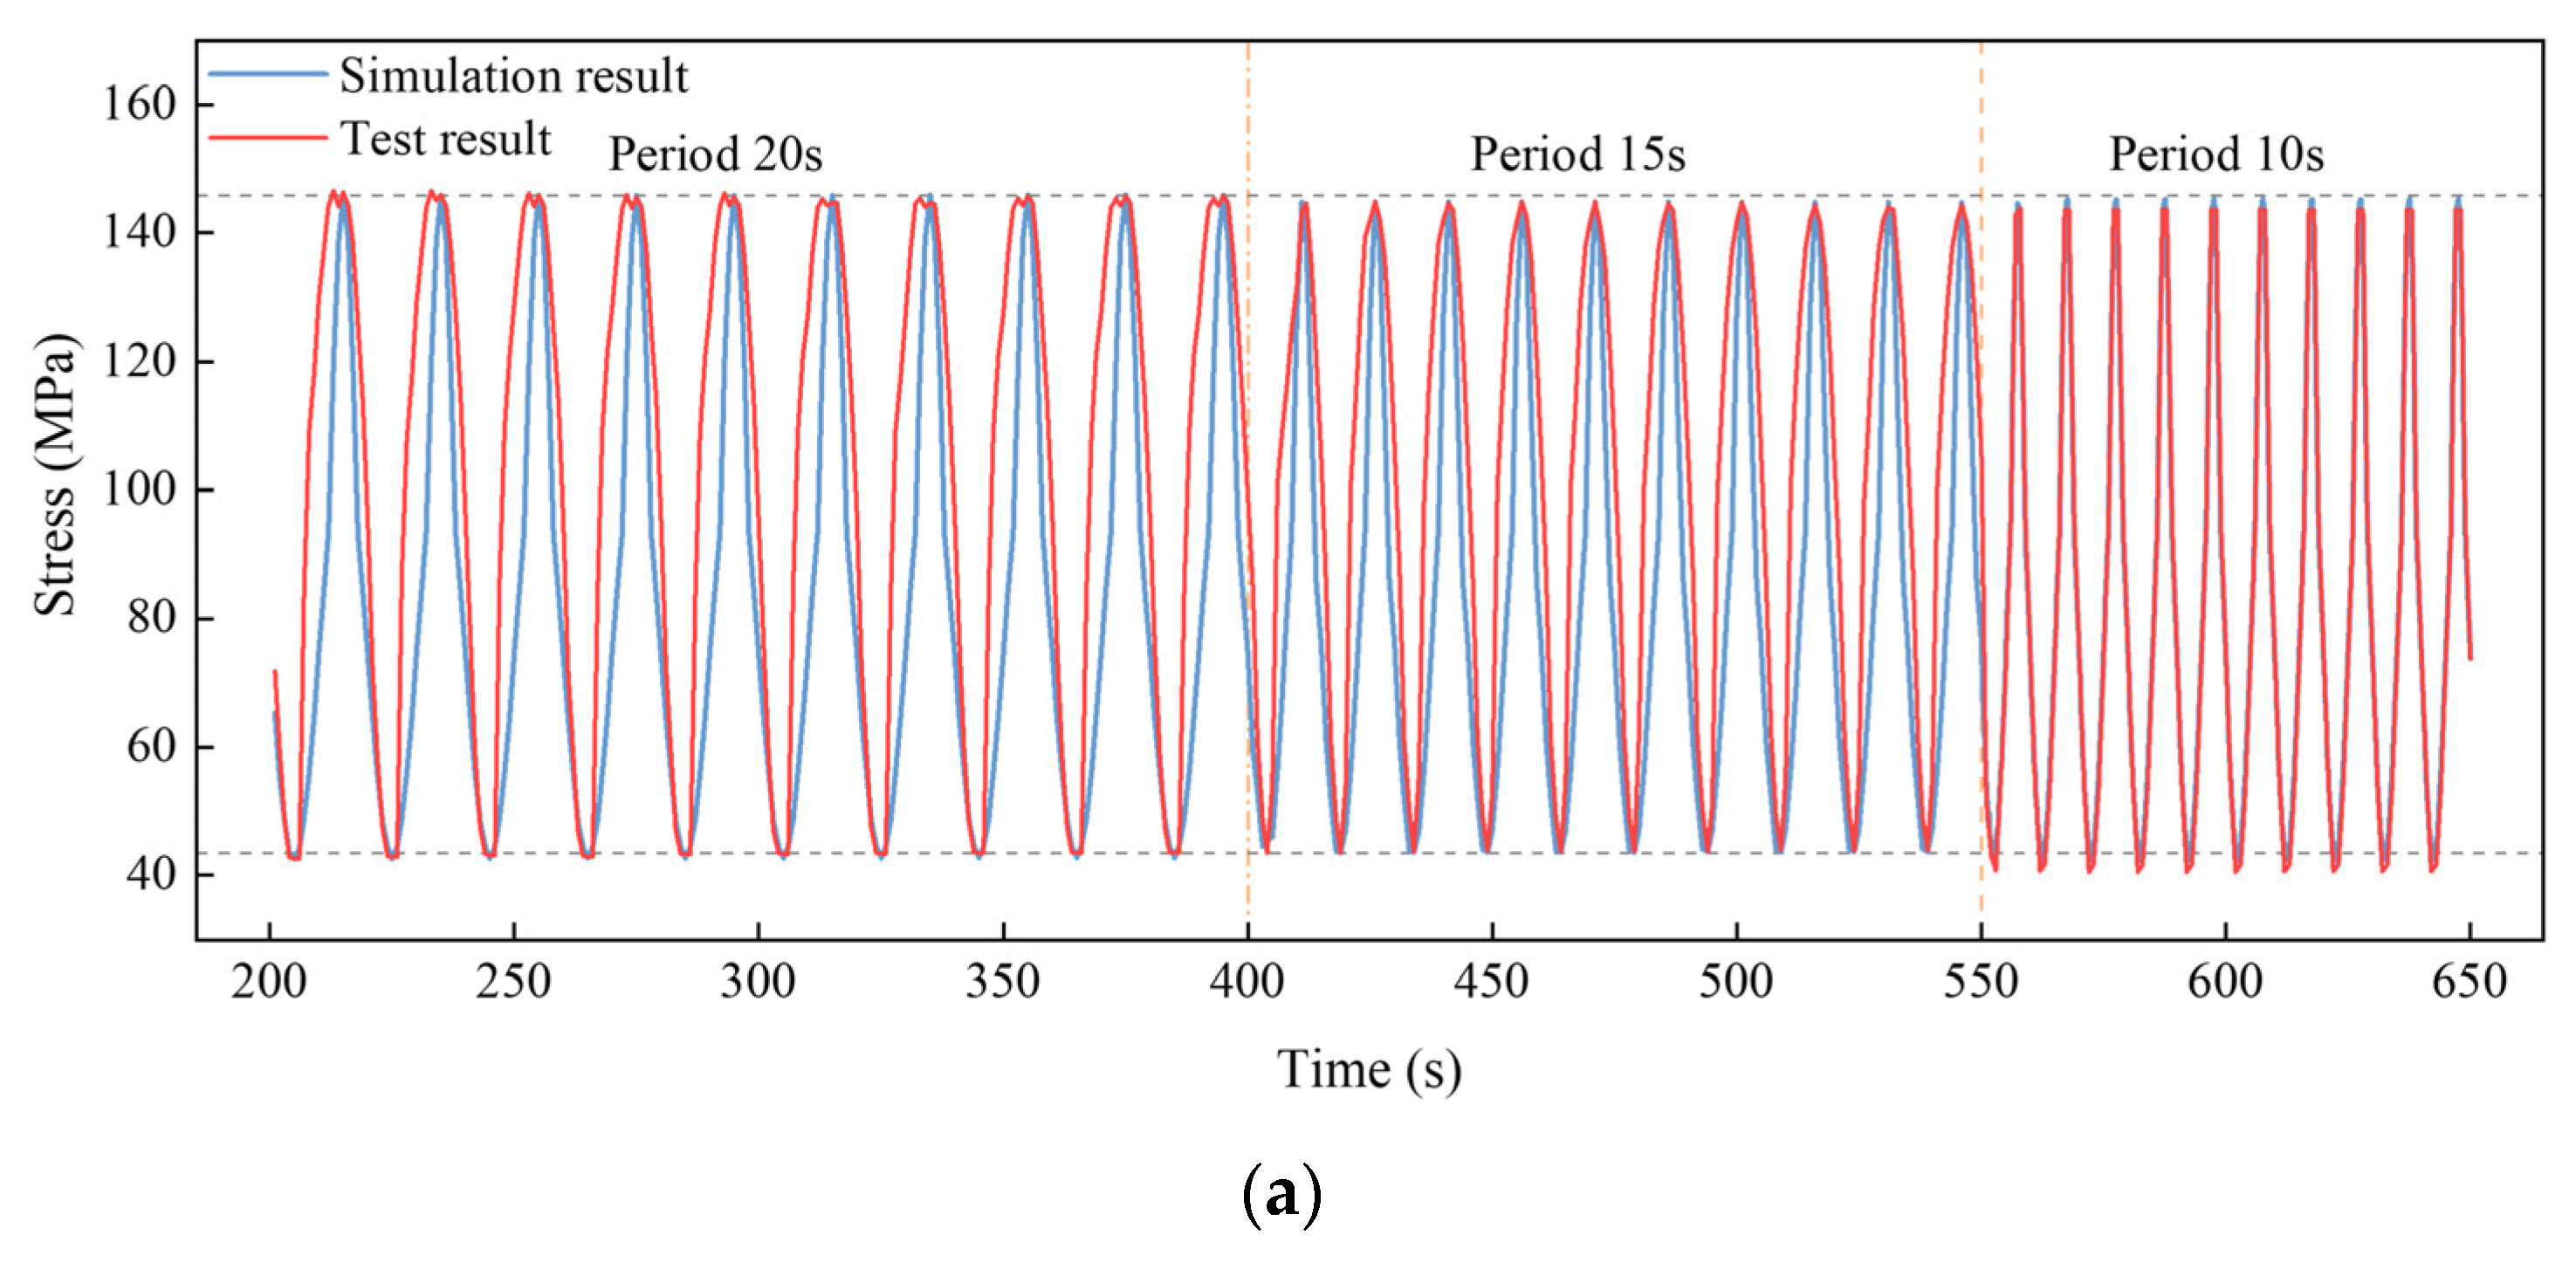
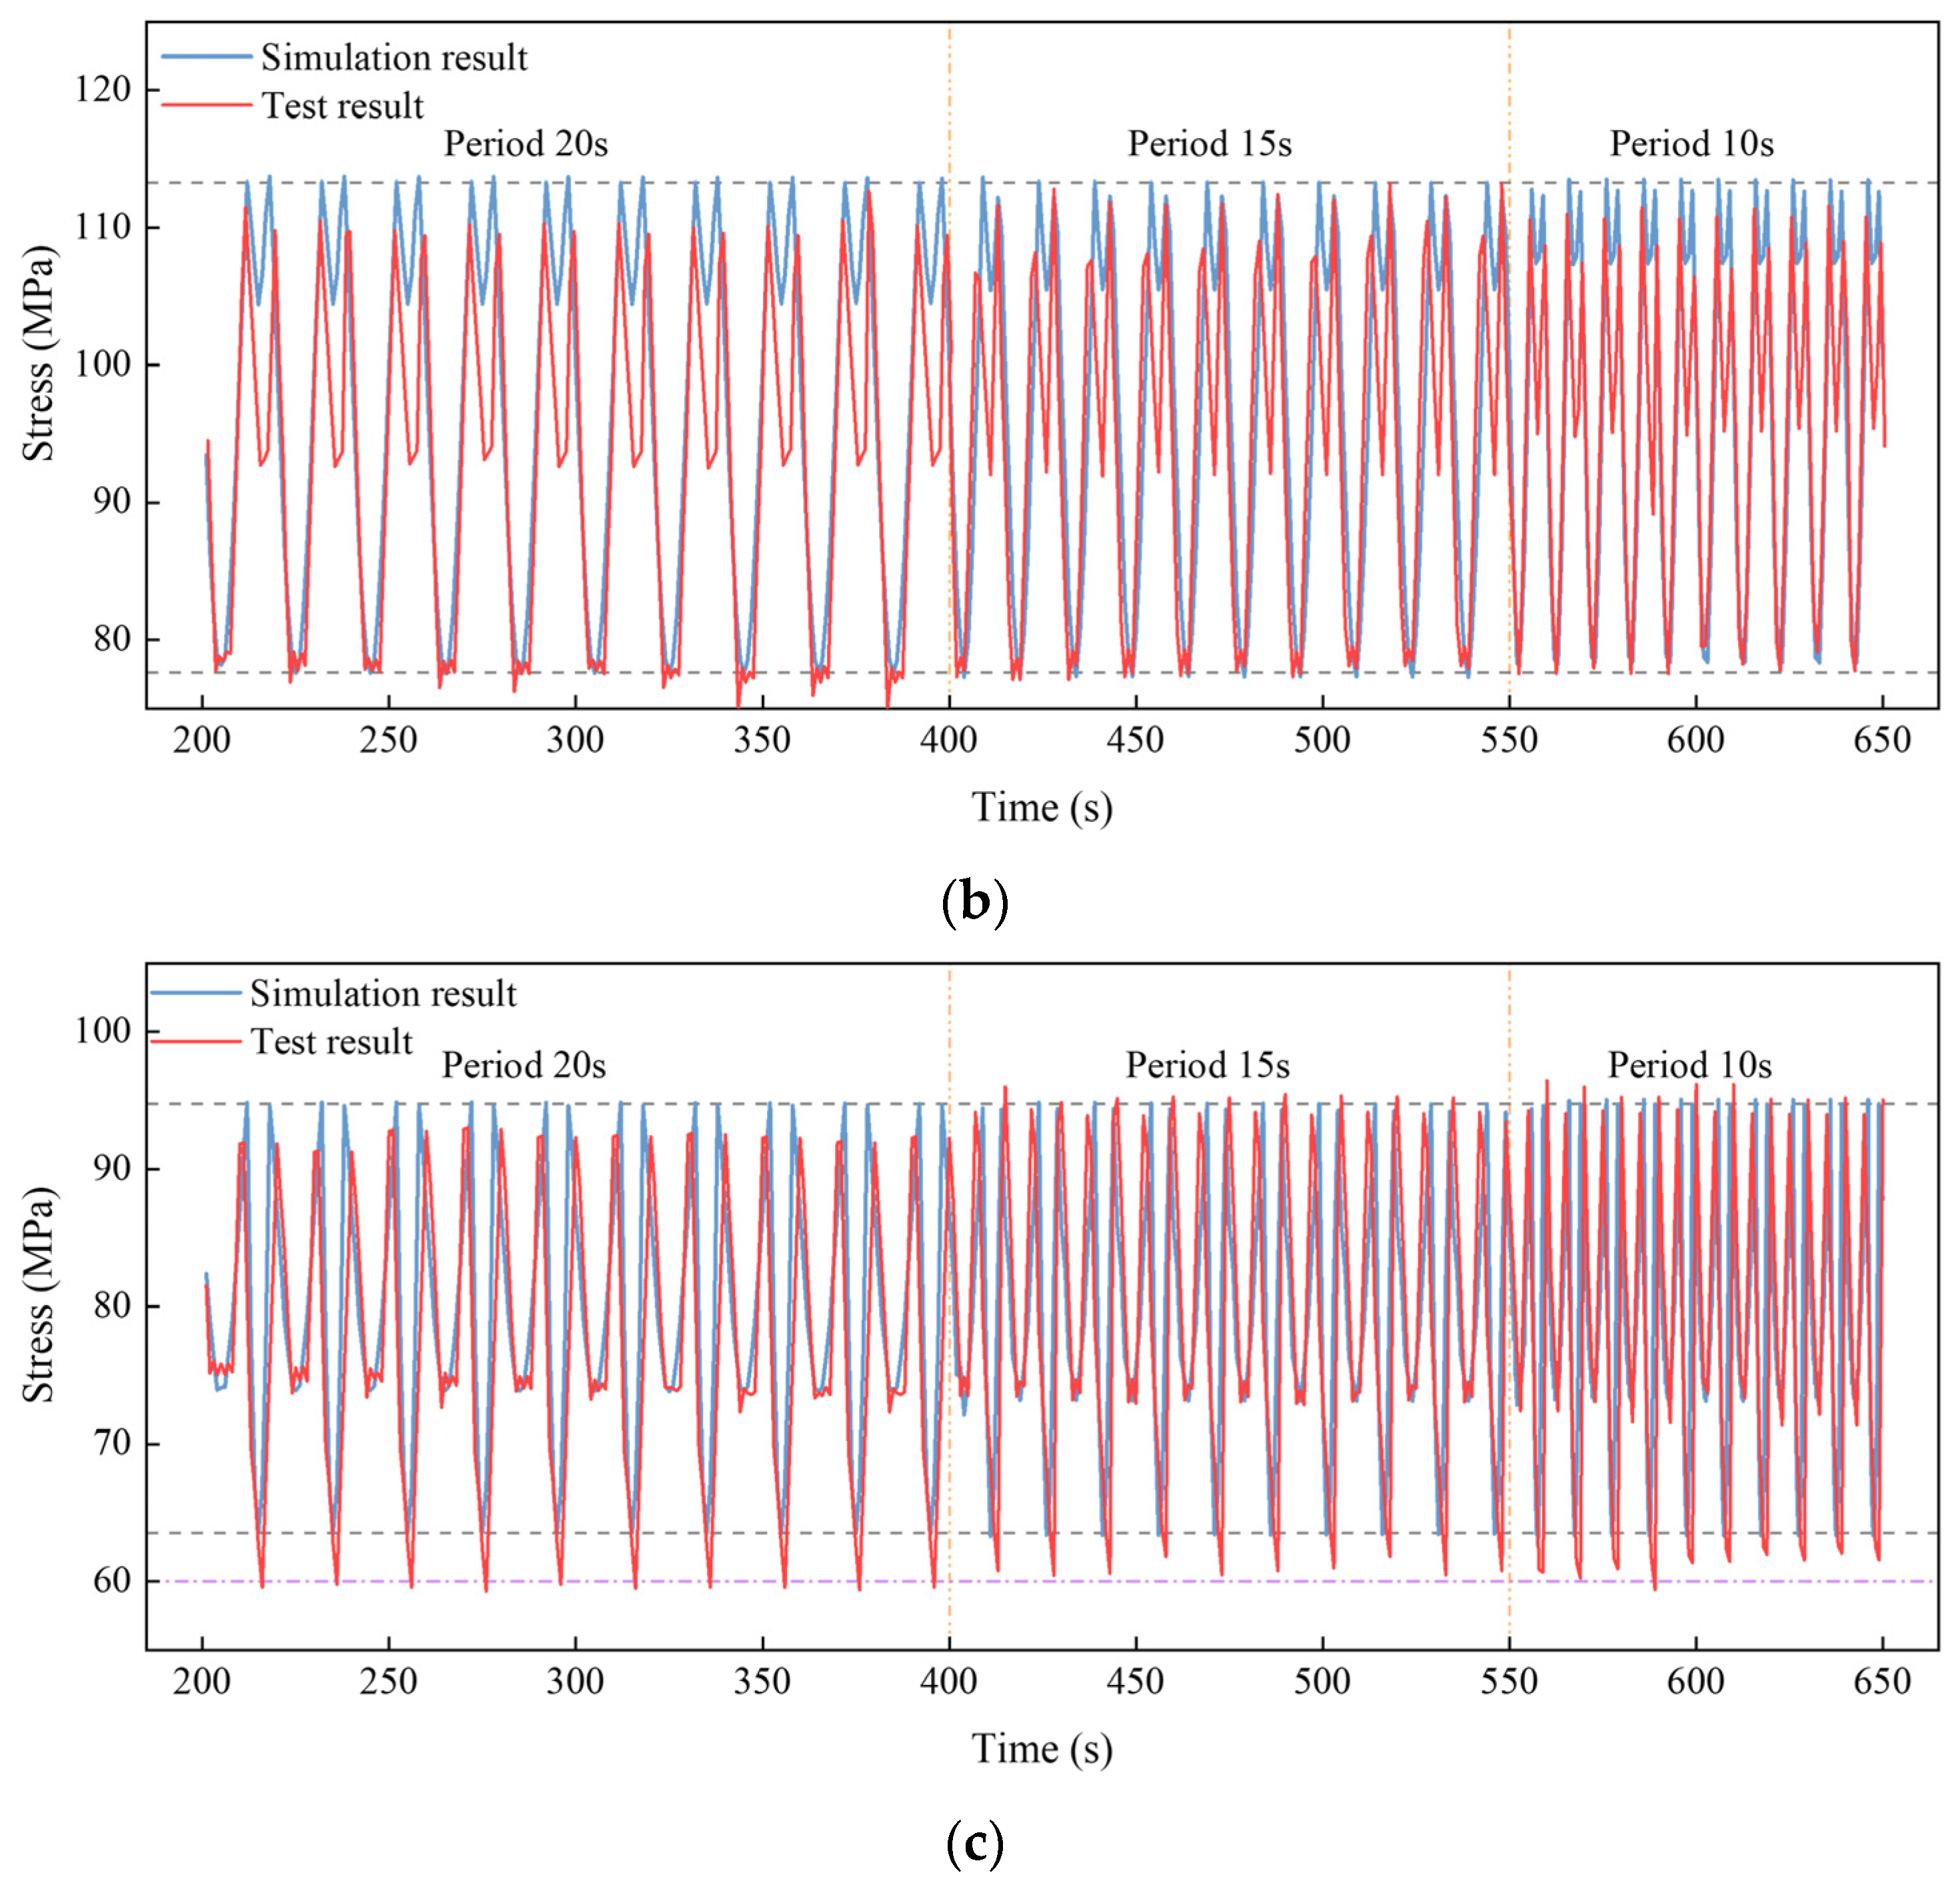
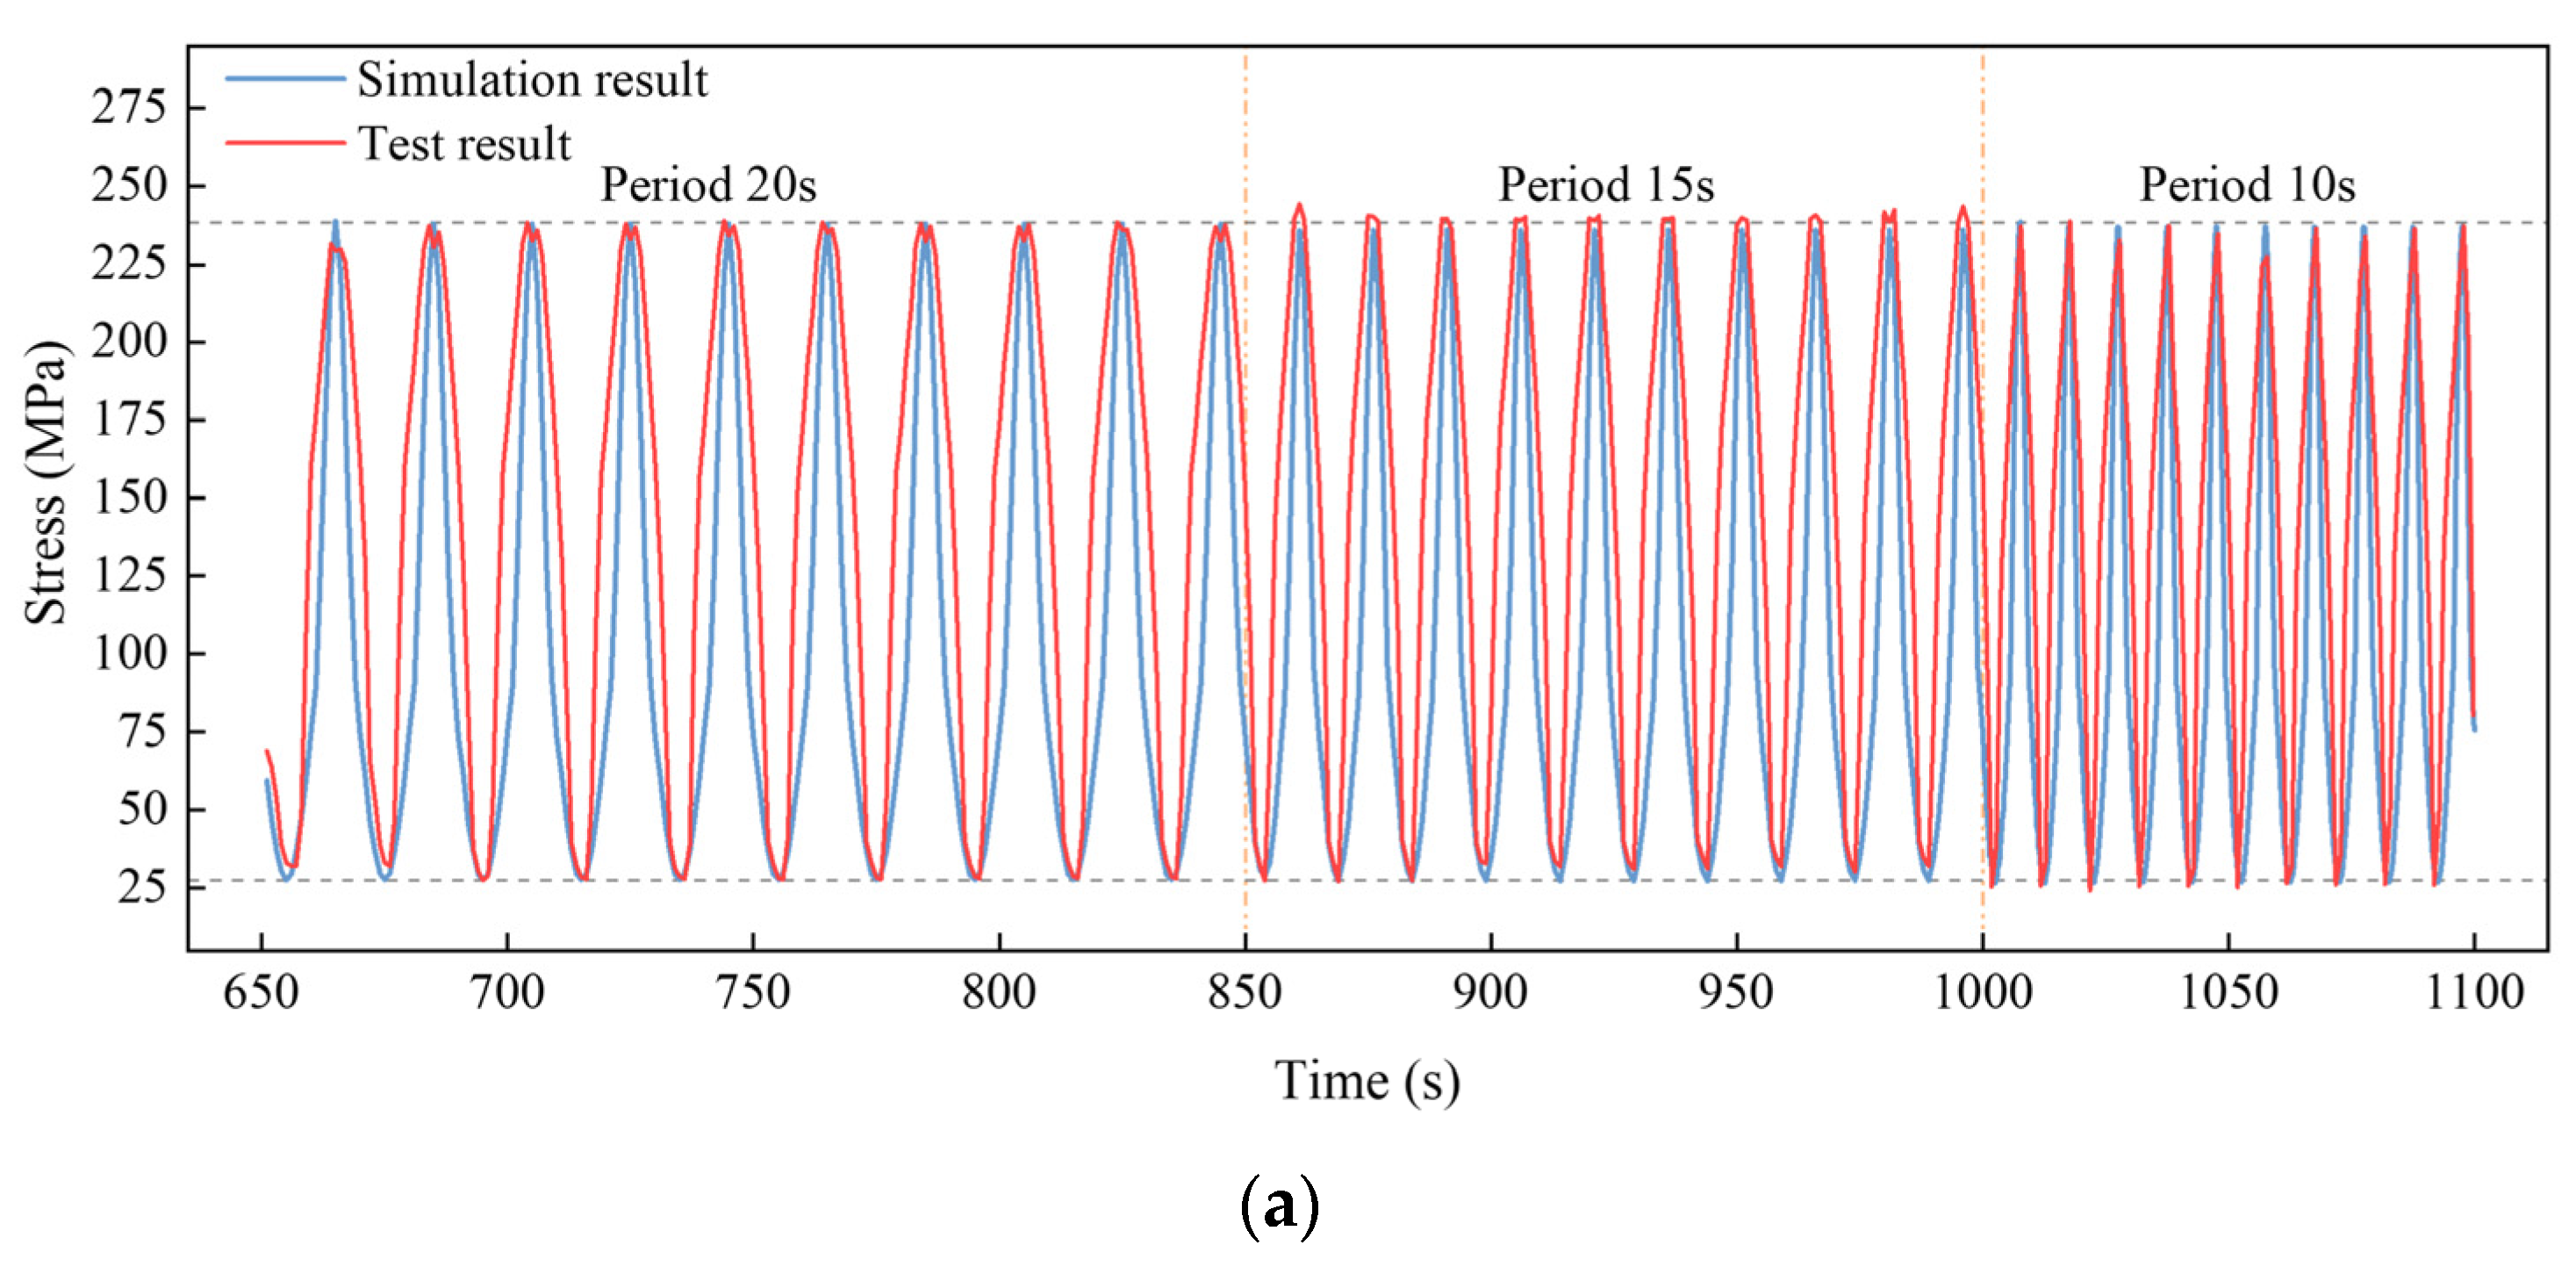
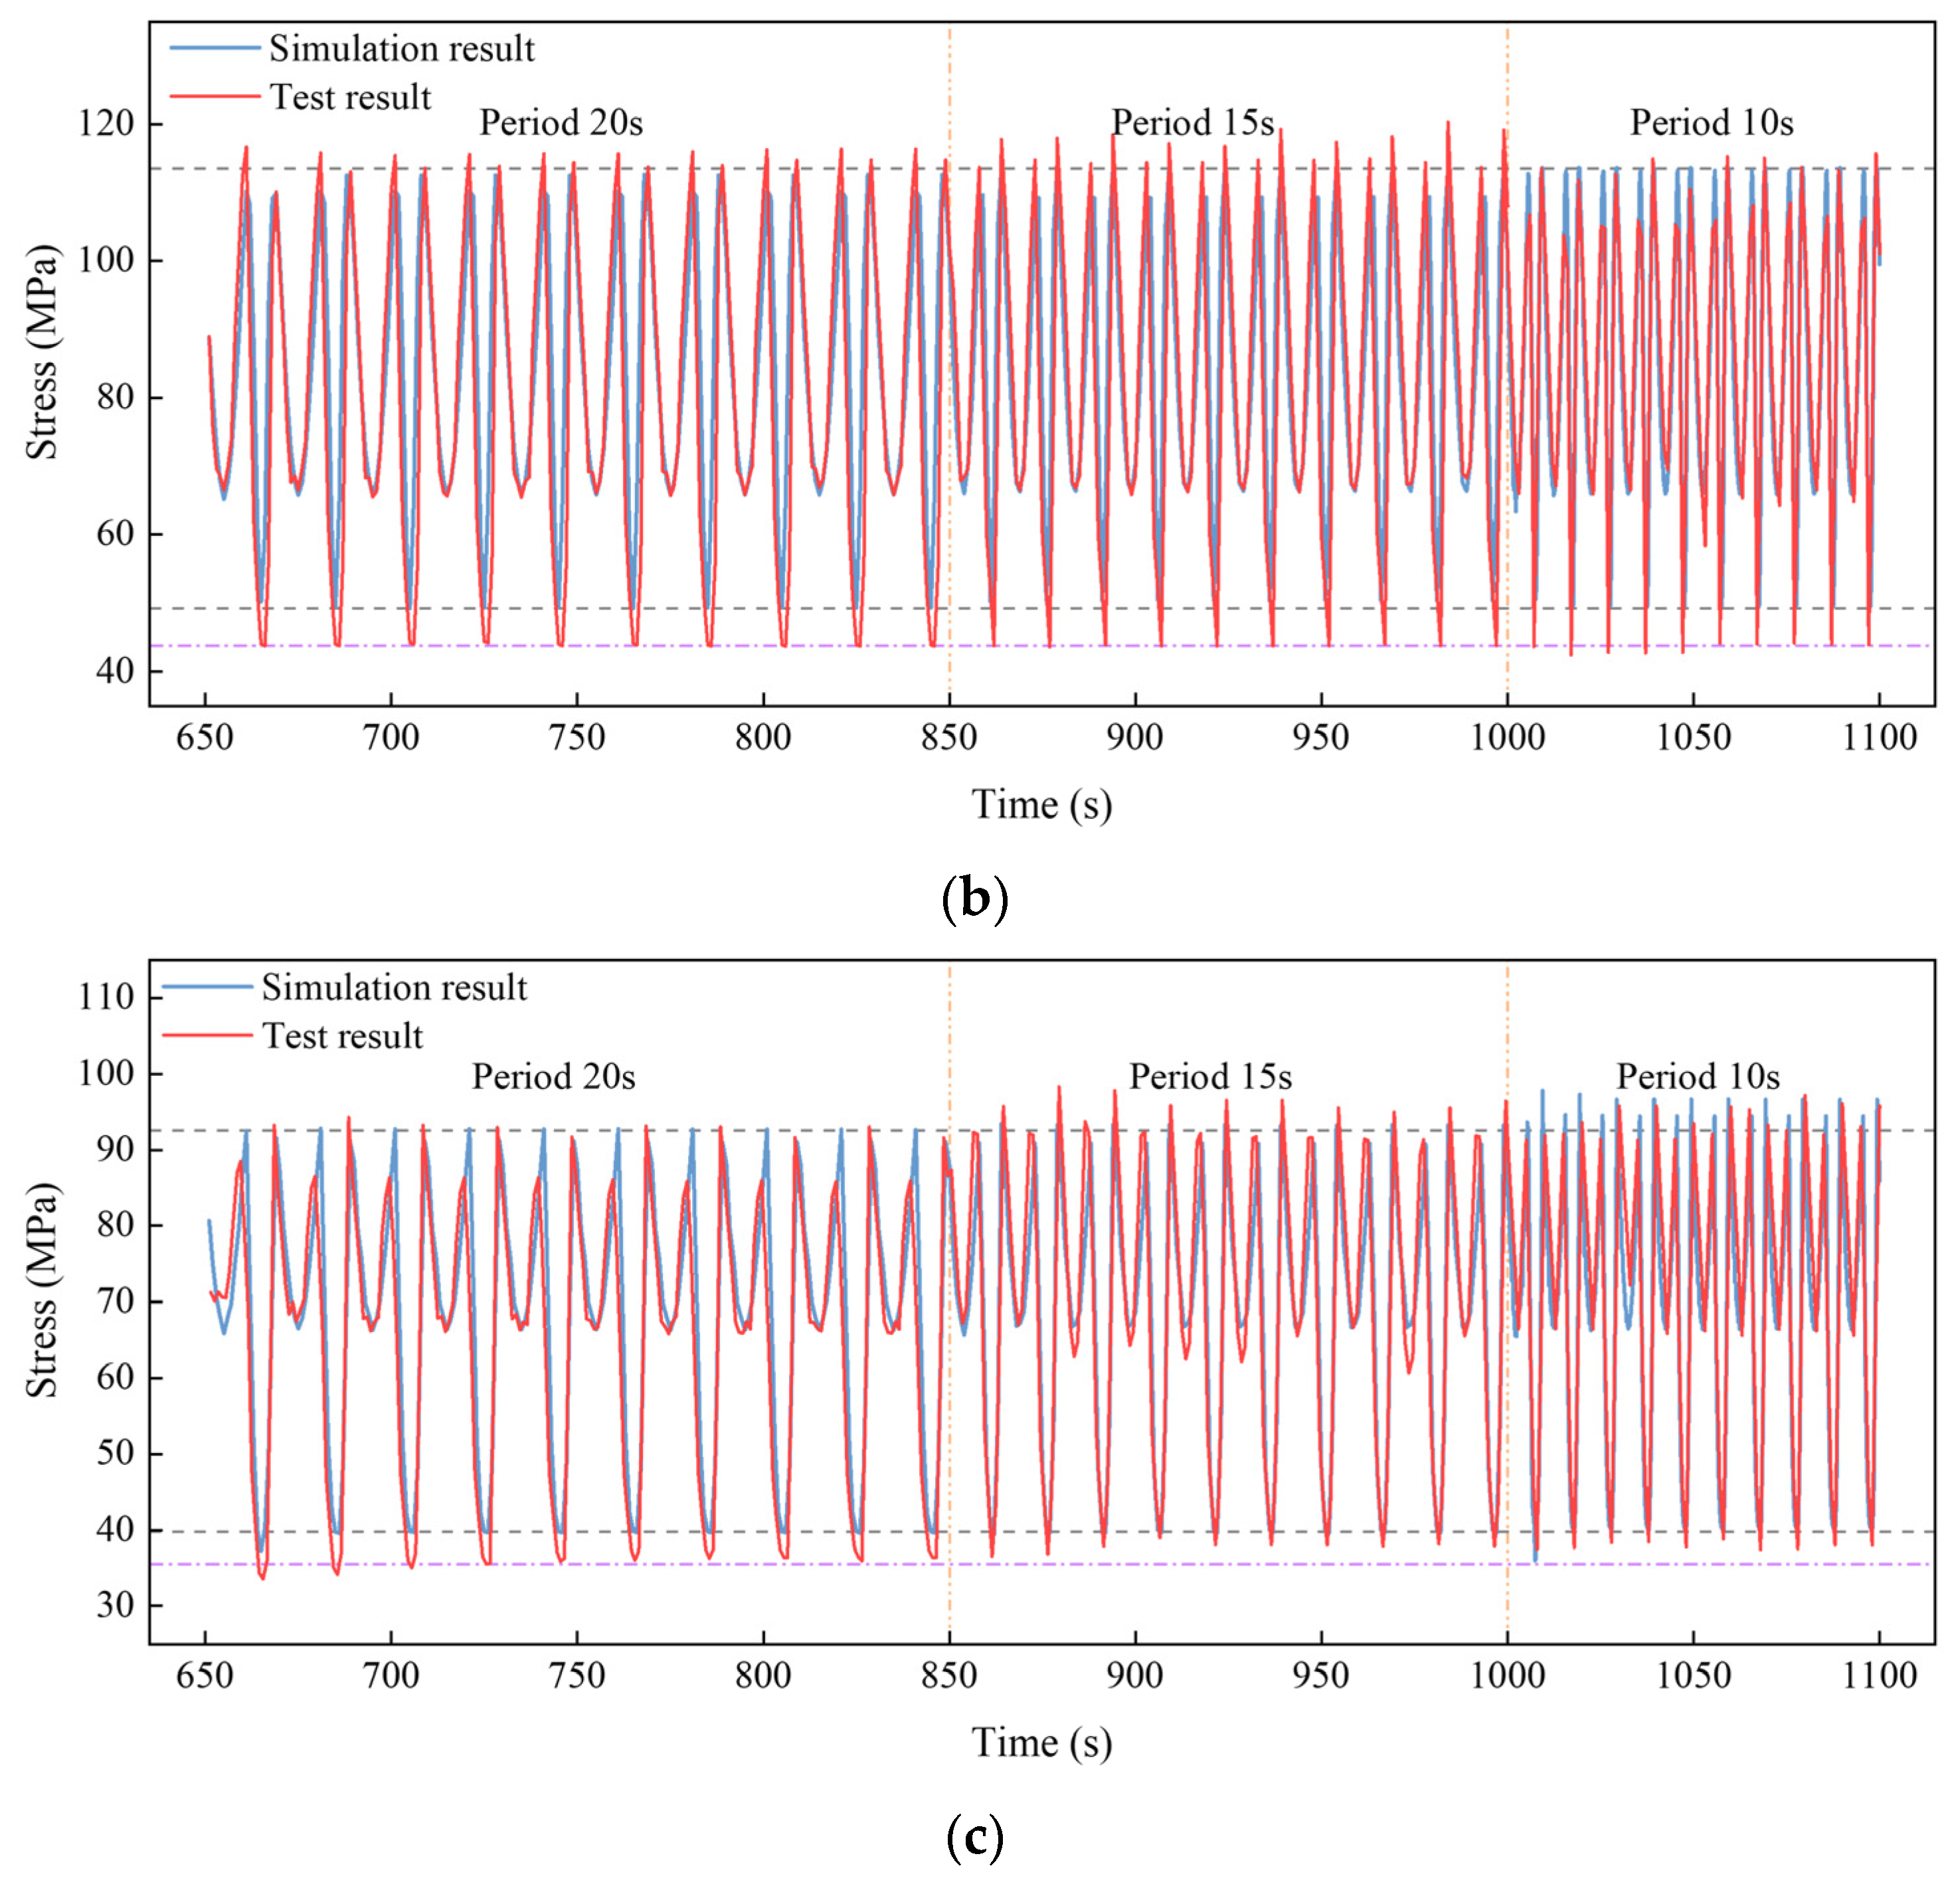
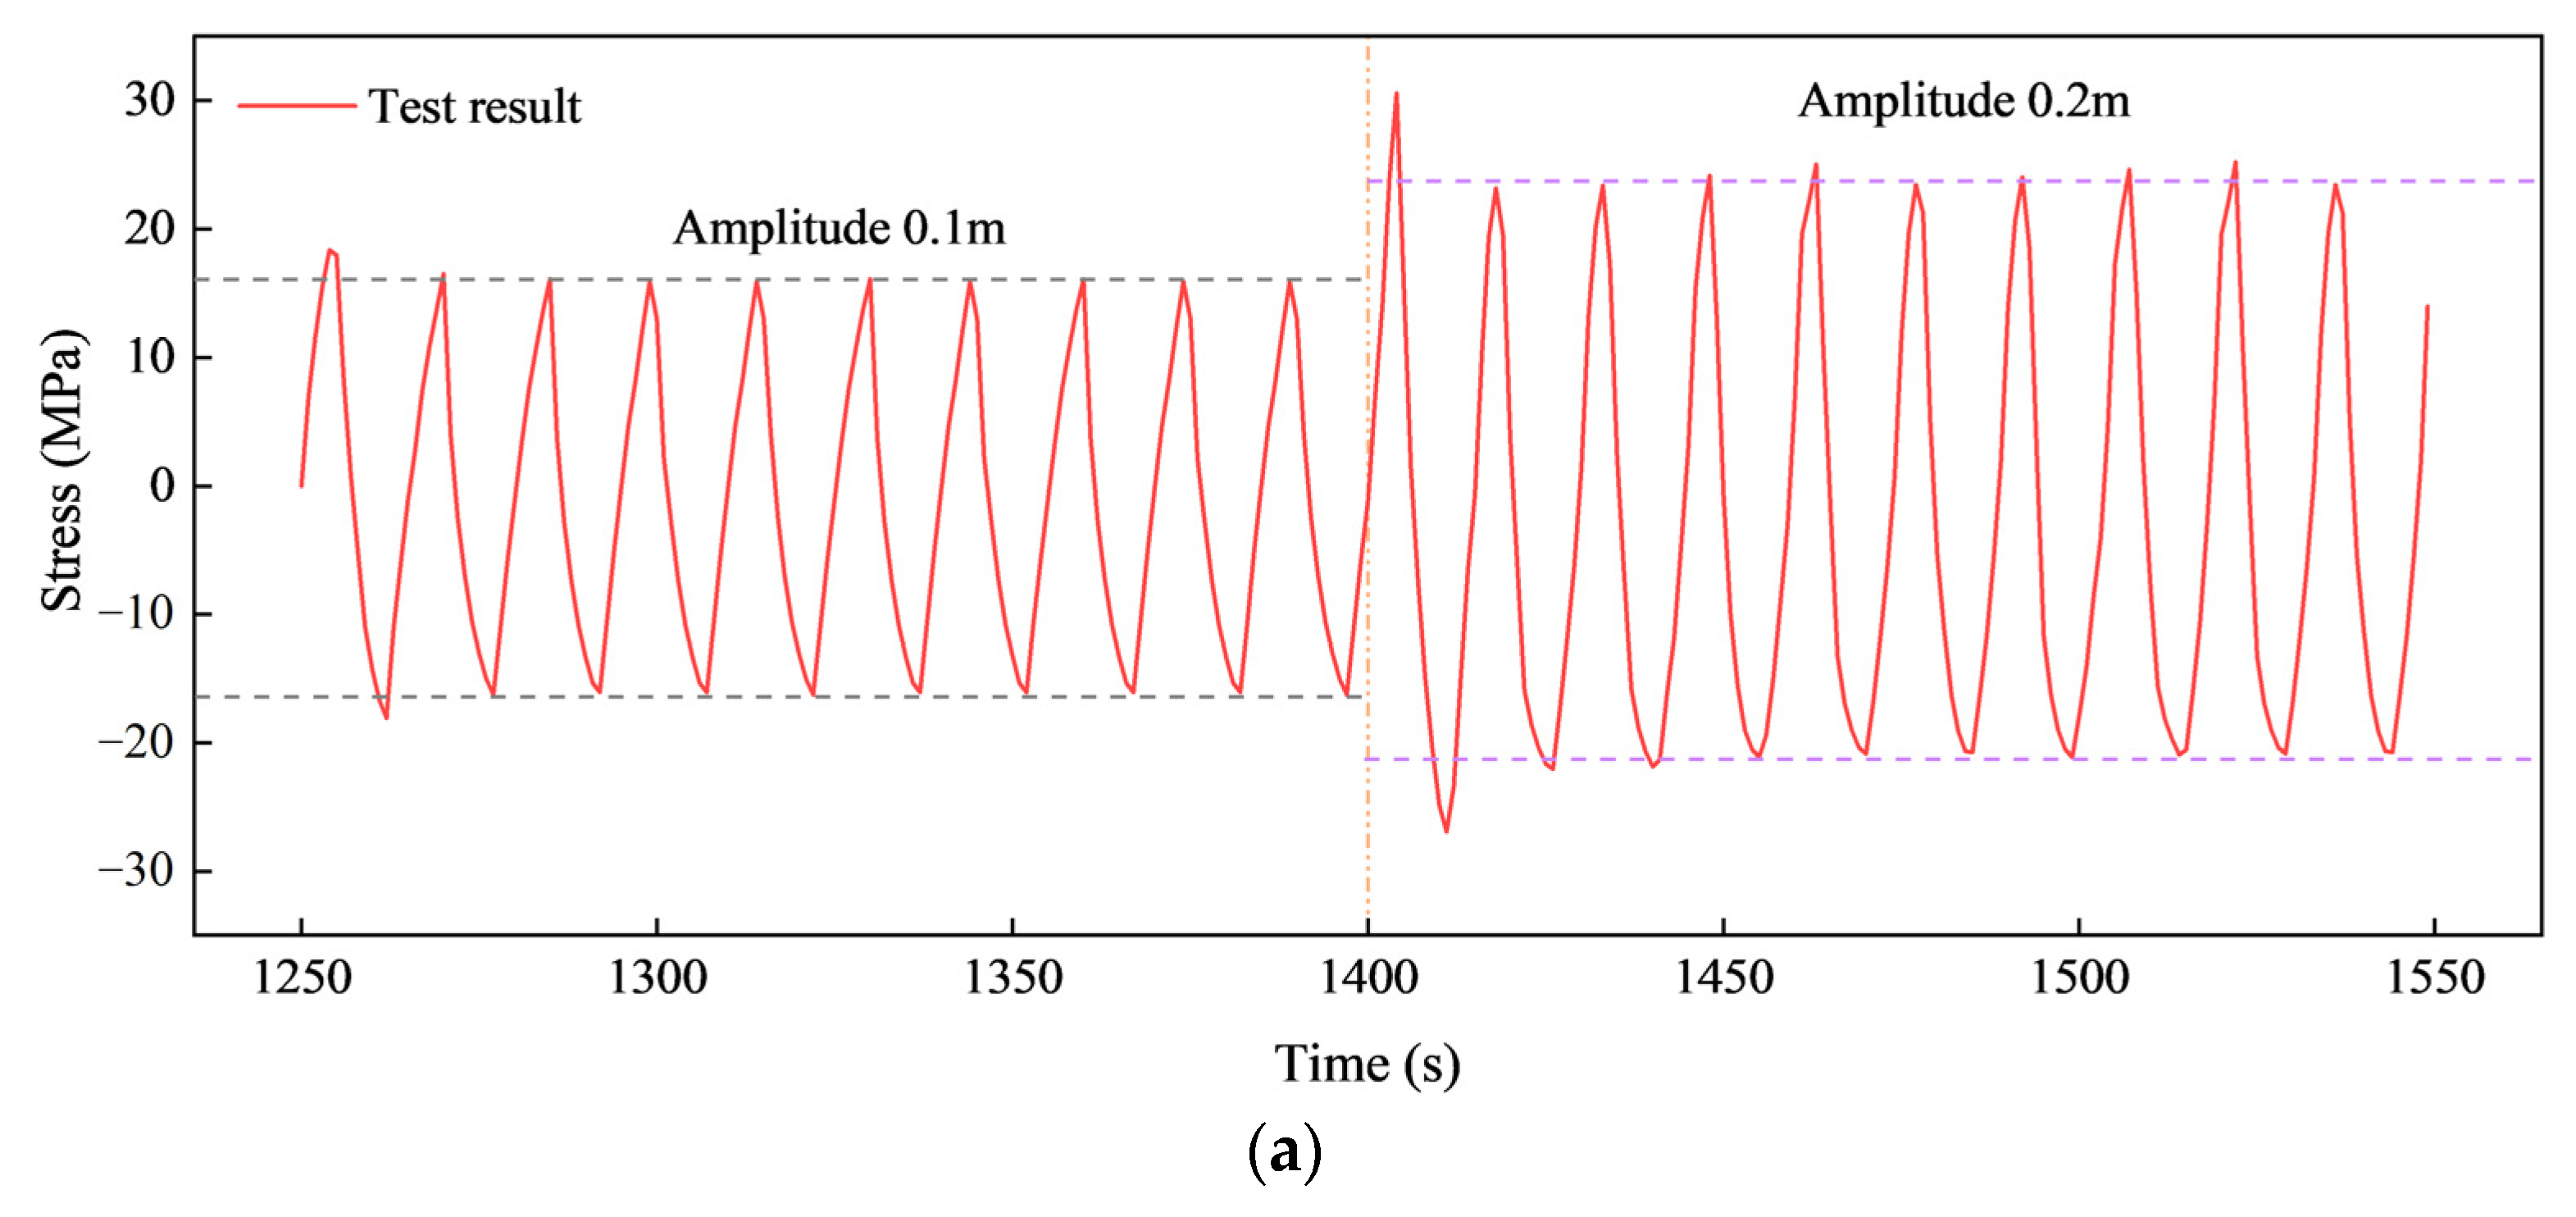
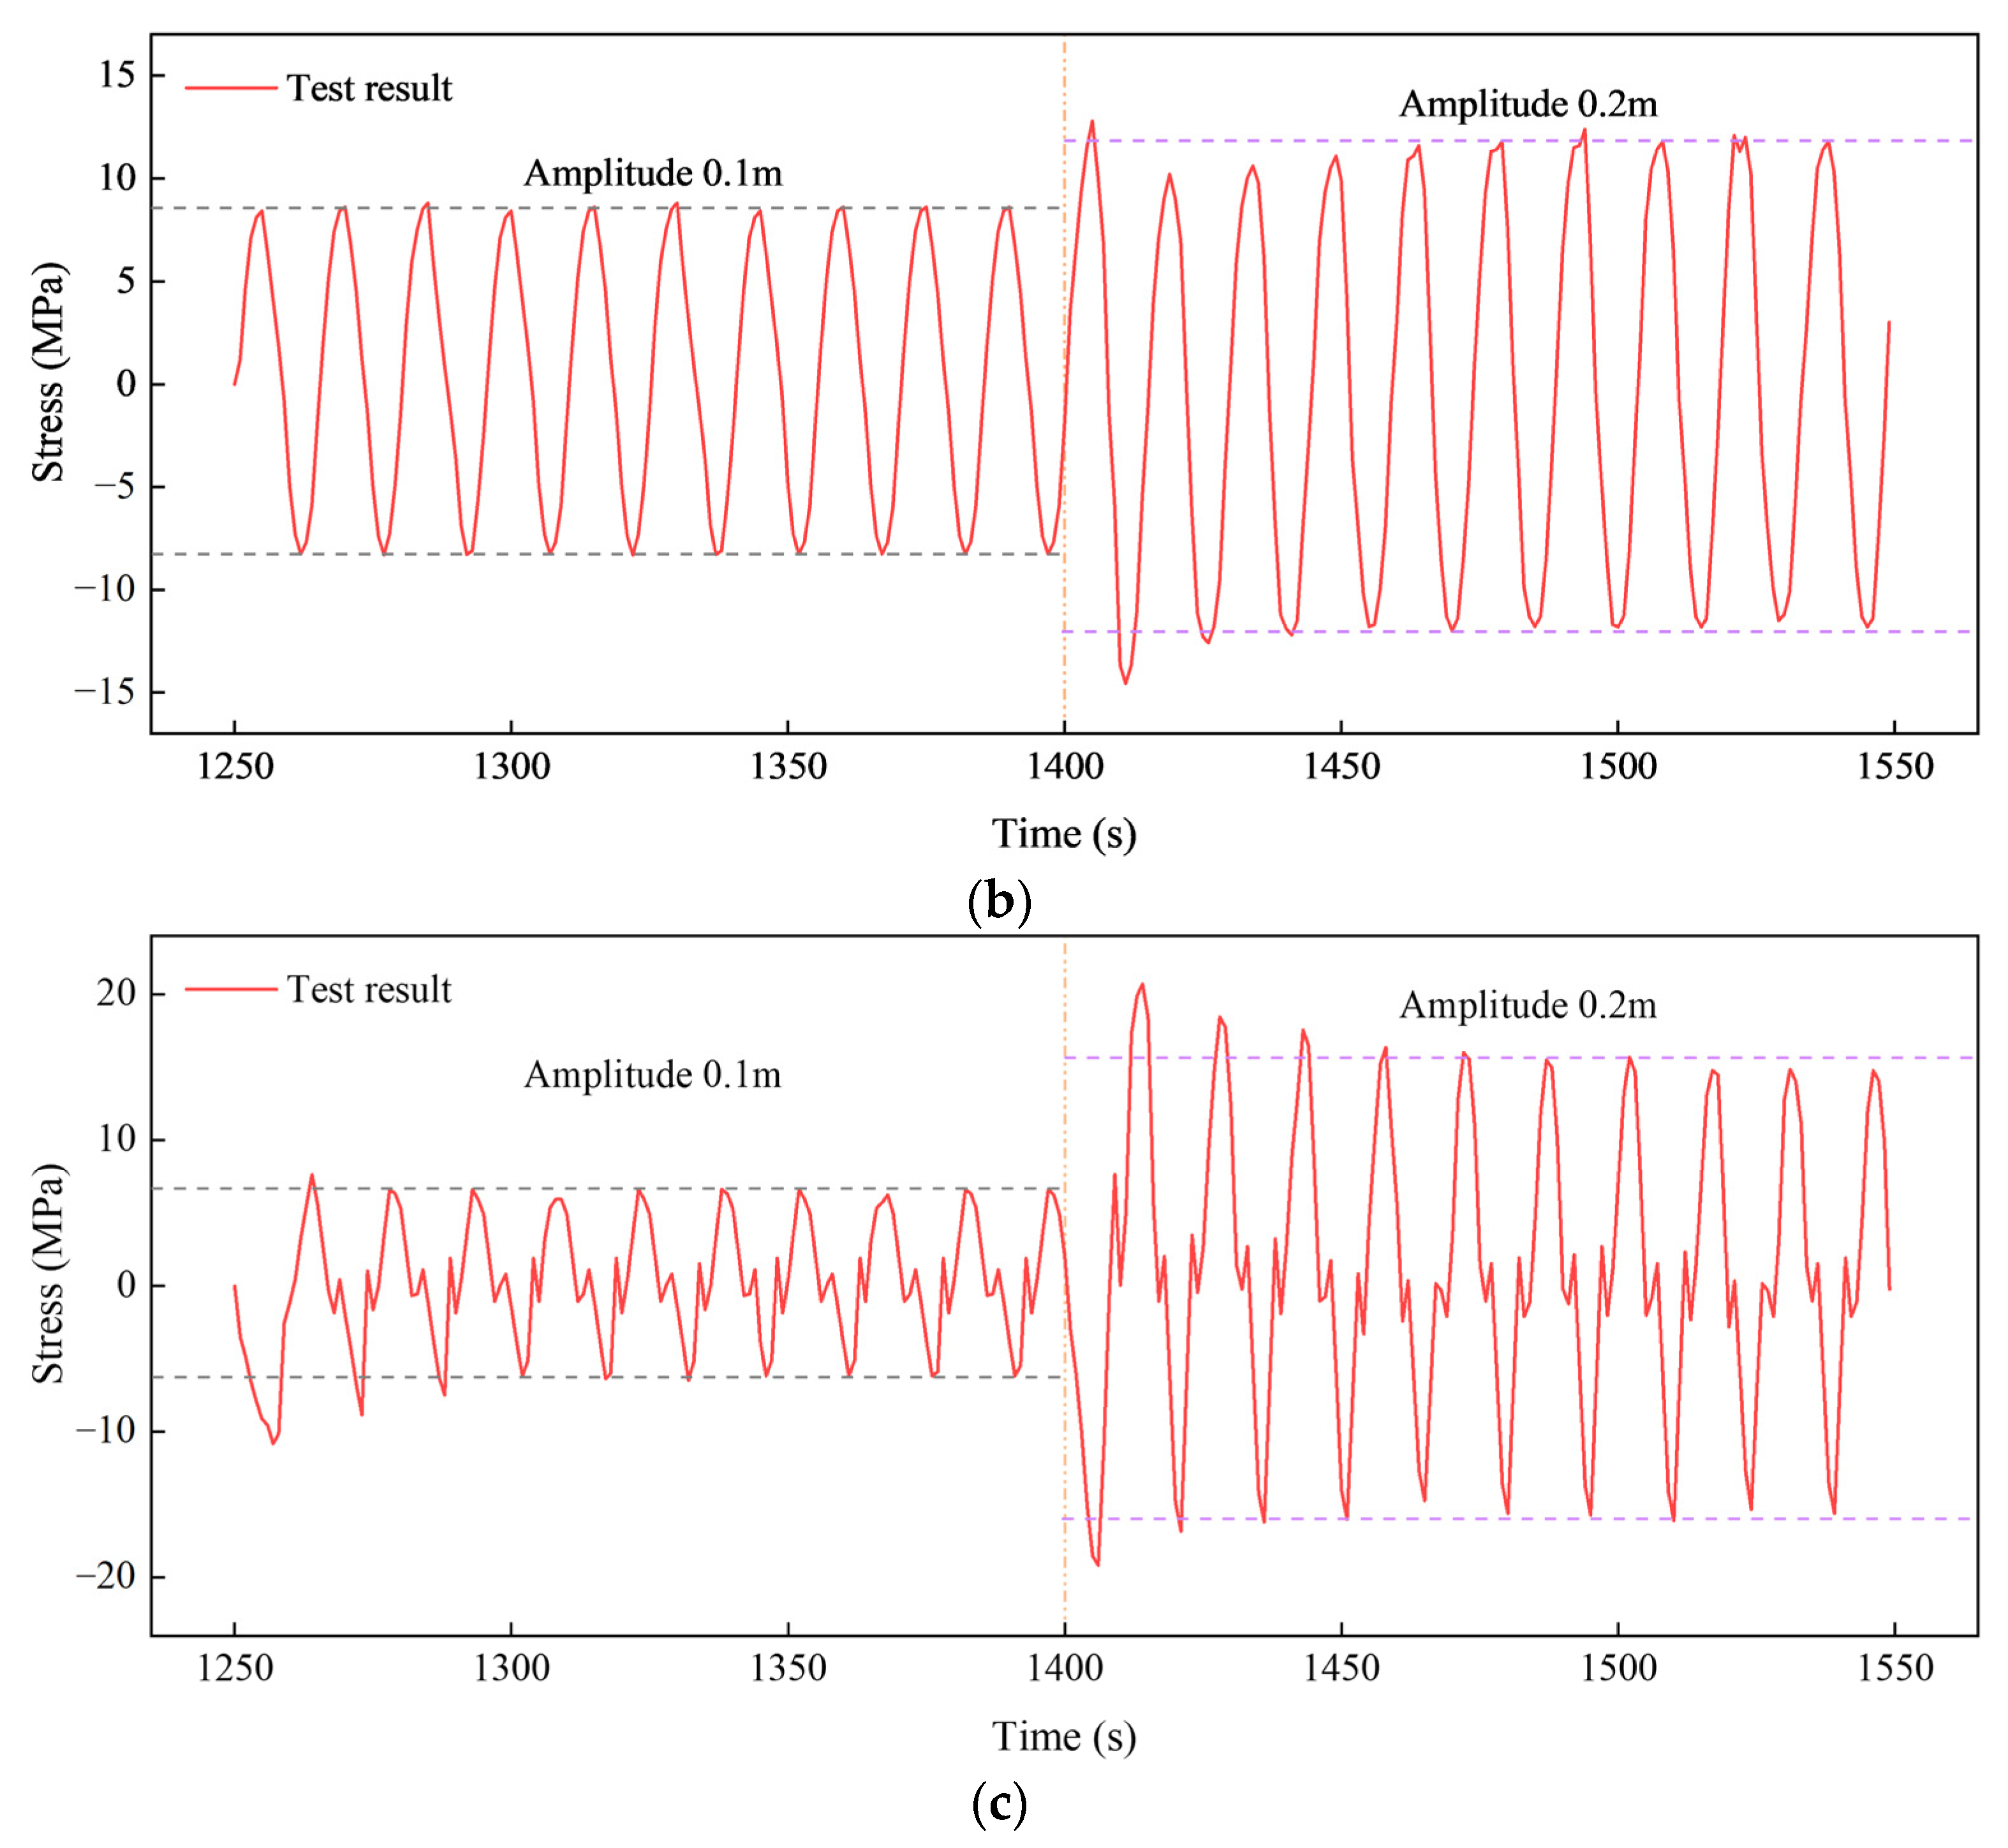
4.2.1. Effect of Increasing Loading Amplitude
4.2.2. Effect of Increasing the Loading Frequency
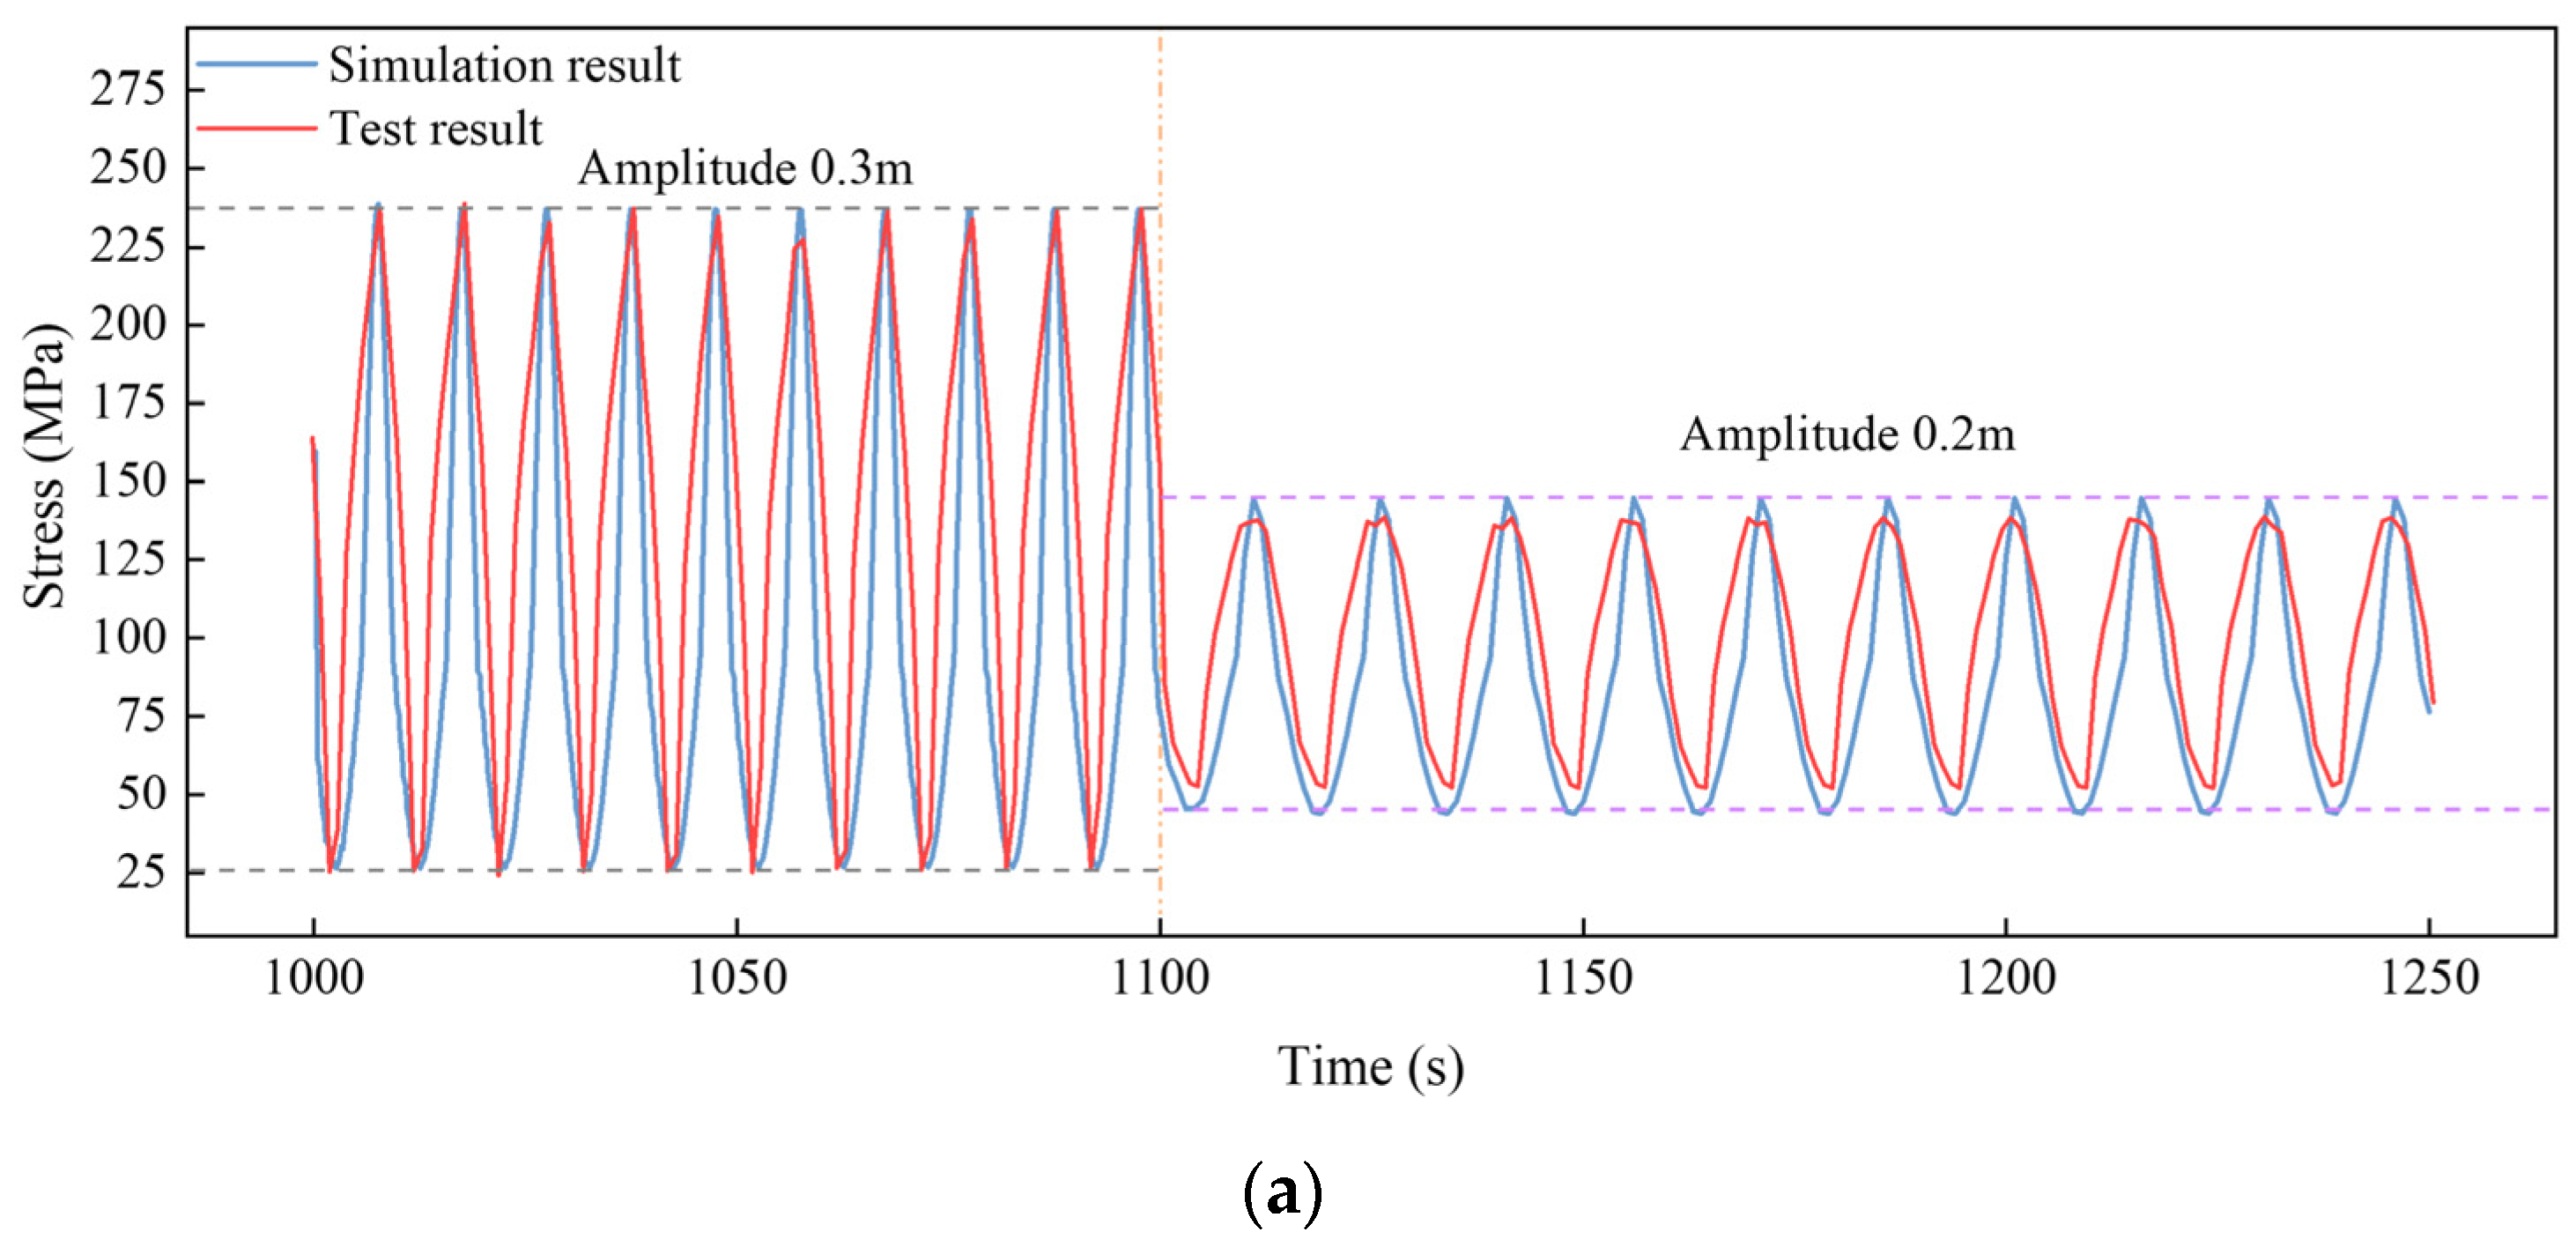
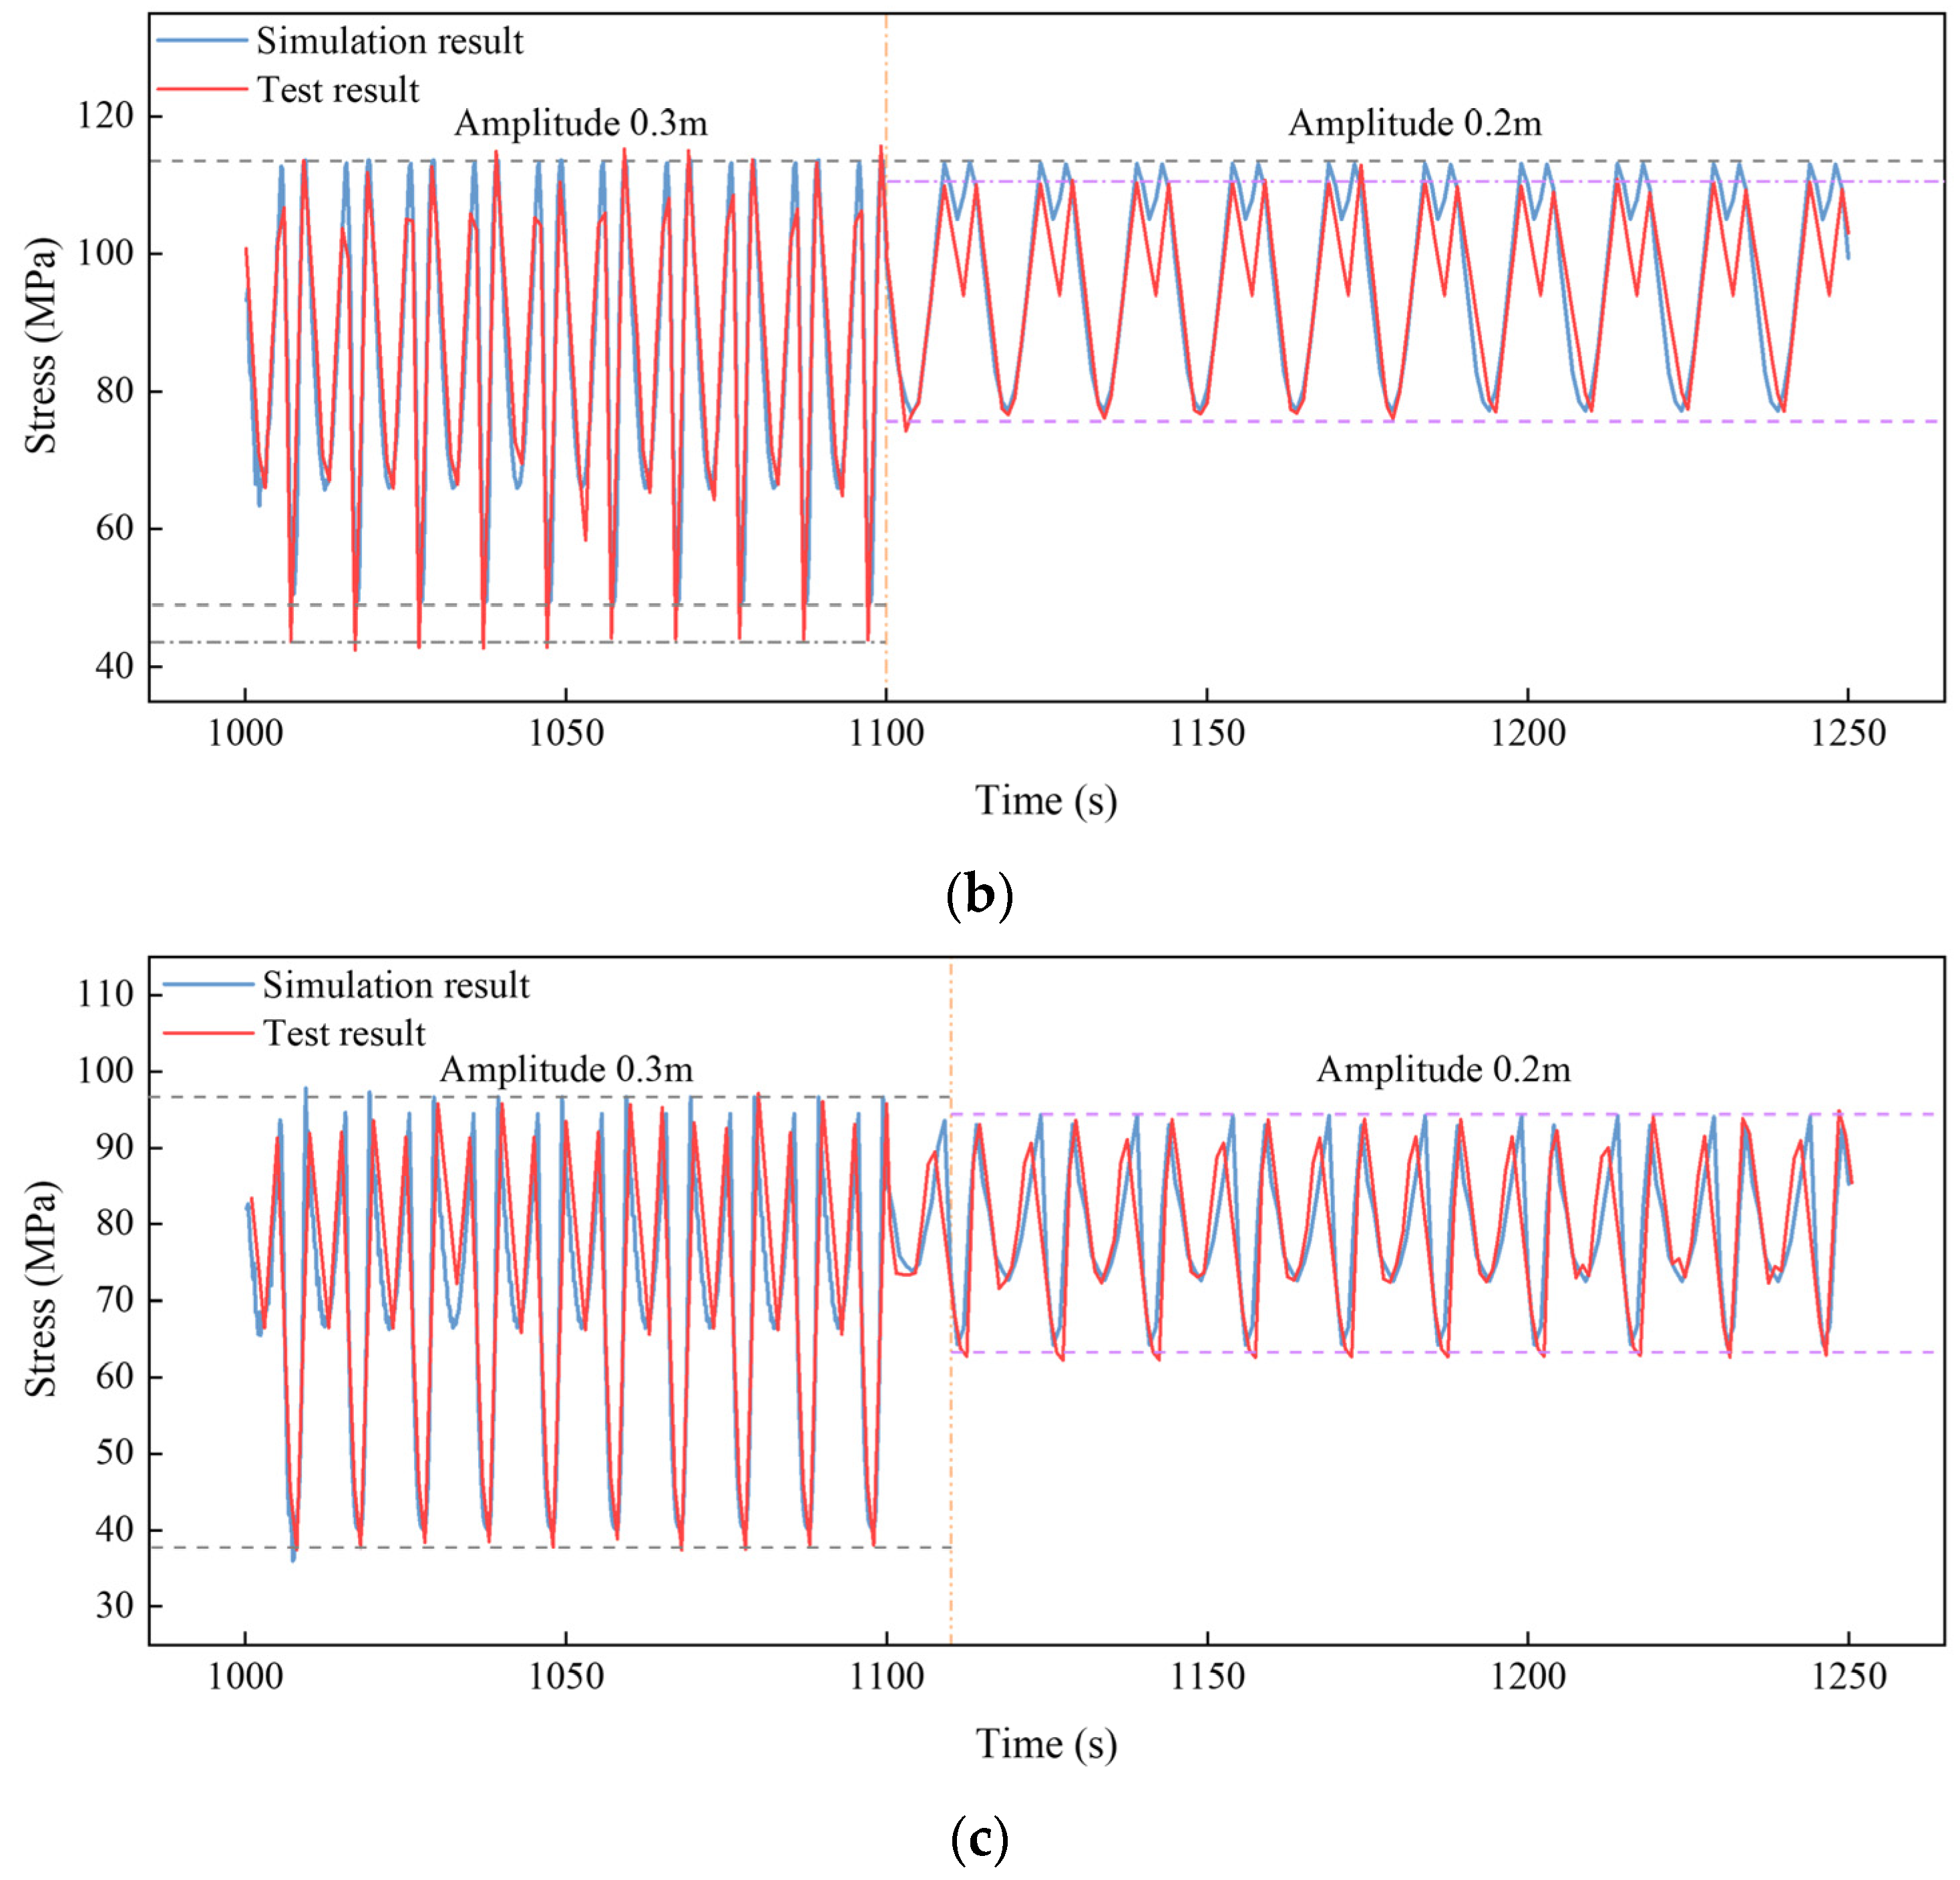
4.2.3. Effect of Decreasing the Loading Amplitude
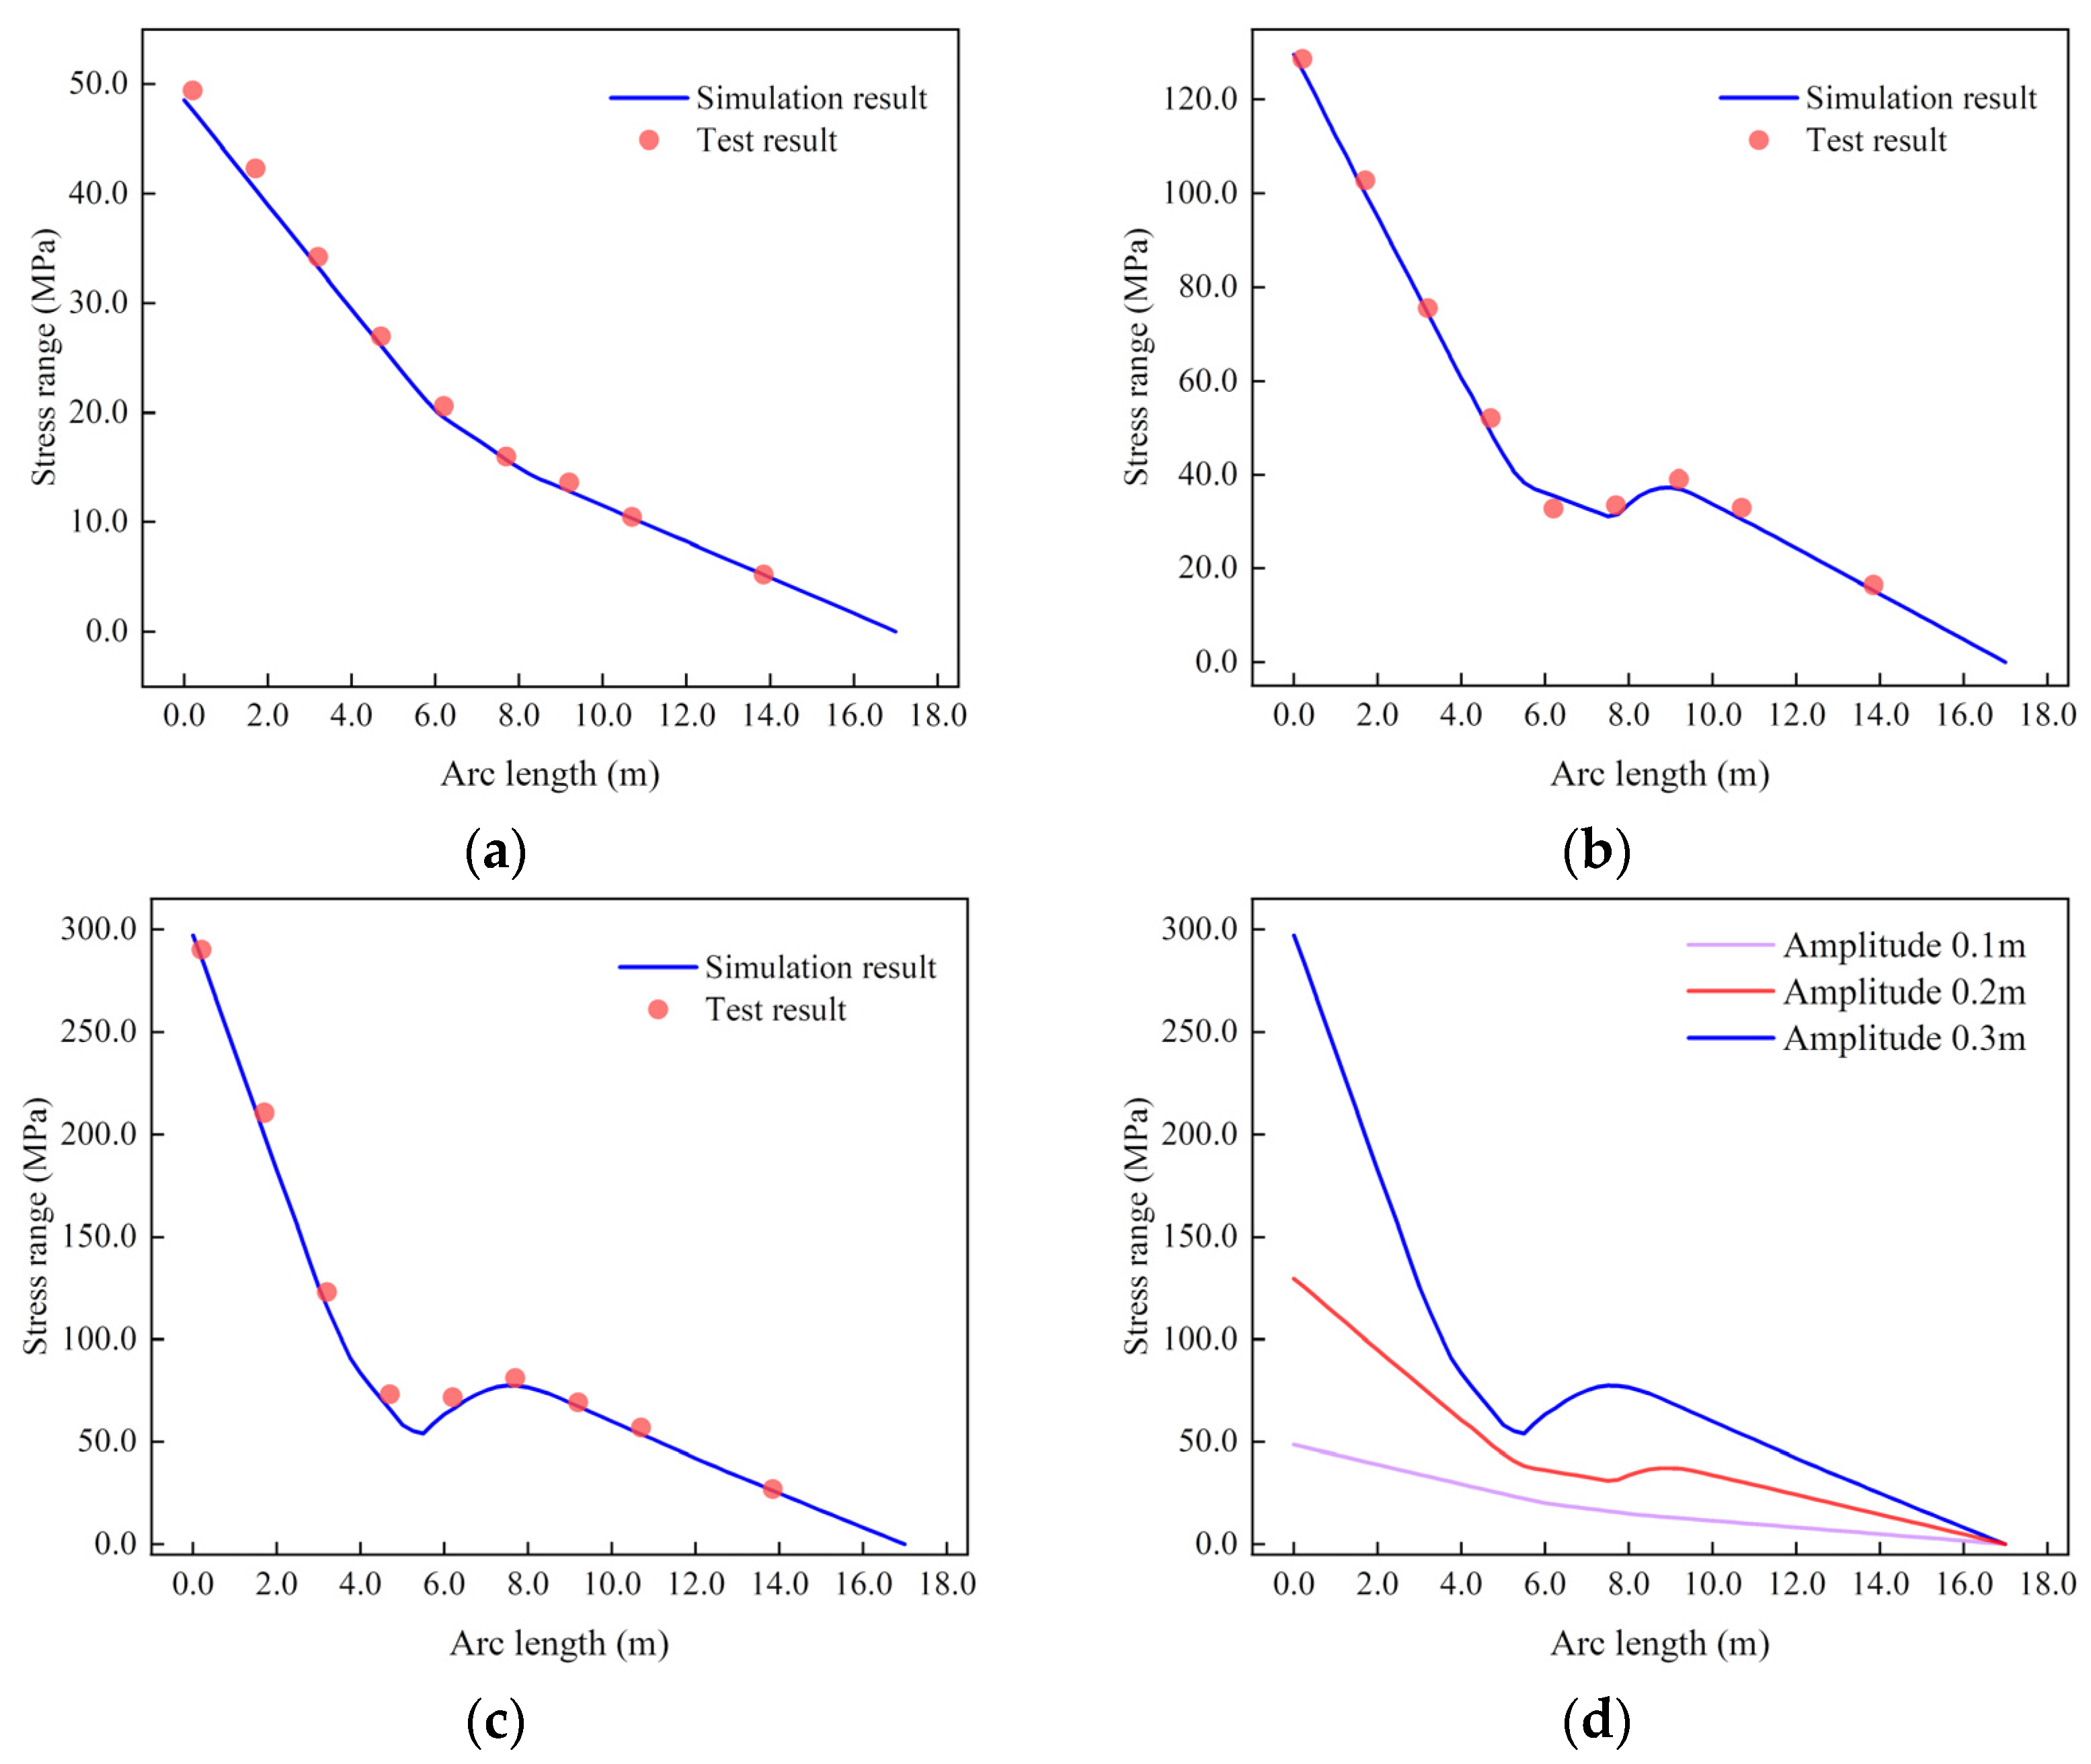
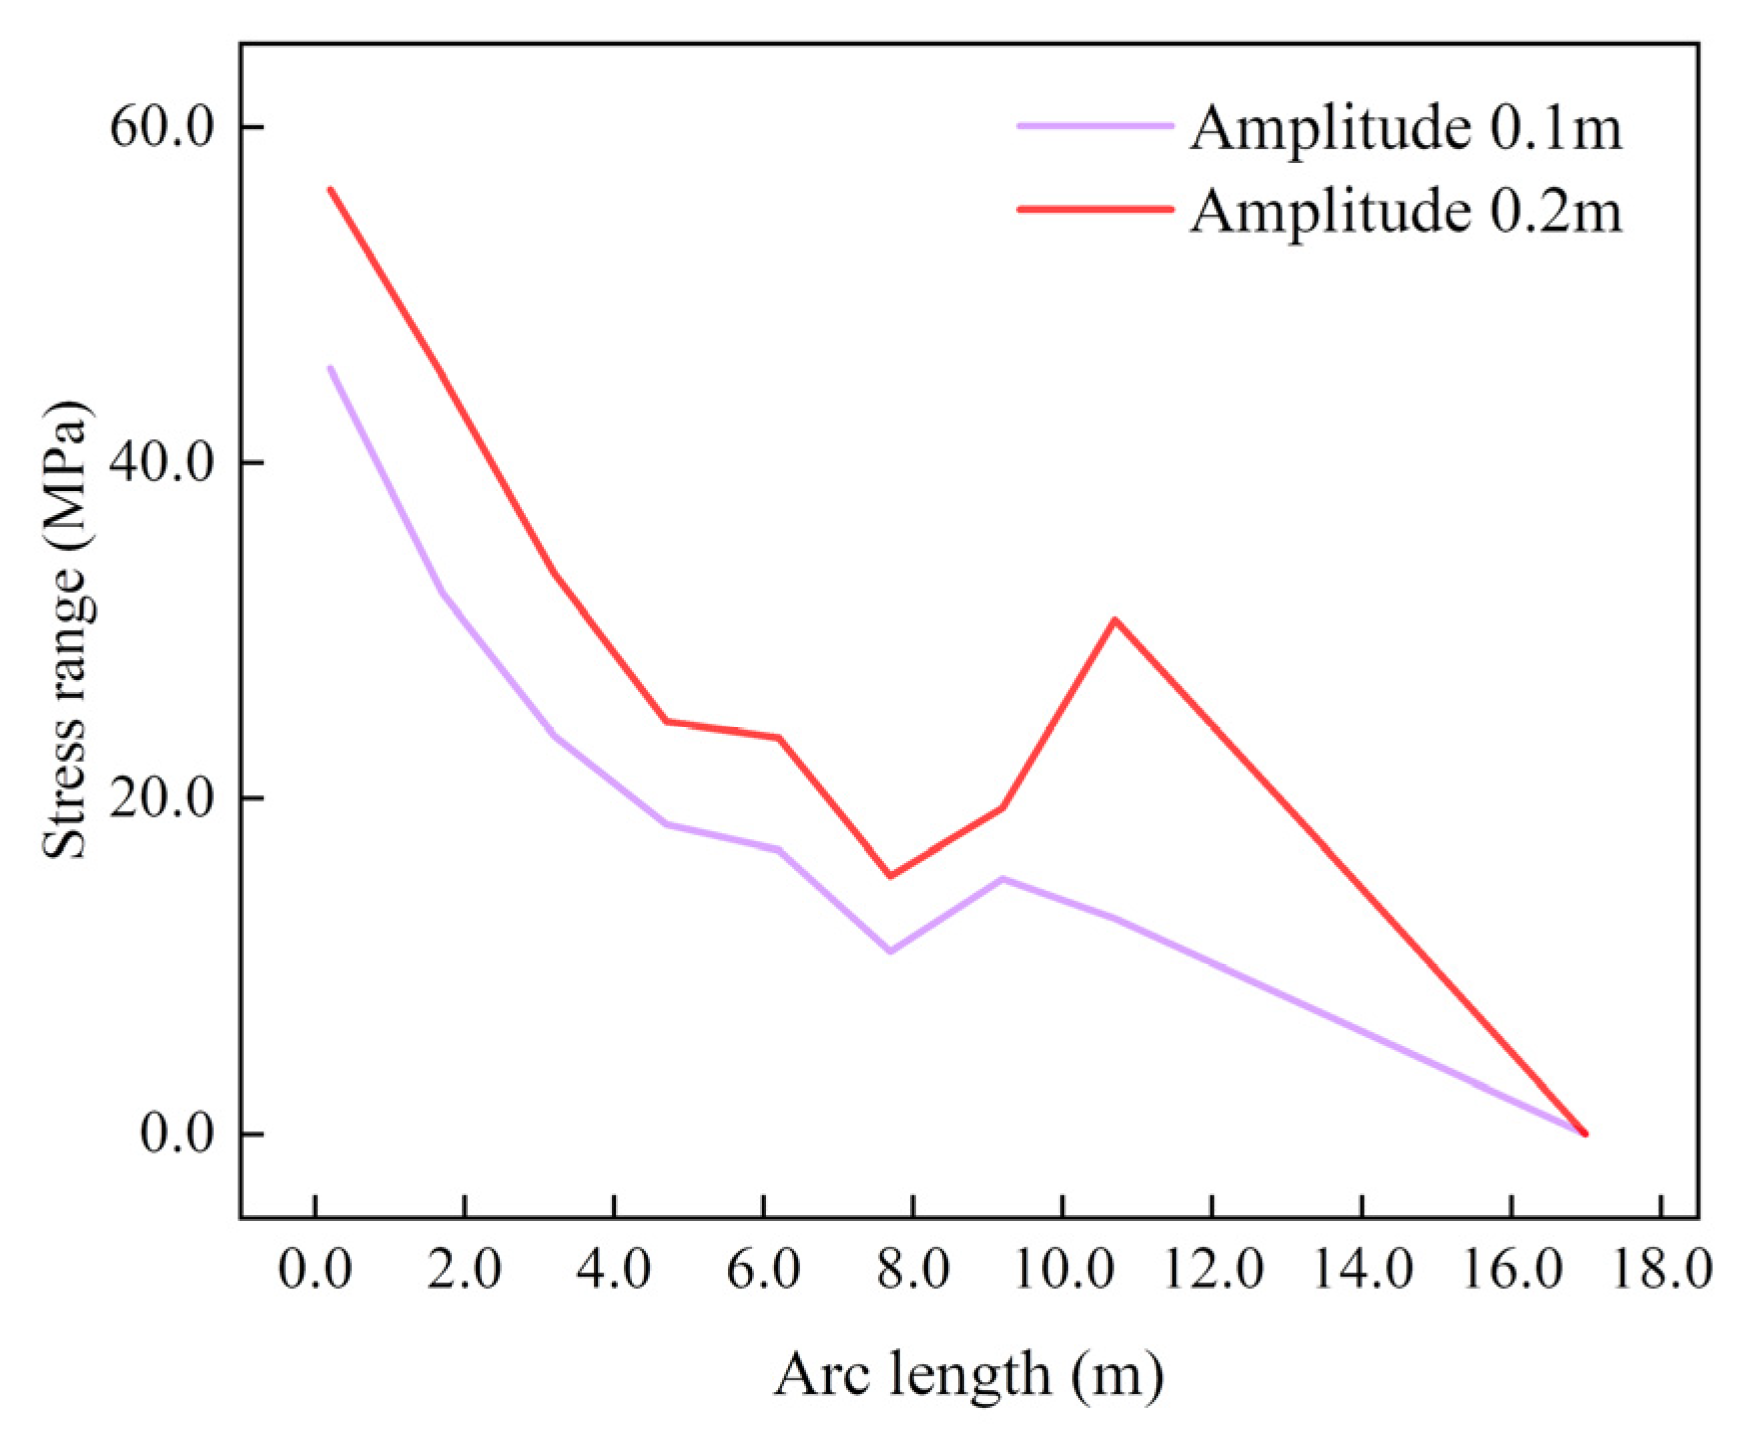
4.2.4. Stress Range Analysis
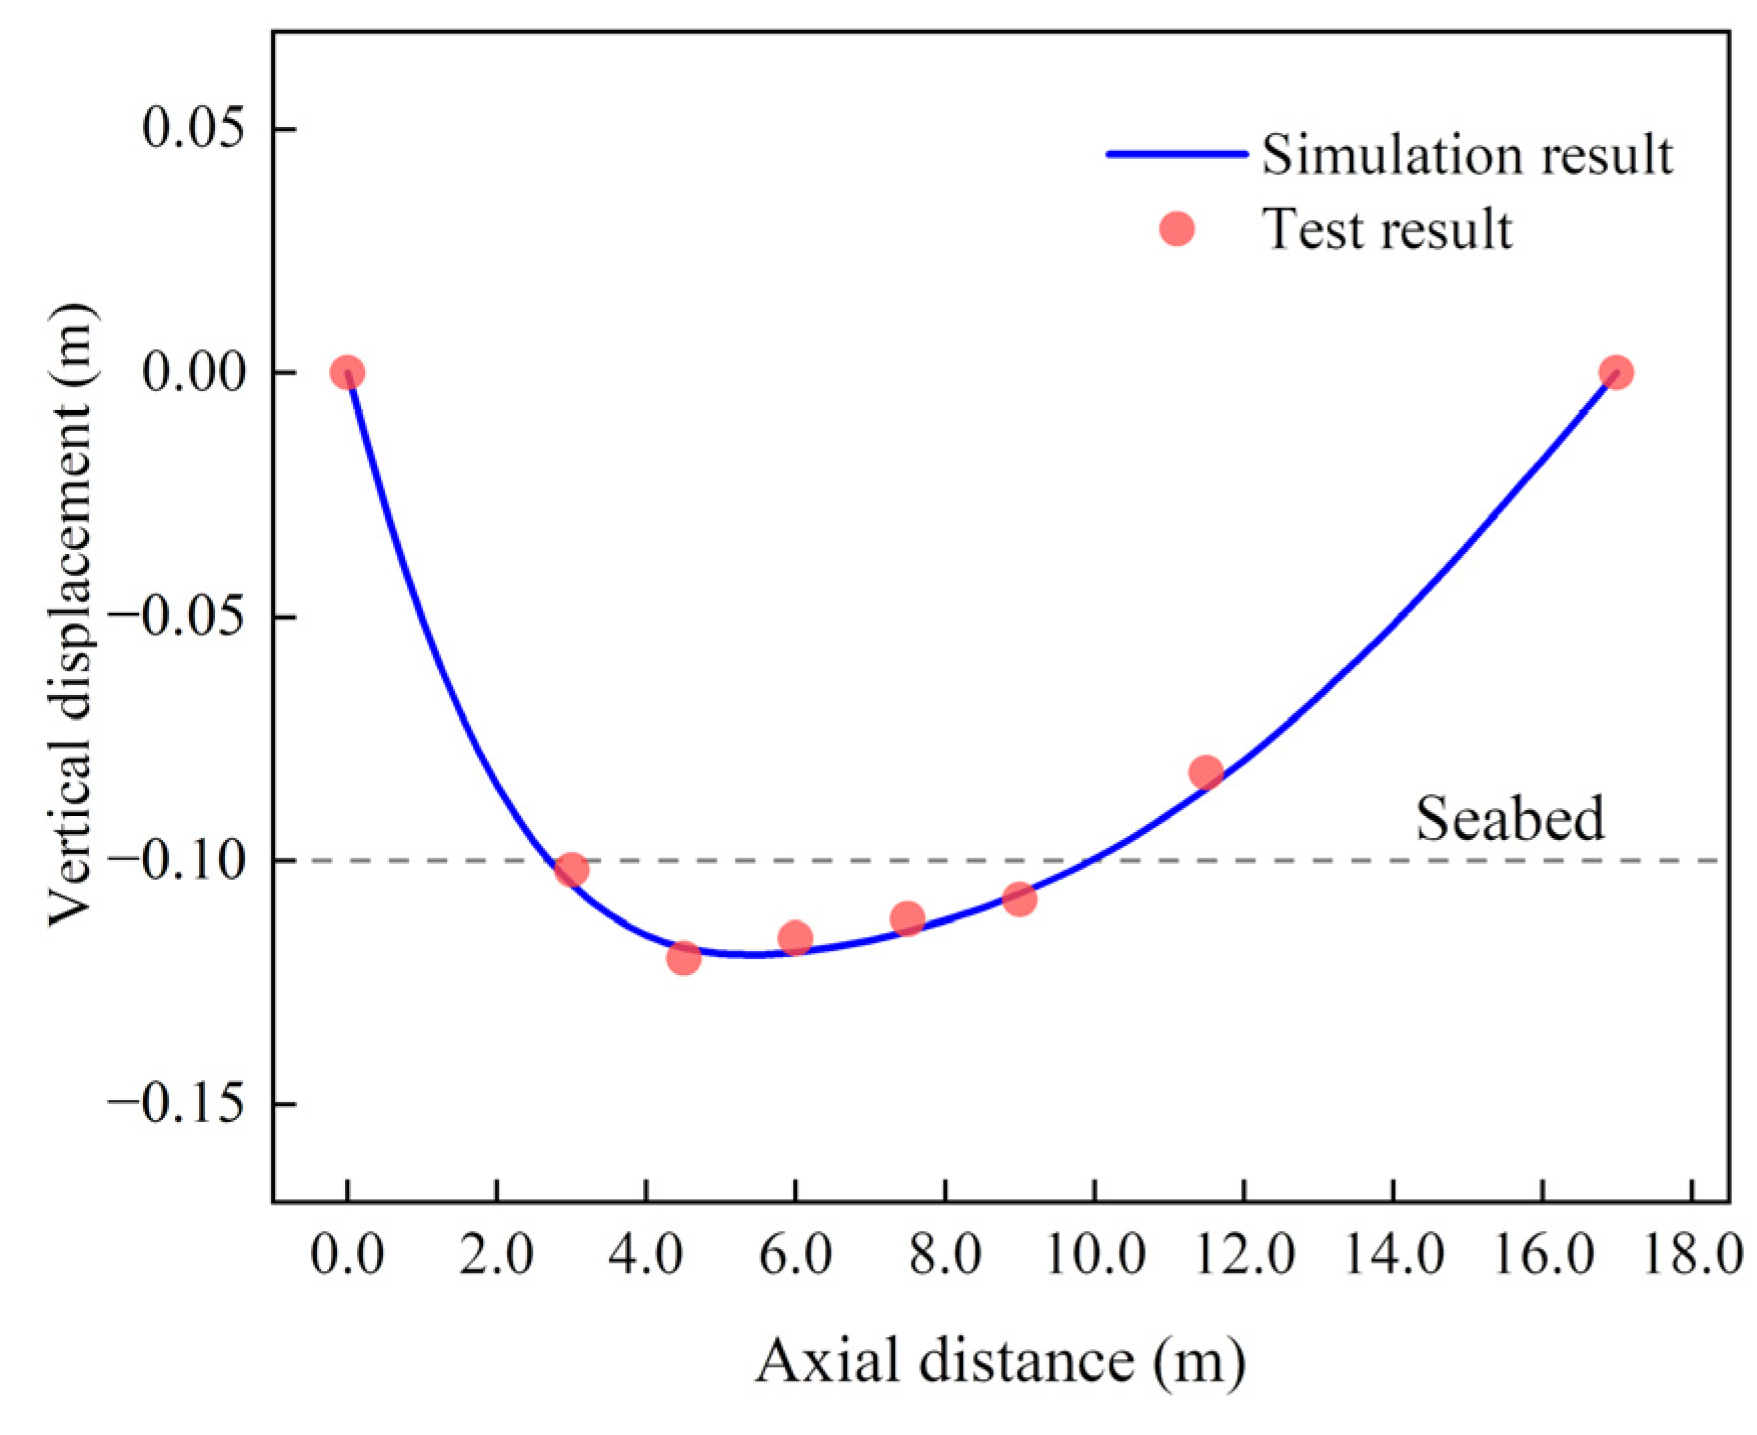
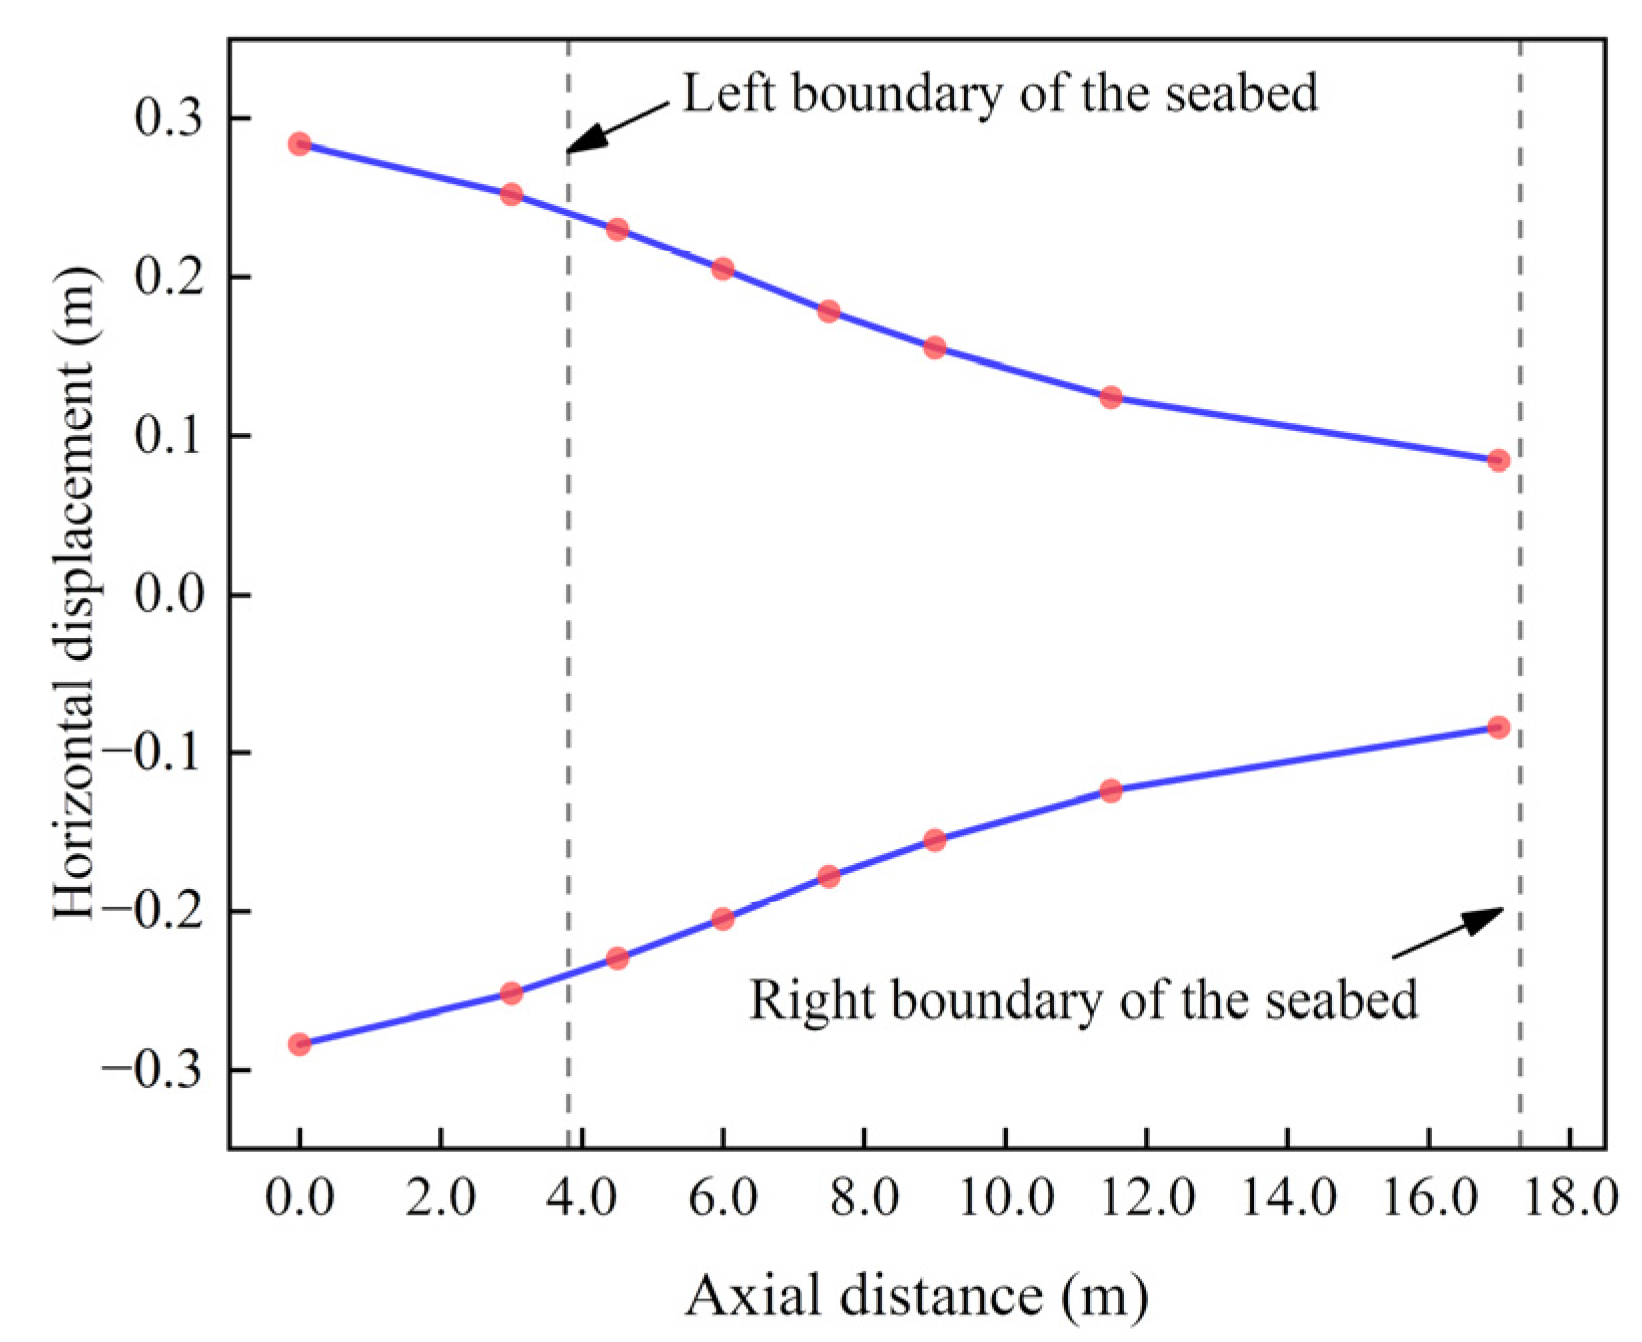
4.2.5. Seabed Trench Analysis
4.3. Cyclic Horizontal Displacement Loading
4.3.1. Effect of Increasing Loading Amplitude
4.3.2. Stress Range Analysis
4.3.3. Trench Plan Analysis
5. Conclusions
Author Contributions
Funding
Institutional Review Board Statement
Informed Consent Statement
Data Availability Statement
Conflicts of Interest
References
- Yu, Y.; Xu, S.; Yu, J.; Xu, W.; Xu, L.; Xu, L. Dynamic Analysis of Steel Catenary Riser on the Nonlinear Seabed Using Vector Form Intrinsic Finite Element Method. Ocean Eng. 2021, 241, 109982. [Google Scholar] [CrossRef]
- Drumond, G.P.; Pasqualino, I.P.; Pinheiro, B.C.; Estefen, S.F. Pipelines, Risers and Umbilicals Failures: A Literature Review. Ocean Eng. 2018, 148, 412–425. [Google Scholar] [CrossRef]
- Quéau, L.M.; Kimiaei, M.; Randolph, M.F. Analytical Estimation of Static Stress Range in Oscillating Steel Catenary Risers at Touchdown Areas and Its Application with Dynamic Amplification Factors. Ocean Eng. 2014, 88, 63–80. [Google Scholar] [CrossRef]
- Zargar, E.; Kimiaei, M.; Randolph, M. A New Hysteretic Seabed Model for Riser-Soil Interaction. Mar. Struct. 2019, 64, 360–378. [Google Scholar] [CrossRef]
- Bai, X.; Huang, W.; Vaz, M.A.; Yang, C.; Duan, M. Riser-Soil Interaction Model Effects on the Dynamic Behavior of a Steel Catenary Riser. Mar. Struct. 2015, 41, 53–76. [Google Scholar] [CrossRef]
- Randolph, M.; Quiggin, P. Non-Linear Hysteretic Seabed Model for Catenary Pipeline Contact. In Volume 3: Pipeline and Riser Technology; ASMEDC: New York, NY, USA, 1 January 2009; pp. 145–154. [Google Scholar]
- Aubeny, C.; Biscontin, G. Interaction Model for Steel Compliant Riser on Soft Seabed. SPE Proj. Facil. Constr. 2008, 3, 1–6. [Google Scholar] [CrossRef]
- Chen, J.; Bai, X.; Vaz, M.A. Dynamic Behavior of Steel Catenary Riser at the TDZ Considering Soil Stiffness Degeneration and Trench Development. Ocean Eng. 2022, 250, 110970. [Google Scholar] [CrossRef]
- Elosta, H.; Huang, S.; Incecik, A. Trenching Effects on Structural Safety Assessment of Integrated Riser/Semisubmersible in Cohesive Soil. Eng. Struct. 2014, 77, 57–64. [Google Scholar] [CrossRef]
- Bridge, C.D.; Howells, H.A. Observations and Modeling of Steel Catenary Riser Trenches. In Proceedings of the International Offshore and Polar Engineering Conference, Lisbon, Portugal, 1–6 July 2007; pp. 803–813. [Google Scholar]
- Wang, K.; Low, Y.M. A Simple Parametric Formulation for the Seabed Trench Profile beneath a Steel Catenary Riser. Mar. Struct. 2016, 45, 22–42. [Google Scholar] [CrossRef]
- Shiri, H. Influence of Seabed Trench Formation on Fatigue Performance of Steel Catenary Risers in Touchdown Zone. Mar. Struct. 2014, 36, 1–20. [Google Scholar] [CrossRef]
- Mekha, B.; Randolph, M.; Bhat, S.; Jain, S. Modeling the Touchdown Zone Trench and Its Impact on SCR Fatigue Life. In Proceedings of the Offshore Technology Conference, Houston, TX, USA, 6 May 2013. [Google Scholar]
- Yu, Y.; Xu, S.; Yu, J.; Xu, W.; Xu, L.; Xu, L. Influence of Seabed Trench on the Structural Behavior of Steel Catenary Riser Using the Vector Form Intrinsic Finite Element Method. Ocean Eng. 2022, 251, 110963. [Google Scholar] [CrossRef]
- Shoghi, R.; Shiri, H. Modeling Touchdown Point Oscillation and Its Relationship with Fatigue Response of Steel Catenary Risers. Appl. Ocean Res. 2019, 87, 142–154. [Google Scholar] [CrossRef]
- Shoghi, R.; Pesce, C.P.; Shiri, H. Influence of Trench Geometry on Fatigue Response of Steel Catenary Risers by Using a Boundary Layer Solution on a Sloped Seabed. Ocean Eng. 2021, 221, 108447. [Google Scholar] [CrossRef]
- Willis, N.R.T.; West, P.T.J. Interaction between Deepwater Catenary Risers and a Soft Seabed: Large Scale Sea Trials. In Proceedings of the Offshore Technology Conference, Houston, TX, USA, 30 April 2001. [Google Scholar]
- Bai, X.; Vaz, M.A.; Morooka, C.K.; Xie, Y. Dynamic Tests in a Steel Catenary Riser Reduced Scale Model. Ships Offshore Struct. 2017, 12, 1064–1076. [Google Scholar] [CrossRef]
- Wang, L.; Zhang, J.; Yuan, F.; Li, K. Interaction between Catenary Riser and Soft Seabed: Large-Scale Indoor Tests. Appl. Ocean Res. 2014, 45, 10–21. [Google Scholar] [CrossRef]
- Hodder, M.S.; Byrne, B.W. 3D Experiments Investigating the Interaction of a Model SCR with the Seabed. Appl. Ocean Res. 2010, 32, 146–157. [Google Scholar] [CrossRef]
- Wang, L.Z.; Li, K.; Yuan, F. Lateral Cyclic Interaction between Catenary Riser and Soft Seabed. Appl. Ocean Res. 2017, 63, 11–23. [Google Scholar] [CrossRef] [Green Version]
- Dai, Y.; Zhou, J. Experimental Investigations on Seismic Response of Riser in Touchdown Zone. Int. J. Nav. Archit. Ocean Eng. 2018, 10, 348–359. [Google Scholar] [CrossRef]
- Tianfeng, Z.; Shixiao, F.; Tianhao, W. Seabed Stiffness Influences and Water Damping Effects on Vibration of the Touchdown Zone in a Steel Catenary Riser. Int. J. Press. Vessel. Pip. 2019, 170, 30–39. [Google Scholar] [CrossRef]
- Bhattacharyya, A.; Tognarelli, M.; Li, G.; Ghosh, R.; Clukey, E.C.; Sun, Q. Simulation of SCR Behaviour at Touchdown Zone- Part I: Numerical Analysis of Global SCR Model Versus Sectional SCR Model. In Proceedings of the Offshore Technology Conference, Houston, TX, USA, 4 October 2011. [Google Scholar]
- Elliott, B.J.; Zakeri, A.; Macneill, A.; Phillips, R.; Clukey, E.C.; Li, G. Centrifuge Modeling of Steel Catenary Risers at Touchdown Zone Part I: Development of Novel Centrifuge Experimental Apparatus. Ocean Eng. 2013, 60, 200–207. [Google Scholar] [CrossRef]
- Elliott, B.J.; Zakeri, A.; Barrett, J.; Hawlader, B.; Li, G.; Clukey, E.C. Centrifuge Modeling of Steel Catenary Risers at Touchdown Zone Part II: Assessment of Centrifuge Test Results Using Kaolin Clay. Ocean Eng. 2013, 60, 208–218. [Google Scholar] [CrossRef]
- Clukey, E.C.; Tognarelli, M.; Li, G.; Ghosh, R.; Phillips, R.D.; Zakeri, A.; Elliott, B.; Bhattacharyya, A.; Sun, Q. Simulation of SCR Behaviour at Touchdown Zone-Part II: Testing of a Sectional SCR Model in a Geotechnical Centrifuge. In Proceedings of the Offshore Technology Conference, Houston, TX, USA, 4 October 2011. [Google Scholar]
- Hu, H.J.E.; Leung, C.F.; Chow, Y.K.; Palmer, A.C. Centrifuge Modelling of SCR Vertical Motion at Touchdown Zone. Ocean Eng. 2011, 38, 888–899. [Google Scholar] [CrossRef]


| Properties of Riser and Seabed | Value | Unit |
|---|---|---|
| Total length L | 2130.0 | m |
| External diameter D | 168.0 | mm |
| Wall thickness t | 18.3 | mm |
| Mudline shear strength sum | 6.0 | kPa |
| Shear strength gradient k | 1.5 | kPa/m |
| Power law parameter a | 6.0 | |
| Power law parameter b | 0.25 | |
| Normalized maximum stiffness Kmax | 200 | |
| Suction ratio fsuc | 0.2 | |
| Normalized suction decay distance λsuc | 0.5 | |
| Normalized repenetration offset after uplift λrep | 0.5 | |
| Saturated soil density ρs | 1500.0 | kg/m3 |
| Soil buoyancy factor fb | 1.5 |
| Loading Sequence | Loading Direction | Amplitude (m) | Period (s) |
|---|---|---|---|
| 1 | Vertical | 0.1 | 20 |
| 2 | 0.2 | 20, 15, 10 | |
| 3 | 0.3 | 20, 15, 10 | |
| 4 | 0.2 | 15 | |
| 5 | Horizontal | 0.1 | 15 |
| 6 | 0.2 | 15 |
Disclaimer/Publisher’s Note: The statements, opinions and data contained in all publications are solely those of the individual author(s) and contributor(s) and not of MDPI and/or the editor(s). MDPI and/or the editor(s) disclaim responsibility for any injury to people or property resulting from any ideas, methods, instructions or products referred to in the content. |
© 2023 by the authors. Licensee MDPI, Basel, Switzerland. This article is an open access article distributed under the terms and conditions of the Creative Commons Attribution (CC BY) license (https://creativecommons.org/licenses/by/4.0/).
Share and Cite
Yu, Y.; Xu, S.; Yu, J.; Xu, L.; Liu, X.; Liu, P. Experimental Study of the Dynamic Performance of Steel Catenary Riser within the Touchdown Zone. J. Mar. Sci. Eng. 2023, 11, 151. https://doi.org/10.3390/jmse11010151
Yu Y, Xu S, Yu J, Xu L, Liu X, Liu P. Experimental Study of the Dynamic Performance of Steel Catenary Riser within the Touchdown Zone. Journal of Marine Science and Engineering. 2023; 11(1):151. https://doi.org/10.3390/jmse11010151
Chicago/Turabian StyleYu, Yang, Shengbo Xu, Jianxing Yu, Lixin Xu, Xin Liu, and Pengfei Liu. 2023. "Experimental Study of the Dynamic Performance of Steel Catenary Riser within the Touchdown Zone" Journal of Marine Science and Engineering 11, no. 1: 151. https://doi.org/10.3390/jmse11010151