
Features of Oil Spills Monitoring on the Water Surface by the Russian Federation in the Arctic Region

Abstract
:1. Introduction
2. Oil Pollution of the World’s Waters Today
2.1. Oil spills Caused by Marine Transportation
2.2. The Arctic Incidents
2.3. Energy Pipelines Accidents
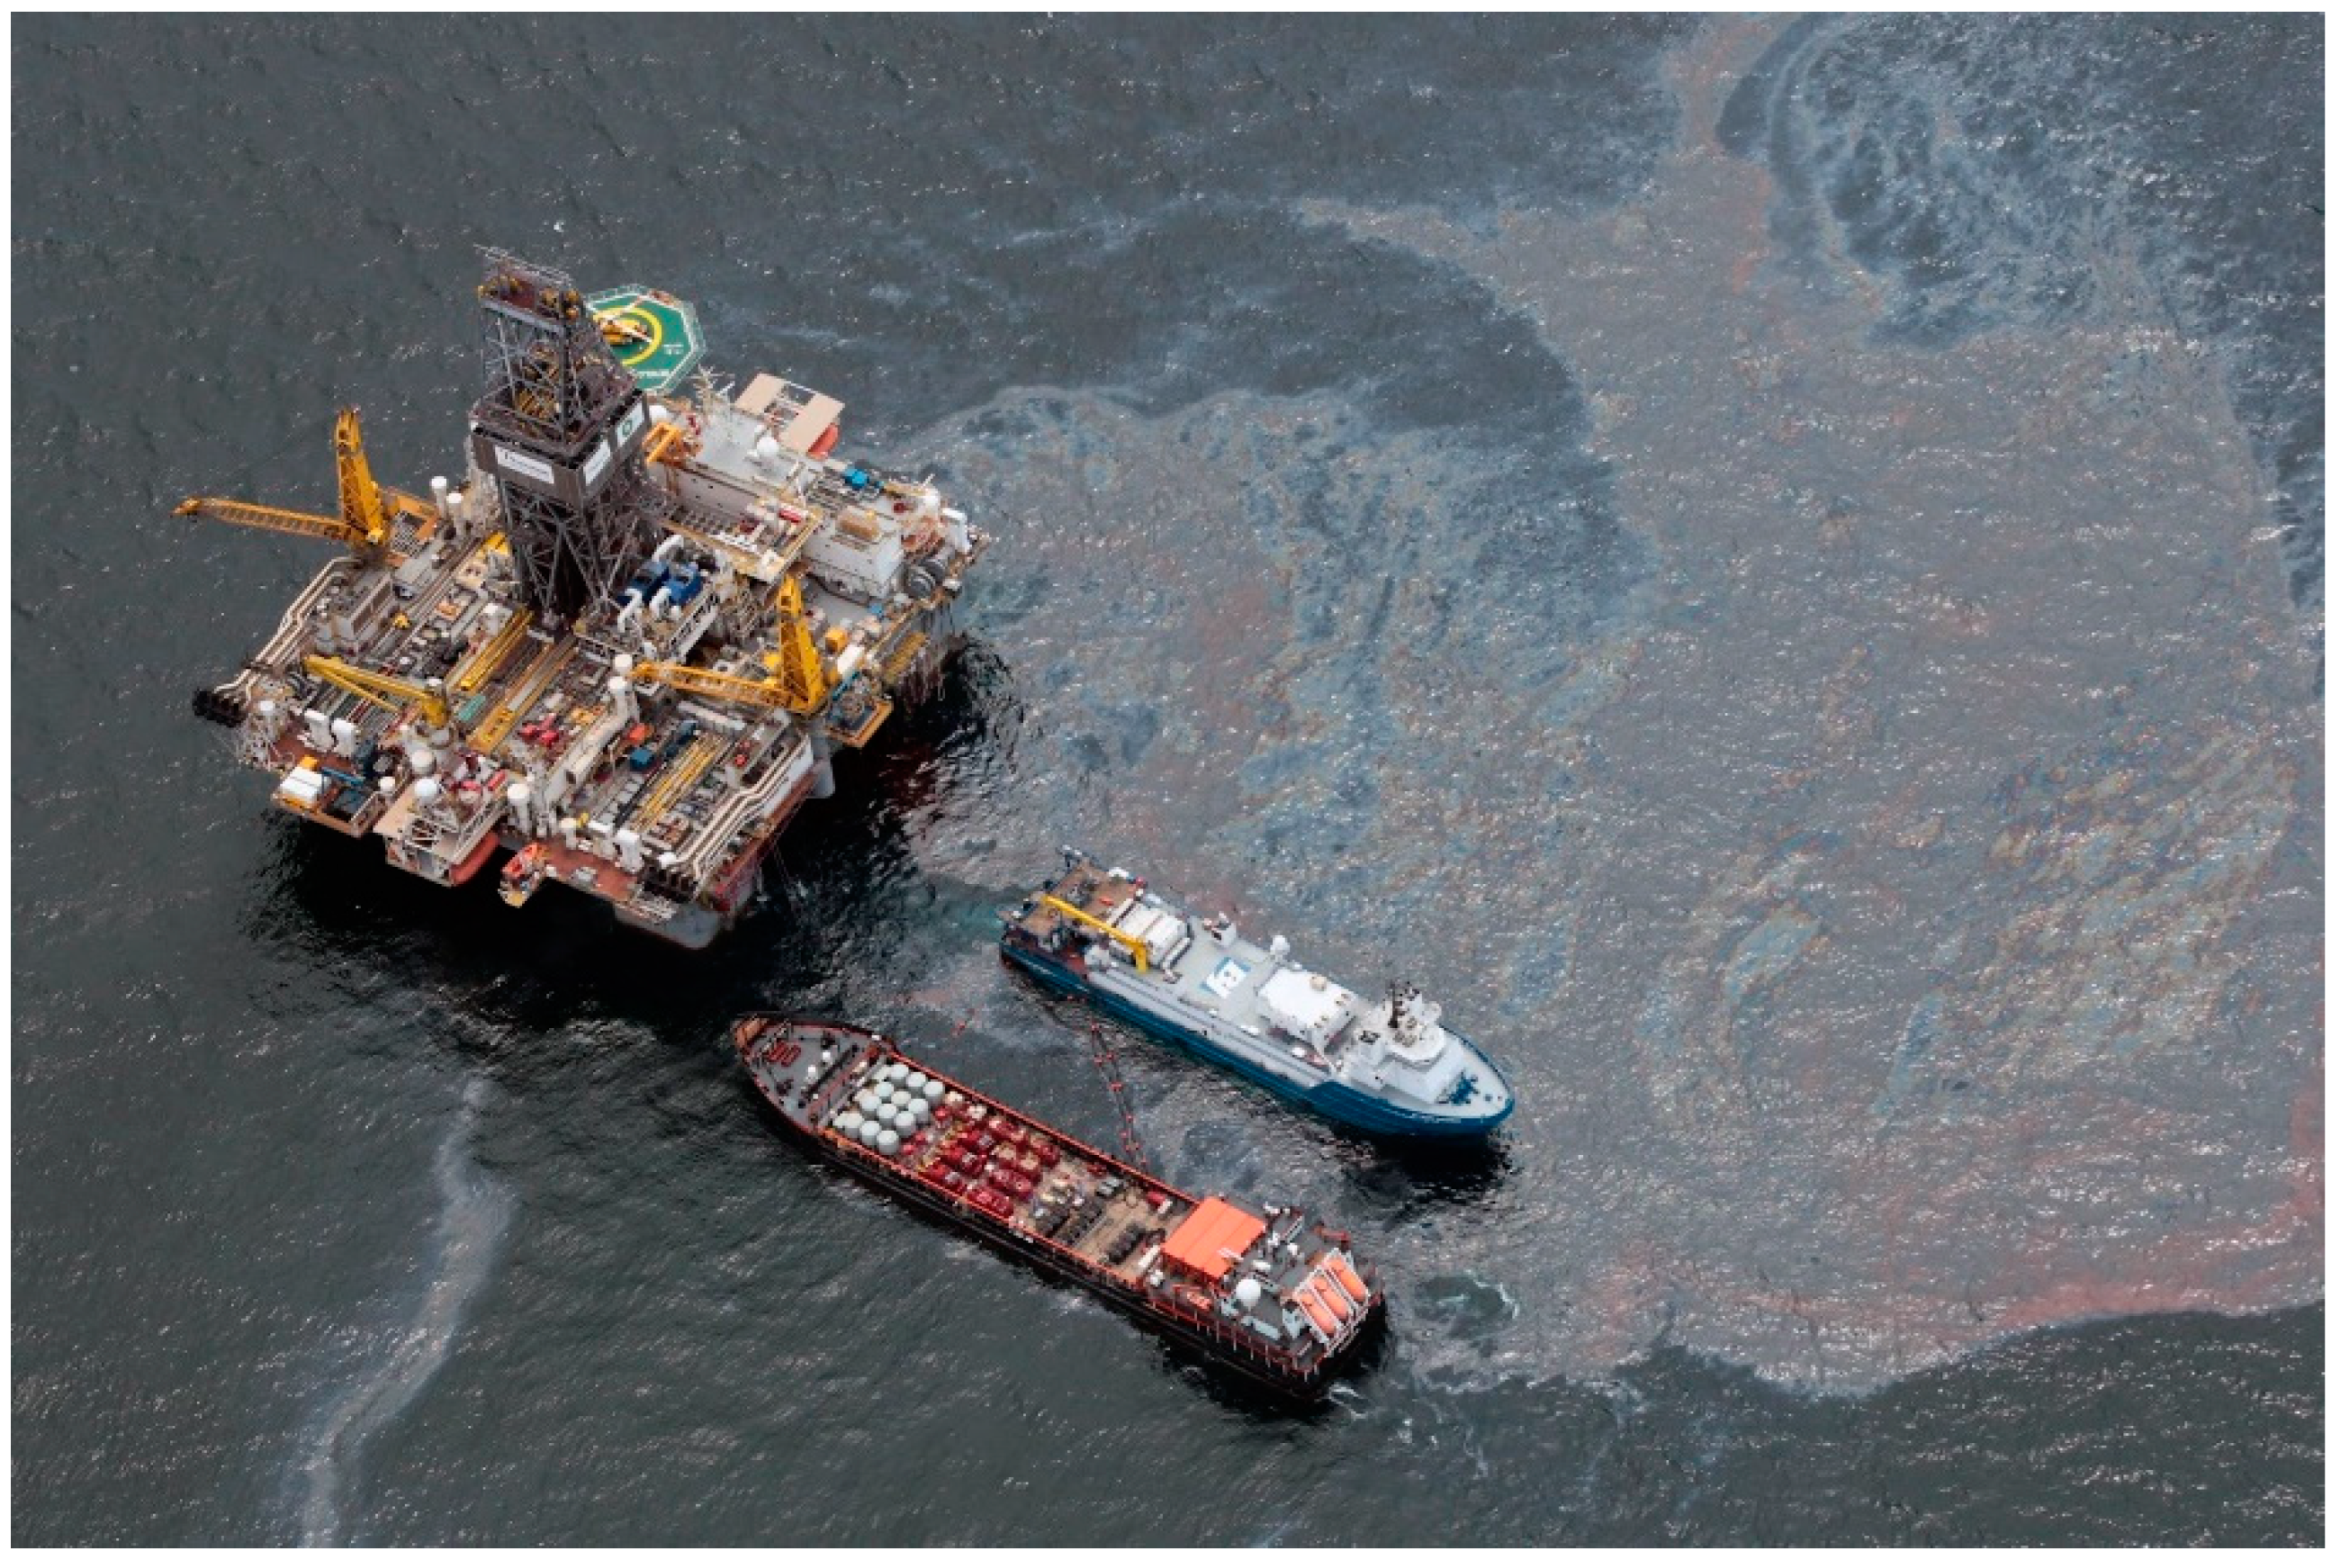
2.4. Oil Spills Caused by Petroleum Exploration and Production
3. Features of Oil Spills Monitoring in the Arctic Region
3.1. The Potential of the Arctic Territories
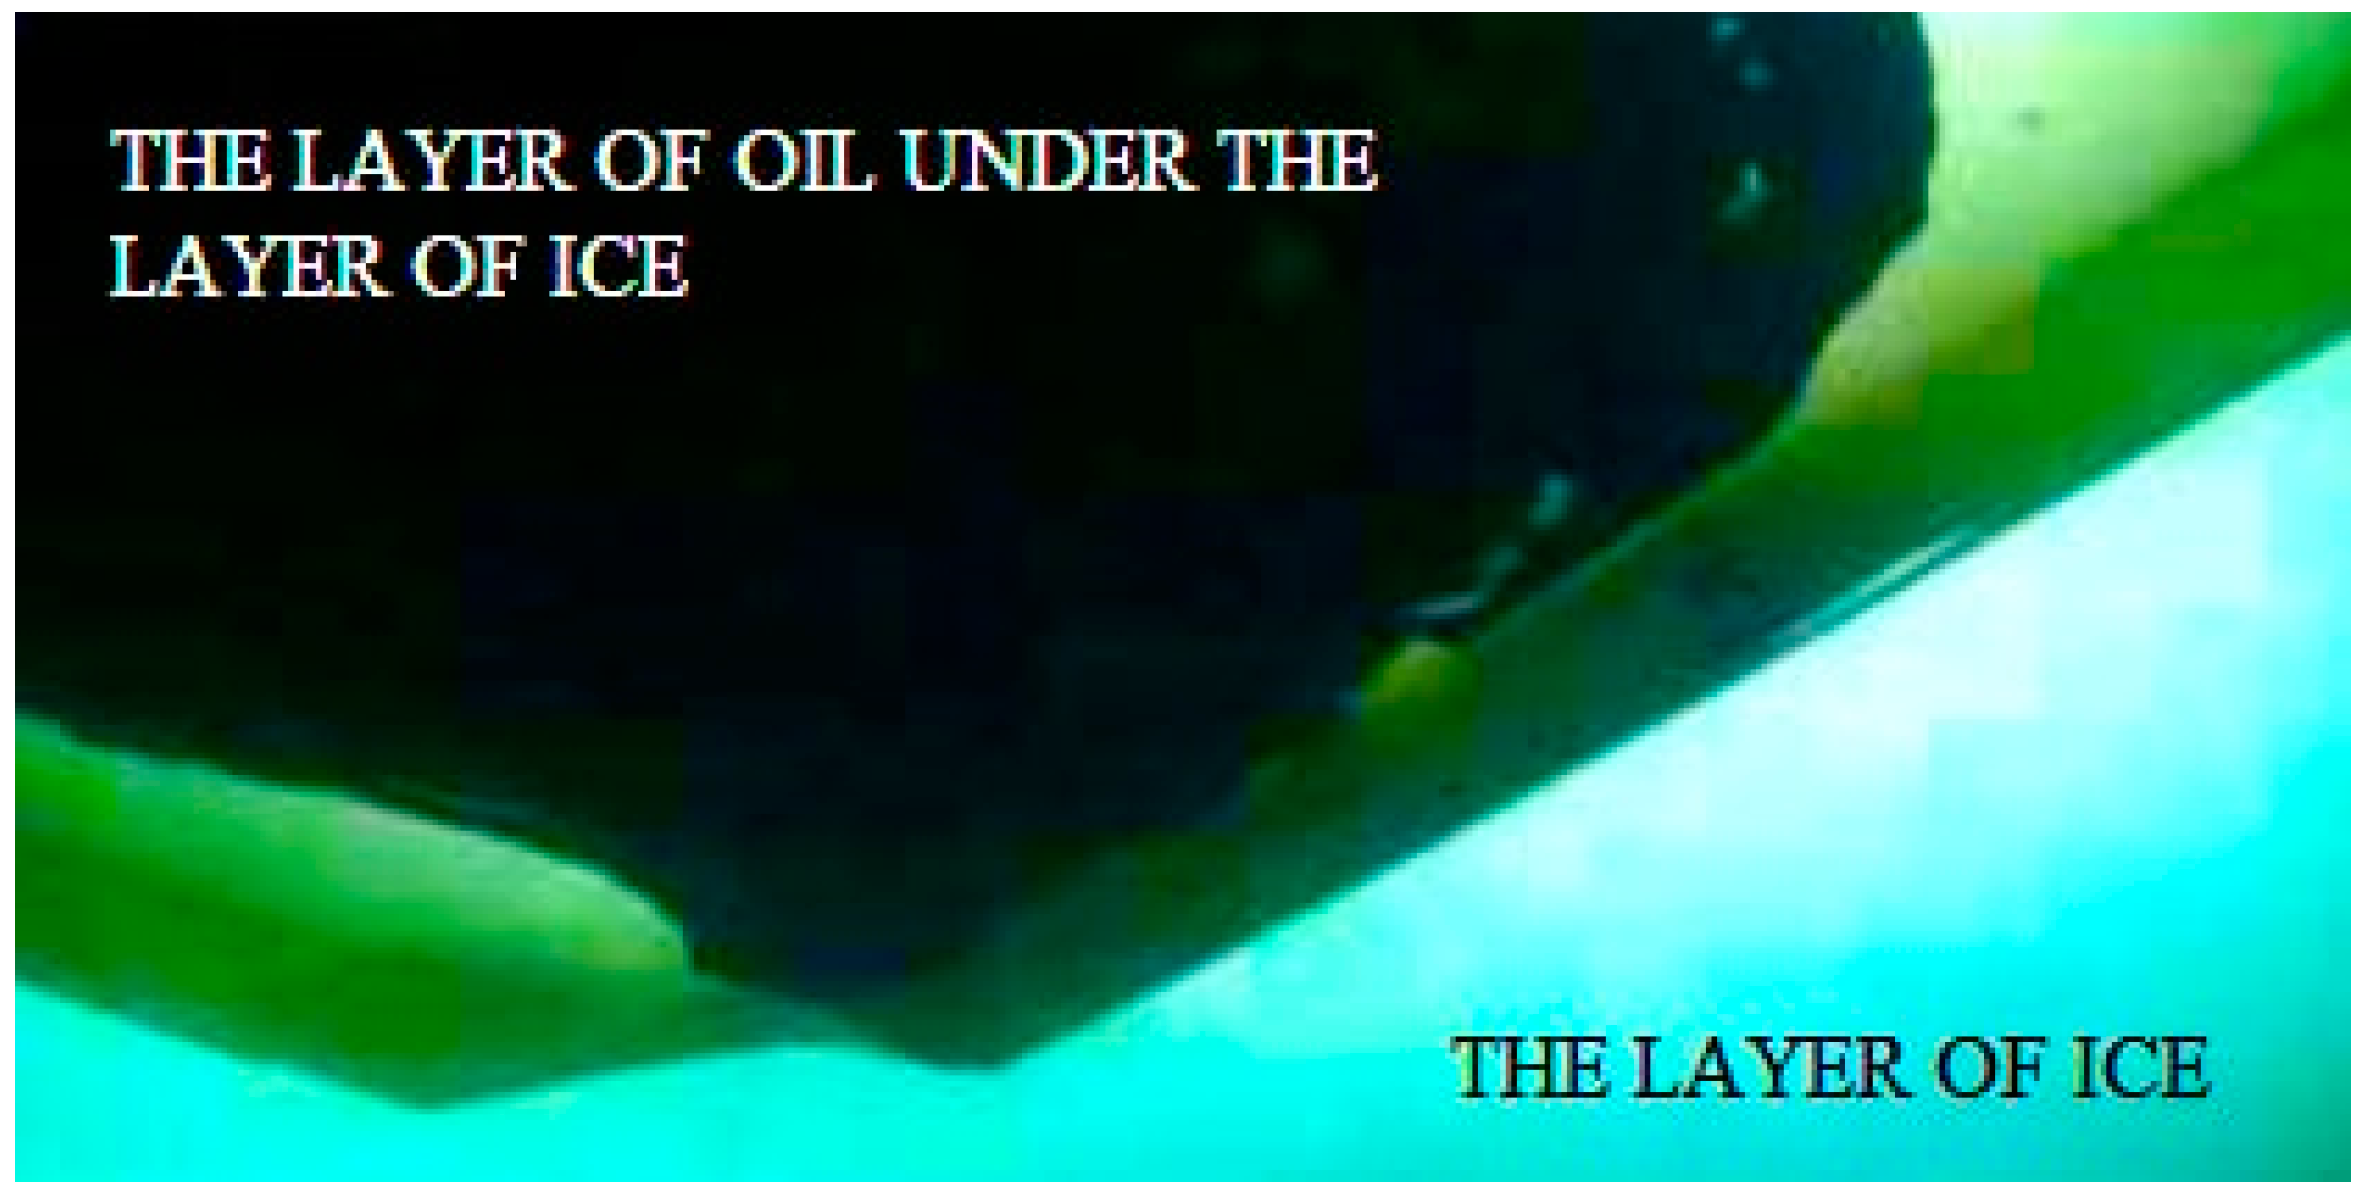
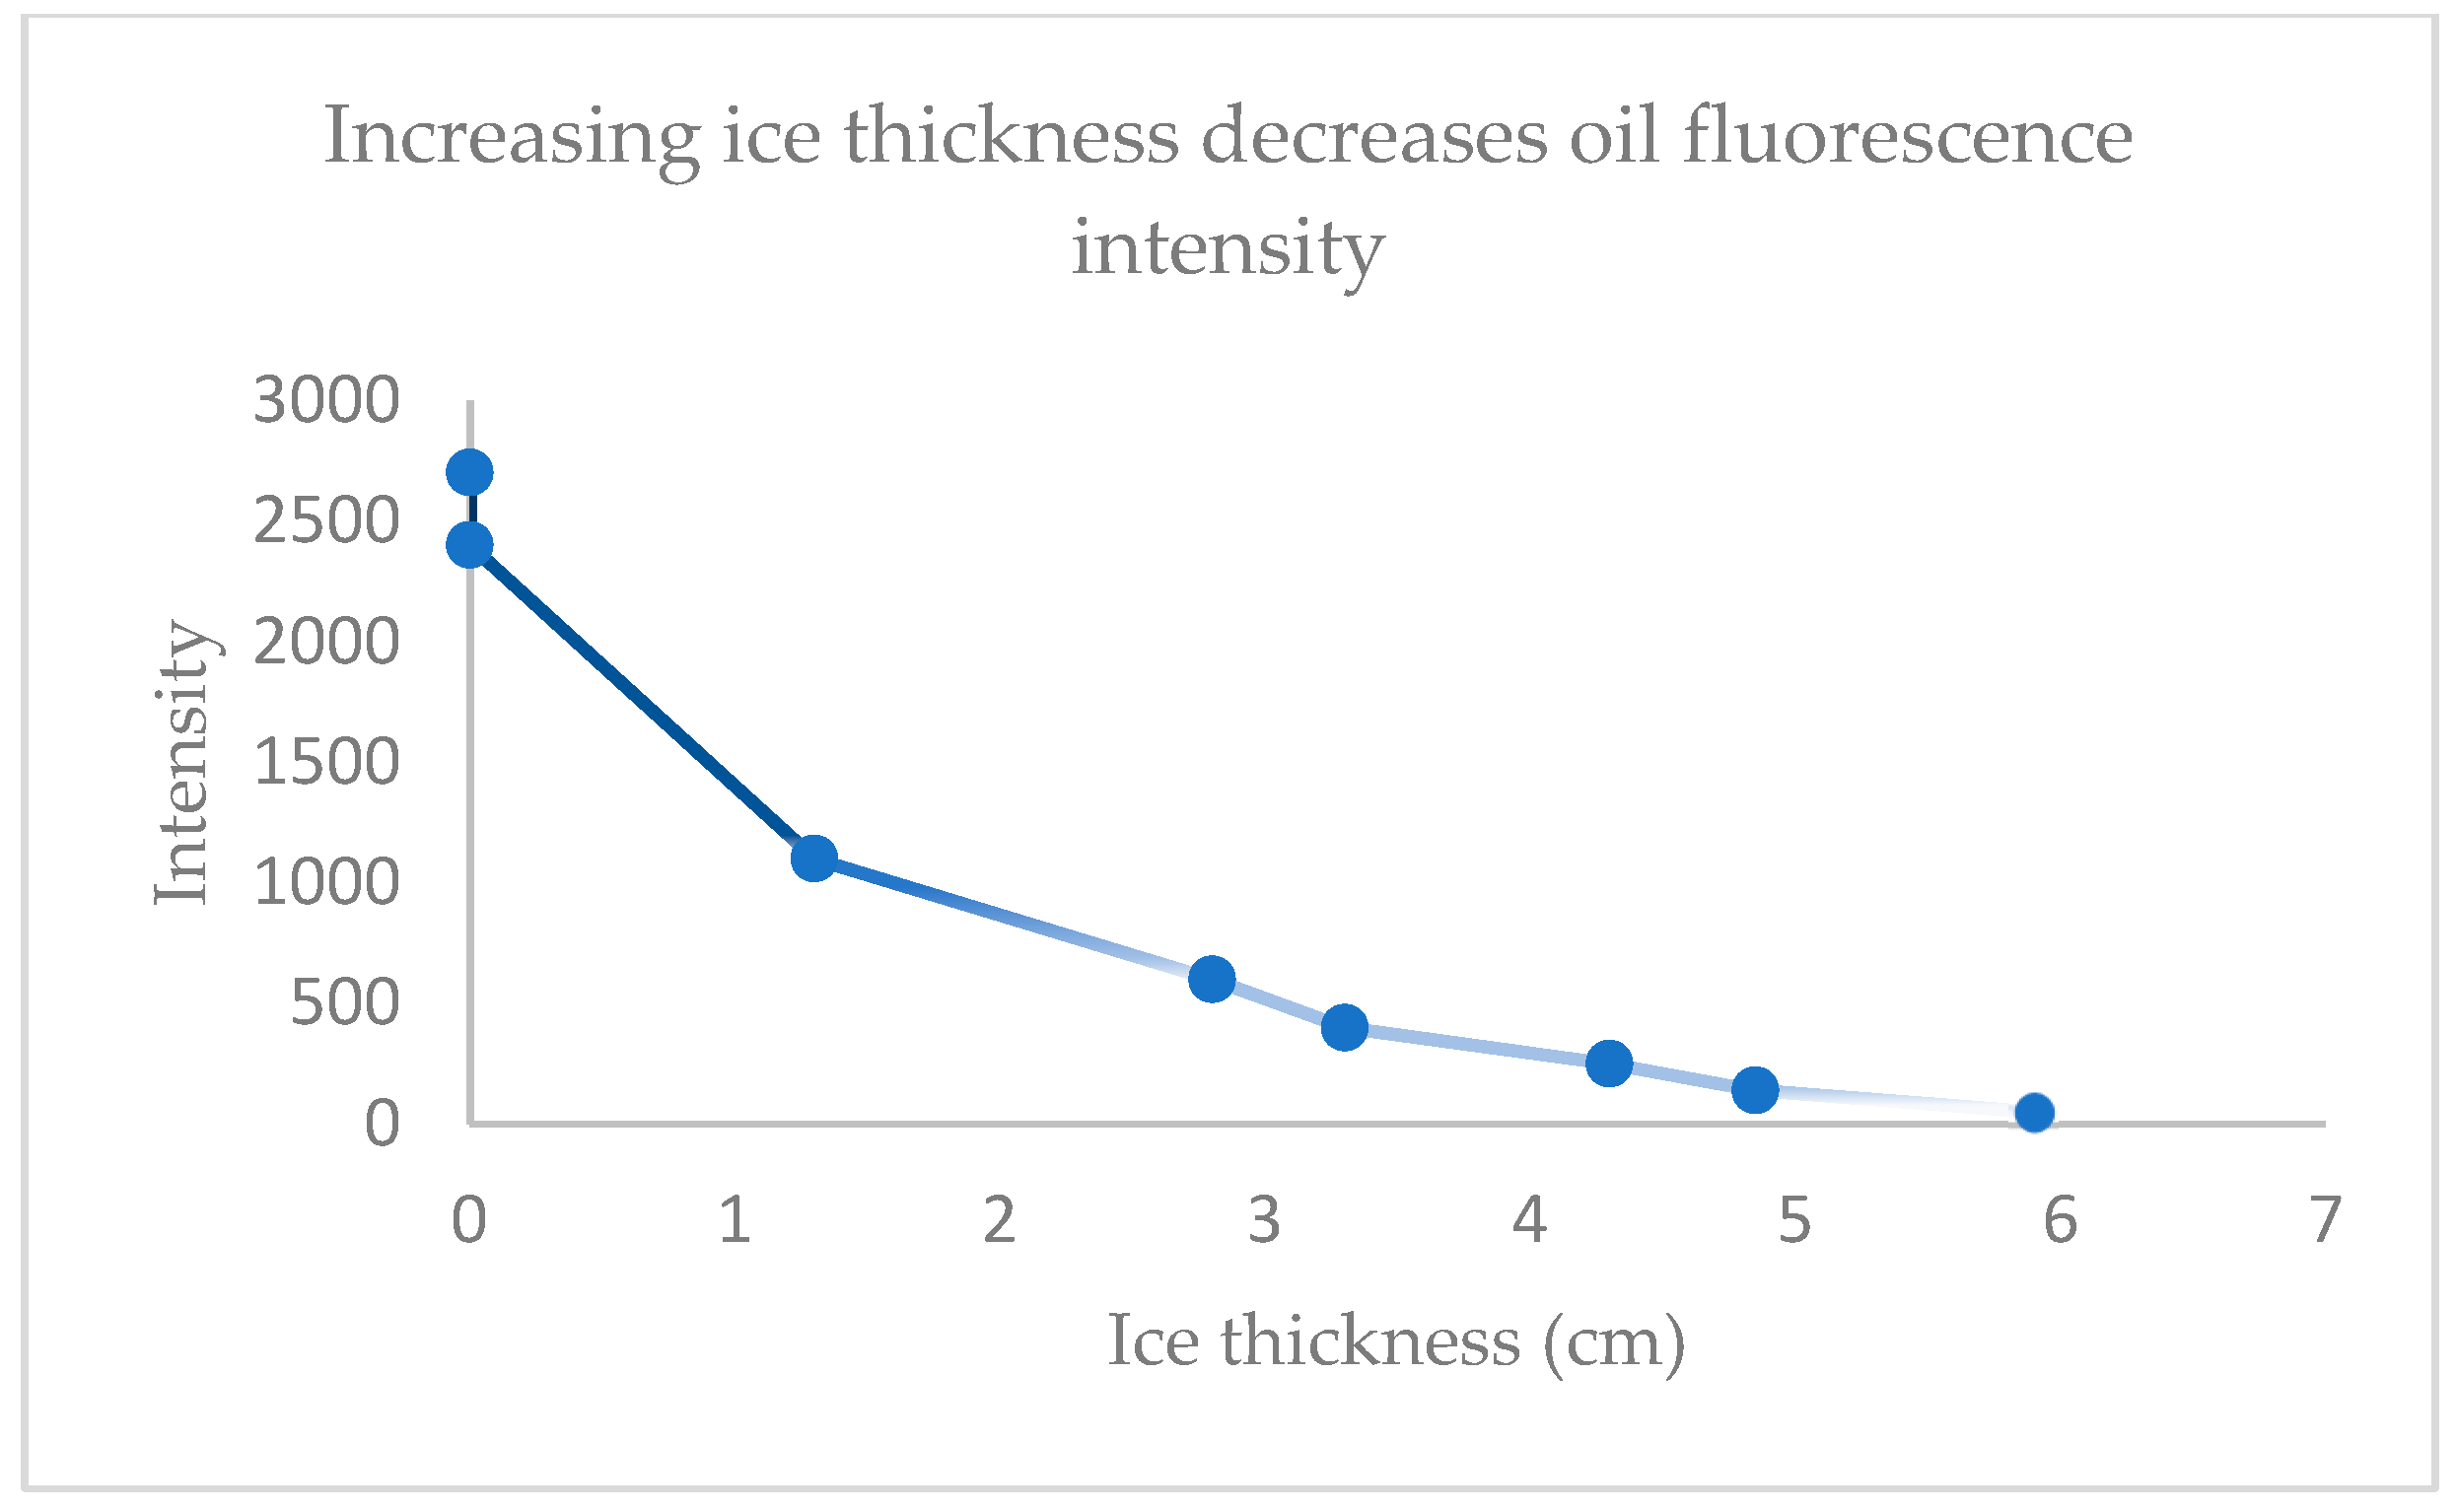
3.2. Oil on Ice
4. Existing Methods and Devices for Oil Spill Monitoring
- Speed (of on-time detection of the spill and prompt alarm of the incident);
- Accuracy (high-quality, close-to-reality monitoring data);
- Universality (the ability to use this method everywhere, under any conditions: on land, on water, etc.);
- Cost-effectiveness (cheapness of the method, not to the detriment of its quality);
- Individual available positive aspects of the method.
- Gravimetric analysis;
- Infrared spectrometry;
- Fluorescence spectroscopy analysis;
- Gas chromatographic analysis.
- Aircrafts;
- Unmanned aerial vehicles (UAVs);
- Satellites;
- Radars.
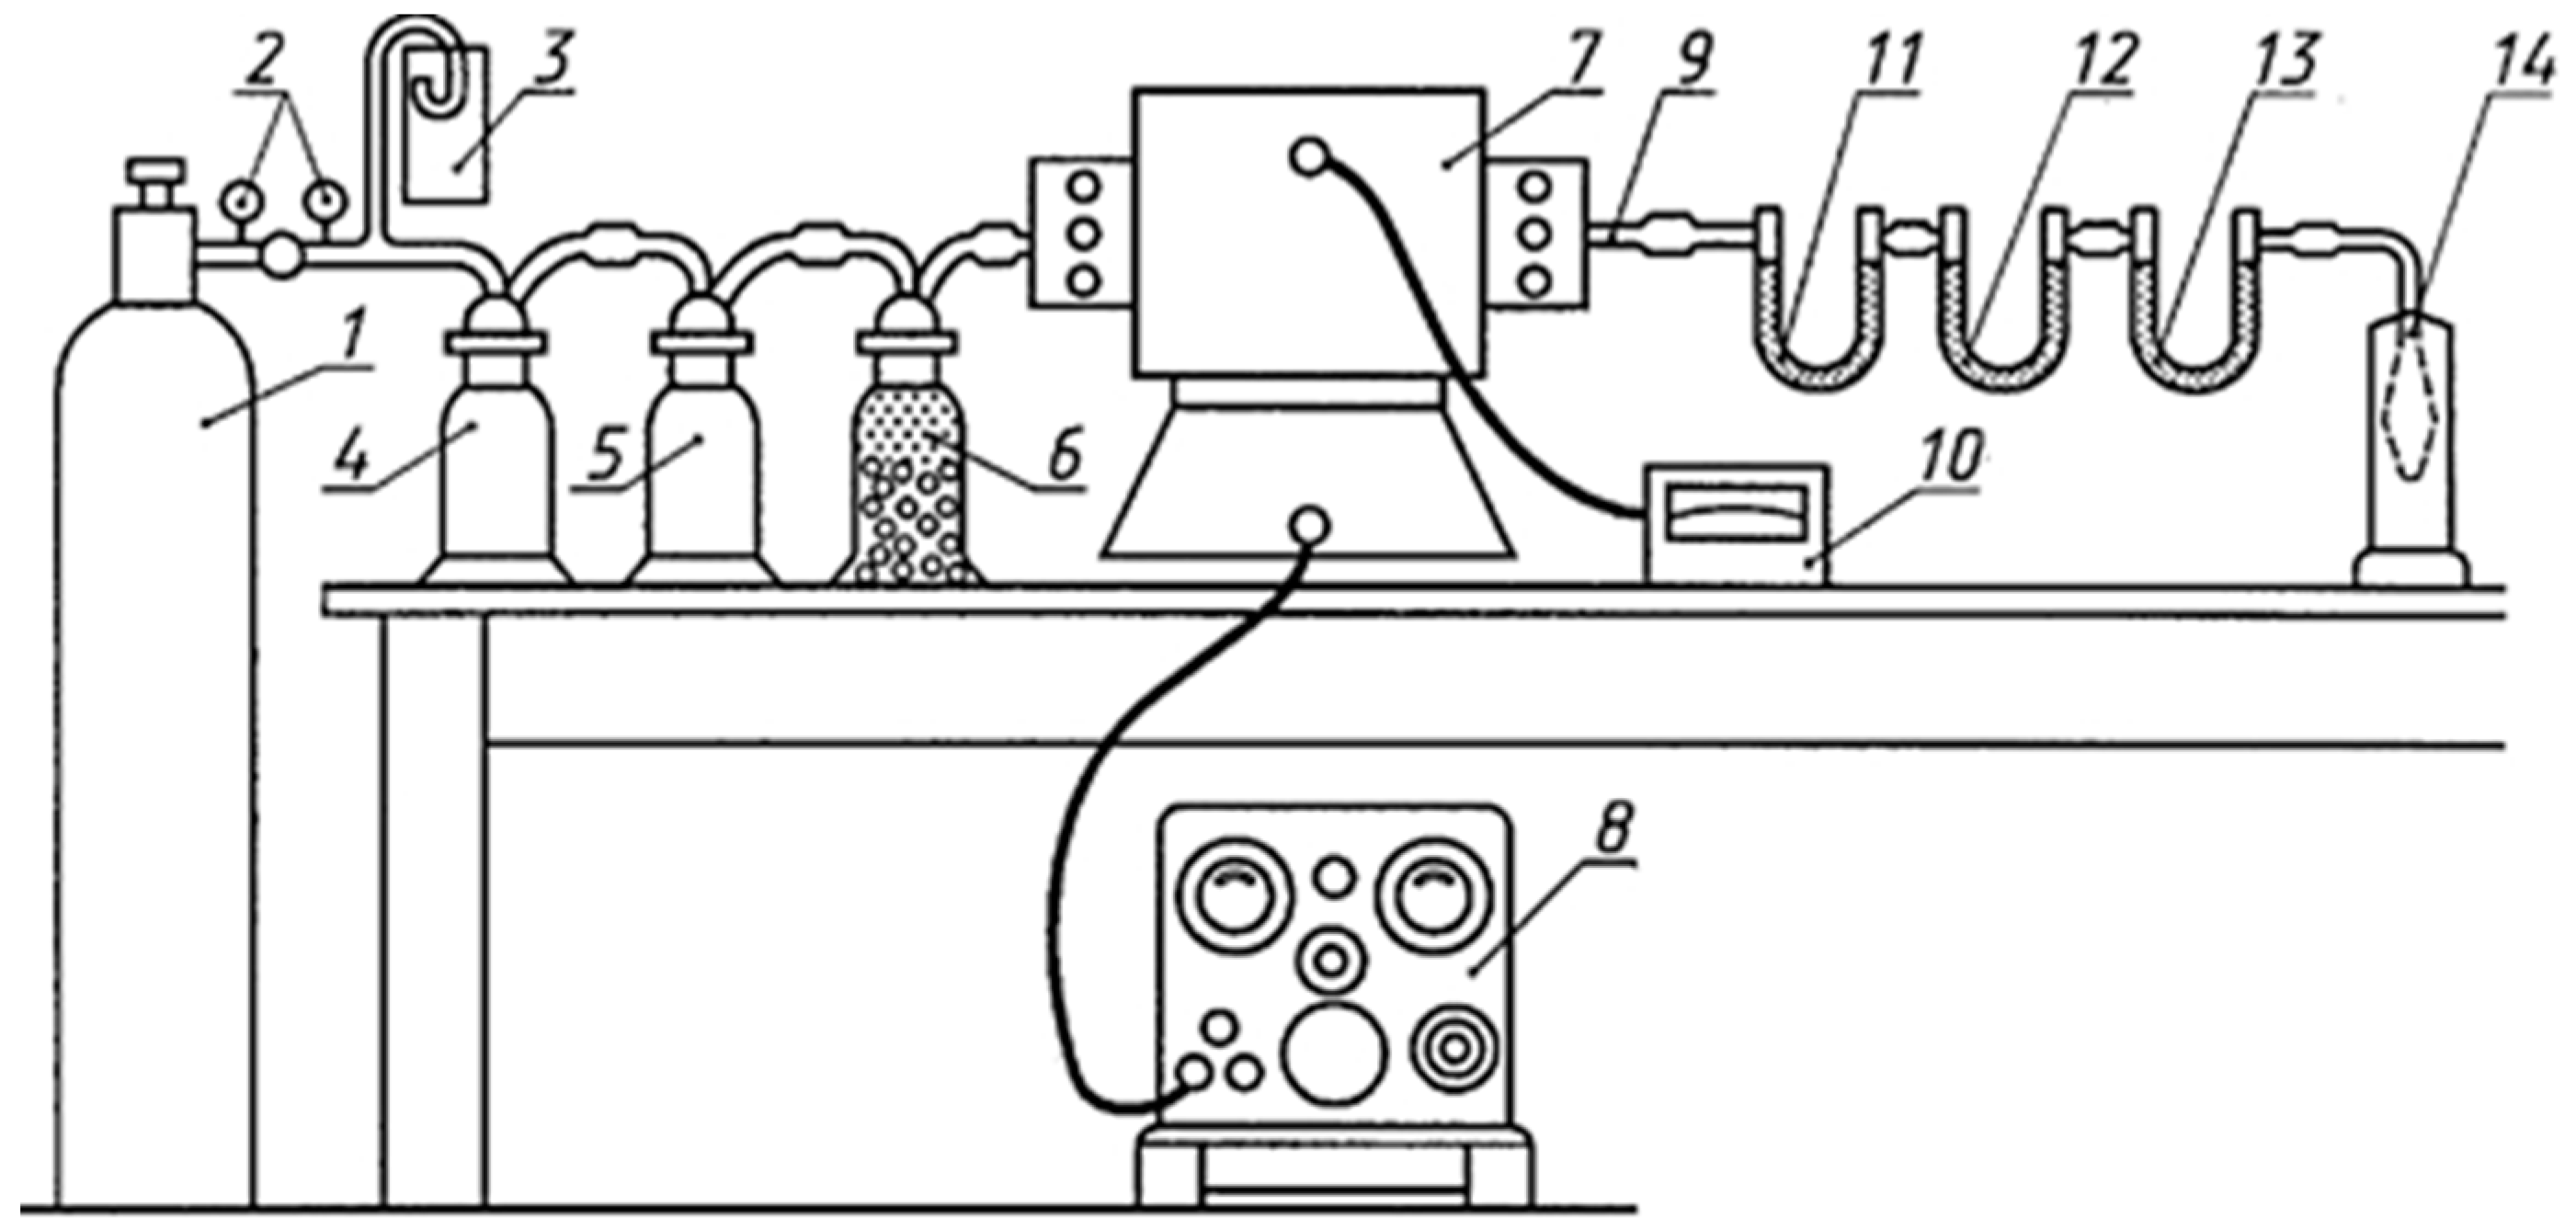
4.1. Gravimetric Method
4.2. Infrared Spectrometry Method
- Extraction of oil from the sample taken with an organic solvent;
- Purification of the extract from polar compounds using the column chromatography method;
- Registration of the intensity of the absorption spectrum of C-H bonds in the range of wave numbers 2700–3150 cm−1;
- Determination of the concentration level of oil and petroleum products by the area of the spectrum or optical density.
4.3. The Fluorescence Spectroscopy Method
4.4. Gas Chromatographic Method
4.5. Aircrafts
- Continuous monitoring of oil production systems in the “online” mode;
- Use of a thermal imaging system built into the aircraft to locate possible oil leaks;
- Development of a digital map of onshore oil production facilities;
- Obtaining and processing photographic plans of territories;
- Prompt detection of possible illegal pipeline tapping;
- Monitoring of bush sites [48].
- Affordable cost;
- High-quality terrain survey followed by the creation of a digital terrain map using modern software;
- Through aerial surveillance, loss and leakage of fossils can be quickly and effectively controlled, saving time and increasing the effectiveness of the monitoring itself ring itself;
- There is minimal damage to the environment due to low fuel consumption and the lack of an infrastructure;
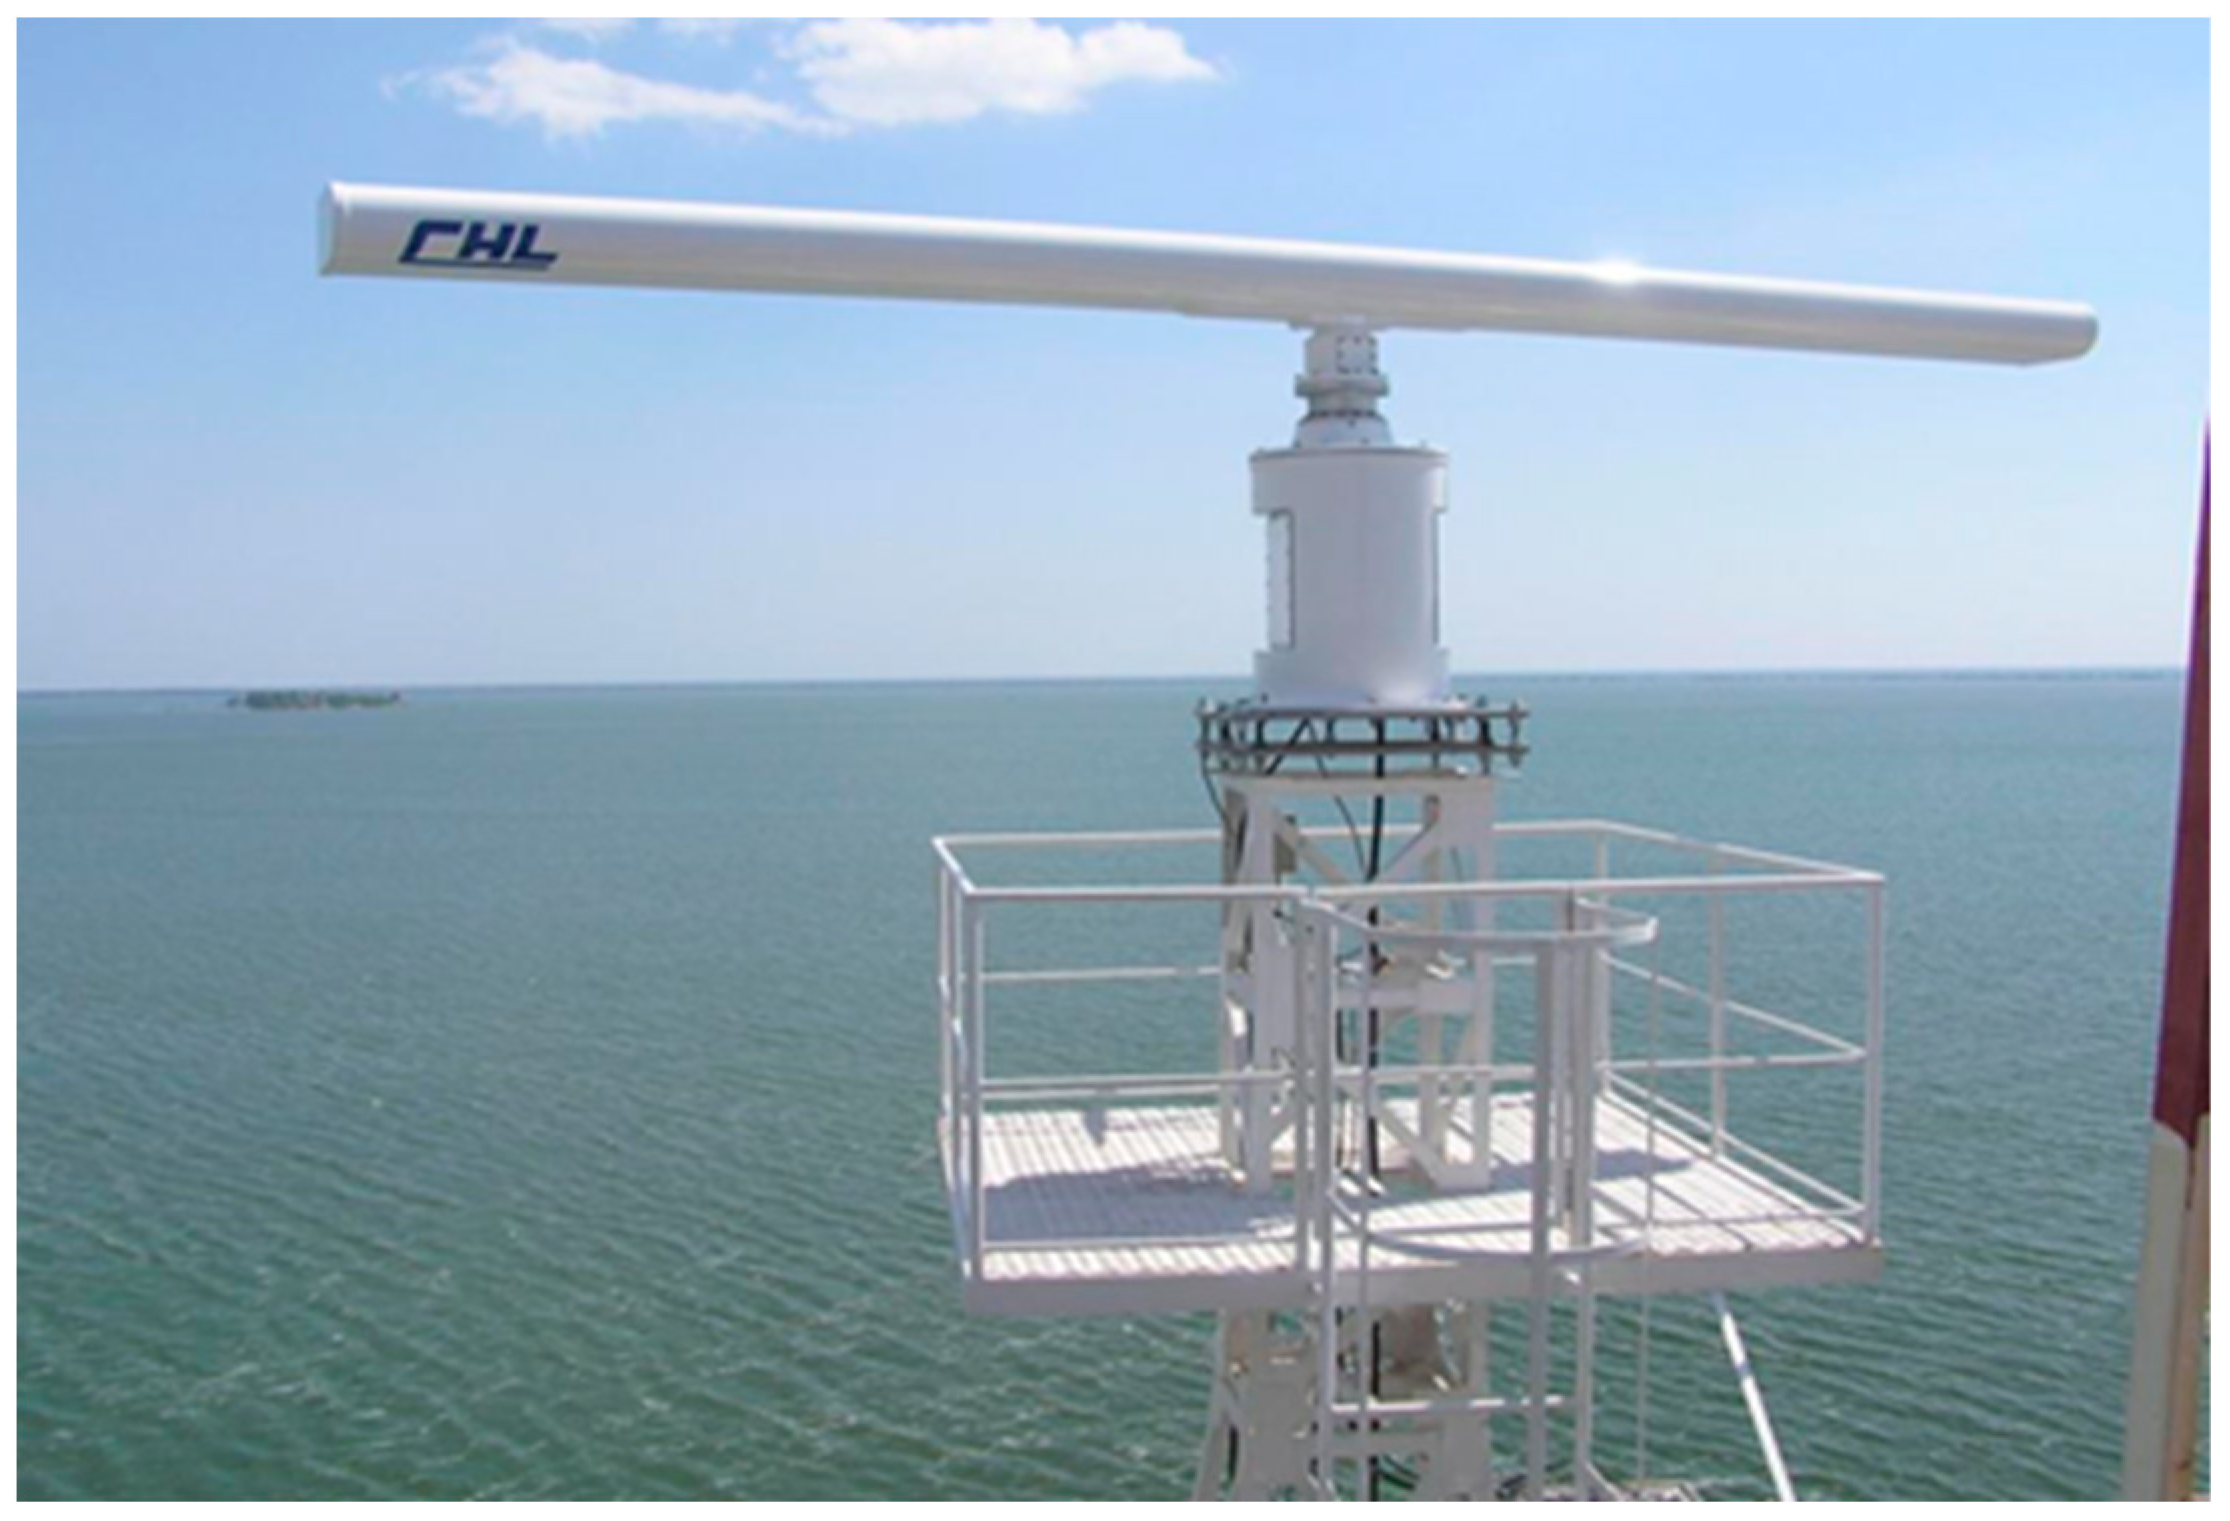
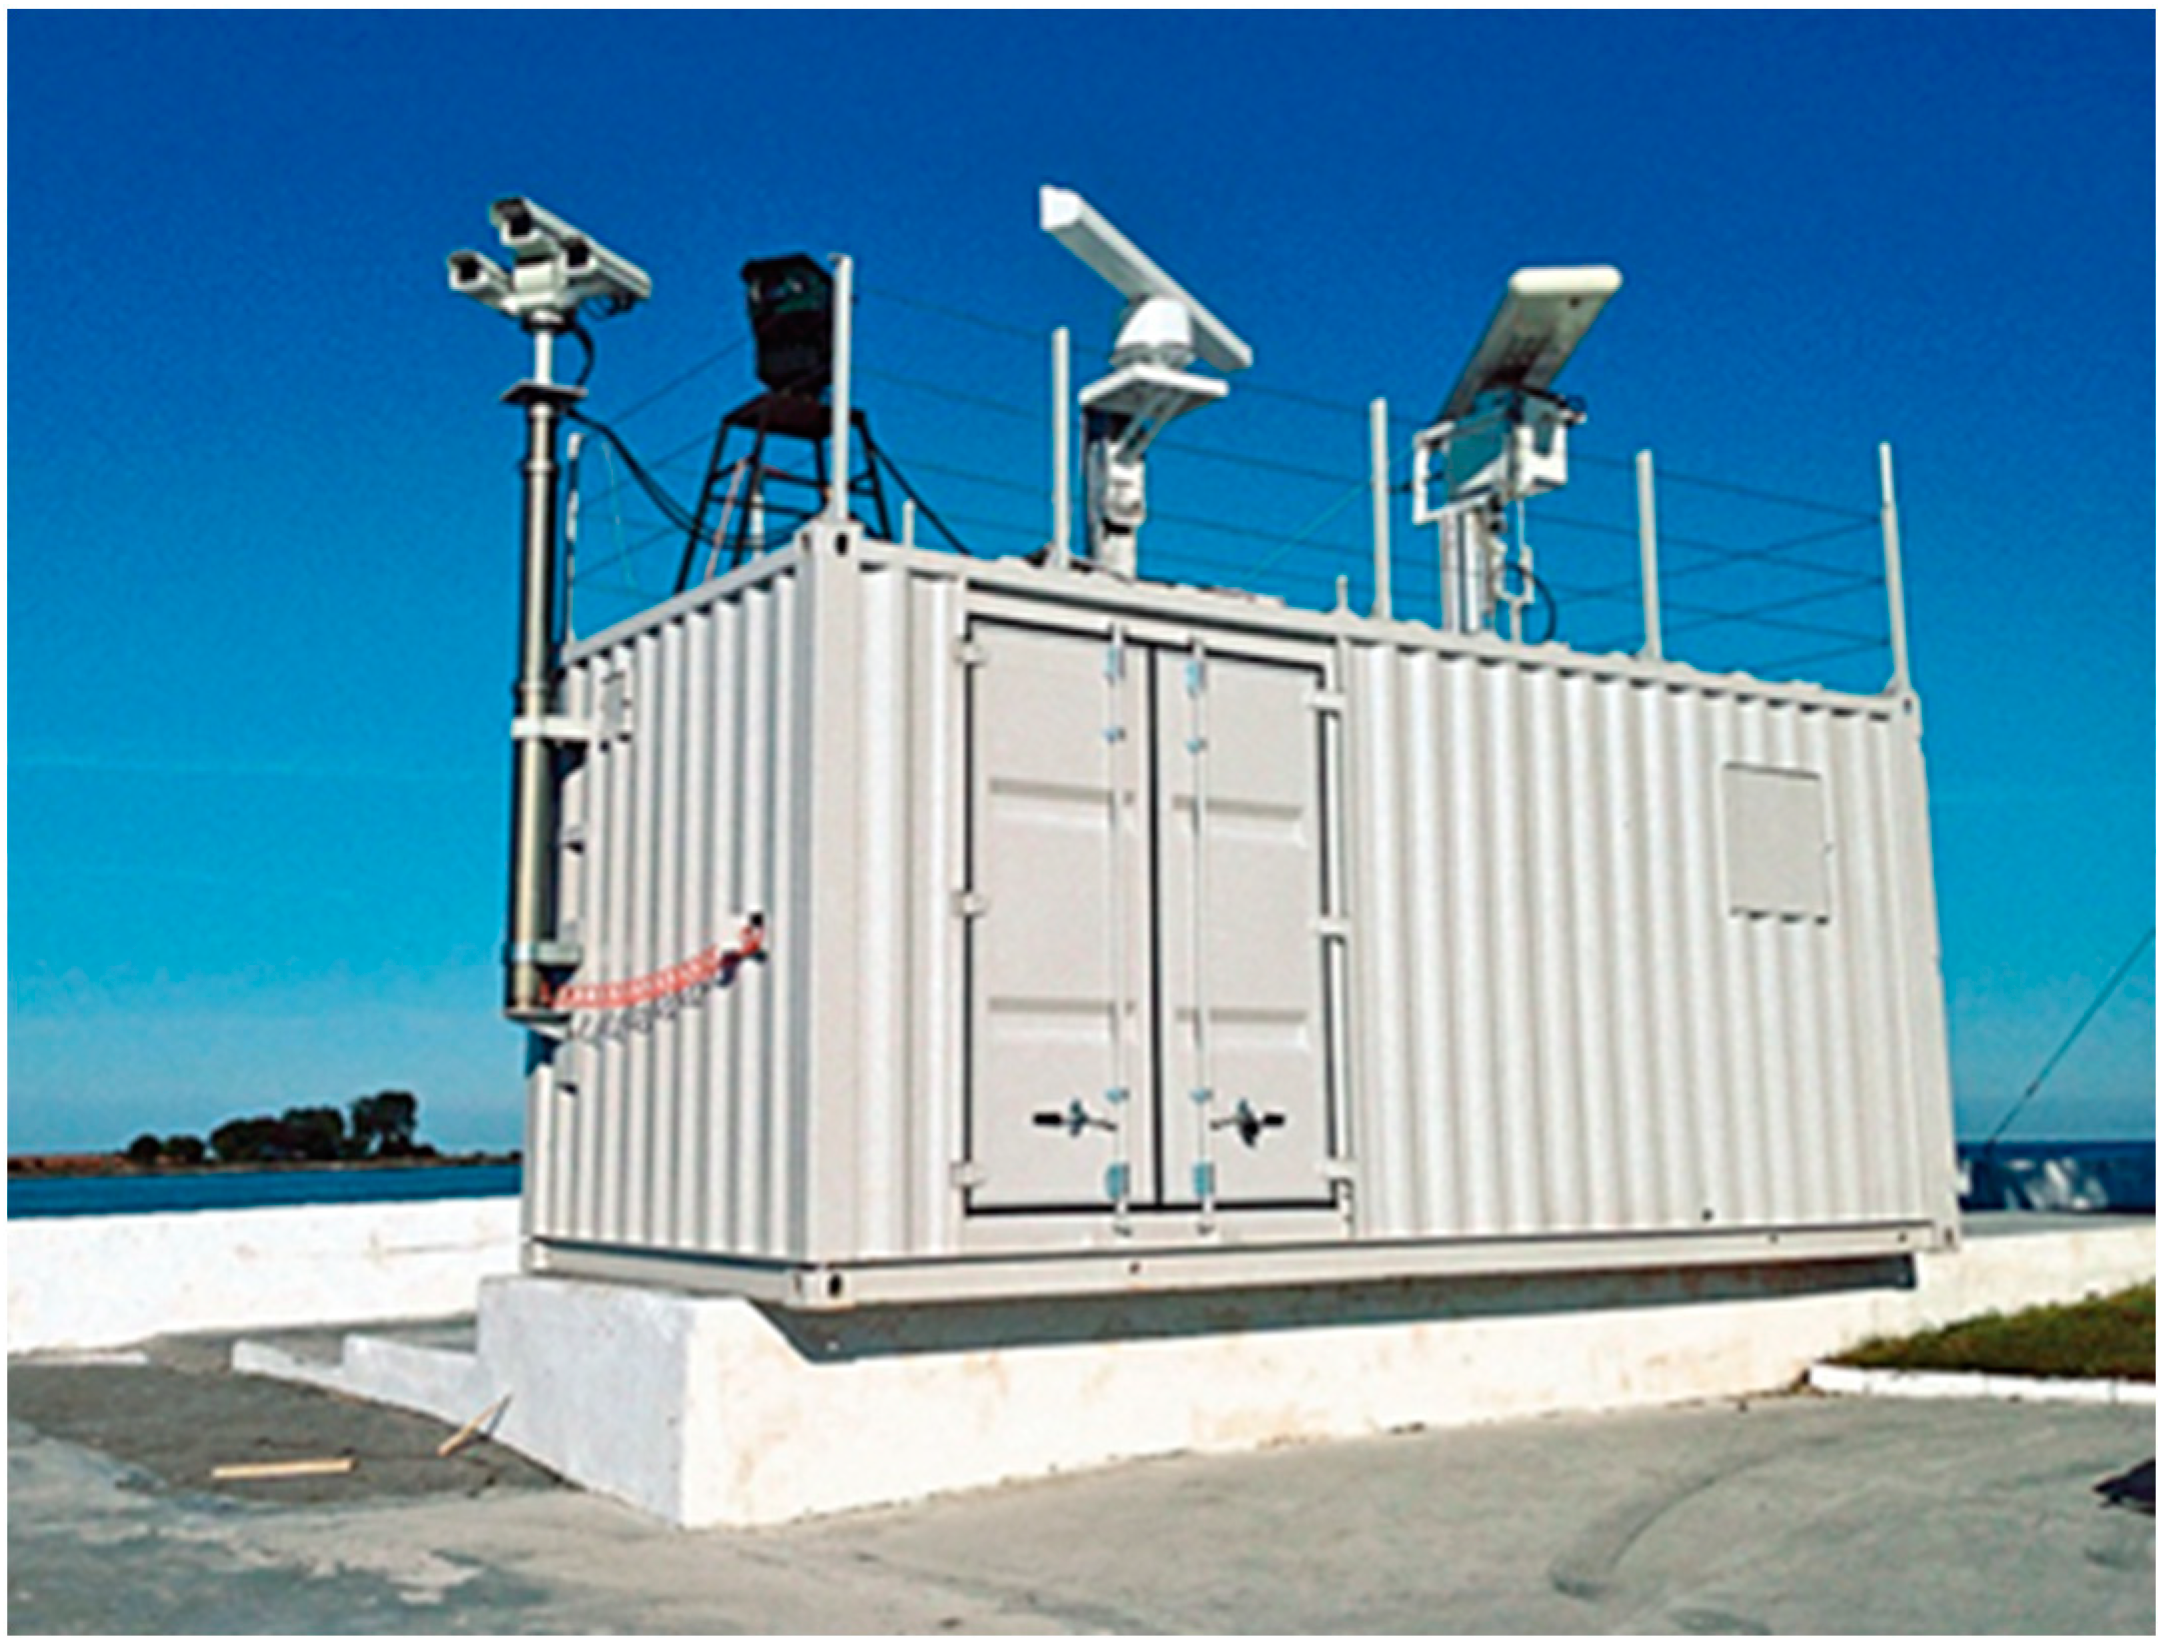
4.6. Radar Method
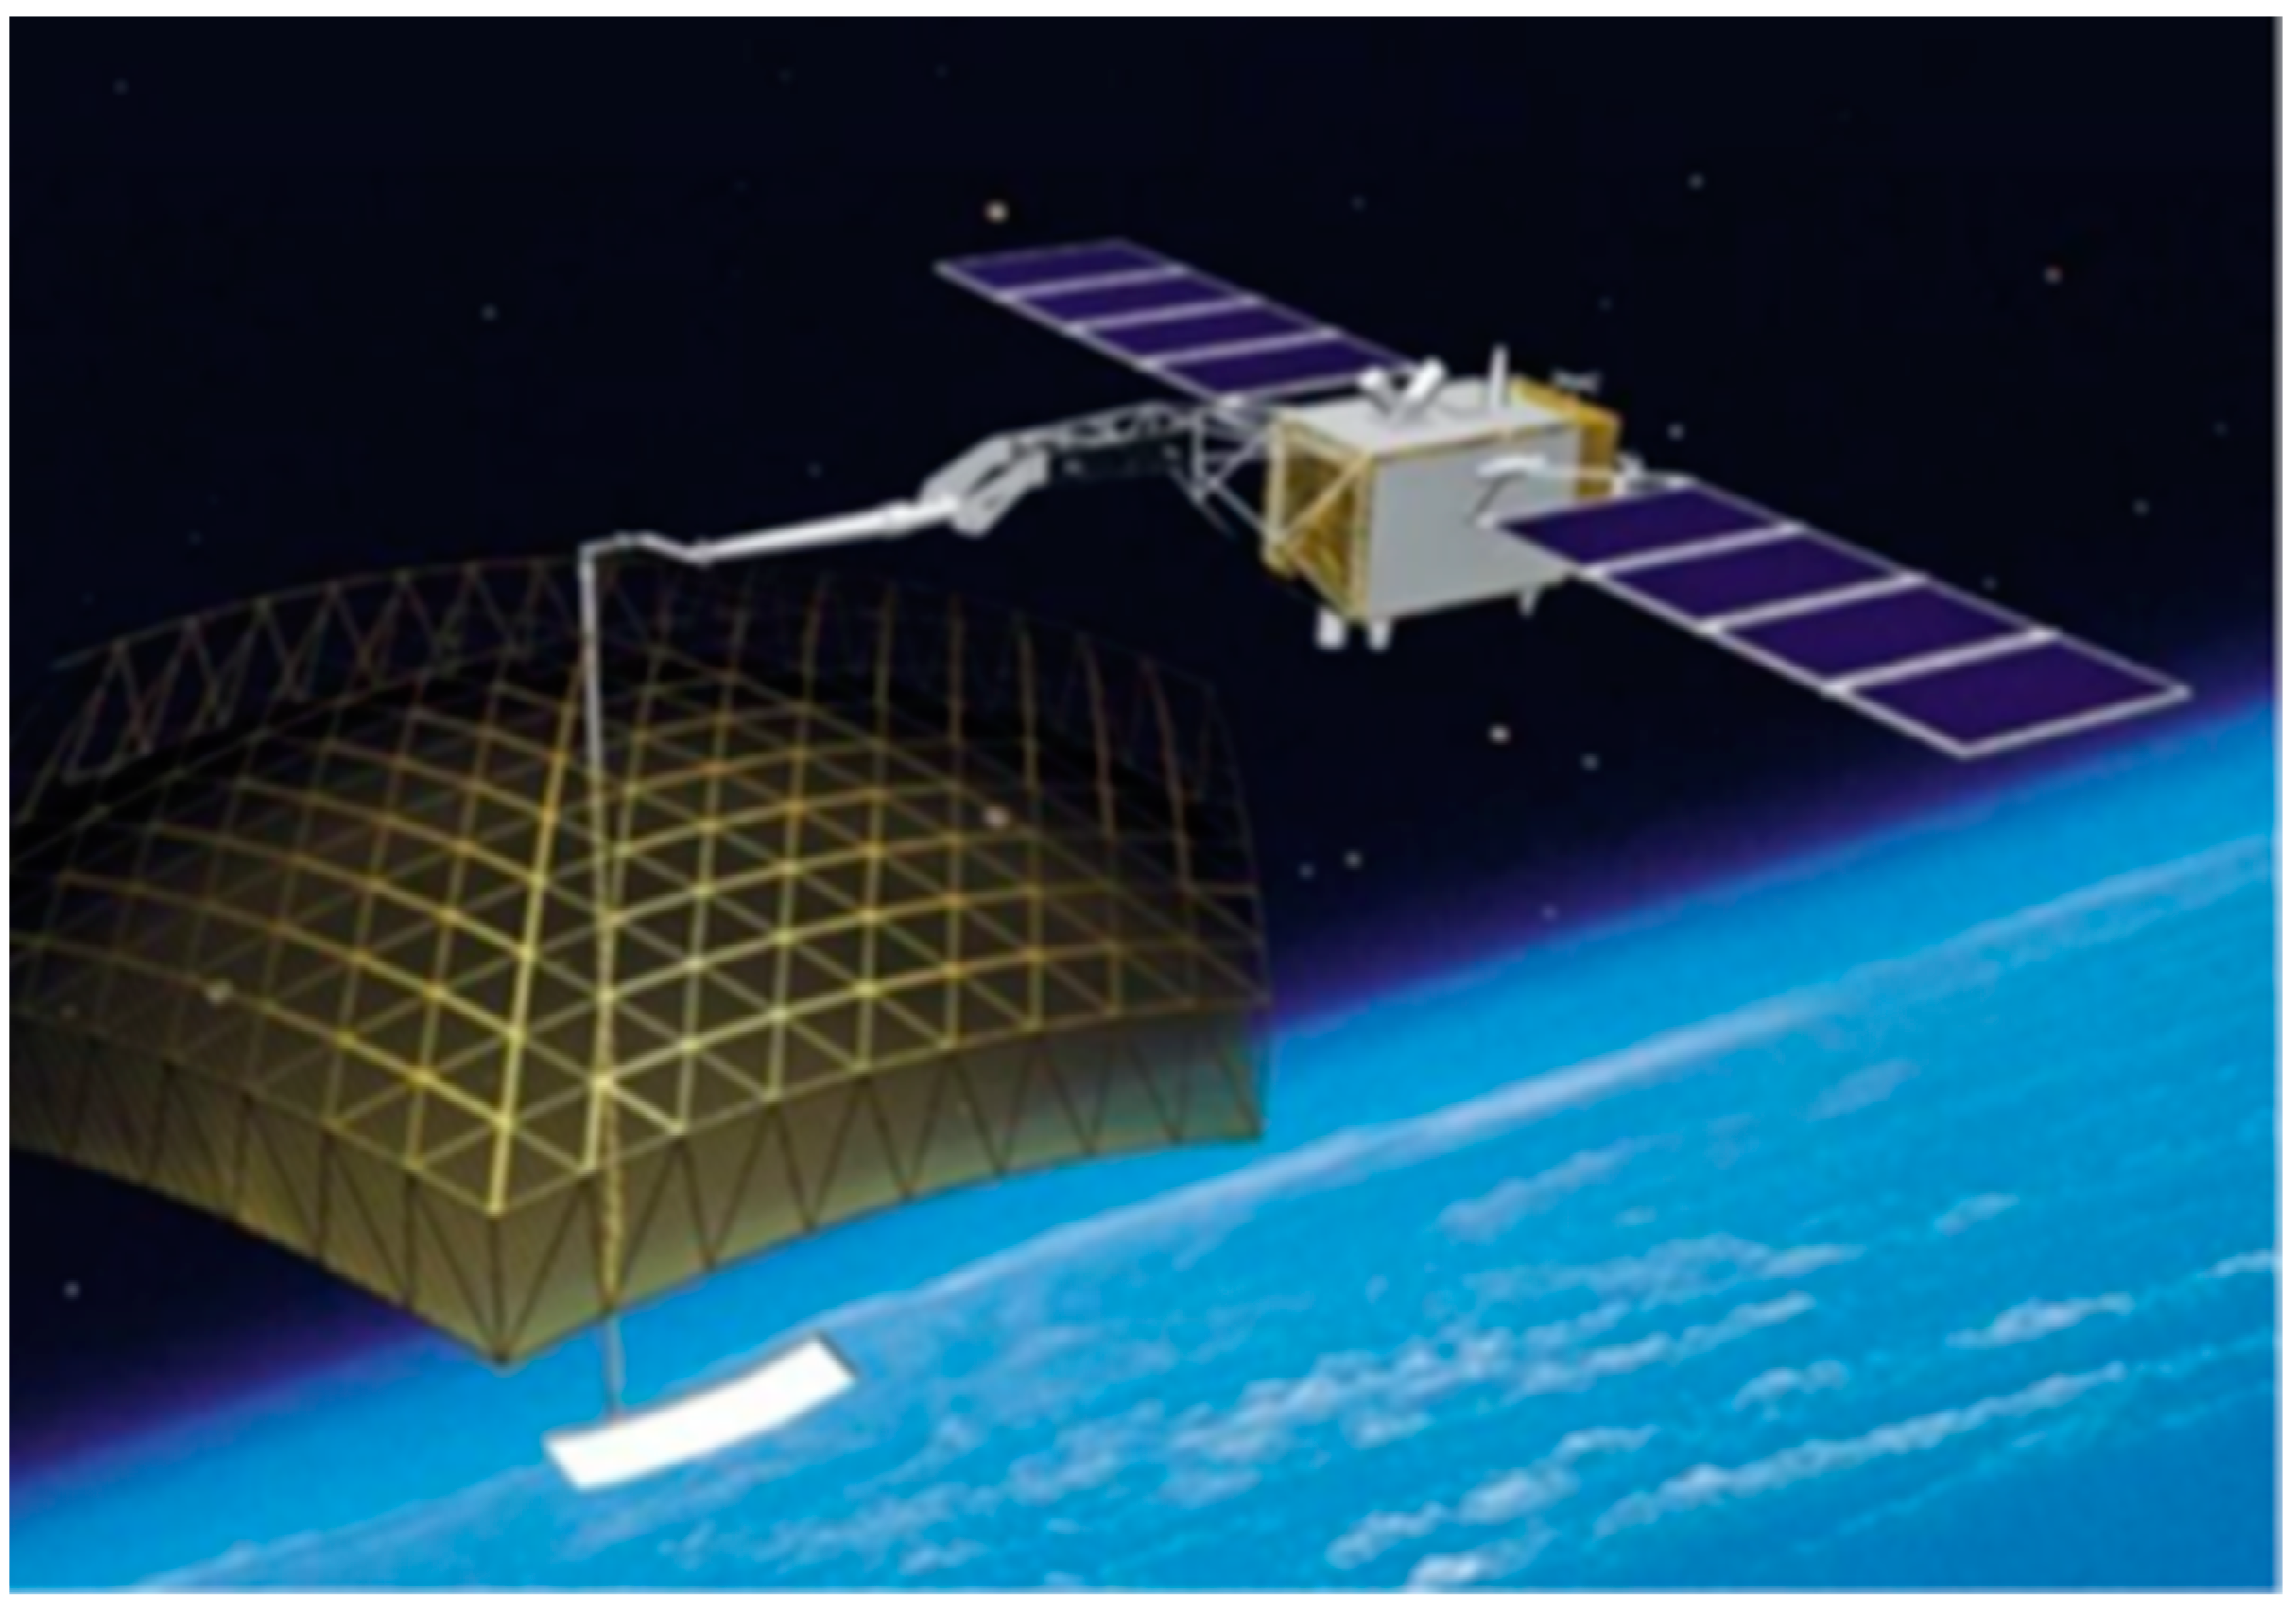
- A radar on an artificial Earth satellite.
- ▪
- The radar may be susceptible to weather conditions that could cause distortion of the received radar images of the surveyed area;
- ▪
- Since the satellite on which the radar is installed is in constant motion in orbit, the frequency of monitoring depends on how far the satellite is from the Earth. To achieve effective operational monitoring, it will be necessary to involve several satellites and coordinate their parallel work.
- Vessel radar.
- Coastal radar.
4.7. Conclusion on the Analysis of Oil Spill Monitoring Methods
- To monitor pipeline routes, video capture using a television camera is used. Operators can quickly monitor the current situation by watching video broadcasting in the “online” mode;
- Using a digital camera allows for photos of the highest resolution to be obtained, which can then be subjected to spectrometry processing to identify problem areas (e.g., corrosion, excessive heating, etc.);
- The location of an oil spill may be detected by filming in the IR spectrum, since the areas with a different shade in the frames will have more thermal radiation of oil.
5. The Effectiveness of Remote Monitoring Methods for the Arctic Region
6. Conclusions
Author Contributions
Funding
Institutional Review Board Statement
Informed Consent Statement
Data Availability Statement
Conflicts of Interest
References
- Gabdulkhakov, R.R.; Rudko, V.A.; Povarov, V.G.; Ugolkov, V.L.; Pyagay, I.N.; Smyshlyaeva, K.I. Technology of Petroleum Needle Coke Production in Processing of Decantoil with the Use of Polystyrene as a Polymeric Mesogen Additive. ACS Omega 2021, 6, 19995–20005. [Google Scholar] [CrossRef] [PubMed]
- Kopteva, A.V.; Ushkova, T.O. Development of Methods for Determining the Relative Weight of Physical Factors in Pipeline Paraffinization. E3S Web Conf. 2021, 266, 04008. [Google Scholar] [CrossRef]
- Riazi, M.R. Oil Spill Occurrence, Simulation, and Behavior; CRC Press: Boca Raton, FL, USA, 2021. [Google Scholar]
- Litvinenko, V.S.; Leitchenkov, G.L.; Vasiliev, N.I. Anticipated Sub-Bottom Geology of Lake Vostok and Technological Approaches Considered for Sampling. Geochemistry 2020, 80, 125556. [Google Scholar] [CrossRef]
- Polak, A.; Marshall, S.; Ren, J.; Hwang, B.; Hagan, B.; Stothard, D.J.M. Remote oil spill detection and monitoring beneath sea ice. In Proceedings of the Living Planet Symposium 2016, Prague, Czech Republic, 9–13 May 2016; European Space Agency: Prague, Czech Republic, 2016; Volume SP-740. Available online: https://pure.hud.ac.uk/en/publications/remote-oil-spill-detection-and-monitoring-beneath-sea-ice (accessed on 15 November 2022).
- Horn, S.A.; Neal, P. The Atlantic Empress Sinking—A Large Spill Without Environmental Disaster. Int. Oil Spill Conf. Proc. 1981, 1981, 429–435. [Google Scholar] [CrossRef]
- ITOPF. Oil Tanker Spill Statistics 2021; ITOPF Ltd.: London, UK, 2022; Available online: https://www.itopf.org/fileadmin/uploads/itopf/data/Documents/Company_Lit/Oil_Spill_Stats_2021.pdf (accessed on 15 November 2022).
- Statistics—ITOPF. Available online: https://www.itopf.org/knowledge-resources/data-statistics/statistics/ (accessed on 15 November 2022).
- Wright, S.K.; Allan, S.; Wilkin, S.M.; Ziccardi, M. Oil Spills in the Arctic. Arct. One Health 2022, 159–192. [Google Scholar] [CrossRef]
- Piatt, J.F.; Lensink, C.J.; Butler, W.; Kendziorek, M.; Nysewander, D.R. Immediate Impact of the “Exxon Valdez” Oil Spill on Marine Birds. Auk 1990, 107, 387–397. [Google Scholar] [CrossRef]
- Koch, D. DEC | Spill Prevention and Response SPAR Annual Report; Oil and Hazardous Substance Release Prevention & Response Fund Annual Report; Alaska Department of Environmental Conservation Division of Spill Prevention and Response: Juneau, AK, USA, 2019.
- Prince, R.C.; Owens, E.H.; Sergy, G.A. Weathering of an Arctic Oil Spill over 20 Years: The BIOS Experiment Revisited. Mar. Pollut. Bull. 2002, 44, 1236–1242. [Google Scholar] [CrossRef]
- Samsonova, I.V.; Potravny, I.M.; Pavlova, M.B.; Semyonova, L.A. Assessment of Losses Caused to the Indigenous Peoples of the North in the Taimyr Dolgano-Nenets District of the Krasnoyarsk Territory Due to the Diesel Spill at TPP-3 in Norilsk. Arkt. Ekol. Ekon. 2021, 11, 254–265. [Google Scholar] [CrossRef]
- Ekofisk Bravo Oil Field; Norway, North Sea | IncidentNews | NOAA. Available online: https://incidentnews.noaa.gov/incident/6237 (accessed on 16 December 2022).
- Law, R.J.; Moffat, C.F. Chapter 36. The Braer Oil Spill, 1993. Oil Spill Sci. Technol. 2011, 1119–1126. [Google Scholar] [CrossRef]
- Walgate, R. Soviet Science: Relations Forsworn. Nature 1980, 287, 672–673. [Google Scholar] [CrossRef]
- Bonsdorff, E. The Antonio Gramsci Oil Spill Impact on the Littoral and Benthic Ecosystems. Mar. Pollut. Bull. 1981, 12, 301–305. [Google Scholar] [CrossRef]
- Thomas, C.; Fagoe, E. Coast Guard Response to the Volgoneft 263 Oil Spill. Int. Oil Spill Conf. Proc. 1991, 1991, 279–283. [Google Scholar] [CrossRef]
- Oil Spills Occur Annually in Komi. Available online: https://takiedela.ru/news/2021/05/27/komineft/ (accessed on 15 November 2022).
- Deepwater Horizon—BP Gulf of Mexico Oil Spill | US EPA. Available online: https://www.epa.gov/enforcement/deepwater-horizon-bp-gulf-mexico-oil-spill (accessed on 15 November 2022).
- Harsh Weather Hinders Clean-Up of North Sea Oil Spill. Available online: https://www.cnbc.com/amp/2007/12/12/harsh-weather-hinders-cleanup-of-north-sea-oil-spill.html (accessed on 15 November 2022).
- Ushakov, I.E. Detection of floods of oil products in the sea radar-tracking means. J. Min. Inst. 2016, 219, 421. [Google Scholar] [CrossRef]
- Marin, E.A.; Ponomarenko, T.V.; Vasilenko, N.V.; Galevskiy, S.G. Economic evaluation of projects for development of raw hydrocarbons fields in the conditions of the northern production areas using binary and reverting discounting. Sever i rynok: Formirovanie ekonomicheskogo poryadka. North Mark. Form. Econ. Order 2022, 3, 144–157. [Google Scholar] [CrossRef]
- Ponomarenko, T.; Marin, E.; Galevskiy, S. Economic Evaluation of Oil and Gas Projects: Justification of Engineering Solutions in the Implementation of Field Development Projects. Energies 2022, 15, 3103. [Google Scholar] [CrossRef]
- Berezikov, S.A. Structural Changes and Innovation Economic Development of the Arctic Regions of Russia. J. Min. Inst. 2019, 240, 716. [Google Scholar] [CrossRef] [Green Version]
- Grigorev, G.S.; Salishchev, M.V.; Senchina, N. On the Applicability of Electromagnetic Monitoring of Hydraulic Fracturing. J. Min. Inst. 2021, 250, 492–500. [Google Scholar] [CrossRef]
- Romasheva, N.V.; Babenko, M.A.; Nikolaichuk, L.A. Sustainable Development of the Russian Arctic Region: Environmental Problems and Ways to Solve Them. Min. Inf. Anal. Bull. 2022, 78–87. [Google Scholar] [CrossRef]
- “Energy of the Arctic” Research Series. Available online: https://www.skolkovo.ru/centres/senec/senec-research-arctic/ (accessed on 15 November 2022).
- Tysiachniouk, M.S. Disentangling Benefit-Sharing Complexities of Oil Extraction on the North Slope of Alaska. Sustainability 2020, 12, 5432. [Google Scholar] [CrossRef]
- Falmagne, V.; St-Onge, N. Ground Support Challenges in Arctic Mining Conditions. In Proceedings of the Ground Support 2019: Ninth International Symposium on Ground Support in Mining and Underground Construction, Sudbury, ON, Canada, 23–25 October 2019; pp. 139–154. [Google Scholar] [CrossRef]
- Dittmers, K.H.; Davies, R.; Mackie, S.; Petersen, J.; Germany, D.E.A.; Buenz, S. How Low Can You Go?—Exploring for Shallow Oil in the Barents Sea. In Proceedings of the 80th EAGE Conference and Exhibition 2018: Opportunities Presented by the Energy Transition, Copenhagen, Denmark, 11–14 June 2018; pp. 1–5. [Google Scholar] [CrossRef]
- Brodt, L.E. Best Practices of Oil and Gas Companies to Develop Gas Fields on the Arctic Shelf. Arct. North 2021, 44, 30–44. [Google Scholar] [CrossRef]
- Seliverstov, S.; Lukomskaya, O.; Titov, V.; Vashchuk, A.; Khalturin, A. On Building the Architecture of the Intelligent Transportation System in the Arctic Region. Transp. Res. Procedia 2021, 57, 603–610. [Google Scholar] [CrossRef]
- Zhukovskiy, Y.L.; Lavrik, A.Y.; Buldysko, A.D. Energy Demand Side Management in Stand-Alone Power Supply System with Renewable Energy Sources. J. Phys. Conf. Ser. 2021, 1753, 012059. [Google Scholar] [CrossRef]
- Lavrik, A.; Zhukovskiy, Y.; Buldysko, A. Features of the Optimal Composition Determination of Energy Sources During Multi-Criterial Search in the Russian Arctic Conditions. In Proceedings of the 2nd 2020 International Youth Conference on Radio Electronics, Electrical and Power Engineering, REEPE 2020, Moscow, Russia, 12–14 March 2020. [Google Scholar] [CrossRef]
- Litvinenko, V.S.; Dvoynikov, M.V.; Trushko, V.L. Elaboration of a Conceptual Solution for the Development of the Arctic Shelf from Seasonally Flooded Coastal Areas. Int. J. Min. Sci. Technol. 2022, 32, 113–119. [Google Scholar] [CrossRef]
- Govindarajan, S.K.; Mishra, A.; Kumar, A. Oil Spill in a Marine Environment: Requirements Following an Offshore Oil Spill. Rud.-Geološko-Naft. Zb. 2021, 36, 1–9. [Google Scholar] [CrossRef]
- Dmitrieva, A.S.; Lyagova Schipachev, A.M. Numerical Analysis of Stress-Strain State of Vertical Steel Tanks with Defects. In Topical Issues of Rational Use of Natural Resources; CRC Press: London, UK, 2019; Volume 2, pp. 796–803. [Google Scholar] [CrossRef]
- Shvets, N.N.; Beresneva, P.V. Oil and Gas in the Arctic: Legal Status and Reserves. MGIMO Rev. Int. Relat. 2014, 4, 60–67. [Google Scholar] [CrossRef]
- Gautier, D.L.; Bird, K.; Charpentier, R.R.; Grantz, A. Assessment of Undiscovered Oil and Gas in the Arctic. Science 2009, 324, 1175–1179. [Google Scholar] [CrossRef]
- Ustinov, D.A.; Shafhatov, E.R. Assessment of Reliability Indicators of Combined Systems of Offshore Wind Turbines and Wave Energy Converters. Energies 2022, 15, 9630. [Google Scholar] [CrossRef]
- Goodman, R. Oil Under Ice Detection: What Is the State-of-the-Art? In Oil Spill Response: A Global Perspective; Springer: Berlin/Heidelberg, Germany, 2008; pp. 7–19. [Google Scholar] [CrossRef]
- Petrich, C.; Karlsson, J.; Eicken, H. Porosity of Growing Sea Ice and Potential for Oil Entrainment. Cold Reg. Sci. Technol. 2013, 87, 27–32. [Google Scholar] [CrossRef] [Green Version]
- Xie, H.; Yapa, P.D.; Nakata, K. Modeling Emulsification after an Oil Spill in the Sea. J. Mar. Syst. 2007, 68, 489–506. [Google Scholar] [CrossRef]
- GOST 26564.2-85 Refractory Silicon Carbide Materials and Products. Methods For Determining Free Carbon. Available online: https://znaytovar.ru/gost/2/GOST_26564285_Materialy_i_izde.html (accessed on 15 November 2022).
- Zanella, D.; Focant, J.; Franchina, F.A. 30 Th Anniversary of Comprehensive Two-dimensional Gas Chromatography: Latest Advances. Anal. Sci. Adv. 2021, 2, 213–224. [Google Scholar] [CrossRef]
- GOST R 51797-2001 Drinking Water. Method For Determining The Content Of Petroleum Products—Docs.Cntd.Ru. Available online: https://docs.cntd.ru/document/1200025941 (accessed on 15 November 2022).
- Sidorenko, V.M.; Magomedov, M.D.; Ogneva, P.G. Remote fluorimetric monitoring of oil pollution on the water surface. J. Min. Inst. 2001, 149, 117. Available online: https://pmi.spmi.ru/index.php/pmi/article/view/9597 (accessed on 10 November 2022).
- Oil Producers Are Invited to Use Drones to Monitor Territories. Available online: https://ugra-tv.ru/news/society/mne_sverkhu_vidno_vsye_neftyanikam_kogalyma_predlagayut_ispolzovat_dlya_monitoringa_territoriy_bespi/ (accessed on 15 November 2022).
- Oil Pollution in the World’s Oceans. Океана. Available online: https://priroda.club/morja-i-okeany/6056-neftjanoe-zagrjaznenie-mirovogo-okeana-53-foto.html (accessed on 15 November 2022).
- Trump’s Nominee for Top Environmental Post at DOJ Gets Senate Panel Approval—ThinkProgress. Available online: https://thinkprogress.org/senate-panel-approves-bp-defense-attorney-for-dojs-top-environmental-position-1d55707c4167/ (accessed on 15 November 2022).
- Environmental Monitoring of Oil and Petroleum Products Spills Using Aircraft. Available online: https://russiandrone.ru/publications/ekologicheskiy-monitoring-razlivov-nefti-i-nefteproduktov-s-ispolzovaniem-letatelnykh-apparatov/ (accessed on 8 December 2022).
- Ushakov, I.E.; Shishkin, I.F. Radar sounding of the sea surface. Tech. Phys. Lett. 1997, 25, 745–748. [Google Scholar] [CrossRef]
- Nilov, M.A.; Beskid, P.P.; Chernetsova, E.A.; Nichiporenko, N.T.; Petrov, A.V.; Petrakov, A.V.; Timofeev, V.P. Environmental monitoring of St Petersburg harbour area by coastal millimetre wave radar. J. Min. Inst. 2001, 149, 101. Available online: https://pmi.spmi.ru/index.php/pmi/article/view/9591 (accessed on 1 November 2022).
- Russia to Upgrade Kondor-FKA Satellite. Available online: https://airrecognition.com/index.php/news/defense-aviation-news/2019-news/june/5192-russia-to-upgrade-kondor-fka-satellite.html (accessed on 19 December 2022).
- Method for Detecting Oil Films on the Surface. Available online: https://www.elibrary.ru/item.asp?id=37453670 (accessed on 15 November 2022).
- News Gallery|Www.Korabli.Eu. Available online: https://www.korabli.eu/galleries/novosti/morskie-novosti/novostnaya-galereya?page=0%2C70&133=&2=&236=&4=&5= (accessed on 19 December 2022).
- Babyr, K.V.; Ustinov, D.A.; Pletnev, D.N. Improving Electrical Safety of the Maintenance Personnel in the Conditions of Incomplete Single-Phase Ground Faults. Occup. Saf. Ind. 2022, 8, 55–61. [Google Scholar] [CrossRef]
- Military-Industrial Complex News, History of Weapons, Military Equipment. Available online: https://bastion-karpenko.ru/2013/10/18/%D0%B2%D0%B1%D0%B0%D0%BB%D1%82%D0%B8%D0%B9%D1%81%D0%BA%D0%B5%D1%83%D1%81%D0%BF%D0%B5%D1%88%D0%BD%D0%BE%D0%BF%D1%80%D0%BE%D0%B2%D0%B5%D0%B4%D0%B5%D0%BD%D1%8B-%D0%B8%D1%81%D0%BF%D1%8B%D1%82%D0%B0/ (accessed on 19 December 2022).
- Serda, M.; Becker, F.G.; Cleary, M.; Team, R.M.; Holtermann, H.; The, D.; Agenda, N.; Science, P.; Sk, S.K.; Hinnebusch, R.; et al. Use of Coastal Radars for Environmental Control of the Sea Surface. J. Min. Inst. 2004, 158, 99. [Google Scholar] [CrossRef]
- Vogt, P.; Tarchi, D. Monitoring of Marine Oil Spills from SAR Satellite Data. Proc. SPIE -Int. Soc. Opt. Eng. 2004, 5569, 209–219. [Google Scholar] [CrossRef]
- Gusev, E.A. Results and Prospects of Geological Mapping of the Arctic Shelf of Russia. J. Min. Inst. 2022, 255, 290–298. [Google Scholar] [CrossRef]
- Schistad Solberg, A.H.; Storvik, G.; Solberg, R.; Volden, E. Automatic Detection of Oil Spills in ERS SAR Images. IEEE Trans. Geosci. Remote Sens. 1999, 37, 1916–1924. [Google Scholar] [CrossRef] [Green Version]
- Carracedo, P.; Torres-López, S.; Barreiro, M.; Montero, P.; Balseiro, C.F.; Penabad, E.; Leitao, P.C.; Pérez-Muñuzuri, V. Improvement of Pollutant Drift Forecast System Applied to the Prestige Oil Spills in Galicia Coast (NW of Spain): Development of an Operational System. Mar. Pollut. Bull. 2006, 53, 350–360. [Google Scholar] [CrossRef]
- Dala, A.; Arslan, T. In Situ Microwave Sensors and Switching Circuit for Oil Slick Thickness Measurement. IEEE Sens. J. 2022, 22, 9027–9034. [Google Scholar] [CrossRef]
- Pegau, W.S.; Garron, J.; Zabilansky, L.; Bassett, C.; Bello, J.; Bradford, J.; Carns, R.; Courville, Z.; Eicken, H.; Elder, B.; et al. Detection of Oil in and under Ice. Int. Oil Spill Conf. Proc. 2017, 2017, 1857–1876. [Google Scholar] [CrossRef]
- Transportation Research Board and National Research Council. Responding to Oil Spills in the U.S. Arctic Marine Environment; The National Academies Press: Washington, DC, USA, 2014. [Google Scholar] [CrossRef]
- Kechut, N.I.; Riazi, M.; Sohrabi, M.; Jamiolahmady, M. Tertiary Oil Recovery and CO2 Sequestration by Carbonated Water Injection (CWI). In Proceedings of the Society of Petroleum Engineers—SPE International Conference on CO2 Capture, Storage, and Utilization 2010, New Orleans, LA, USA, 10–12 November 2010; pp. 430–441. [Google Scholar] [CrossRef]
- Hansen, R.S. Phased Antenna Arrays; Tekhnosfera: Moscow, Russia, 2012; 558p. [Google Scholar]
- Scattone, F.; Ettorre, M.; Eddo, B.; Sauleau, R.; Fonseca, N.J.G. Truncated Leaky-Wave Antenna with Cosecant-Squared Radiation Pattern. IEEE Antennas Wirel. Propag. Lett. 2018, 17, 841–844. [Google Scholar] [CrossRef]
- Shirokov, I.B. Active small element antenna array for local navigation system. Microw. Telecommun. Technol. 2020, 1-1, 233–234. [Google Scholar]


| № | Shipname | Date | Location | Spill Size (Million Barrels) |
|---|---|---|---|---|
| 1 | Atlantic Empress | 1979 | Off Tobago, West Indies | 2.1 |
| 2 | ABT Summer | 1991 | 700 nautical miles off Angola | 1.9 |
| 3 | Castillo de Bellver | 1983 | Off Saldanha Bay, South Africa | 1.8 |
| 4 | Amoco Cadiz | 1978 | Off Brittany, France | 1.6 |
| 5 | Haven | 1991 | Genoa, Italy | 1 |
| 6 | Odyssey | 1988 | 700 nautical miles off Nova Scotia, Canada | 1 |
| 7 | Torrey Canyon | 1967 | Scilly Isles, UK | 0.9 |
| 8 | Sea Star | 1972 | Gulf of Oman | 0.8 |
| 9 | Sanchi | 2018 | Off Shanghai, China | 0.8 |
| 10 | Irenes Serenade | 1980 | Navarino Bay, Greece | 0.7 |
| 11 | Urquiola | 1976 | La Coruna, Spain | 0.7 |
| 12 | Hawaiian Patriot | 1977 | 300 nautical miles off Honolulu | 0.7 |
| 13 | Independenta | 1979 | Bosphorus, Turkey | 0.7 |
| № | Name | Date | Location | Cause | Spill Size (Million Barrels) |
|---|---|---|---|---|---|
| 1 | Gulf War | January 1991 | Persian Gulf, Middle East | Iraq–Kuwait War | 5–8 |
| 2 | Deepwater Horizon | April–July 2010 | Gulf of Mexico, US | Wellhead blowout | 4–5 |
| 3 | Ixtoc I | June 1979–March 1980 | Bay of Campeche, Gulf of Mexico | Exploratory well blowout | 3.3–3.5 |
| 4 | Fergana Valley | March 1992 | Uzbekistan | Oil well blowout | >2 |
| 5 | Nowruz oil field | February–September 1983 | Persian Gulf/Iran | Iraq–Iran war | >1.9 |
| 6 | Production Well, D-103 | August 1980 | Tripoli, Libya | Well blowout | ~1 |
| Type of UAV | UAV Weight, kg | Radius of the Action Zone, km |
|---|---|---|
| Micro and mini short range | To 7 | From 25 to 40 |
| Small radius, light | From 7 to 50 | From 15 to 115 |
| Medium radius, light | From 50 to 100 | From 110 to 300 |
| Medium | From 100 to 300 | From 170 to 1000 |
| Medium—heavy | From 300 to 500 | From 150 to 1000 |
| Medium radius, heavy | From 500 to 1000 | From 75 to 300 |
| Large radius, heavy | Above 1000 | Above 300 |
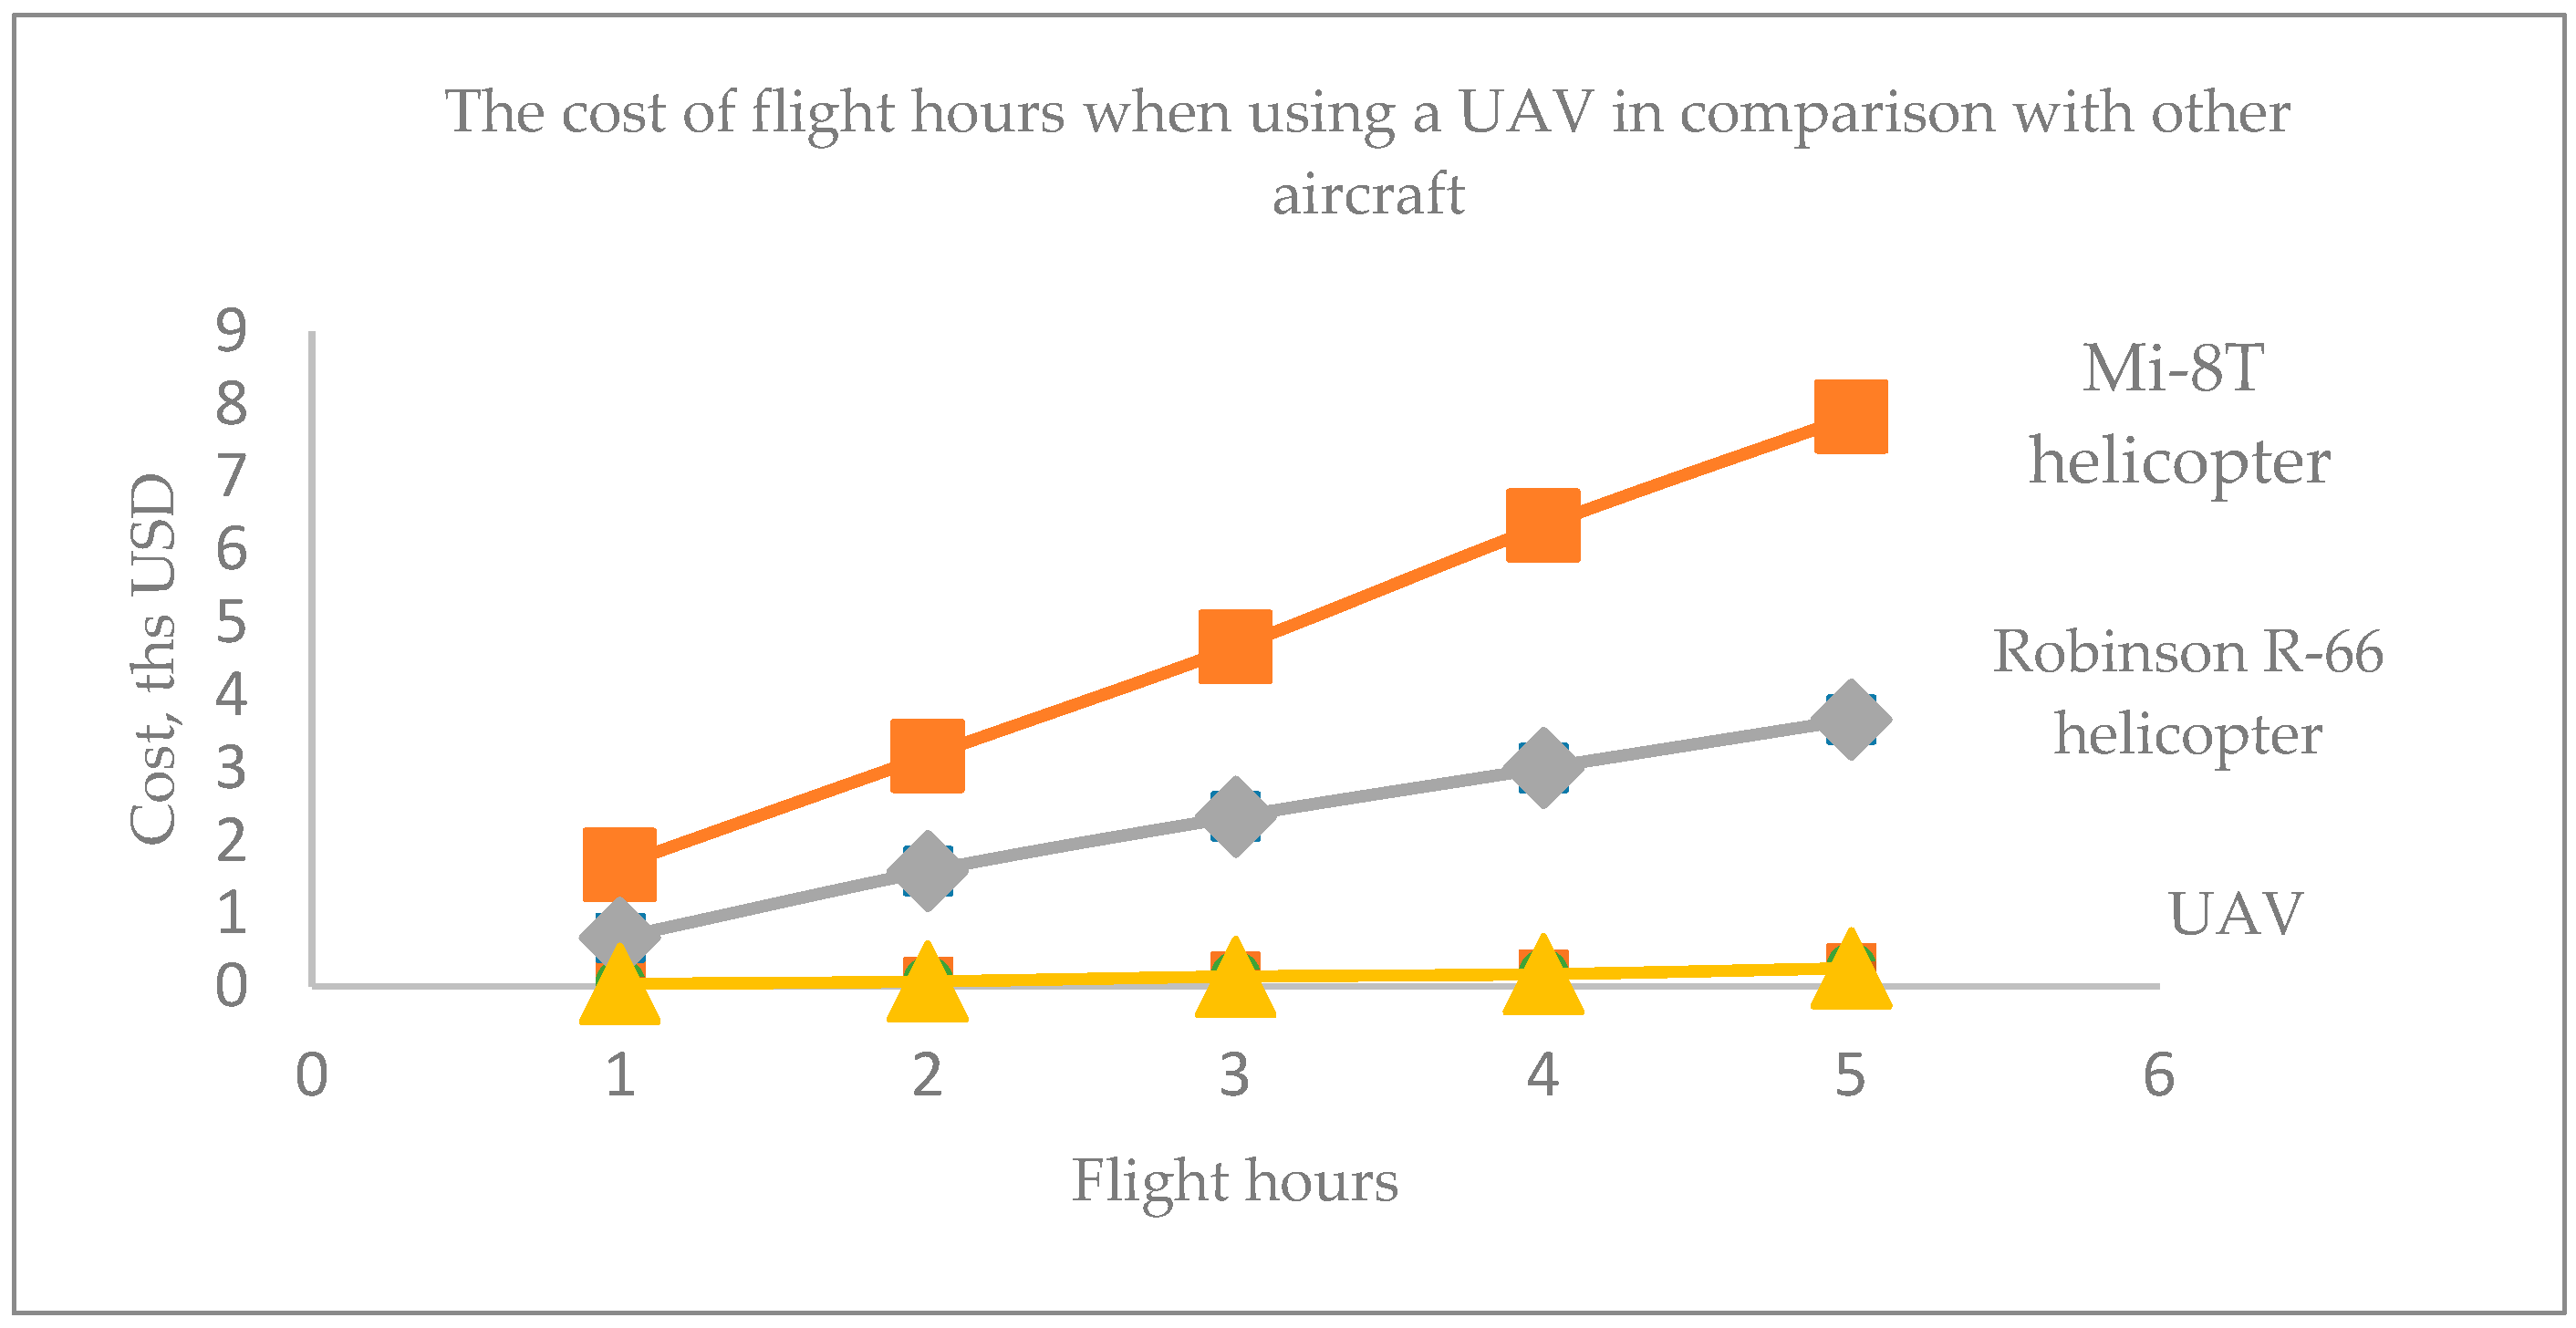
| Type of Aircraft | Costs per Hour of Flight (Relevant for November 2022) |
|---|---|
| Drone | ≈100 USD |
| Helicopter Robinson R-66 | from 930 USD |
| Mi-8T helicopter | from 1900 USD |
| Location | Airborne | On Ice | Below Ice | ||||||
|---|---|---|---|---|---|---|---|---|---|
| Sensor | GPR | FMCW | Optical | FP | IR | GPR | Optical | FP | Acoustic |
| Fall-Winter-Spring | |||||||||
| Exposed oil on ice | Y | P2 | Y | Y | P2 | Y | P2 | N/A | N/A |
| Snow covered oil on ice | Y | P2 | N | N | N | Y | P2 | N | N |
| Fresh oil under ice or with up to 6 cm (encapsulation) | P2 | P2 | N | N | N | Y | Y | Y | Y |
| Encapsulated oil (more than 6 cm new growth) | P | P2 | N | N | N | Y | P | N | P2 |
| Summer | |||||||||
| Exposed oil on ice | P2 | P2 | Y | Y | Y | N/A | N/A | N/A | N/A |
Disclaimer/Publisher’s Note: The statements, opinions and data contained in all publications are solely those of the individual author(s) and contributor(s) and not of MDPI and/or the editor(s). MDPI and/or the editor(s) disclaim responsibility for any injury to people or property resulting from any ideas, methods, instructions or products referred to in the content. |
© 2023 by the authors. Licensee MDPI, Basel, Switzerland. This article is an open access article distributed under the terms and conditions of the Creative Commons Attribution (CC BY) license (https://creativecommons.org/licenses/by/4.0/).
Share and Cite
Khalturin, A.A.; Parfenchik, K.D.; Shpenst, V.A. Features of Oil Spills Monitoring on the Water Surface by the Russian Federation in the Arctic Region. J. Mar. Sci. Eng. 2023, 11, 111. https://doi.org/10.3390/jmse11010111
Khalturin AA, Parfenchik KD, Shpenst VA. Features of Oil Spills Monitoring on the Water Surface by the Russian Federation in the Arctic Region. Journal of Marine Science and Engineering. 2023; 11(1):111. https://doi.org/10.3390/jmse11010111
Chicago/Turabian StyleKhalturin, Artem Alekseevich, Konstantin Dmitrievich Parfenchik, and Vadim Anatolievich Shpenst. 2023. "Features of Oil Spills Monitoring on the Water Surface by the Russian Federation in the Arctic Region" Journal of Marine Science and Engineering 11, no. 1: 111. https://doi.org/10.3390/jmse11010111