


Effect of Saturation on Shear Behavior and Particle Breakage of Coral Sand


Abstract
:1. Introduction
2. Test Overview
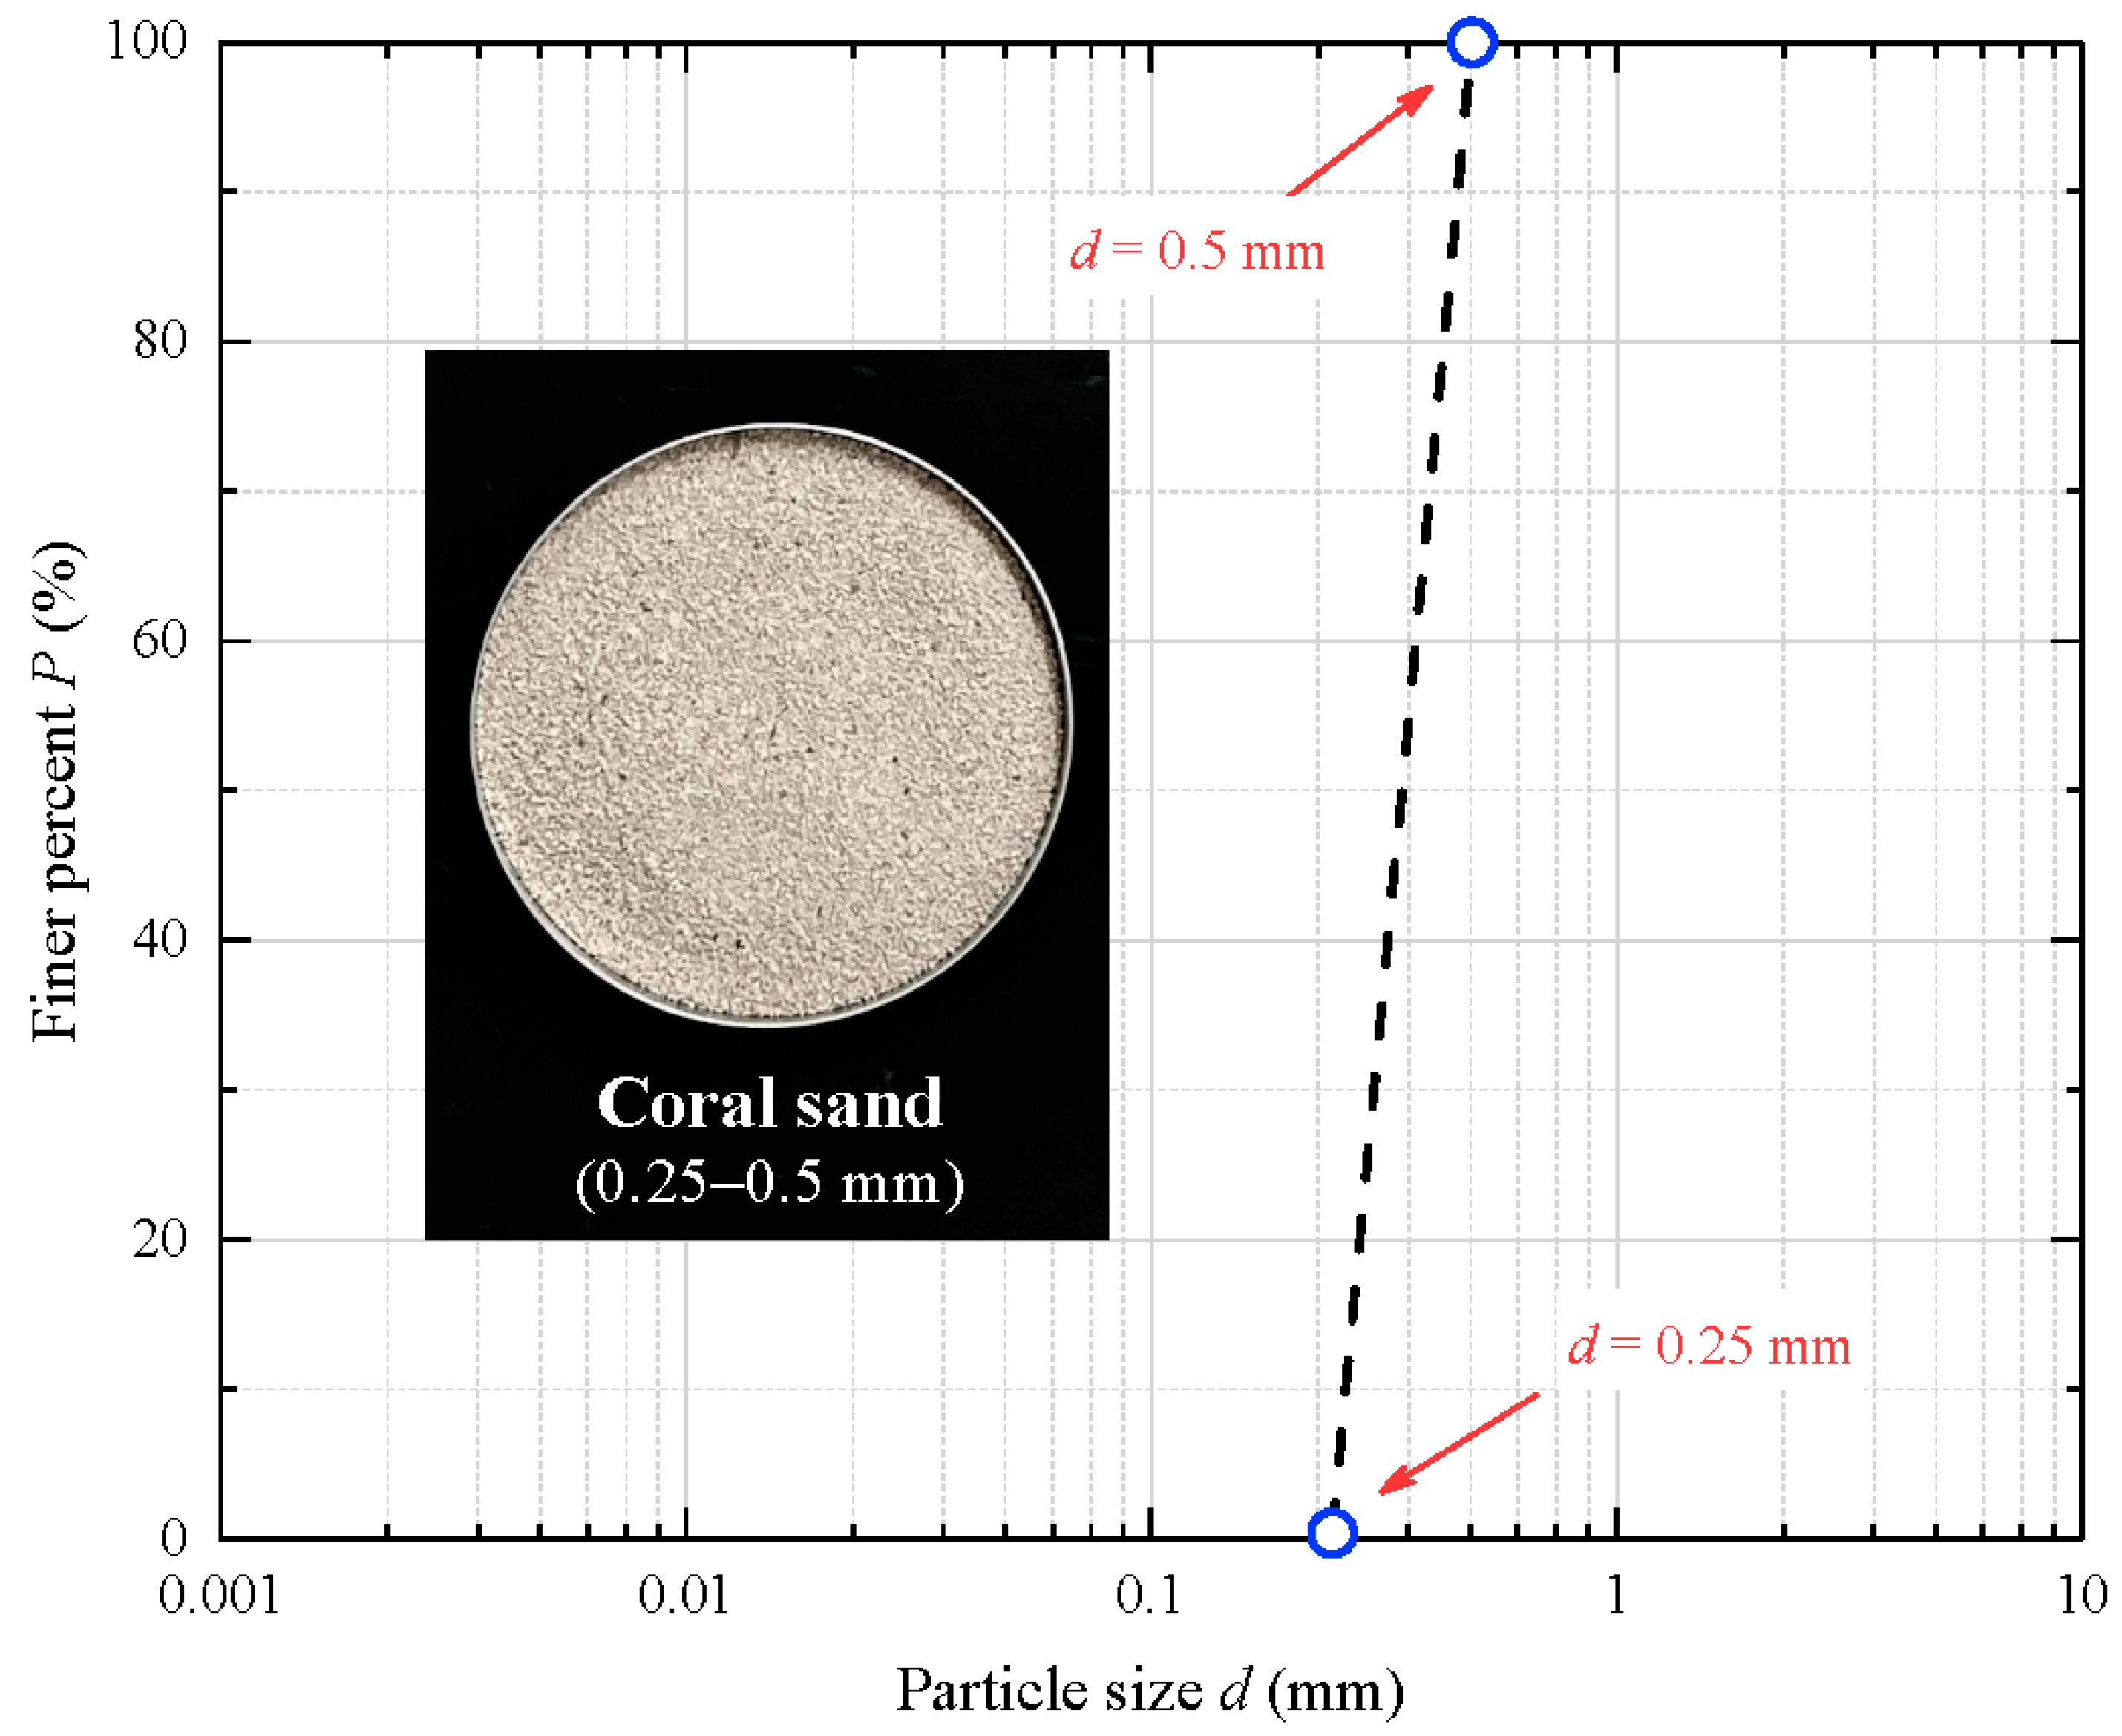
2.1. Material
2.2. Test Scheme
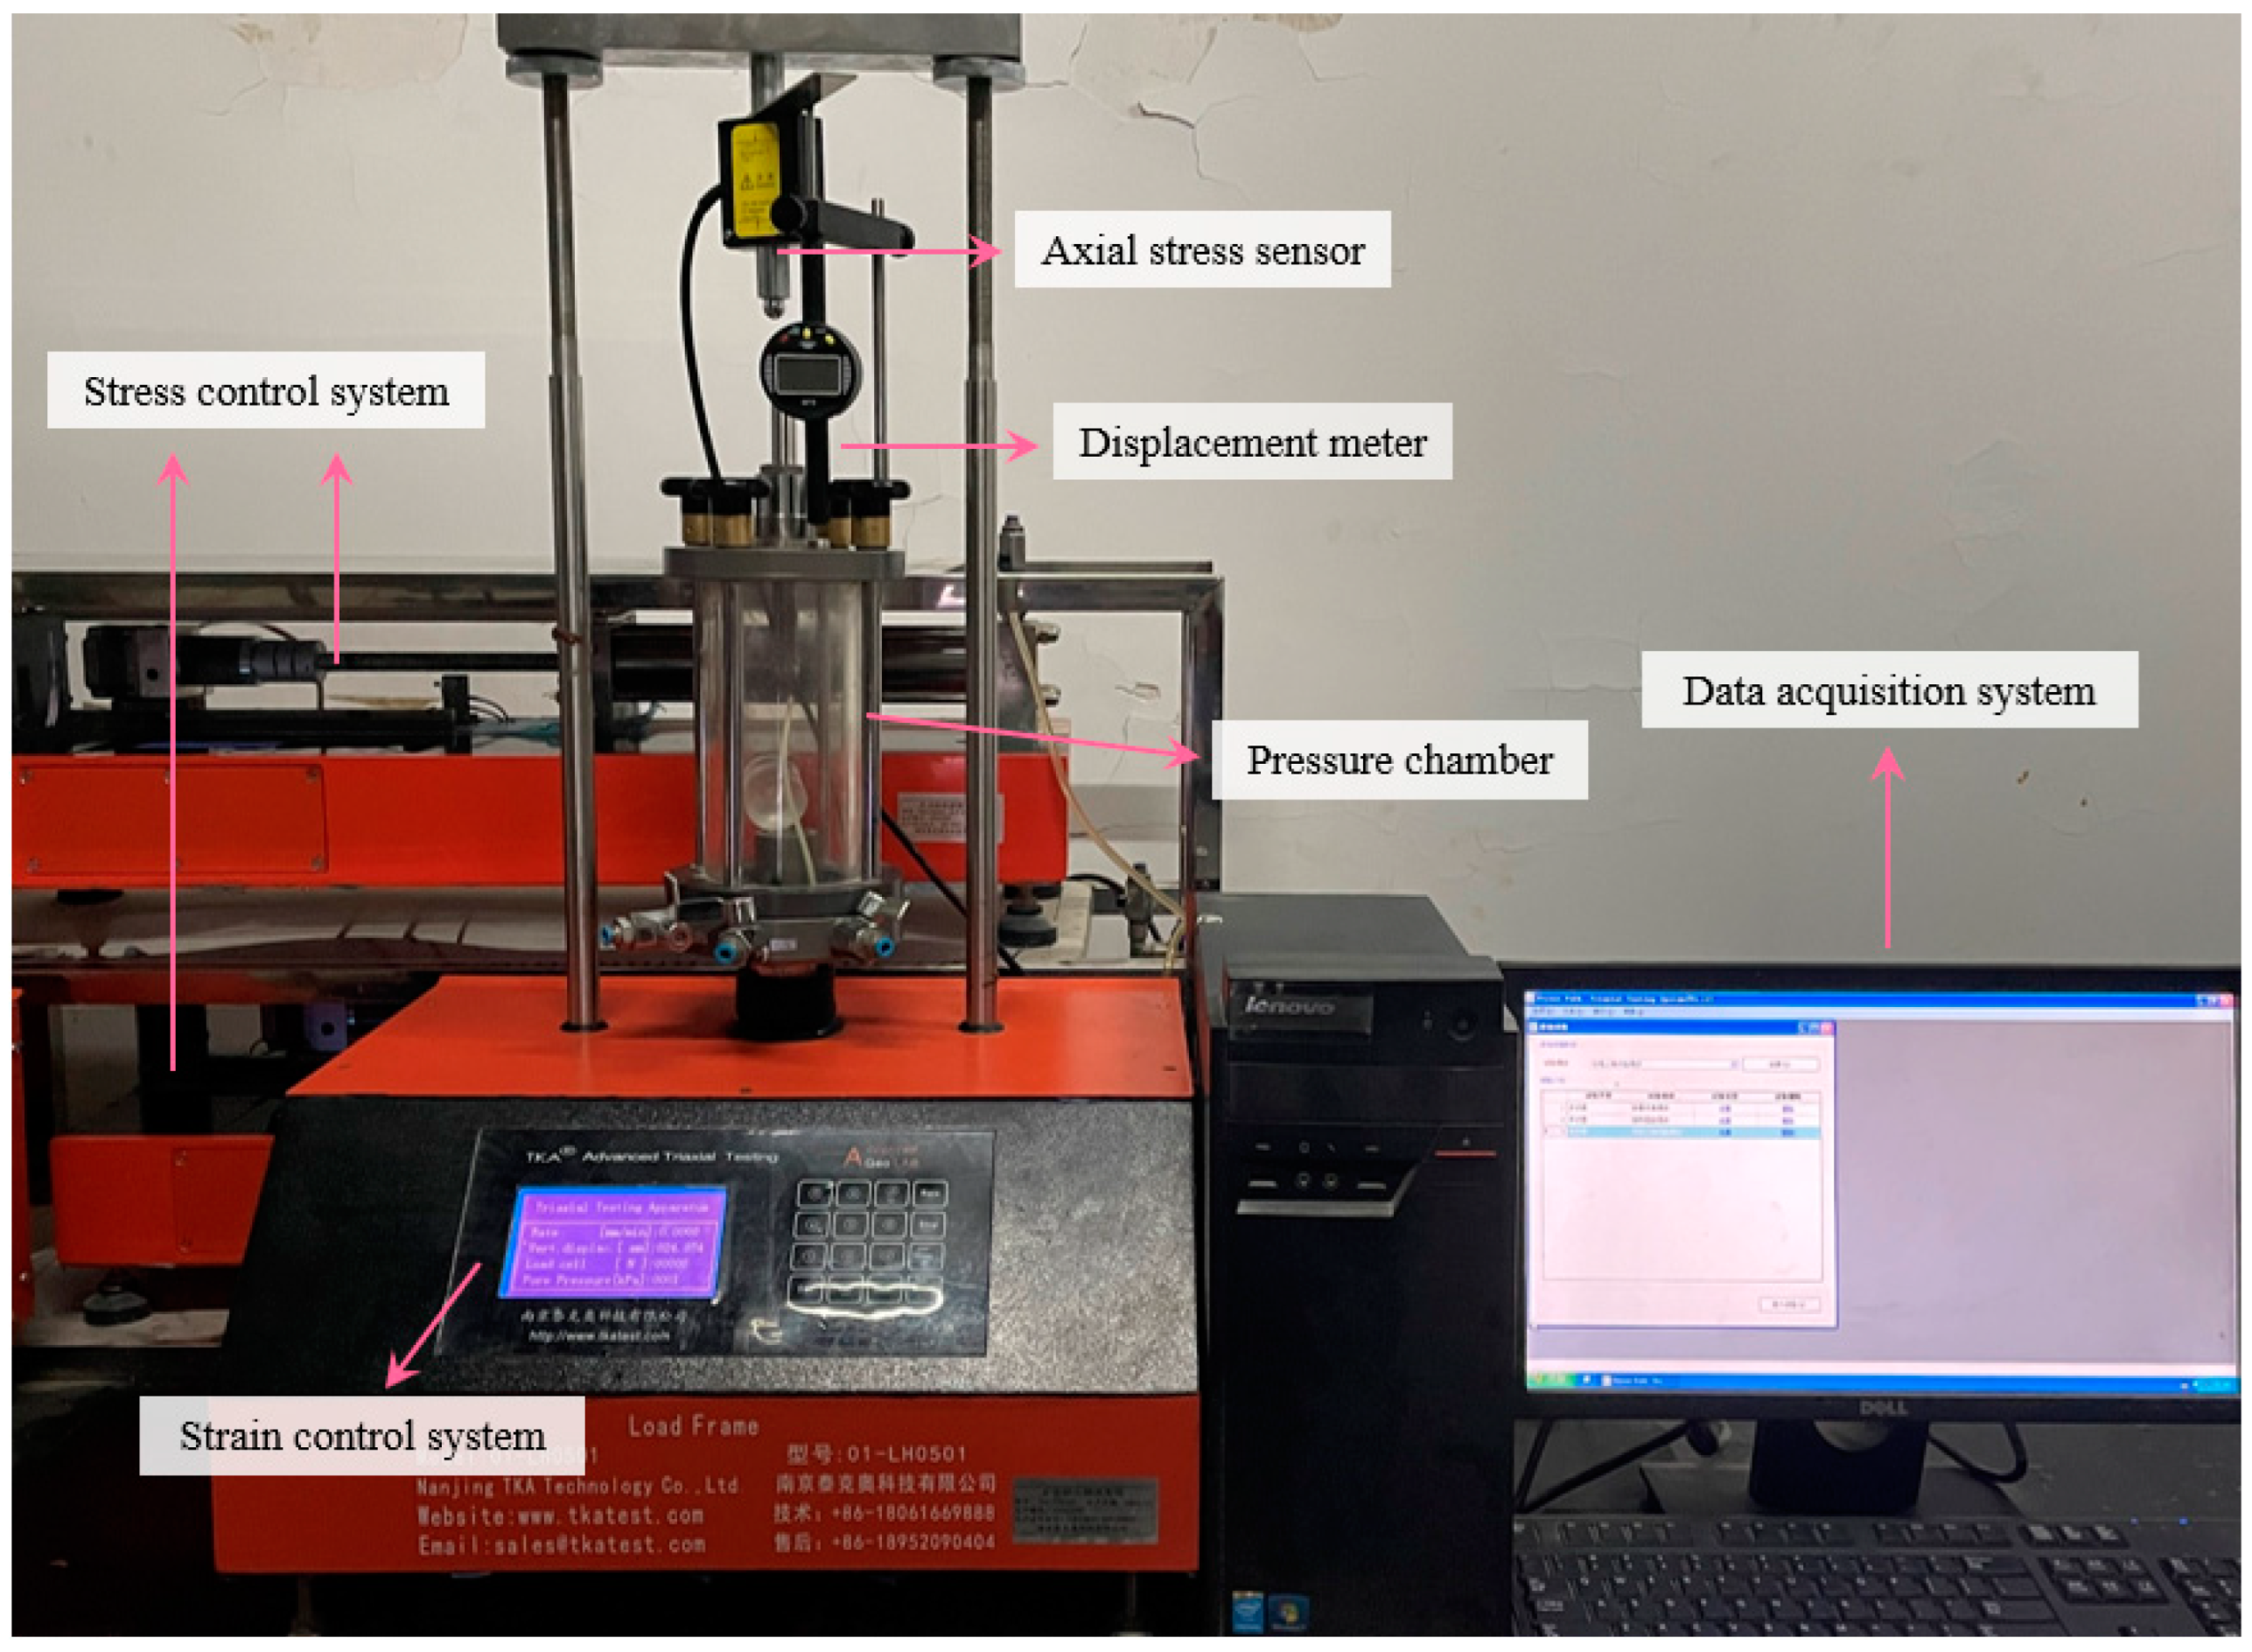
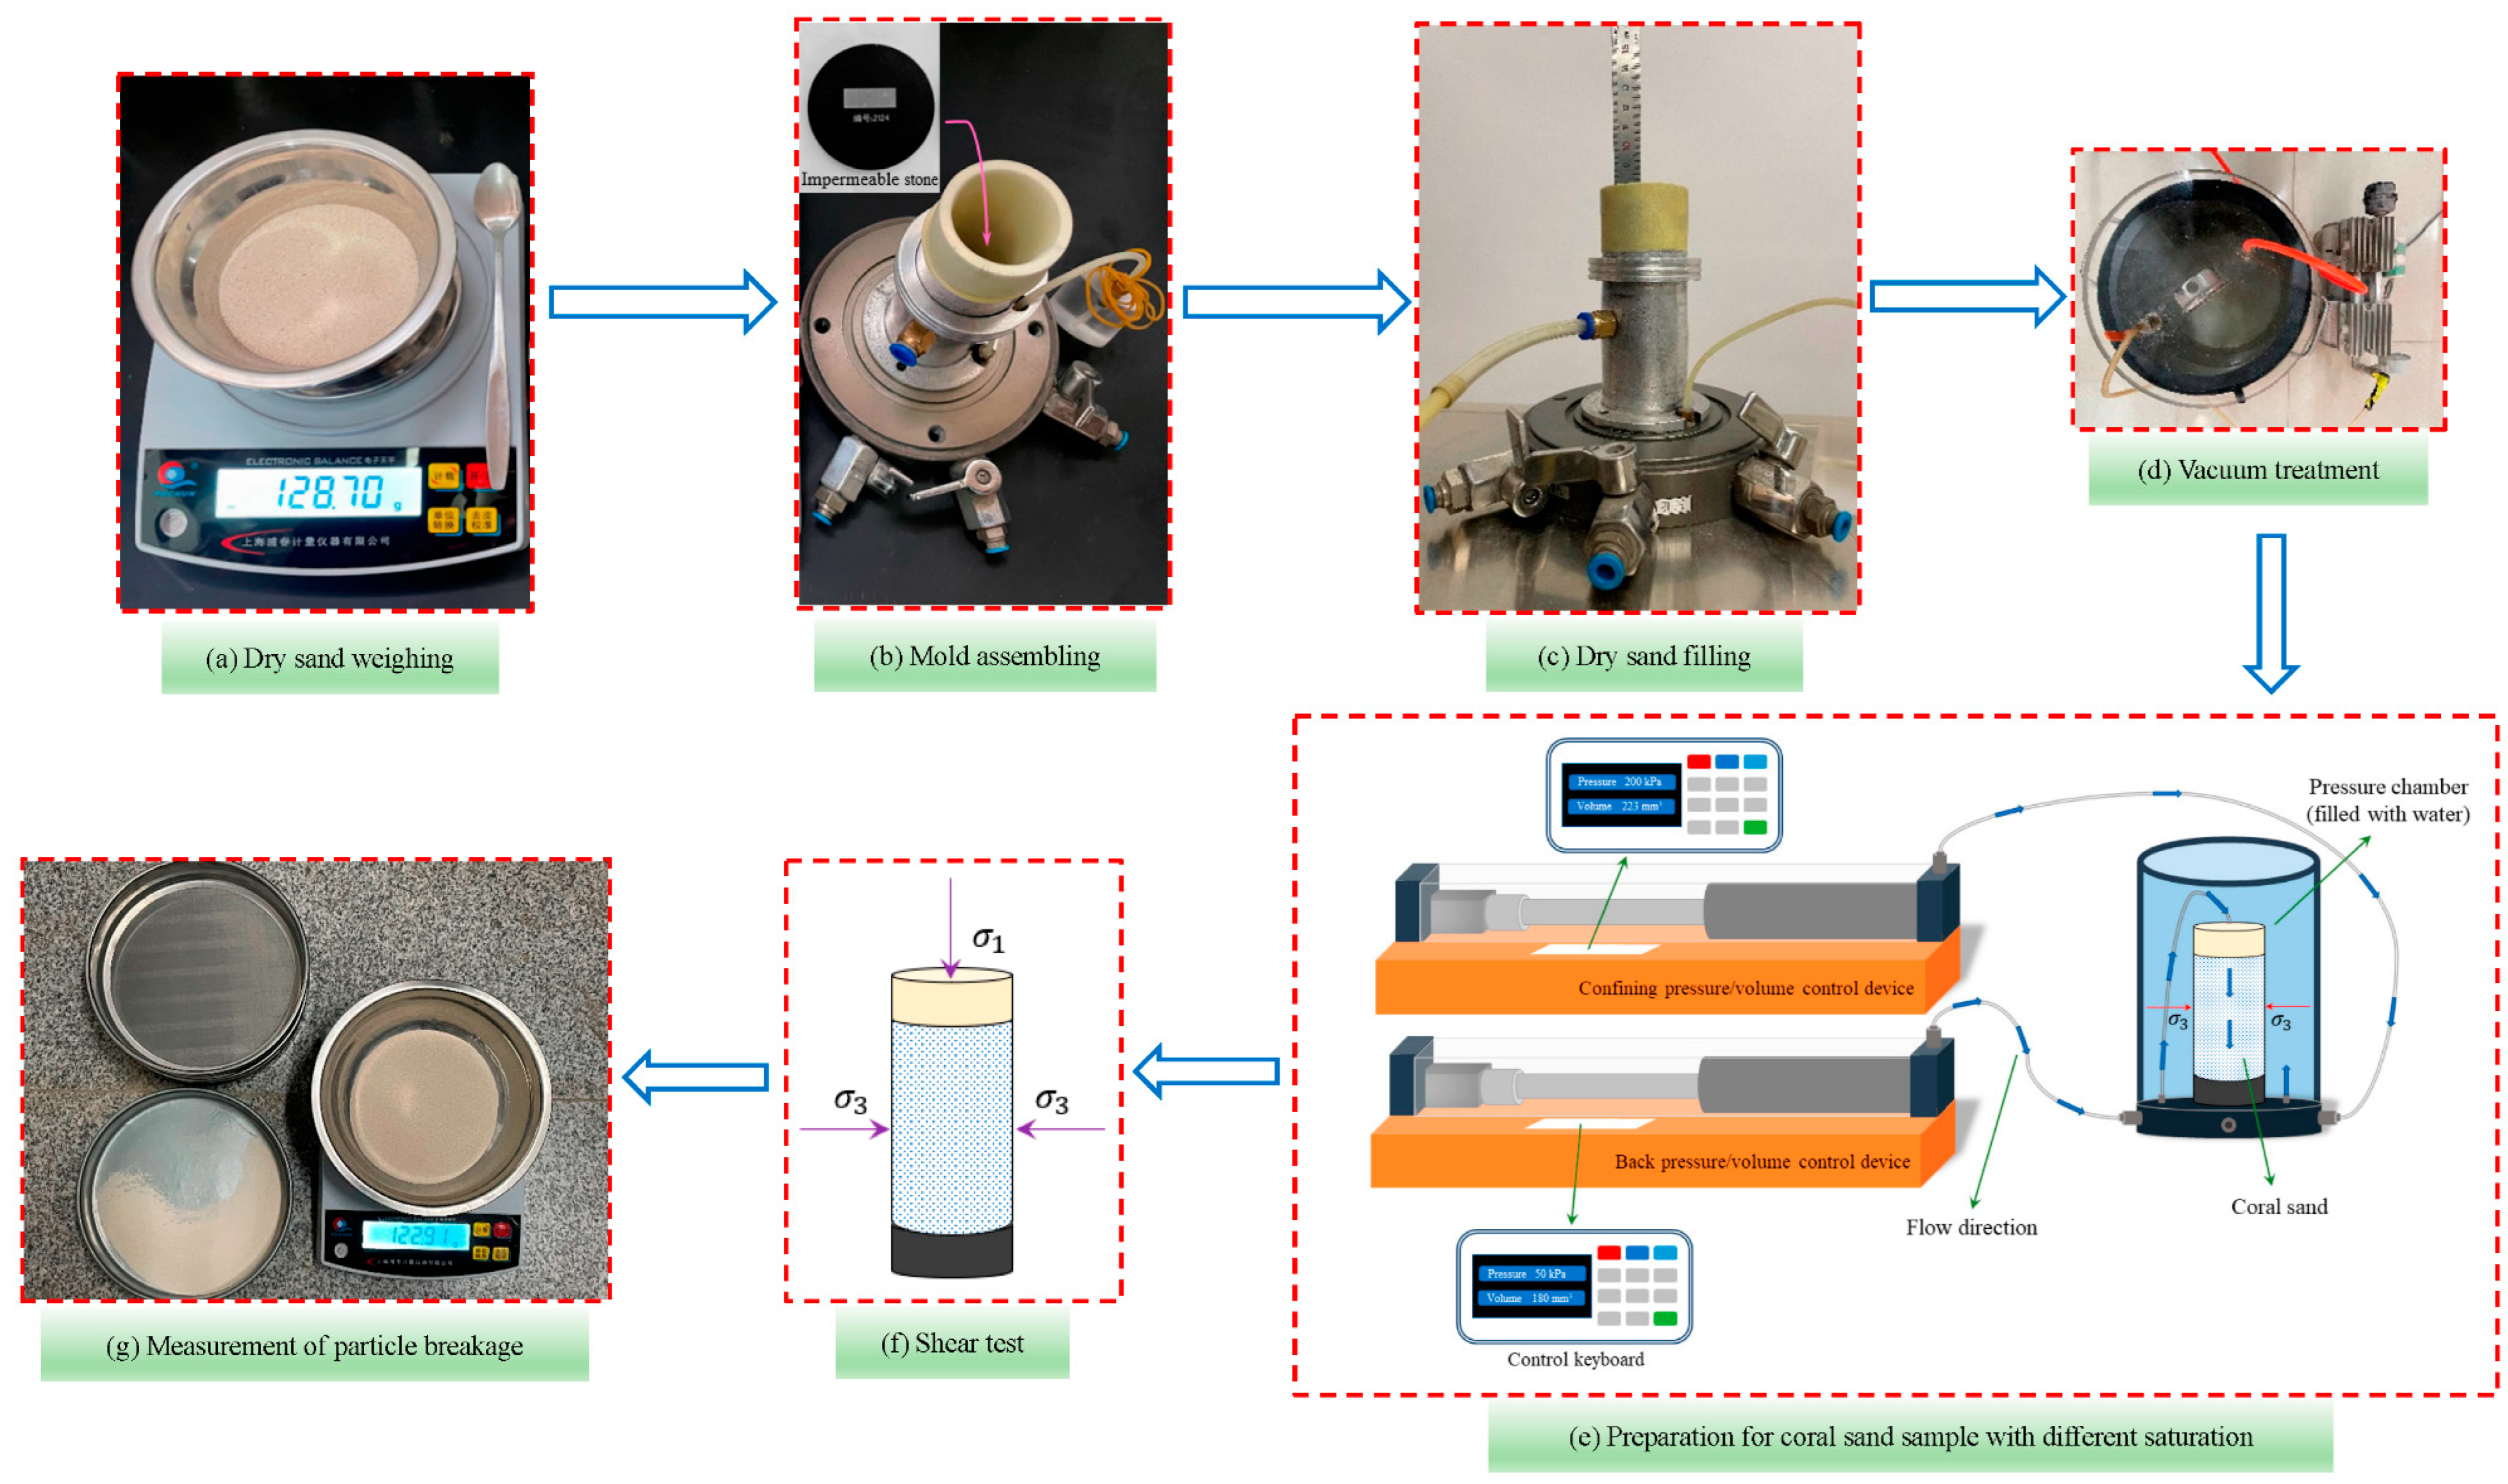
2.3. Apparatus and Procedure
3. Shear Test Result and Analysis
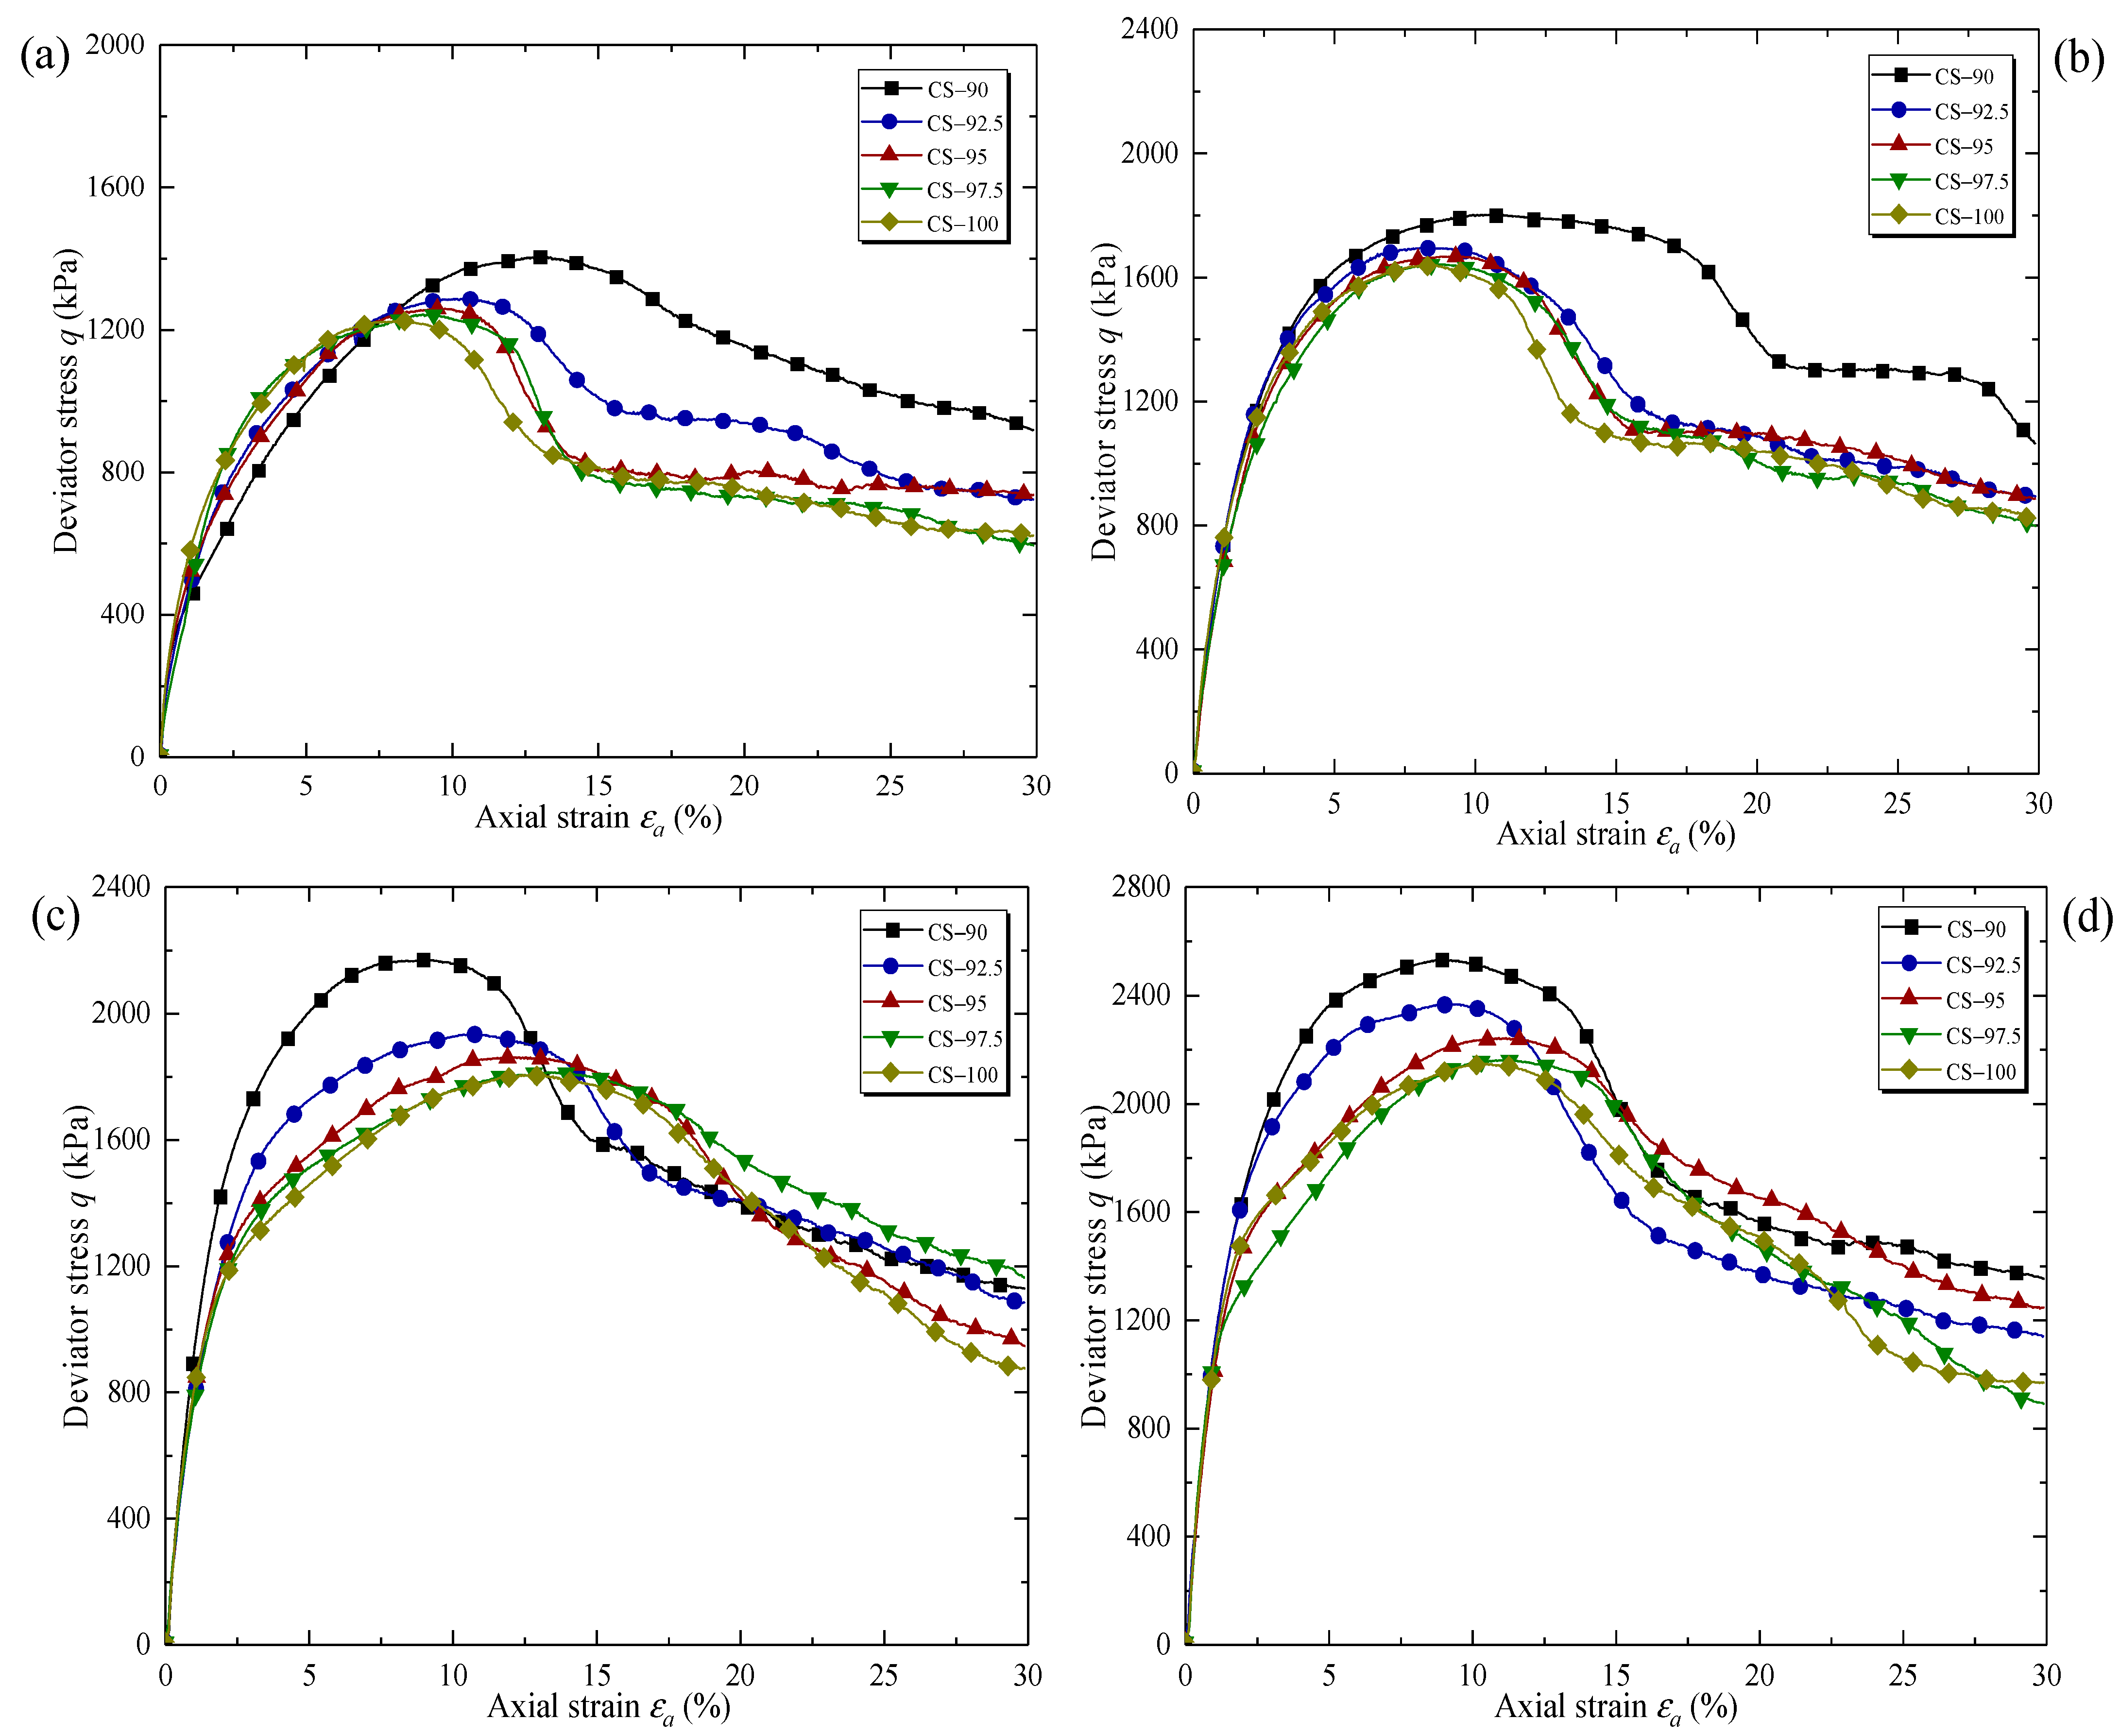
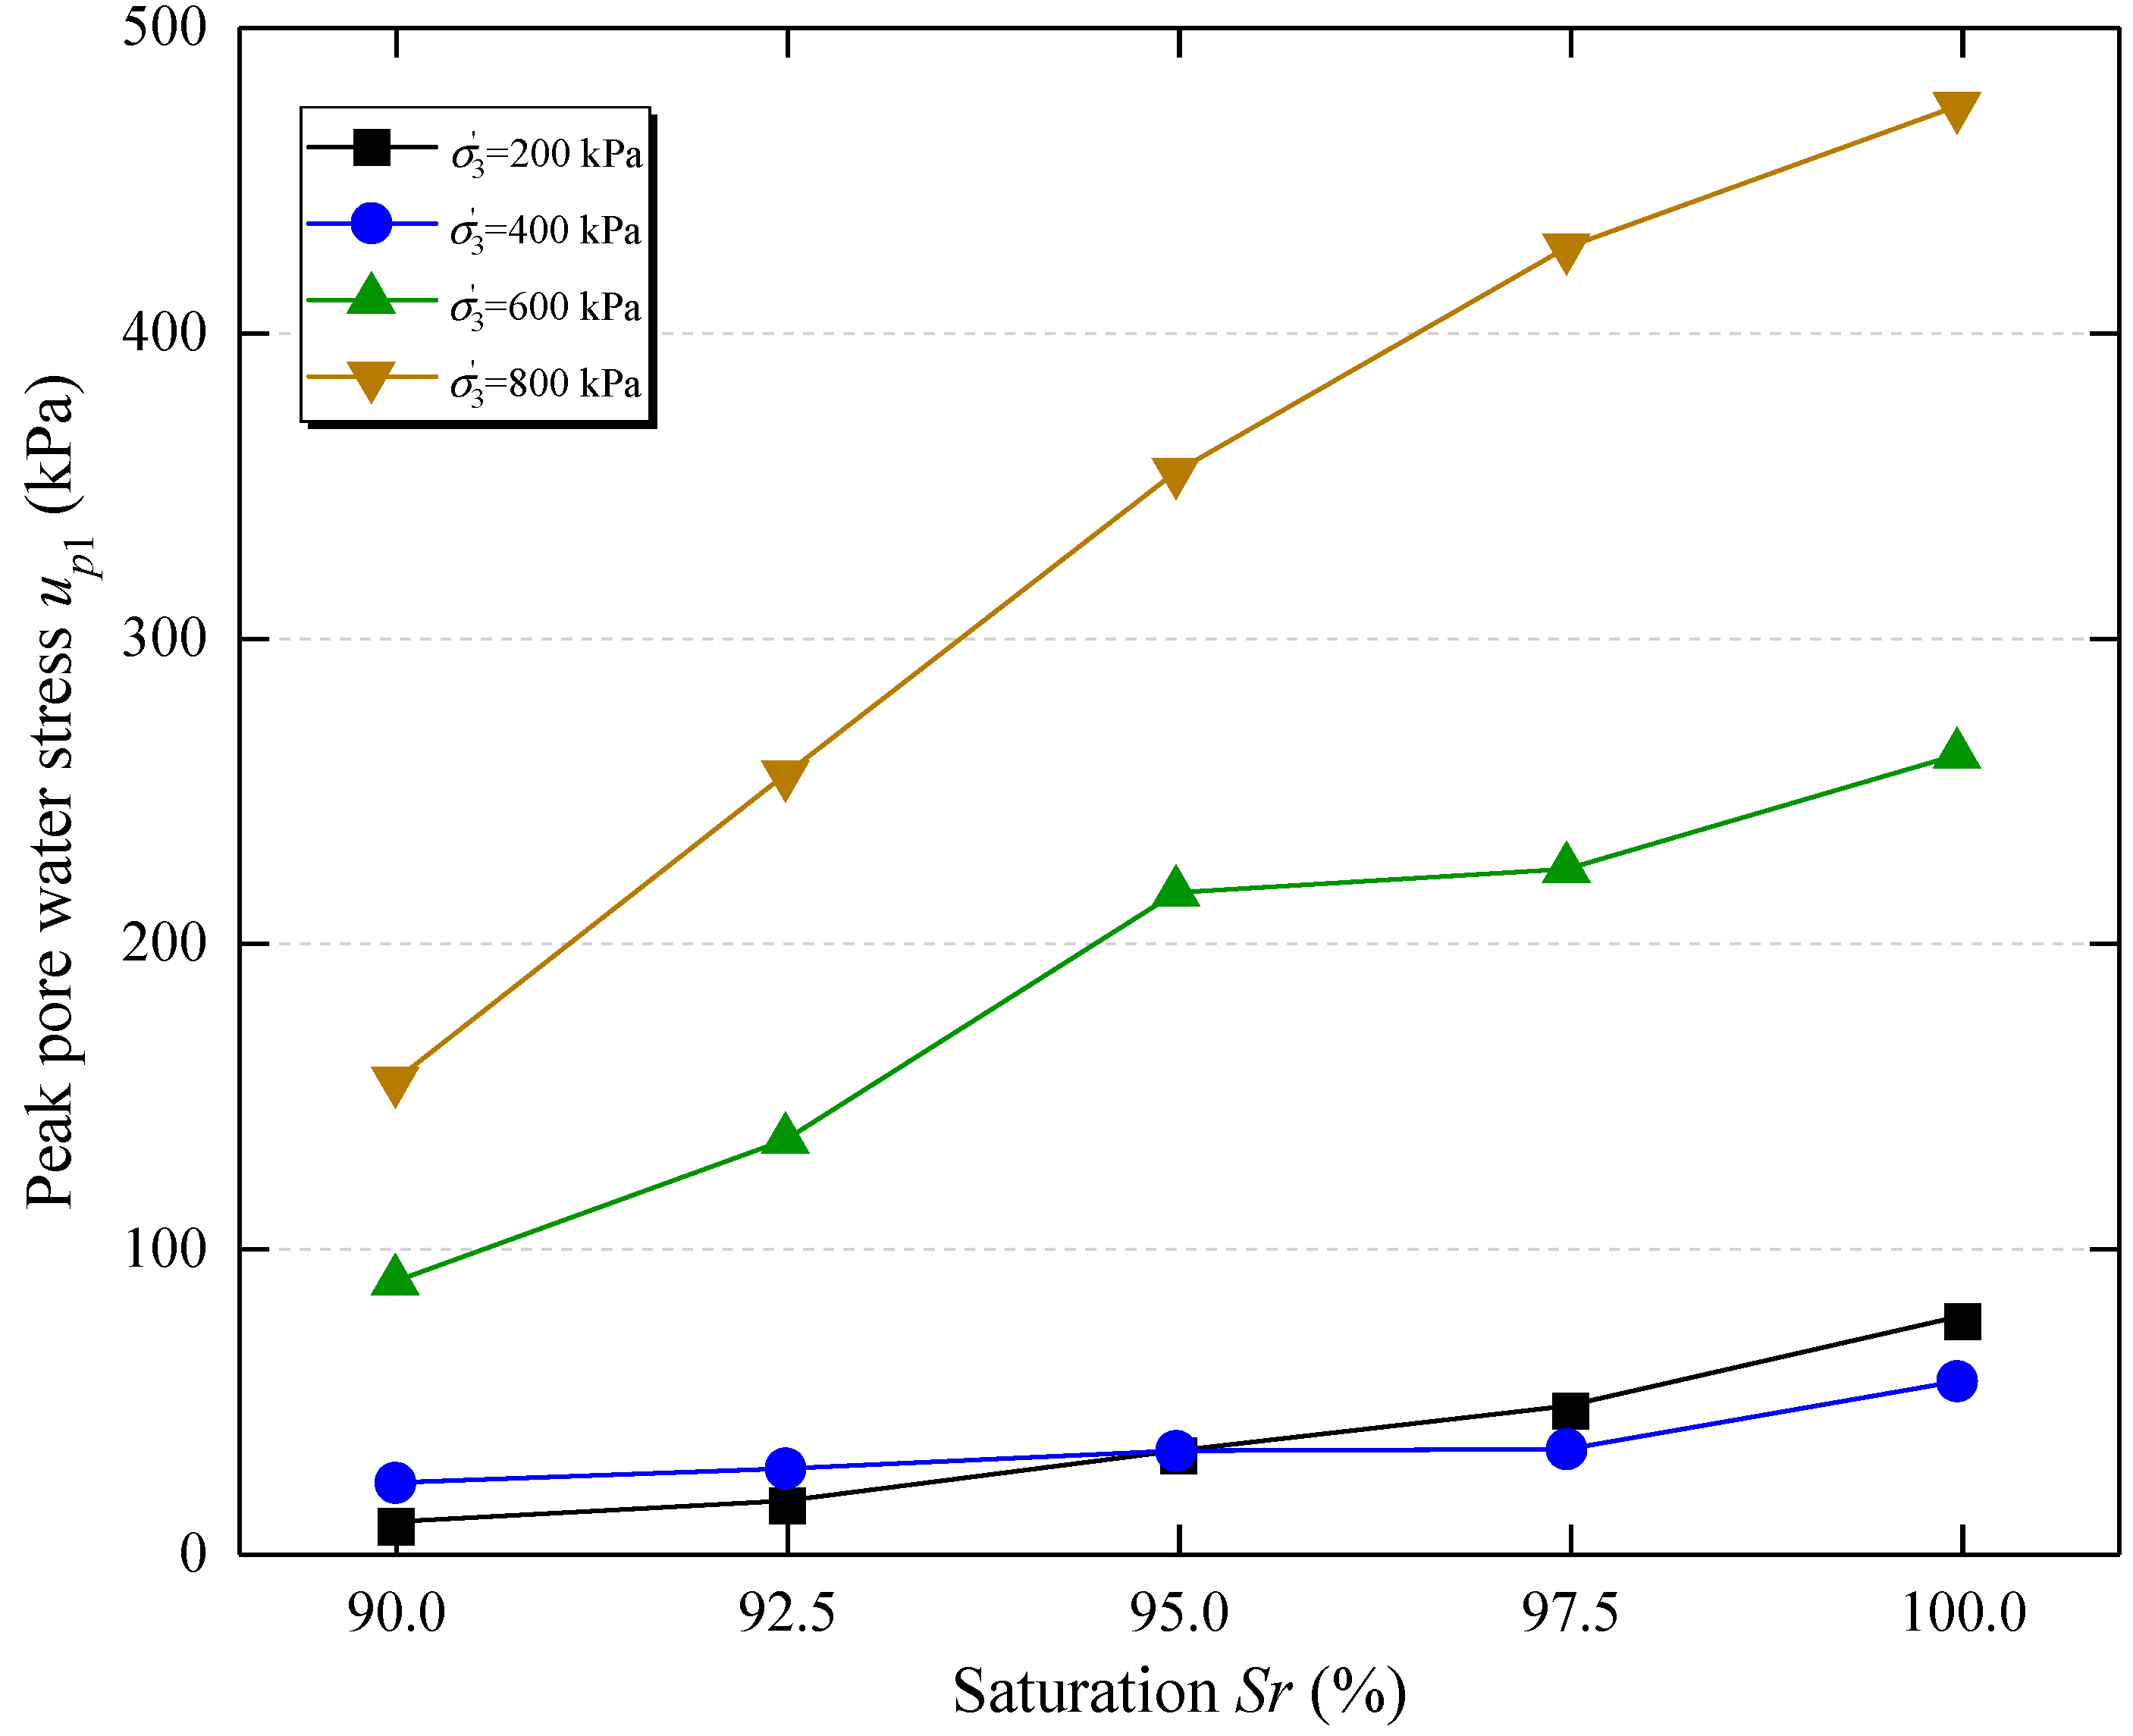
3.1. Deviator Stress–Pore Water Stress–Axial Strain Relationship
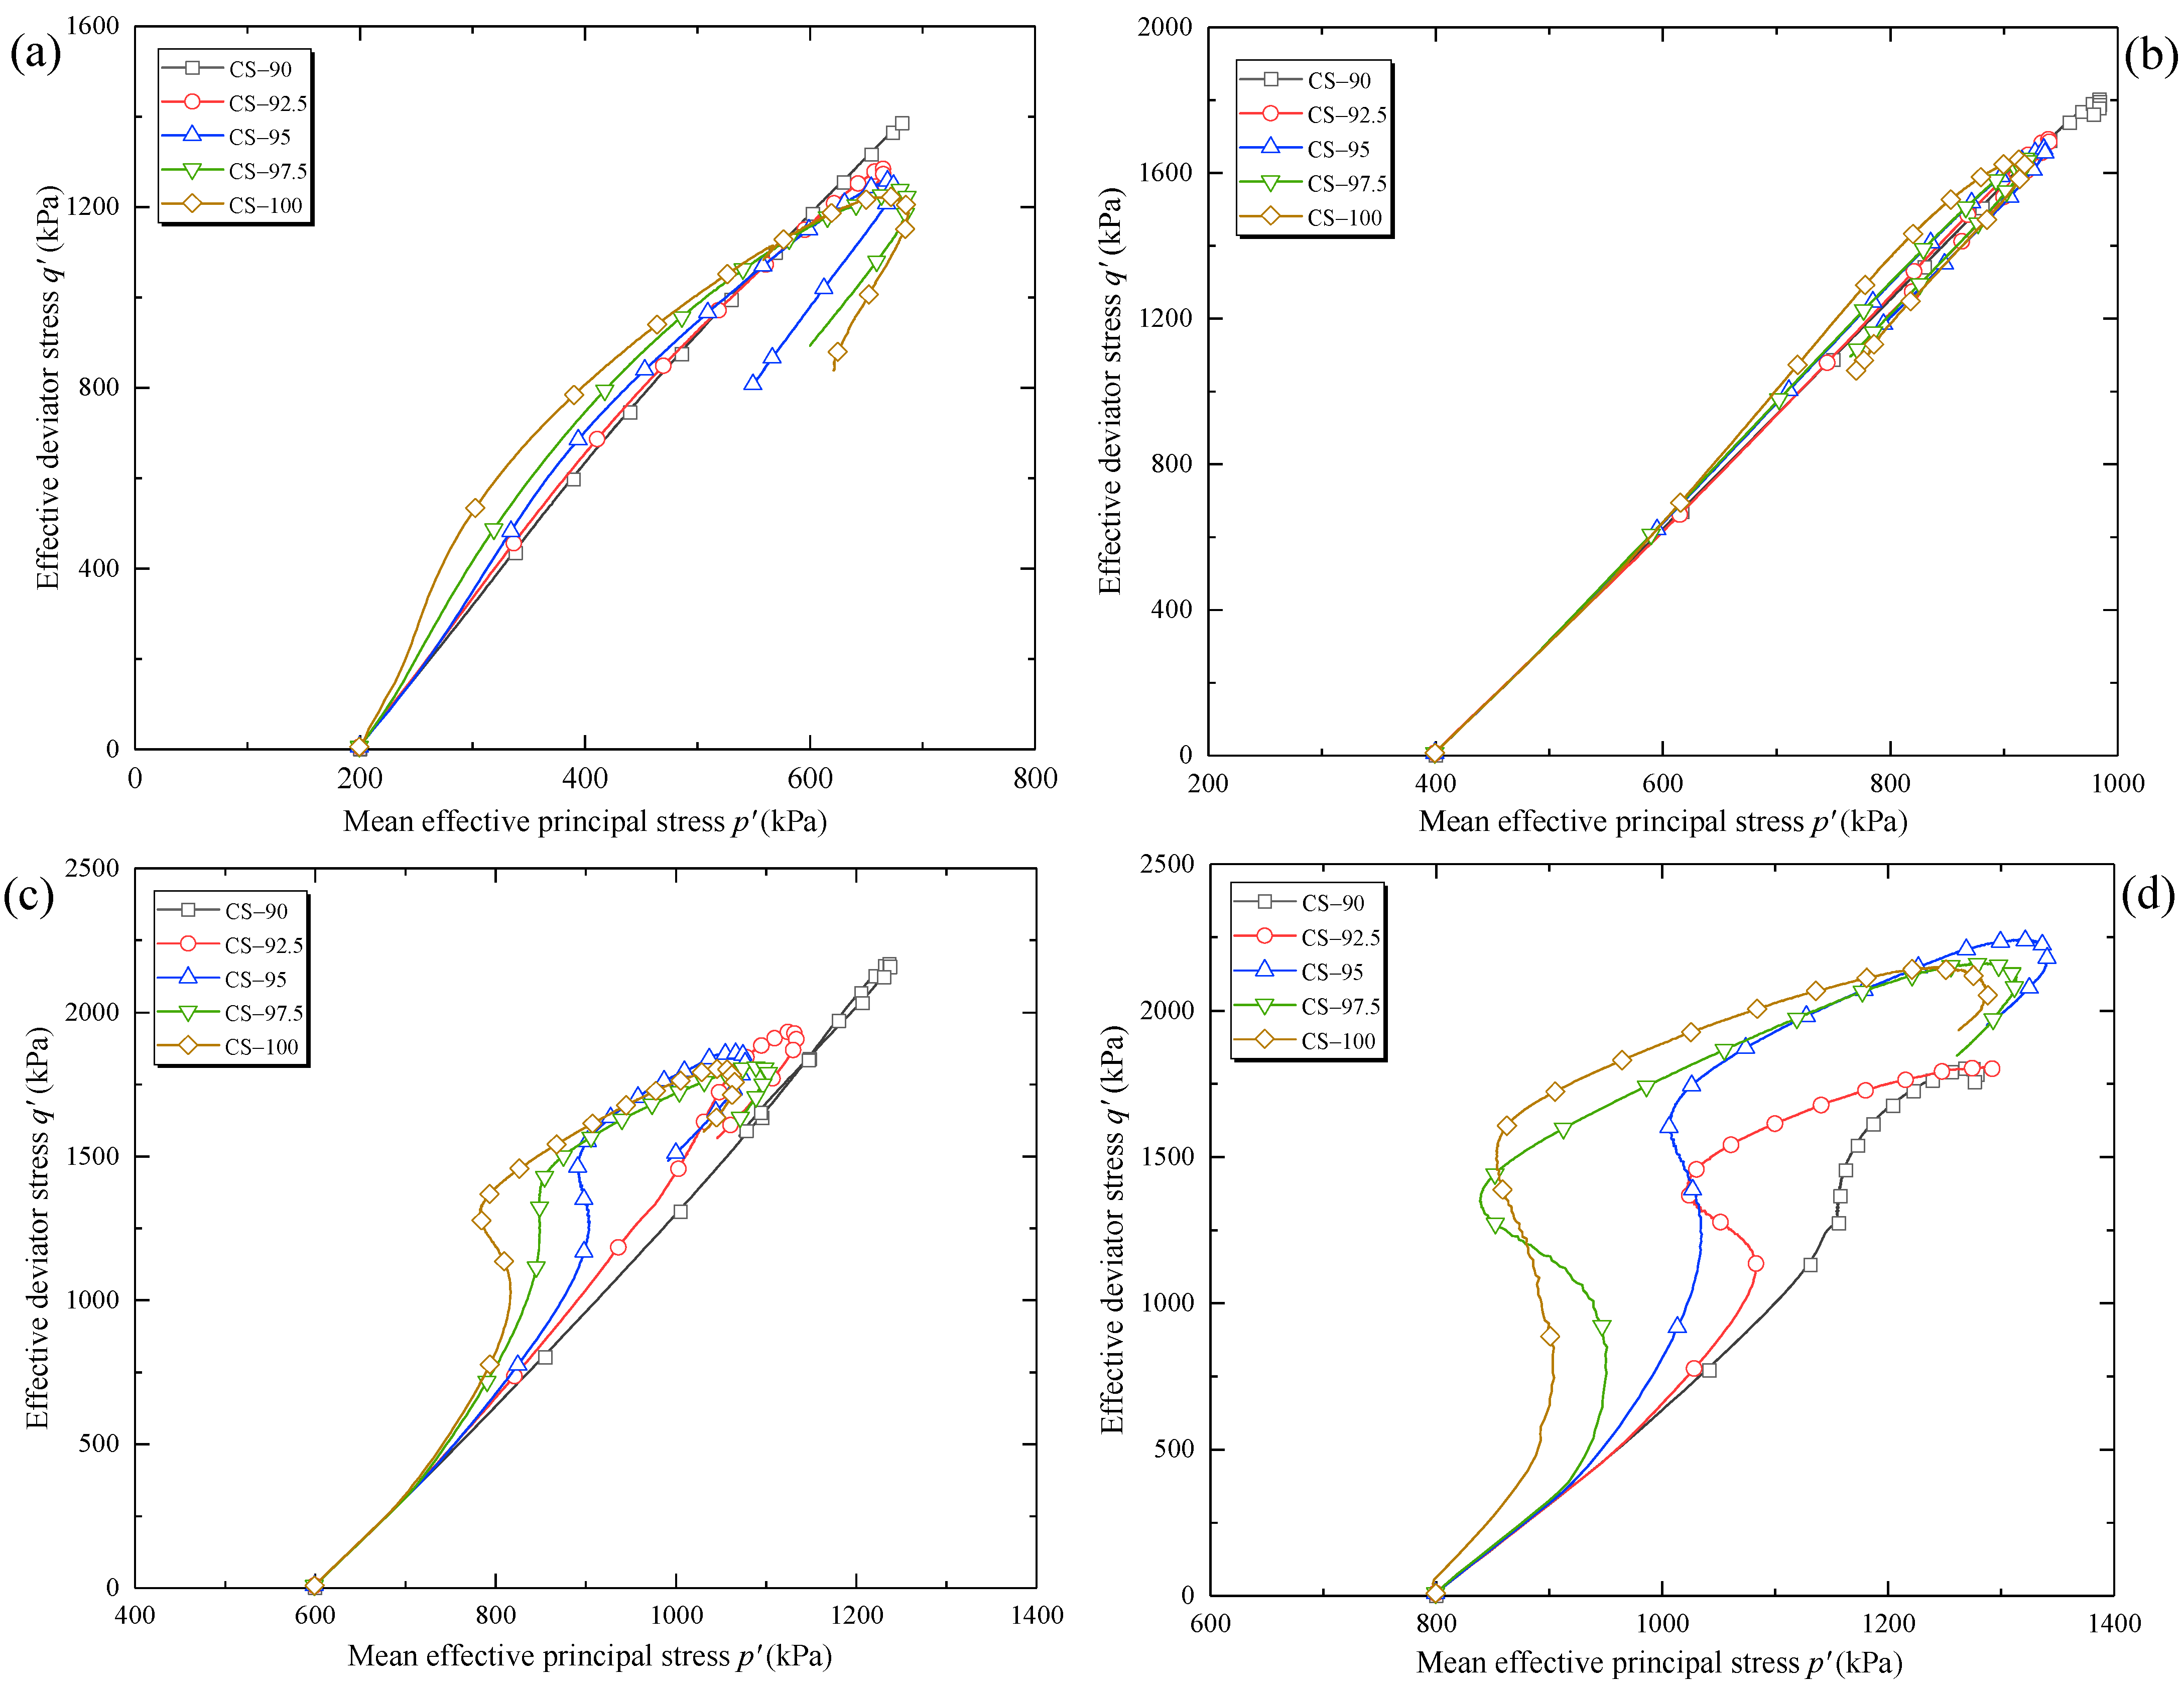
3.2. Stress Path
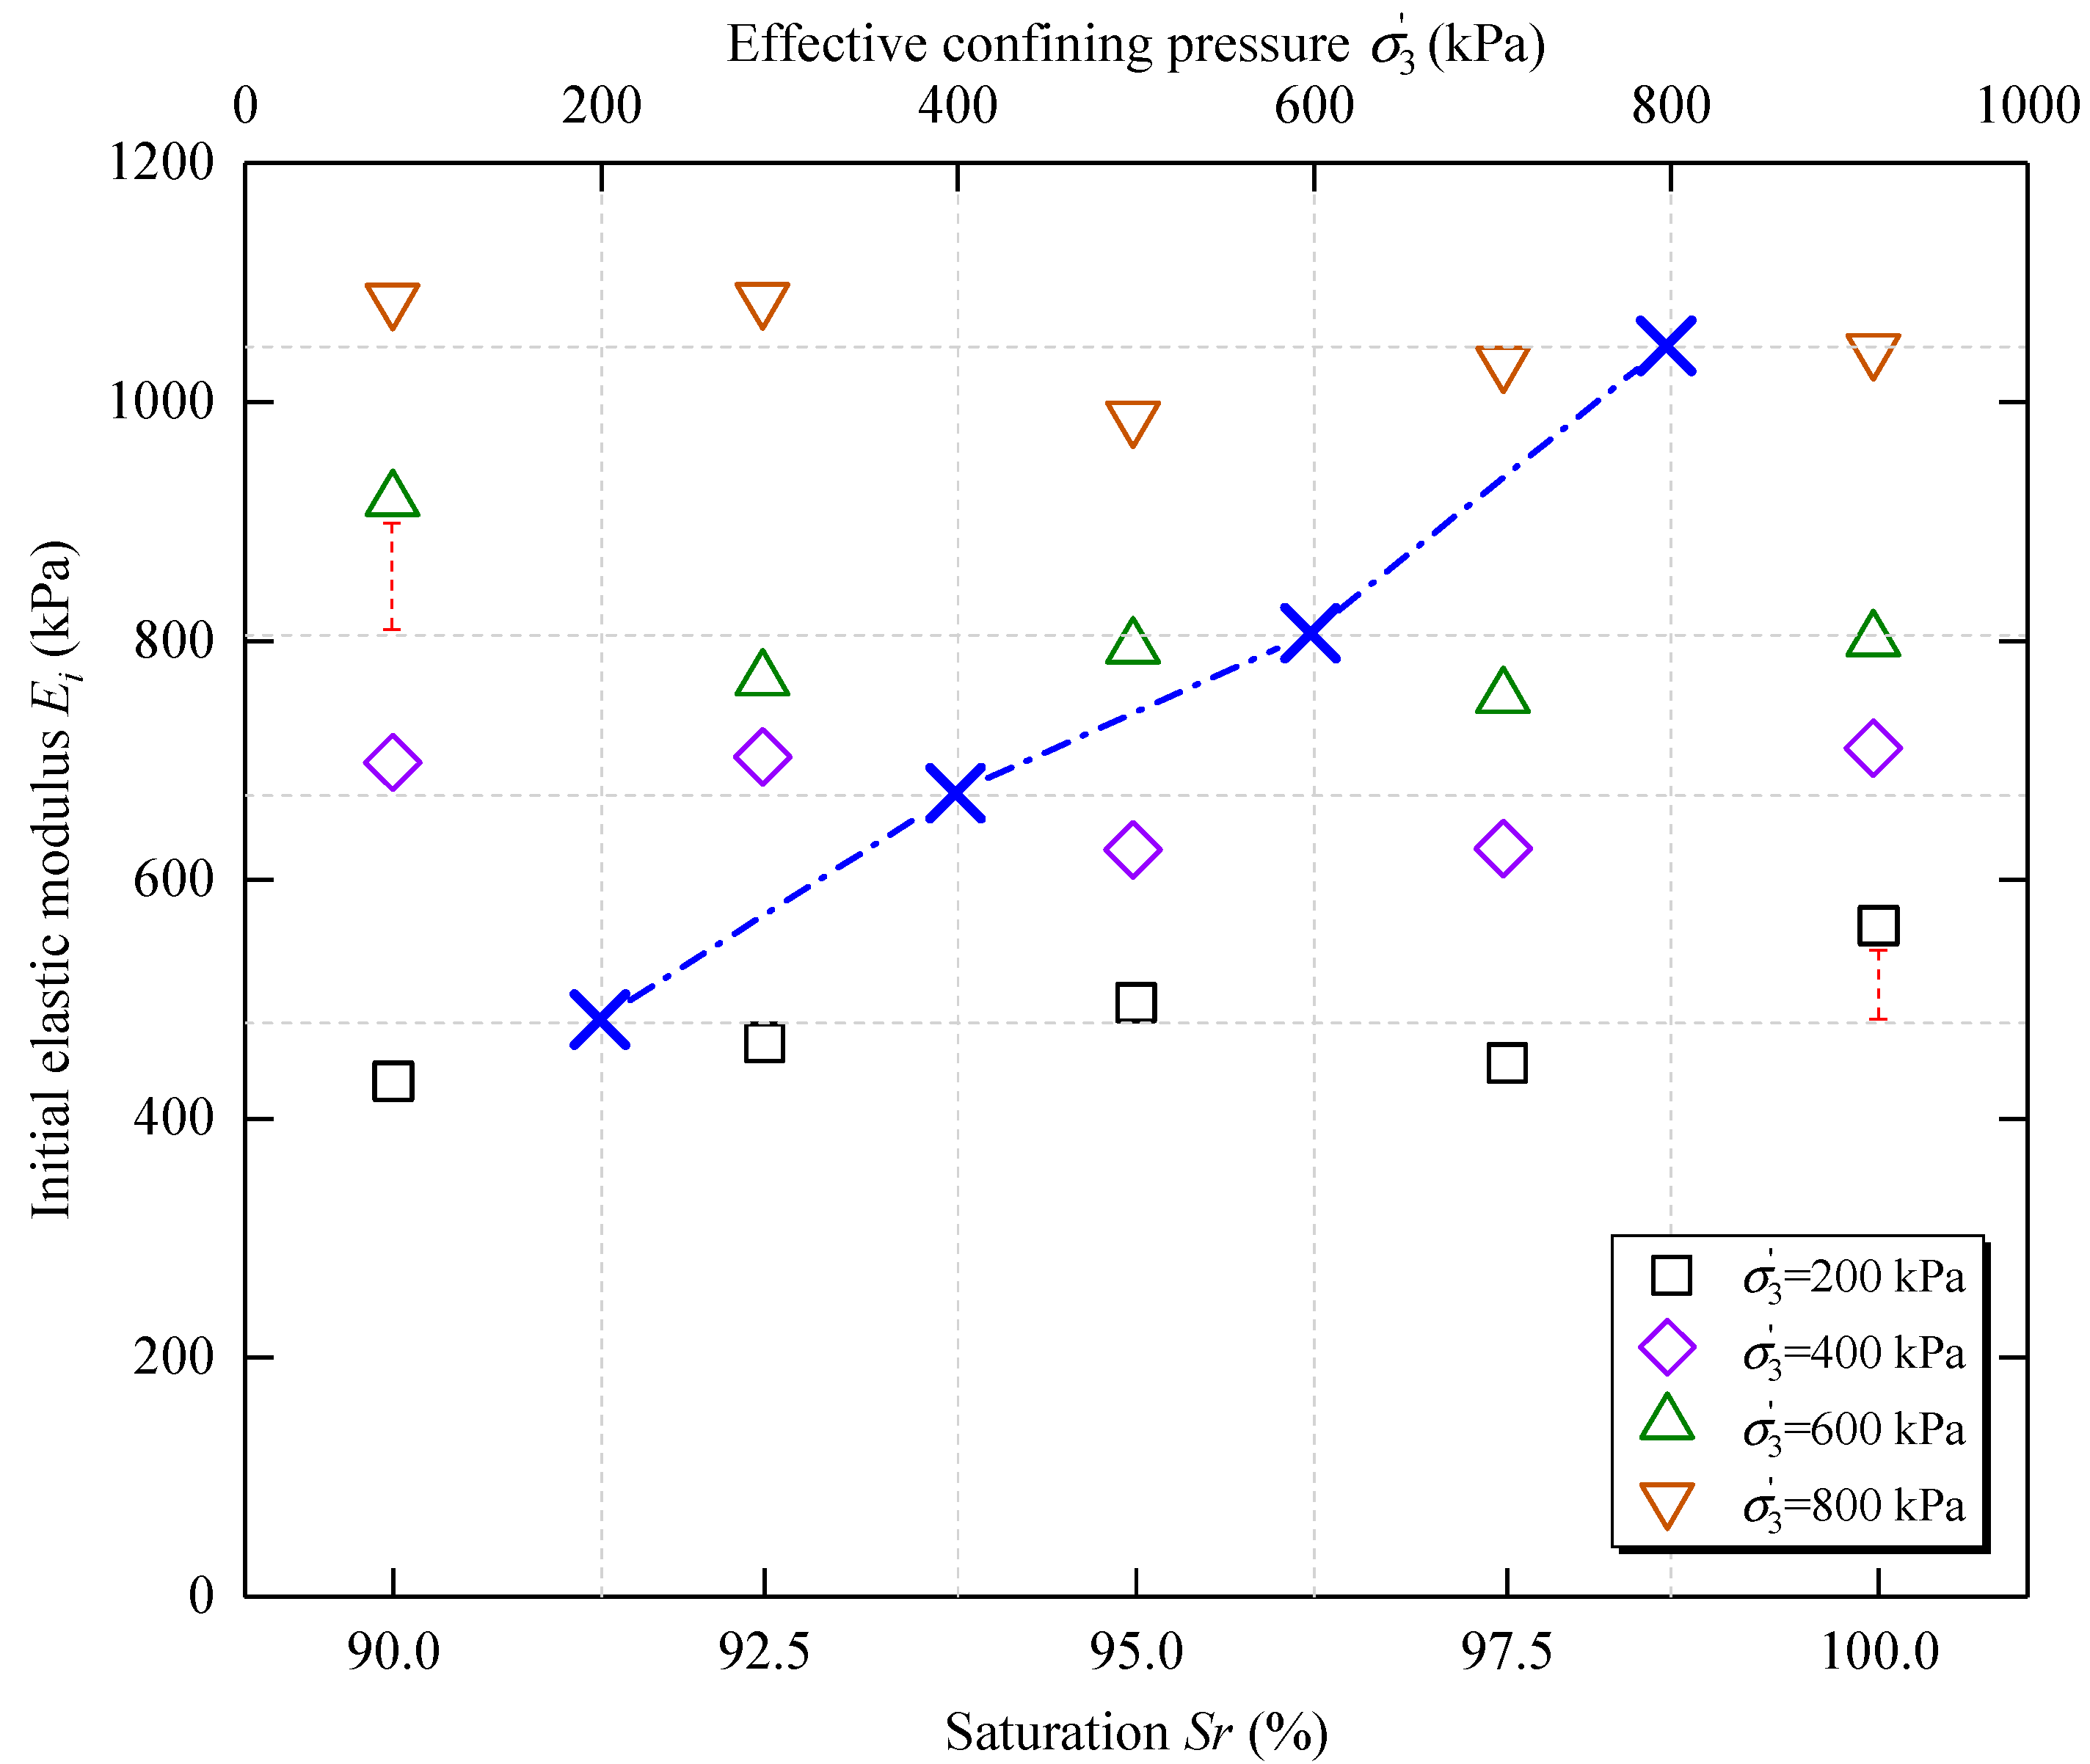
3.3. Initial Elastic Modulus
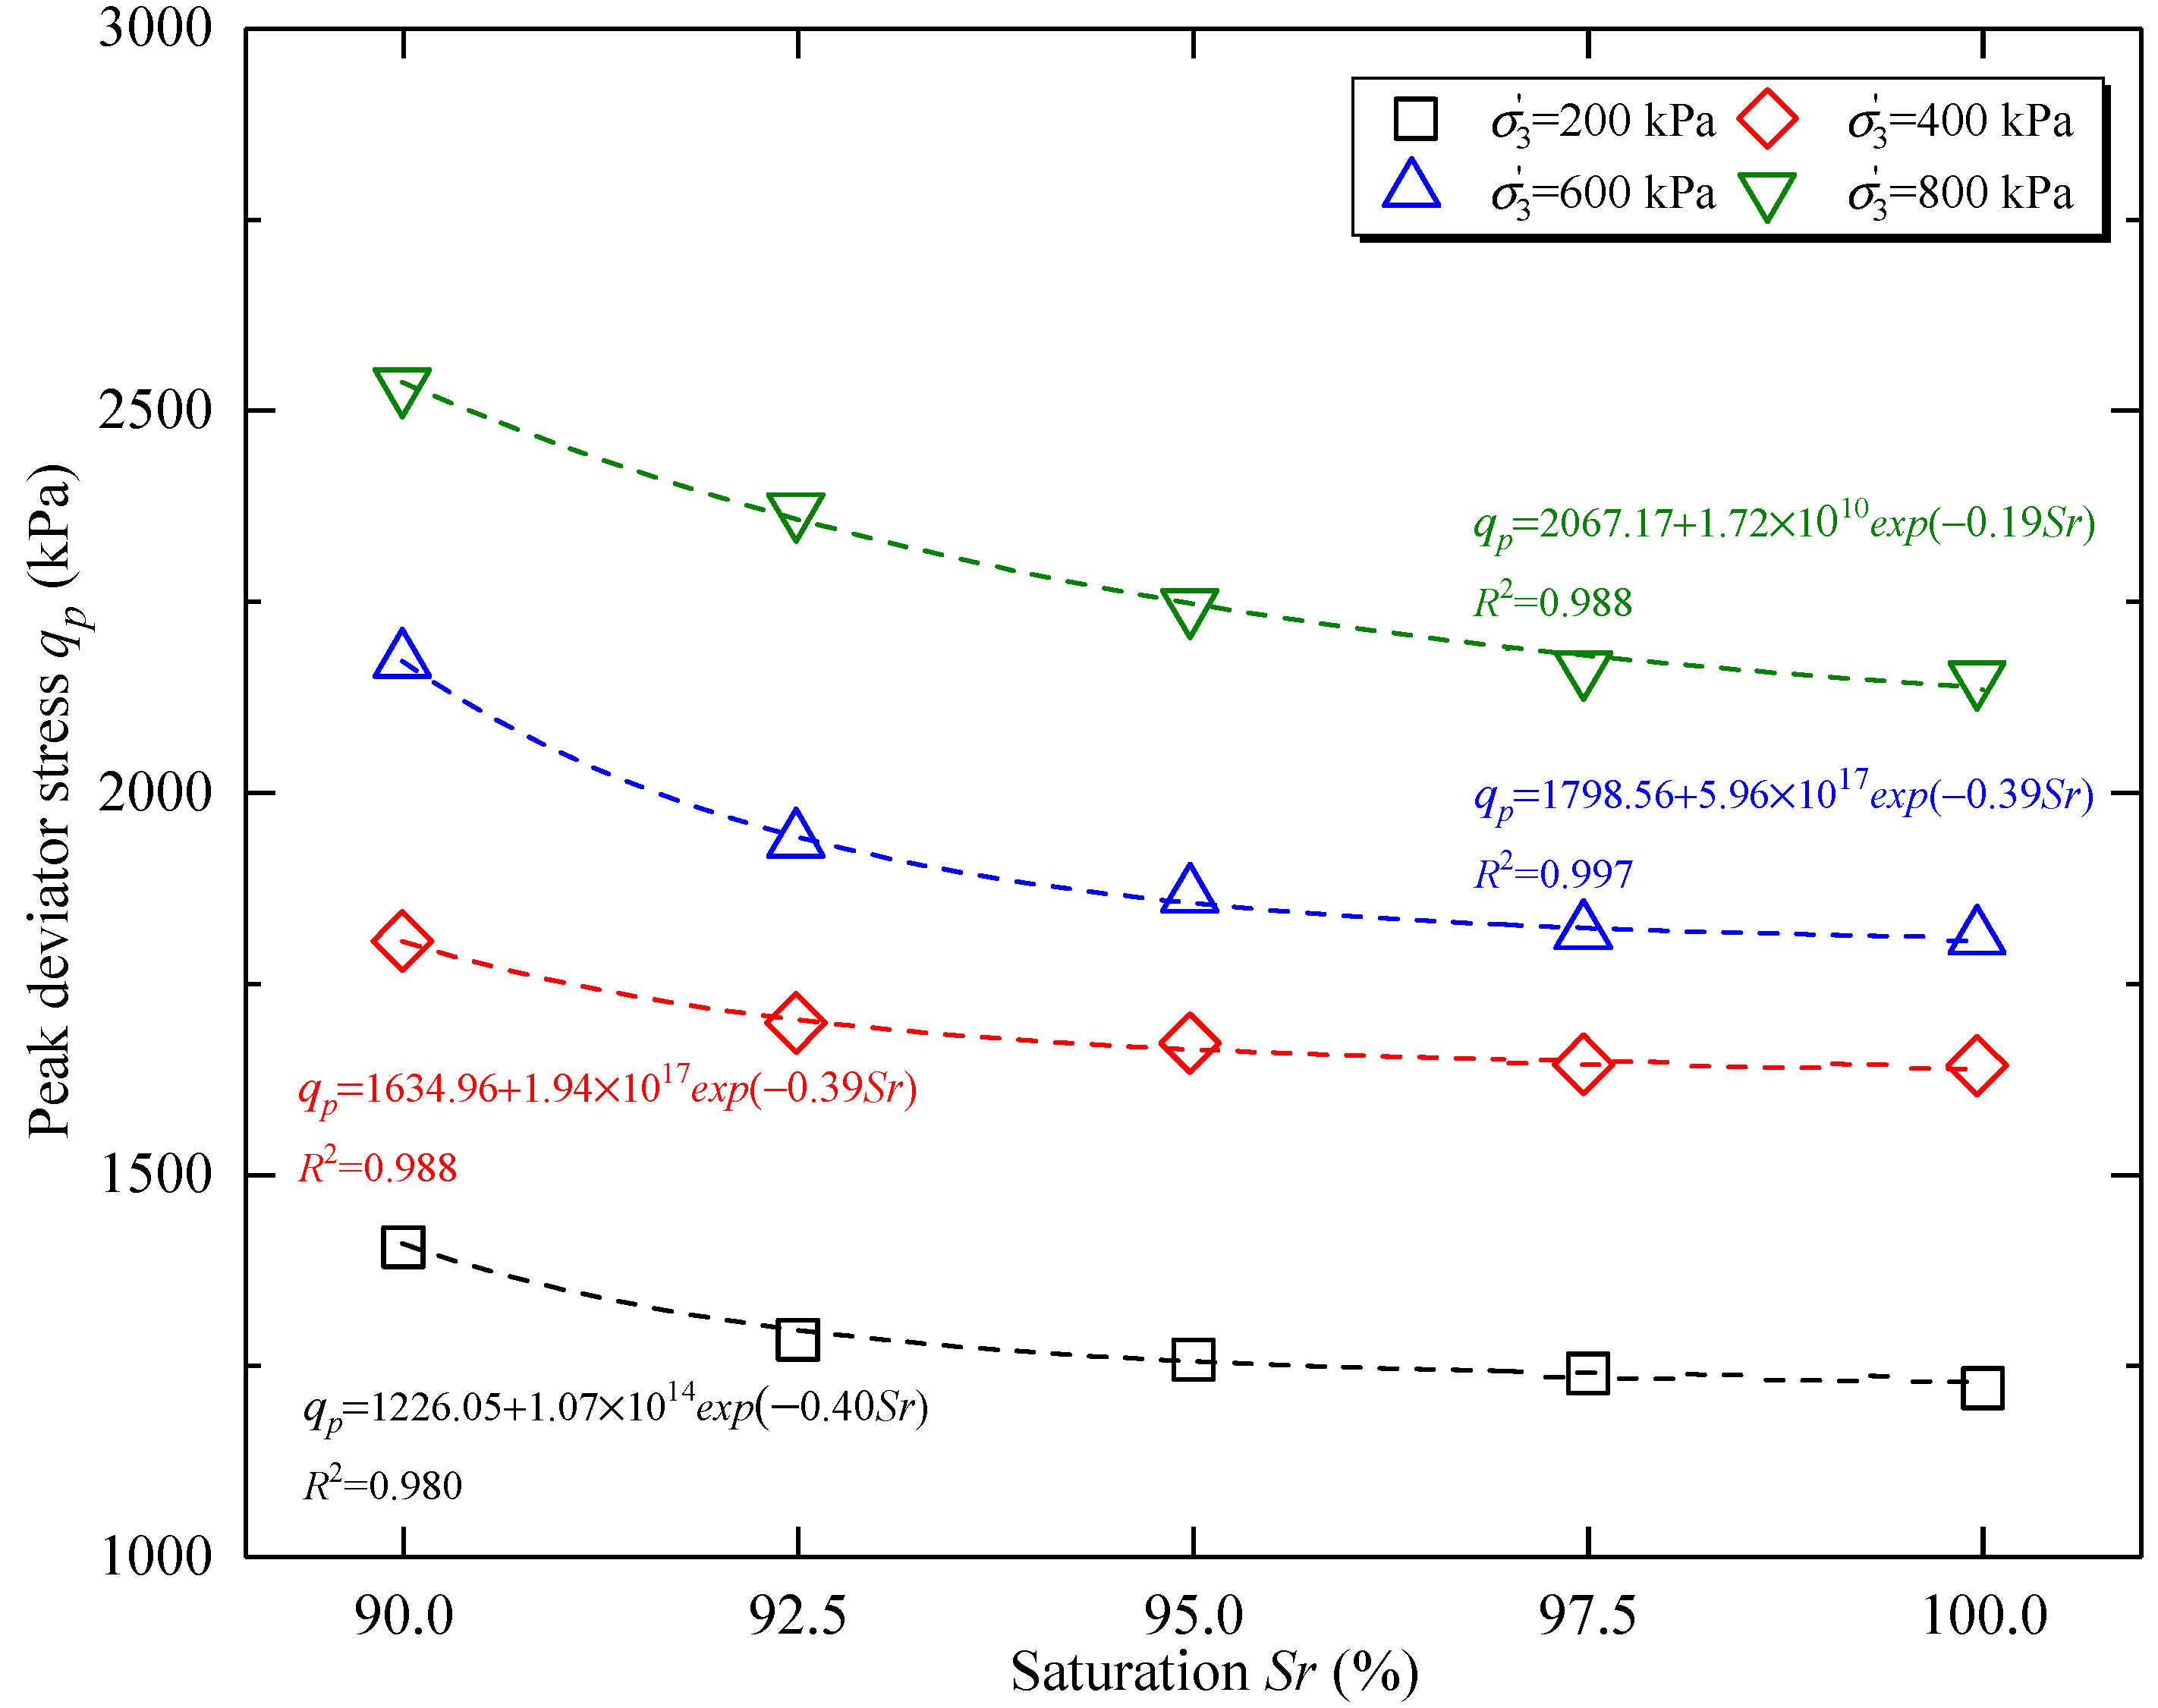
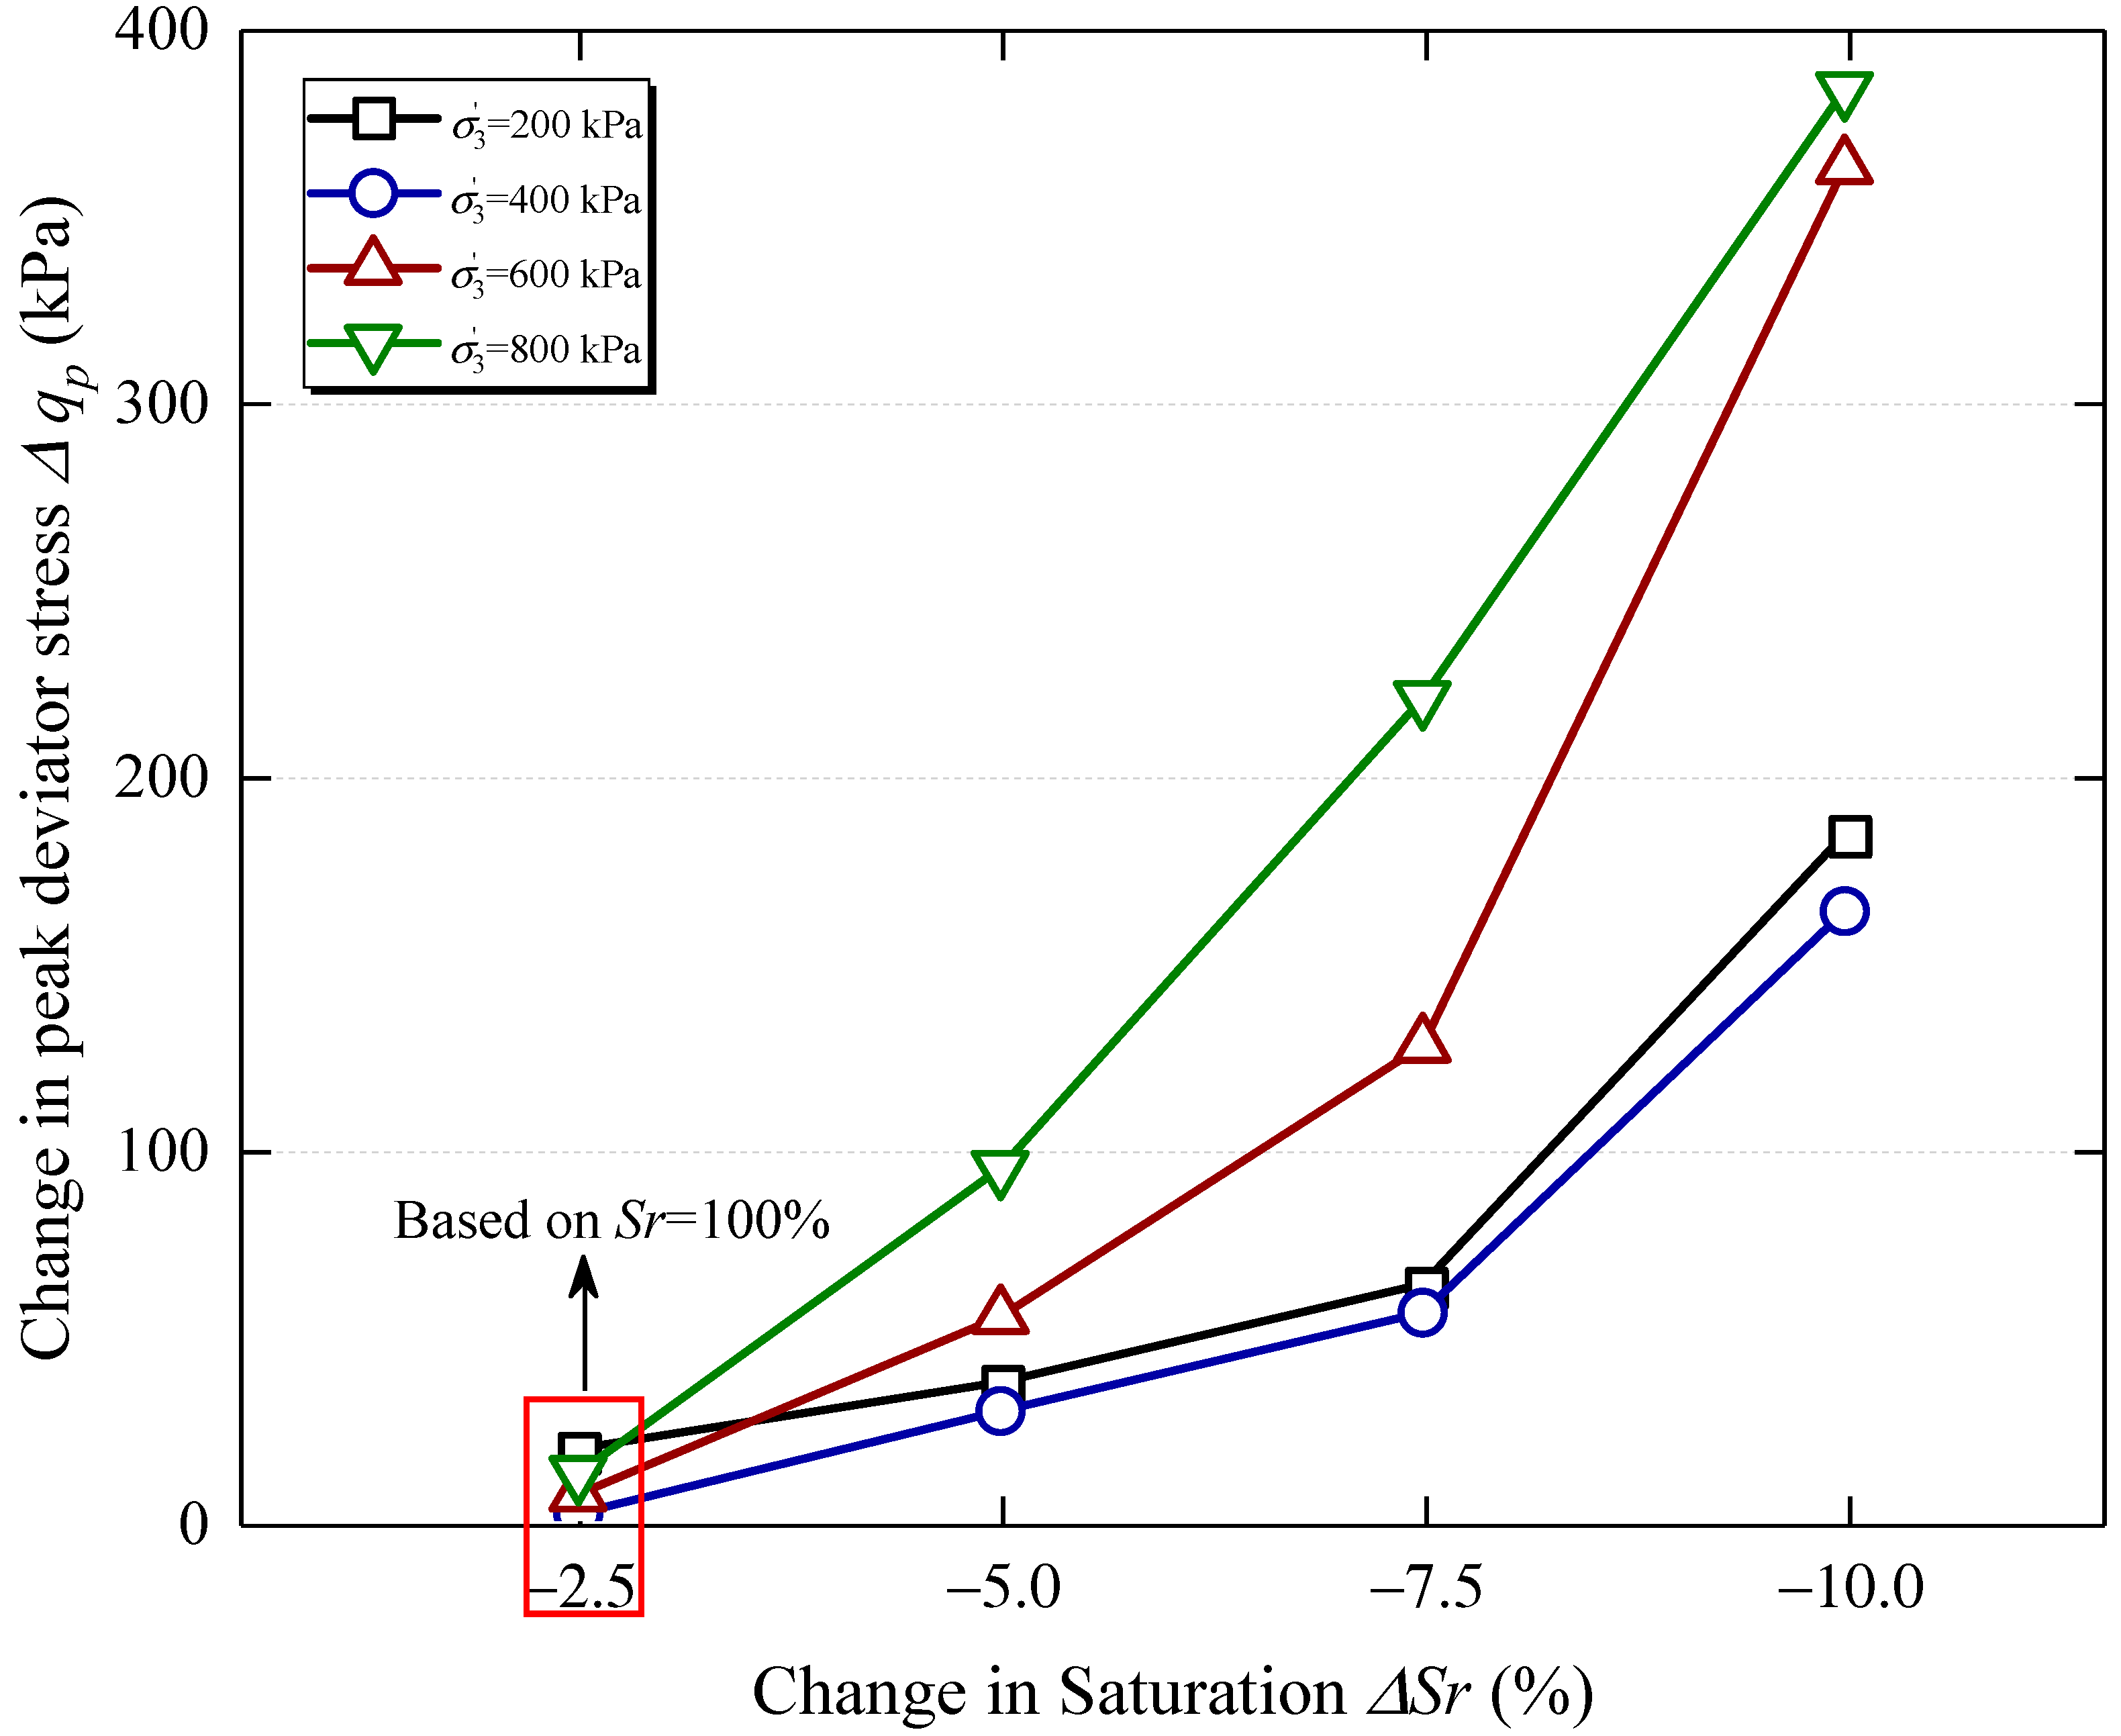
3.4. Shear Strength
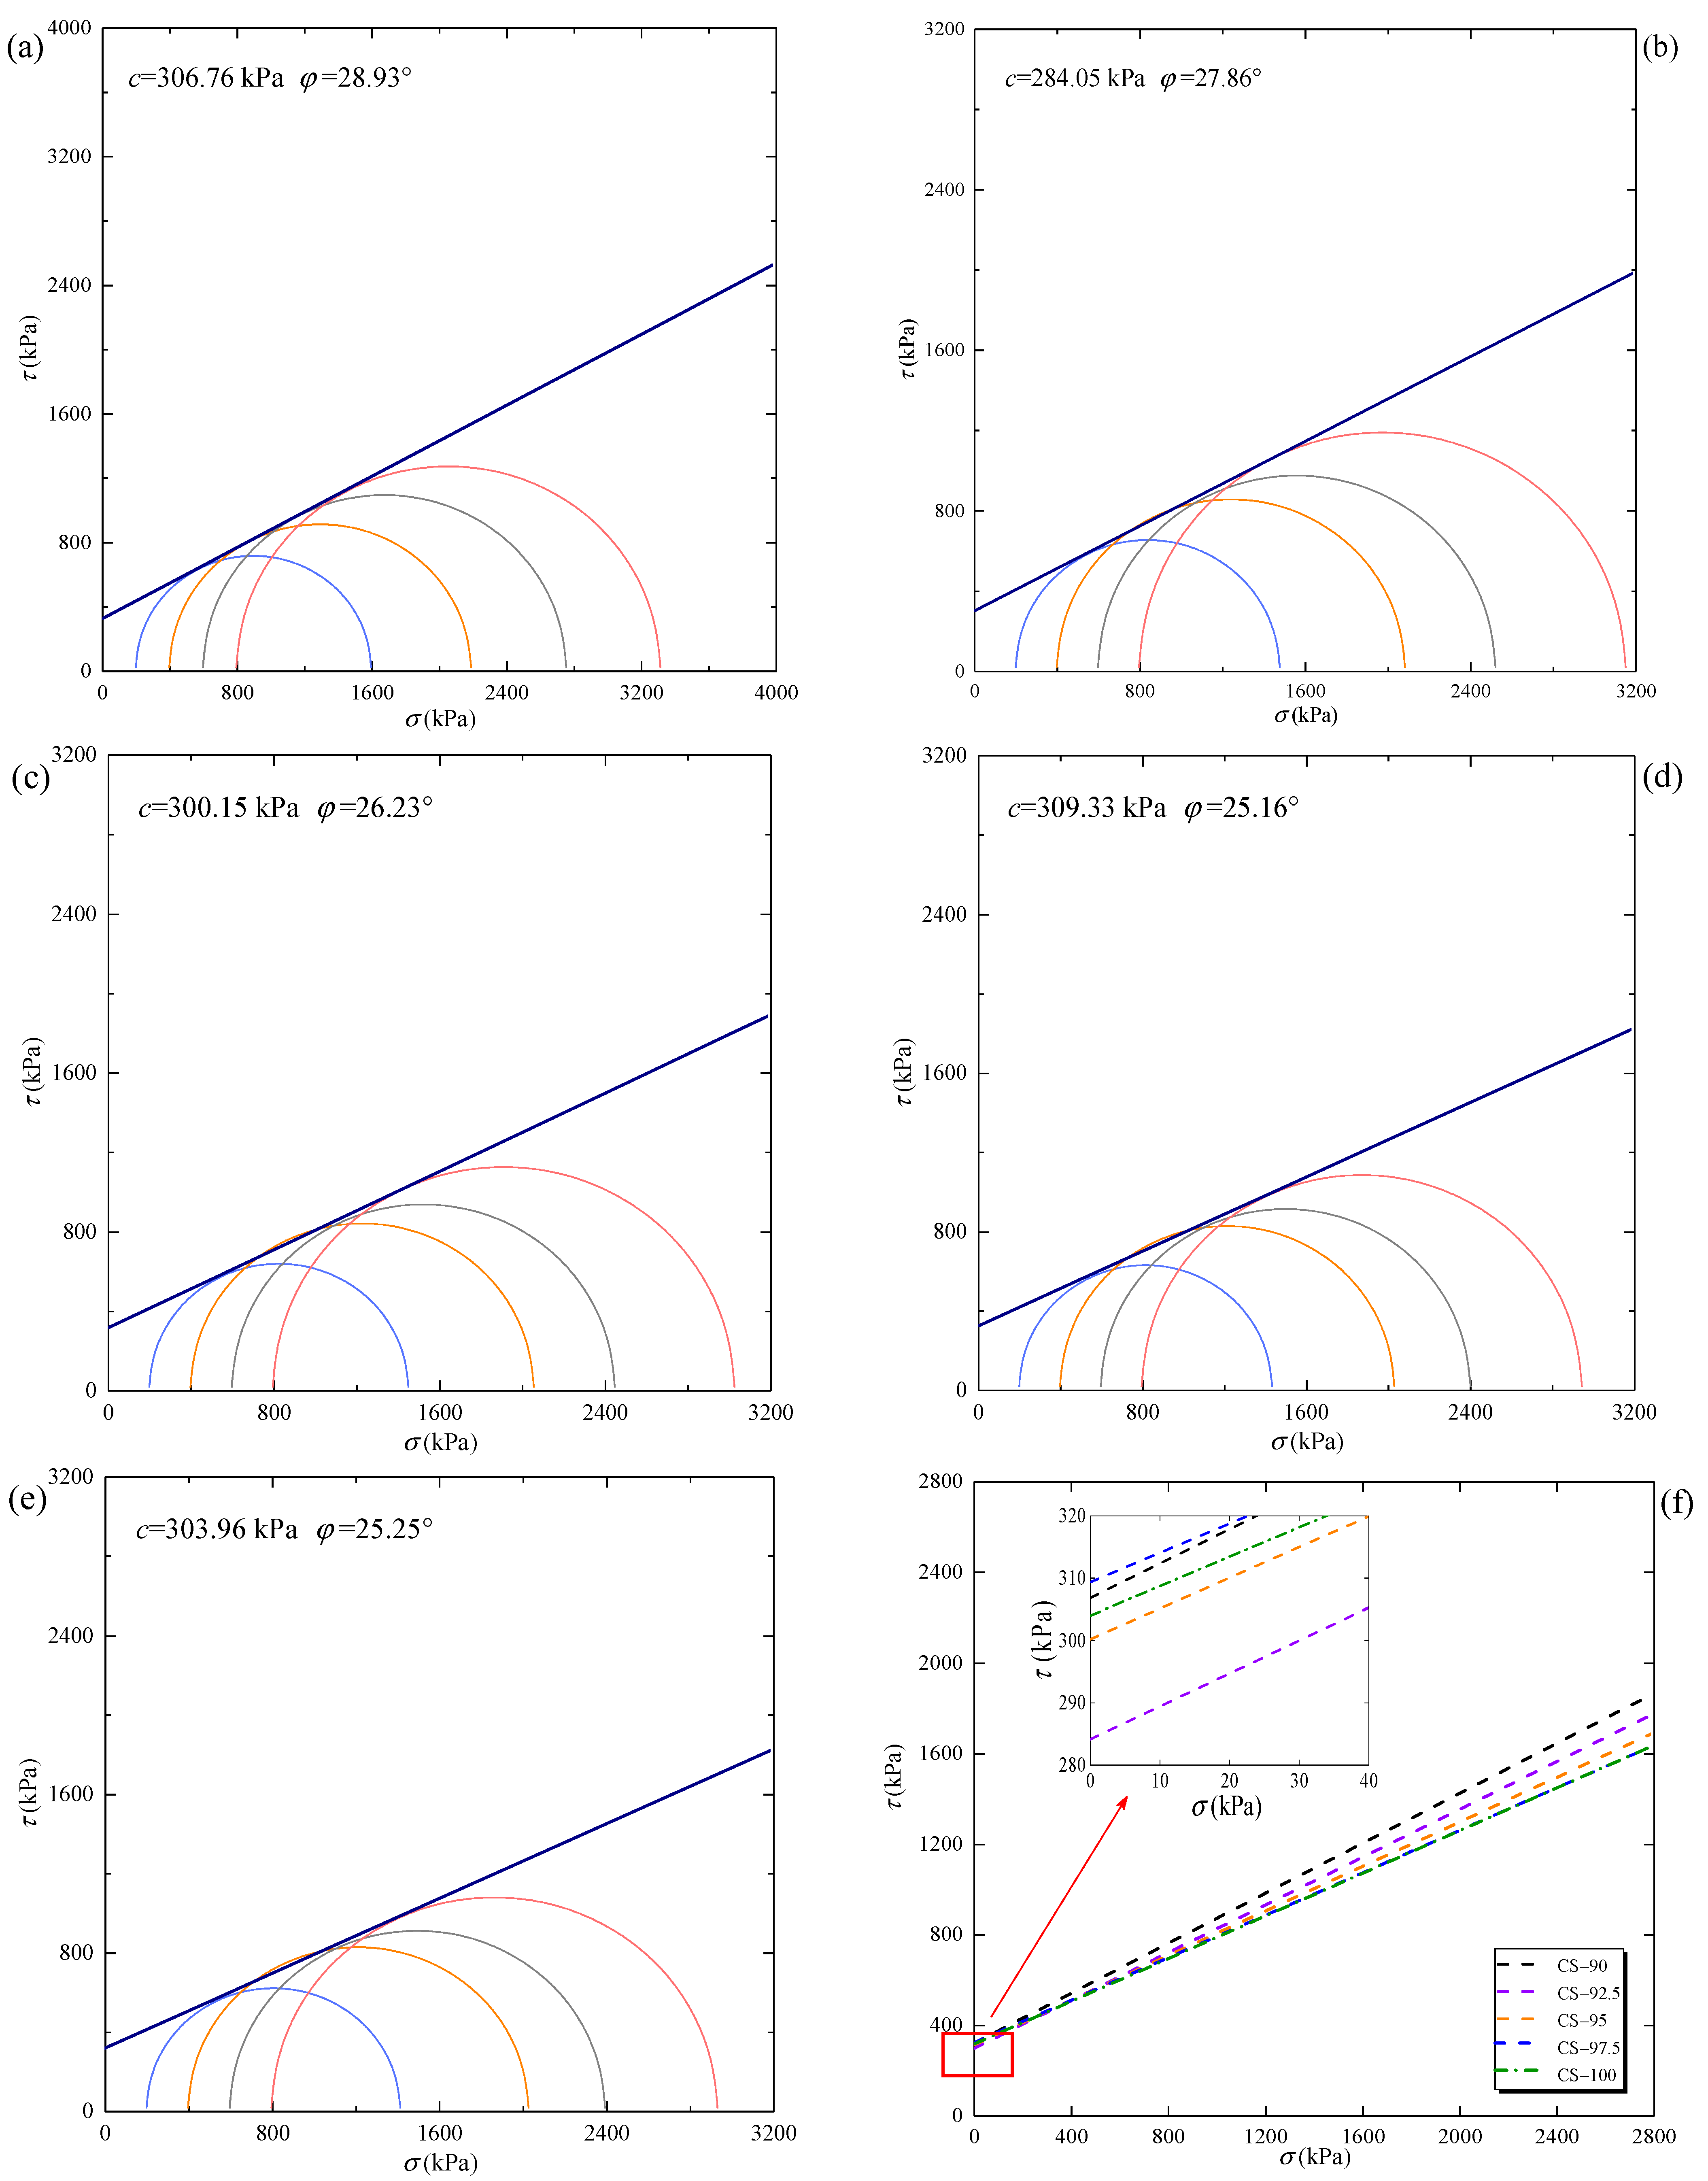
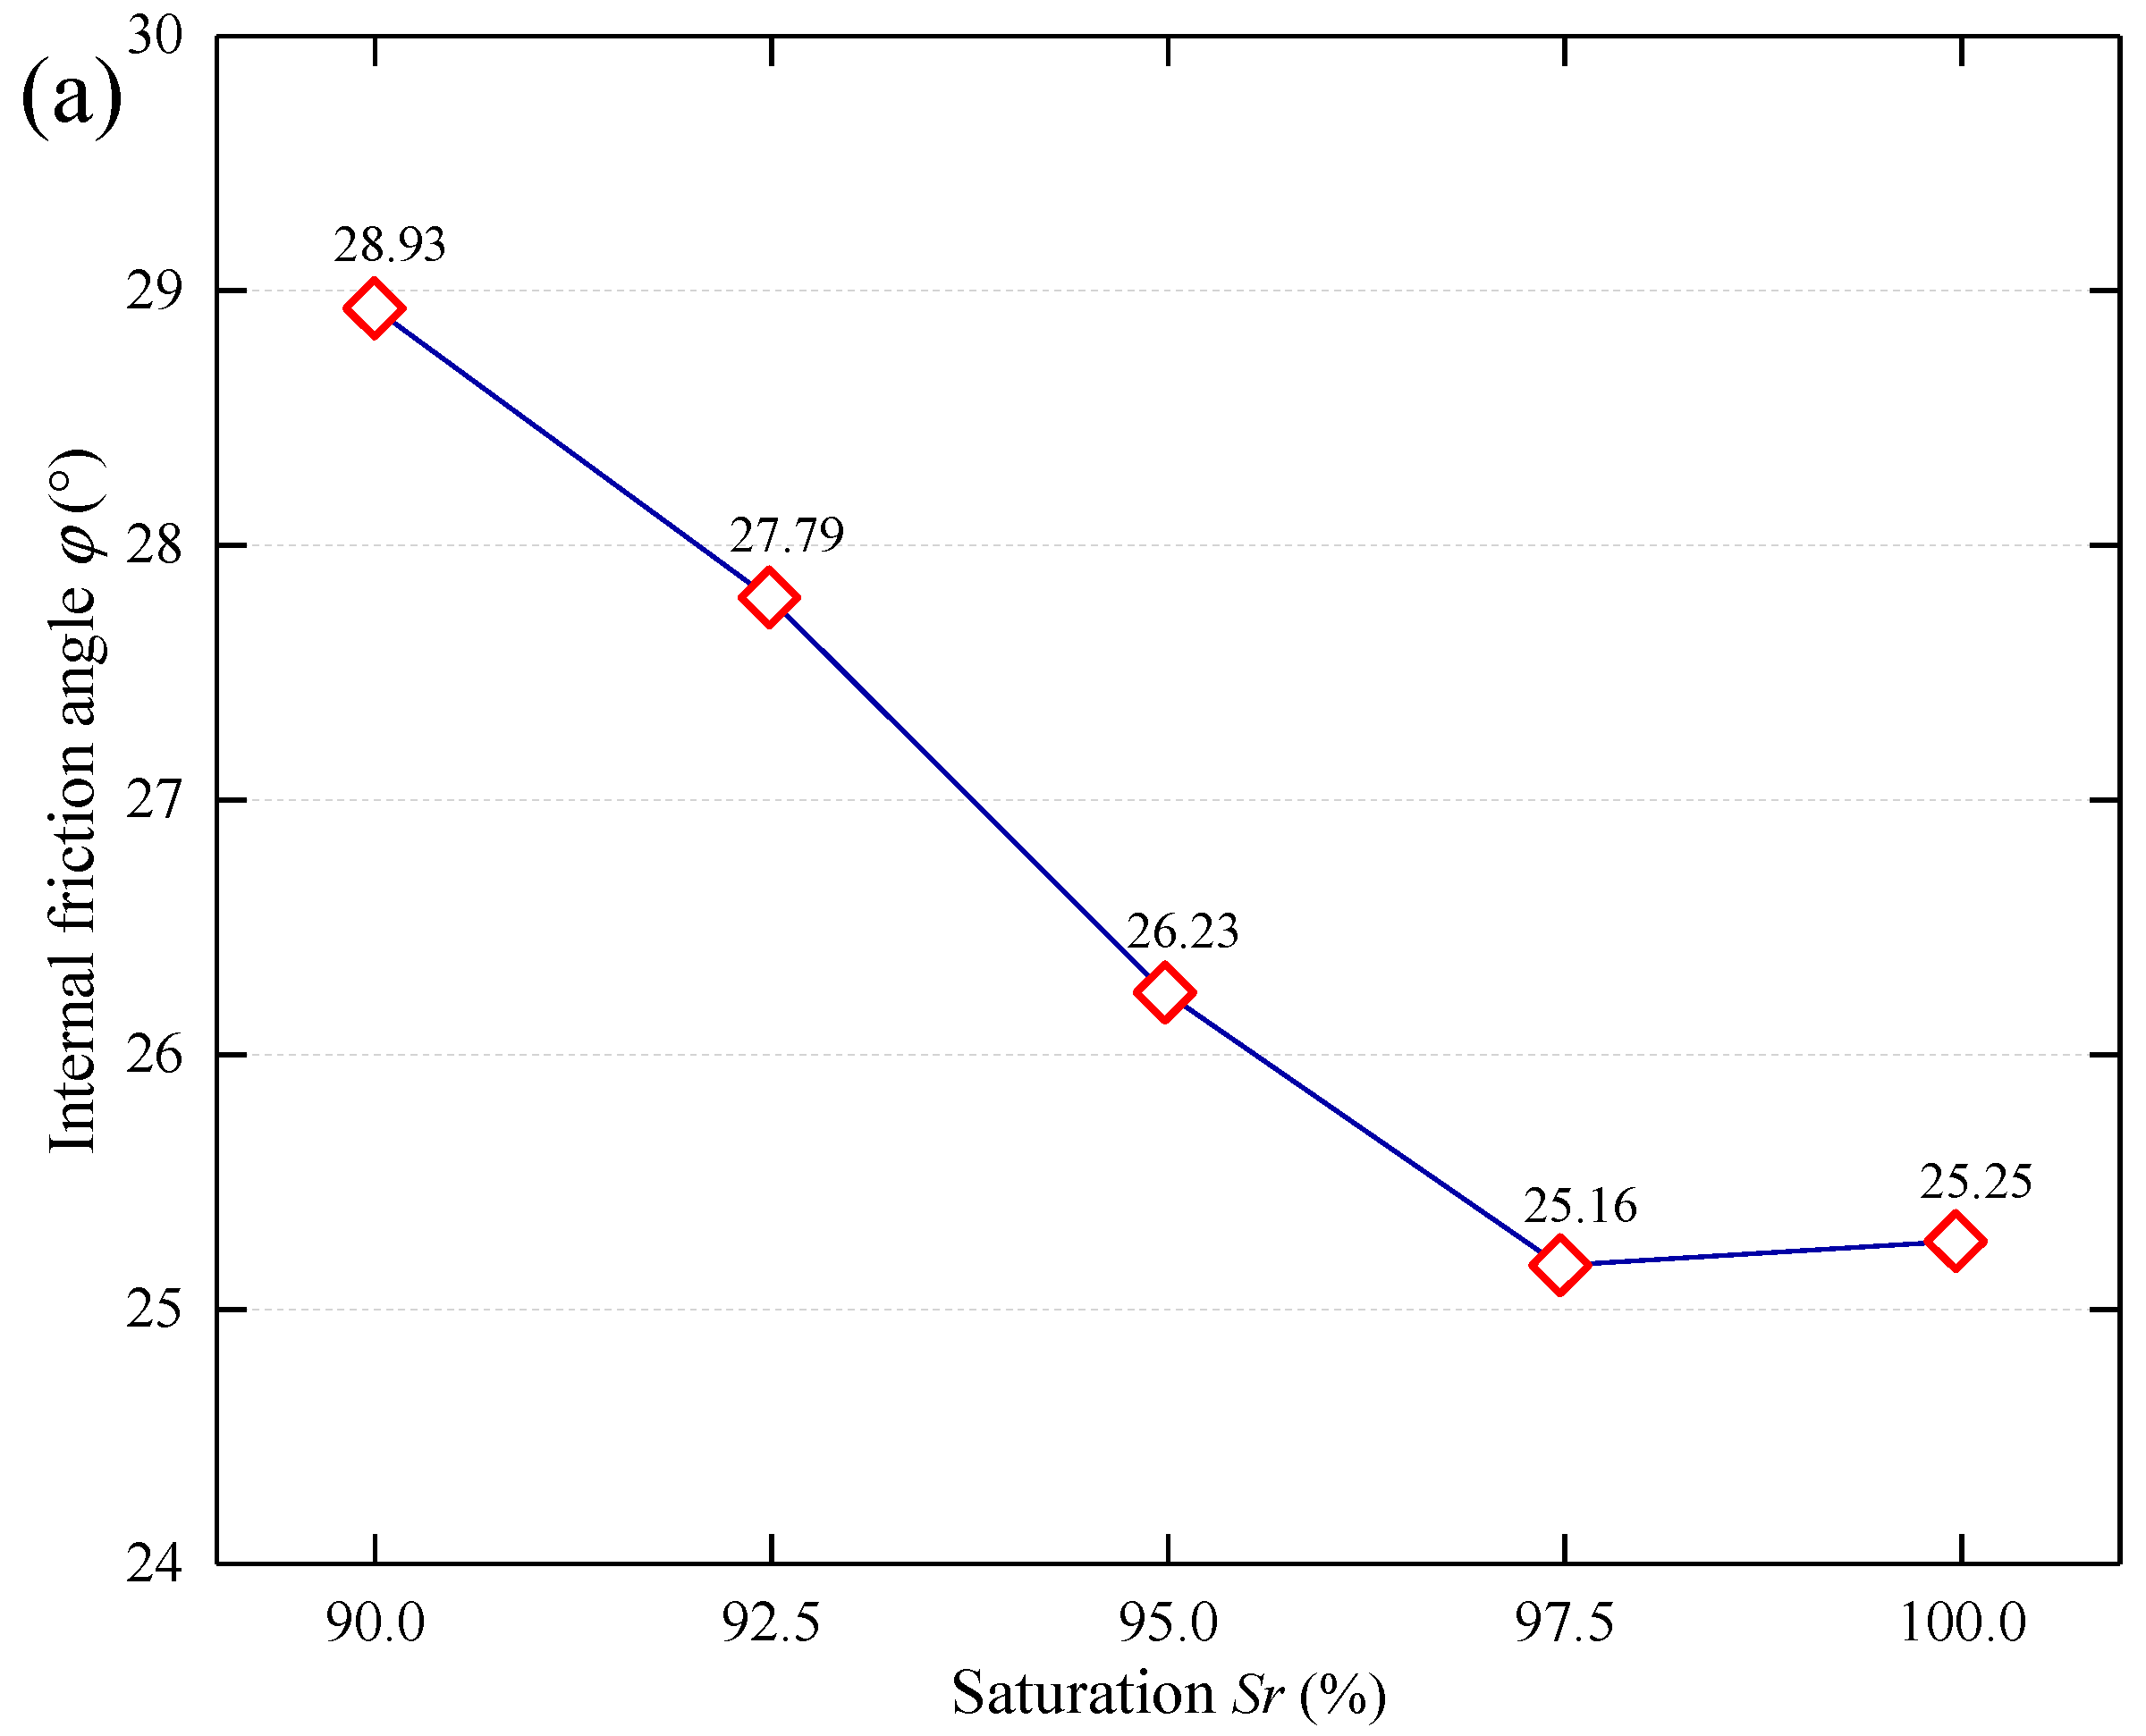
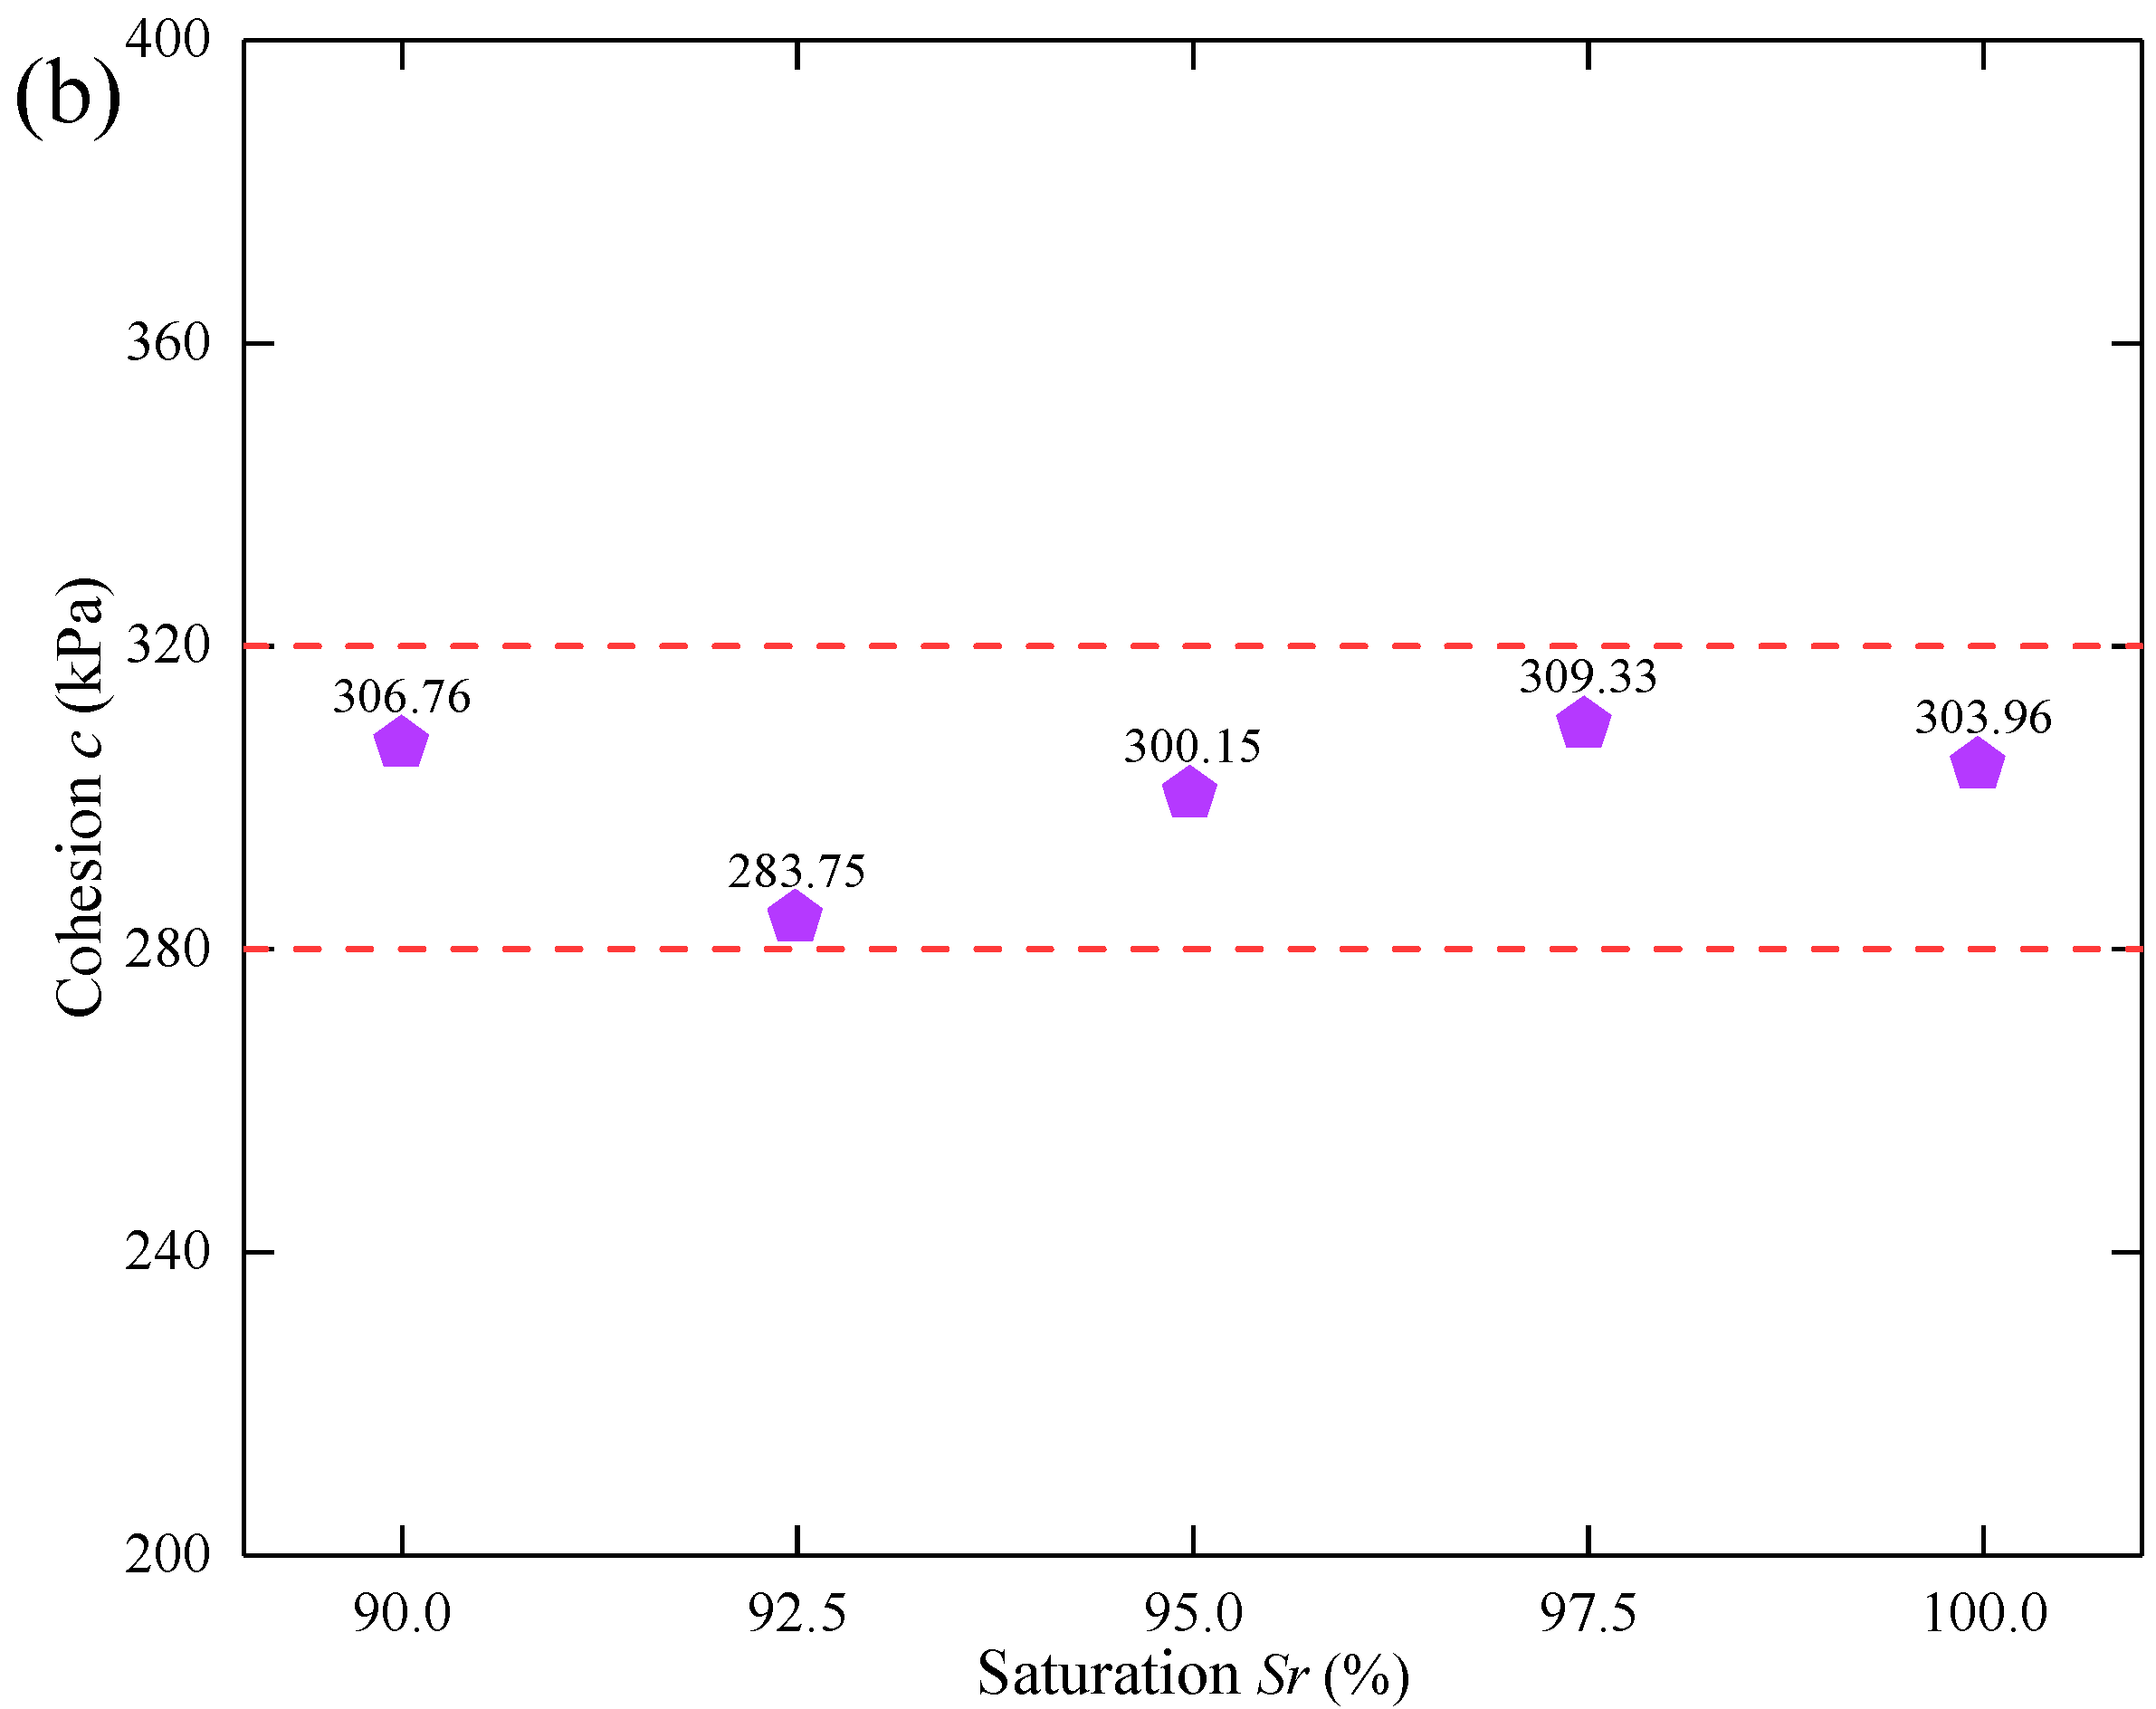
3.5. Shear Strength Parameter
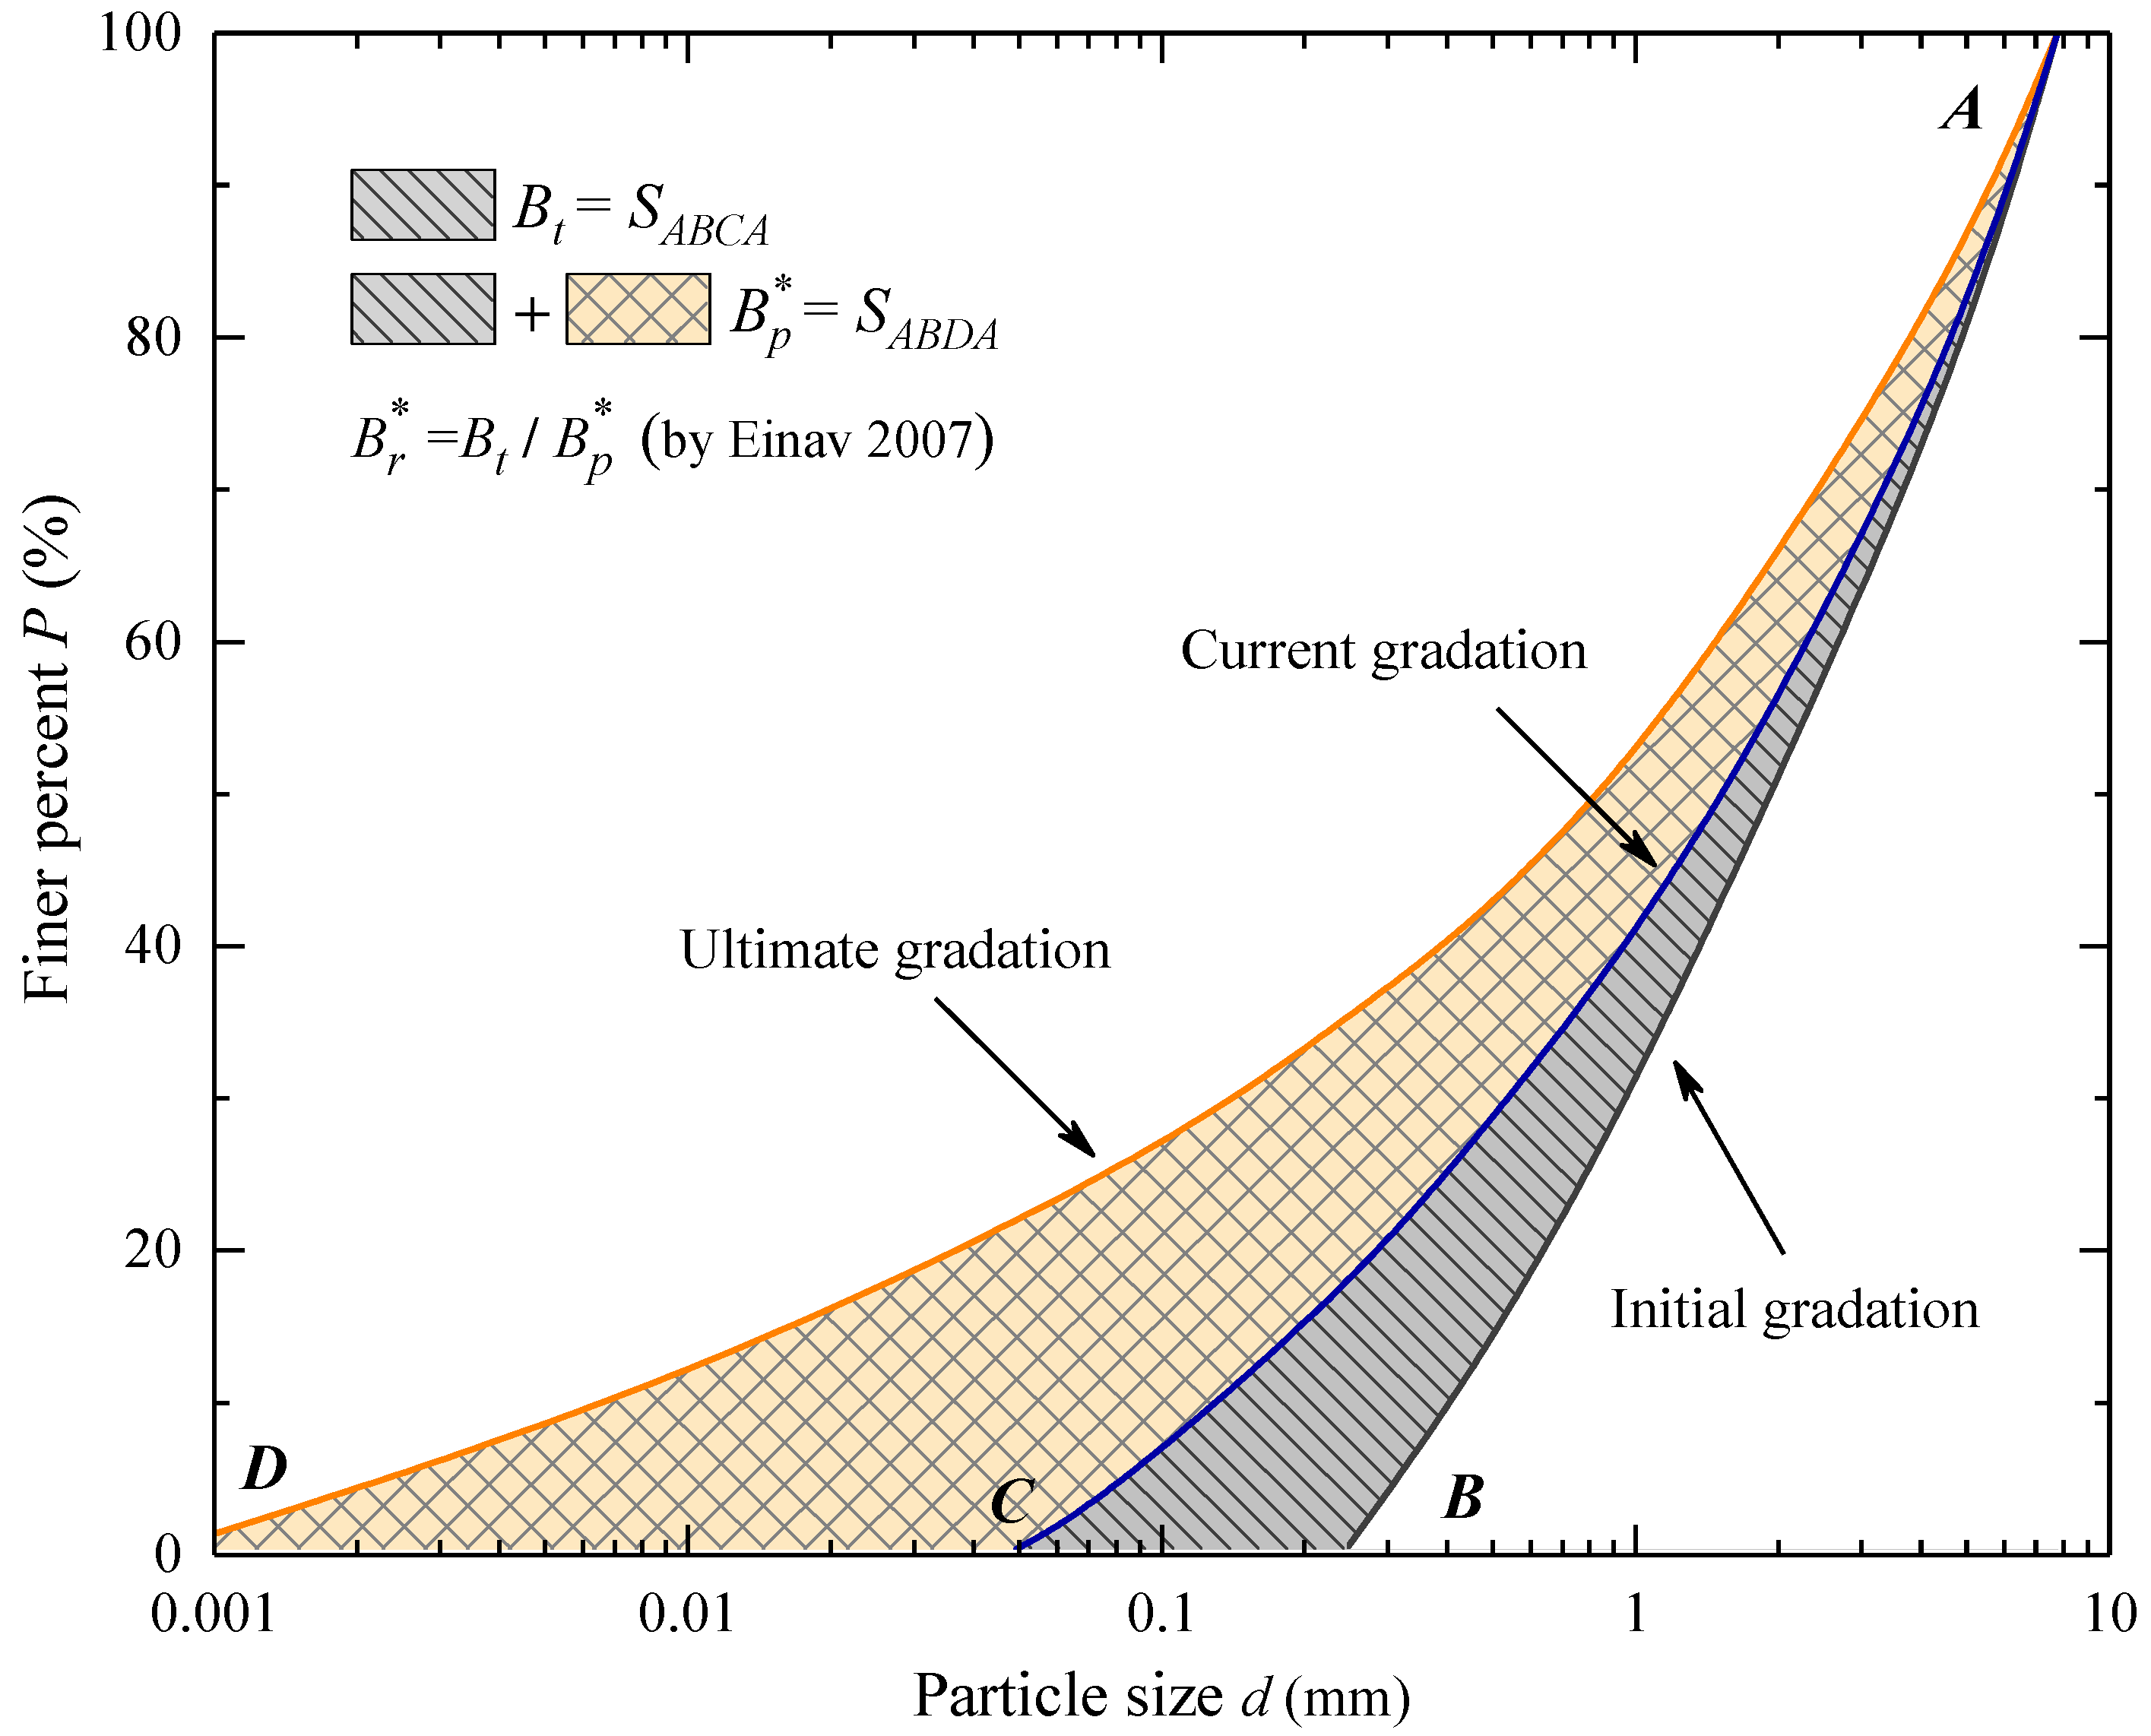
4. Particle Breakage Analysis
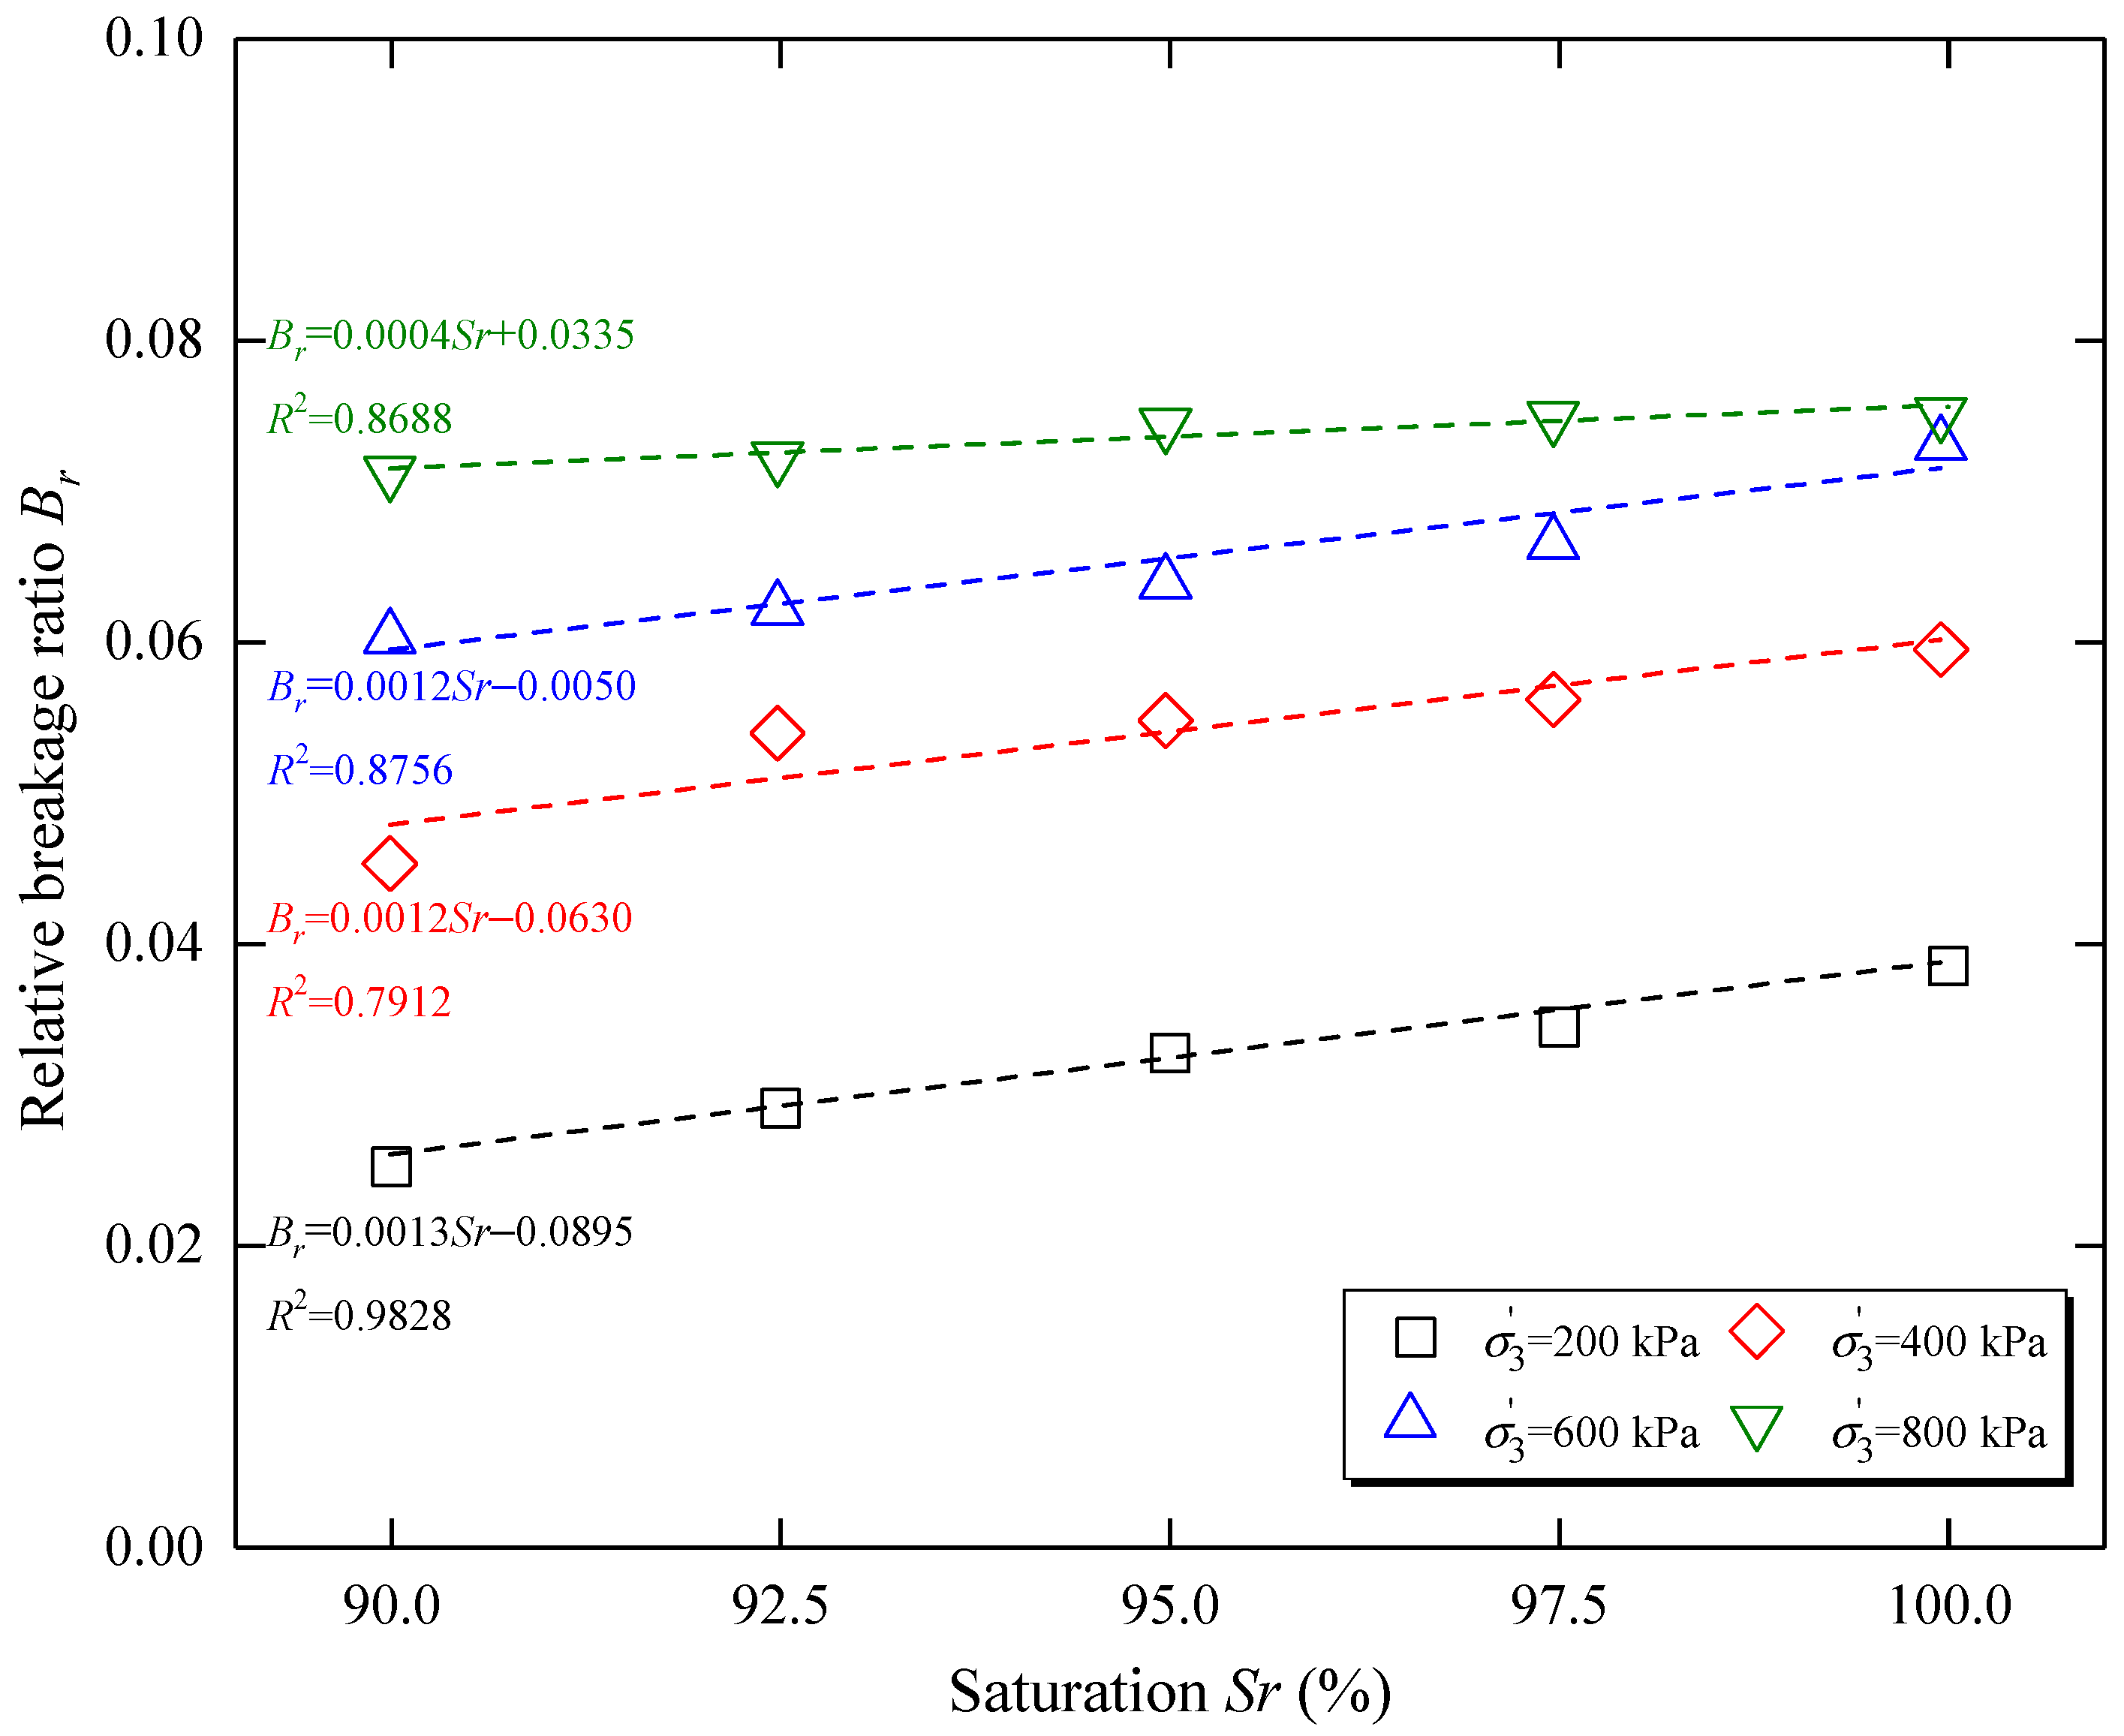
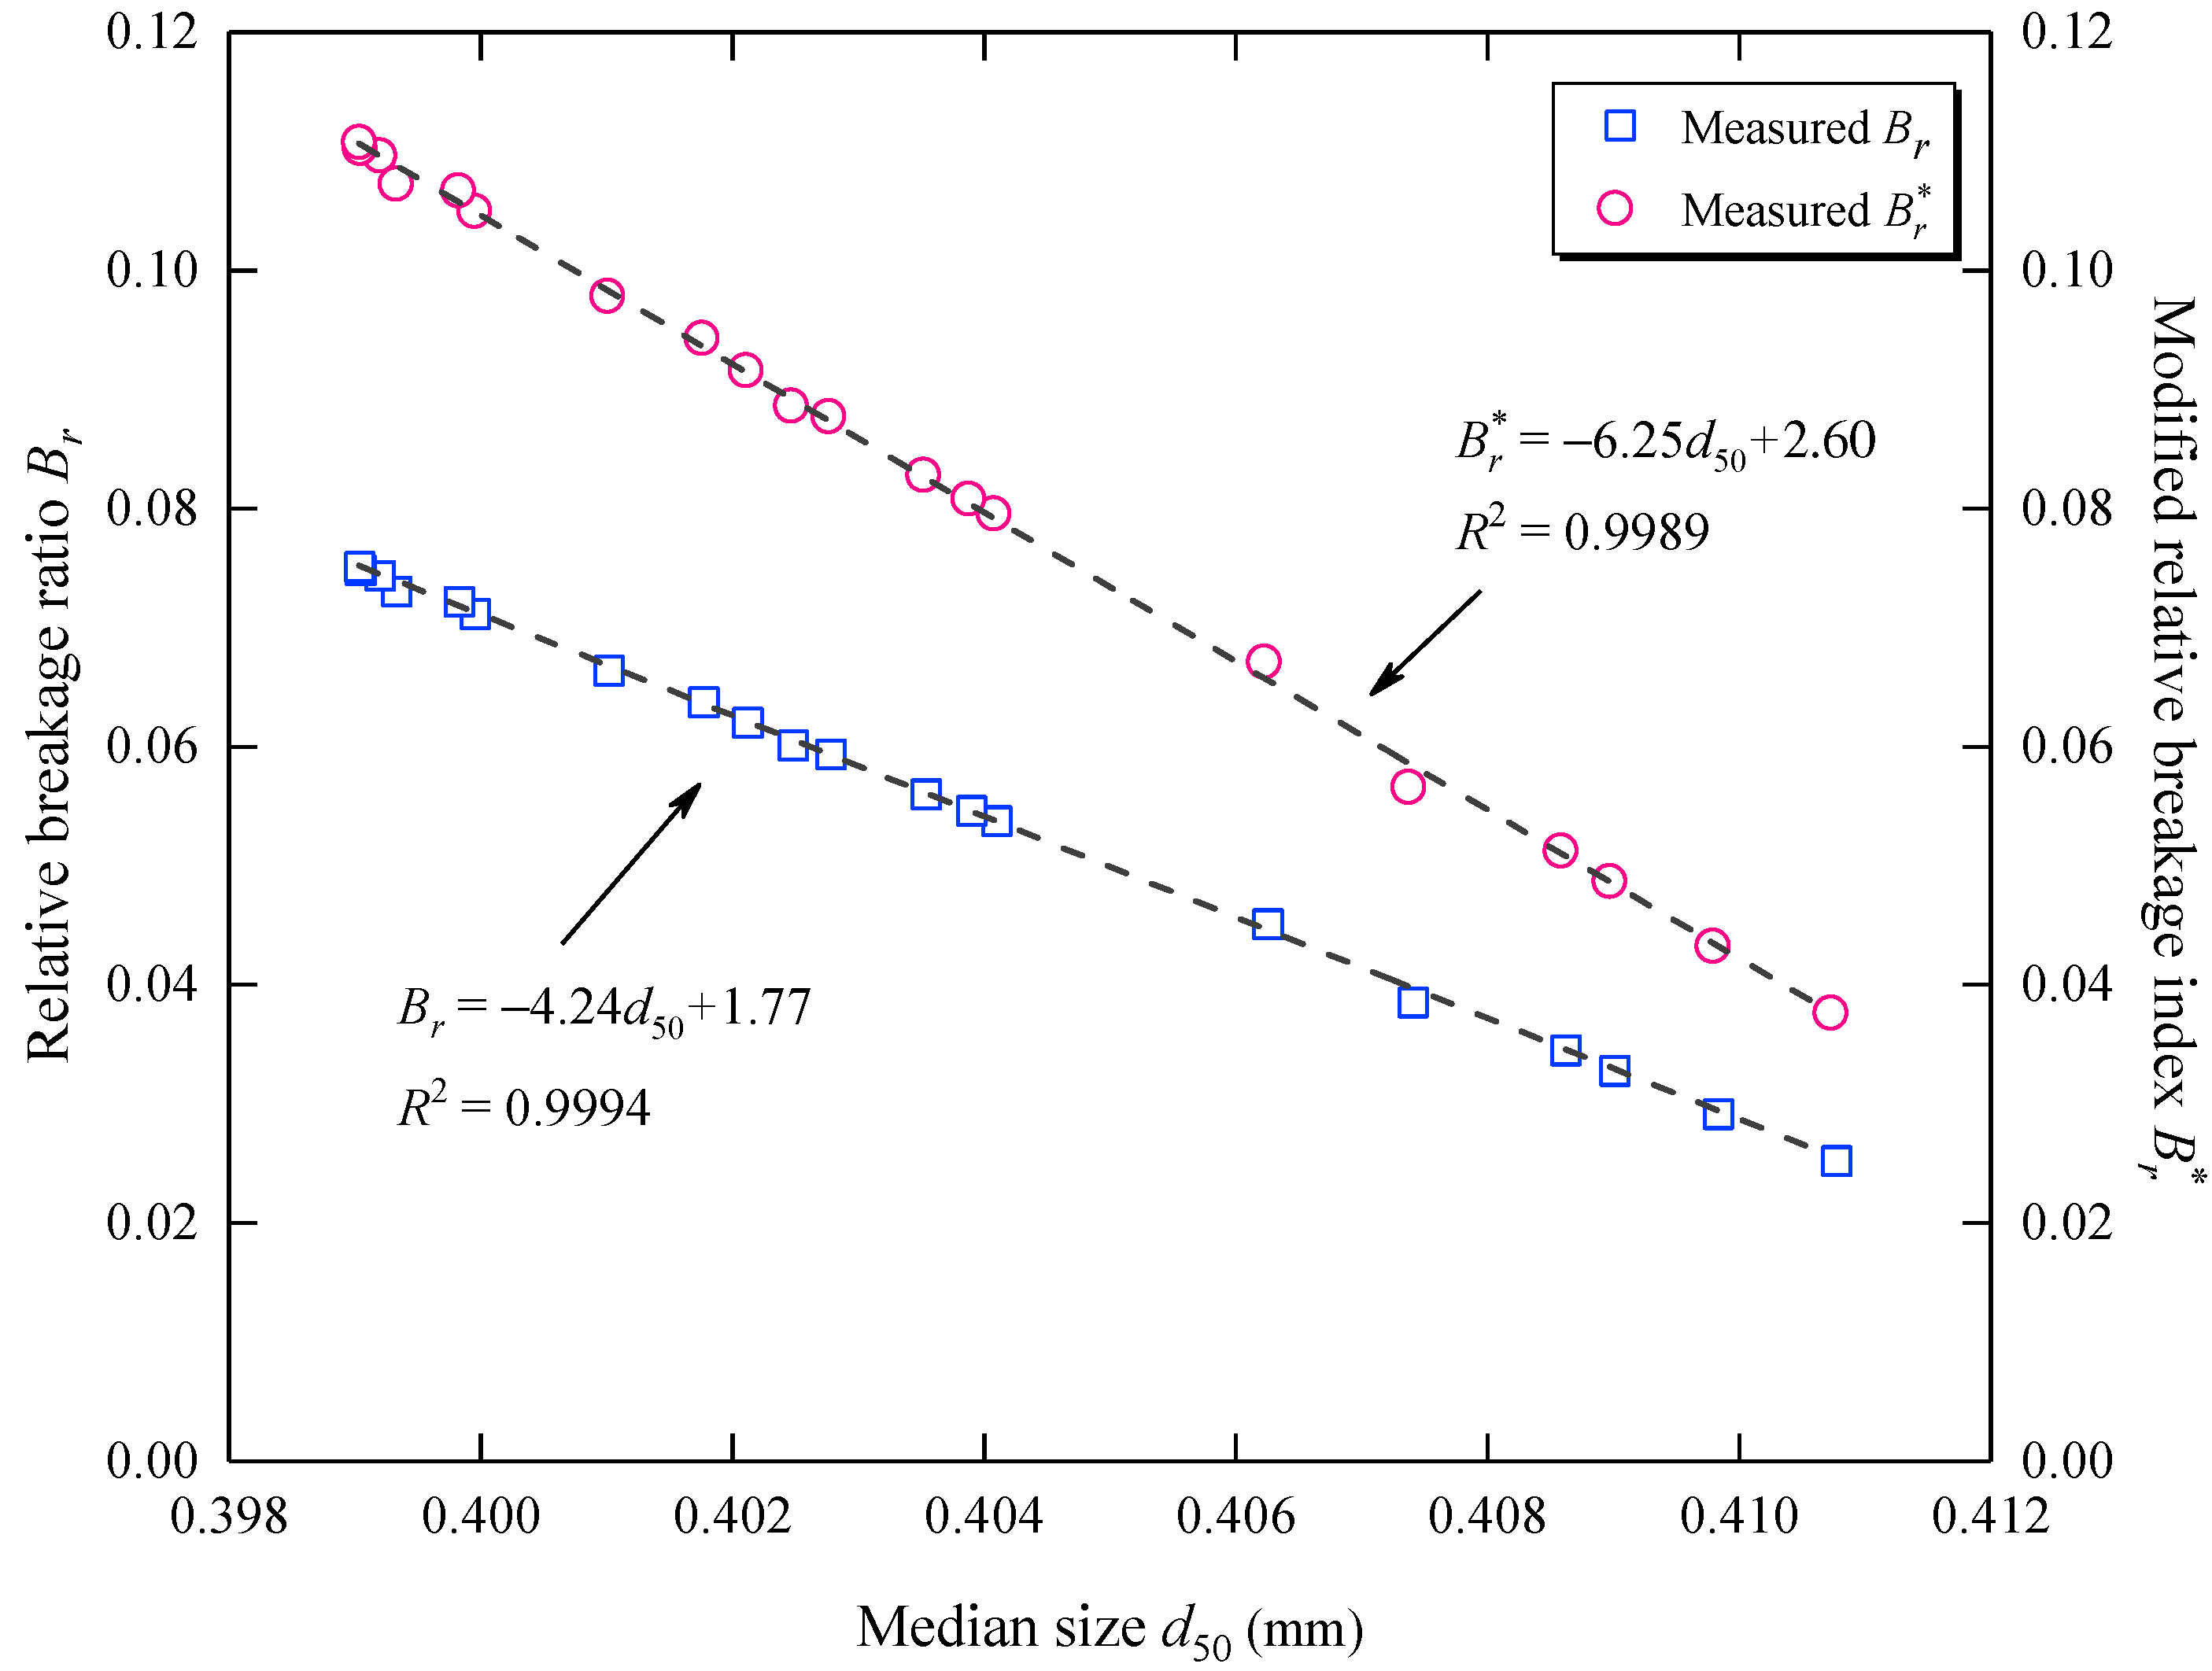
4.1. Effect of Saturation on Particle Breakage Ratio
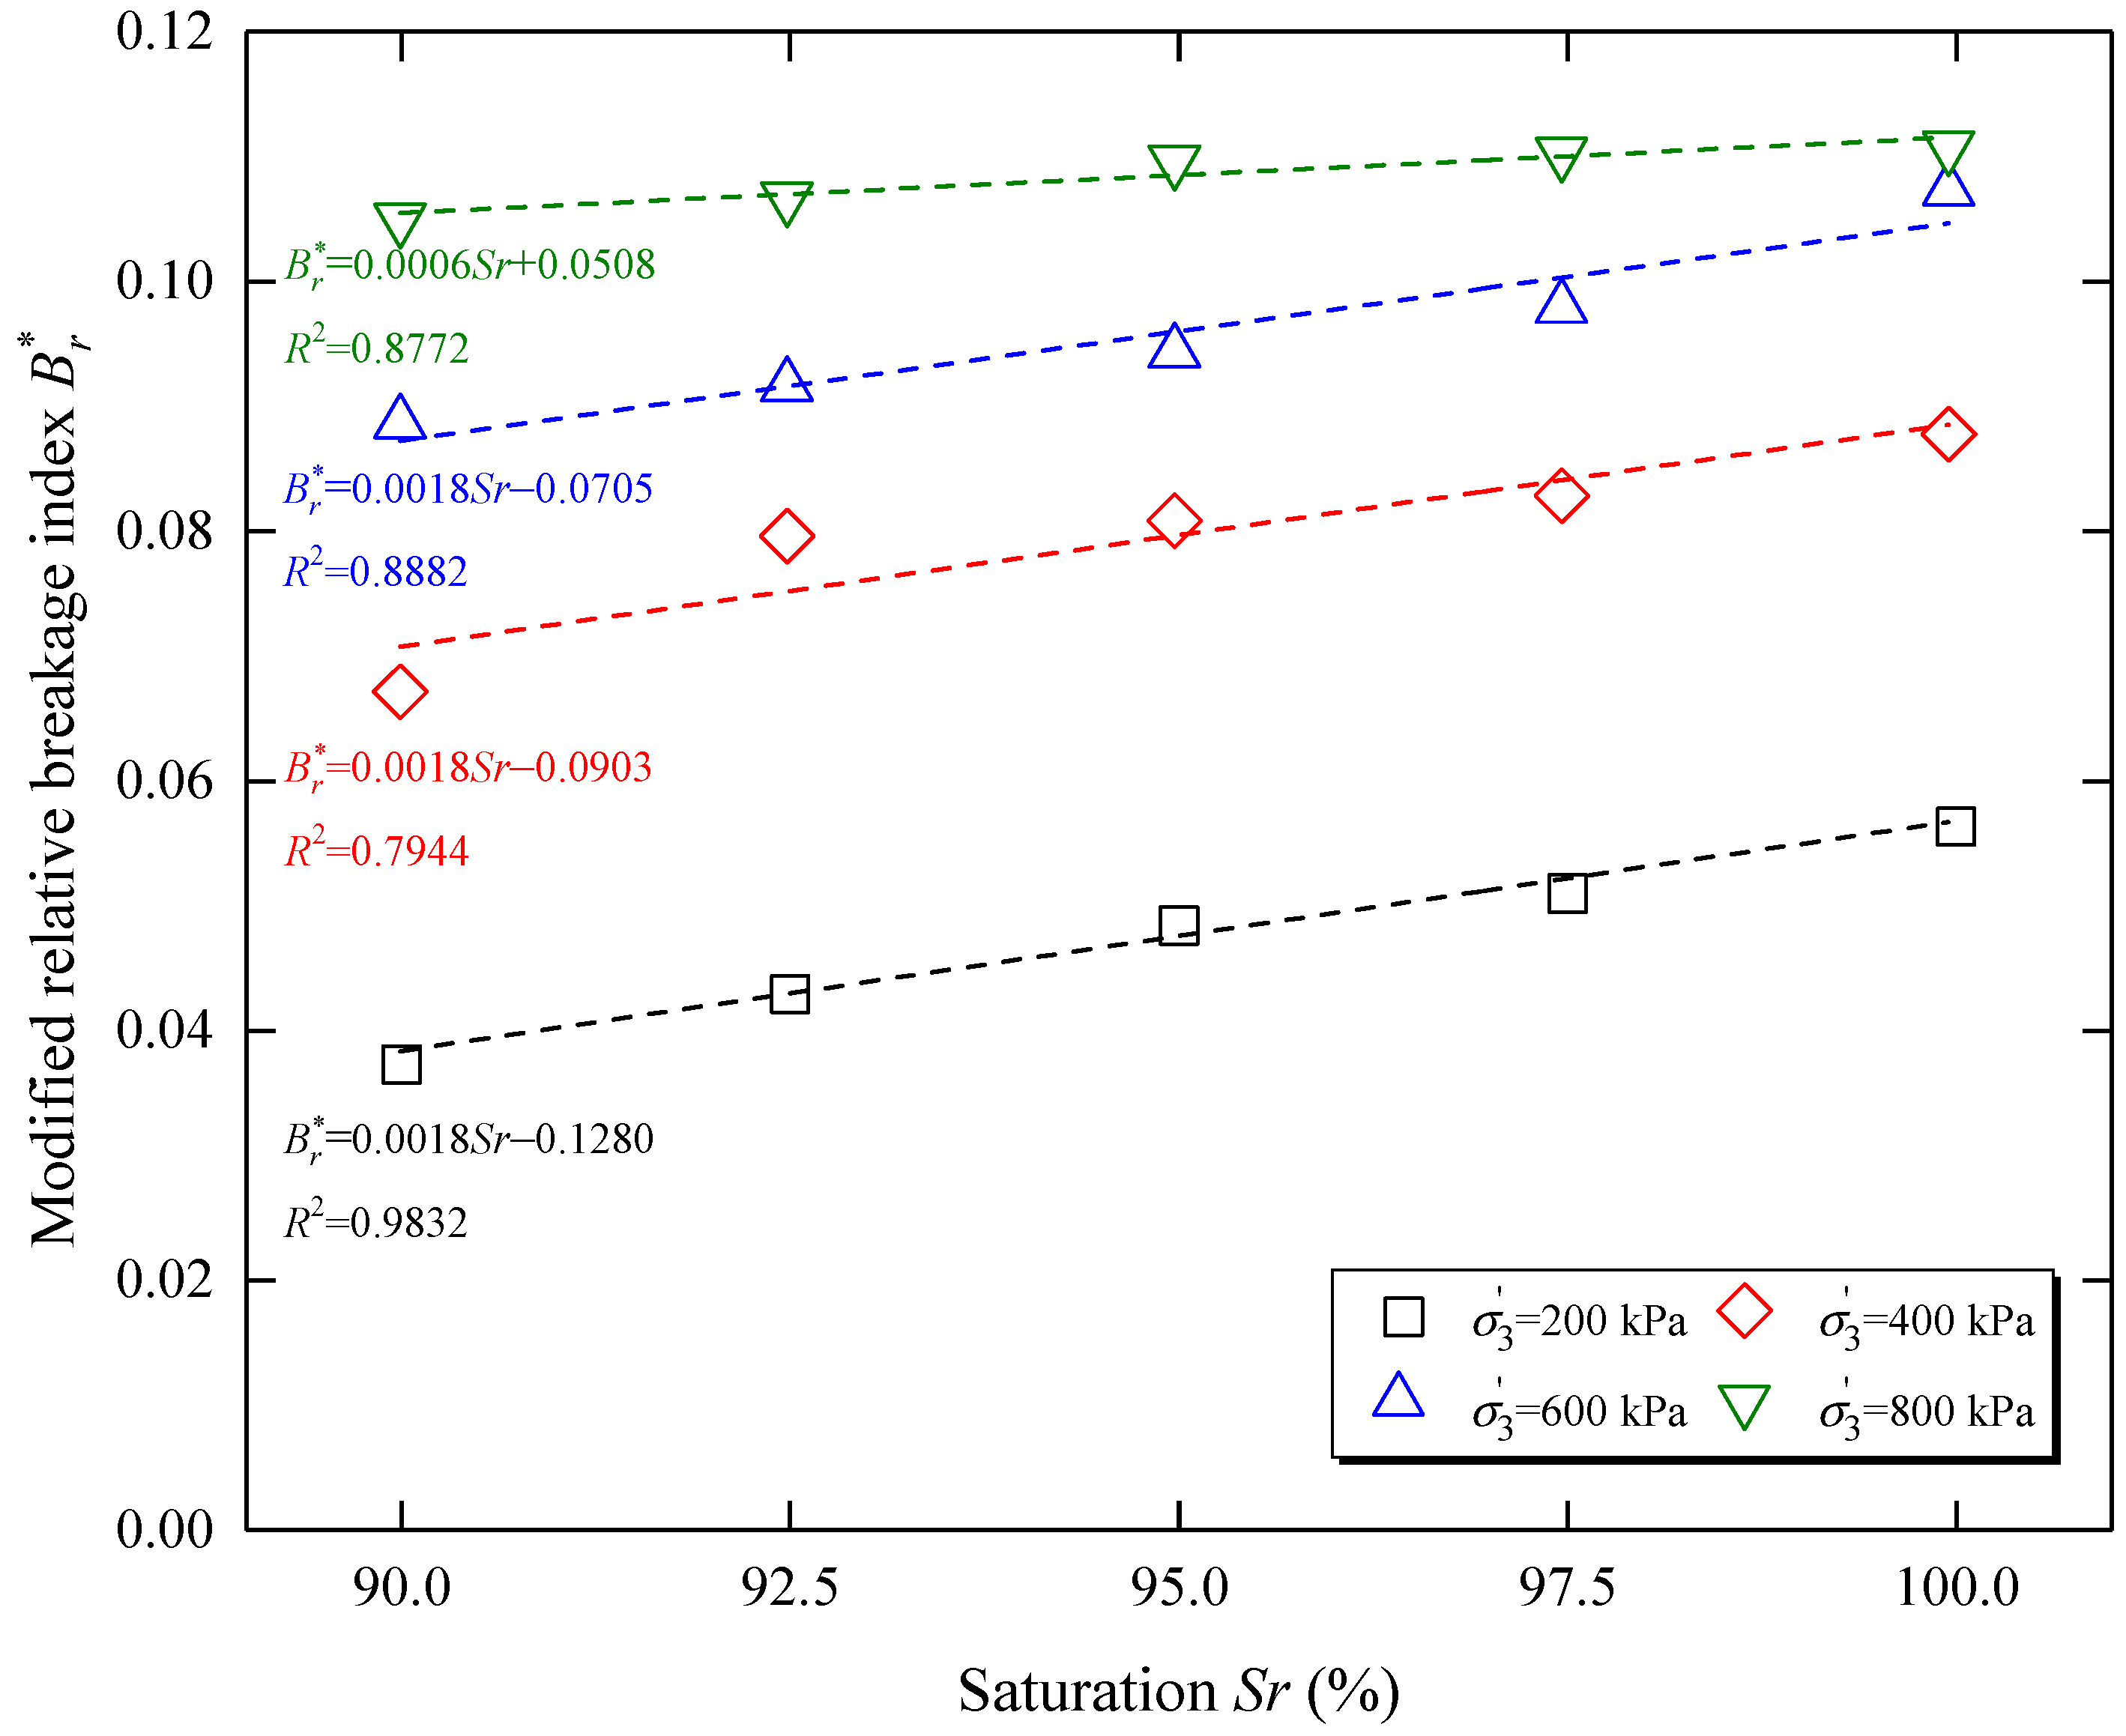
4.2. Effect of Saturation on Modified Particle Breakage Index
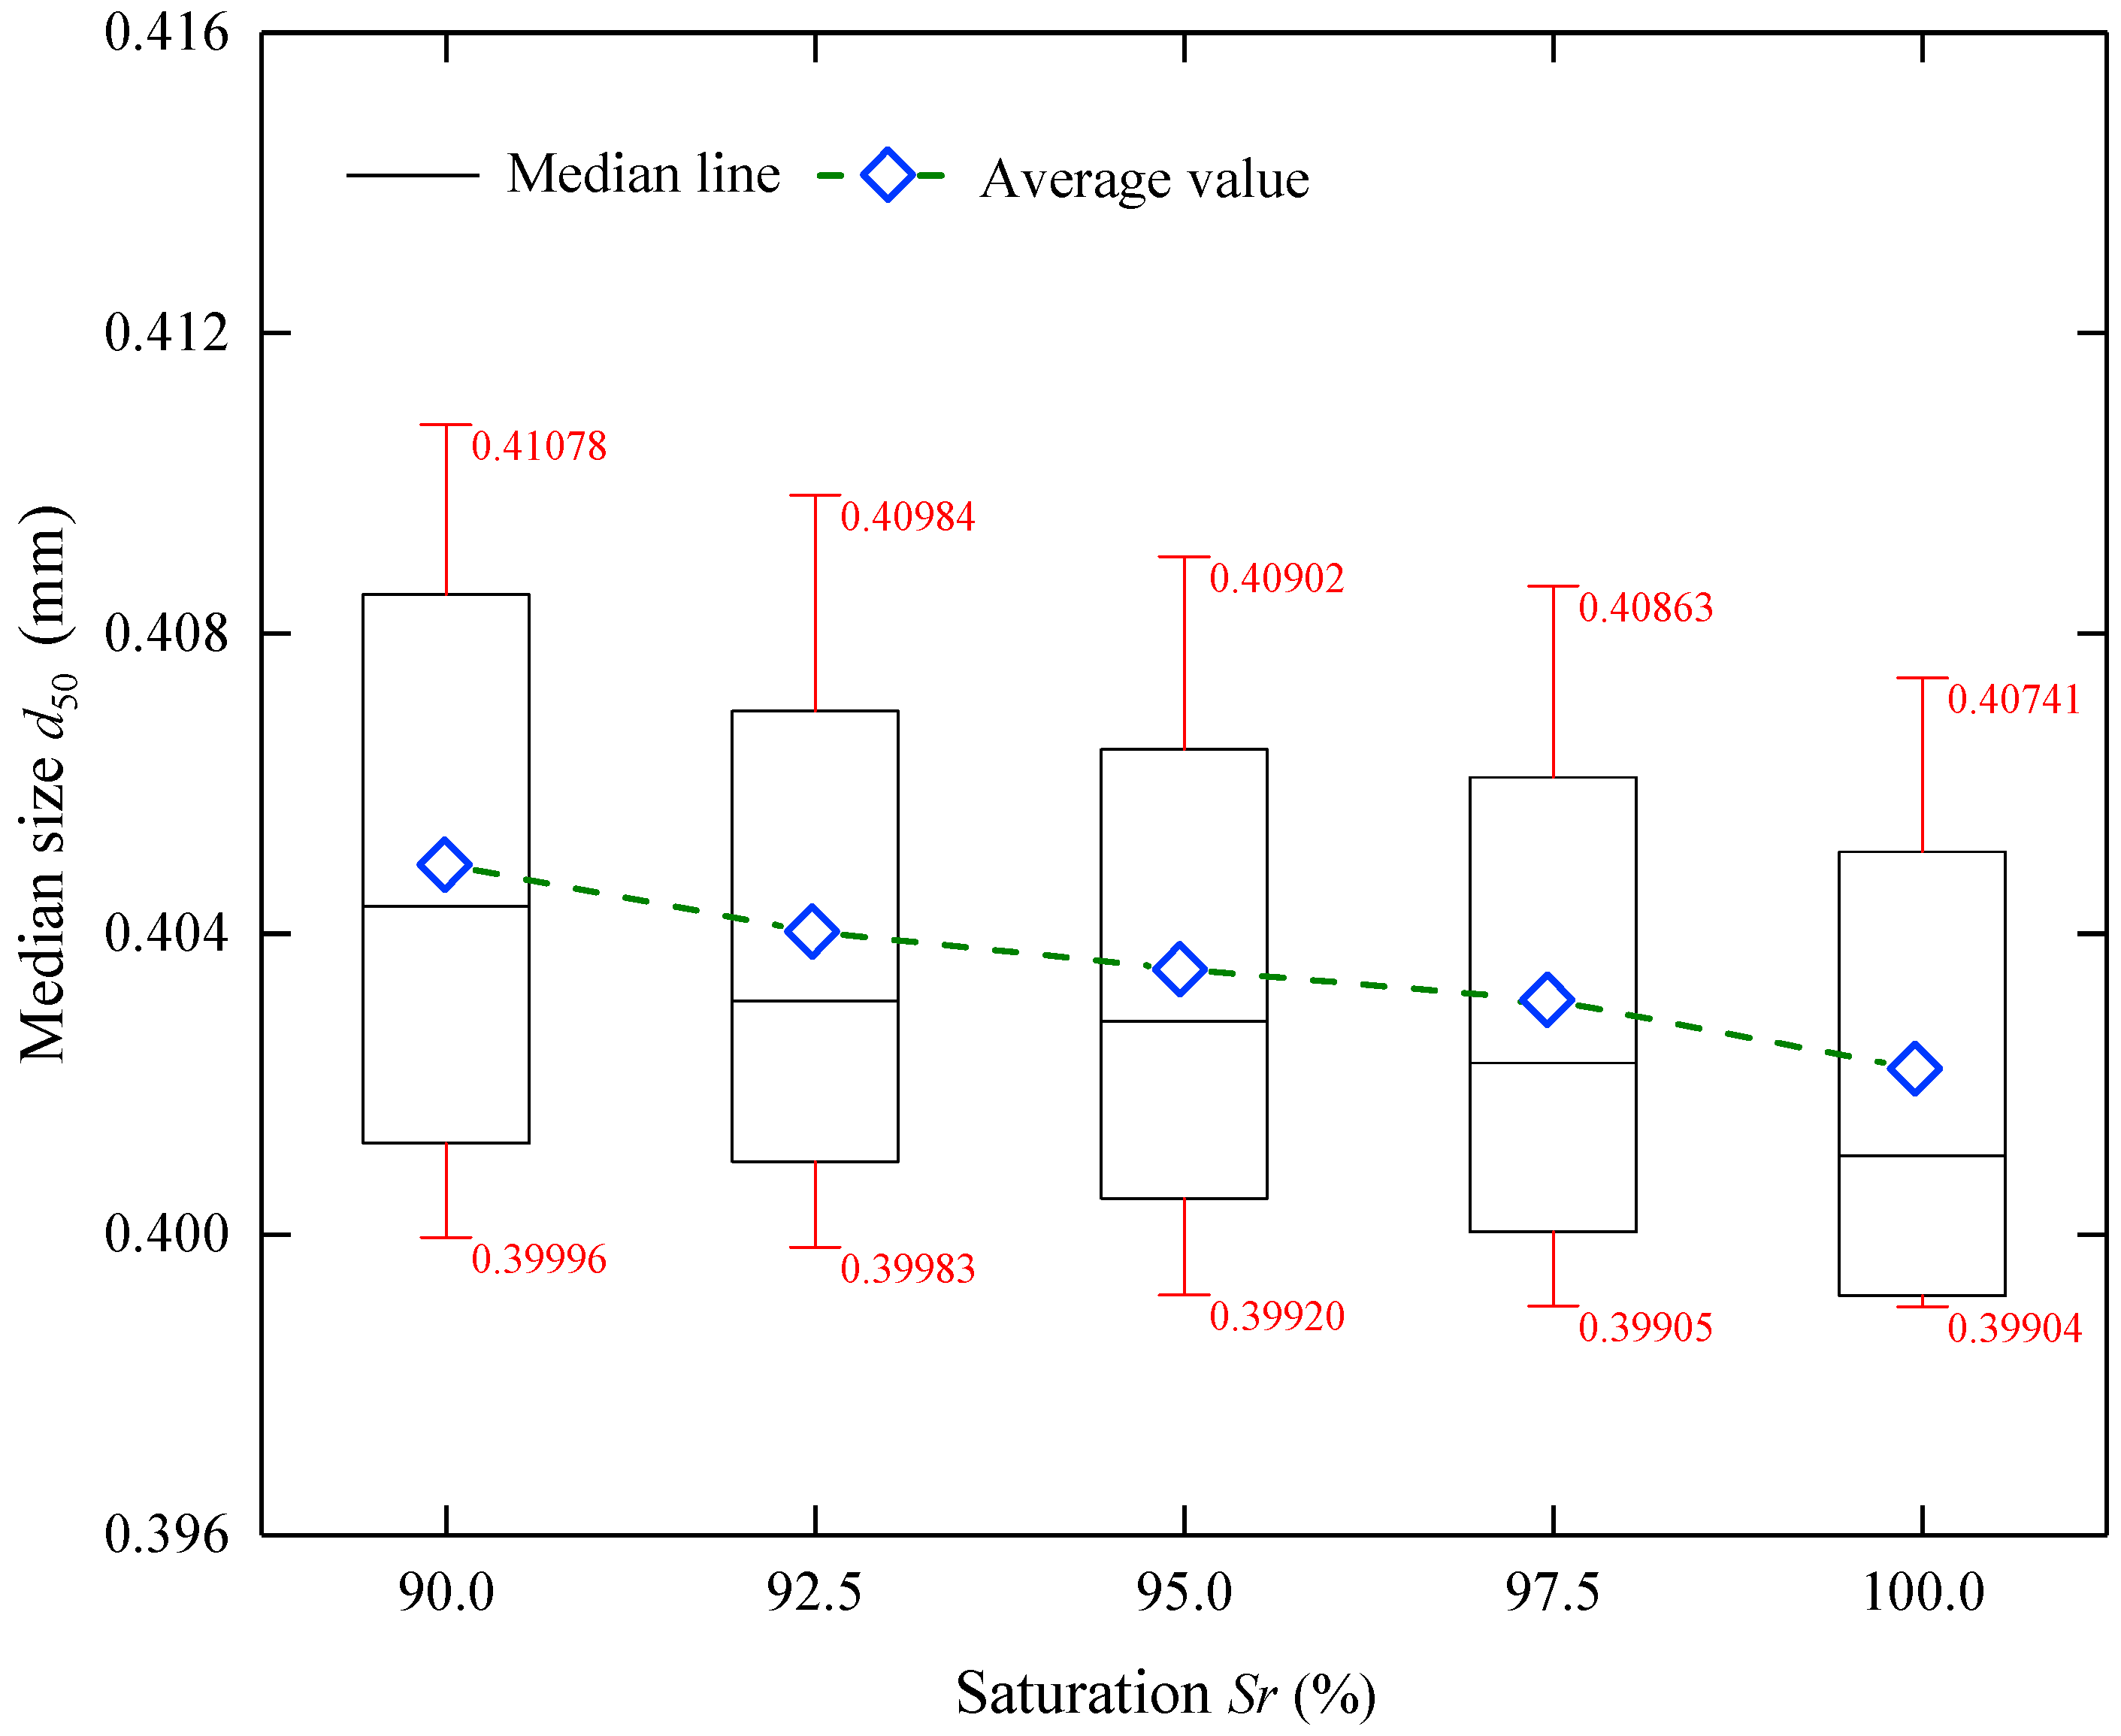
4.3. Effect of Saturation on Particle Median Size
5. Discussion of Saturation Effect on Shear Strength and Particle Breakage
5.1. Saturation Effect on Shear Strength of Coral Sand
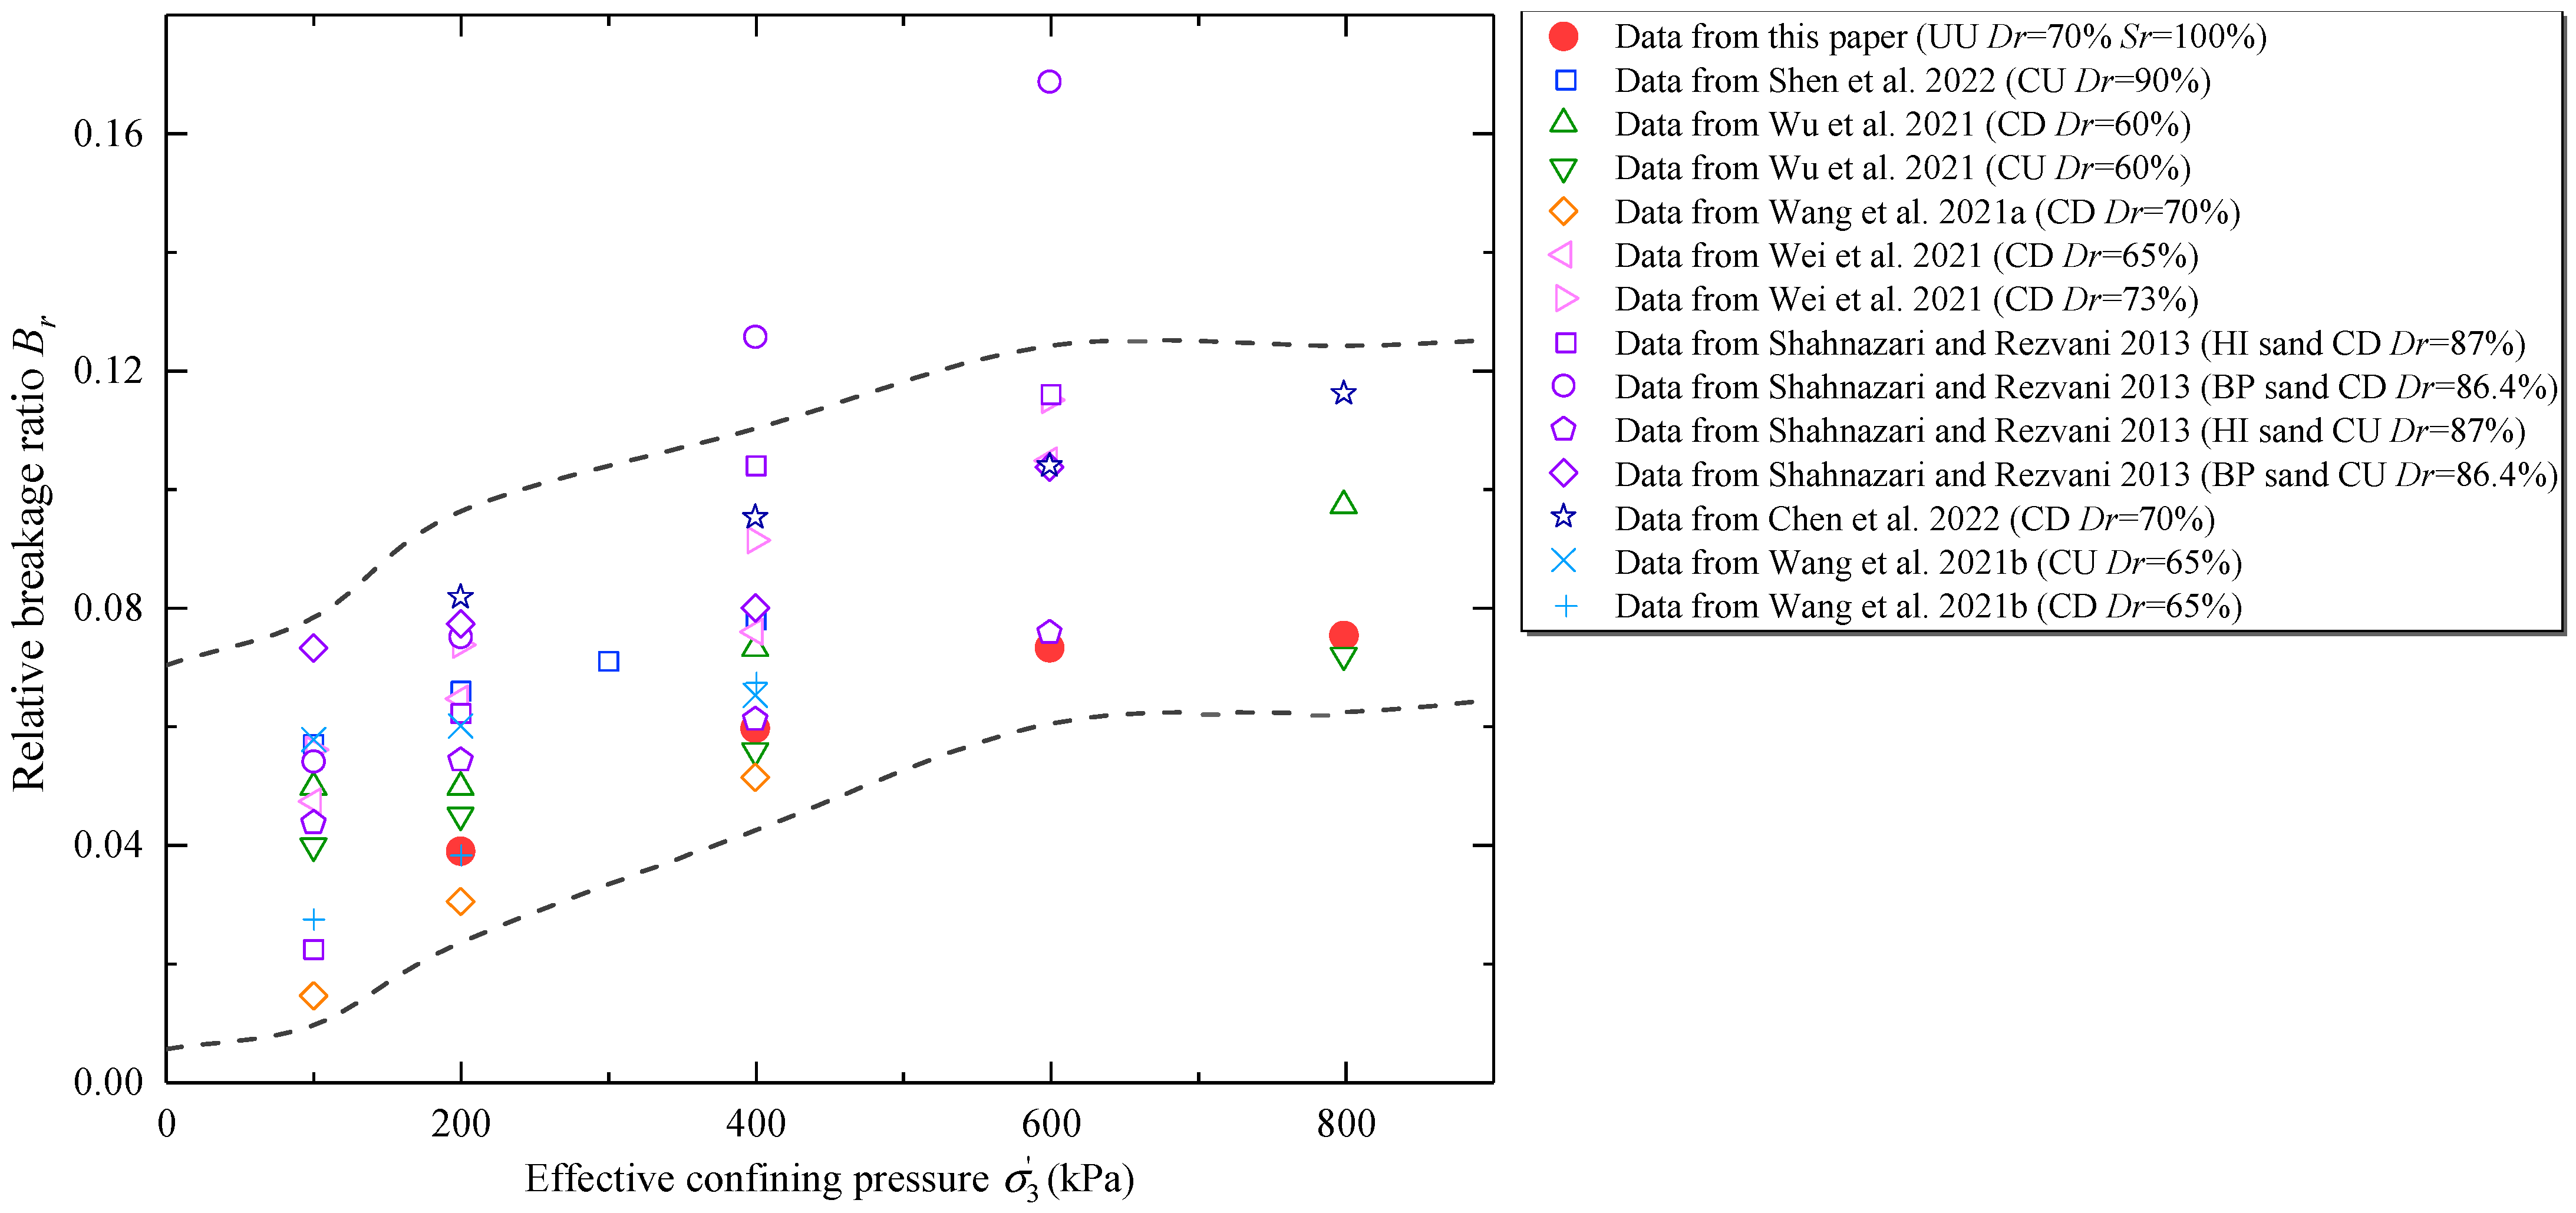
5.2. Saturation Effect on Particle Breakage of Coral Sand
6. Conclusions
Author Contributions
Funding
Data Availability Statement
Conflicts of Interest
Nomenclature
| CS | Coral sand |
| Sr | Saturation (Unit: %) |
| Effective confining pressure (Unit: kPa) | |
| UU | Unconsolidated–undrained |
| CD | Consolidated–drained |
| CU | Consolidated-undrained |
| d | Particle size (Unit: mm) |
| d50 | Diameter that corresponds to an 50% finer in the particle gradation curve (Unit: mm) |
| ρd | Dry density (Unit: g/cm3) |
| e | Void ratio |
| P | Mass percentage of particles smaller than a certain size (Unit: %) |
| Cu | Nonuniformity coefficient |
| Cc | Curvature coefficient |
| Gs | Specific gravity |
| ρdmin | Minimum dry density (Unit: g/cm3) |
| ρdmax | Maximum dry density (Unit: g/cm3) |
| emin | Minimum void ratio |
| emax | Maximum void ratio |
| Dr | Relative density (Unit: %) |
| v | Shear rate (Unit: mm/min) |
| εa | Axial strain (Unit: %) |
| n | Porosity |
| VW | Volume of water inside sample (Unit: mm3) |
| VV | Volume of pores inside sample (Unit: mm3) |
| V | Sample volume (Unit: mm3) |
| q | Deviator stress (Unit: kPa) |
| qp | Peak deviator stress (Unit: kPa) |
| u | Pore water stress (Unit: kPa) |
| up1 | Peak pore water stress (Unit: kPa) |
| Effective major principal stress (Unit: kPa) | |
| p’ | Mean effective principal stress (Unit: kPa) |
| Ei | Initial elastic modulus (Unit: kPa) |
| Mean initial elastic modulus (Unit: kPa) | |
| m1, m2, m3 | Fitting parameters |
| τ | Shear stress acting on the shear plane (Unit: kPa) |
| σ | Normal stress on the shear plane (Unit: kPa) |
| φ | Internal friction angle (Unit: °) |
| c | Cohesion (Unit: kPa) |
| φu | Sliding friction angle (Unit: °) |
| φd | Dilatancy friction angle (Unit: °) |
| φb | Friction angle caused by particle breakage and rearrangement (Unit: °) |
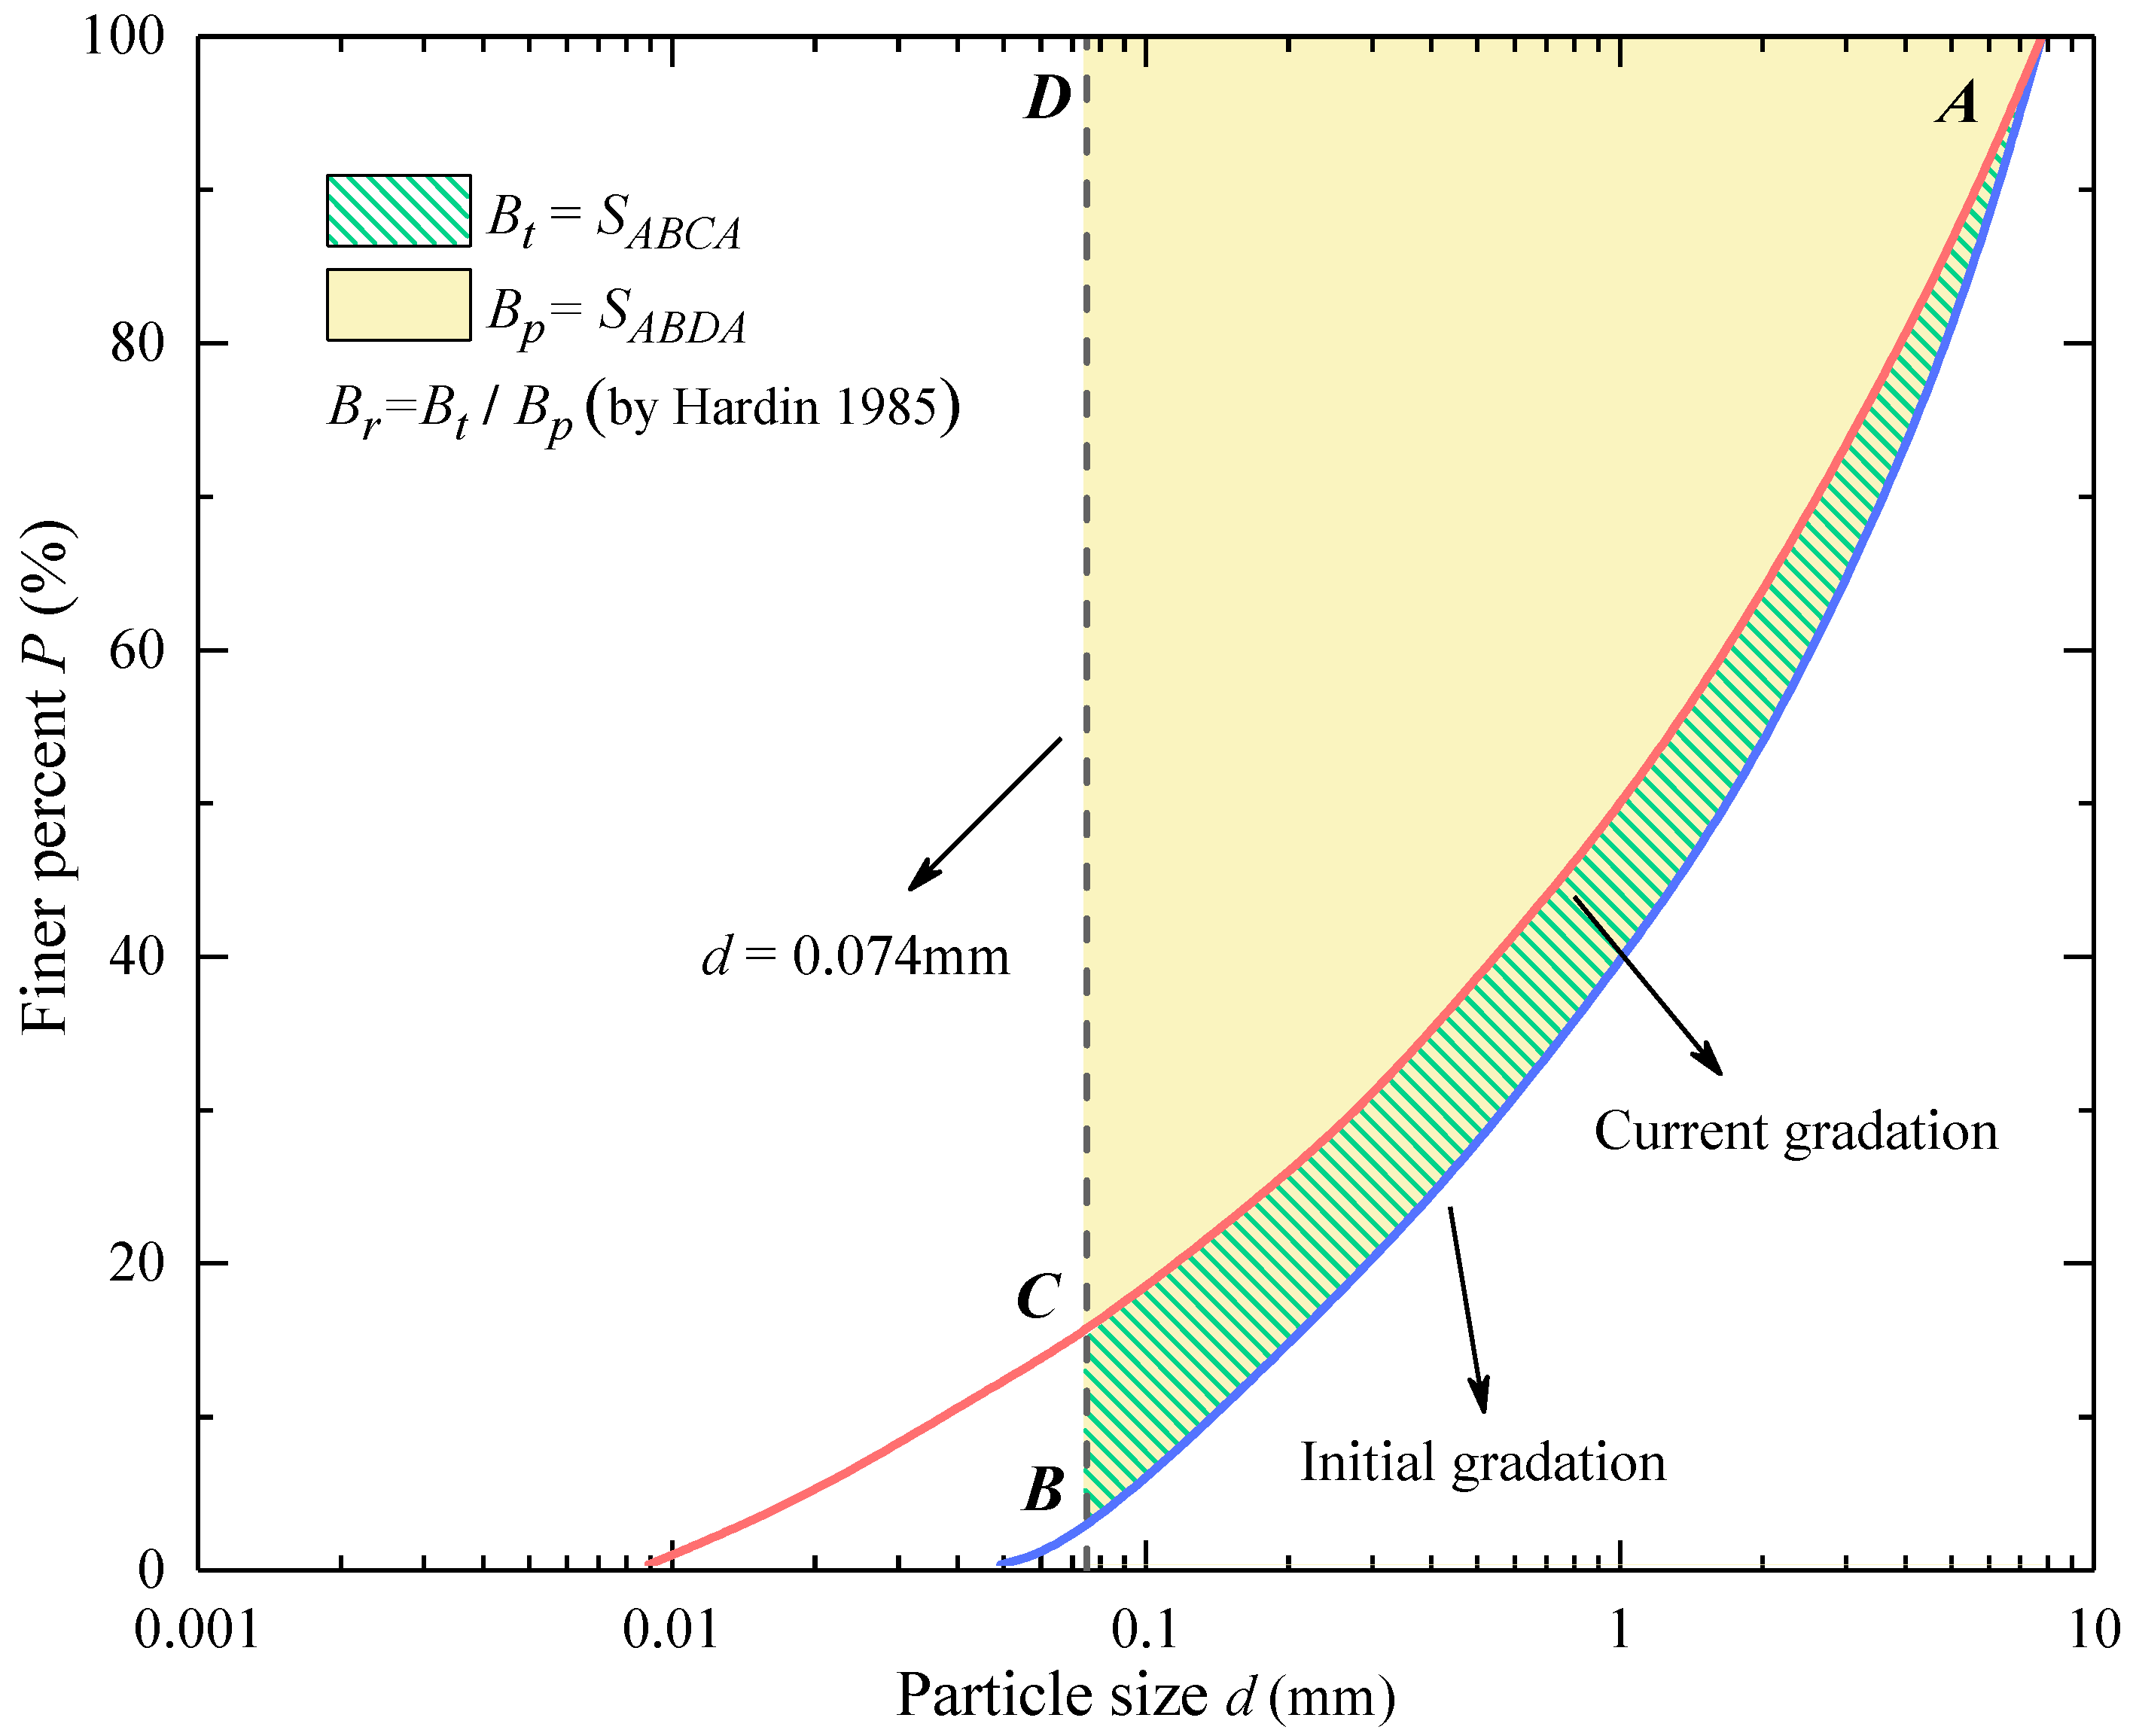
| Br | Relative breakage ratio |
| Bt | Total breakage |
| Bp | Breakage potential |
| p1, p2 | Fitting parameters |
| α | Fractal dimension |
| dM | Upper limit of particle size (Unit: mm) |
| Modified breakage potential | |
| Modified relative breakage index | |
| η | Shear strength increasing ratio (Unit: %) |
| B | Pore water stress index |
References
- Wang, X.; Wu, Y.; Cui, J.; Zhu, C.Q.; Wang, X.Z. Shape characteristics of coral sand from the South China Sea. J. Mar. Sci. Eng. 2020, 8, 803. [Google Scholar] [CrossRef]
- Javdanian, H.; Jafarian, Y. Dynamic shear stiffness and damping ratio of marine calcareous and siliceous sand. Geo-Mar. Lett. 2018, 38, 315–322. [Google Scholar] [CrossRef]
- Xu, L.J.; Wang, X.Z.; Wang, R.; Zhu, C.Q.; Liu, X.P. Physical and mechanical properties of calcareous soils: A review. Mar. Georesour. Geotechnol. 2021, 40, 751–766. [Google Scholar] [CrossRef]
- Wang, X.Z.; Ding, H.Z.; Meng, Q.S.; Wei, H.Z.; Wu, Y.; Zhang, Y. Engineering characteristics of coral reef and site assessment of hydraulic reclamation in the South China Sea. Constr. Build. Mater. 2021, 300, 124263. [Google Scholar] [CrossRef]
- Chen, J.F.; Akosah, S.; Ma, C.; Gidigasu, S.S.R. Large-scale triaxial tests of reinforced coral sand with different grain size distributions. Mar. Georesour. Geotechnol. 2022. [Google Scholar] [CrossRef]
- Shen, J.H.; Xu, D.S.; Liu, Z.W.; Wei, H.Z. Effect of particle characteristics stress on the mechanical properties of cement mortar with coral sand. Constr. Build. Mater. 2020, 260, 119836. [Google Scholar] [CrossRef]
- Chen, X.; Xu, D.S.; Shen, J.H.; Wei, H.Z.; Wang, R. Effect of particle size and particle distribution pattern on dynamic behavior of cemented calcareous sand. Mar. Georesour. Geotechnol. 2022. [Google Scholar] [CrossRef]
- Shen, J.H.; Wang, X.; Liu, W.B.; Zhang, P.Y.; Zhu, C.Q.; Wang, X.Z. Experimental study on mesoscopic shear behavior of calcareous sand material with digital imaging approach. Adv. Civil Eng. 2020, 2020, 8881264. [Google Scholar] [CrossRef]
- Wu, Y.; Wang, X.; Shen, J.H.; Cui, J.; Zhu, C.Q.; Wang, X.Z. Experiment study on the impact of water content on the strength parameters of coral gravelly sand. J. Mar. Sci. Eng. 2020, 8, 634. [Google Scholar] [CrossRef]
- Bishop, A.W.; Henkel, D.J. The Measurement of Soil Properties in the Triaxial Test; Edward Arnold: New York, NY, USA, 1962. [Google Scholar]
- Sharma, S.S.; Ismail, M.A. Monotonic and cyclic behavior of two calcareous soils of different origins. J. Geotech. Geoenviron. Eng. 2006, 132, 1581–1591. [Google Scholar] [CrossRef]
- Hassanlourad, M.; Rasouli, M.R.; Salehzadeh, H. A comparison between the undrained shear behavior of carbonate and quartz sands. Int. J. Civ. Eng. 2014, 12, 338–350. [Google Scholar]
- Wu, Y.; Cui, J.; Li, N.; Wang, X.; Wu, Y.H.; Guo, S.Y. Experimental study on mechanical behavior and particle breakage characteristics of hydraulic filled coral sand on a coral reef island in the South China Sea. Rock Soil Mech. 2020, 41, 3181–3191. [Google Scholar] [CrossRef]
- Zhang, C.Y.; Chen, M.; Hu, M.J.; Wang, X.Z.; Tang, J.J. Effect of fine particles content on shear strength of calcareous sand. Rock Soil Mech. 2019, 40, 195–202. [Google Scholar]
- Saeidaskari, J.; Alibolandi, M.; Azizkandi, A.S. Undrained monotonic and cyclic behavior of Qeshm calcareous sand. Mar. Georesour. Geotechnol. 2021, 39, 798–811. [Google Scholar] [CrossRef]
- Liu, M.C.; Hu, S.F.; Dai, P.F. Investigation on shear behavior of calcareous sand in South China sea in undrained triaxial tests. China J. Highw. Transp. 2022, 35, 69–76. [Google Scholar] [CrossRef]
- Wang, X.; Wang, X.Z.; Shen, J.H.; Zhu, C.Q. Particle size and confining-pressure effects of shear characteristics of coral sand: An experimental study. Bull. Eng. Geol. Environ. 2022, 81, 97. [Google Scholar] [CrossRef]
- Chen, Y.Y.; Tang, Y.; Guan, Y.F.; Liu, R.M.; Han, X.; Zhao, X.Q. Study on the mechanical properties of coral sands with different particle gradations. Mar. Georesour. Geotechnol. 2022. [Google Scholar] [CrossRef]
- Lv, Y.R.; Liu, J.G.; Zuo, D.J. Moisture effects on the undrained dynamic behavior of calcareous sand at high strain rates. Geotech. Test. J. 2018, 42, 20170412. [Google Scholar] [CrossRef]
- Shen, J.H.; Hu, M.J.; Wang, X.; Zhang, C.Y.; Xu, D.S. SWCC of calcareous silty sand under different fines contents and dry densities. Front. Environ. Sci. 2021, 303, 682907. [Google Scholar] [CrossRef]
- Xu, D.S.; Su, Z.Q.; Lalit, B.; Qin, Y. A hybrid FBG-based load and vibration transducer with a 3D fused deposition modelling approach. Meas Sci. Technol. 2022, 33, 065106. [Google Scholar] [CrossRef]
- Qin, Y.; Wang, Q.K.; Xu, D.S.; Yan, J.M.; Zhang, S.S. A FBG based earth and water pressure transducer with 3D fused deposition modeling approach for soil mass. J. Rock Mech. Geotech. 2022, 14, 663–669. [Google Scholar] [CrossRef]
- Ding, Z.; He, S.H.; Sun, Y.F.; Xia, T.D.; Zhang, Q.F. Comparative study on cyclic behavior of marine calcareous sand and terrigenous siliceous sand for transportation infrastructure applications. Constr. Build. Mater. 2021, 283, 122740. [Google Scholar] [CrossRef]
- Zhang, J.M.; Zhang, L.; Jiang, G.S.; Wang, R. Research on particle crushing of calcareous sands under triaxial shear. Rock Soil Mech. 2008, 29, 2789–2793. [Google Scholar]
- Shahnazari, H.; Rezvani, R. Effective parameters for the particle breakage of calcareous sand: An experimental study. Eng. Geol. 2013, 159, 91–105. [Google Scholar] [CrossRef]
- Yu, F.W. Particle breakage in triaxial shear of a coral sand. Soils Found. 2018, 58, 866–880. [Google Scholar] [CrossRef]
- Wang, G.; Wang, Z.N.; Ye, Q.G.; Zha, J.J. Particle breakage evolution of coral sand using triaxial compression tests. J. Rock Mech. Geotech. Eng. 2021, 13, 321–334. [Google Scholar] [CrossRef]
- Wang, X.; Liu, J.Q.; Cui, J.; Wang, X.Z.; Shen, J.H.; Zhu, C.Q. Particle breakage characteristic of a founding filling material on island-reefs in the South China Sea. Constr. Build. Mater. 2021, 306, 124690. [Google Scholar] [CrossRef]
- Shen, J.H.; Wang, X.; Shan, Y.; Cui, J.; Chen, X.; Wang, X.Z.; Zhu, C.Q. Particle breakage and shape analysis of calcareous sand under consolidated-undrained triaxial shear. Bull. Eng. Geol. Environ. 2022, 81, 232. [Google Scholar] [CrossRef]
- Lv, Y.R.; Li, X.; Wang, Y. Particle breakage of calcareous sand at high strain rates. Powder Technol. 2020, 366, 776–787. [Google Scholar] [CrossRef]
- Xu, L.J.; Wang, R.; Xu, D.S.; Wang, X.Z.; Meng, Q.S.; Zhu, C.Q. Review of particle breakage measurement methods for calcareous sand. Adv. Civ. Eng. 2022, 2020, 6477197. [Google Scholar] [CrossRef]
- Wang, G.; Ye, Q.G.; Zha, J.J. Experimental study on mechanical behavior and particle crushing of coral sand-gravel fill. Chin. J. Geotech. Eng. 2018, 40, 802–810. [Google Scholar]
- Wu, Y.; Li, N.; Wang, X.Z.; Cui, J.; Chen, Y.L.; Wu, Y.H.; Yamamoto, H. Experimental investigation on mechanical behavior and particle crushing of calcareous sand retrieved from South China Sea. Eng. Geol. 2021, 280, 105932. [Google Scholar] [CrossRef]
- Wang, C.Y.; Ding, X.M.; Yin, Z.Y.; Peng, Y.; Chen, Z.X. Mechanical characteristic and particle breakage of coral sand under one-dimensional repeated loading. Acta Geotech. 2021, 17, 3117–3130. [Google Scholar] [CrossRef]
- Maleki, M.; Bayat, M. Experimental evaluation of mechanical behavior of unsaturated silty sand under constant water content condition. Eng. Geol. 2012, 141, 45–56. [Google Scholar] [CrossRef]
- Duong, T.V.; Tang, A.M.; Cui, Y.J.; Trinh, V.N.; Dupla, J.C.; Calon, N.; Canou, J.; Robinet, A. Effects of fines and water contents on the mechanical behavior of interlayer soil in ancient railway sub-structure. Soils Found. 2013, 53, 868–878. [Google Scholar] [CrossRef]
- Aldaood, A. Impact of fine materials on the saturated and unsaturated behavior of slity sand soil. Ain Shams Eng. J. 2020, 11, 717–725. [Google Scholar] [CrossRef]
- Wang, X.; Wu, Y.X.; Lu, Y.; Cui, J.; Wang, X.Z.; Zhu, C.Q. Strength and dilatancy of coral sand in the South China Sea. Bull. Eng. Geol. Environ. 2021, 80, 8279–8299. [Google Scholar] [CrossRef]
- Shen, J.H.; Wang, X.; Cui, J.; Wang, X.Z.; Zhu, C.Q. Shear characteristic of calcareous gravelly sand considering particle breakage. Bull. Eng. Geol. Environ. 2022, 81, 130. [Google Scholar] [CrossRef]
- Zhang, J.M.; Jiang, G.S.; Wang, R. Research on influences of particles breakage and dilatancy on shear strength of calcareous sand. Rock Soil Mech. 2009, 30, 2043–2048. [Google Scholar]
- Hassanlourand, M.; Salehzadeh, H.; Shahnazari, H. Dilation and particle breakage effects on the shear strength of calcareous sand based on energy aspects. Int. J. Civ. Eng. 2008, 6, 108–119. [Google Scholar]
- Wang, X.Z.; Jiao, Y.Y.; Wang, R.; Hu, M.J.; Meng, Q.S.; Tan, F.Y. Engineering characteristics of calcareous sand in Nansha Islands, South China Sea. Eng. Geol. 2011, 120, 40–47. [Google Scholar] [CrossRef]
- Khaboushan, E.A.; Emami, H.; Mosaddeghi, M.R.; Astaraei, A.R. Estimation of unsaturated shear strength parameters using easily-available soil properties. Soil Trill Res. 2018, 184, 118–127. [Google Scholar] [CrossRef]
- Wei, Y.J.; Wu, X.L.; Xia, J.W.; Miller, G.A.; Cai, C.F.; Guo, Z.L.; Hassanikhah, A. The effect of water content on the shear strength characteristics of granitic soils in South China. Soil Trill Res. 2019, 187, 50–59. [Google Scholar] [CrossRef]
- Shen, J.H.; Wang, X.Z.; Wang, X.; Yao, T.; Wei, H.Z.; Zhu, C.Q. Effect and mechanism of fines content on the shear strength of calcareous sand. Bull. Eng. Geol. Environ. 2021, 80, 7899–7919. [Google Scholar] [CrossRef]
- Xu, D.S.; Huang, M.; Zhou, Y. One-dimension compression behavior of calcareous sand and marine clay mixtures. Int. J. Geomech. 2020, 20, 04020137. [Google Scholar] [CrossRef]
- Qin, Y.; Wang, Q.K.; Xu, D.S.; Fan, X.C. Study of the effects of fine coral powder and salinity on the mechanical behaviour of coral sand-seawater cement mortar. Constr. Build. Mater. 2021, 313, 125476. [Google Scholar] [CrossRef]
- Yang, J.J.; Xu, D.S.; Shen, J.H.; Wei, H.Z.; Wang, R.; Xiao, X.B. Effect of coral sand powders and seawater salinity on the impact mechanical properties of cemented coral sand. Soils Found. 2022, 62, 101206. [Google Scholar] [CrossRef]
- Wiebe, B.; Graham, J.; Tang, G.X.; Dixon, D. Influence of pressure, saturation, and temperature on the behaviour of unsaturated sand-bentonite. Can. Geotech. J. 1998, 35, 194–205. [Google Scholar] [CrossRef]
- Hu, X.; Hong, B.N.; Du, Q.; Meng, Y.M. Influence of water contents on shear strength of coal-bearing soil. Rock Soil Mech. 2009, 30, 2291–2294. [Google Scholar]
- Malizia, J.P.; Shakoor, A. Effect of water content and density on shear strength and deformation behavior of clay soils. Eng. Geol. 2018, 244, 125–131. [Google Scholar] [CrossRef]
- Wang, X.Z.; Wang, X.; Jin, Z.C.; Meng, Q.S.; Zhu, C.Q.; Wang, R. Shear characteristics of calcareous gravelly soil. Bull. Eng. Geol. Environ. 2017, 76, 561–573. [Google Scholar] [CrossRef]
- Alonso, E.E.; Pereira, J.M.; Vaunat, J.; Olivella, S. A microstructurally based effective stress for unsaturated soils. Géotechnique 2010, 60, 913–925. [Google Scholar] [CrossRef]
- Rowe, P.W.; Barden, L.; Lee, I.K. Energy components during the triaxial cell and direct shear tests. Géotechnique 1964, 14, 247–261. [Google Scholar] [CrossRef]
- Lee, K.L.; Farhoomand, I. Compressibility and crushing of granular soil in anisotropic triaxial tests. Can. Geotech. J. 2011, 4, 68–86. [Google Scholar] [CrossRef]
- Wang, X.Z.; Weng, Y.L.; Wang, X.; Chen, J.W. Interlocking mechanism of calcareous soil. Rock Soil Mech. 2008, 39, 3113–3120. [Google Scholar] [CrossRef]
- Lade, P.V.; Yamamuro, J.A.; Bopp, P.A. Significance of particle crushing in granular materials. J. Geotech. Eng. 1996, 122, 309–316. [Google Scholar] [CrossRef]
- Hardin, B.O. Crushing of soils particles. J. Geotech. Eng. 1985, 111, 1177–1192. [Google Scholar] [CrossRef]
- Yan, C.P.; Long, Z.L.; Zhou, Y.C.; Kuang, D.M.; Chen, J.M. Investigation on the effects of confining pressure and particle size of shear characteristics of calcareous sand. Rock Soil Mesh. 2020, 41, 581–591. [Google Scholar]
- Wei, H.Z.; Li, X.X.; Zhang, S.D.; Zhao, T.; Yin, M.; Meng, Q.S. Influence of particle breakage on drained shear strength of calcareous sands. Int. J. Geomech. 2021, 21, 04021118. [Google Scholar] [CrossRef]
- Biarez, J.; Hicher, P.-Y. Elementary Mechanics of Soil Behavior; A.A.Balkema: Avereest, The Netherlands, 1994. [Google Scholar]
- Einav, I. Breakage mechanics—Part I: Theory. J. Mech. Phys. Solids 2007, 55, 1274–1297. [Google Scholar] [CrossRef]
- Cooper, M.R.; Sorensen, K.K.; Bodas Freitas, T.; Georgoutsos, G. Particle breakage during shearing of a carbonate sand. Géotechnique 2004, 54, 157–163. [Google Scholar] [CrossRef]
- Gao, R.; Ye, J.H. Experimental investigation on the dynamic characteristics of calcareous sand from the reclaimed coral reef islands in the South China Sea. Rock Soil Meth. 2019, 40, 3897–3908. [Google Scholar]
- Brand, E.W. Back pressure effects on the undrained strength characteristic of soft clay. Soils Found. 1975, 15, 1–16. [Google Scholar] [CrossRef]
- Huang, B.; Wang, Q.J.; Ling, D.S.; Ding, H.; Chen, Y.M. Effect of back pressure on shear strength of saturated sand in triaxial tests. Rock Soil Mech. 2012, 34, 1313–1319. [Google Scholar]
- Bandini, B.; Cooper, M.R. The influence of particle breakage on the location of the critical state line of sand. Soils Found. 2011, 51, 591–600. [Google Scholar] [CrossRef]
- Yao, T.; Baudet, B.A.; Lourenco, S.D. Evolution of surface roughness of single sand grains with normal loading. Géotechnique 2022, 72, 543–555. [Google Scholar] [CrossRef]
- Ovalle, C.; Dano, C.; Hicher, P.-Y.; Cisternas, M. Experimental framework for evaluating the mechanical behavior of dry and wet crushable granular materials based on the particle breakage ratio. Can. Geotech. J. 2015, 52, 587–598. [Google Scholar] [CrossRef]
- Wei, H.Z.; Yin, M.; Zhao, T.; Yan, K.; Shen, J.H.; Meng, Q.S.; Wang, X.Z.; He, J.Q. Effect of particle breakage on the shear strength of calcareous sand. Mar. Geophys. Res. 2021, 42, 23. [Google Scholar] [CrossRef]


| Research Material | Research Content | Research Method | Researcher and Year | Shear Type | Research Variable | Main Conclusions |
|---|---|---|---|---|---|---|
| Saturated coral sand | Mechanical properties | Triaxial shear test | Sharma and Ismail (2006) [11] | CU | Soil origin, Relative density, Initial mean effective stress | The monotonic shear response of calcareous soil from Goodwyn and Ledge Point was similar to that of siliceous sand, and the peak friction angel were relatively higher than siliceous sand. |
| Hassanlourad et al. (2014) [12] | CU | Effective confining pressure, Relative density | Coral sand illustrated more shear strength than quartz sand in the triaxial consolidated undrained test. | |||
| Zhang et al. (2019) [13] | CD | Fine particle content | The dilatancy property and peak deviator stress of coral sand decreased with the increasing fine particle content. | |||
| Wu et al. (2020) [14] | CD | Effective confining pressure, Relative density | The strain softening and dilatation characteristic of coral sand gradually weaken with increasing effective confining pressure and decreasing compactness. | |||
| Saeidaskari et al. (2021) [15] | CU | Effective confining pressure, Relative density | Coral sand showed initial contractive behavior, and the contractive behavior became more apparent as the effective confining pressure increased. | |||
| Liu et al. (2022) [16] | CU | Effective confining pressure, Relative density | The shear modulus of coral sand increased with effective confining pressures and relative density, and the shear strength (or internal frictional angle) in peak state was more than that in critical state. | |||
| Wang et al. (2022) [17] | CD | Particle size, Effective confining pressure | The shear strength of coral sand specimens with a single particle size decreased with an increase in particle size. | |||
| Chen et al. (2022) [18] | CD | Particle gradation, Effective confining pressure | The softening and dilatancy were more significant for coral sand with smaller particle size, and the average peak friction angle of coral sand decreased linearly with the increasing mean particle size. |
| Research Material | Research Content | Research Method | Researcher and Year | Shear Type | Research Variable | Main Conclusions |
|---|---|---|---|---|---|---|
| Saturated coral sand | Particle breakage | Triaxial shear test | Zhang et al. (2008) [24] | CD | Effective confining pressure, Axial strain | The increase of effective confining pressure and axial strain could promote the particle breakage of coral sand. |
| Shahnazari and Rezvani (2013) [25] | CD, CU | Effective confining pressure, Relative density, Axial strain, Drainage condition, Grain size distribution | Increasing of effective confining pressure, axial strain, relative density and grain size resulted in a higher particle breakage for coral sand, and coral sand under undrained condition had less particle breakage compared to the drained experiments due to the increasing of pore pressure. | |||
| Yu (2018) [26] | CD, CU | Effective confining pressure, Initial void ratio, Consolidated stress ratio | In isotropic consolidation, more particle breakage of coral sand was cause in higher effective confining pressure (or denser sample), and anisotropic stress yielded more particle breakage than isotropic stress for coral sand. | |||
| Wu et al. (2020) [14] | CD | Effective confining pressure, Relative density | The relationship between particle breakage and plastic work of coral sand could be described by a power function with a negative index, and particle breakage increased with the increasing plastic work with a hyperbolic form. | |||
| Wang et al.(2021) [27] | CD, CU | Effective confining pressure, Axial strain | Particle breakage of coral sand increased with axial strain at a gradually decreasing rate during triaxial drained compression, and shear strain could induce further breakage without an increase in stress. | |||
| Wang et al.(2021) [28] | CD | Effective confining pressure, Relative density | For coral gravelly sand, the highest breakage degree was observed in sand particles within 1–2 mm size range. | |||
| Chen et al. (2022) [18] | CD | Particles gradation Effective confining pressure | The particle breakage of coral sand increased with the increasing effective confining pressure and mean particle size. | |||
| Shen et al. (2022) [29] | CU | Effective confining pressure | The particle breakage of coral sand increased in powder function form with increasing effective confining pressure, and splitting and abrasion were the main particle breakage patterns of coral sand within 400 kPa effective confining pressure. |
| Sample | Particle Size d(mm) | Median Size d50 (mm) | Nonuniform Coefficient Cu | Curvature Coefficient Cc | Specific Gravity Gs | Maximum Void Ratio emax | Minimum Void Ratio emin | Maximum Dry Density ρdmax(g/cm3) | Minimum Dry Density ρdmin(g/cm3) |
|---|---|---|---|---|---|---|---|---|---|
| Coral medium sand | 0.25–0.5 | 0.375 | 1.455 | 0.96 | 2.83 | 1.608 | 1.043 | 1.385 | 1.085 |
| Sample | Sample No. | Saturation Sr (%) | Relative Density Dr (%) | Specimen Size | Effective Confining Pressure | Shear Type | Shear Rate v (mm/min) | Terminal Strain εt (%) | |
|---|---|---|---|---|---|---|---|---|---|
| Diameter (mm) | Height (mm) | ||||||||
| Coral medium sand | CS–90 | 90 | 70 | 39.1 | 80 | 200 | UU | 0.15 | 30 |
| CS–90 | 90 | 70 | 39.1 | 80 | 400 | UU | 0.15 | 30 | |
| CS–90 | 90 | 70 | 39.1 | 80 | 600 | UU | 0.15 | 30 | |
| CS–90 | 90 | 70 | 39.1 | 80 | 800 | UU | 0.15 | 30 | |
| CS–92.5 | 92.5 | 70 | 39.1 | 80 | 200 | UU | 0.15 | 30 | |
| CS–92.5 | 92.5 | 70 | 39.1 | 80 | 400 | UU | 0.15 | 30 | |
| CS–92.5 | 92.5 | 70 | 39.1 | 80 | 600 | UU | 0.15 | 30 | |
| CS–92.5 | 92.5 | 70 | 39.1 | 80 | 800 | UU | 0.15 | 30 | |
| CS–95 | 95 | 70 | 39.1 | 80 | 200 | UU | 0.15 | 30 | |
| CS–95 | 95 | 70 | 39.1 | 80 | 400 | UU | 0.15 | 30 | |
| CS–95 | 95 | 70 | 39.1 | 80 | 600 | UU | 0.15 | 30 | |
| CS–95 | 95 | 70 | 39.1 | 80 | 800 | UU | 0.15 | 30 | |
| CS–97.5 | 97.5 | 70 | 39.1 | 80 | 200 | UU | 0.15 | 30 | |
| CS–97.5 | 97.5 | 70 | 39.1 | 80 | 400 | UU | 0.15 | 30 | |
| CS–97.5 | 97.5 | 70 | 39.1 | 80 | 600 | UU | 0.15 | 30 | |
| CS–97.5 | 97.5 | 70 | 39.1 | 80 | 800 | UU | 0.15 | 30 | |
| CS–100 | 100 | 70 | 39.1 | 80 | 200 | UU | 0.15 | 30 | |
| CS–100 | 100 | 70 | 39.1 | 80 | 400 | UU | 0.15 | 30 | |
| CS–100 | 100 | 70 | 39.1 | 80 | 600 | UU | 0.15 | 30 | |
| CS–100 | 100 | 70 | 39.1 | 80 | 800 | UU | 0.15 | 30 | |
| Sample | Sample No. | Sr (%) | Water Content (mL) |
|---|---|---|---|
| Coral medium sand | CS–90 | 90 | 45.56 |
| CS–92.5 | 92.5 | 46.82 | |
| CS–95 | 95 | 48.09 | |
| CS–97.5 | 97.5 | 49.35 | |
| CS–100 | 100 | 50.62 |
| Sample | Expression | R2 | ||||
|---|---|---|---|---|---|---|
| Coral medium sand | 200 | 1226.055 | −0.404 | 0.980 | ||
| 400 | 1634.959 | −0.385 | 0.988 | |||
| 600 | 1798.559 | −0.389 | 0.997 | |||
| 800 | 2067.165 | −0.194 | 0.988 |
| Shear Behavior | Saturation | ||
|---|---|---|---|
| Sr = 97.5% | Sr = 100% | ||
| Shear strength qp (kPa) | 1240.1 | 1220.9 | |
| 1639.9 | 1638.1 | ||
| 1813.2 | 1806.2 | ||
| 2159.7 | 2147.1 | ||
| Internal fiction angle φ (°) | 25.16 | 25.25 | |
| cohesion c (kPa) | 309.33 | 303.96 | |
Publisher’s Note: MDPI stays neutral with regard to jurisdictional claims in published maps and institutional affiliations. |
© 2022 by the authors. Licensee MDPI, Basel, Switzerland. This article is an open access article distributed under the terms and conditions of the Creative Commons Attribution (CC BY) license (https://creativecommons.org/licenses/by/4.0/).
Share and Cite
Chen, X.; Shen, J.; Wang, X.; Yao, T.; Xu, D. Effect of Saturation on Shear Behavior and Particle Breakage of Coral Sand. J. Mar. Sci. Eng. 2022, 10, 1280. https://doi.org/10.3390/jmse10091280
Chen X, Shen J, Wang X, Yao T, Xu D. Effect of Saturation on Shear Behavior and Particle Breakage of Coral Sand. Journal of Marine Science and Engineering. 2022; 10(9):1280. https://doi.org/10.3390/jmse10091280
Chicago/Turabian StyleChen, Xiang, Jianhua Shen, Xing Wang, Ting Yao, and Dongsheng Xu. 2022. "Effect of Saturation on Shear Behavior and Particle Breakage of Coral Sand" Journal of Marine Science and Engineering 10, no. 9: 1280. https://doi.org/10.3390/jmse10091280