
Responses of Freshwater Calcifiers to Carbon-Dioxide-Induced Acidification


Abstract
:1. Introduction
2. Materials and Methods
3. Results
4. Discussion
5. Conclusions
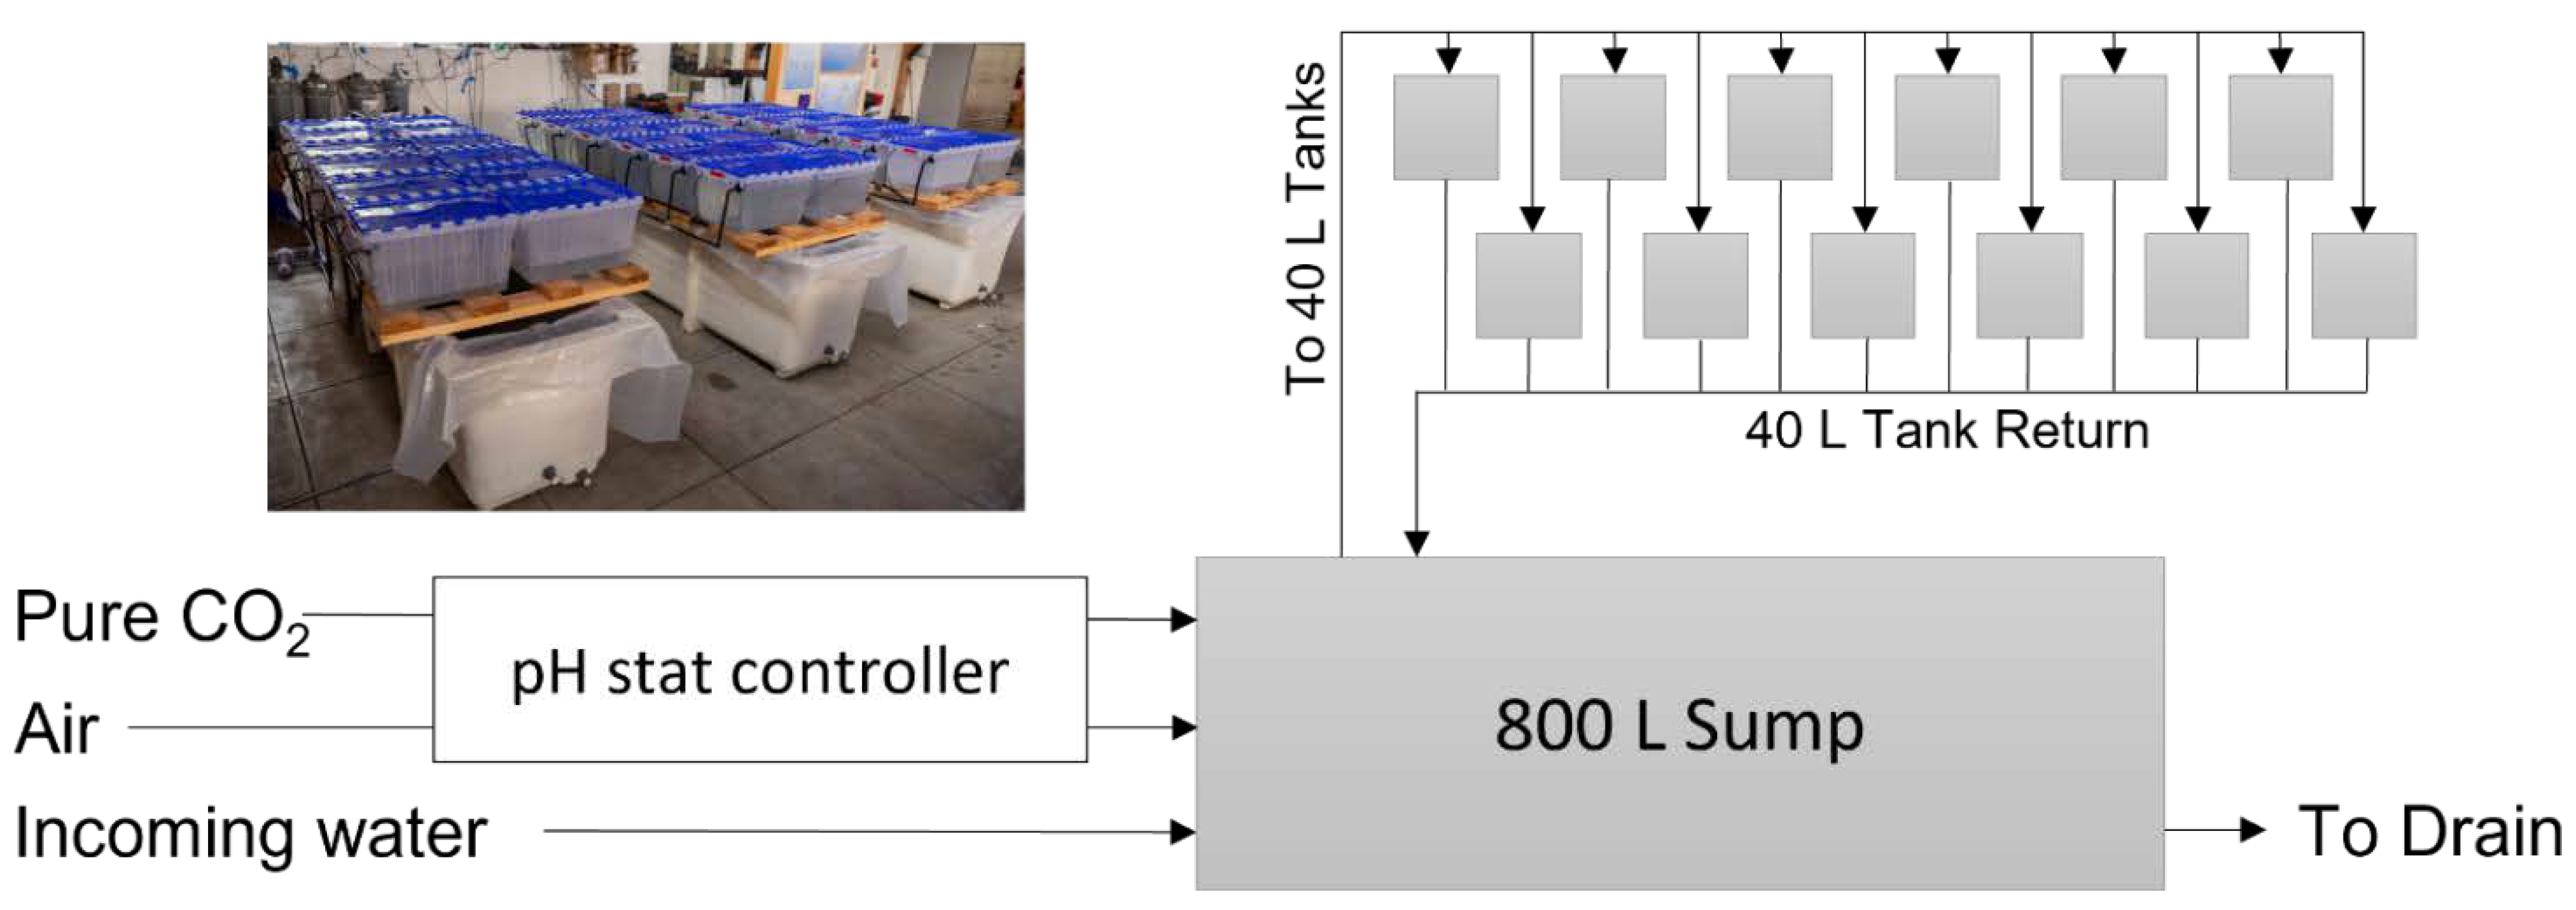
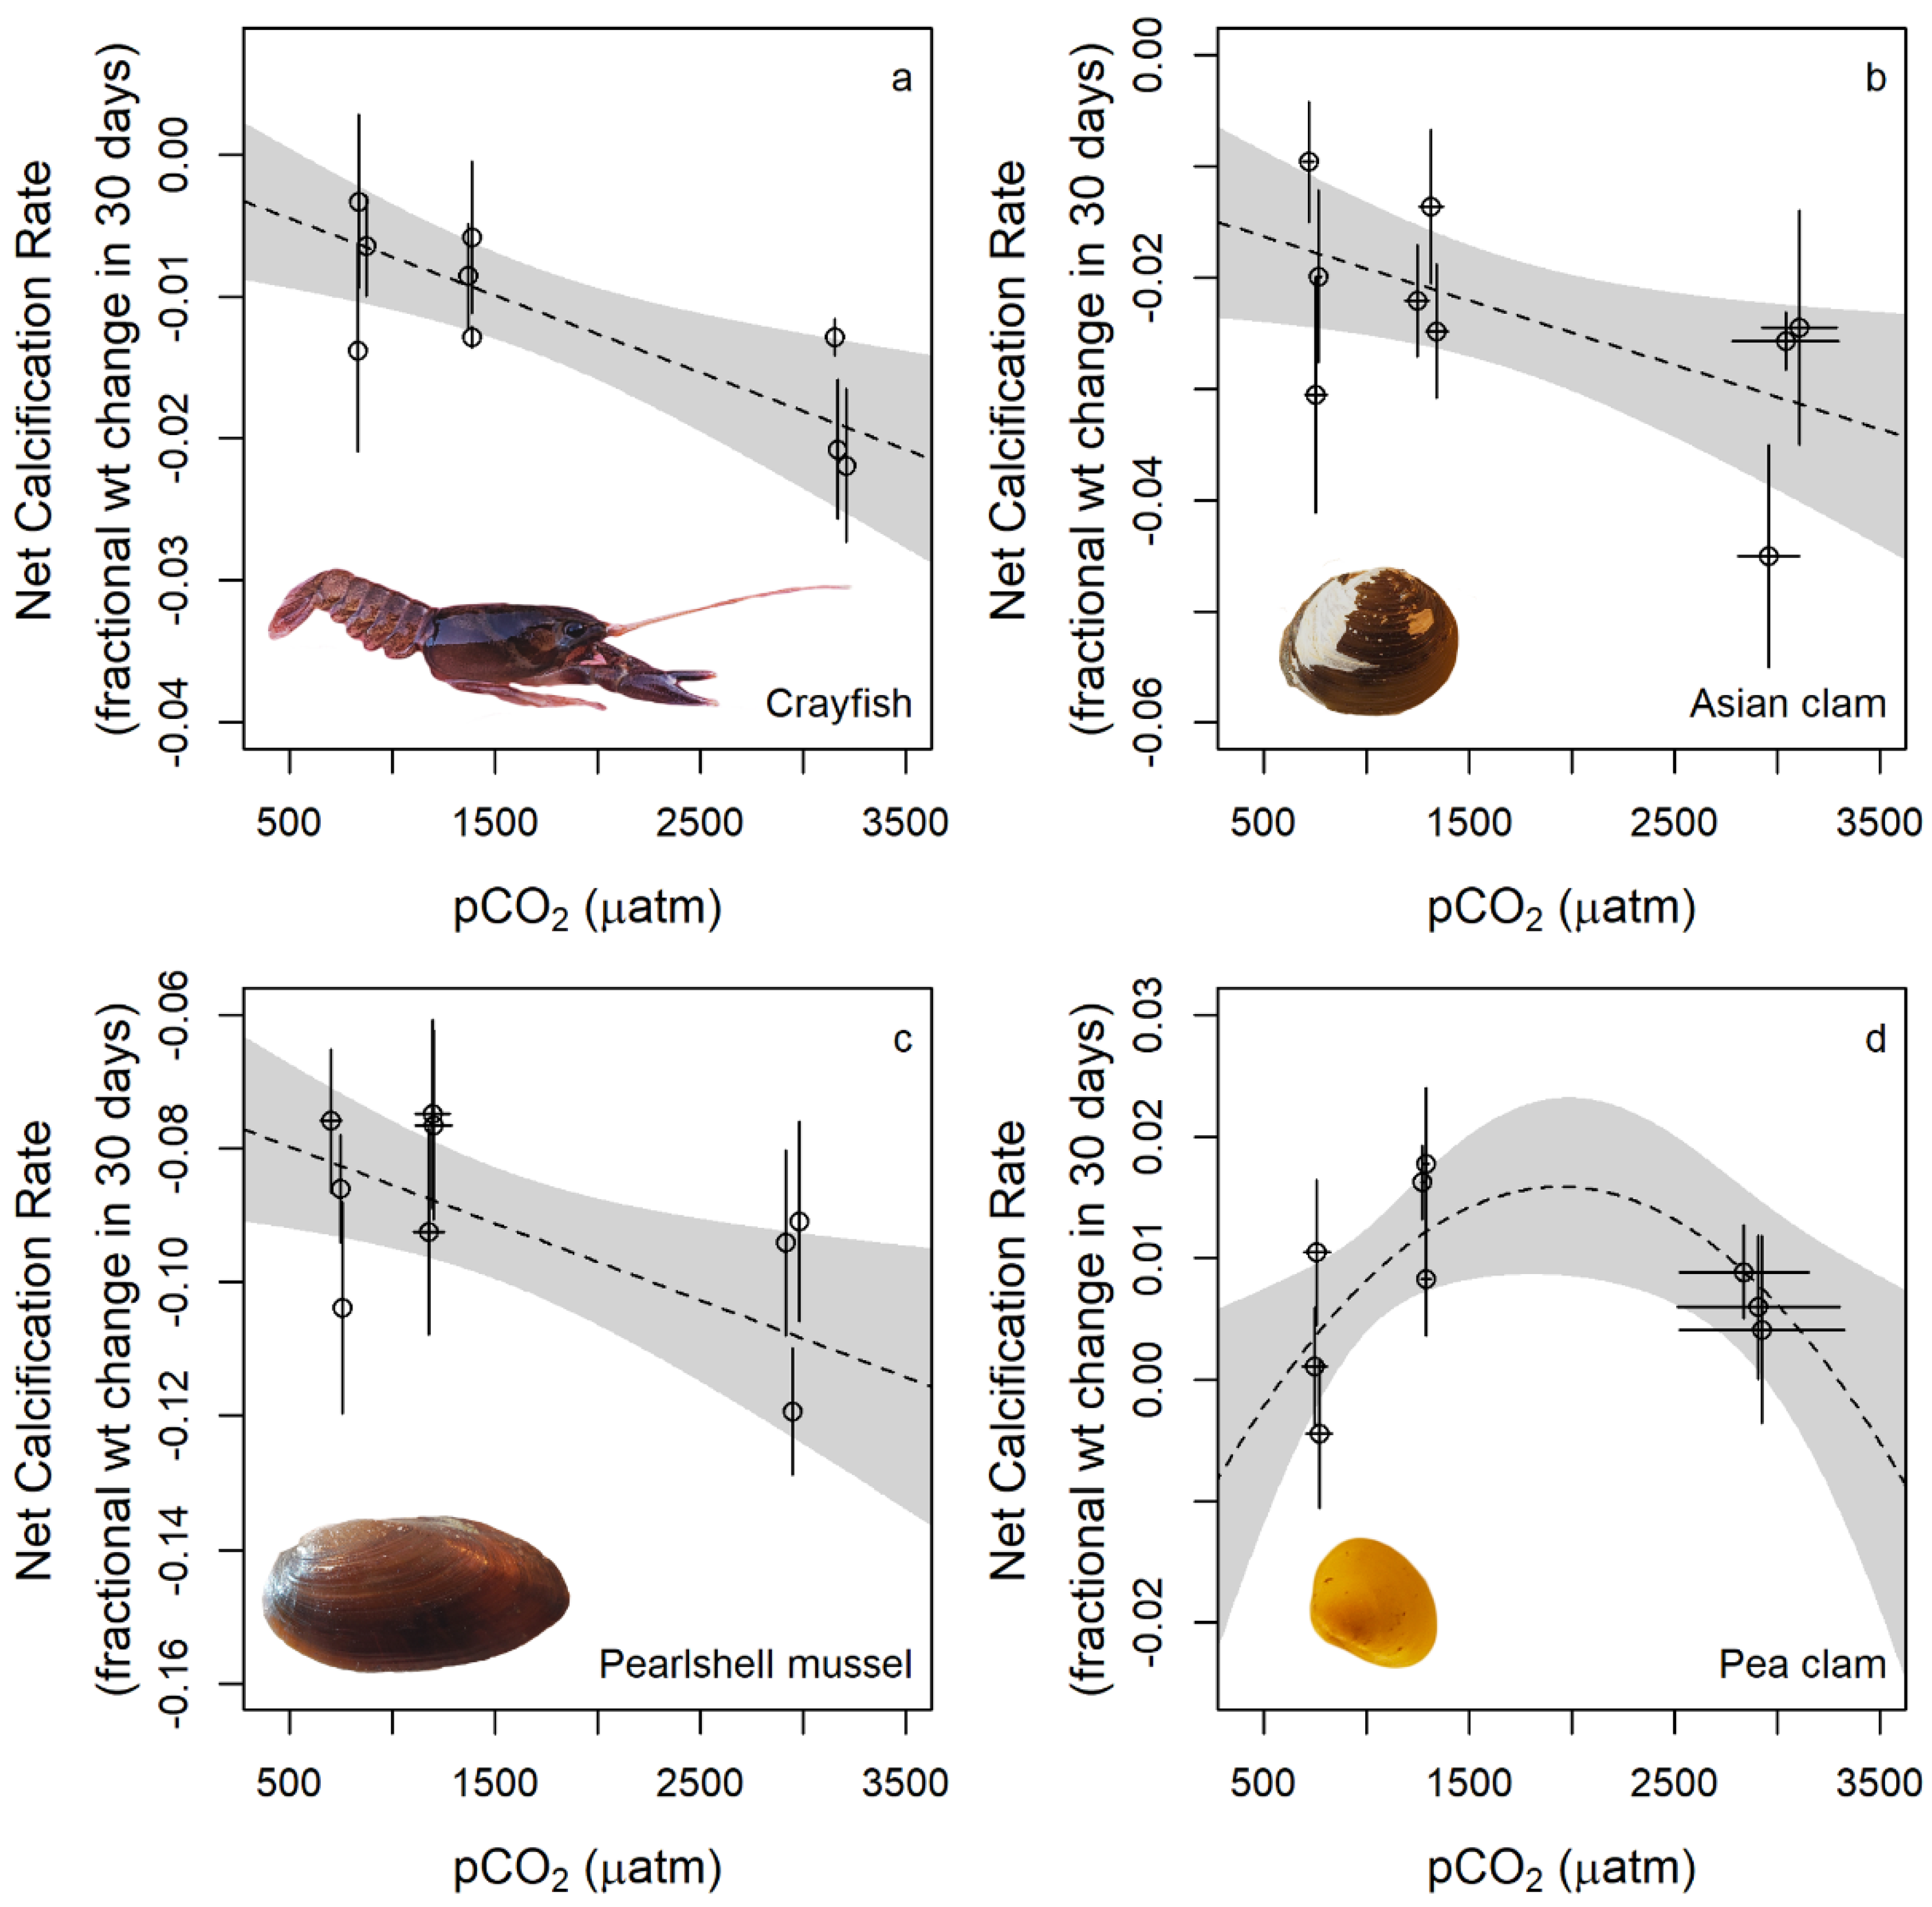
- CO2-induced acidification (doubling, quadrupling of ambient pCO2 causing pH decline of between 0.23 and 0.57 units) caused negative linear calcification responses in three species of freshwater calcifiers and a more complex parabolic calcification response in one species (pea clam). Increased pCO2 decreased the feeding rates of the signal crayfish on its natural pea clam prey but had no significant impact on crayfish respiration rate (i.e., constant metabolism), potentially driving this species’ negative calcification response to acidification by depriving it of energy required for its molt-mediated calcification.
- Although increased pCO2 can impair calcification rates of freshwater organisms, variation in these effects amongst species, combined with impacts on predator–prey dynamics, could yield complex ecological consequences for freshwater systems.
- Results highlight the importance of further elucidating the understudied effects of CO2-induced acidification within freshwater systems.
Author Contributions
Funding
Institutional Review Board Statement
Informed Consent Statement
Data Availability Statement
Acknowledgments
Conflicts of Interest
References
- Doney, S.C.; Busch, D.S.; Cooley, S.R.; Kroeker, K.J. The impacts of ocean acidification on marine ecosystems and reliant human communities. Annu. Rev. Environ. Resour. 2020, 45, 1–30. [Google Scholar] [CrossRef]
- Hurd, C.L.; Beardall, J.; Comeau, S.; Cornwall, C.E.; Havenhand, J.N.; Munday, P.L.; Parker, L.M.; Raven, J.A.; McGraw, C.M. Ocean acidification as a multiple driver: How interactions between changing seawater carbonate parameters affect marine life. Mar. Freshw. Res. 2020, 71, 263–274. [Google Scholar] [CrossRef]
- Comeau, S.; Cornwall, C.E.; DeCarlo, T.M.; Krieger, E.; McCulloch, M.T. Similar controls on calcification under ocean acidification across unrelated coral reef taxa. Glob. Chang. Biol. 2018, 24, 4857–4868. [Google Scholar] [CrossRef] [Green Version]
- Gilbert, P.U.P.A.; Bergmann, K.D.; Boekelheide, N.; Tambutté, S.; Mass, T.; Marin, F.; Adkins, J.F.; Erez, J.; Gilbert, B.; Knutson, V.; et al. Biomineralization: Integrating mechanism and evolutionary history. Sci. Adv. 2022, 8, eabl9653. [Google Scholar] [CrossRef]
- Ries, J.B.; Cohen, A.L.; McCorkle, D.C. Marine calcifiers exhibit mixed responses to CO2-induced ocean acidification. Geology 2009, 37, 1131–1134. [Google Scholar] [CrossRef]
- Gaylord, B.; Barclay, K.M.; Jellison, B.M.; Jurgens, L.J.; Ninokawa, A.T.; Rivest, E.B.; Leighton, L.R. Ocean change within shoreline communities: From biomechanics to behaviour and beyond. Conserv. Physiol. 2019, 7, 1–14. [Google Scholar] [CrossRef]
- George, M.N.; O’Donnell, M.J.; Concodello, M.; Carrington, E. Mussels repair shell damage despite limitations imposed by ocean acidification. J. Mar. Sci. Eng. 2022, 10, 359. [Google Scholar] [CrossRef]
- Waldbusser, G.G.; Gray, M.W.; Hales, B.; Langdon, C.J.; Haley, B.A.; Gimenez, I.; Smith, S.R.; Brunner, E.L.; Hutchinson, G. Slow shell building, a possible trait for resistance to the effects of acute ocean acidification. Limnol. Oceanogr. 2016, 61, 1969–1983. [Google Scholar] [CrossRef] [Green Version]
- Jokiel, P.L. Ocean acidification and control of reef coral calcification by boundary layer limitation of proton flux. Bull. Mar. Sci. 2011, 87, 639–657. [Google Scholar] [CrossRef]
- Hasler, C.T.; Butman, D.; Jeffrey, J.D.; Suski, C.D. Freshwater biota and rising pCO2? Ecol. Lett. 2016, 19, 98–108. [Google Scholar] [CrossRef] [PubMed]
- Aufdenkampe, A.K.; Mayorga, E.; Raymond, P.A.; Melack, J.M.; Doney, S.C.; Alin, S.R.; Aalto, R.E.; Yoo, K. Riverine coupling of biogeochemical cycles between land, oceans, and atmosphere. Front. Ecol. Environ. 2011, 9, 53–60. [Google Scholar] [CrossRef] [Green Version]
- Hasler, C.T.; Jeffrey, J.D.; Schneider, E.V.C.; Hannan, K.D.; Tix, J.A.; Suski, C.D. Biological consequences of weak acidification caused by elevated carbon dioxide in freshwater ecosystems. Hydrobiologia 2018, 806, 1–12. [Google Scholar] [CrossRef]
- Caldeira, K.; Wickett, M. Ocean model predictions of chemistry changes from carbon dioxide emissions to the atmosphere and ocean. J. Geophys. Res. C Ocean. 2005, 110, 1–12. [Google Scholar] [CrossRef] [Green Version]
- Waters, J.; Millero, F.J.; Woosley, R.J. Corrigendum to “The free proton concentration scale for seawater pH”, [MARCHE: 149 (2013) 8-22]. Mar. Chem. 2014, 165, 66–67. [Google Scholar] [CrossRef]
- Nathenson, M. Chemistry of Lake Tahoe, California-Nevada, and Nearby Springs; Department of the Interior, US Geological Survey: Reston, VA, USA, 1989. [Google Scholar] [CrossRef]
- Jokiel, P. Coral growth: Buoyant weight. In Coral Reefs: Research Methods; Stoddart, D.R., Johannes, R.E., Eds.; UNESCO: Paris, France, 1978; pp. 529–541. [Google Scholar]
- Shechter, A.; Berman, A.; Singer, A.; Freiman, A.; Grinstein, M.; Erez, J.; Aflalo, E.D.; Sagi, A. Reciprocal changes in calcification of the gastrolith and cuticle during the molt cycle of the red claw crayfish Cherax quadricarinatus. Biol. Bull. 2008, 214, 122–134. [Google Scholar] [CrossRef] [PubMed] [Green Version]
- Bach, L.T. Reconsidering the role of carbonate ion concentration in calcification by marine organisms. Biogeosciences 2015, 12, 4939–4951. [Google Scholar] [CrossRef] [Green Version]
- Liu, Y.W.; Sutton, J.N.; Ries, J.B.; Eagle, R.A. Regulation of calcification site pH is a polyphyletic but not always governing response to ocean acidification. Sci. Adv. 2020, 6, eaax1314. [Google Scholar] [CrossRef] [Green Version]
- Kroeker, K.J.; Kordas, R.L.; Crim, R.N.; Singh, G.G. Meta-analysis reveals negative yet variable effects of ocean acidification on marine organisms. Ecol. Lett. 2010, 13, 1419–1434. [Google Scholar] [CrossRef]
- Cummings, K.S.; Graf, D.L. Mollusca: Bivalvia. In Ecology and Classification of North American Freshwater Invertebrates; Thorp, J.H., Covich, A.P., Eds.; Elsevier: London, UK, 2010; pp. 309–384. ISBN 978-0-12-374855-3. [Google Scholar]
- Guralnick, R. Life-history patterns in the brooding freshwater bivalve Pisidium (Sphaeriidae). J. Molluscan Stud. 2004, 70, 341–351. [Google Scholar] [CrossRef]
- Dodd, L.F.; Grabowski, J.H.; Piehler, M.F.; Westfield, I.; Ries, J.B. Ocean acidification impairs crab foraging behavior. Proc. R. Soc. B Biol. Sci. 2015, 282, 1–9. [Google Scholar] [CrossRef] [Green Version]
- Dickinson, G.H.; Bejerano, S.; Salvador, T.; Makdisi, C.; Patel, S.; Long, W.C.; Swiney, K.M.; Foy, R.J.; Steffel, B.V.; Smith, K.E.; et al. Ocean acidification alters properties of the exoskeleton in adult Tanner crabs, Chionoecetes bairdi. J. Exp. Biol. 2021, 224, jeb232819. [Google Scholar] [CrossRef] [PubMed]
- Kroeker, K.J.; Micheli, F.; Gambi, M.C. Ocean acidification causes ecosystem shifts via altered competitive interactions. Nat. Clim. Chang. 2013, 3, 156–159. [Google Scholar] [CrossRef]
- Dodds, W.K.; Perkin, J.S.; Gerken, J.E. Human impact on freshwater ecosystem services: A global perspective. Environ. Sci. Technol. 2013, 47, 9061–9068. [Google Scholar] [CrossRef] [PubMed]
- Vaughn, C.C.; Hakenkamp, C.C. The functional role of burrowing bivalves in freshwater ecosystems. Freshw. Biol. 2001, 46, 1431–1446. [Google Scholar] [CrossRef] [Green Version]
- Reynolds, J.; Souty-Grosset, C.; Richardson, A. Ecological roles of crayfish in freshwater and terrestrial habitats. Freshw. Crayfish 2013, 19, 197–218. [Google Scholar] [CrossRef]


| Parameter | Units | Low pCO2 | Intermediate pCO2 | High pCO2 |
|---|---|---|---|---|
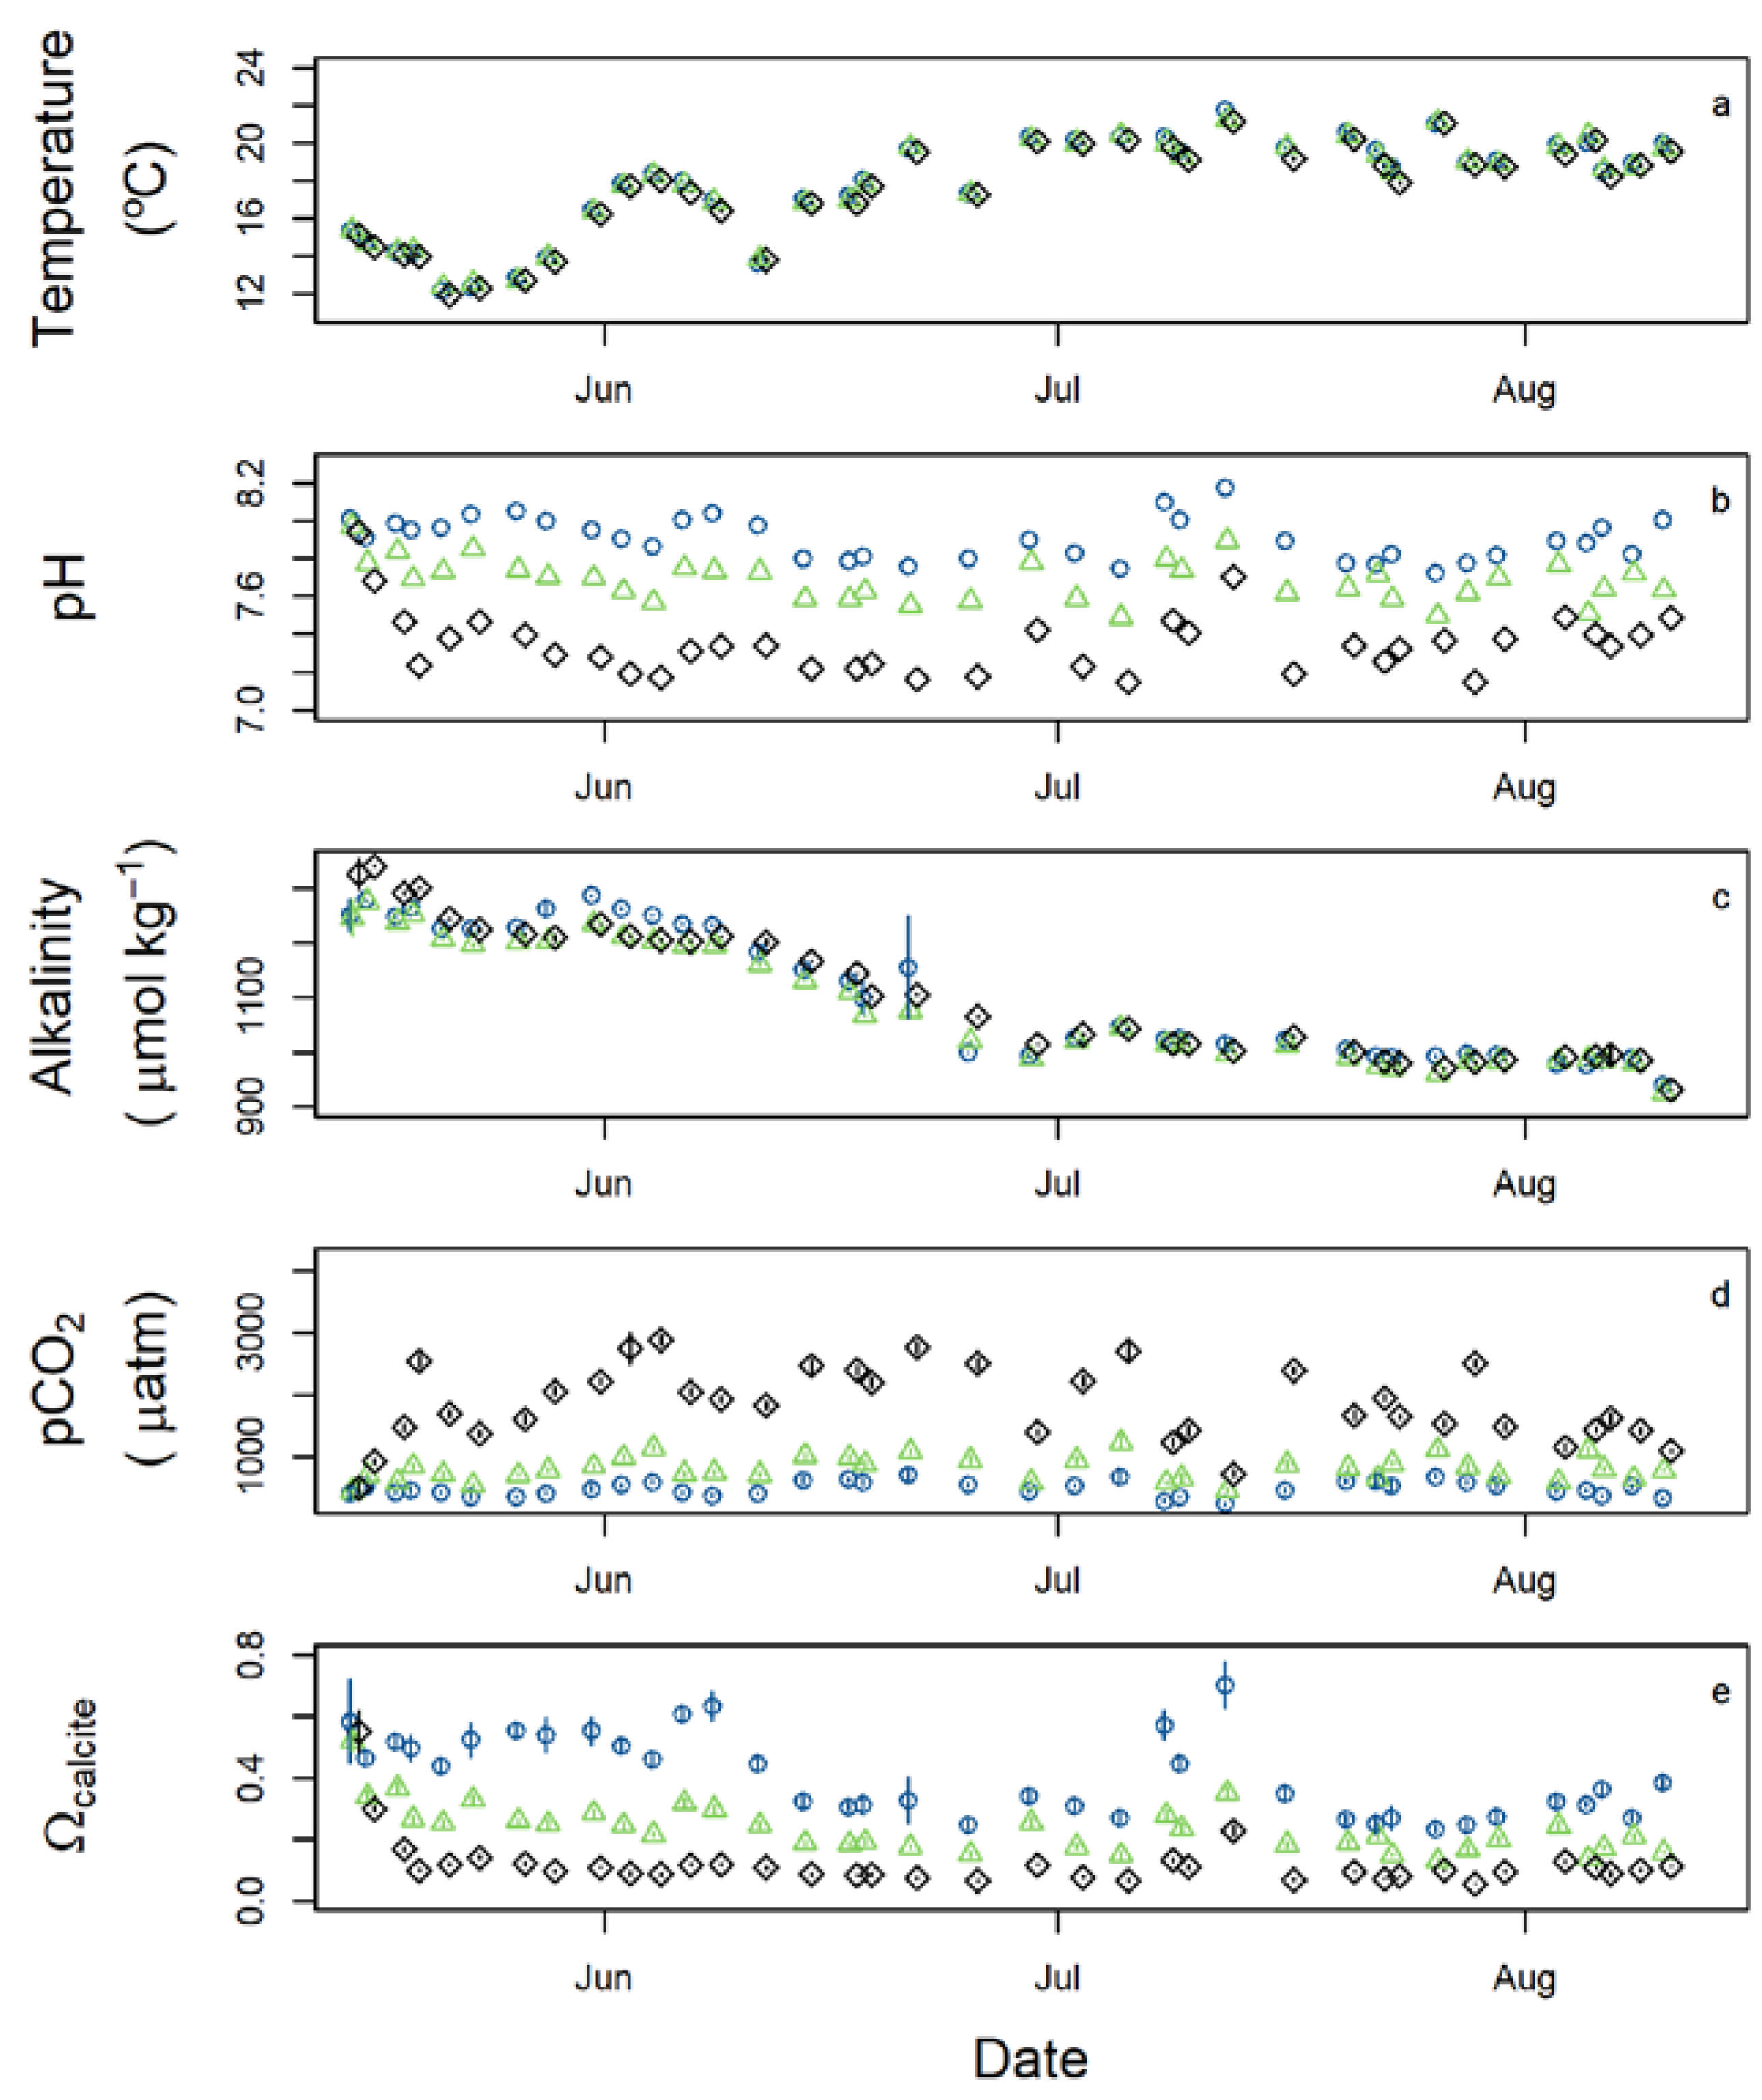
| Temperature | °C | 17.9 (2.6) | 17.9 (2.5) | 17.6 (2.5) |
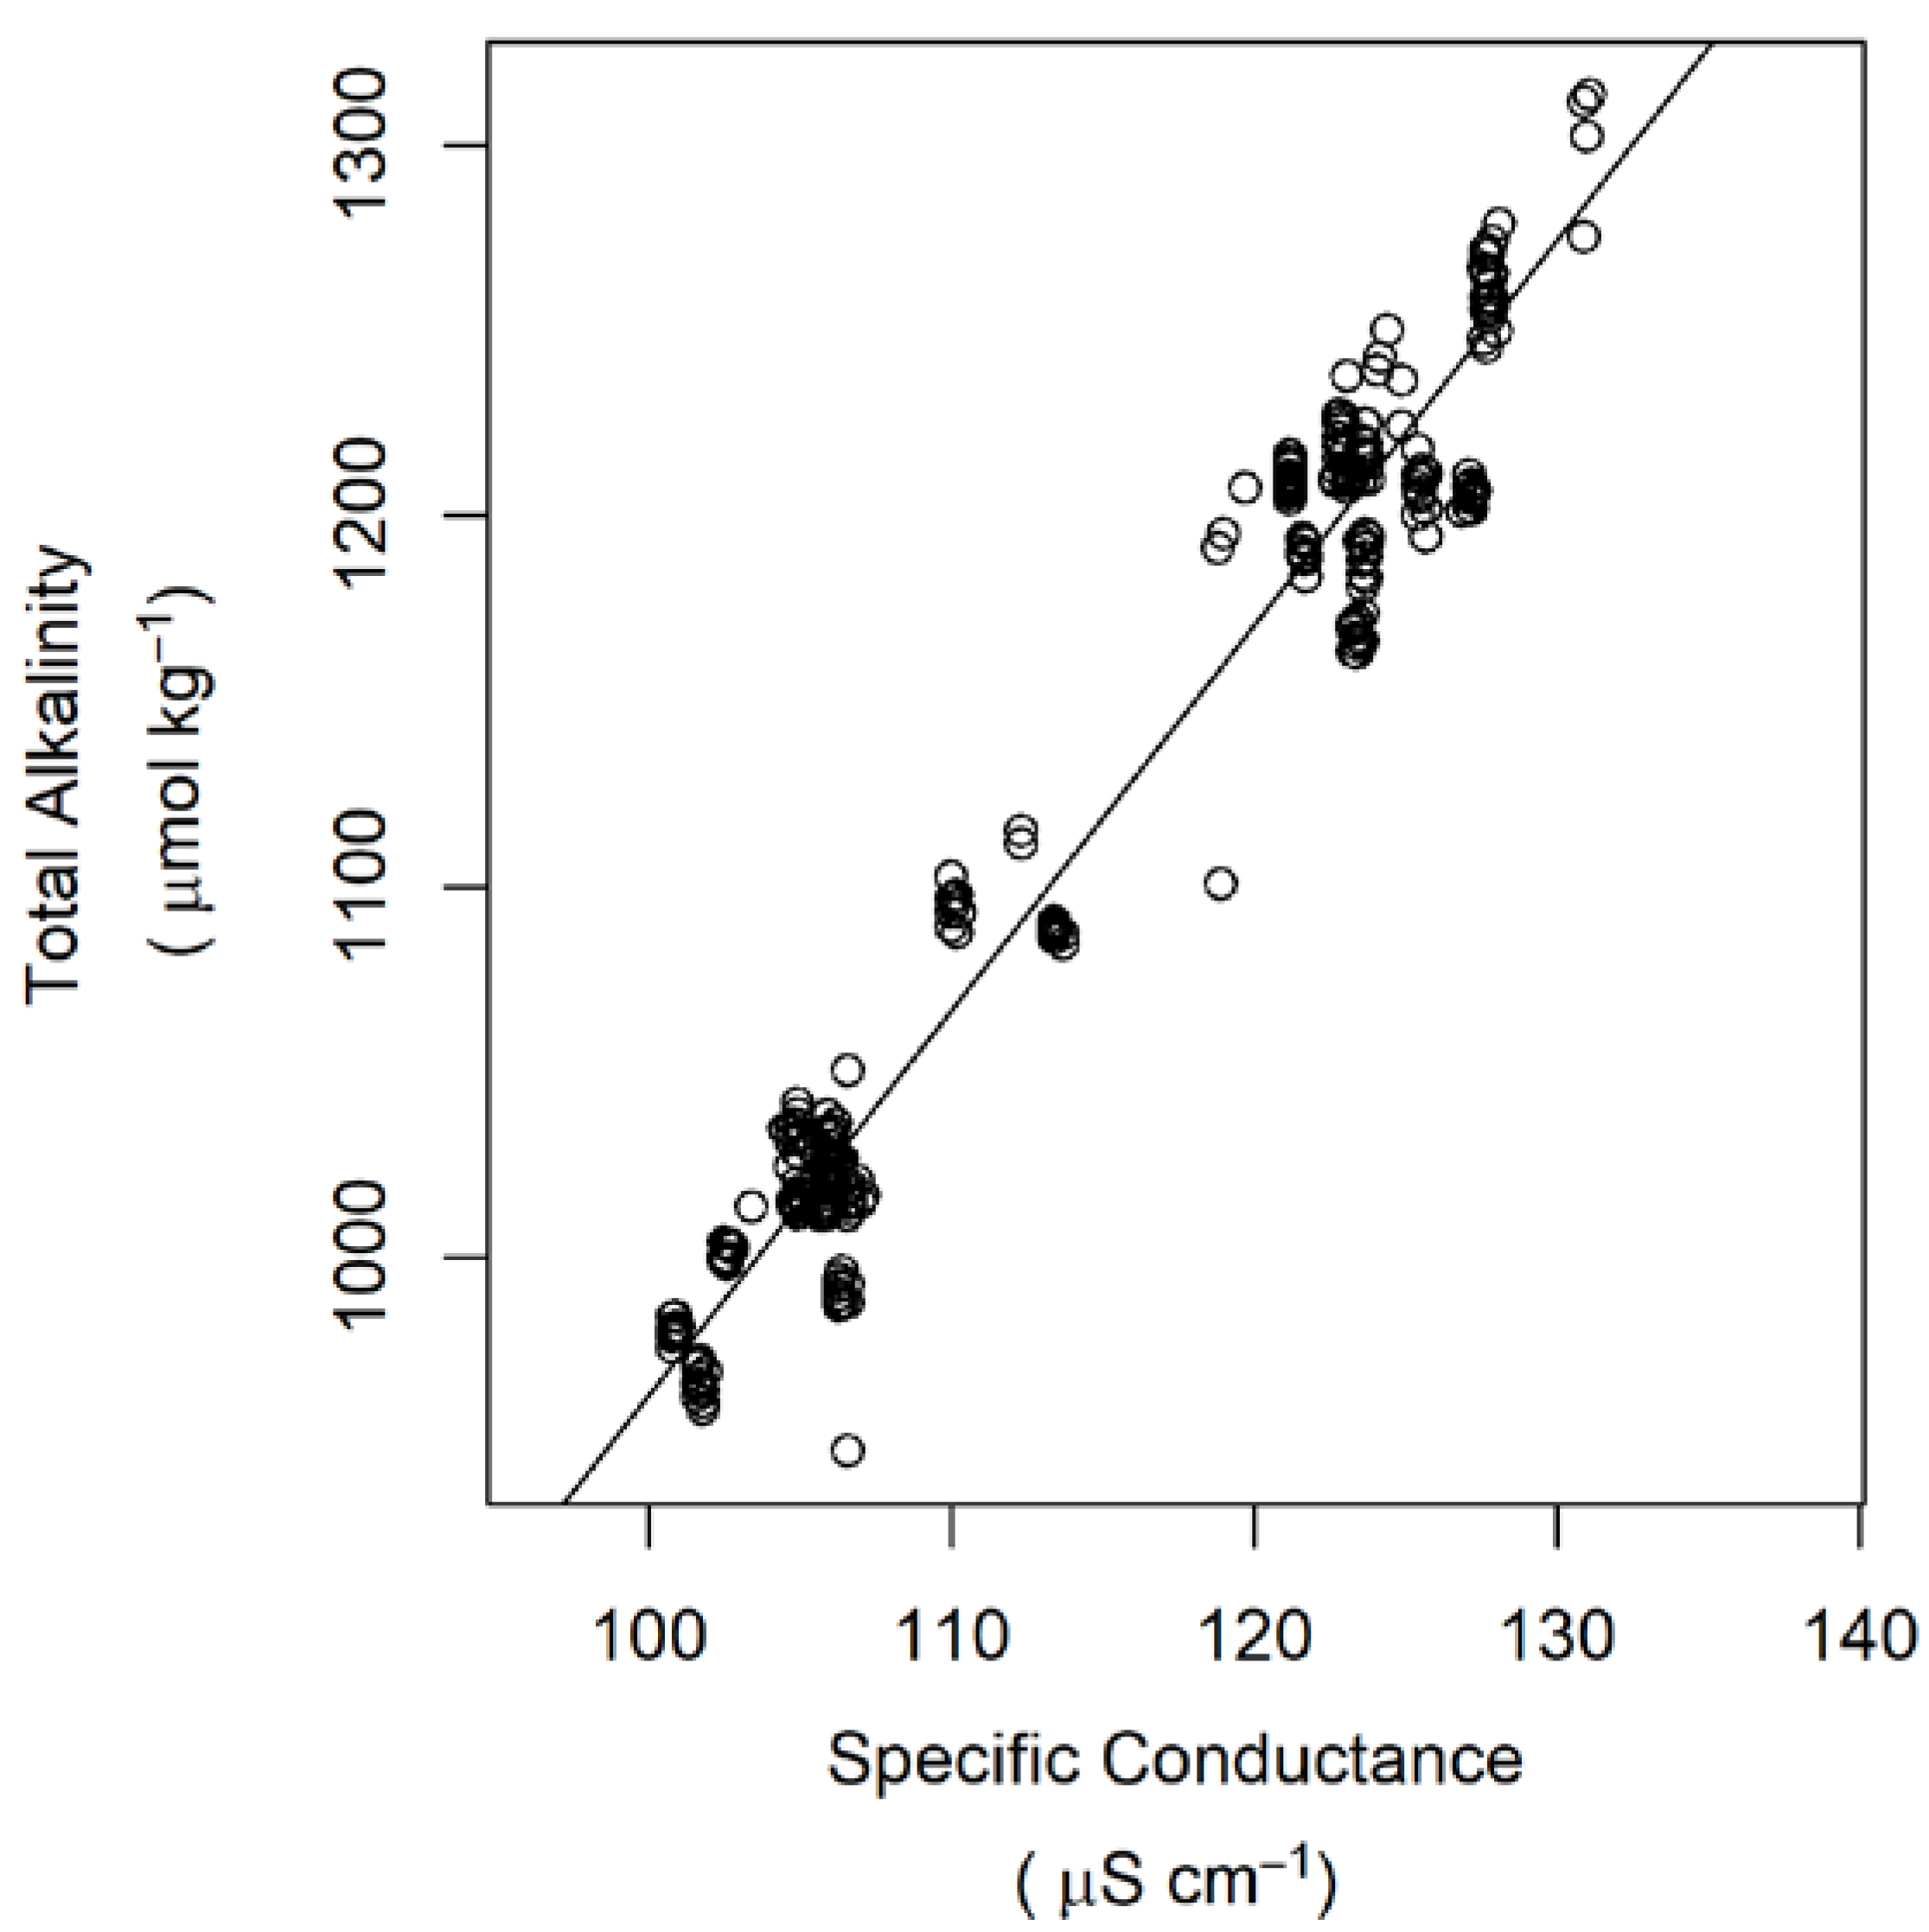
| Specific conductance | µS cm−1 | 113 (11) | 111 (10) | 113 (11) |
| Dissolved oxygen | µmol L−1 | 232 (13) | 230 (13) | 227 (9) |
| pH (NBS scale) | 7.91 (0.11) | 7.67 (0.10) | 7.32 (0.12) | |
| Total alkalinity | µmol kg−1 | 1098 (116) | 1078 (102) | 1093 (110) |
| pCO2 | µatm | 616 (151) | 1026 (239) | 2380 (693) |
| [HCO3−] | µmol kg−1 | 1088 (114) | 1072 (102) | 1090 (110) |
| [CO32−] | µmol kg−1 | 4.7 (1.4) | 2.7 (0.7) | 1.2 (0.4) |
| Ωaragonite | 0.50 (0.16) | 0.28 (0.08) | 0.13 (0.04) |
| Species | Low pCO2 | Intermediate pCO2 | High pCO2 |
|---|---|---|---|
| P. leniusculus | −0.007 (0.003), 10 | −0.009 (0.002), 15 | −0.019 (0.003), 8 |
| C. fluminea | −0.018 (0.004), 33 | −0.019 (0.004), 31 | −0.032 (0.004), 31 |
| M. margaritifera | −0.087 (0.006), 25 | −0.082 (0.008), 19 | −0.108 (0.008), 18 |
| Pisidium sp. | 0.003 (0.003), 29 | 0.013 (0.003), 35 | 0.007 (0.003), 21 |
| Species | Model | b0 | b1 | b2 | R2 | RMSE | F-Statistic | p-Value | AIC |
|---|---|---|---|---|---|---|---|---|---|
| P. leniusculus | linear | −1.79 × 10⁻³ | −5.42 × 10⁻⁶ | 0.257 | 0.008 | 10.71 (1, 31) | 0.0026 | −217.18 | |
| P. leniusculus | exponential | −1.10 × 10⁻⁴ | −4.71 × 10⁻³ | 4.41 × 10⁻⁴ | 0.260 | 0.008 | 5.29 (2, 30) | 0.0104 | −215.33 |
| P. leniusculus | parabolic | −5.84 × 10⁻³ | −4.32 × 10⁻⁷ | −1.19 × 10⁻⁹ | 0.260 | 0.008 | 5.27 (2, 30) | 0.0105 | −215.32 |
| C. fluminea | linear | −1.35 × 10⁻² | −5.76 × 10⁻⁶ | 0.052 | 0.024 | 5.13 (1, 93) | 0.0258 | −433.29 | |
| C. fluminea | exponential | 1.32 × 10⁻² | −2.80 × 10⁻² | 1.49 × 10⁻⁴ | 0.050 | 0.024 | 2.4 (2, 92) | 0.0963 | −431.04 |
| C. fluminea | parabolic | 2.53 × 10⁻³ | −2.80 × 10⁻⁵ | 5.64 × 10⁻⁹ | 0.067 | 0.024 | 3.3 (2, 92) | 0.0410 | −432.78 |
| M. margaritifera | linear | −7.38 × 10⁻² | −1.15 × 10⁻⁵ | 0.099 | 0.032 | 6.6 (1, 60) | 0.0126 | −243.26 | |
| M. margaritifera | exponential | −4.67 × 10⁻² | −3.66 × 10⁻² | 8.29 × 10⁻⁵ | 0.044 | 0.033 | 0.52 (2, 59) | 0.5973 | −229.62 |
| M. margaritifera | parabolic | −7.86 × 10⁻² | −4.40 × 10⁻⁶ | −1.90 × 10⁻⁹ | 0.100 | 0.032 | 3.27 (2, 59) | 0.0447 | −241.29 |
| Pisidium sp. | linear | 8.06 × 10⁻³ | −5.23 × 10⁻⁸ | 0.000 | 0.017 | 0.001 (1, 83) | 0.9815 | −442.70 | |
| Pisidium sp. | exponential | −7.37 × 10⁻³ | 1.54 × 10⁻² | −3.09 × 10⁻⁶ | 0.000 | 0.017 | 0.0002 (2, 82) | 0.9998 | −440.70 |
| Pisidium sp. | parabolic | −1.68 × 10⁻² | 3.37 × 10⁻⁵ | −8.68 × 10⁻⁹ | 0.076 | 0.017 | 3.393 (2, 82) | 0.0383 | −447.46 |
Publisher’s Note: MDPI stays neutral with regard to jurisdictional claims in published maps and institutional affiliations. |
© 2022 by the authors. Licensee MDPI, Basel, Switzerland. This article is an open access article distributed under the terms and conditions of the Creative Commons Attribution (CC BY) license (https://creativecommons.org/licenses/by/4.0/).
Share and Cite
Ninokawa, A.T.; Ries, J. Responses of Freshwater Calcifiers to Carbon-Dioxide-Induced Acidification. J. Mar. Sci. Eng. 2022, 10, 1068. https://doi.org/10.3390/jmse10081068
Ninokawa AT, Ries J. Responses of Freshwater Calcifiers to Carbon-Dioxide-Induced Acidification. Journal of Marine Science and Engineering. 2022; 10(8):1068. https://doi.org/10.3390/jmse10081068
Chicago/Turabian StyleNinokawa, Aaron T., and Justin Ries. 2022. "Responses of Freshwater Calcifiers to Carbon-Dioxide-Induced Acidification" Journal of Marine Science and Engineering 10, no. 8: 1068. https://doi.org/10.3390/jmse10081068