1. Introduction
Tsunamis are destructive waves caused by earthquakes, volcanic eruptions, underwater landslides, or climate change [
1]. Although the initial wave heights of tsunamis are usually around one meter high in deep ocean water, when they gradually approach the coast at a high propagating speed [
2], their wave lengths are shortened and their wave heights can increase dramatically [
3]. Since the global tsunami zone is roughly the same as the earthquake zone, the occurrence of tsunamis greatly threatens the safety and intactness of the coastal regions in this area. For instance, the 2011 Japan tsunami caused devastating damage to the coastal region as far as 7 miles inland, resulting in 14,508 casualties and 11,452 missing people, over 162,000 damaged buildings, and 300 damaged coastal highway bridges [
4,
5]. The tsunami aftermath survey revealed that coastal protection facilities, such as seawalls, can effectively delay the arrival of a wave to land and greatly reduce the flooding area [
6,
7]. However, many protection facilities, such as seawalls, were also seriously damaged during the tsunami. Therefore, it is of great significance to study the performance of coastal protection facilities under the impact of real-world tsunamis.
As a typical protection barrier, seawalls are commonly built along the coastline to prevent coastal regions from extreme surges and waves generated during hurricanes and tsunamis. The existence of seawalls can effectively reduce the hydrodynamic load on the coastal infrastructures behind them [
8]. Prabu et al. [
9] pointed out that the wave energy of a tsunami wave can be mainly dissipated by the attenuation of wave height, shoaling on a sloped beach, structures such as a seawalls, reflection due to structures, overtopping, and further inland inundation. Hence, much research has been carried out to study the complex flow phenomena of the impact of tsunami waves on seawalls with different configurations, such as vertical seawalls [
10,
11], curved seawalls [
12], and sloping seawalls [
13]. Moreover, the performance of seawalls under the impact of various types of incident waves, i.e., solitary waves [
14], regular waves [
15], and irregular waves [
16], has been extensively evaluated by carrying out both experimental works and numerical simulations over the past few decades.
In previous research, solitary waves and dam-break surge bores were commonly applied as typical tsunami wave models to study the hydrodynamic characteristics of real-world tsunamis [
17,
18]. The runup processes of solitary waves on sloped beaches have been well studied by many researchers using both experimental and simulation approaches [
19,
20,
21]. In addition, the wave attenuation of tsunamis by vegetation patches has also been studied by applying solitary waves [
22,
23]. Landslide tsunamis have been studied by Watts et al. [
24], who used a Boussinesq wave model. In addition to research on the hydrodynamic characteristics of tsunami waves, extensive studies have been also performed to understand the performance of seawalls under the impact of solitary waves and dam-break surge bores [
25,
26,
27,
28,
29]. For instance, Hsiao and Lin [
30] experimentally investigated the hydrodynamic processes of a solitary wave impinging and overtopping an impermeable trapezoidal seawall located at a 1:20 sloped beach. By applying an incompressible SPH model, Liang et al. [
31] discussed the hydrodynamic characteristics and structural dynamic responses of a vertical seawall under the impact of a solitary wave. By applying surge bores with various heights generated by the dam-break flow, Mokhtar et al. [
32] experimentally studied the tsunami-induced bore pressures exerted on vertical solid and porous seawalls. Prabu et al. [
9] numerically investigated the propagation, impinging, and overtopping of tsunami surge bores over a trapezoidal sea dike on a 1:40 sloped beach and its protection performance in relation to the buildings behind it. It was found from the study that maximum impact force on the onshore building was least when the dike was located close to the building and when the ratio of wave height to dike height was low. Xu et al. [
33] carried out a series of physical experiments to evaluate the effectiveness of barriers in reducing tsunami bore impact loads on a vertical wall. They also proposed some empirical formulas for predicting the reduction ratios of horizontal forces and overturning moments. On the whole, these and other related studies are of great significance for the research community to correctly understand the hydrodynamic characteristics of seawalls in relation to reflection efficiency [
34], wave energy dissipation [
35], and overtopping properties [
36].
Although dam-break surge bores and solitary waves can capture some of the main features of tsunami waves, the spatial-temporal scales of real-world tsunamis differ drastically from that of dam-break surge bores and solitary waves in both wave period and wave length [
37]. In recent years, the rationality of typical tsunami wave models based on dam-break surge bores and solitary waves has been questioned by many researchers [
8,
38]. This also indicates the limitations of the engineering applications of previous research on seawalls to a certain extent. In this study, rather than using a dam-break surge bore or a solitary wave as the tsunami wave model, a parameterized tsunami wave profile [
39] is applied to evaluate the performance of seawalls in mitigating a real-world tsunami wave using a nonhydrostatic numerical wave model. This parameterized tsunami wave profile is proposed based on the real-world tsunami wave profile observed during the 2011 Japan tsunami, and has been successfully applied in studying the hydrodynamic characteristics of coastal bridges [
40], horizontal cylinders [
41], and the wave attenuation of coastal vegetation patches [
42]. In this study, the effects of prominent factors, such as incident wave height, still water depth, beach slope, and the side slope of the seawall, on the hydrodynamic characteristics of the seawall are systematically discussed.
The rest of the paper is organized as follows.
Section 2 describes the governing equations and corresponding numerical methods.
Section 3 presents the wave generation method. Model validations are performed in
Section 4.
Section 5 presents the results and discussions. Concluding remarks are provided in
Section 5.
3. Wave Condition
The tsunami-like wave and solitary wave are numerically generated by imposing Dirichlet boundary conditions at the left side of the computational domain in this study. The temporal evolution of the water surface elevation of a solitary wave [
46] at a constant water depth can described as
where
is the incident wave height,
is the location of the wave crest at
,
=
denotes the wave speed, and
=
is the effective wave number.
During the past decade, more and more researchers have recognized that the solitary wave cannot accurately describe the leading depression waves or the following secondary elevated waves of real-world tsunami waves [
14,
39,
47,
48]. Chan and Liu [
37] proposed a combination of three hyperbolic secant squared functions (sech
2(*)) to describe the tsunami wave profile recorded during the 2011 Tohoku tsunami. This method has also been applied in some recent studies [
10,
42,
47,
48]. The combination of three sech
2(*) waves proposed by Chan and Liu [
37] can be formulated as:
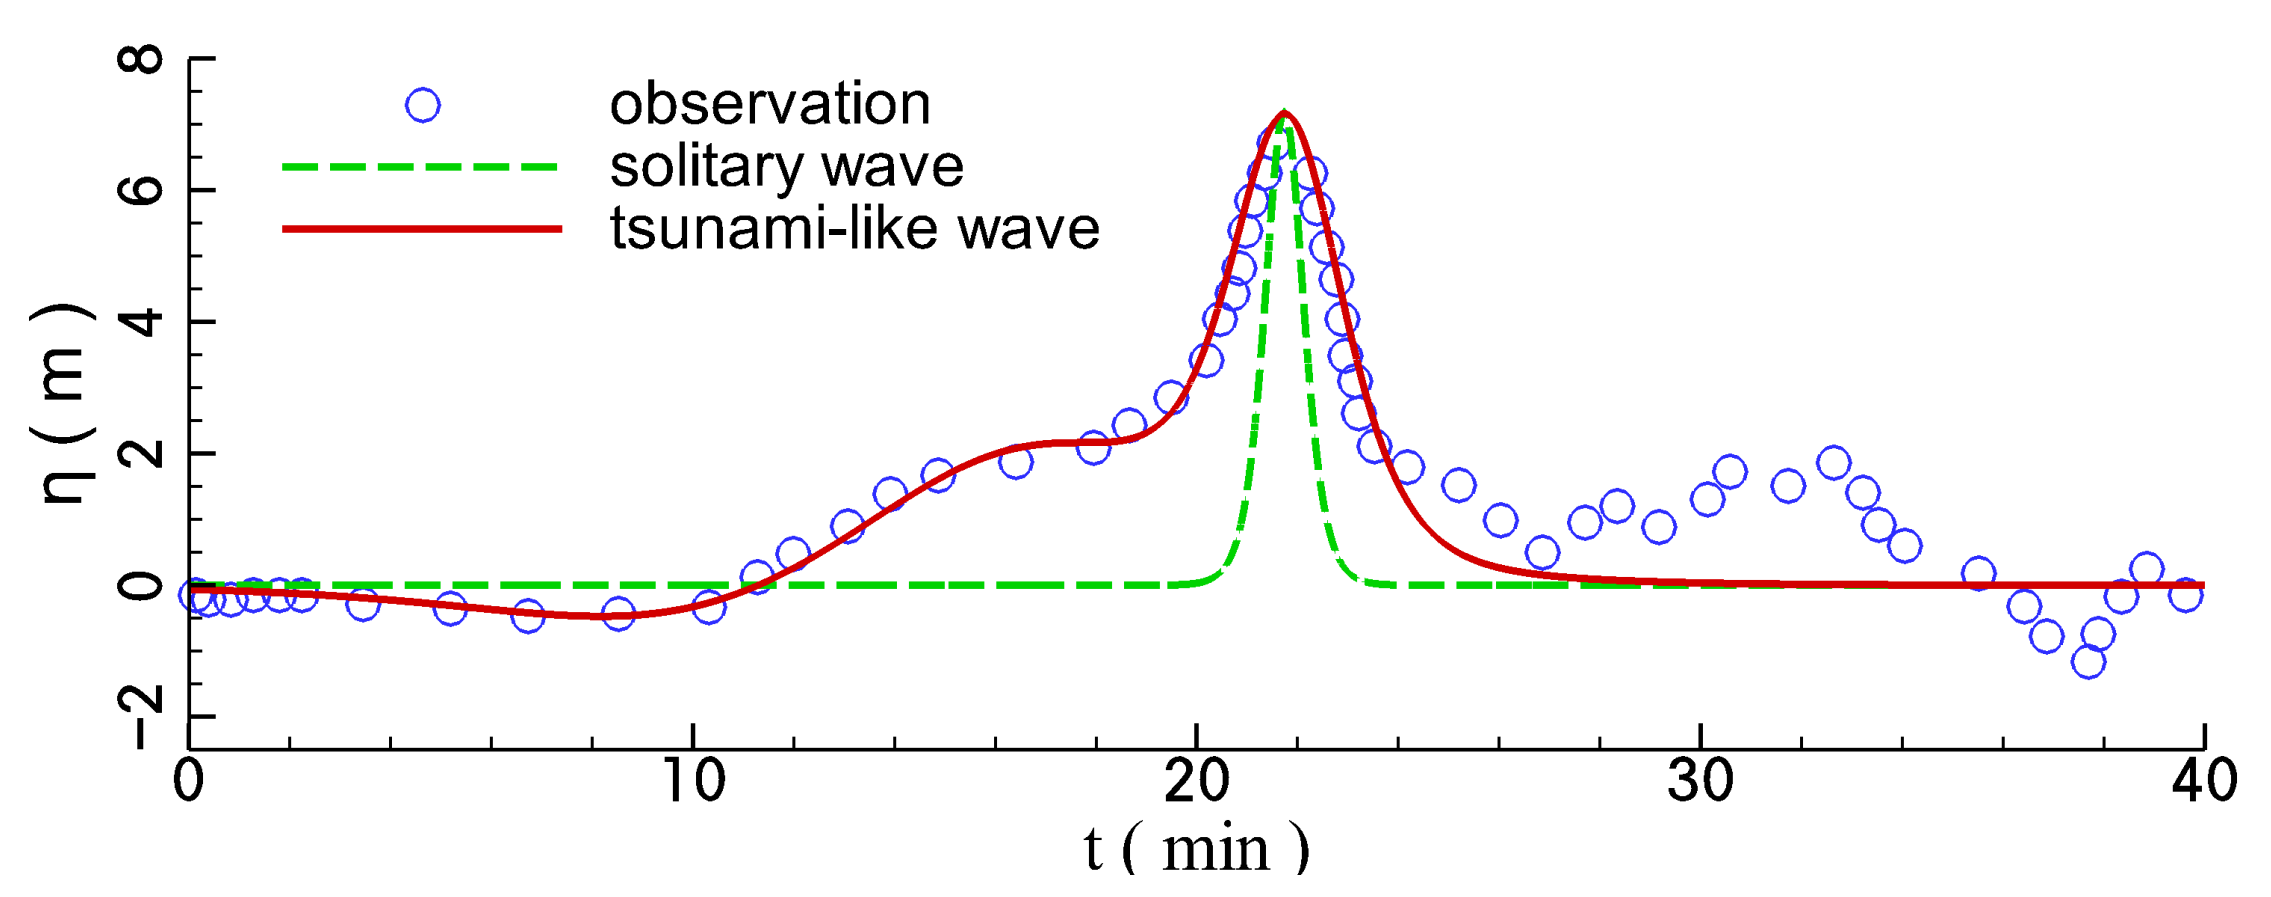
Equation (9) is applied to describe the tsunami wave profile recorded at Iwate South station during the 2011 Tohoku tsunami using
= [−0.8 2.2 5.85] m,
= [0.179 0.198 0.653] min
−1, and
= [9.67 16.33 21.63] min by Chan and Liu [
37], as shown in
Figure 1. It seems that the observed tsunami wave profile can be accurately reproduced by the combined sech
2(*) wave, whereas the solitary wave profile does not closely resemble the observations. In the following sections, the wave profile described by Equation (9) is referred to as a “tsunami-like wave”.
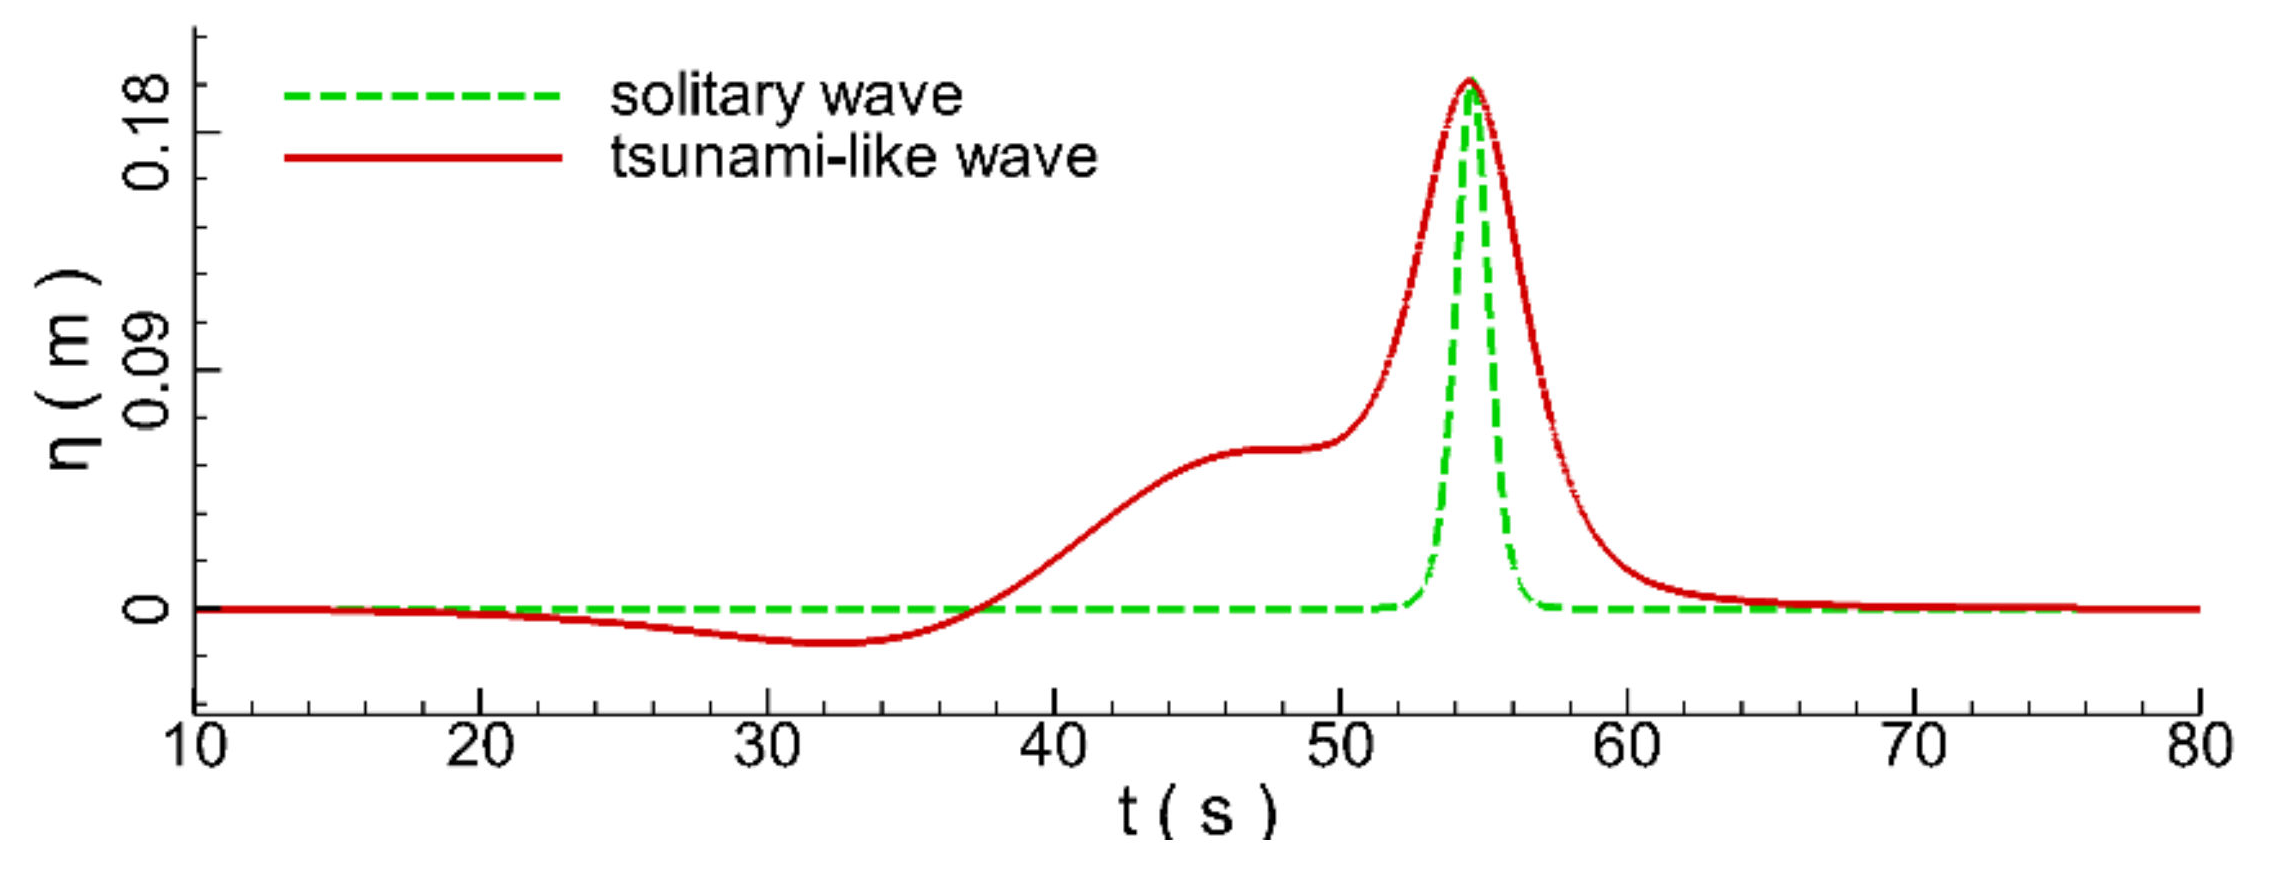
To apply Equation (9) in general situations, in our previous studies, we normalized the parameters of the tsunami-like wave proposed by Chan and Liu [
37] as
where
and
are the incident wave height and the typical wave frequency of a solitary wave with the same wave height, respectively.
is the typical wave period of a solitary wave, which can be defined by the effective wave number given by Chan and Liu [
37]. By applying Equations (10)–(12), any solitary waves can be adapted to tsunami-like waves with the same wave height. For instance,
Figure 2 compares the wave profiles of a tsunami-like wave profile and its corresponding solitary wave with a still water depth
= 1 m and wave height
= 0.2 m.
To generate a tsunami-like wave, the horizontal velocity described by Equation (13) has to be imposed at the inlet of the computational domain as:
where
and
are the wave celerity and wave elevation for each wave component in Equation (9).To generate a tsunami-like wave, the horizontal velocity described by Equation (13) has to be imposed at the inlet of the computational domain.4. Model Validation
3.1. Solitary Wave Runup Processes on a Plane Beach
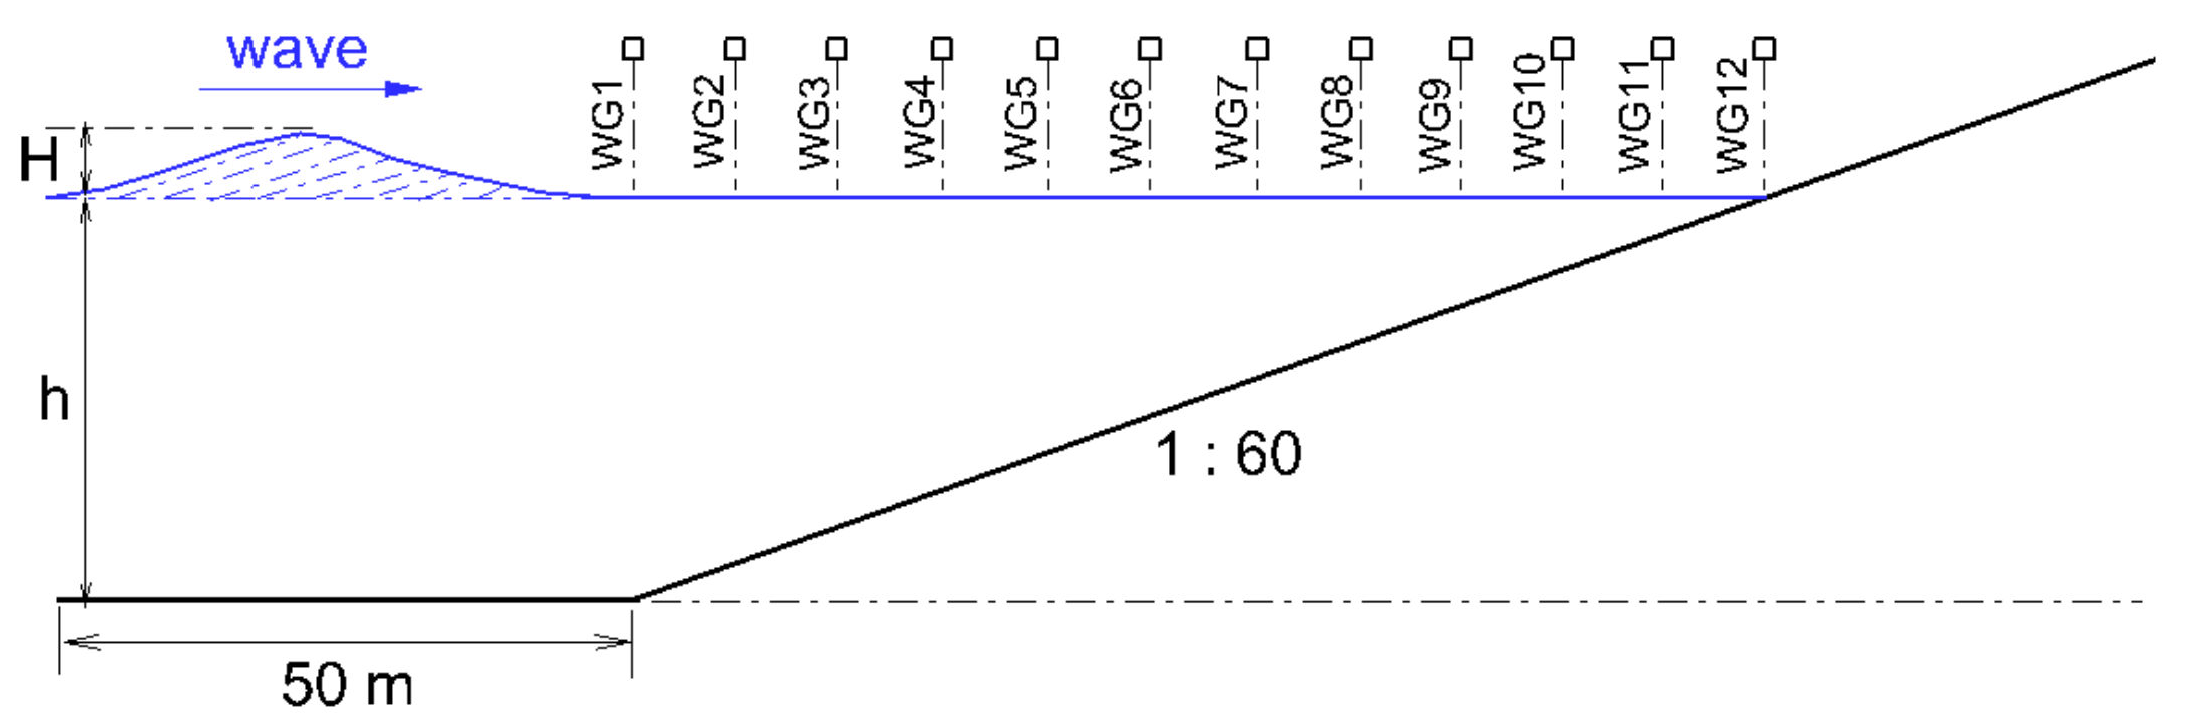
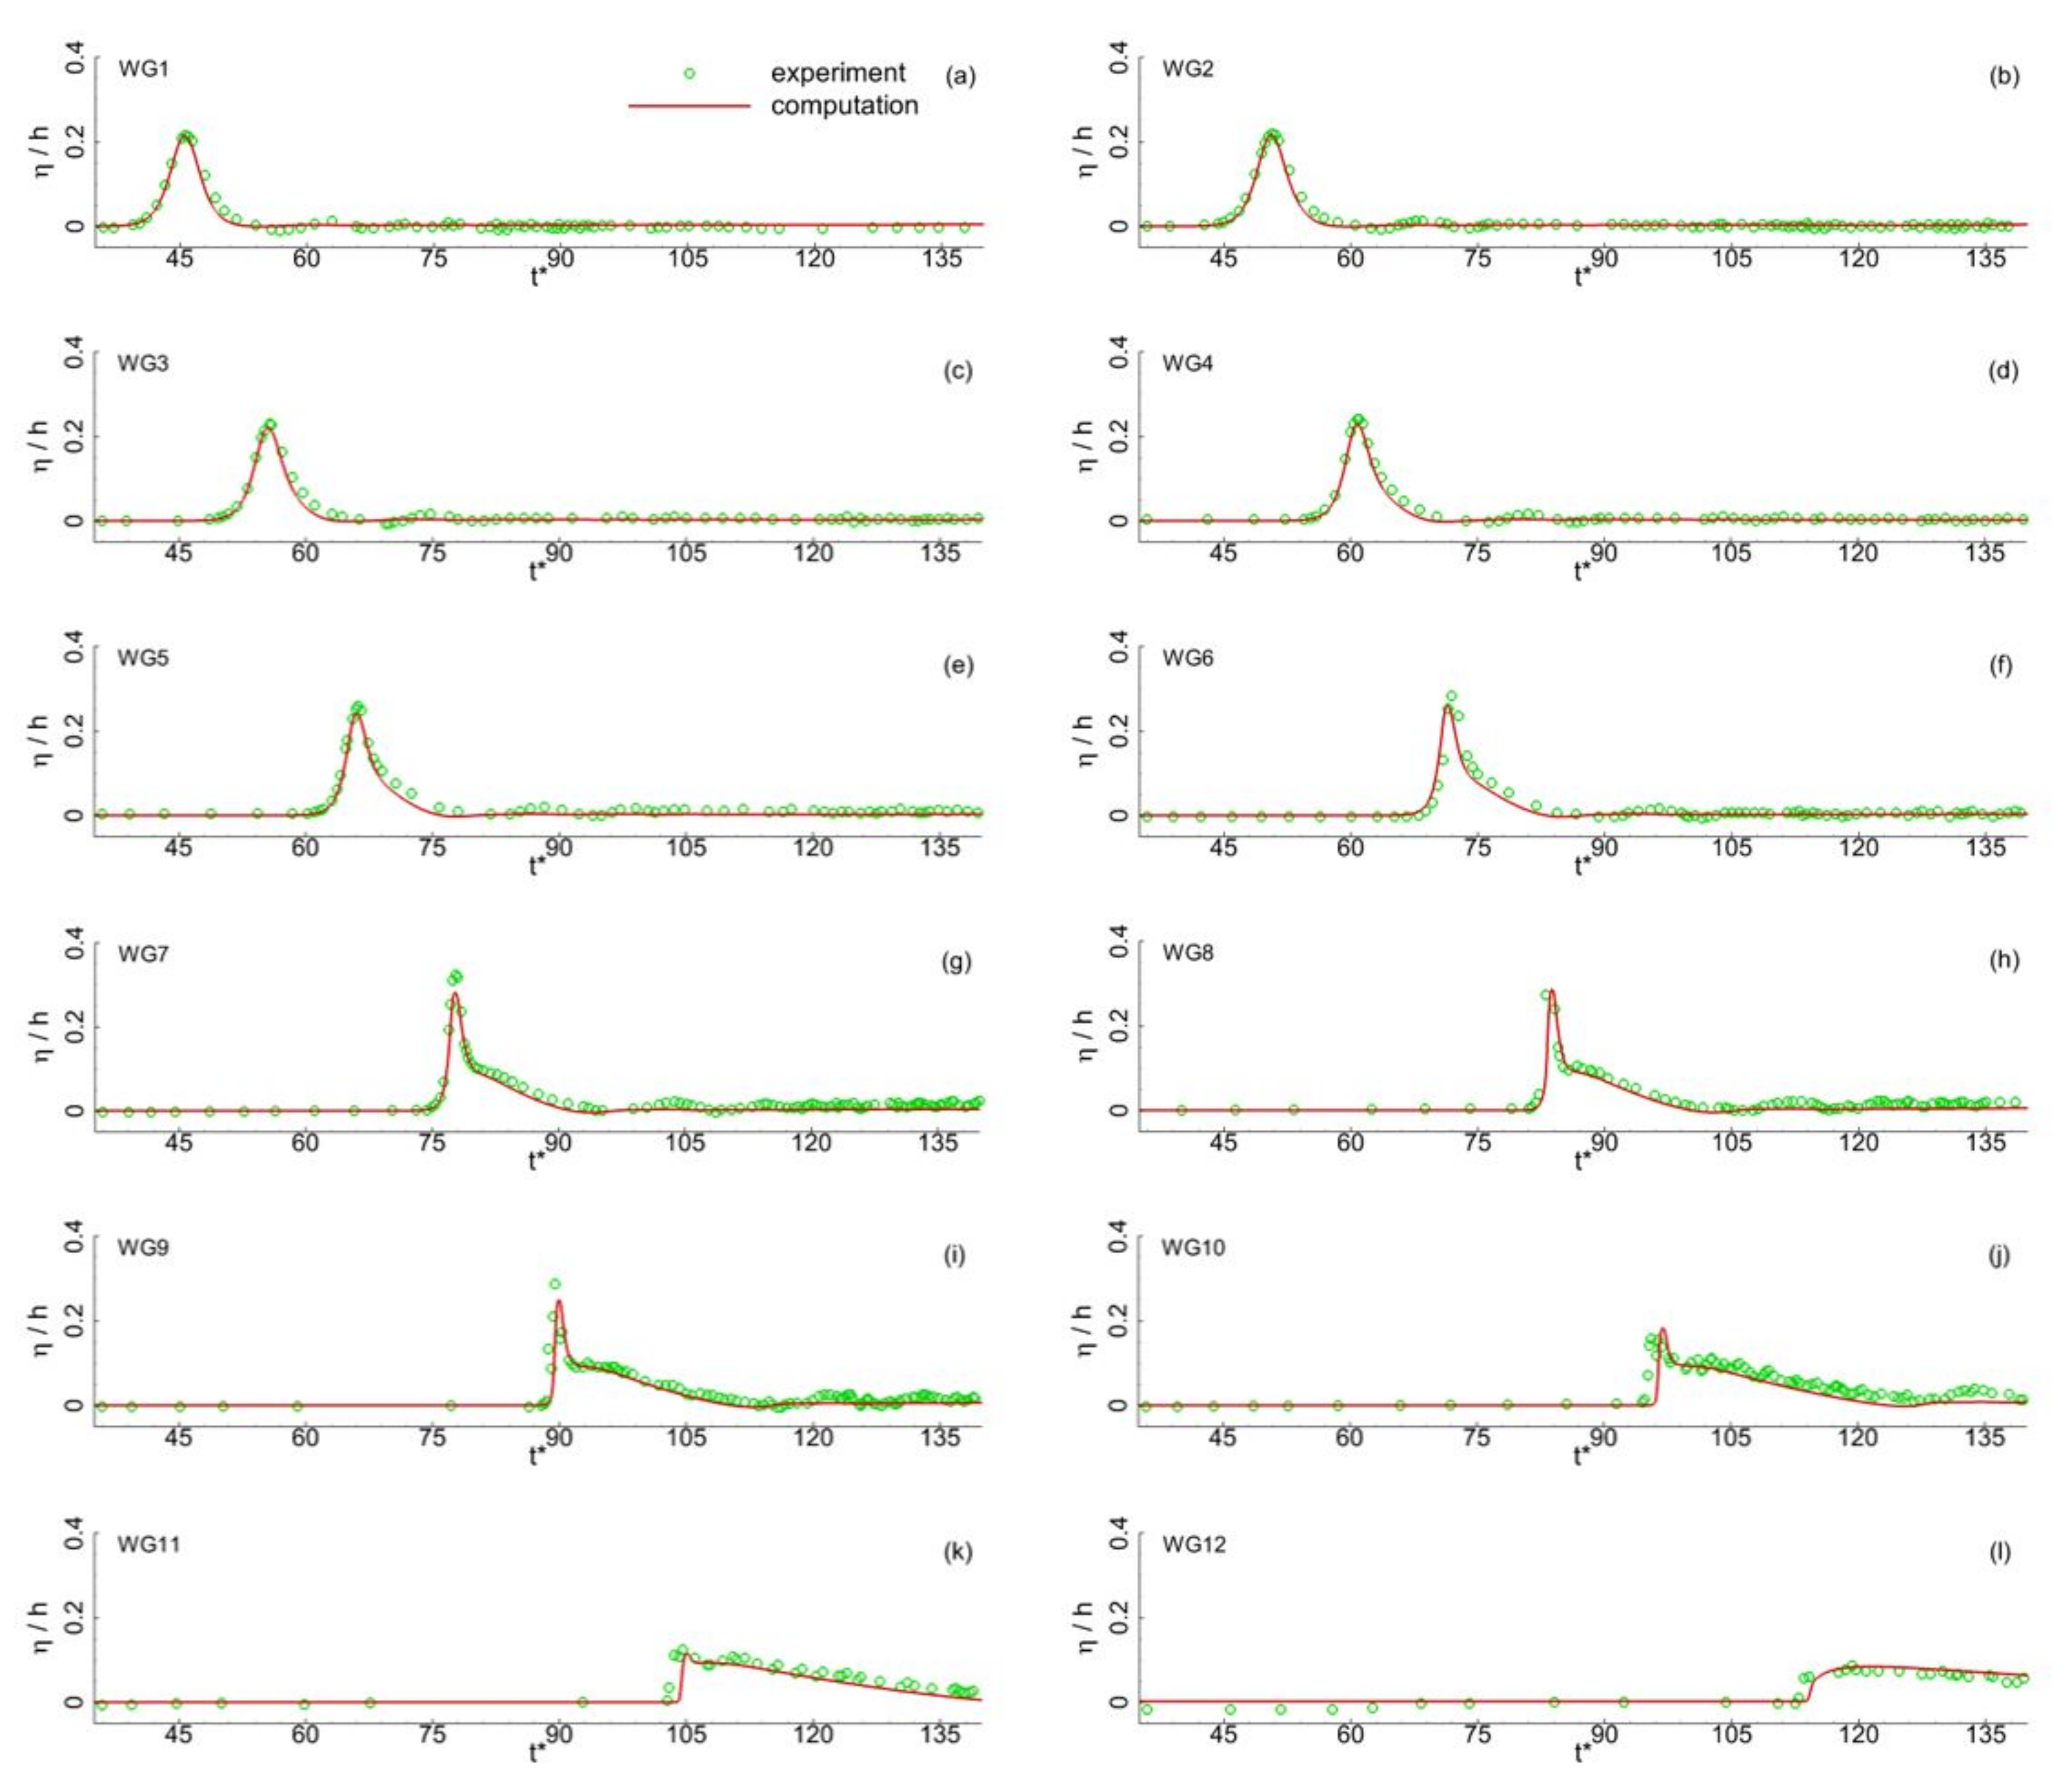
In this section, the runup processes of solitary waves on a 1:60 sloped beach are numerically simulated by applying the nonhydrostatic numerical wave model in this study. The predicted water surface elevations and maximum wave runup height are compared with the corresponding measured data collected by Hsiao et al. [
30]. The toe of the beach was located 50 m from the wave generator, as shown in
Figure 3. Twelve wave gauges (WG) were arranged along the wave flume at
= 50.0, 56.48, 62.96, 69.44, 75.92, 82.4, 89.6, 96.08, 102.56, 109.04, 115.52, and 122.0 m, respectively. In the experiment, six different wave heights (
) were selected:
= 0.054, 0.12, 0.152, 0.208, 0.264, and 0.338. The computational domain was 300 m in length. The mesh resolution in the horizontal direction was
= 0.04 m. Forty
-mesh layers were applied in the vertical direction. In the computation, the still water depth (
) was 1.2 m.
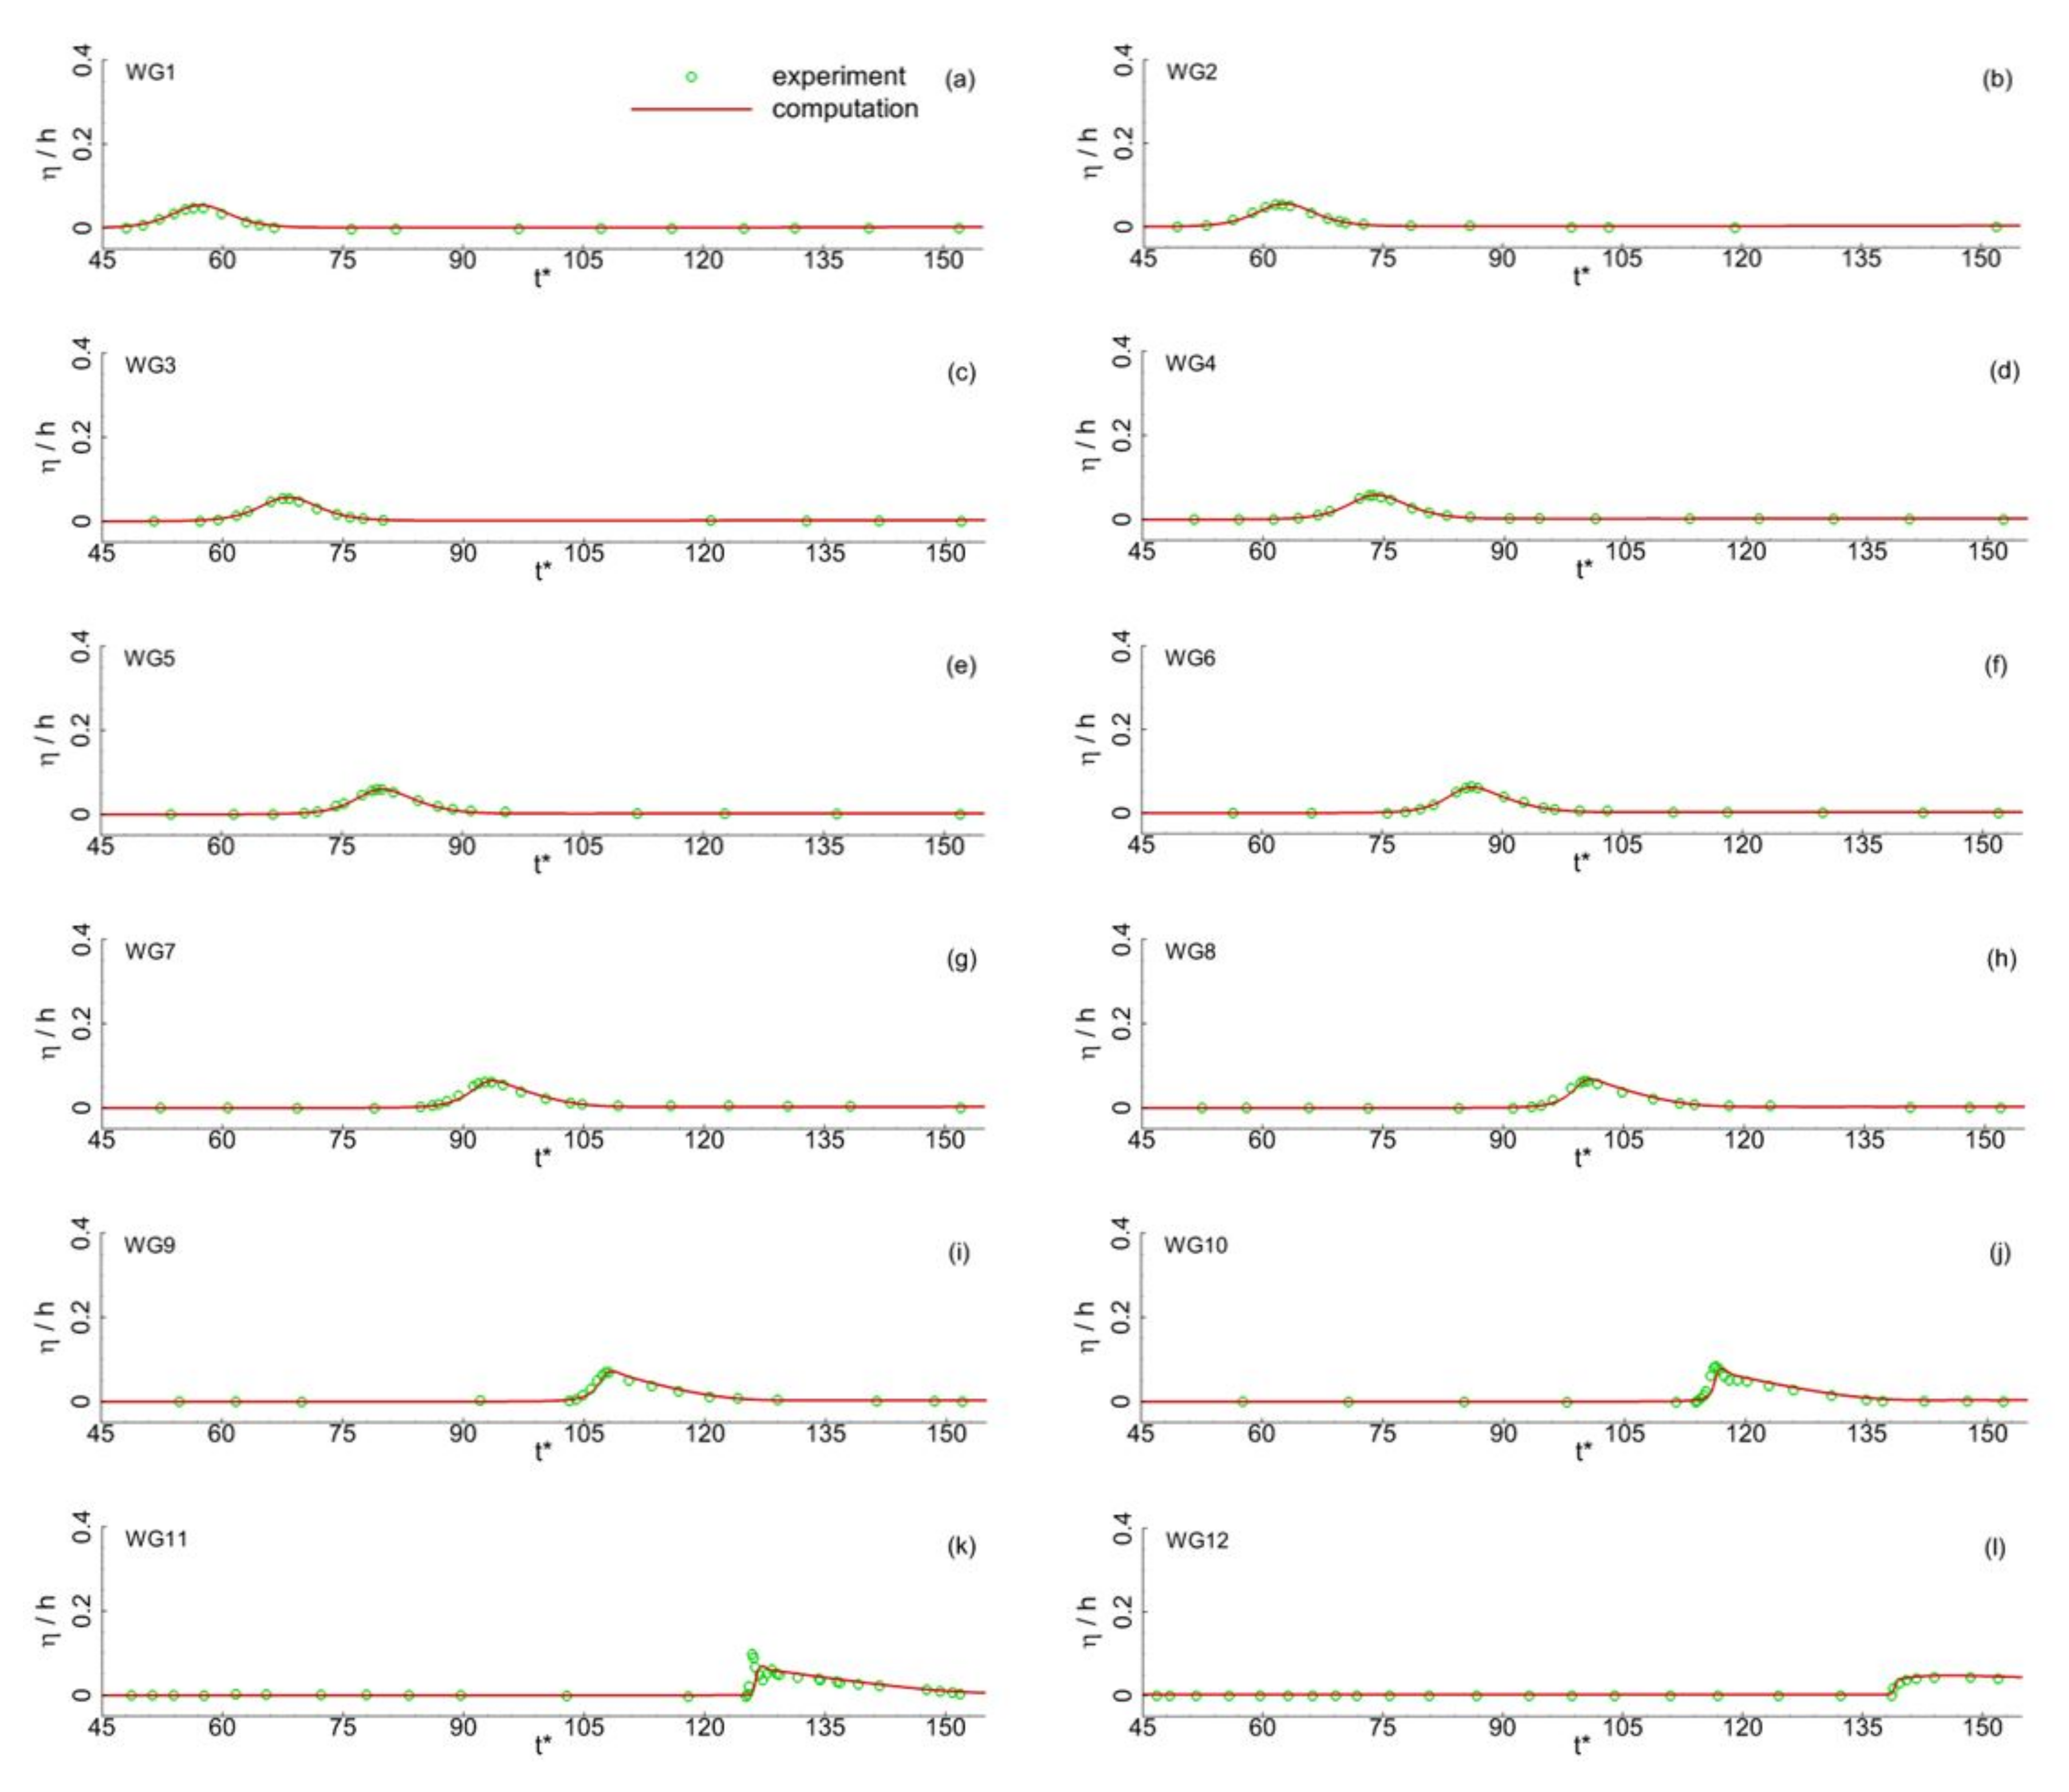
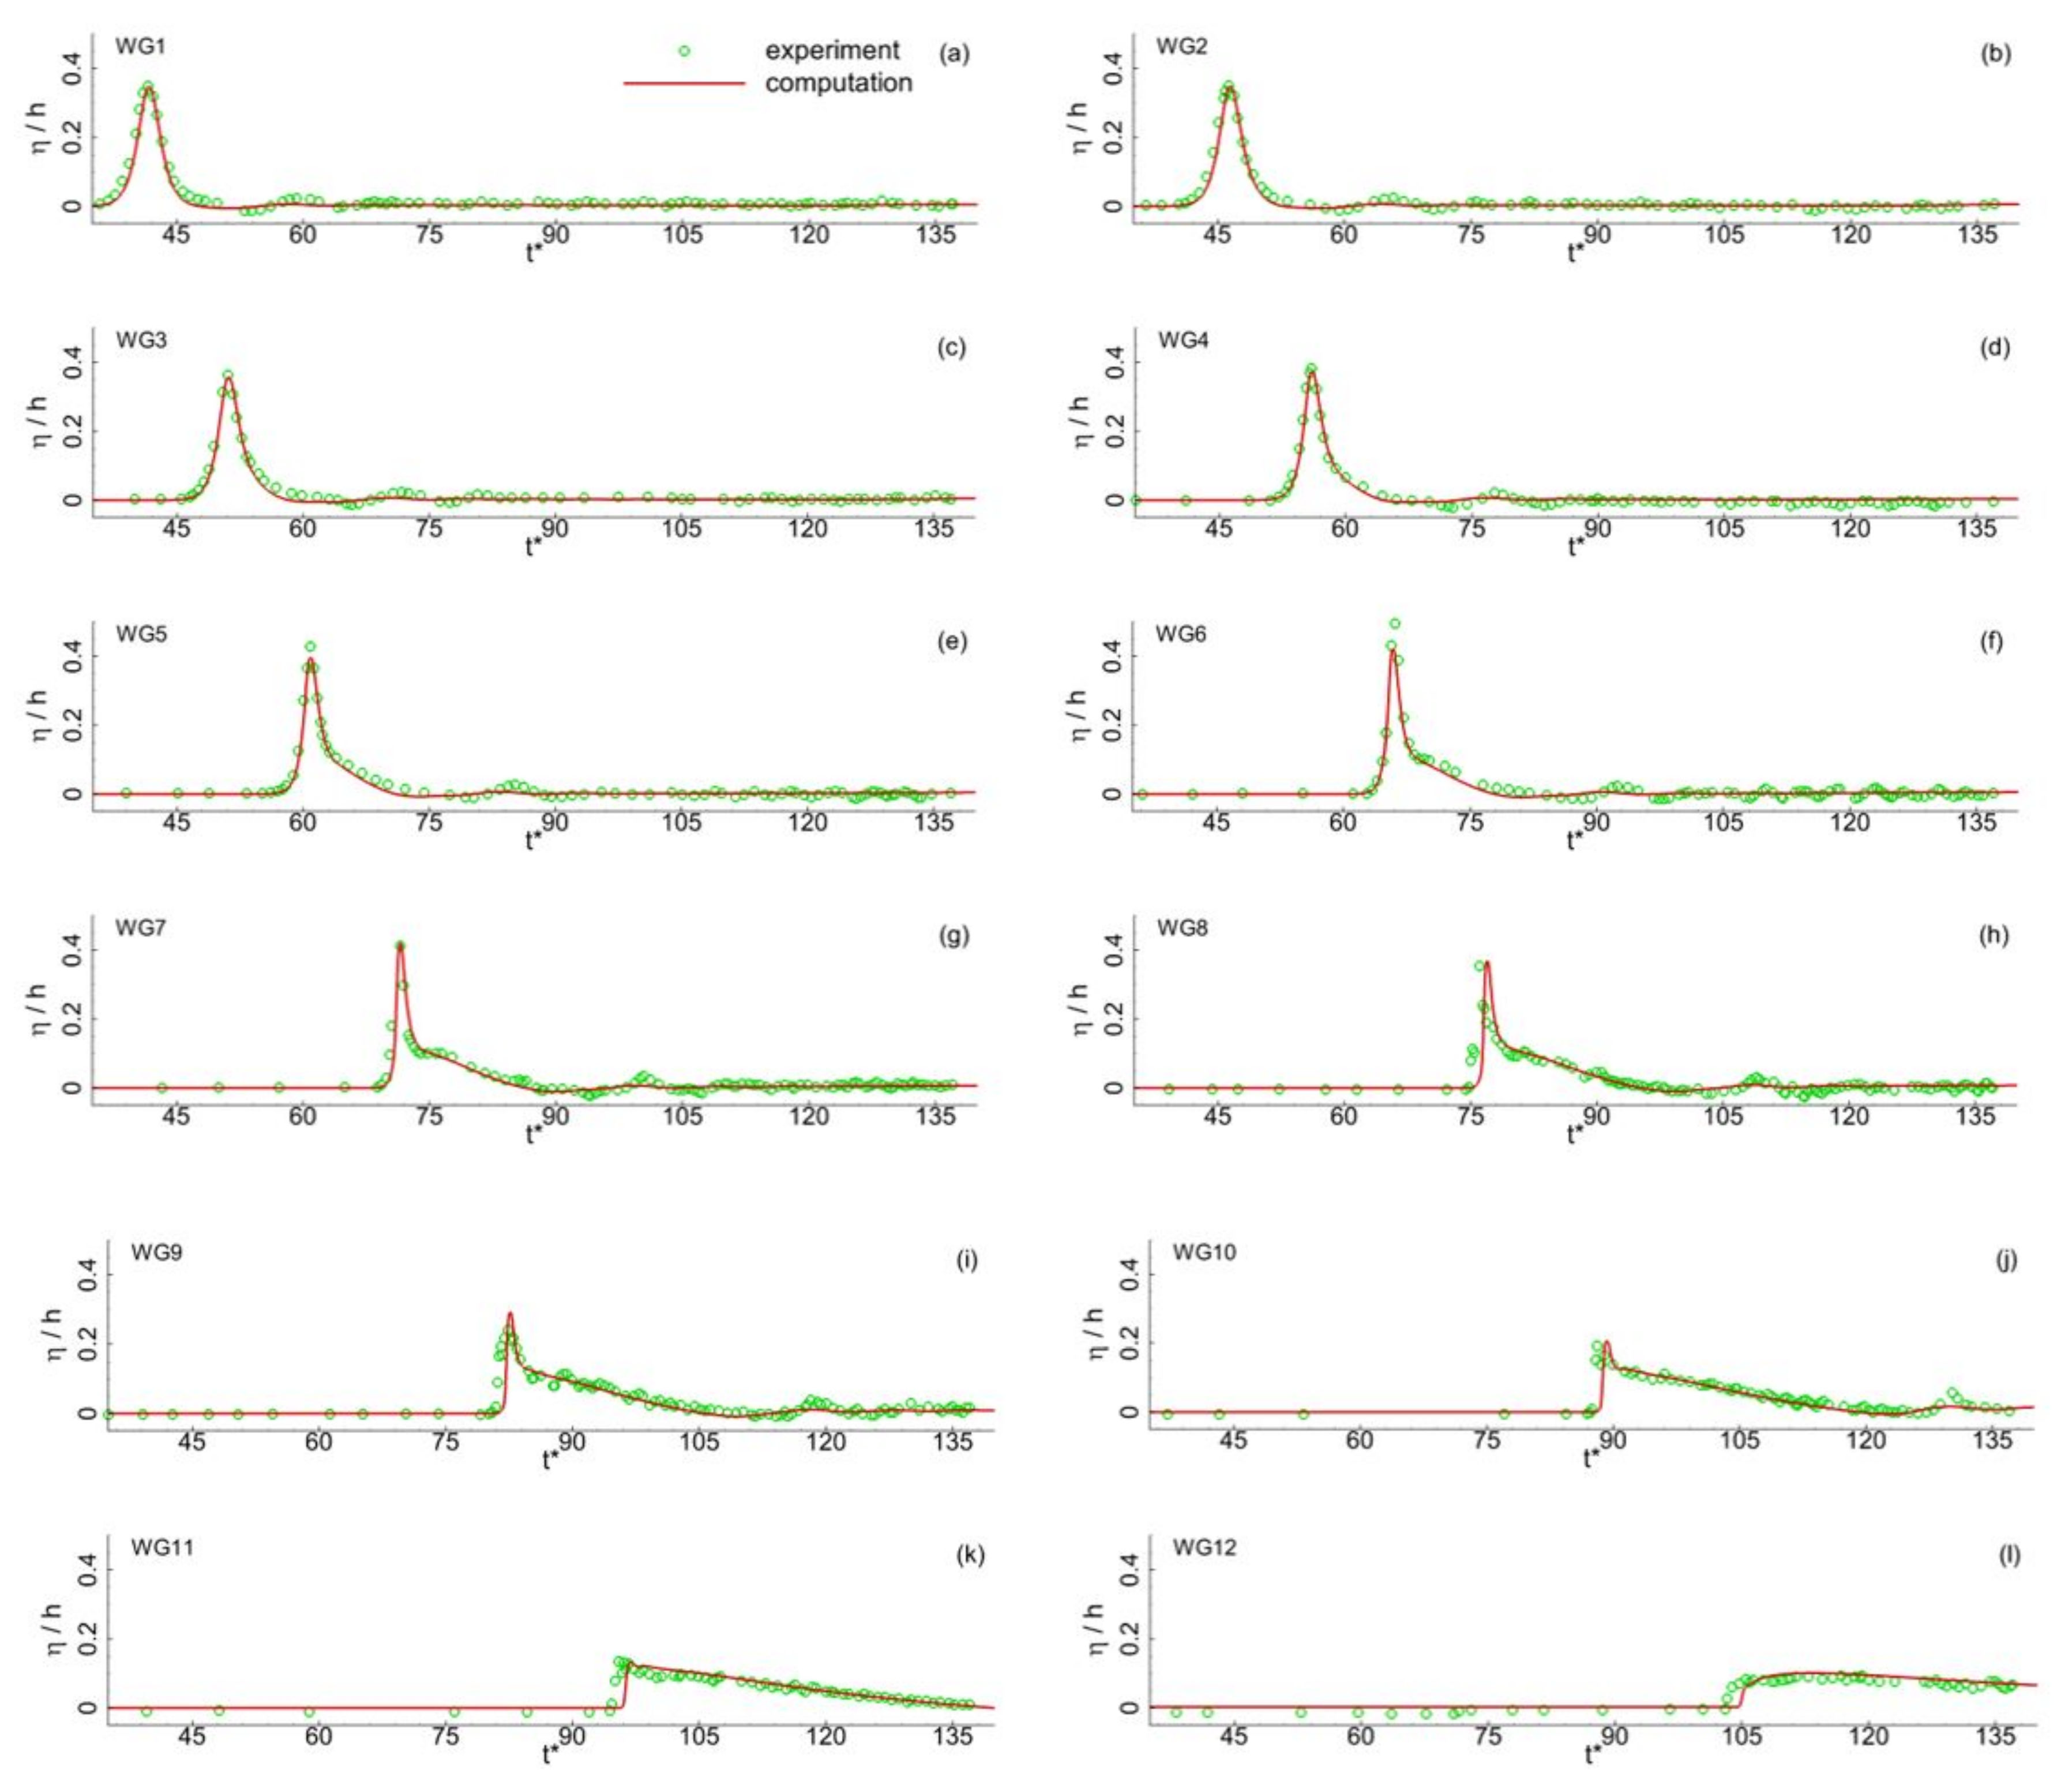
Figure 4,
Figure 5 and
Figure 6 compare the time series of the water surface elevations recorded at 12 different wave gauges for three different incident wave height ratios, namely
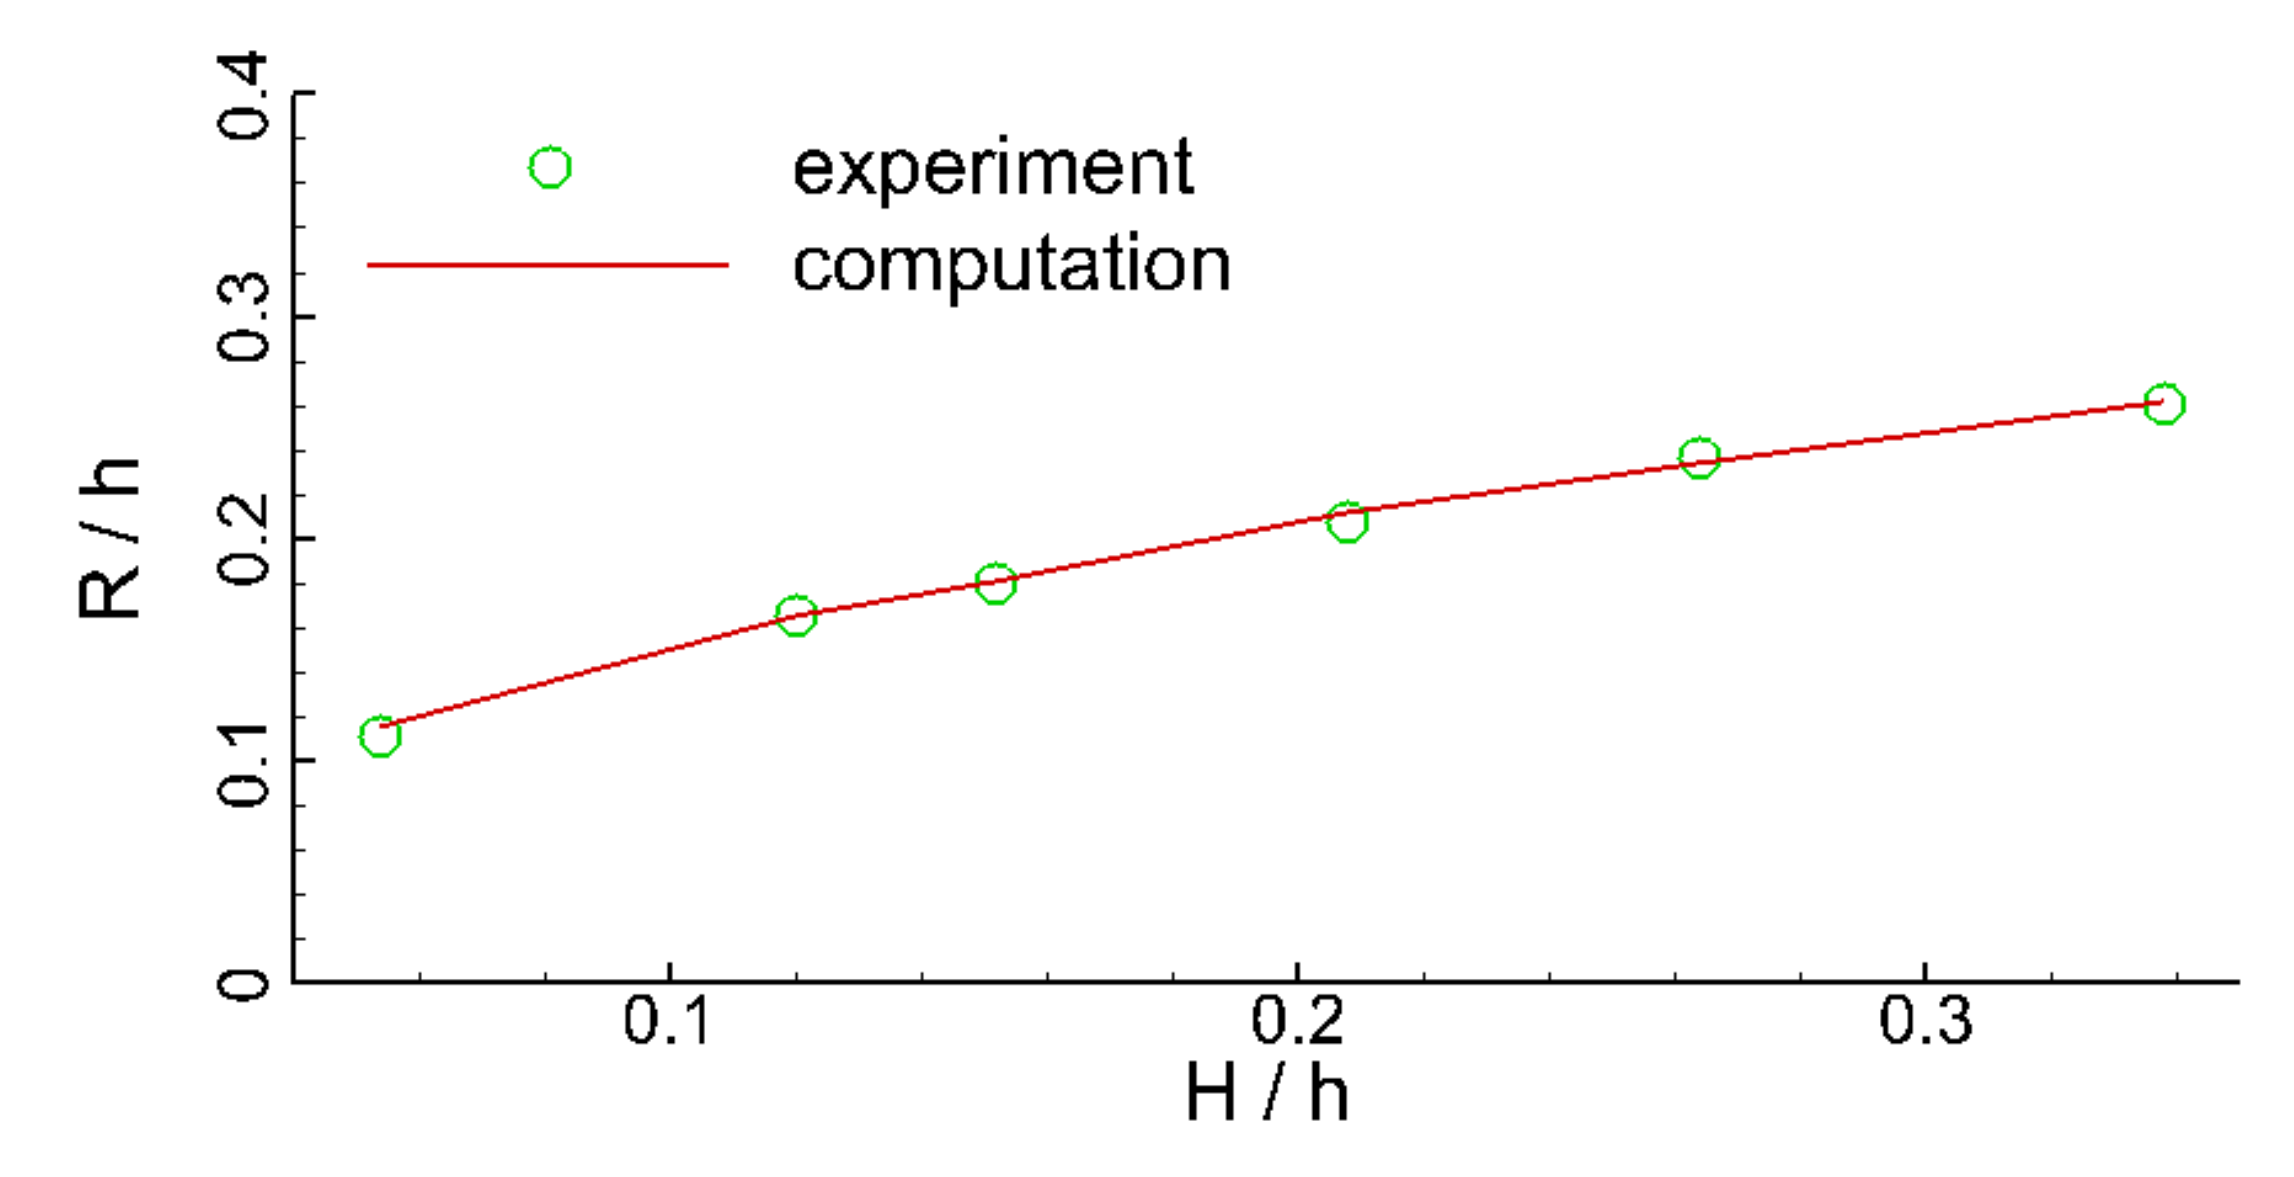
= 0.054, 0.208, and 0.338. It can be observed that the predicted water surface elevations agree well with the experimental data for both peak values and their variations over time. In addition, the predicted variations of maximum runup height with incident wave height ratio are also compared with the experimental data in
Figure 7. The figure shows that the predicted maximum runup heights are in good agreement with the corresponding measurements. Although some discrepancies exist between the predicted water surface elevations and the experimental data, the reliability of the numerical wave model in predicting the temporal variations in the water surface elevations and the maximum wave runup height during the runup processes of the solitary wave on the sloped beach are well calibrated.
3.2. Solitary Wave Overtopping the Seawall
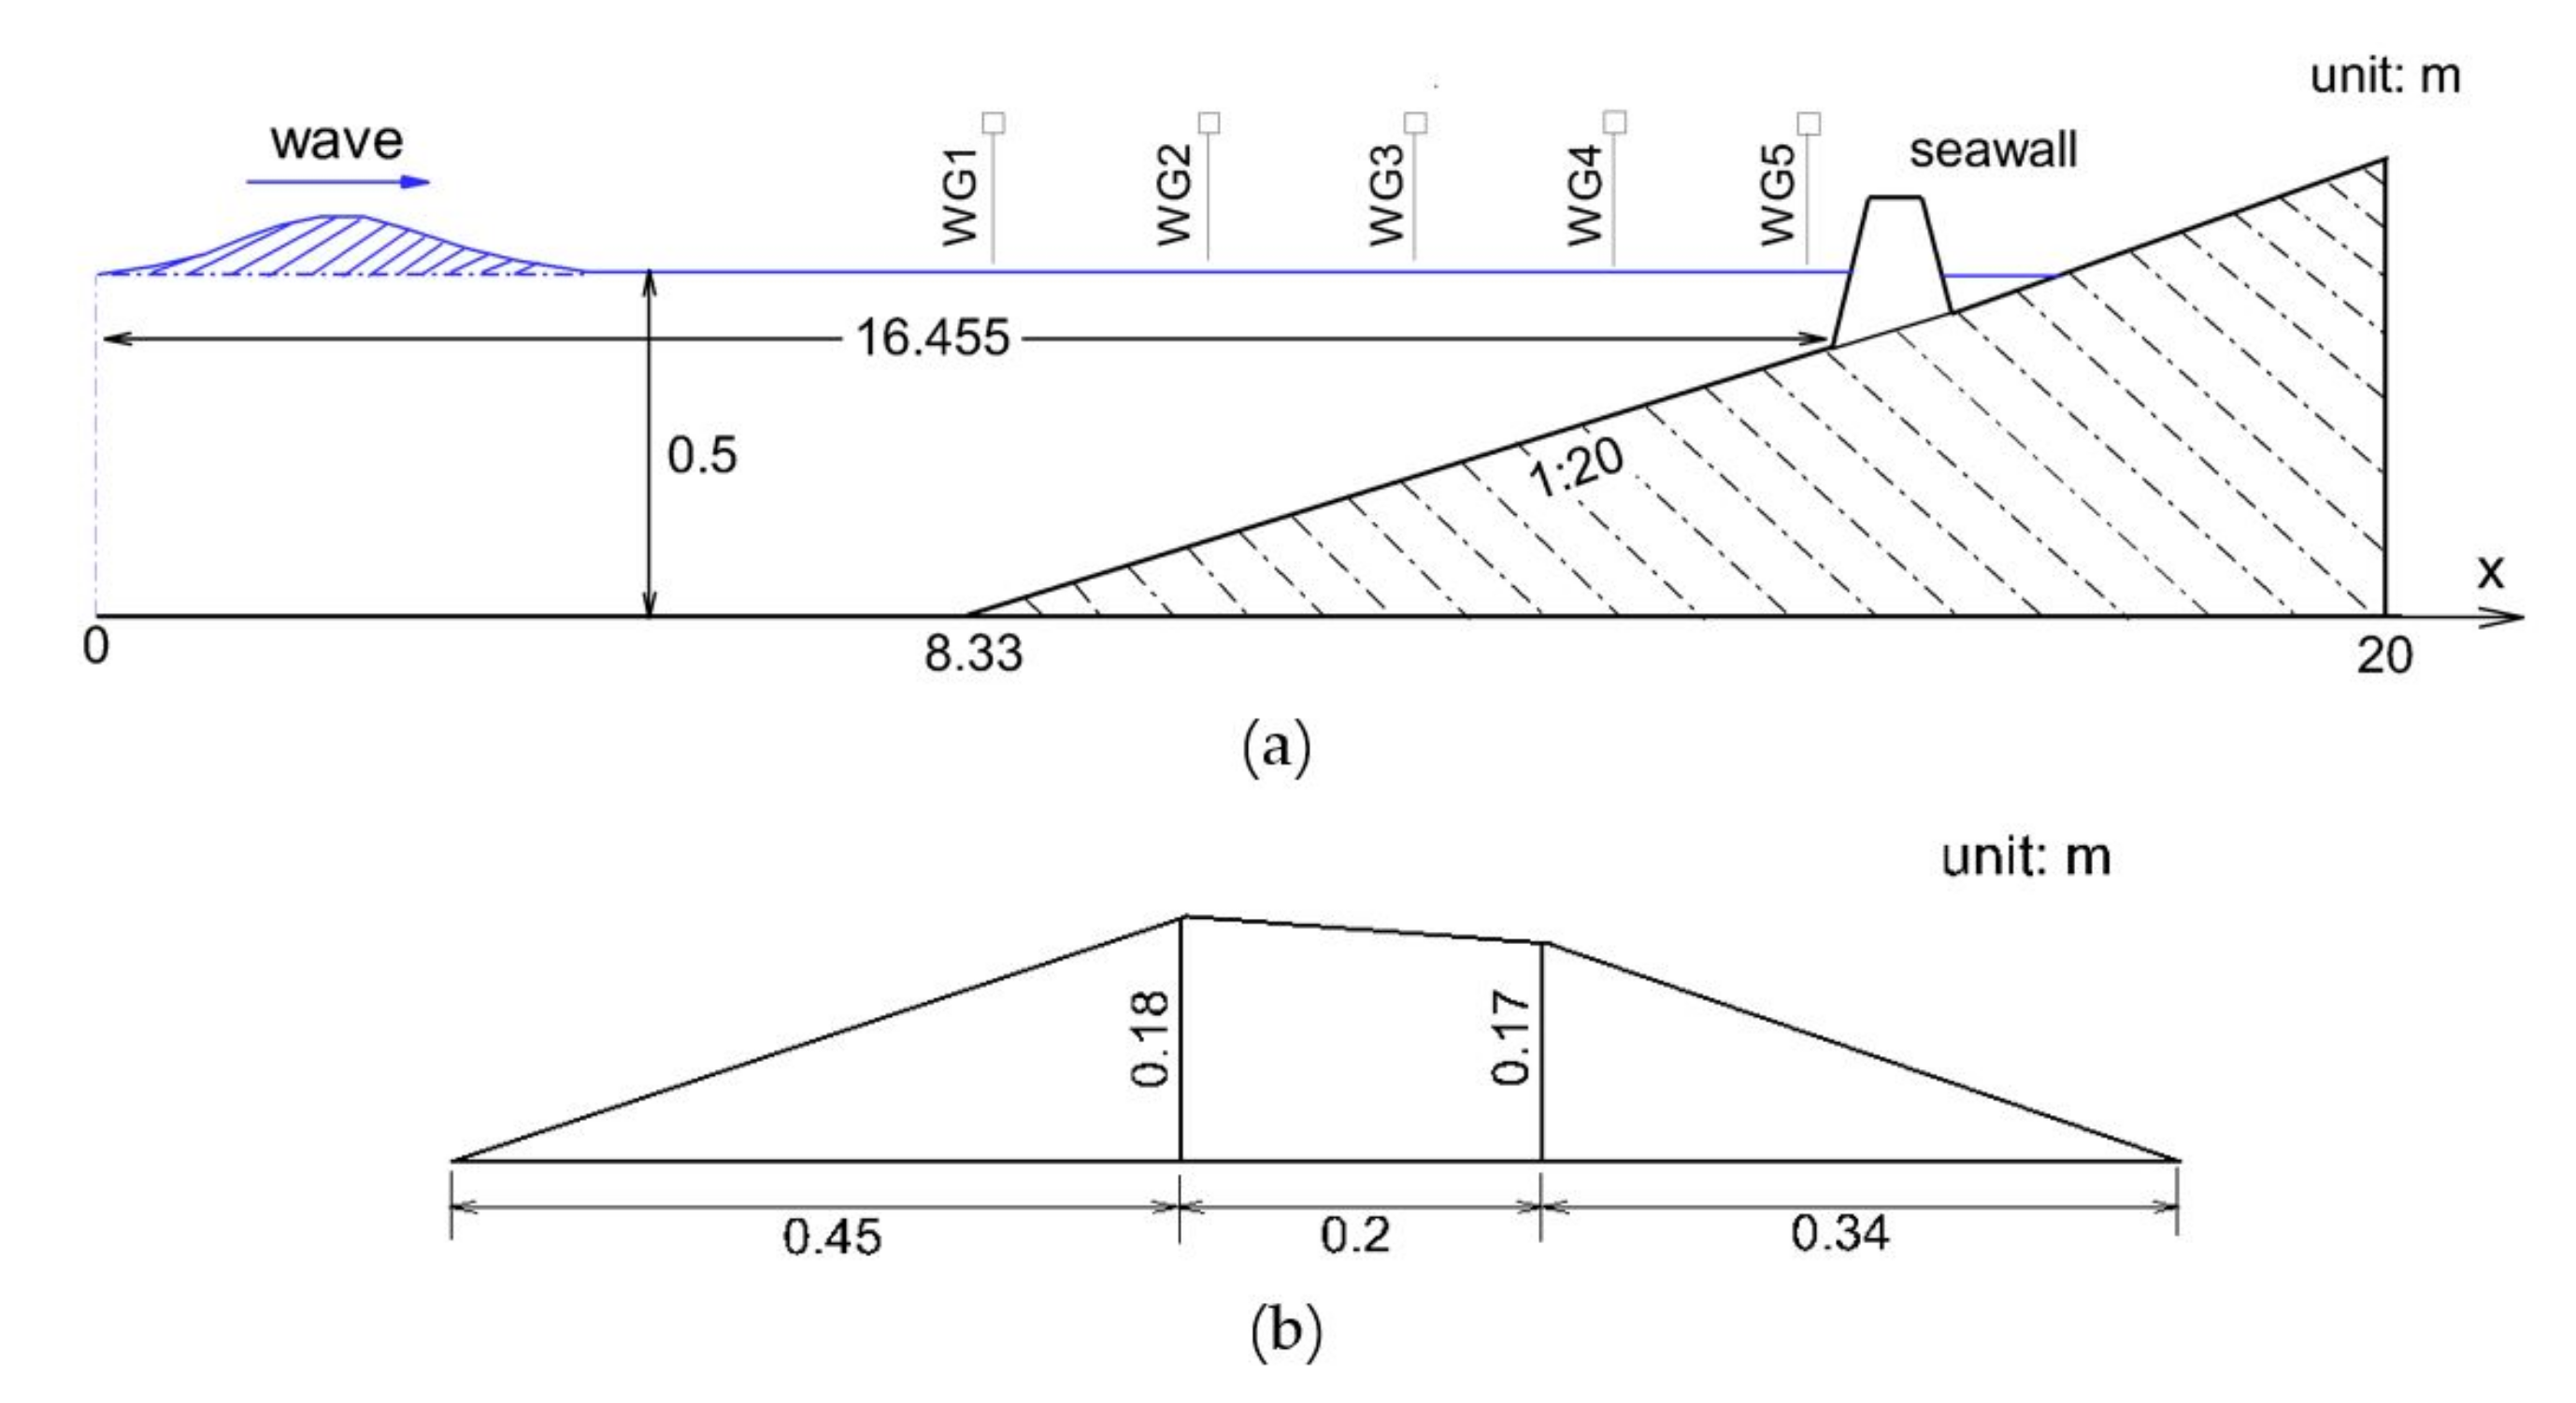
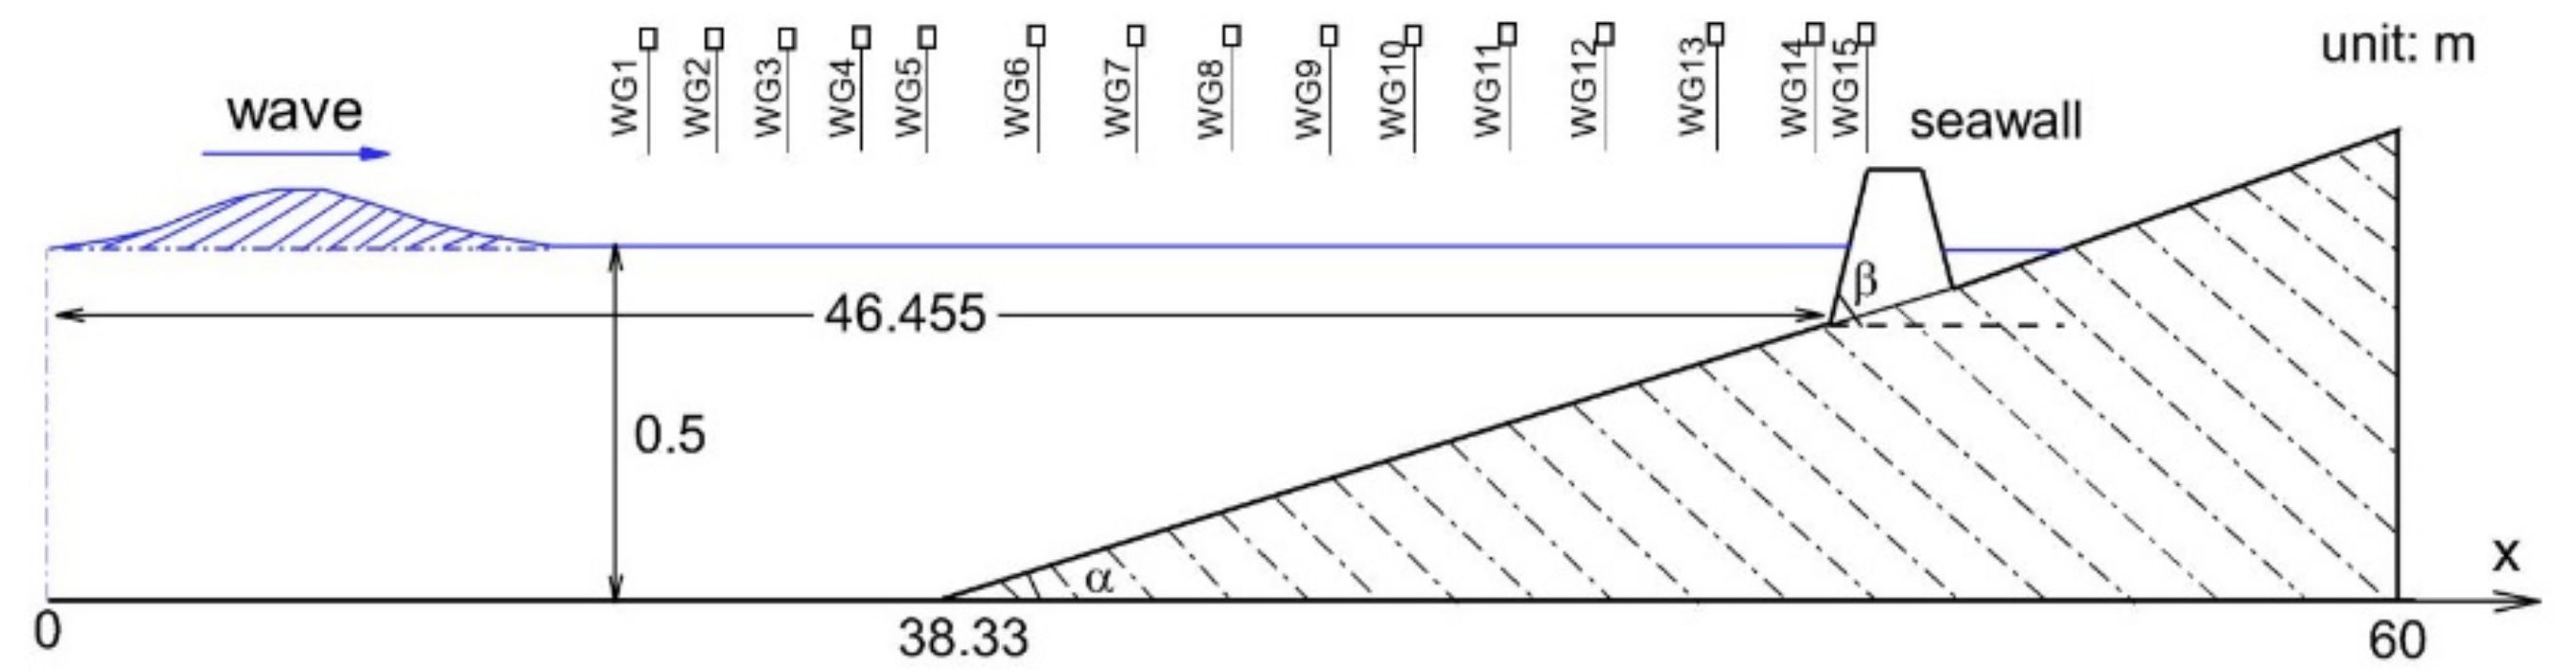
Since this study is designed to investigate the performance of seawalls in mitigating tsunami waves, it is necessary to verify the computational capability of the numerical wave model in predicting the complex interactions between waves and seawalls. In this section, the hydrodynamic processes of solitary wave runup and the overtopping of a seawall located at a 1:20 sloped beach were numerically simulated. The simulated results are compared with the corresponding experimental data collected by Hunt [
49] in the UK Coastal Research Facility. The experimental layout and the geometric dimensions of the seawall are plotted in
Figure 8. The side slope of the seawall was roughly 1:2. The toe of the beach was located 8.33 m away from the wave paddle, as shown in
Figure 8. The toe of the seawall was located 8.125 m away from the toe of the beach. The computational domain was 20 m in length. The mesh resolution in the horizontal direction was
= 0.02 m, and 40
-mesh layers were applied in the vertical direction. The still water depth
was set as 0.5 m. The incident wave height
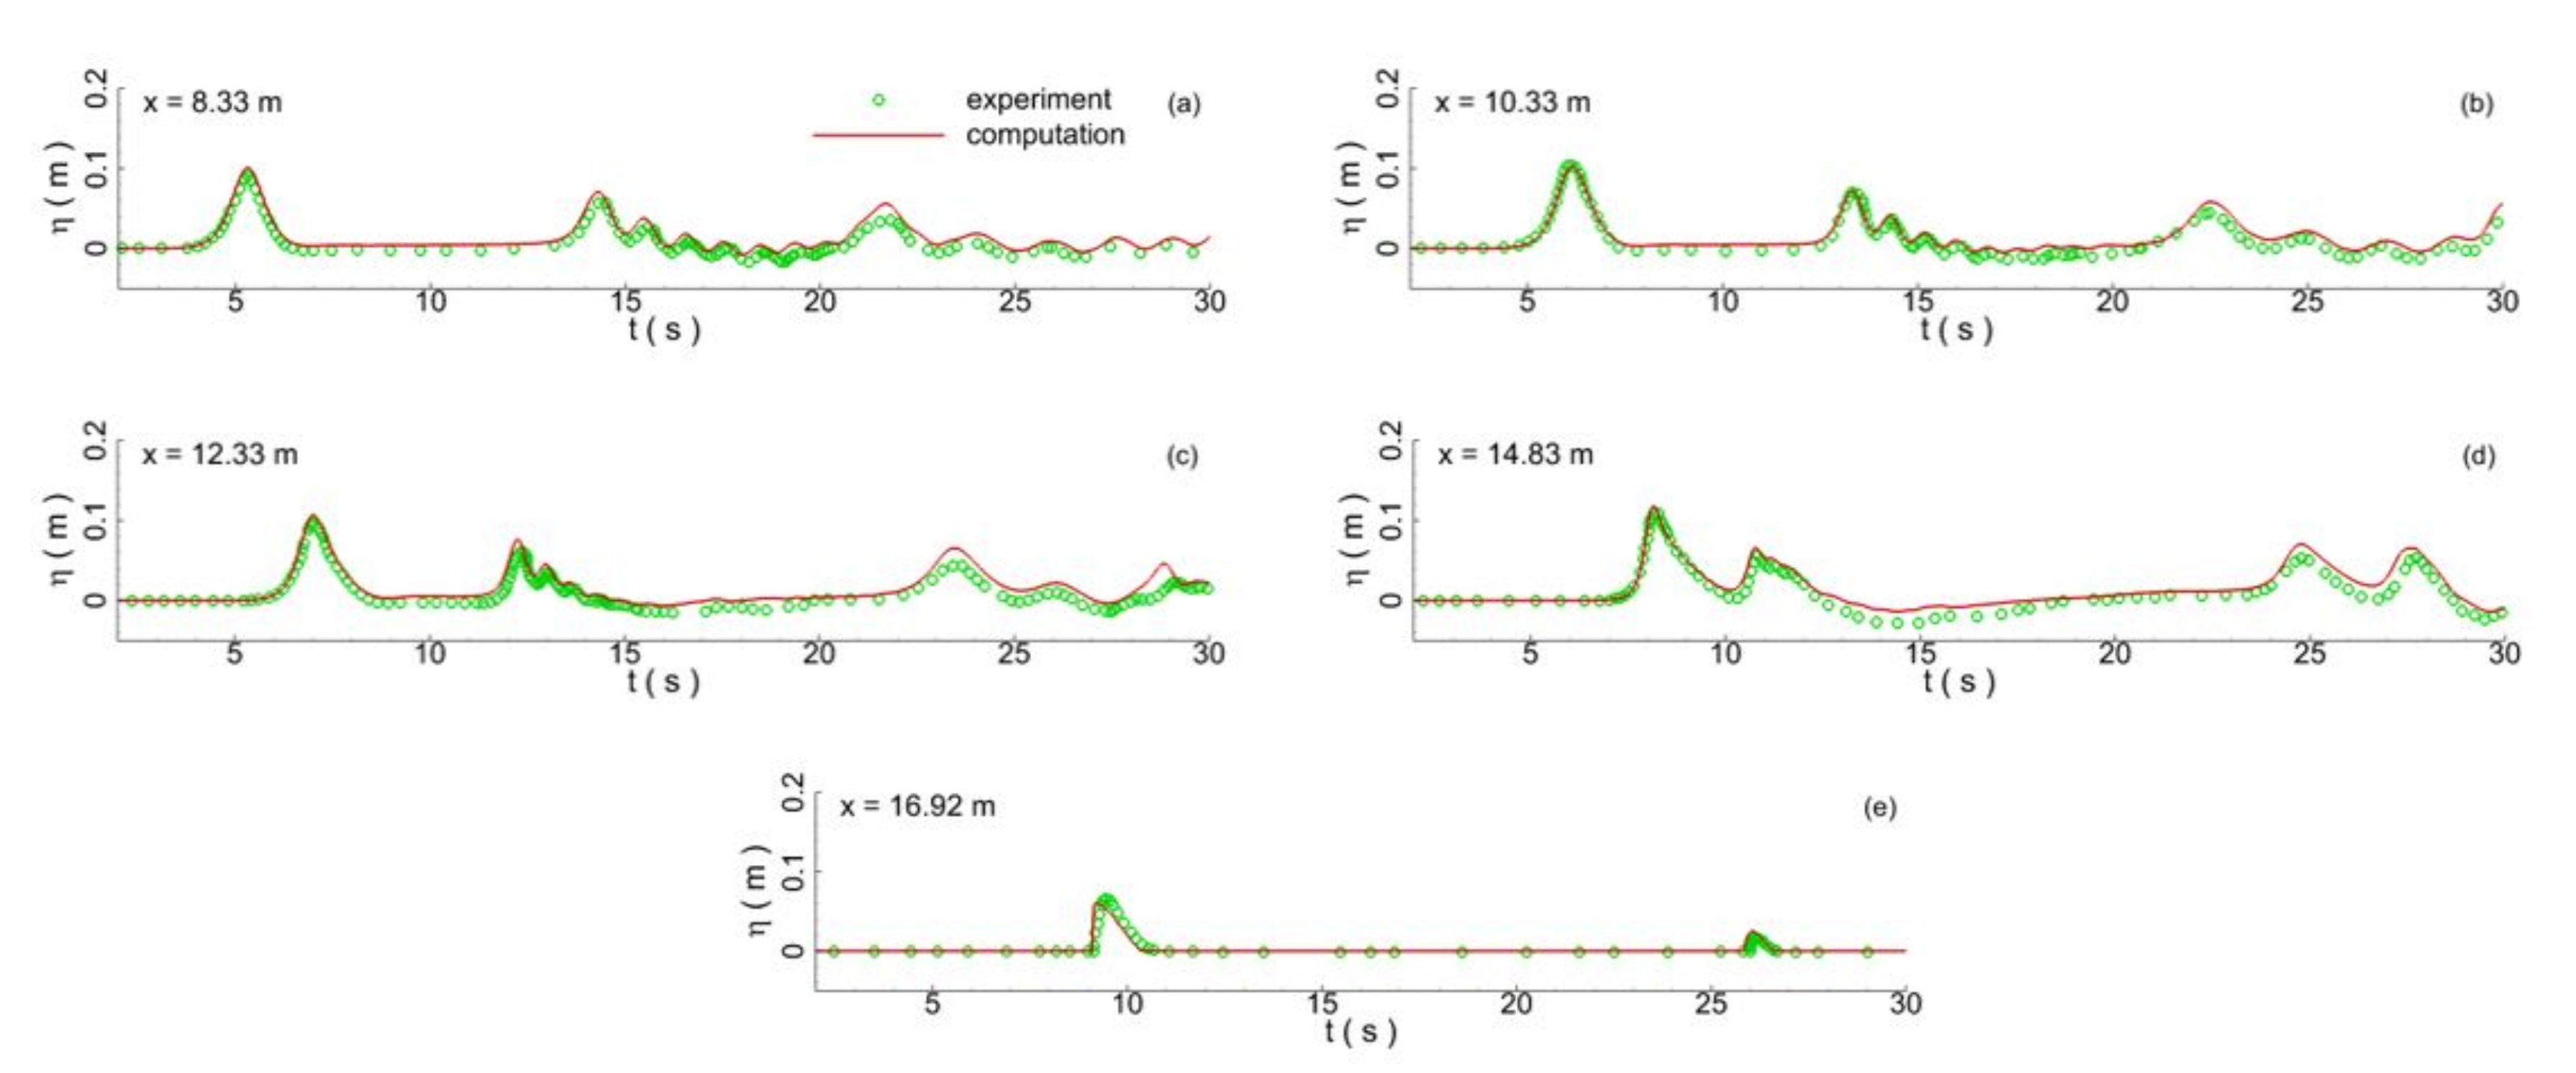
was 0.1 m. The predicted time series of water surface elevation recorded at
= 8.33, 10.33, 12.33, 14.83, and 16.92 m were compared with the experimental data, as shown in
Figure 9. It can be seen that the predicted temporal evolutions of water surface elevation at different wave gauges are in good agreement with the corresponding experiment data, even for the wave gauges located at the top of the seawall.
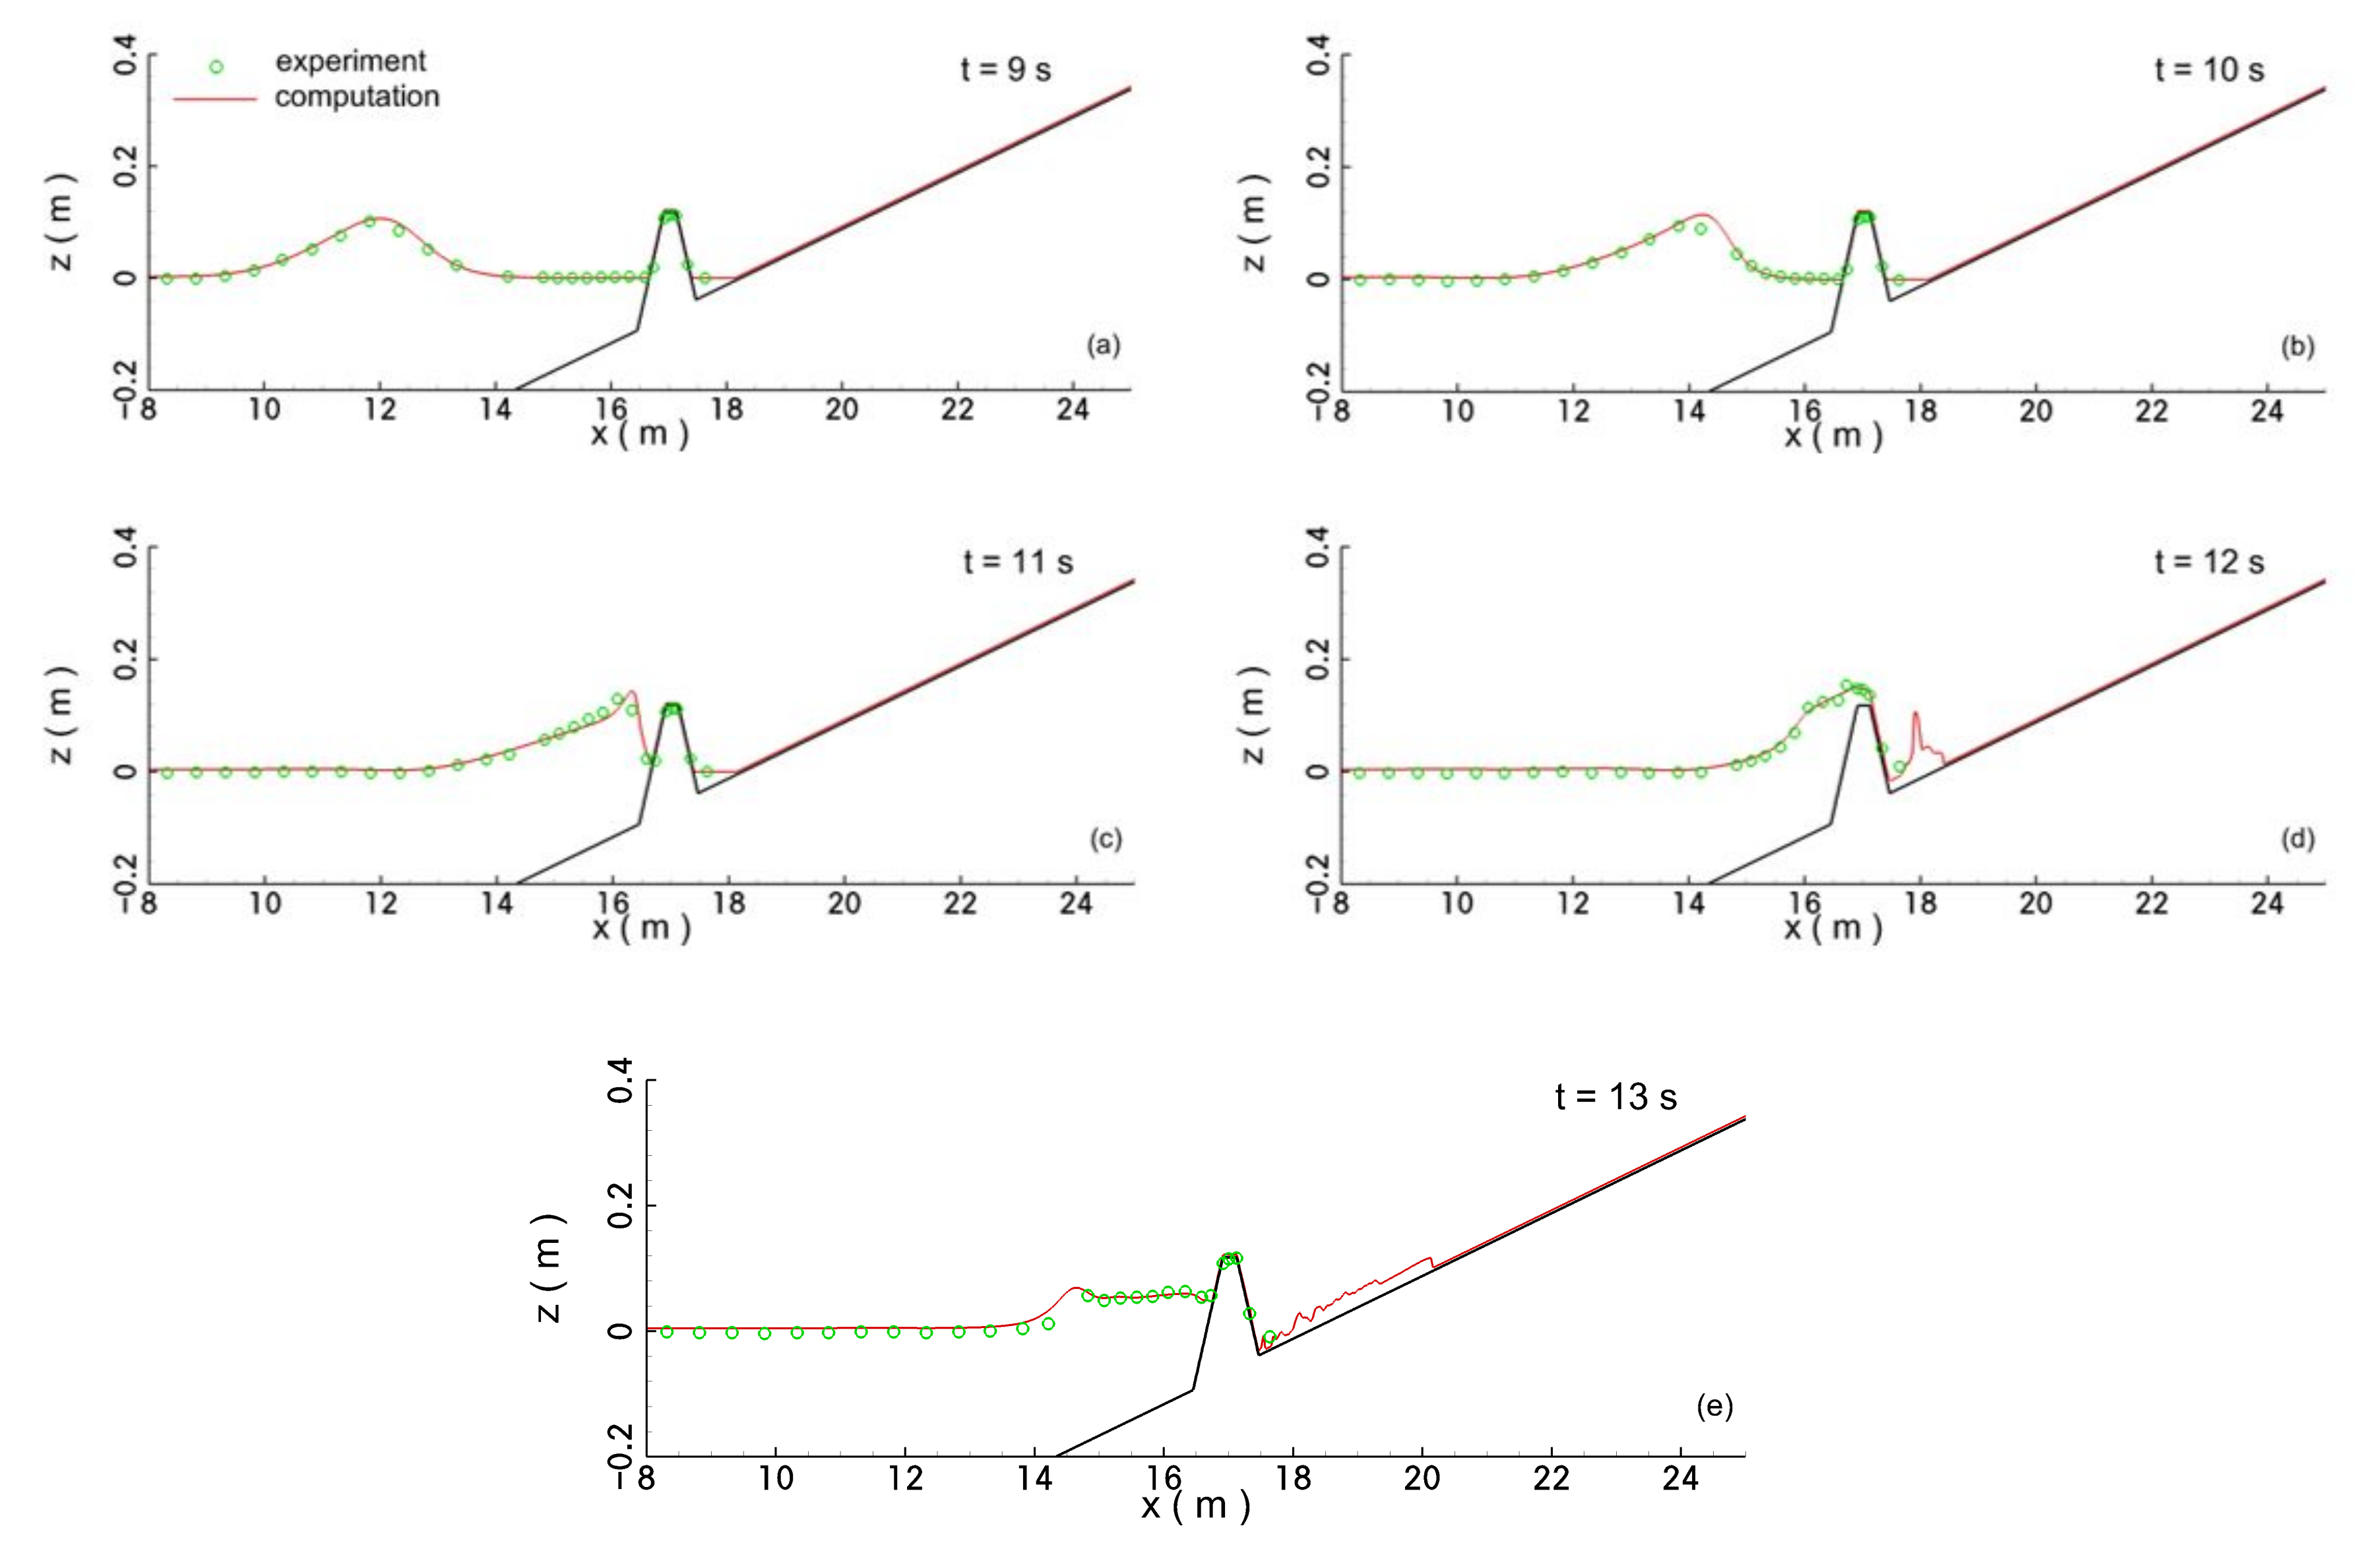
Figure 10 plots the comparisons of the predicted and measured water surface elevations along the wave flume at
= 9, 10, 11, 12, and 13 s. It can be seen that the predicted spatial distributions of water surface elevation also agree well with the measurements. In addition, it shows that the wave steepening and breaking, as well as the overtopping of the seawall and the subsequent rundown processes of the solitary wave, can be properly resolved by the numerical wave model of this study.
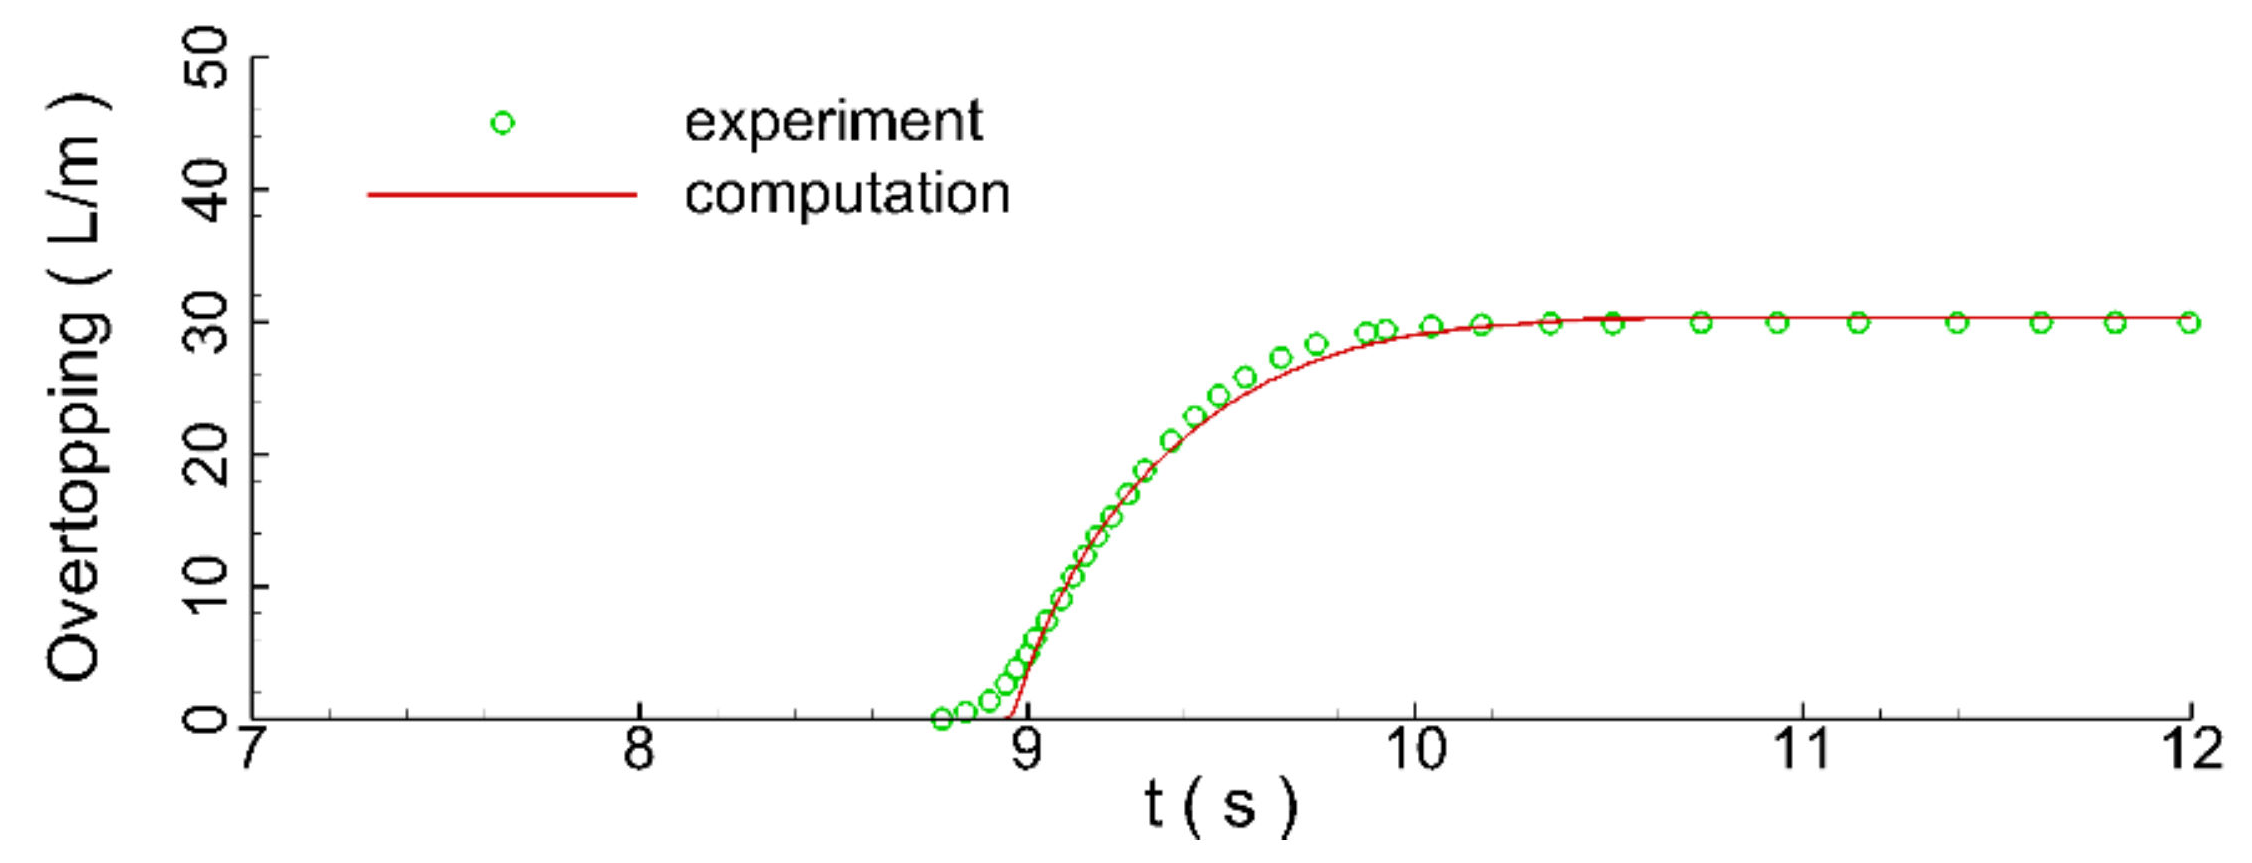
Figure 11 compares the temporal evolutions of the predicted overtopping water of a solitary wave and the corresponding measurements. The predicted volume of the water overtopping the seawall was 30.70 L/m. The measured volume was 30.07 L/m. Thus, there was only a difference of about 2%. Overall, the computational capability of the numerical wave model in predicting the propagation, transformation, runup, and overtopping processes of the solitary wave over the seawall was well calibrated.
4. Results and Discussion
In the following sections, hydrodynamic characteristics of tsunami-like waves during wave propagation, transformation, breaking, and the overtopping of the seawall are numerically investigated. The effects of several prominent factors, i.e., incident wave height, water depth, the side slope of the seawall, and beach slope, are systematically investigated. The computational layout is plotted in
Figure 12. The toe of the beach was located 38.33 m away from the inlet of the computational domain to accommodate the long wave length of tsunami-like wave. The geometric dimensions of the seawall were nearly same as those in
Figure 8b, except that the initial side slope of the seawall was set as 1:2. The toe of the seawall was located 46.455 m away from the toe of the beach.
and
represent the beach slope angle and the side slope angle of the seawall, respectively. The computational domain was 60 m in length. The mesh resolution in the horizontal direction was
= 0.01 m, and 40
-mesh layers were applied in the vertical direction.
It is known that wave energy is dissipated and transferred during wave propagation, transformation, breaking, and overtopping over the seawall. Similar to Qu et al. [
40], this study analyzes the wave energy dissipation of wave propagation over the seawall by calculating the kinetic energy (
KE), potential energy (
PE), and total energy (
TE) as:
The variables in the above formulas have the same meanings as those in
Section 2.
4.1. Hydrodynamic Phenomena
In this section, the complex hydrodynamic phenomena of the tsunami-like wave impacting and overtopping the seawall of the sloped beach are numerically investigated. For comparison purposes, a simulation with the same parameter setups for a solitary wave is also performed. The corresponding results are compared with that of the tsunami-like wave. In the computation, the still water depth (
) was set as 0.5 m. The incident wave height (
) was 0.1 m.
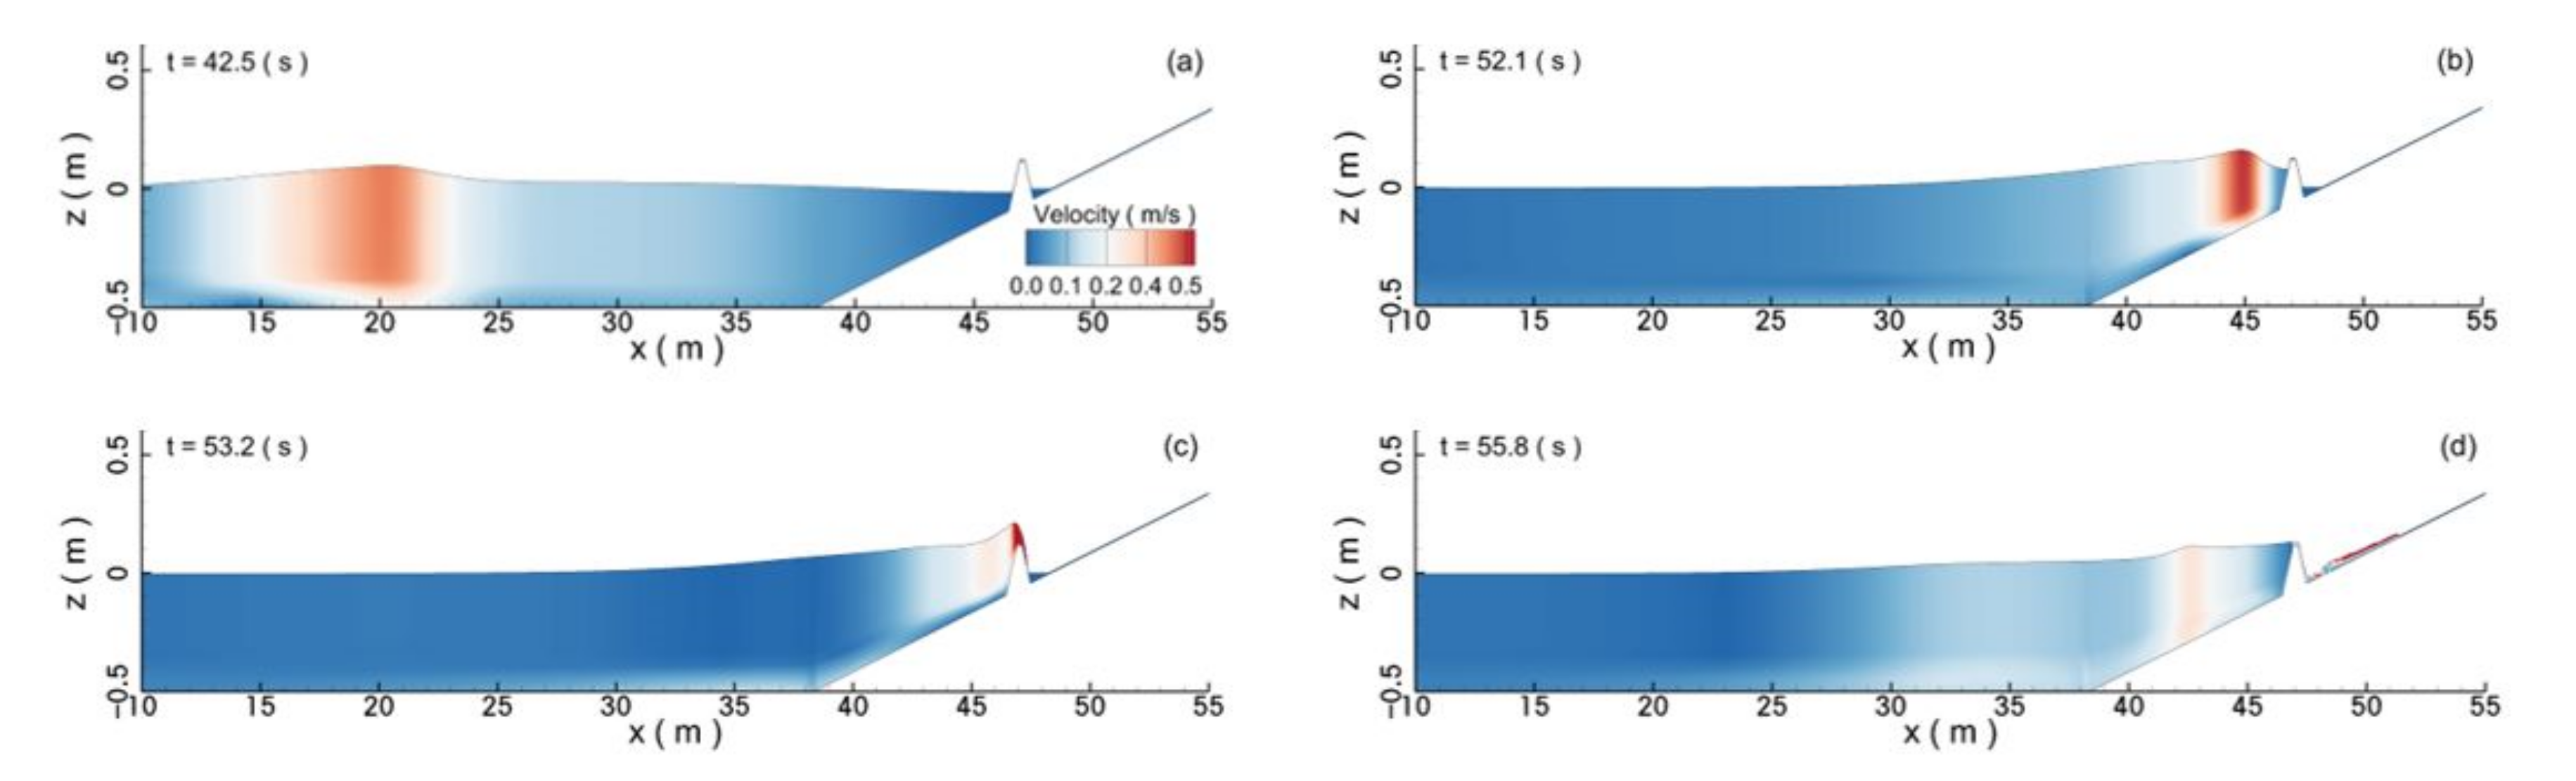
Figure 13 plots the snapshots of the velocity contours of the water body at different time instances. The figure clearly shows that the tsunami-like wave had a very long wave length, which was much greater than that of the solitary wave. Because of the long wavelength of the tsunami-like wave, a large water area of high velocity was found near the wave crest (
Figure 13a). As the tsunami-like wave propagated up the sloped beach and interacted with the seawall, the wave crest became steeper due to the shallowing effects. Meanwhile, the size of the water area with high velocity was shortened, but the magnitude of the water velocity was further enhanced (
Figure 13b). As the tsunami-like wave broke over the seawall, the breaking surge bore climbed over the seawall and propagated further along the sloped beach behind the seawall (
Figure 13c). At the same time, one reflected wave was also formed (
Figure 13d).
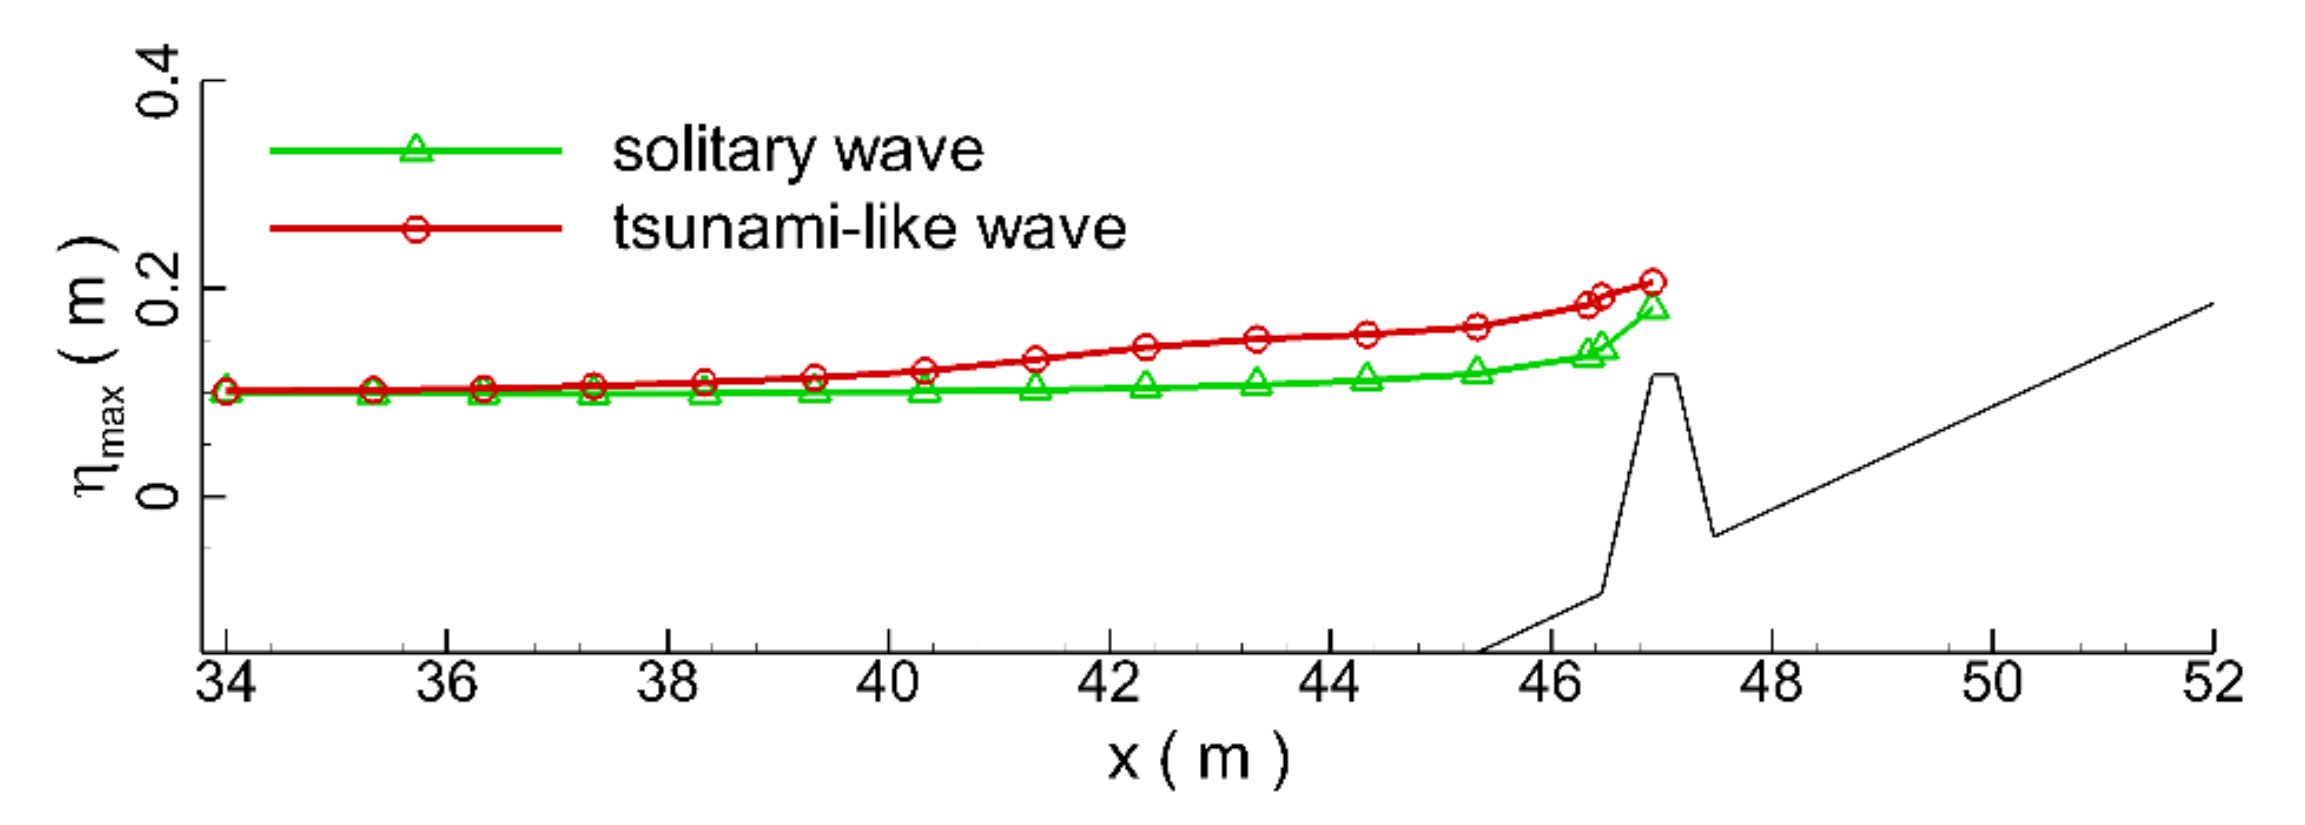
Figure 14 compares the spatial distributions of the maximum water elevation of the tsunami-like wave and the solitary wave during the processes of wave impacting and runup to the seawall at the sloped beach. It clearly shows that the spatial distribution of maximum water elevation of the tsunami-like wave was always greater than the solitary wave, which was about 14.3% greater at the top of the seawall. This is attributed to the stronger water carrying capability and wave reflection of the tsunami-like wave. Since the intensity of the reflected wave of a tsunami potentially affects a secondary disaster, based on the incident wave height and the reflected wave crest recorded at the toe of beach, the wave reflection coefficient was calculated in this study. The wave reflection coefficients were 0.77 and 0.59 for the tsunami-like wave and the solitary wave, respectively, indicating that the tsunami-like wave was more likely to cause secondary disasters. This also shows that using the solitary wave to simulate a tsunami wave will underestimate the secondary disaster risk of a tsunami to a certain extent. Comparisons of the time series of the wave energies of the whole water body are plotted in
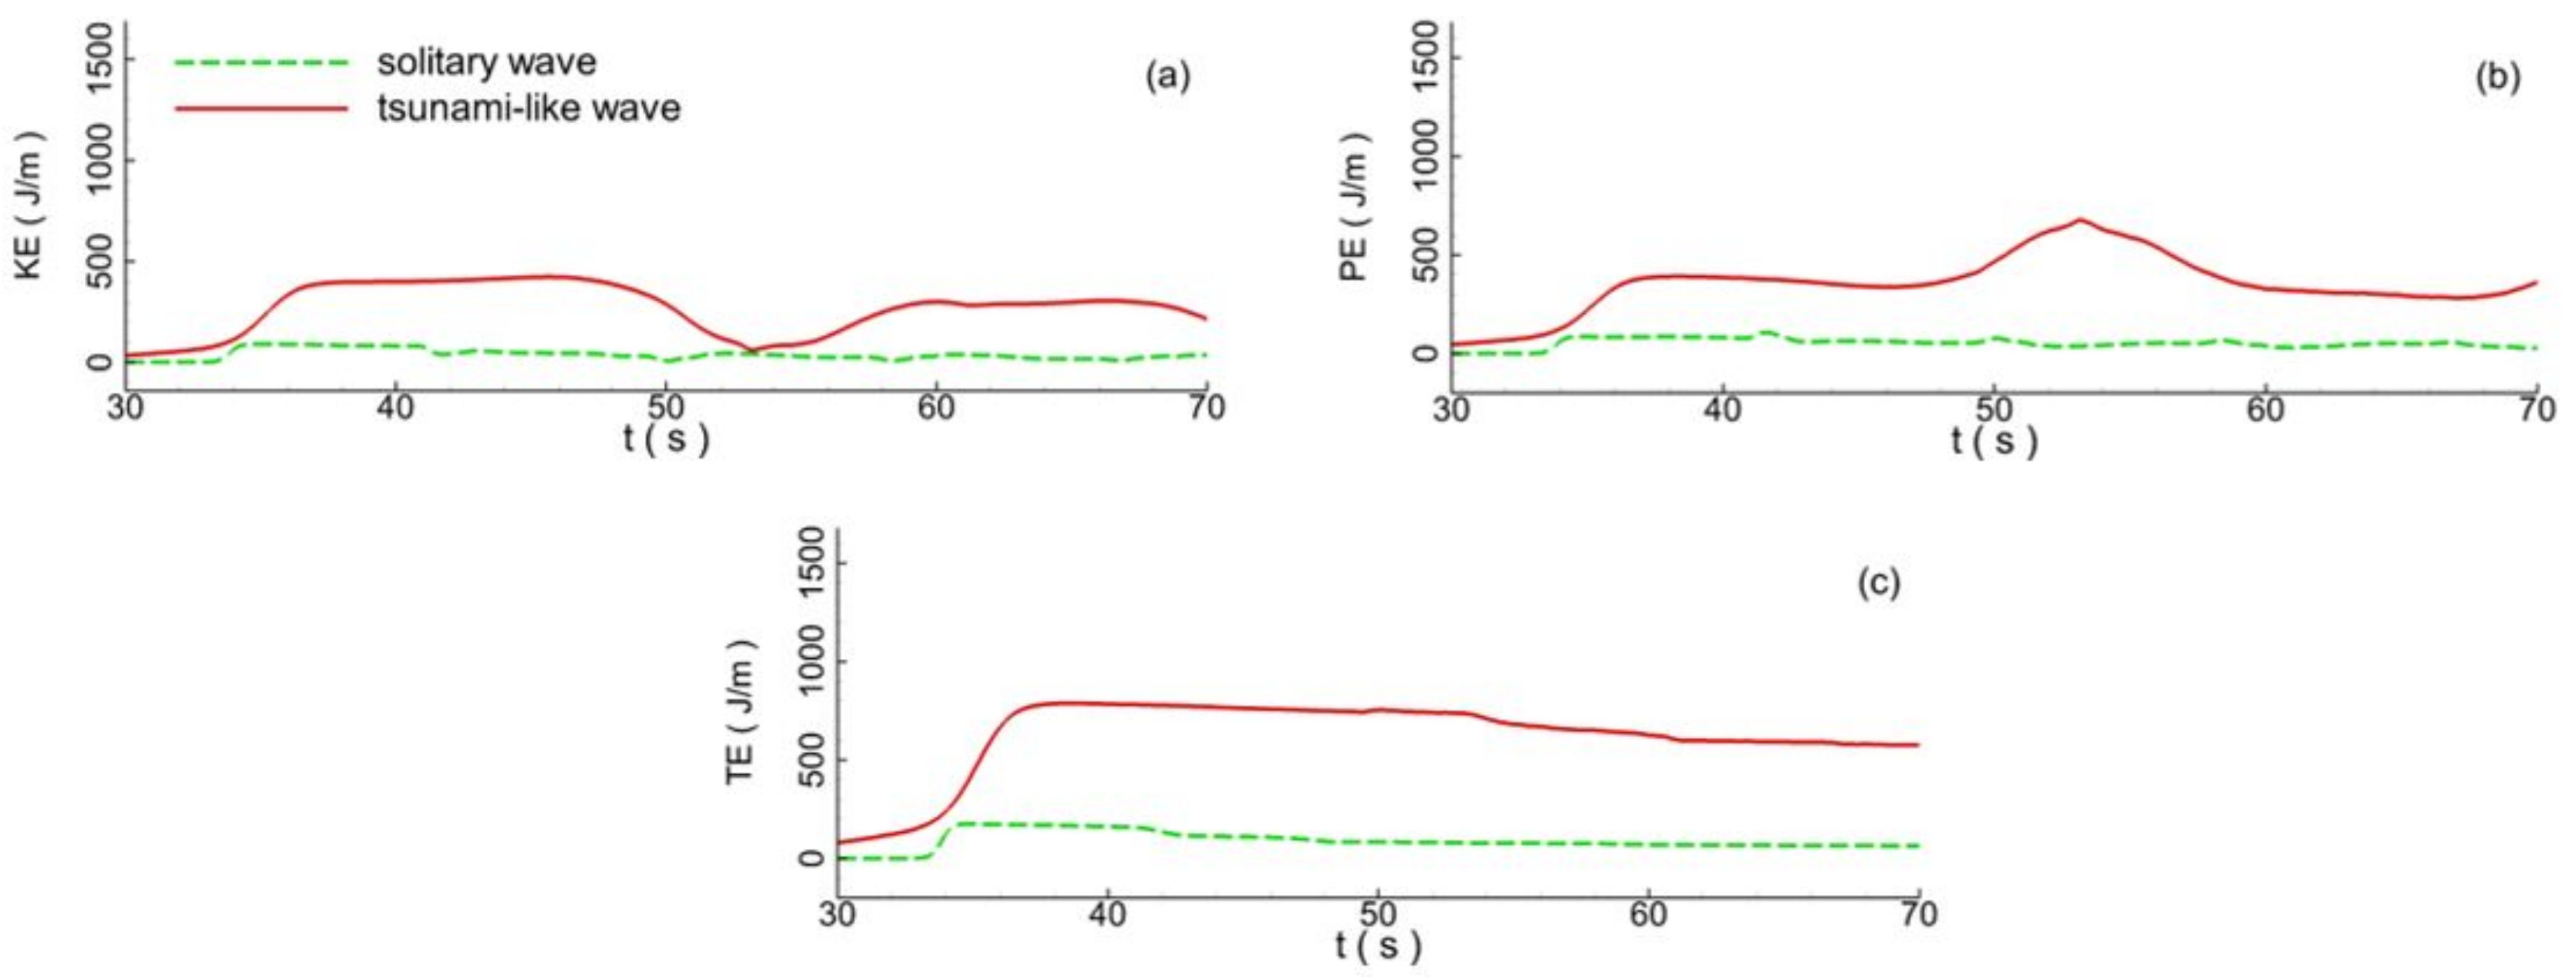
Figure 15. The figure clearly shows that the wave energies of the water body gradually increase once the waves enter the computational domain. It can be seen that the total wave energy of the tsunami-like wave was much greater than that of the solitary wave: about 4.65 times greater. For the tsunami-like wave, about 23.9% of the total wave energy was dissipated by the seawall, while about 34.5% of the total wave energy of the solitary wave was dissipated.
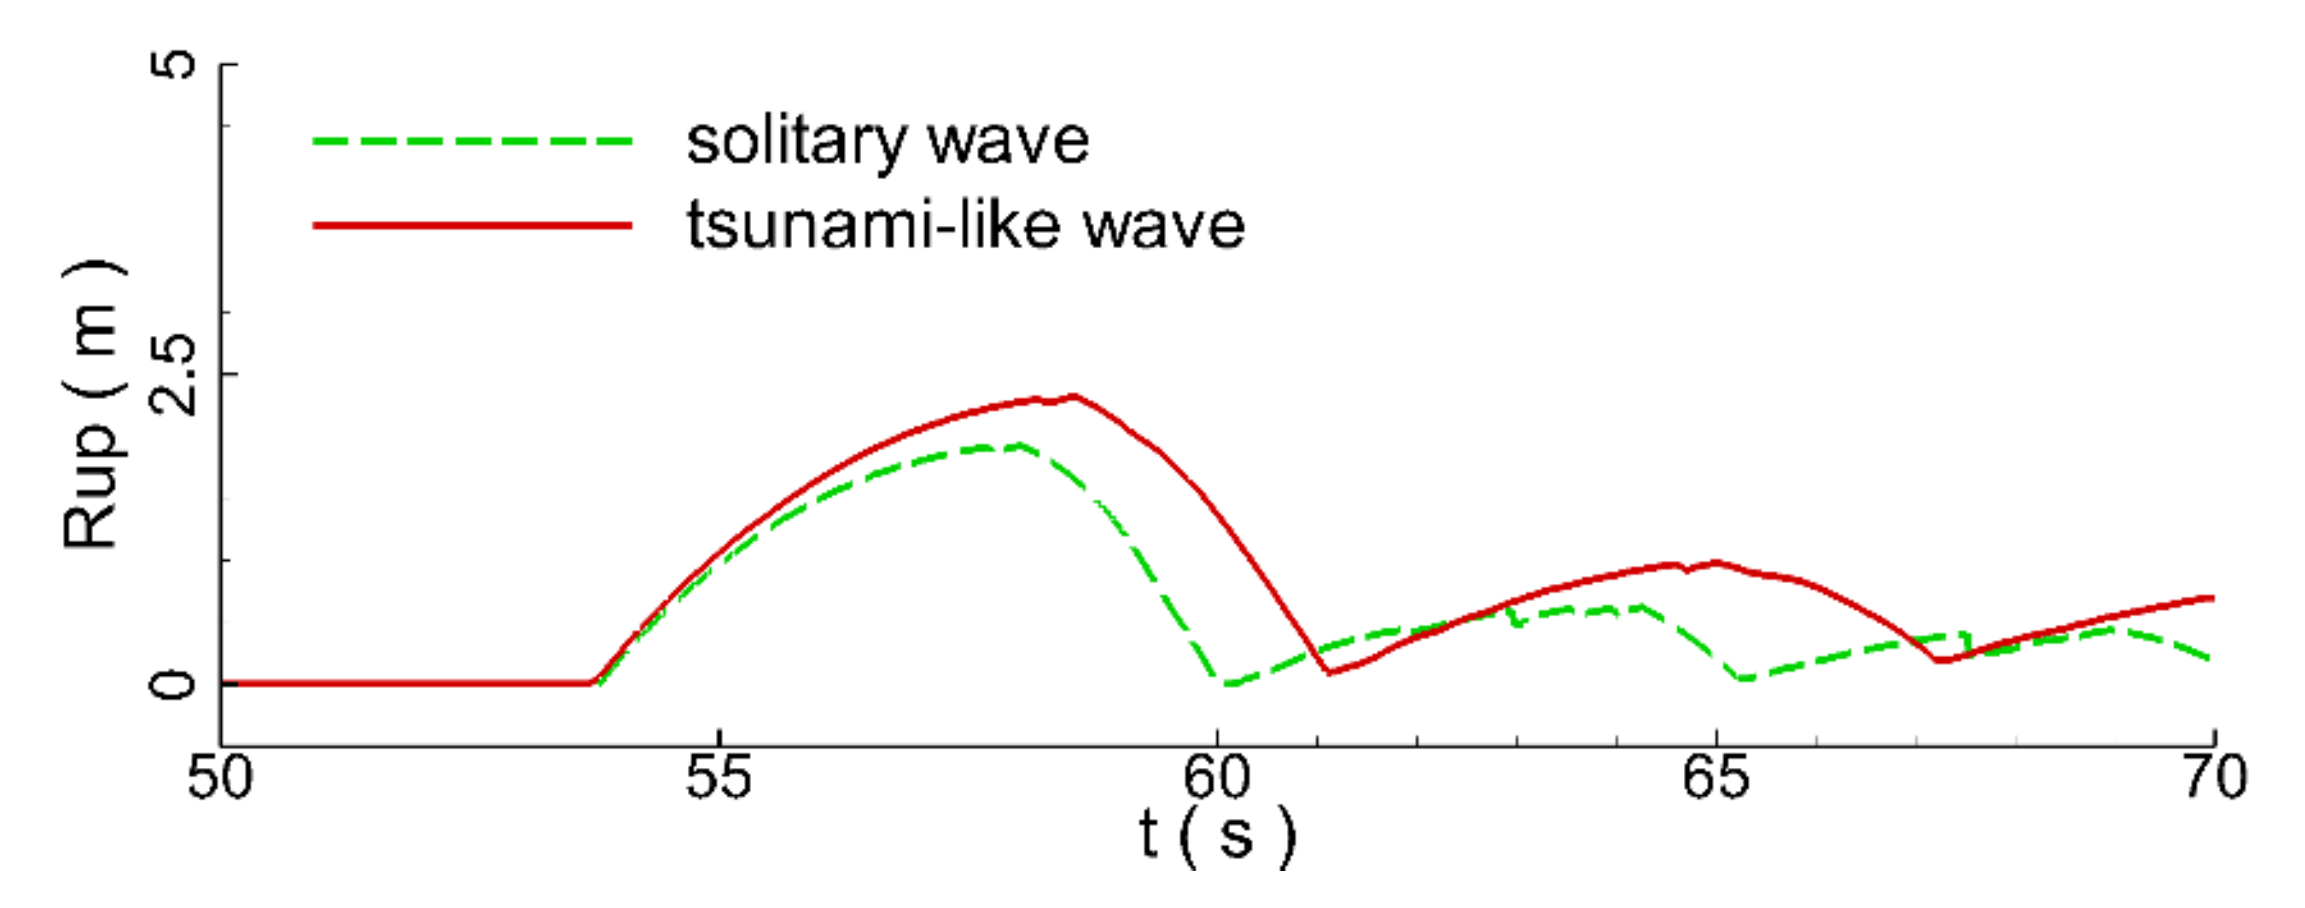
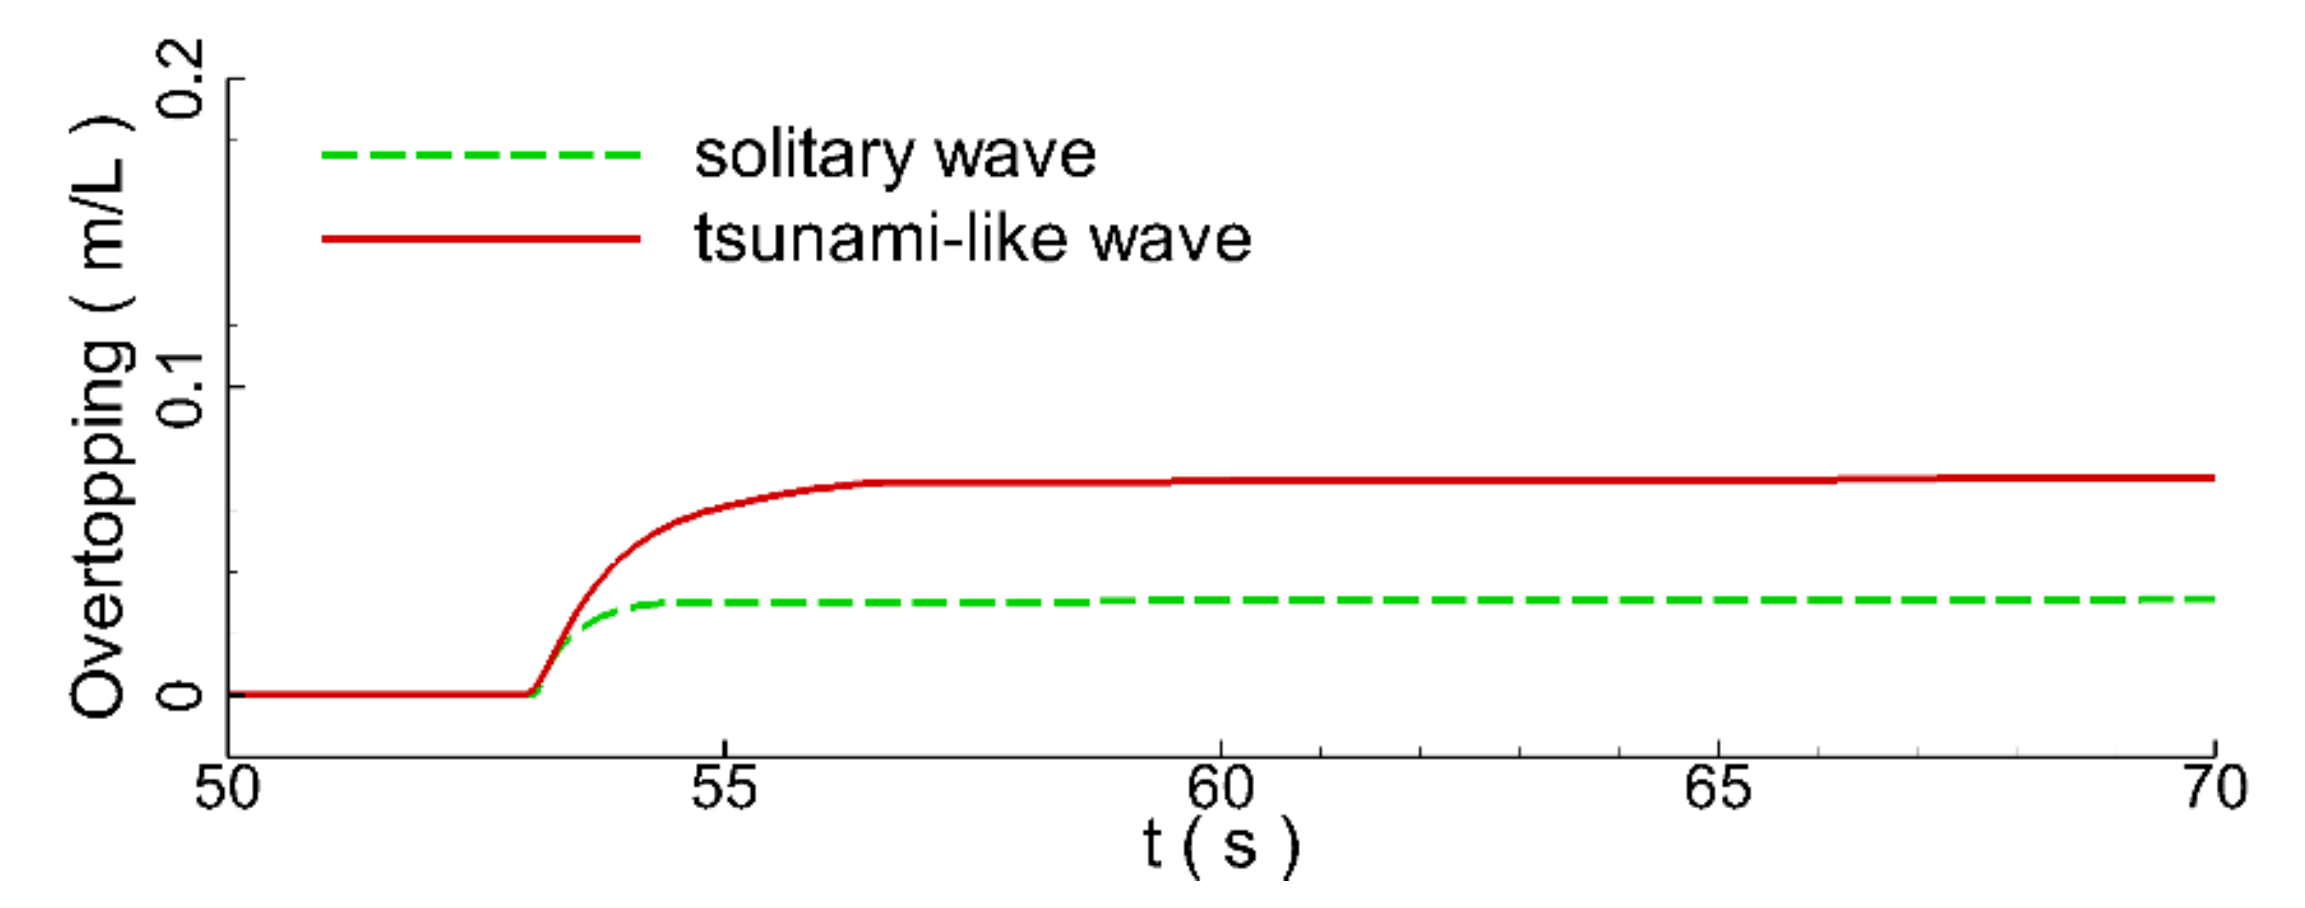
Figure 16 plots the time series of wave runup height. The figure shows that the maximum wave runup height of the tsunami-like wave was about 20% greater than that of the solitary wave. As seen in
Figure 17, the volume of overtopping water of the tsunami-like wave was about 2 times that of the solitary wave, demonstrating the destructive power of the tsunami. As demonstrated above, complex interaction exists between the tsunami-like wave and the seawall. The existence of a seawall can greatly reduce the destructive power of a tsunami-like wave on the coast. Meanwhile, it has been clearly demonstrated that the hydrodynamic characteristics of solitary waves are significantly different from those of real-world tsunami waves. Modeling tsunami waves with solitary waves can misestimate the performance of seawalls under the impact of real-world tsunami waves.
4.2. Effects of Wave Height and Water Depth
In this section, effects of the incident wave height and still water depth on the hydrodynamic characteristics of seawalls under the impact of tsunami-like waves are analyzed and discussed. To consider the effects of incident wave height, the still water depth was set as 0.5 m. Five different wave height ratios were selected:
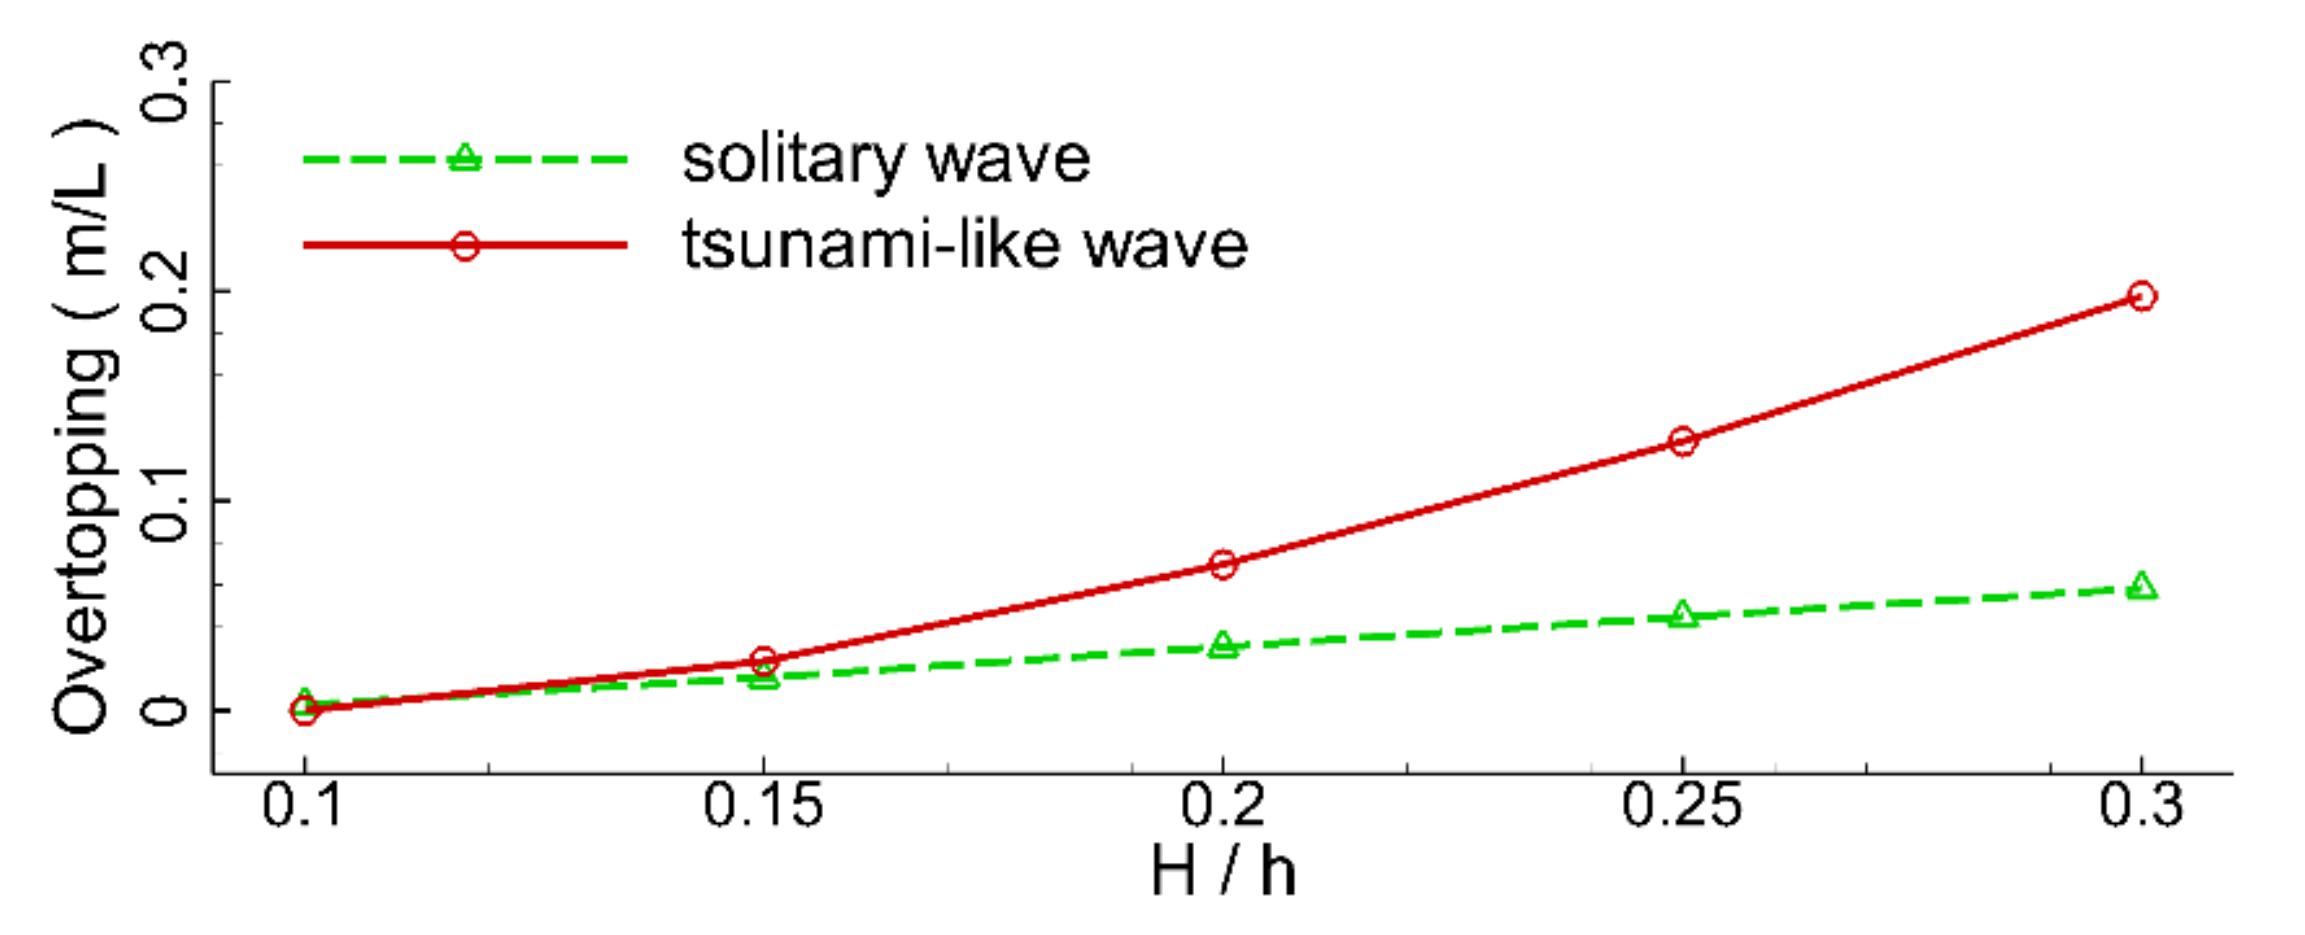
= 0.1, 0.15, 0.2, 0.25, and 0.3. Variations in the maximum volume of overtopping water with incident wave height are plotted in
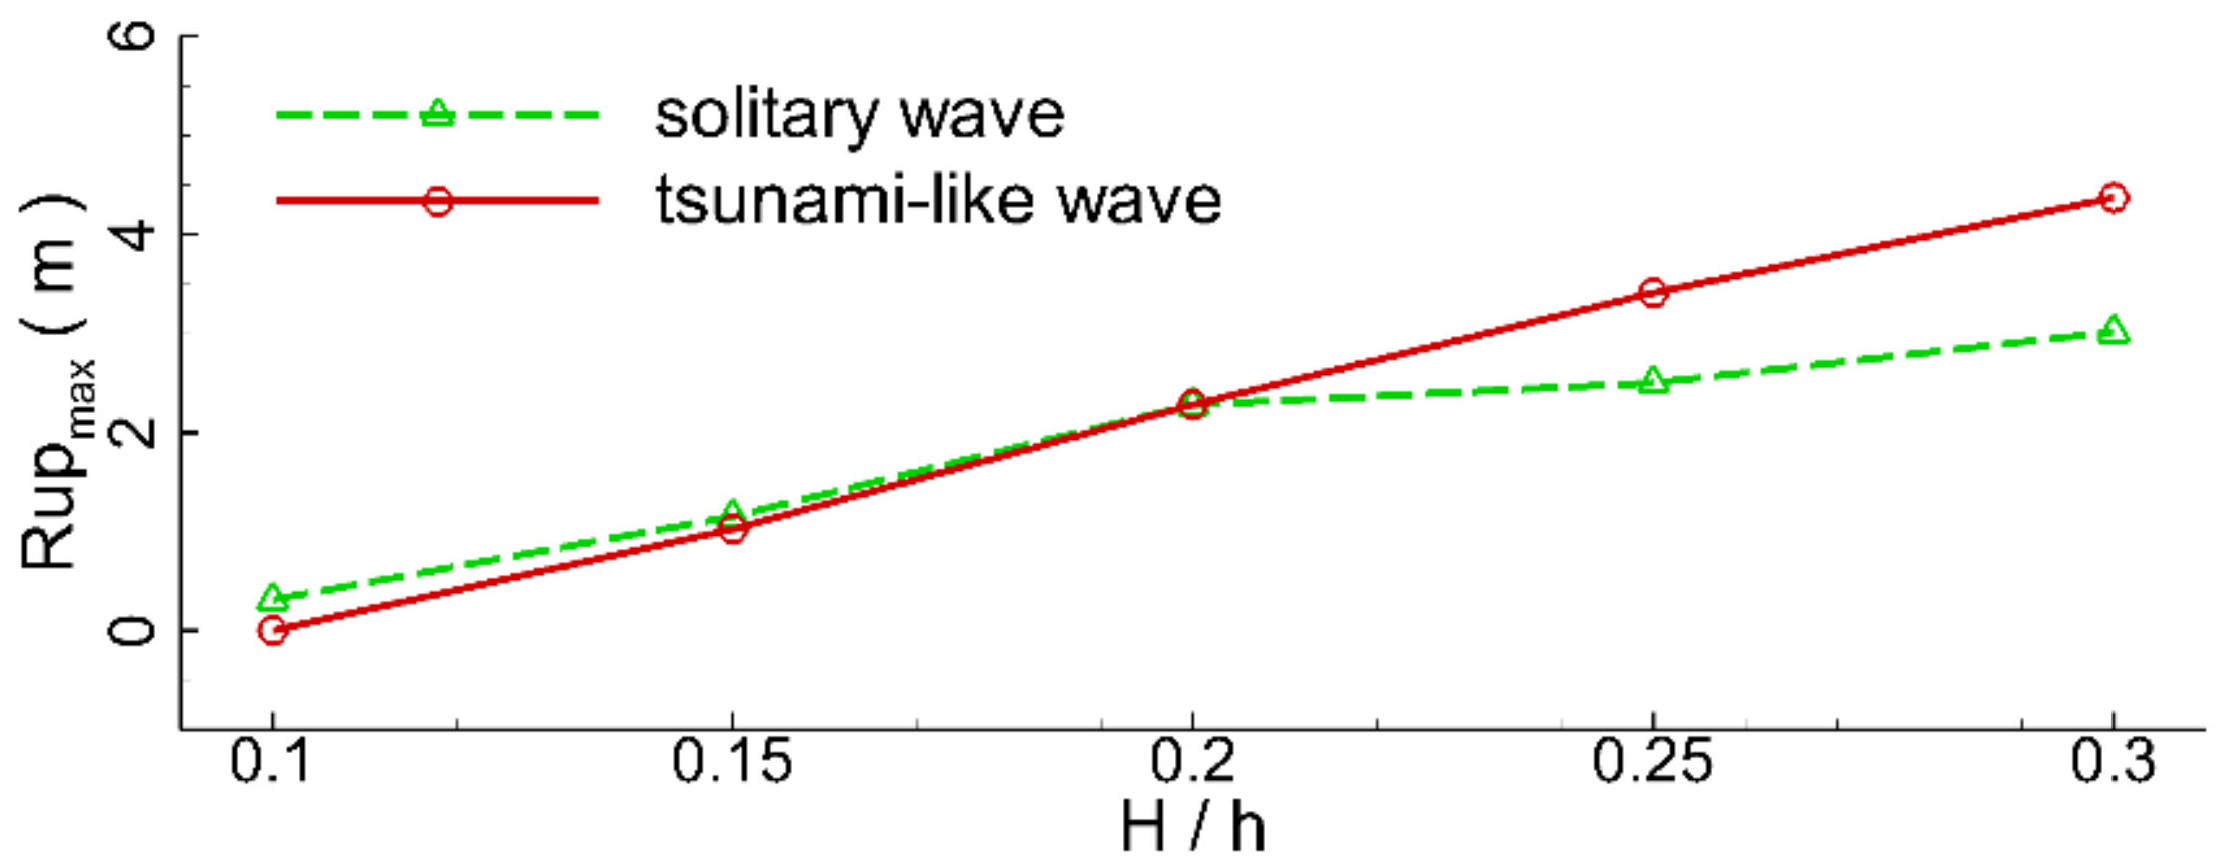
Figure 18. It can be seen that the maximum volume of the overtopping water of the tsunami-like wave increased sharply with the wave height in a parabolic mode. However, the maximum volume of the overtopping water of the solitary wave gently increased linearly with wave height. It can also be observed that the maximum volume of overtopping water of the tsunami-like wave was always greater than that of the solitary wave. The maximum volume of overtopping water of the tsunami-like wave was about 2.37 times greater than that of the solitary wave at the wave height ratio of 0.3. Variations in the maximum wave runup height with incident wave height are plotted in
Figure 19. It can be seen that the maximum wave runup height of tsunami-like wave gradually increased in a linear mode. When the incident wave height was small (
< 0.2), the maximum wave runup height of tsunami-like wave was slightly smaller than the solitary wave. When the incident wave height ratio (
) was greater than 0.2, the increasing rate of the maximum wave runup height for the solitary wave tended to decrease, resulting in its maximum wave runup height becoming smaller than the tsunami-like wave. Comparisons of the variations in wave reflection coefficients with incident wave height are plotted in
Figure 20. It can be seen that the reflection coefficients for both the tsunami-like wave and the solitary wave tended to decrease with the wave height. This indicates that the strength of the waves climbing over the seawall increased with incident wave height. It can also be seen that the reflection coefficient of the solitary wave decreased monotonically with wave height. When the wave height ratio was no more than 0.15, the wave reflection coefficient of the tsunami-like wave decreased monotonically with wave height and was smaller than that of the solitary wave. However, when the wave height ratio was between 0.15 and 0.25, the wave reflection coefficient of the tsunami-like wave was almost not affected by the variations in wave height. When the wave height ratio was greater than 0.25, the wave reflection coefficient continually decreased with wave height.
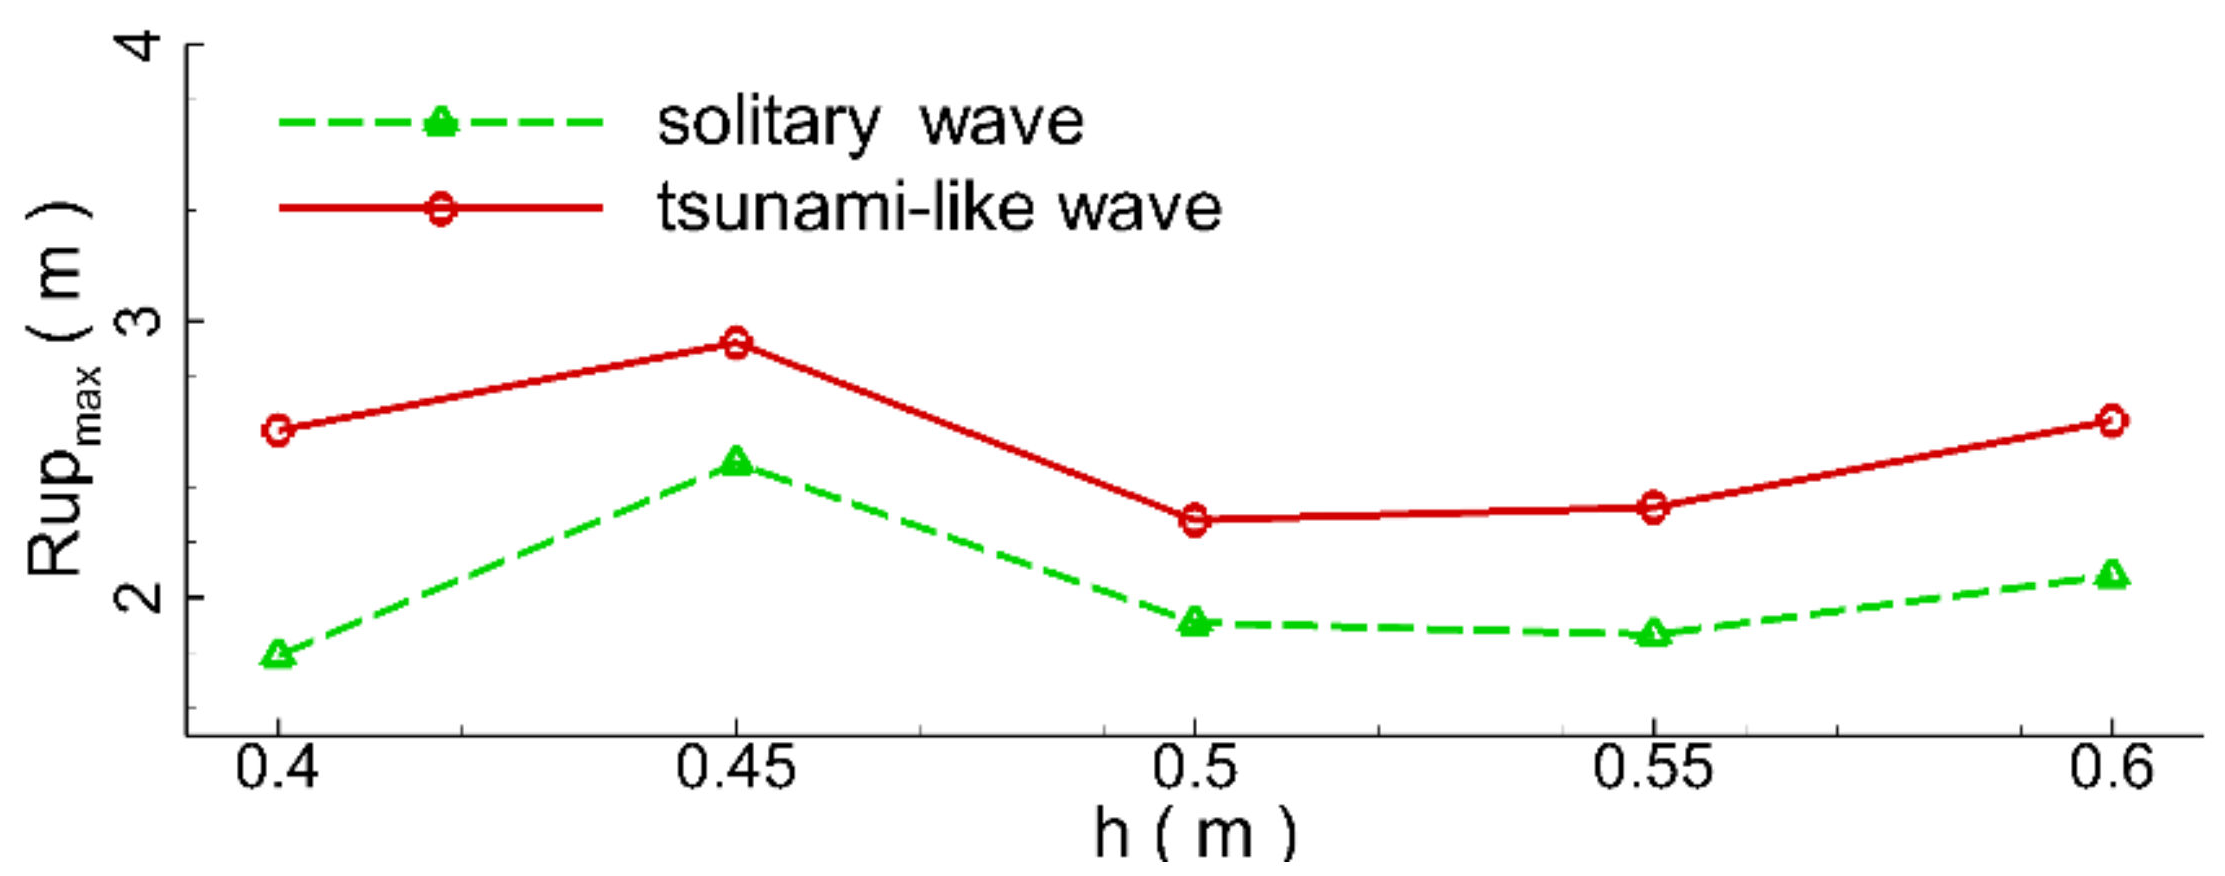
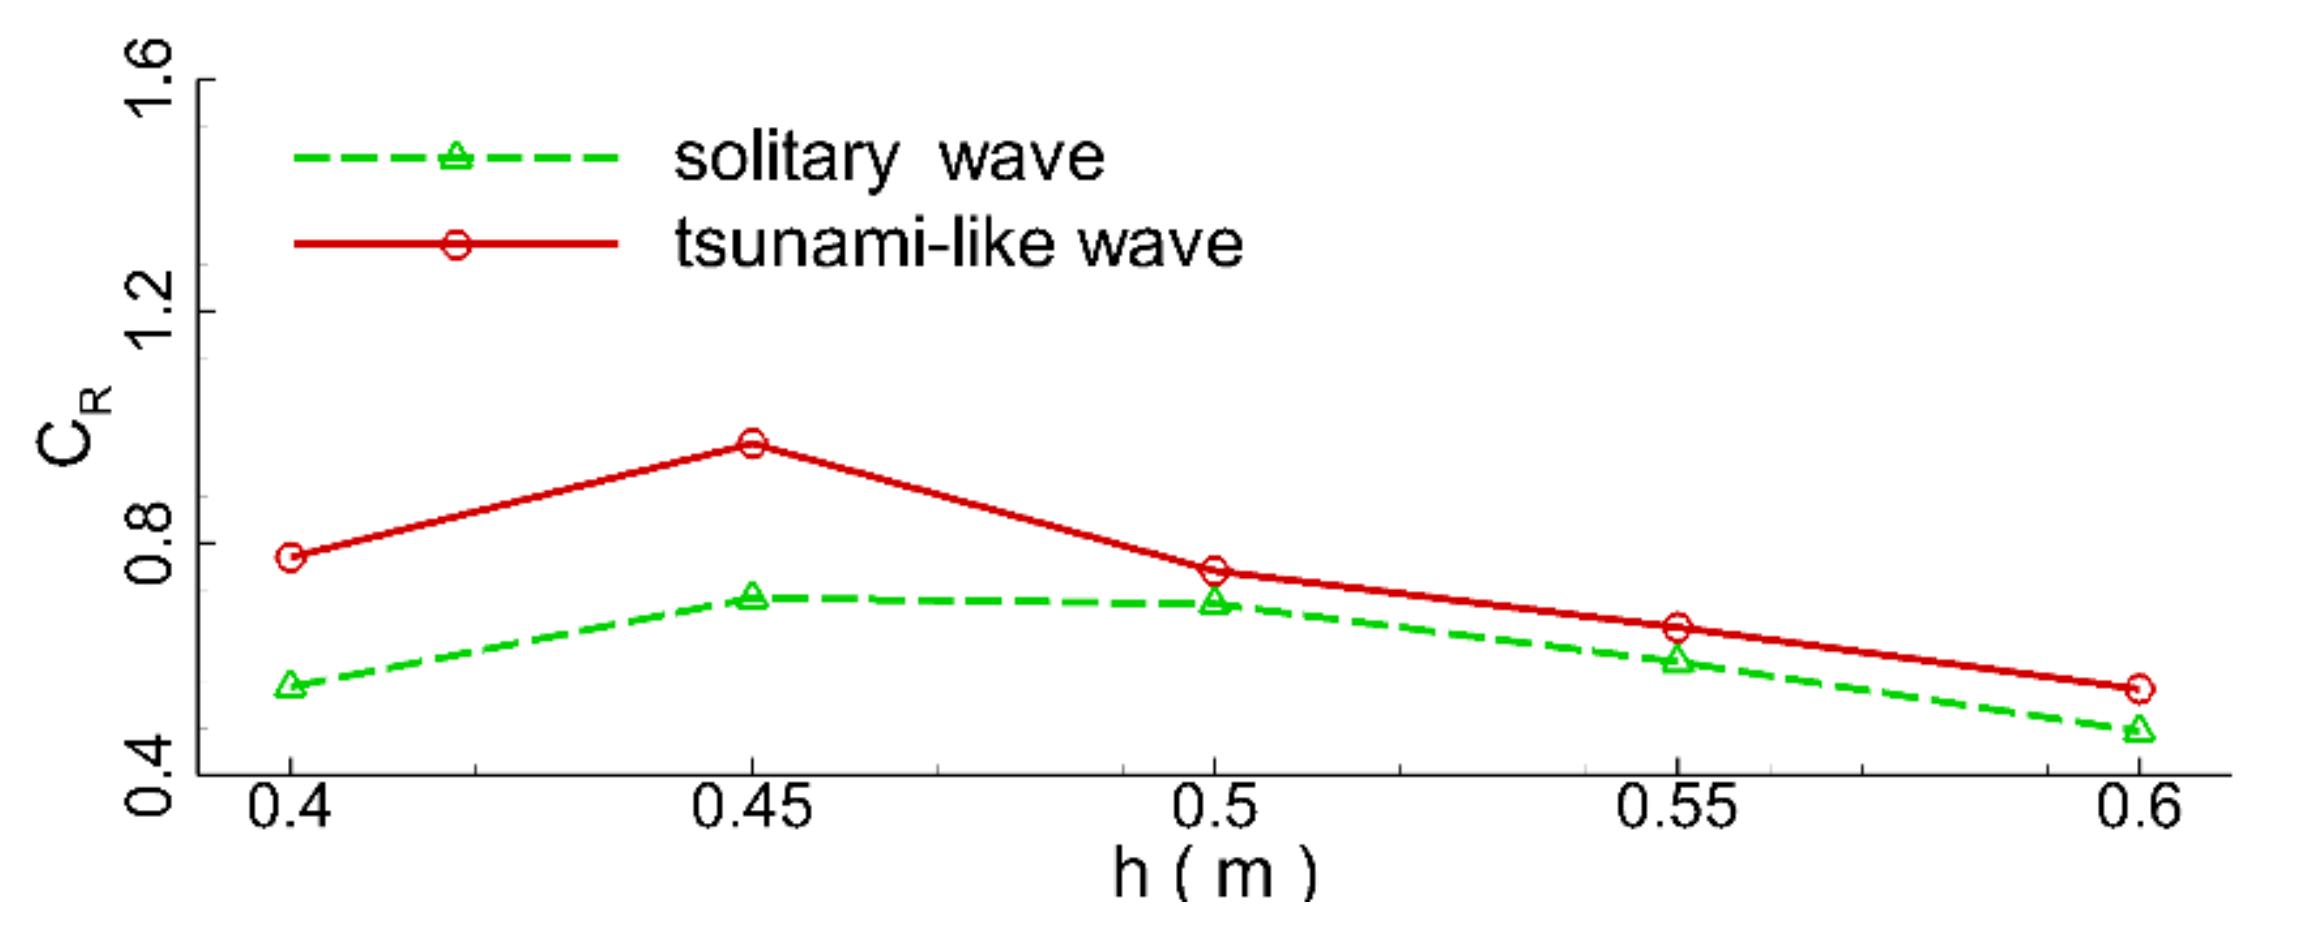
To consider the effects of still water depth, the incident wave height (
) was kept as 0.1 m. Five different still water depths—
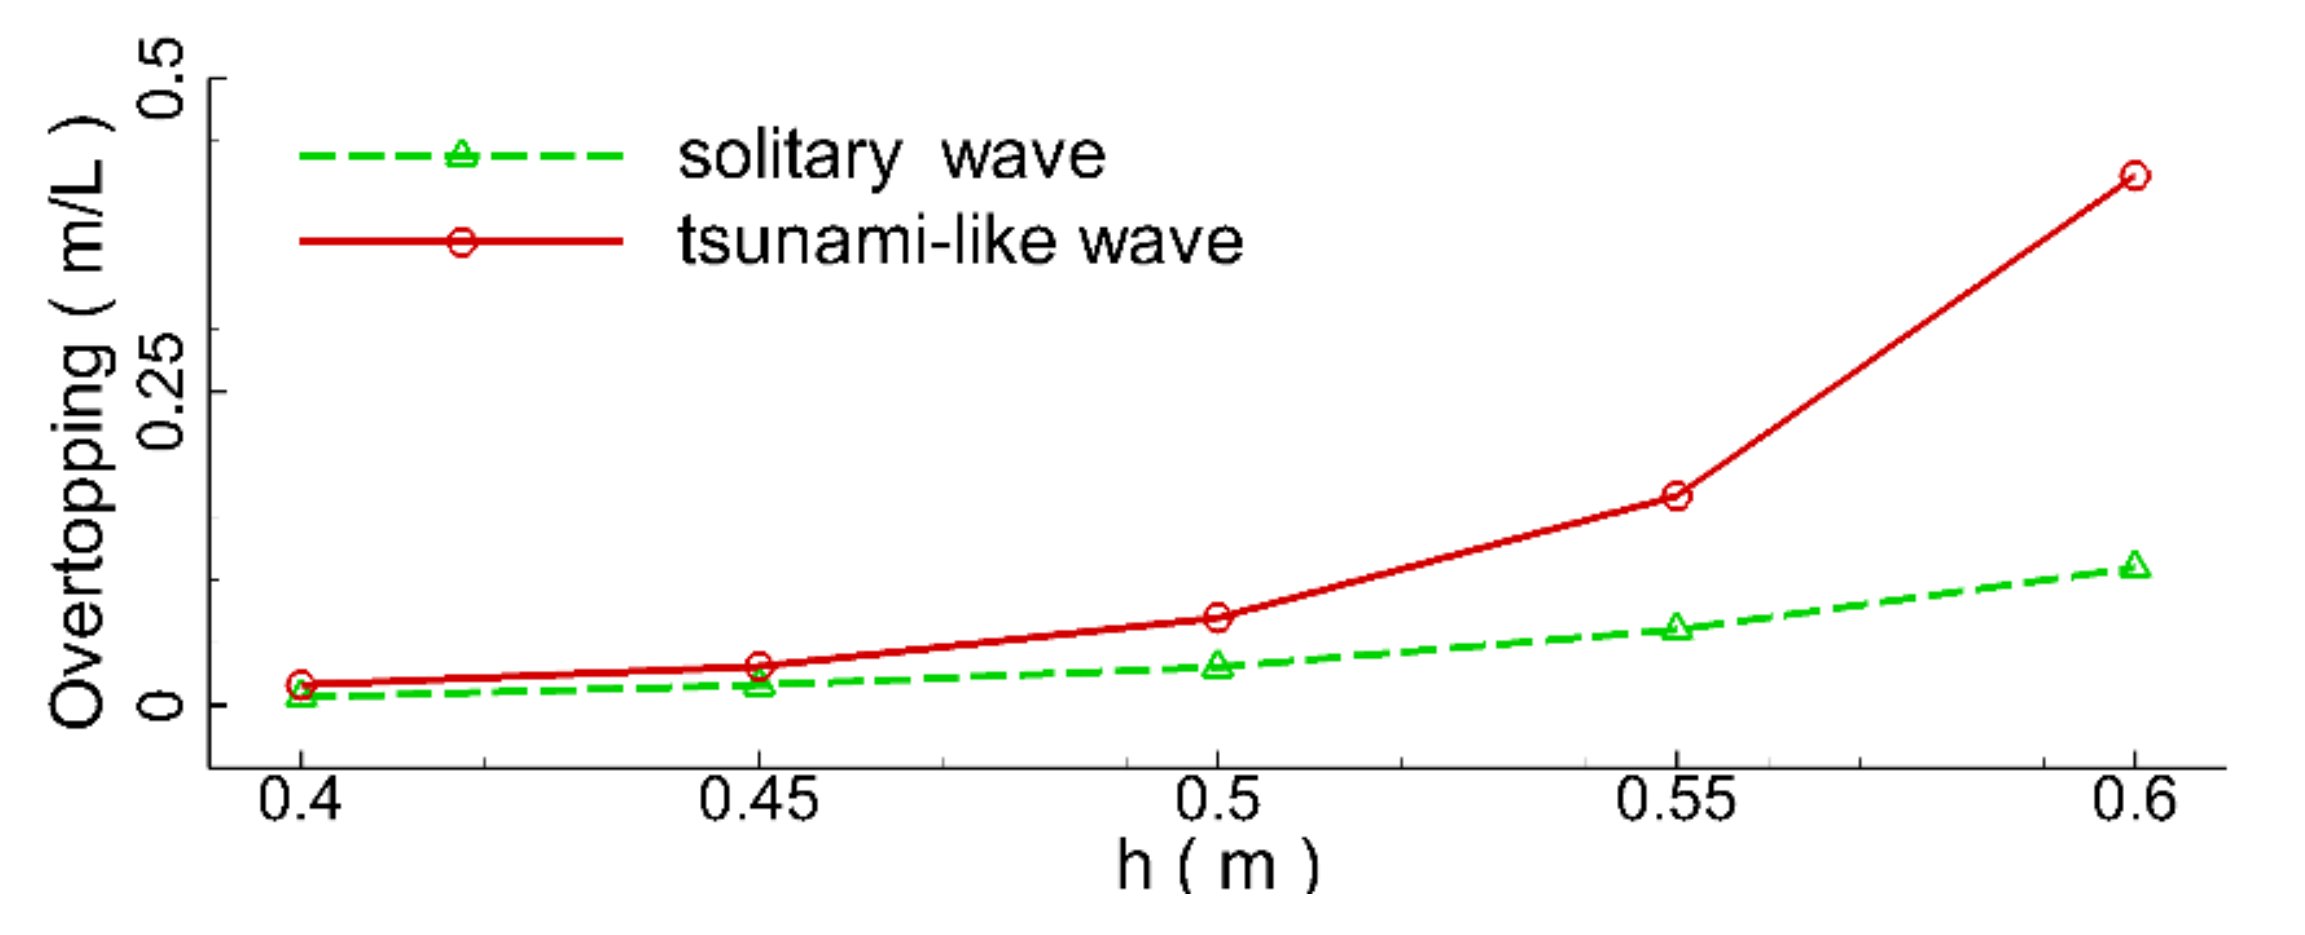
= 0.4, 0.45, 0.5, 0.55, and 0.6 m—were selected. Variations in maximum volume of overtopping water with water depth are plotted in
Figure 21. It can be seen that the maximum volume of overtopping water of the tsunami-like wave increased sharply with water depth, as the increase in water depth resulted in a decreased clearance height of the seawall. The increasing rate of the maximum volume of overtopping water of the tsunami-like wave was much greater than the solitary wave. When
=0.6 m, the maximum volume of overtopping water of the tsunami-like wave was almost three times that of the solitary wave. The variations in the maximum wave runup height of the tsunami-like wave and the solitary wave exhibited nonlinear behaviors, as shown in
Figure 22. The maximum wave runup height of the tsunami-like wave was always greater than the solitary wave under different water depths: on average, 1.26 times greater. Comparisons of the variations in wave reflection coefficients with water depth are plotted in
Figure 23. It can be seen that wave reflection coefficients for both the tsunami-like wave and the solitary wave tended to decrease with water depth when the still water depth was greater than 0.45 m. This is because an increase in water depth reduces the clearance height of the seawall, making it easier for waves to climb over the seawall and run up the sloped beach. It can also be seen that the wave reflection coefficient of the tsunami-like wave was always greater than the solitary wave. Meanwhile, when
= 0.45 m, the wave reflection coefficients for both the tsunami-like wave and the solitary wave approached their peak values.
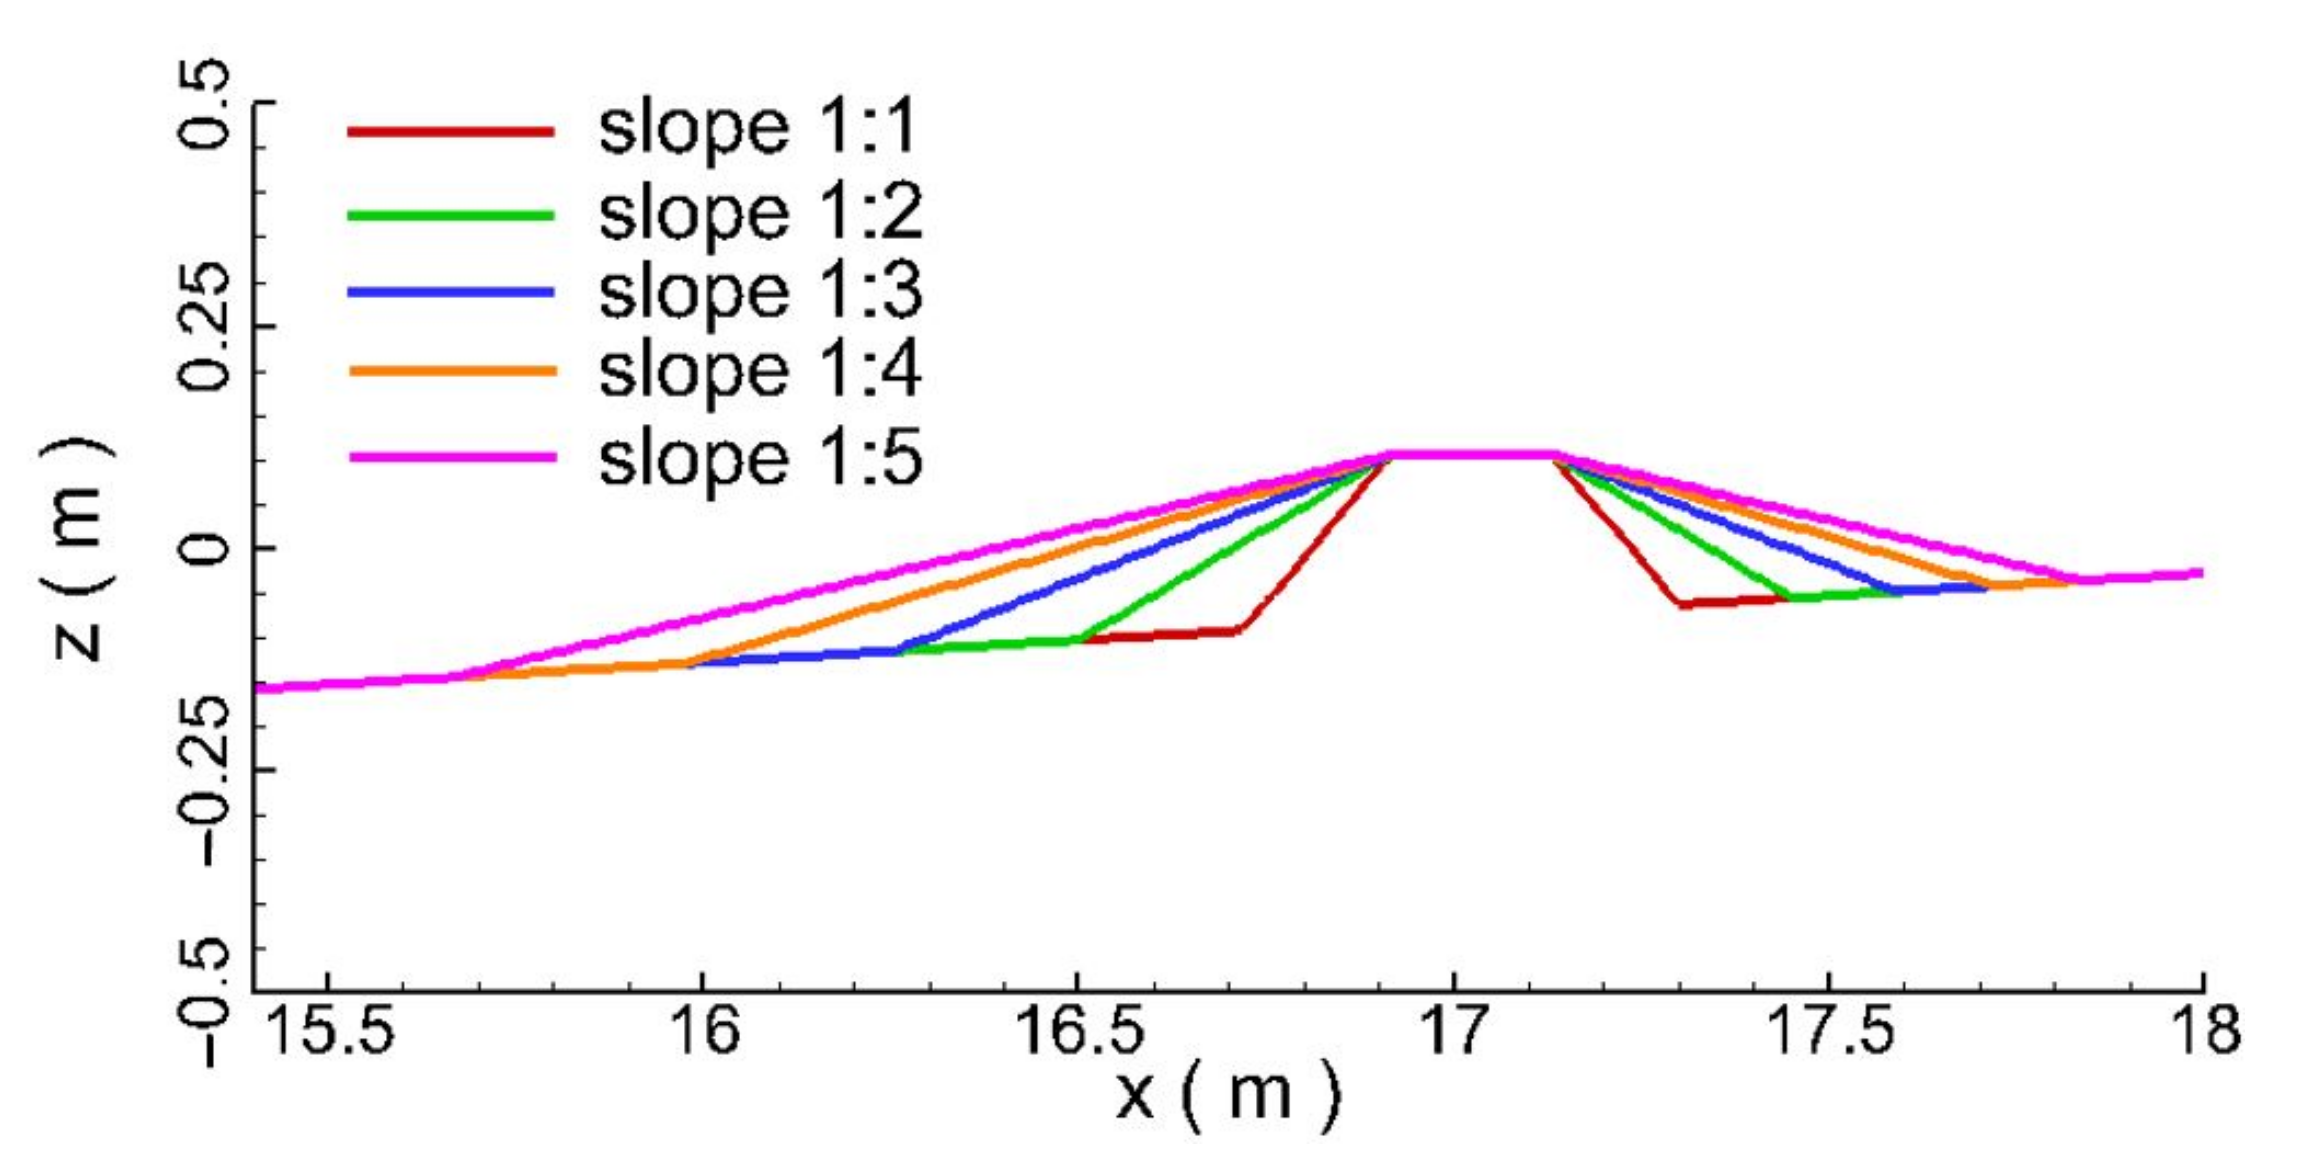
4.3. Effects of the Side Slope of the Seawall
In this section, effects of the side slope of the seawall on the overtopping properties of the tsunami-like wave are systematically investigated. Five different side slopes of seawall are selected:
= 1, 2, 3, 4, and 5. In the computation, the incident wave height (
) was set as 0.1 m. The still water depth (
) was kept as 0.5 m.
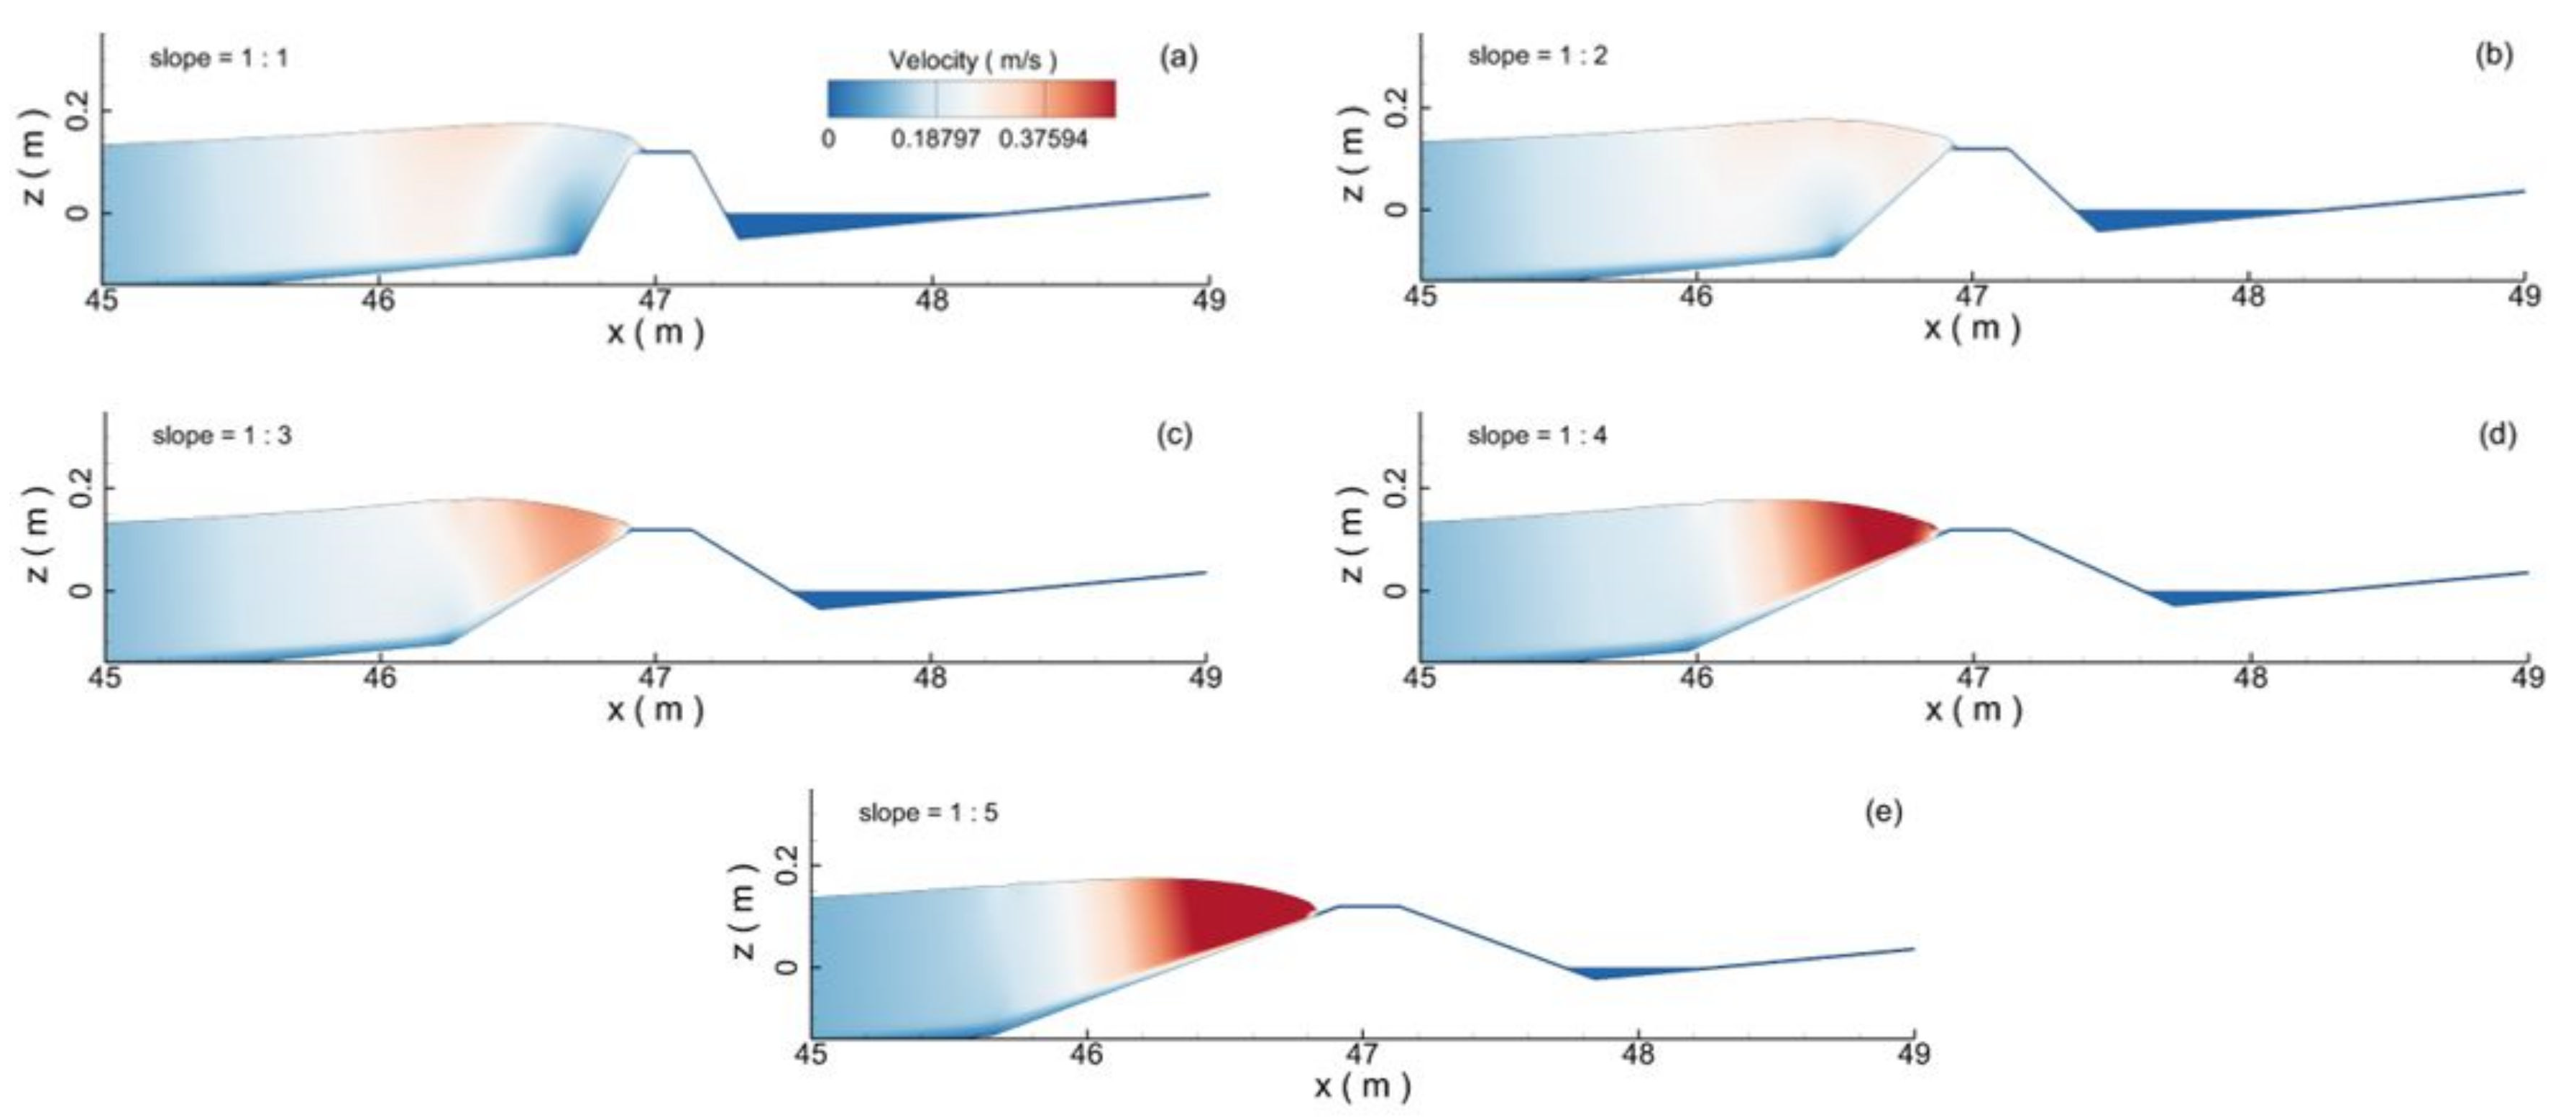
Figure 24 depicts the geometric dimensions of the seawall with different side slopes. Snapshots of the velocity contour of the water body in the instance of the wave climbing over the seawall are plotted in
Figure 25. It can be seen that the blocking effects of the seawall can be gradually enhanced with the side slope of the seawall. The velocity magnitude of the water body near the incoming wave head area gradually decreases.
Figure 26 shows the variations in the maximum overtopping water with the side slopes of the seawall. It can be seen that the maximum volumes of overtopping water of both the tsunami-like wave and the solitary wave slightly decreased with the side slope of the seawall. The influence of the side slope of the seawall on the maximum overtopping water was not noticeable. However, the maximum volume of overtopping water of the tsunami-like wave was always greater than that of the solitary wave: on average, 2.17 times greater. Although the side slope of the seawall had limited influence on the maximum overtopping water, it had significant influence on the maximum wave runup height, as shown in
Figure 27. The maximum wave runup height can be greatly reduced with the increase in the side slope of the seawall. The figure also shows that the maximum wave runup height of the tsunami-like wave was always greater than that of the solitary wave under different side slopes of the seawall: on average, 22.4% greater.
Figure 28 plots the variations in the wave reflection coefficients with the side slopes of the seawall. The figure clearly shows that the side slopes of the seawall had negligible influence on the wave reflection of the tsunami-like wave. It can be seen that the reflection coefficients for both the tsunami-like wave and the solitary wave tended to increase with the slope of the seawall.
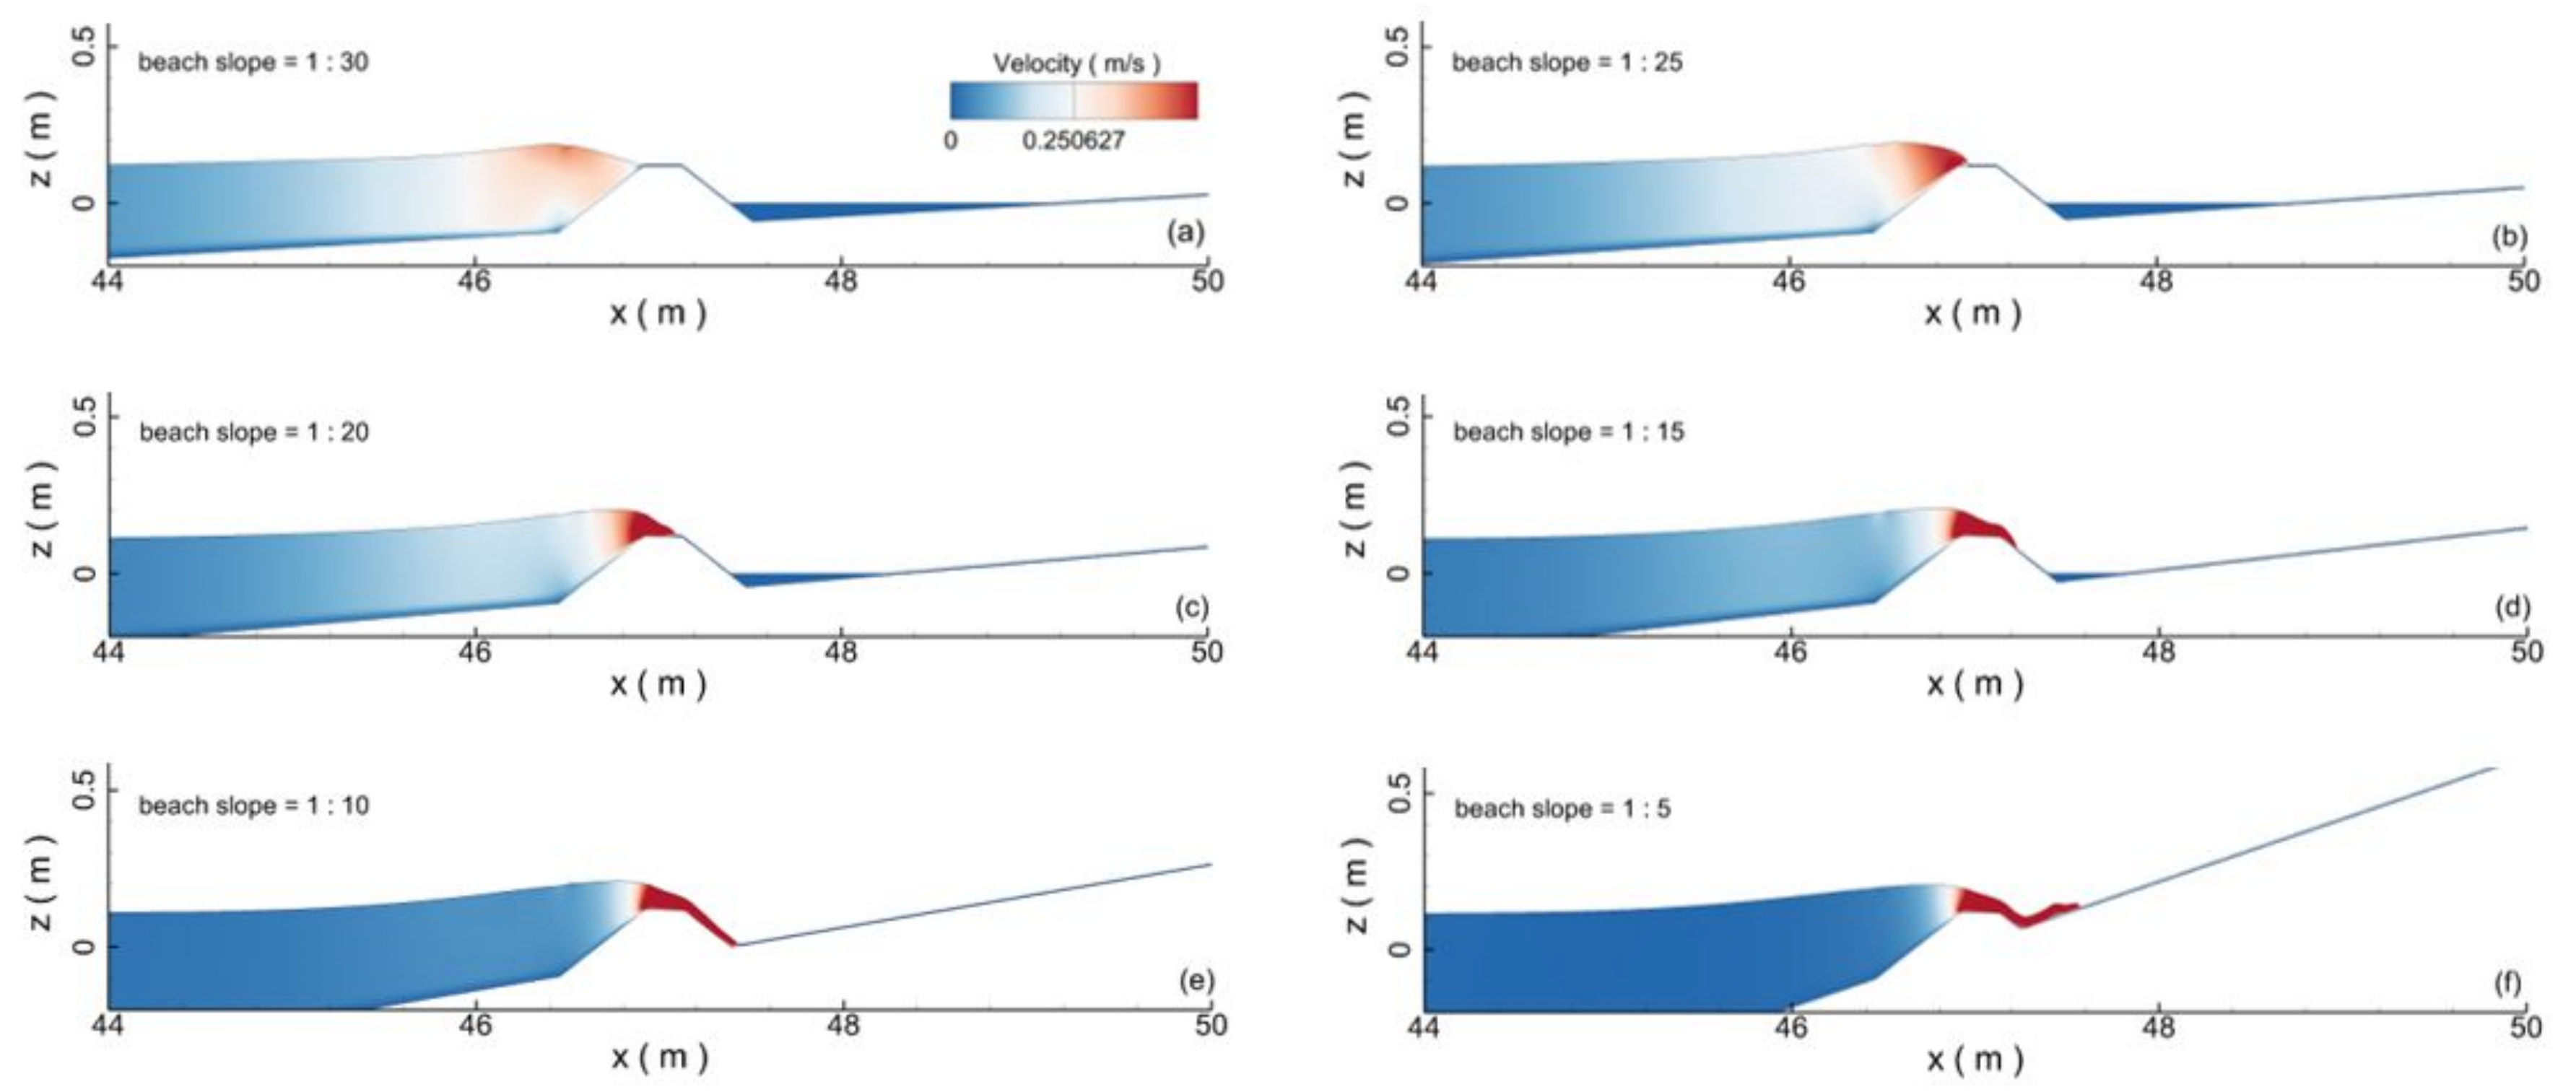
4.4. Effects of Beach Slope
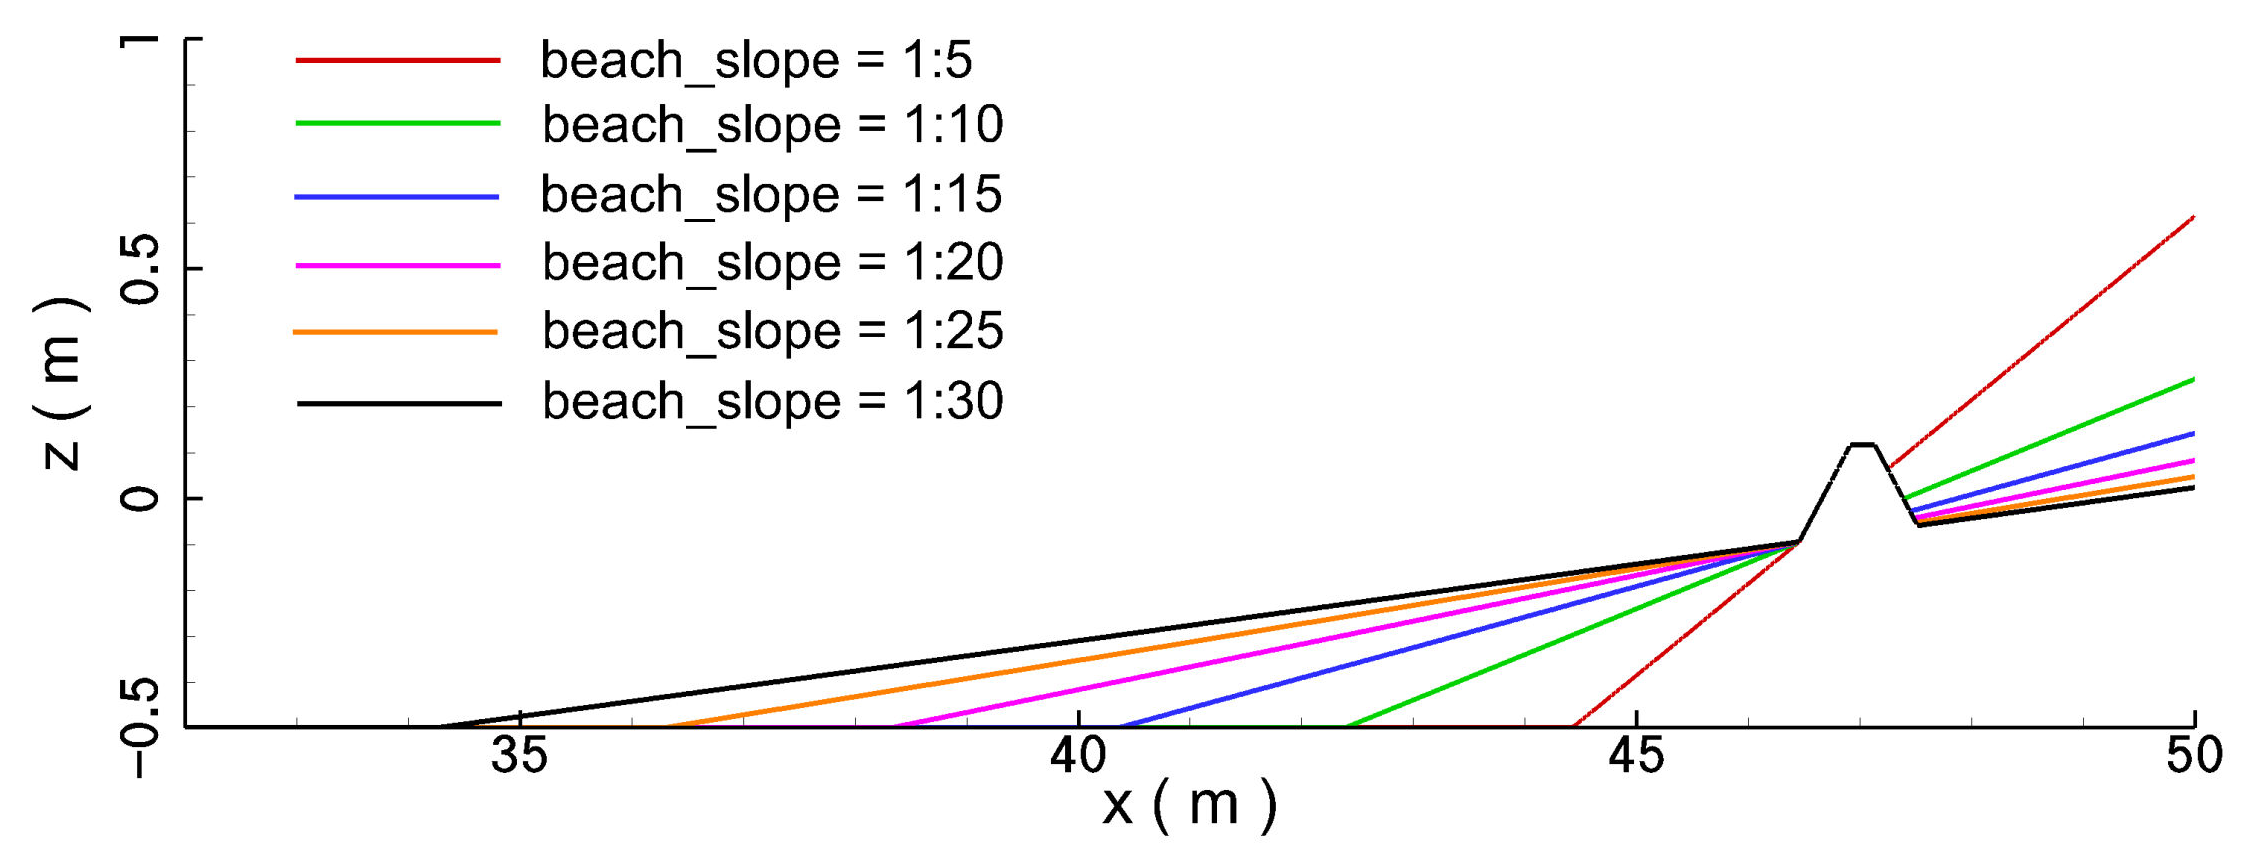
In this section, effects of the beach slope on the hydrodynamic characteristics of the seawall under the impact of the tsunami-like wave are numerically investigated. Five different beach slopes were selected,
= 5, 10, 15, 20, 25, and 30. In the computation, the still water depth (
) was kept as 0.5 m. The incident wave height (
) was set as 0.1 m.
Figure 29 depicts the computational layout for the seawall of differently sloped beaches. Snapshots of the velocity contour of the water body at the instance of wave crest climbing over the seawall are plotted in
Figure 30. The figure clearly shows that the velocity magnitude of the water body near the wave crest gradually increased with the beach slope due to the enhanced wave shallowing effects and the reflected waves.
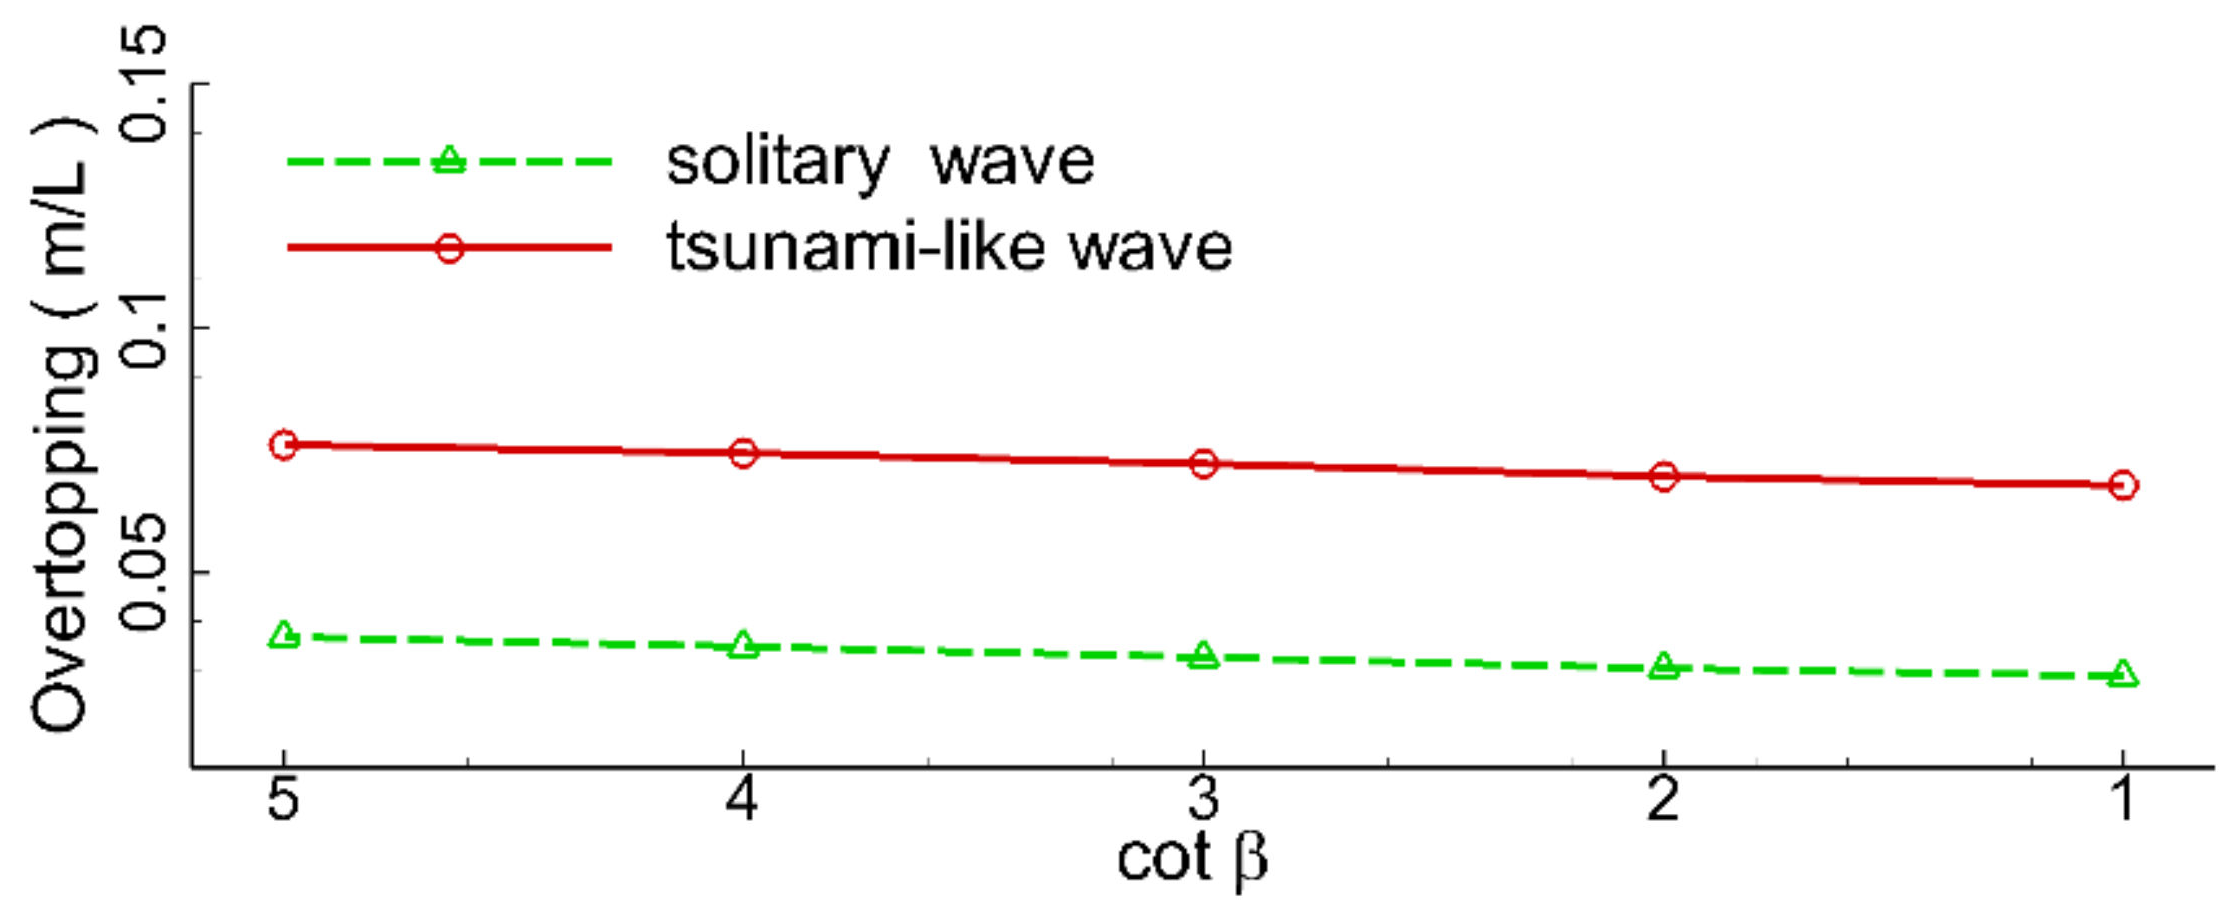
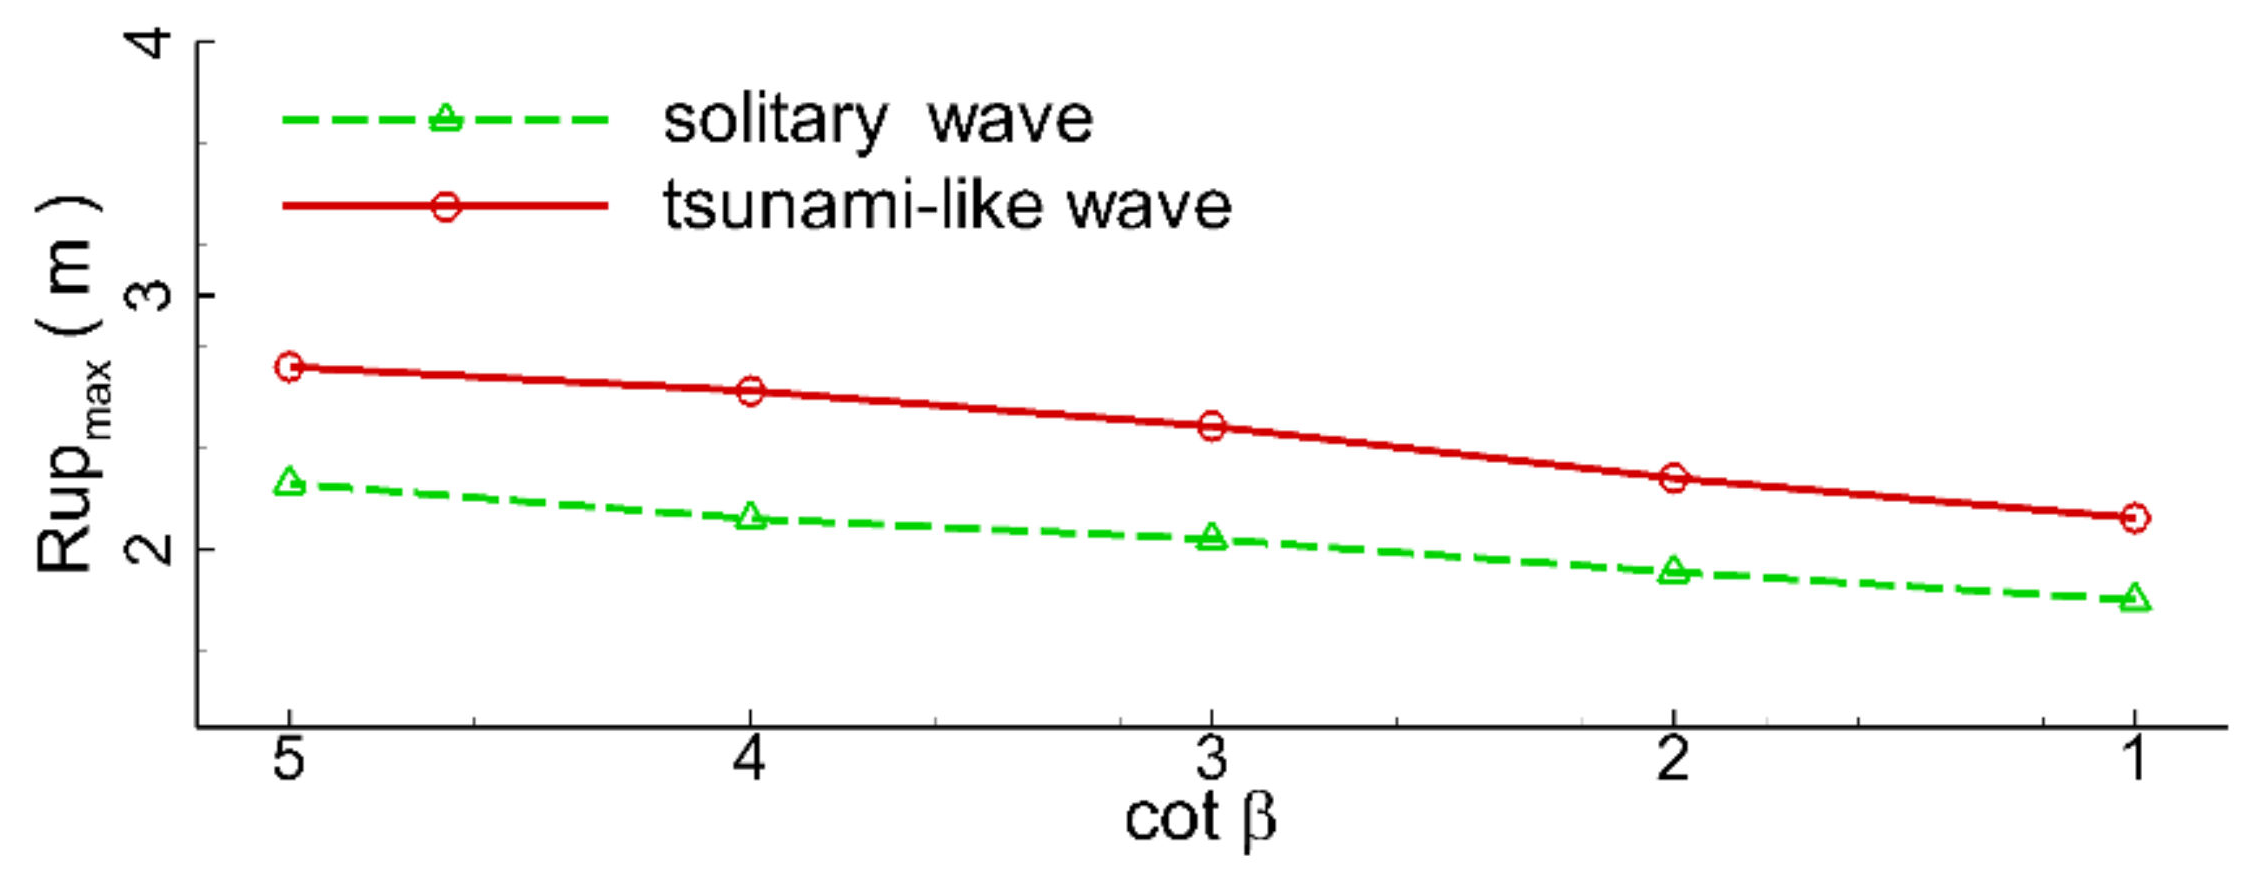
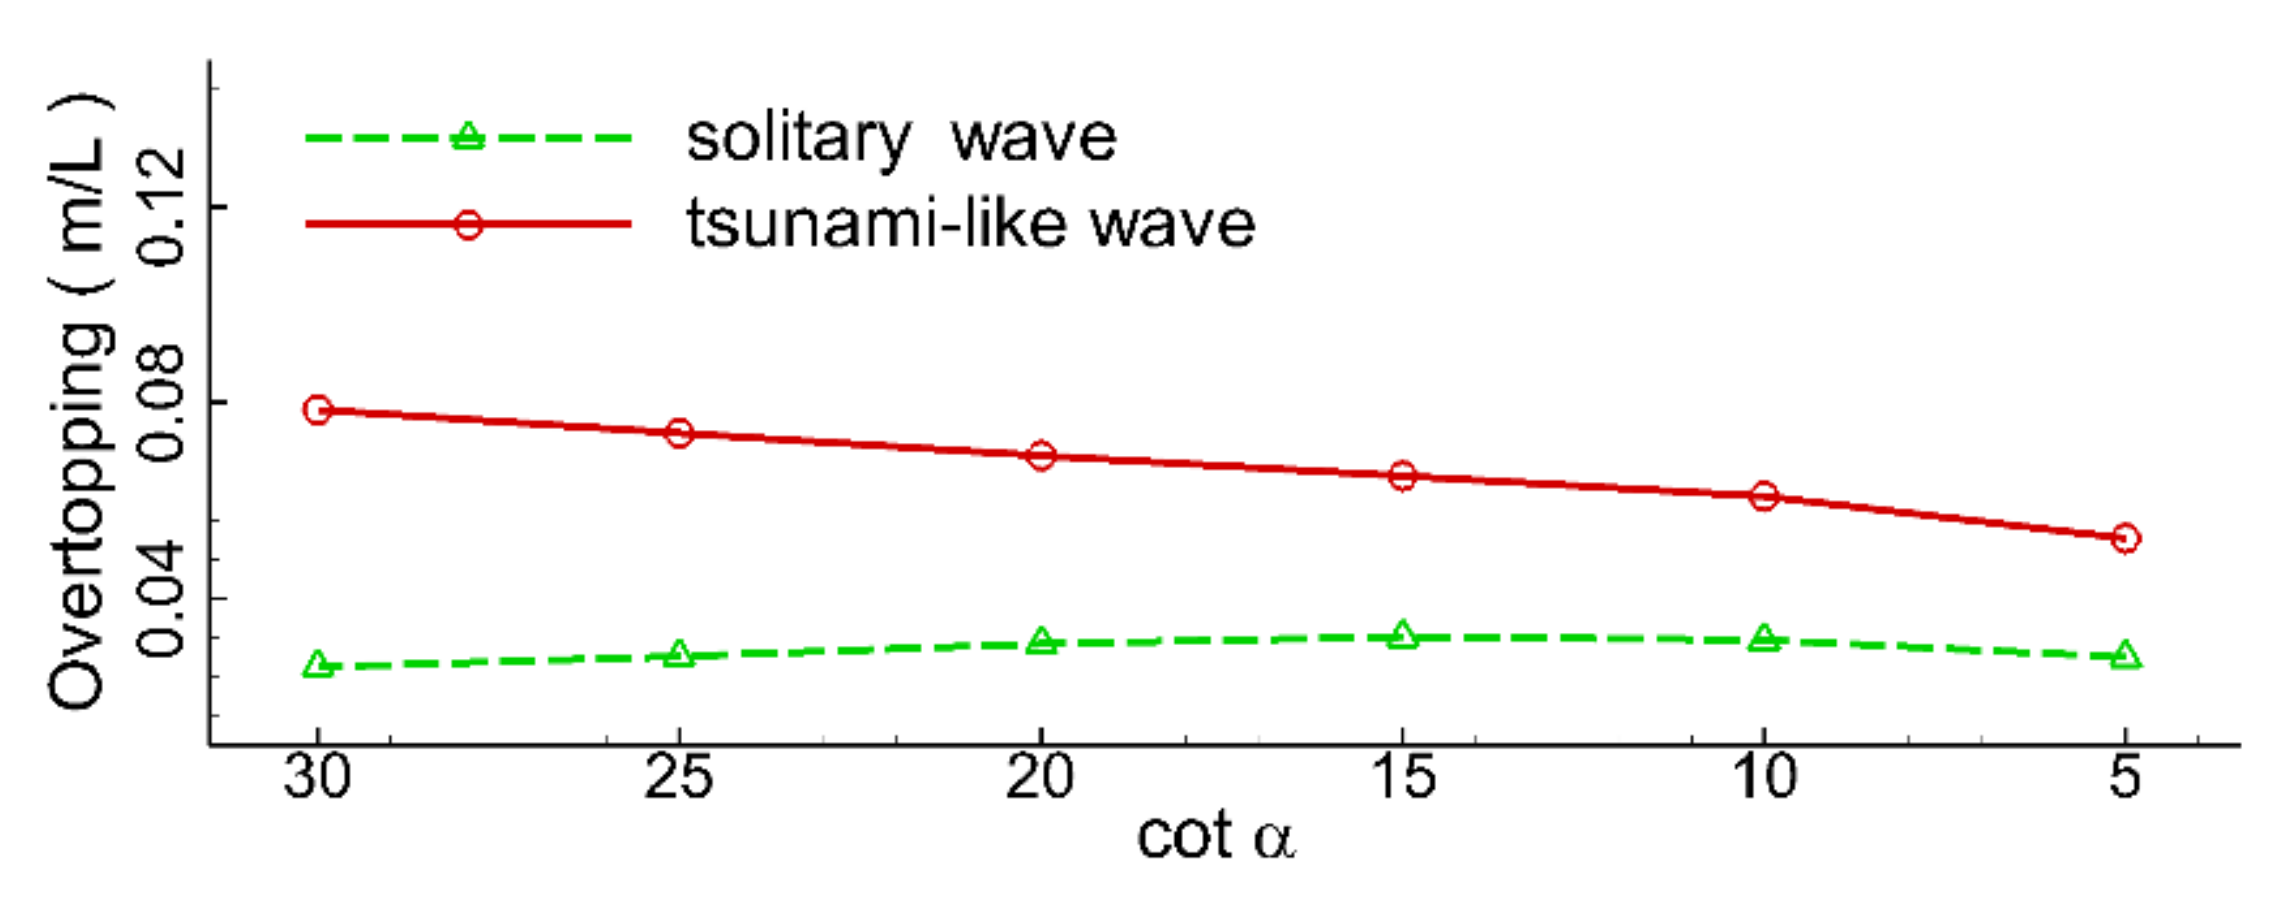
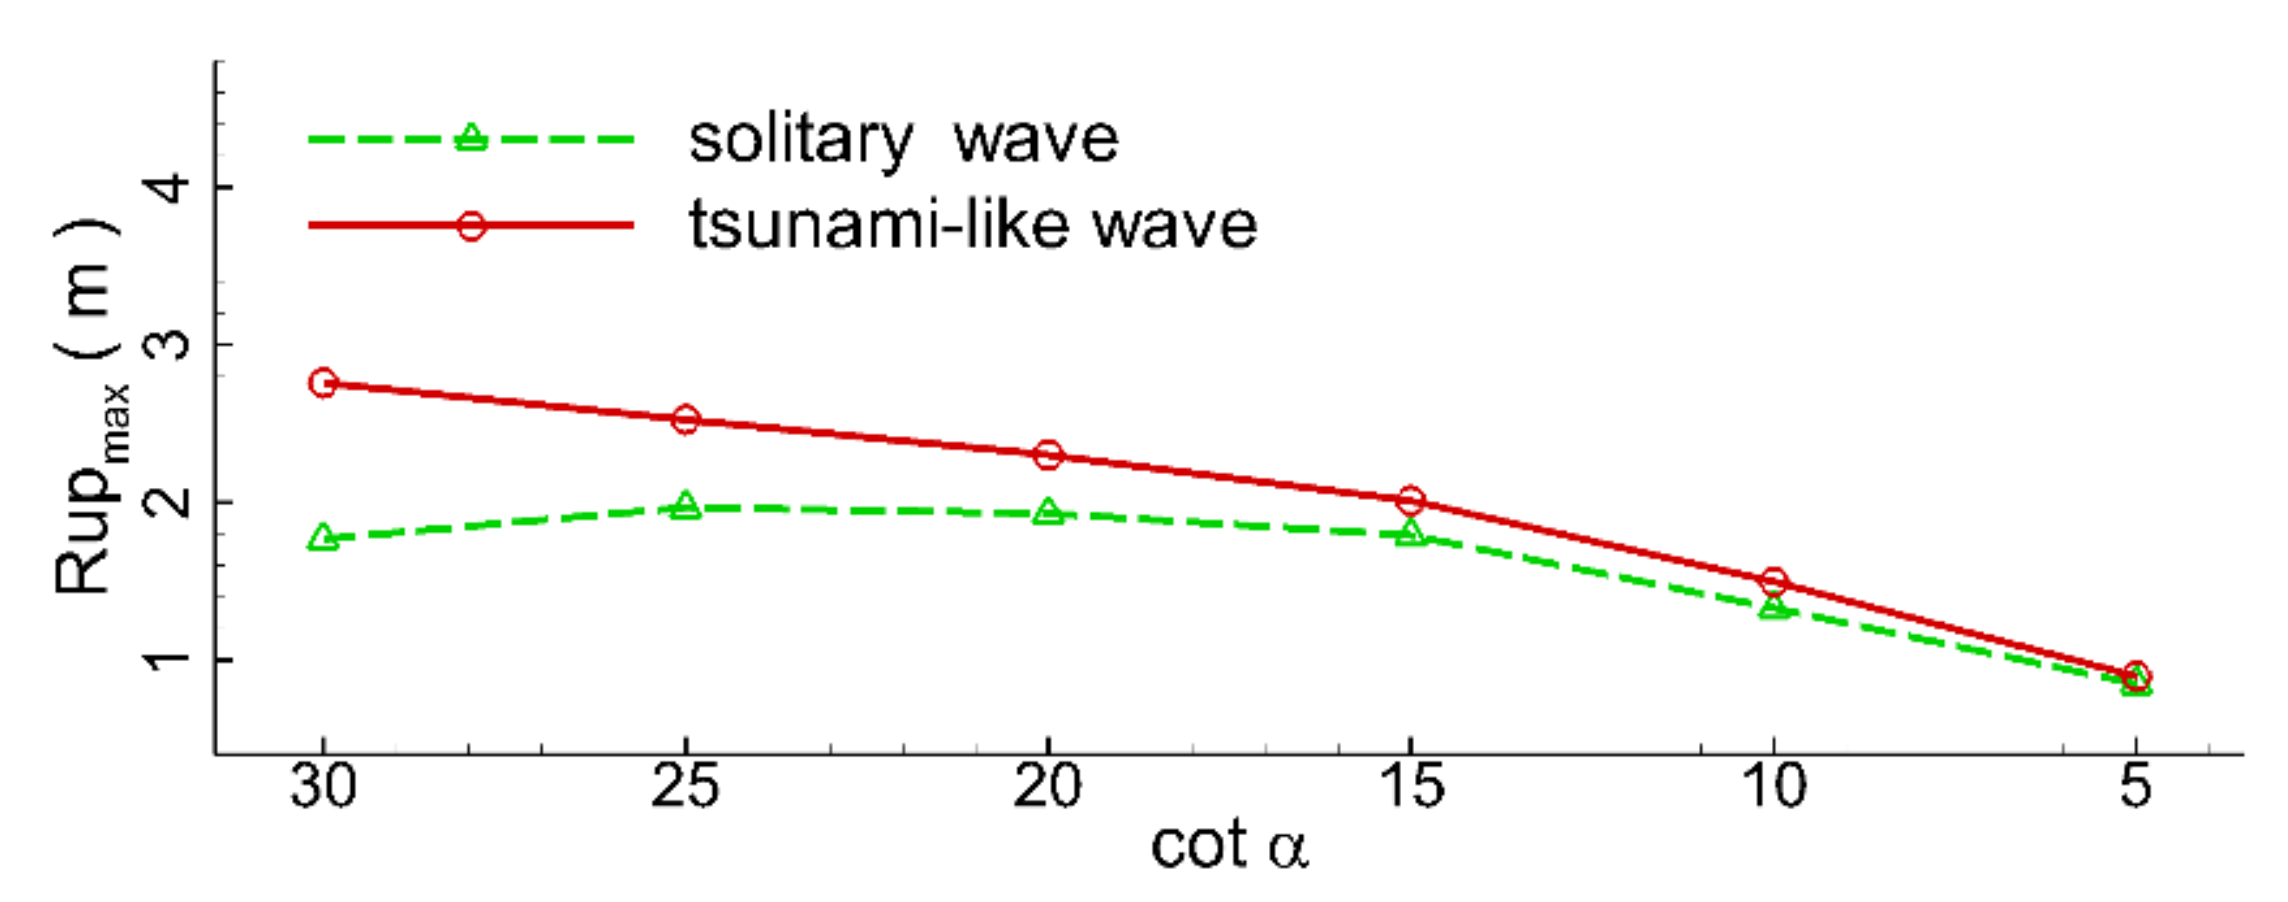
Figure 31 shows the variations in the maximum volume of overtopping water with the beach slopes. The maximum volume of overtopping water of the tsunami-like waves gradually decreased with the beach slope. However, the variations in beach slope had a very limited influence on the maximum volume of overtopping water of the solitary wave. Variations in the maximum runup height of the overtopping water surge bores with beach slopes are plotted in
Figure 32. The figure clearly shows that the maximum wave runup height gradually decreased with the beach slope. However, variations in the maximum wave runup height of the solitary wave exhibit very strong nonlinear behavior. The maximum wave runup height of the solitary wave approached its peak value at the beach slope of 1:25. These hydrodynamic differences were mainly due to the huge differences in wave length between the tsunami-like wave and the solitary wave.
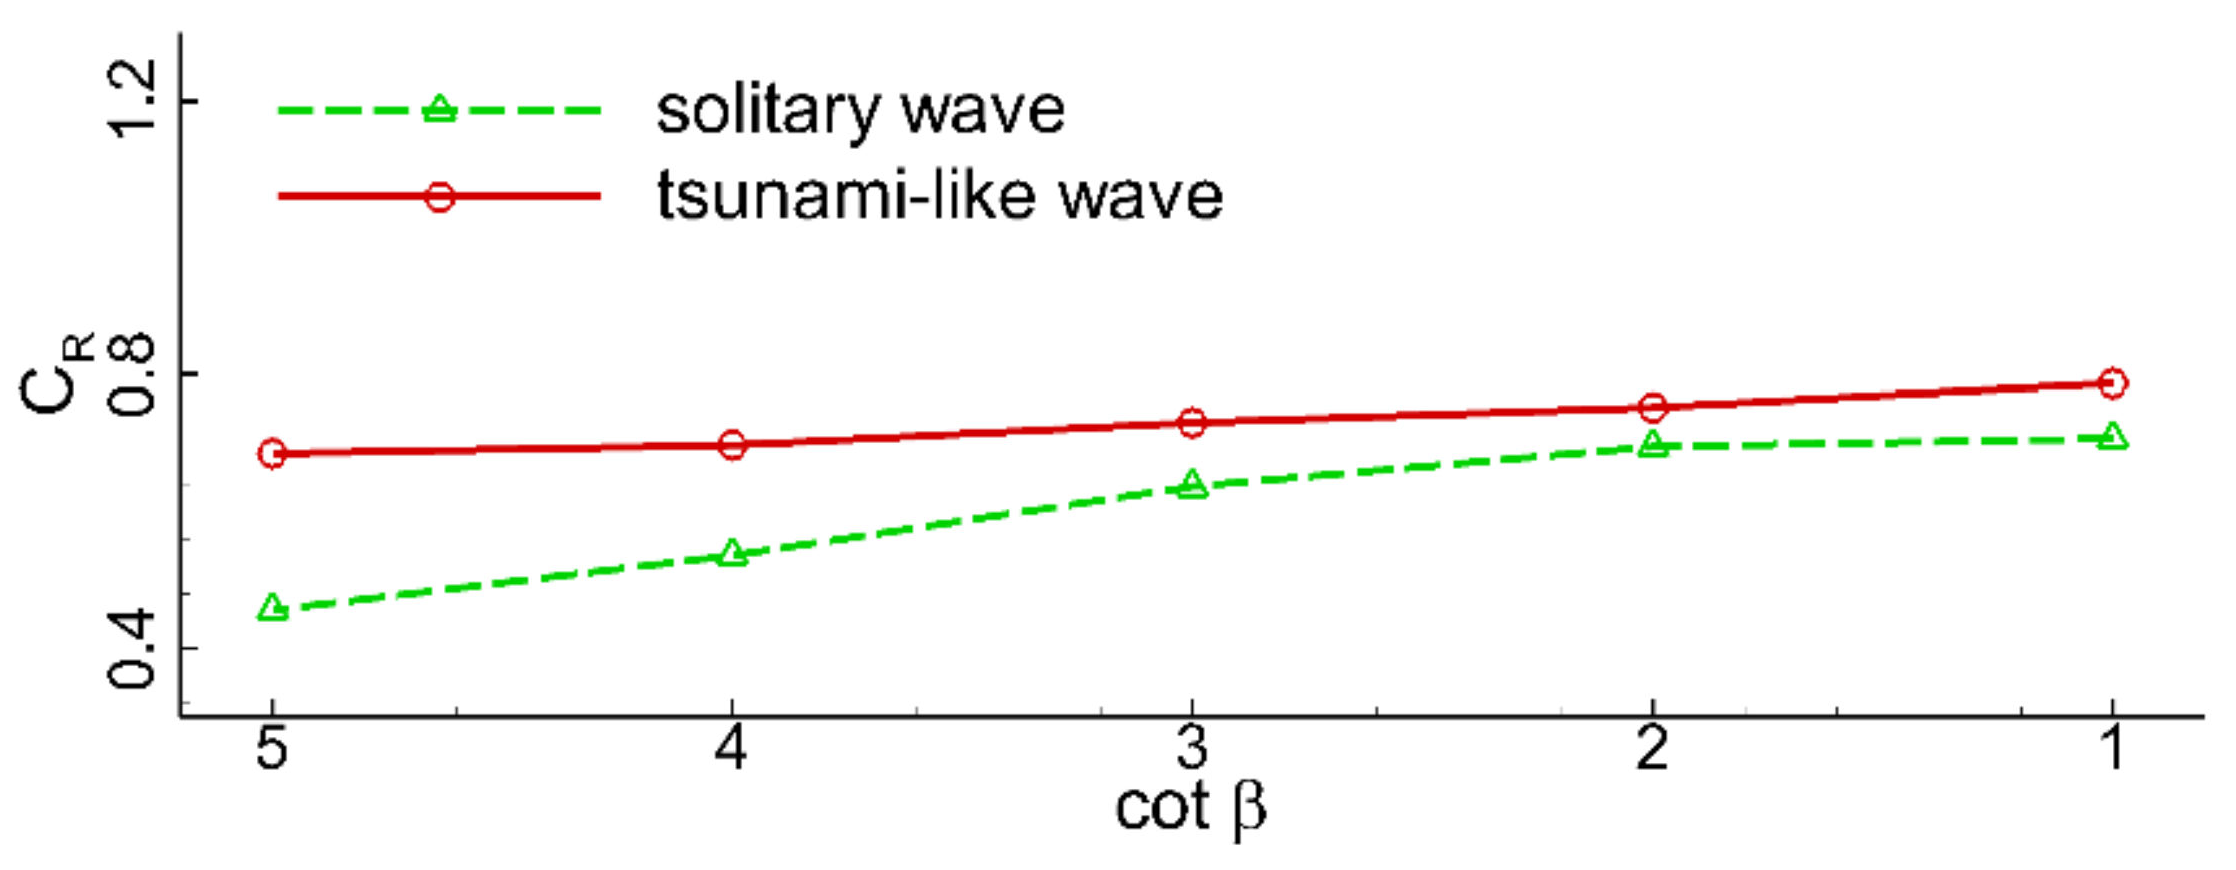
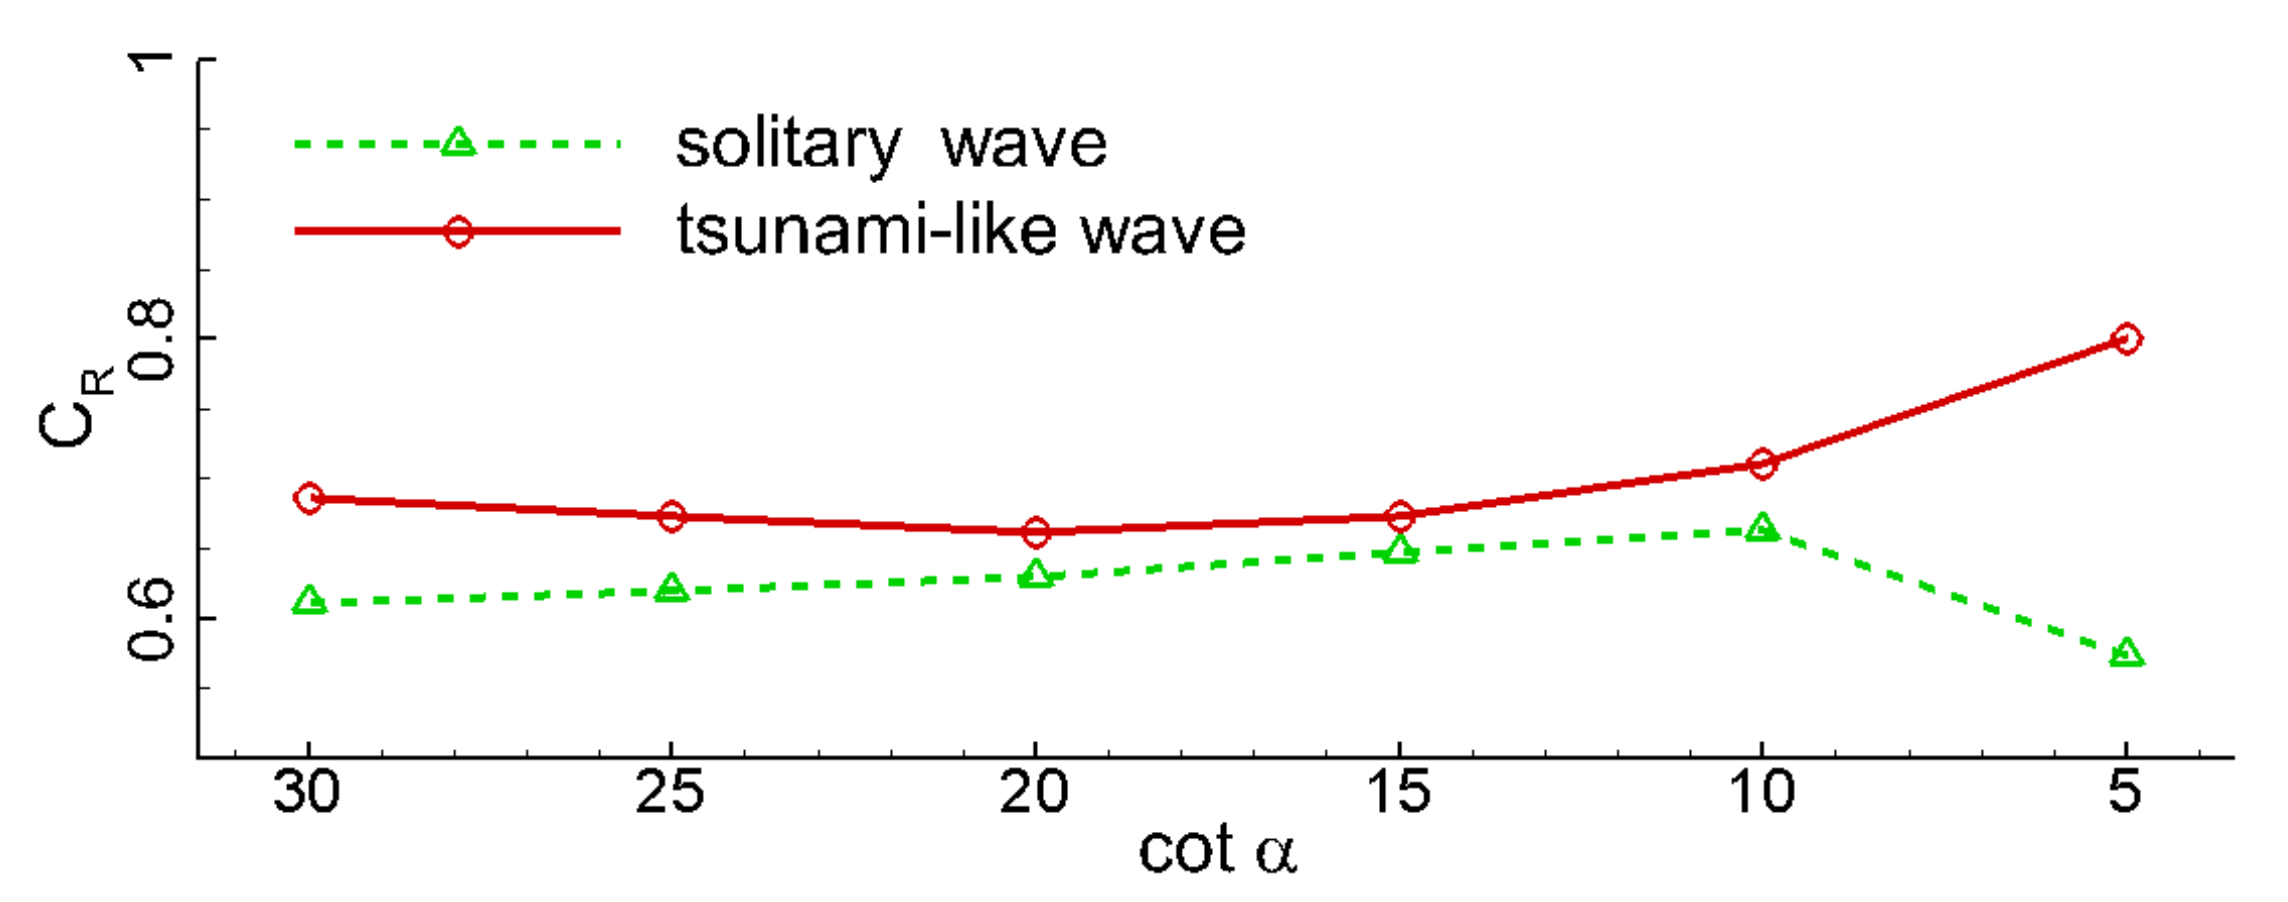
Figure 33 plots the variations in the wave reflection coefficients with the beach slope. It can be seen that when the beach slope was mild (<1:20), the wave reflection coefficient of the tsunami wave decreased slightly with the beach slope. When the beach slope continued to increase (>1:20), the wave reflection coefficient of the tsunami wave gradually increased with the beach slope in a parabolic mode. For the solitary wave, when the beach slope was less than 1:10, the wave reflection coefficient tended to monotonically increase with the beach slope in a linear mode. Once the beach slope was greater than 1:10, the wave reflection coefficient of the solitary wave tended to decrease.


