1. Introduction
This study helps establish the monitoring network based on the observation of the processes of formation, accumulation, emission, and deposit of primary greenhouse gases (GHGs) in various ecosystems over Russia [
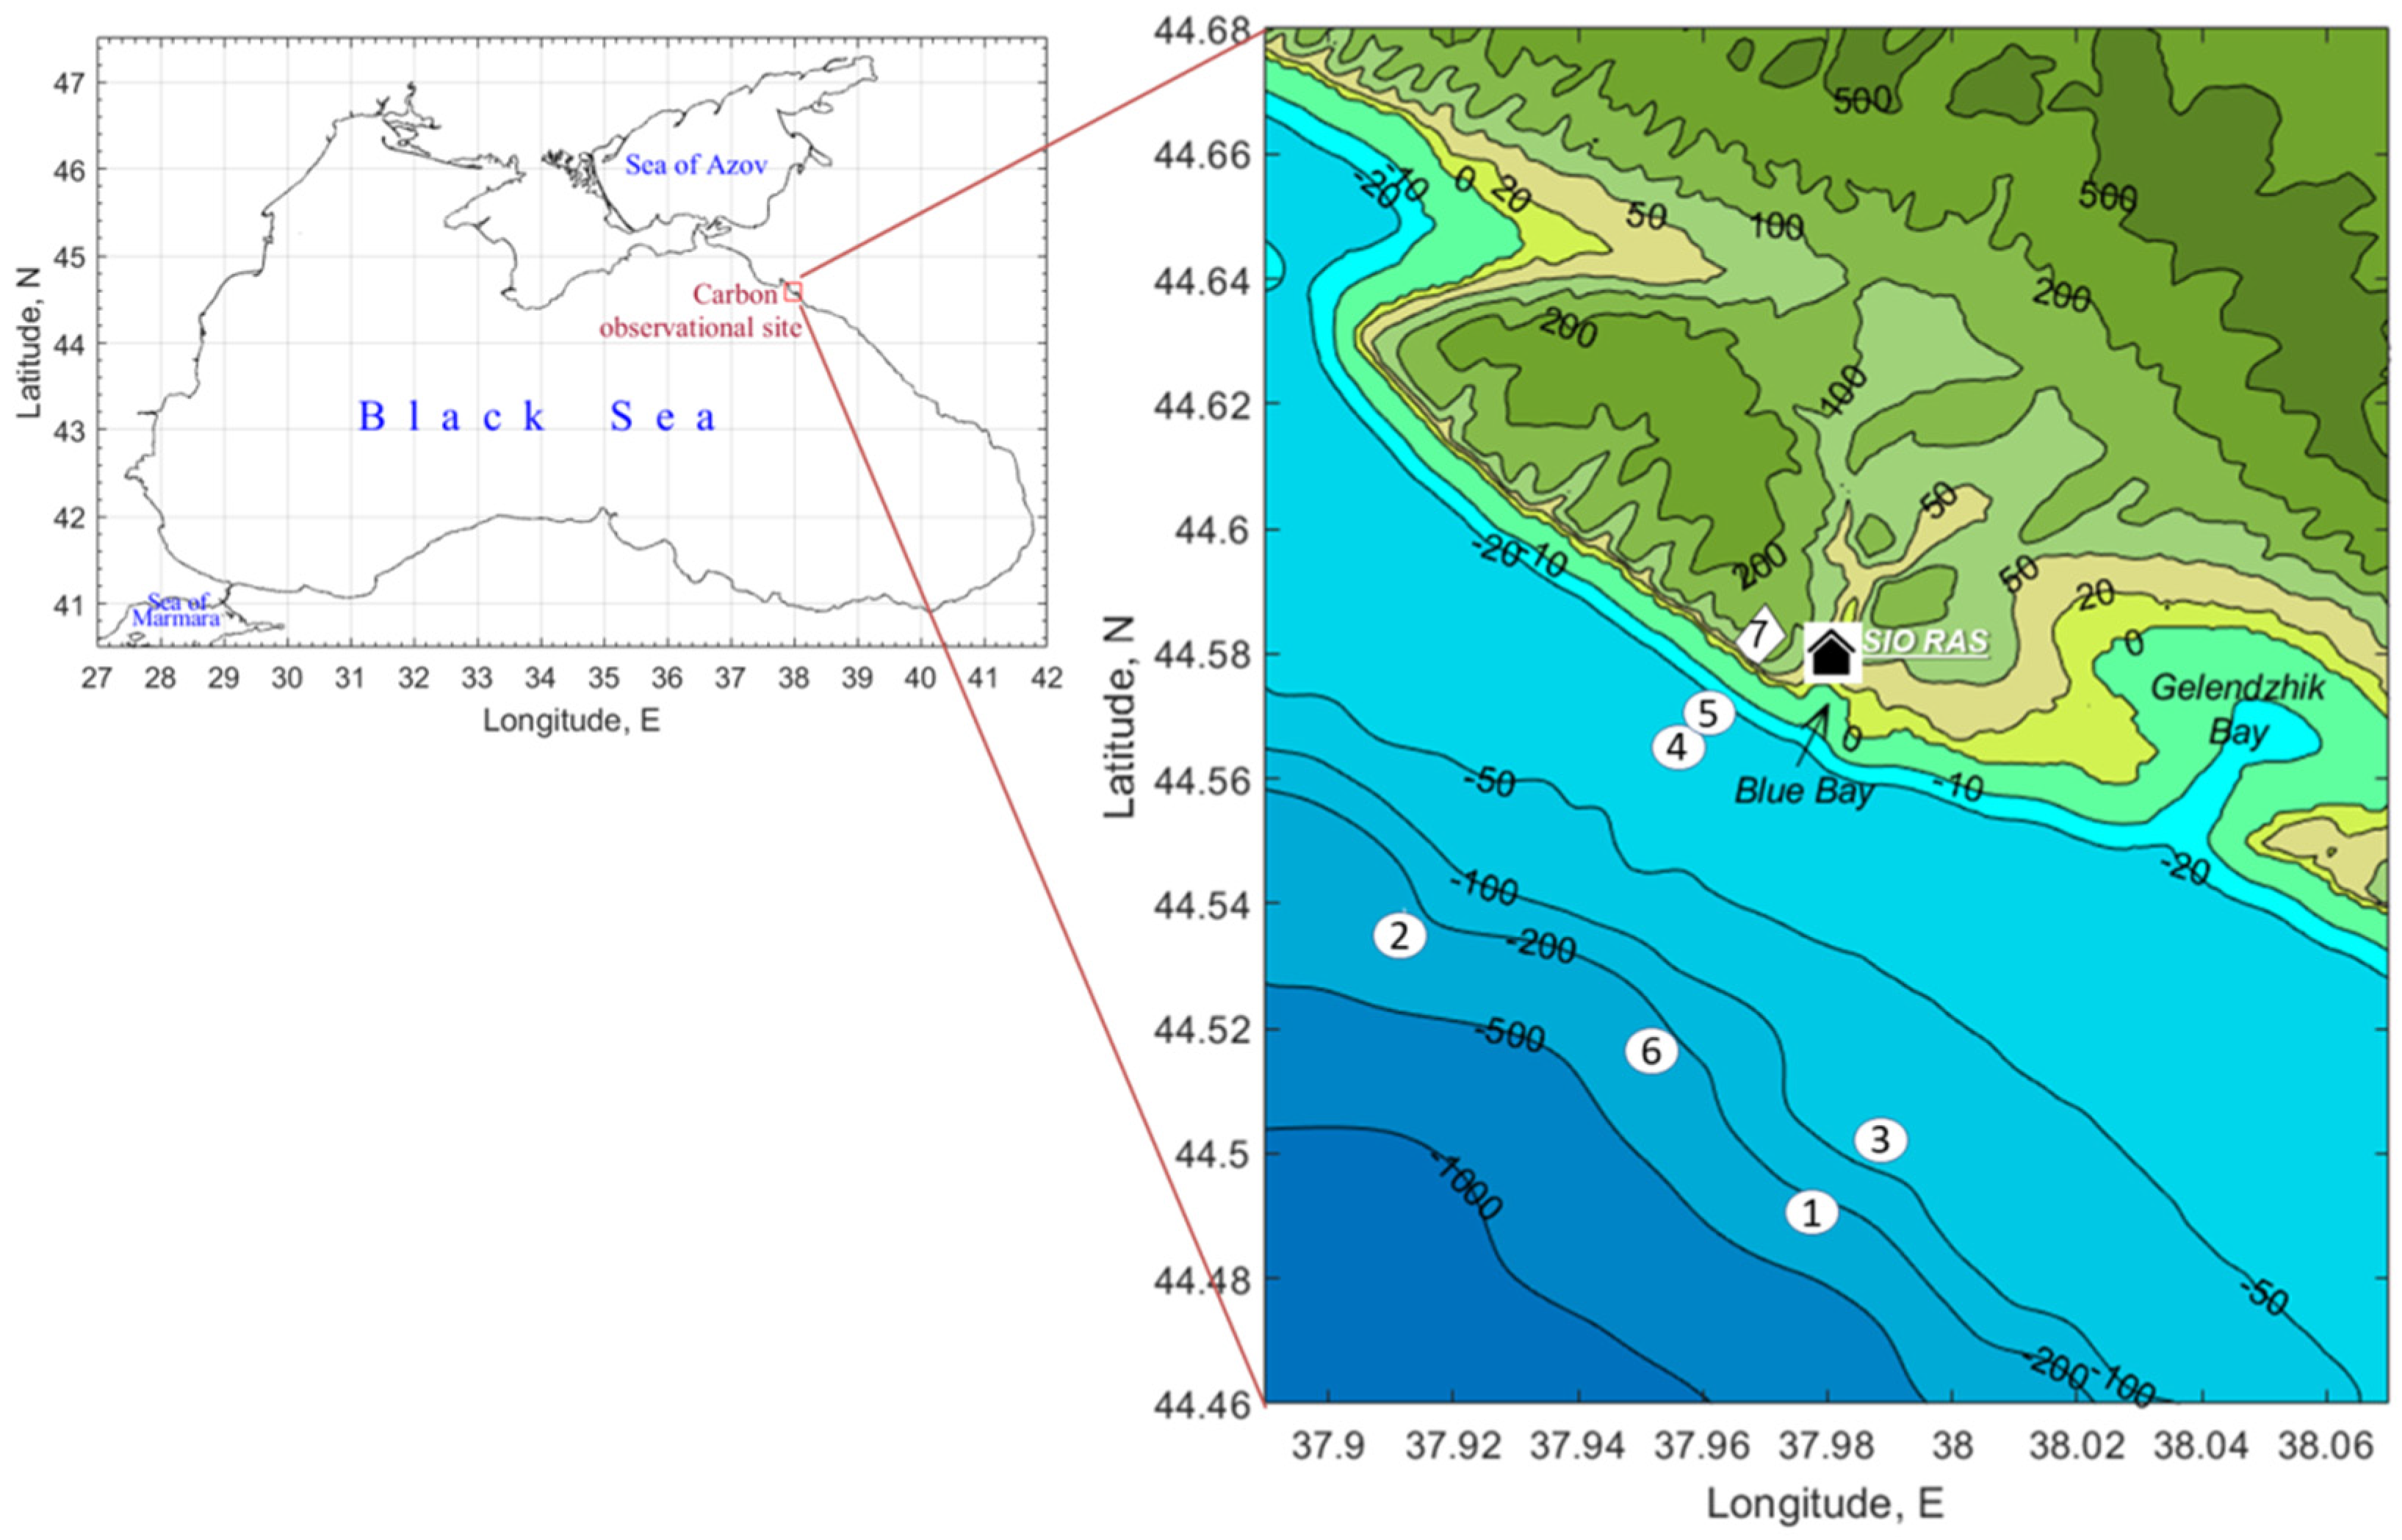
1]. The research activity at the carbon observational site in the Gelendzhik area (
Figure 1), located at the northeastern coast of the Black Sea, focuses on the development of infrastructure and technology for measurements of GHG fluxes over marine and coastal areas. The sea shelf part of the carbon observational site adjacent to Blue Bay of the Black Sea extends a bit beyond the shelf edge (the isobath of ~250 m), 4 to 5 nautical miles from the sea shore. The area near Blue Bay houses the Southern Branch of the Shirshov Institute of Oceanology of Russian Academy of Sciences (SIO RAS;
https://ocean.ru/en/index.php/otdeleniya-i-filialy-io-ran/yuzhnoe-otdelenie, accessed on 22 November 2021), where several oceanographic instruments were designed and tested during 1950–1990. Our team has used this base while working on R&D projects for the moored automatic mobile profilers since 2005 [
2,
3,
4,
5,
6]. For an overview of the Black Sea physical and biogeochemical characteristics, see References [
7,
8].
An automated tethered profiler is required to frequently measure the hydrophysical control of the carbon system in the shelf water from the bottom part to the air–sea interface at a geographically fixed location. Although this study focuses on the research and development of the profiler, the organization of the carbon observational site in the Black Sea is beyond the scope of the study. While profiler mooring should provide information on time variations of water column properties with a sufficiently high temporal resolution, water sampling will be carried out one or two times per month over a wide area to provide a spatial perspective on the processes under investigation. Other activities include the chemical analysis of seawater samples for dissolved and particulate organic and inorganic carbon and organic and inorganic nitrogen and observations of GHG fluxes over the sea–land interface zone using the eddy covariance and chamber (mobile and stationary) methods based on the data obtained from surveys on the research vessel and the buoy mooring data. Available satellite observations are used for data interpretation. Hybrid process-oriented and statistical (machine learning) models have been developed to retrieve carbon stocks and fluxes from remote sensing data. This helps better understand the carbon cycle in the sea–atmosphere system, which is necessary to evaluate the GHG balance using numerical models. The development of technologies to increase the GHG uptake based on terrestrial and marine ecosystems is one of the key activities being conducted at the carbon experimental site. This research program should provide an opportunity for high-level training with regard to the observation and analysis of experimental data based on GHG fluxes.
In oceanography, automated tethered profilers, known as Yo-Yo, connected by a flexible cable with bottom anchors or other underwater supports (see, for review, Reference [
9]) have been used for long-term measurements of depth profiles of hydrological, biological, chemical, and optical parameters at fixed locations, e.g., in the Baltic Sea [
10] and the Arctic [
11]. These profilers are often equipped with several underwater sensors to assess aquatic ecosystems. Tethered profilers are usually parked at the bottom and can ascend at a speed of 0.1 m s
−1 and take measurements at a high-vertical resolution of 0.01–0.1 m, which is sufficient to resolve issues of fine-scale structures, e.g., thermohaline intrusions, sharp vertical gradients, boundary layers, and others.
Tethered profilers may obtain data on stratification at depths shallower than 1 m, which is useful to estimate the transfer across the air–water interface and verify satellite remote sensing data. Surfacing tethered shuttle buoys, known as coastal surface piercing profilers (CSPPs), are vulnerable to sea currents and internal and surface waves. For instance, at the inshore sites of the Ocean Observatories Initiative, CSPPs can be deployed between April and September, as the wave climate precludes deployment between October and March [
12]. However, surfacing allows the profiler to transmit measurement data via radio and satellite links, which are essential for operational oceanography.
Autonomous tethered profiling systems that operate in shallow waters often use winches [
13]. Few winch-type profiling systems include at least two electronic control devices: one at the winch and the second one at the movable floating carrier with an environmental sensor suite, which includes a pressure sensor. Both controllers interact via a cable, because information regarding the submersion depth of the sensor carrier is crucial for the winch operation. In such cases, the underwater winch should be equipped with a waterproof slip ring or rotary joint. The disadvantages of this design are complicated maintenance and high cost.
Unlike the systems that include two units connected by an underwater electrical cable, there were tethered profilers with all the modules (buoyancy, winch, battery pack, electronic control module, environmental sensor suit, and communication module) mounted on a single open chassis. A synthetic wire was wound around the profiler winch spool, and the second end of the rope was fixed to the bottom anchor. Such a profiler exhibited positive buoyancy; therefore, the winding/unwinding of the synthetic wire allowed it to descend/ascend. The most enhanced profilers of this type were custom-made underwater winches or automatic elevator system type 3 by Nichiyu Giken Kogyo Co., Ltd., Tokyo, Japan (
https://www.nichigi.co.jp/en/en_products/en_nigkocean.html, accessed on 22 November 2021) and Thetis by WetLabs, Inc., Philomath, USA (production discontinued). The chassis structure of the profiler was designed to mount modules of various sizes; a lot of space within the chassis remained unused owing to large dimensions of the devices, e.g., the Thetis profiler had a diameter of 0.8 m, height of 2.1 m, and weight of 100–160 kg. The primary disadvantage of this design is a high hydrodynamic drag. Hence, to operate in a flow, it was necessary to increase the buoyancy, which led to an increase in the energy consumption to submerge the apparatus. These profilers could be deployed and recovered using A-frames and cranes from ships, which were not readily available for low-budget studies, especially in lakes and reservoirs. Hence, there is a need for a compact and lightweight profiler that can be deployed from a small boat. A prototype of such an autonomous profiling measurement system for the ocean surface boundary layer (APMOS) was presented by Reference [
14]. Unfortunately, there have been no reports on the further development of this device.
This study presents the development of a small, tethered winch-type profiler suitable for deployment in a simple rowboat. This development is based on the invention of an underwater winch probe [
15] in which a spool is aligned with the motor drive shaft. A synthetic wire is wound around the spool, which does not rotate. The roller supporting the synthetic wire rotates around the spool. The motor drive helps rotate the roller and reciprocates the motion of the spool, which ensures the uniform placement of the synthetic wire when it is wound around the spool. Based on this invention, a new device, Winchi, was developed and tested in lake water and sea shelf water, as described below.
2. Development of the Profiler
2.1. Design
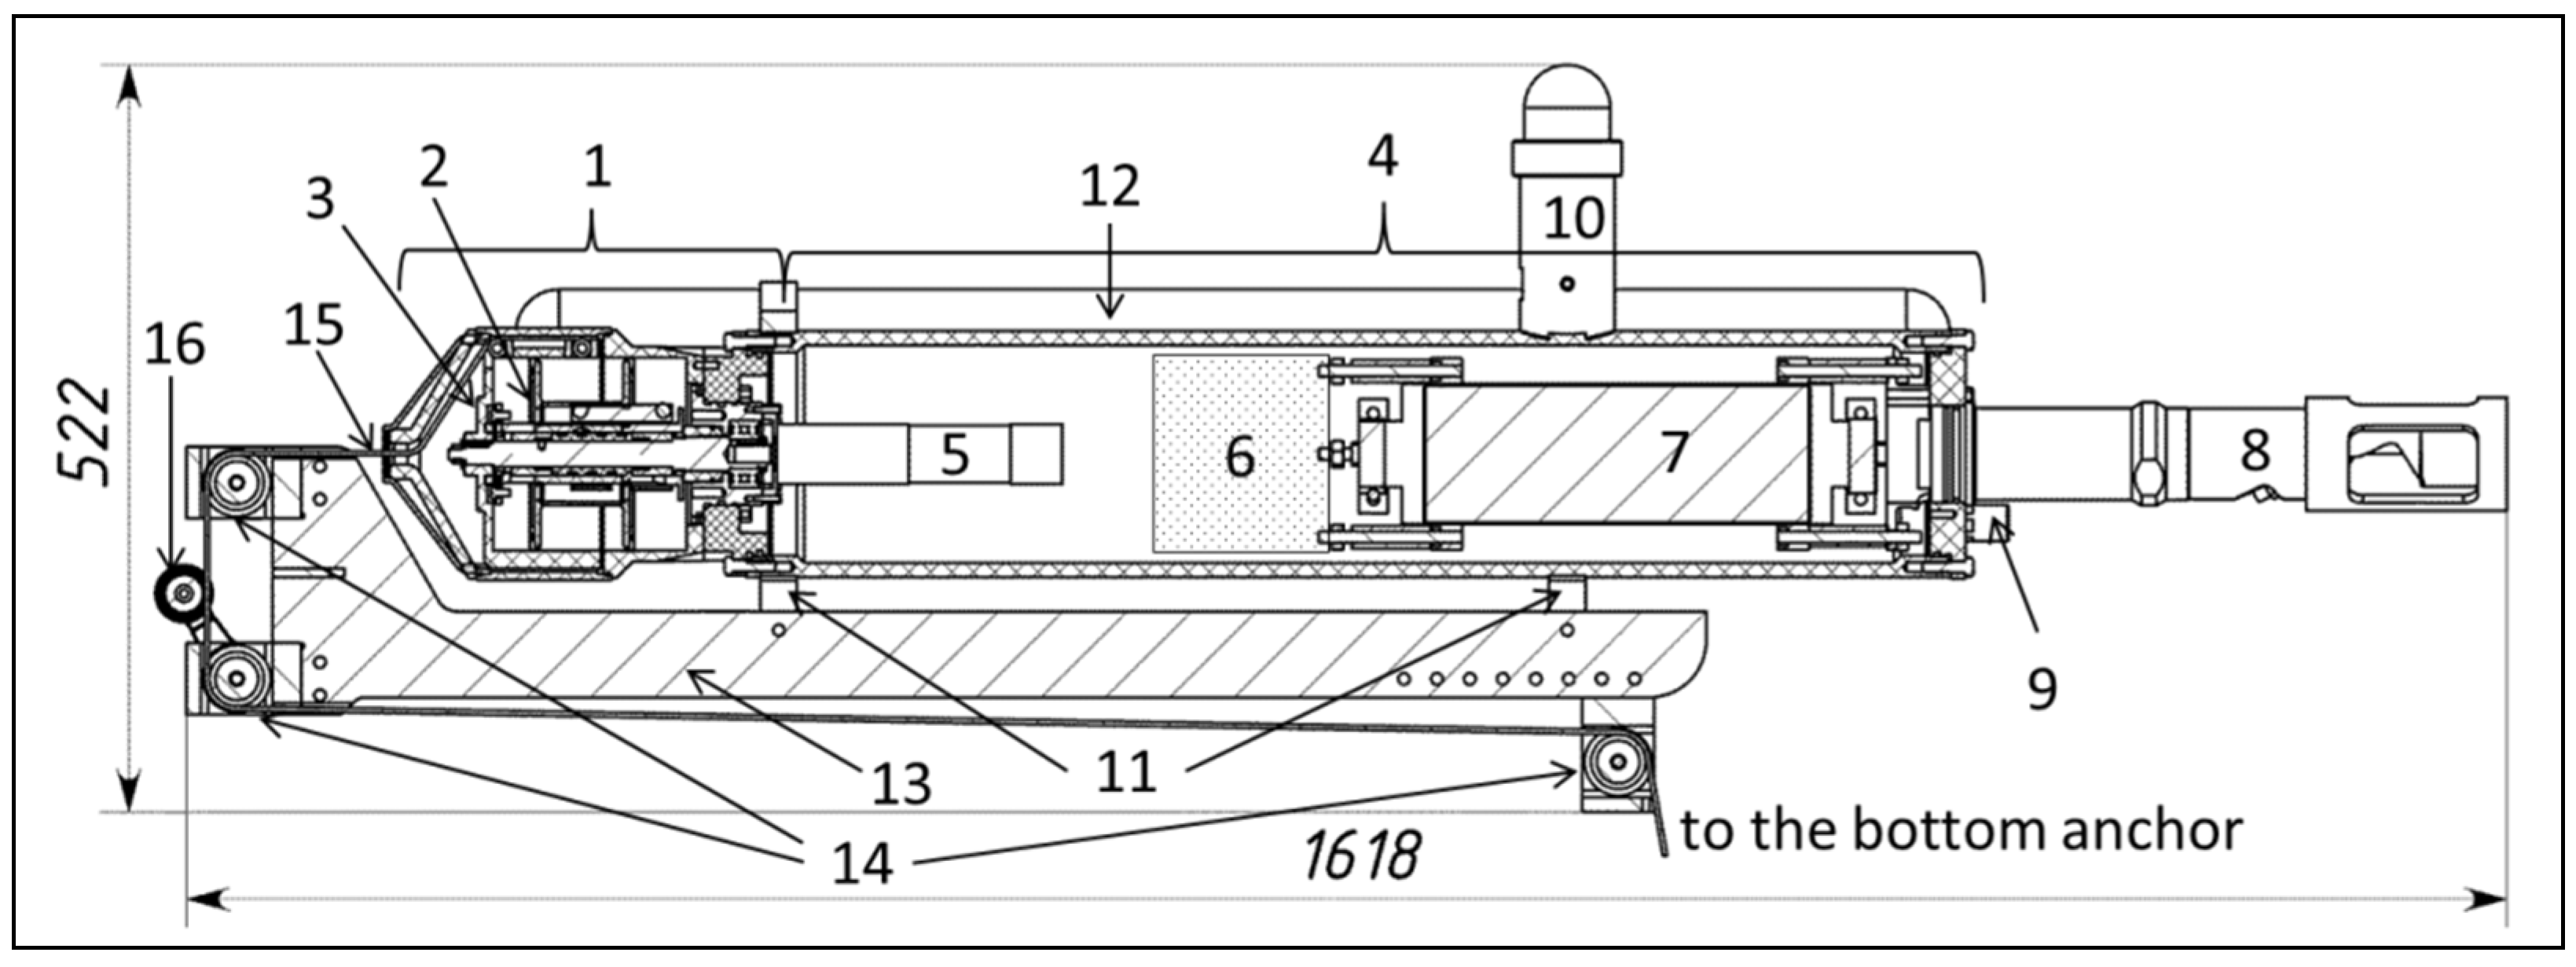
The development focused on the profiler layout of the self-sufficient winch-type tethered device, where the motor drive, controller, and battery pack are placed in pressure-proof cylinder housing. The other end of the winch wire was secured to the bottom anchor or subsurface buoyancy. Originally, the positive buoyant profiler was designed to operate in an upright position. Hence, environmental sensors and positioning communication antennas were mounted on the upper-end cap of the profiler housing, as in an Argo ocean float, whereas the winch spool was located in the lower part of the profiler hull (
Figure 2). Upon moving to a predefined parking depth controlled by a pressure sensor, the motor drive rotation was reversed, changing the direction of winding/unwinding. By winding and unwinding the spool wire, the profiler moved up and down in the water to measure the depth of the aquatic parameters using environmental sensors. For another application with regard to under-ice operations, the profiler was assumed to be negative in terms of the buoyancy and had to be turned upside down to hang down from the surface ice with the sensors facing downward.
The near-surface horizontal flow generates a hydrodynamic drag on the profiler. The hydrodynamic drag force is proportional to the square of the flow speed and the cross-sectional area of the profiler. In the absence of surface waves, a tethered profiler connected to the bottom anchor using a synthetic low-stretch wire drifts with the flow, while the wire is tensioned. At a high flow velocity, when the flow around the profiler becomes turbulent, the positive buoyant profiler may not reach the surface or can quickly be pulled back under the water after surfacing owing to the hydrodynamic drag and wire tension force. Field trials exhibited that the profiler in the upright position becomes unstable at the sea surface and submerges owing to the current, which has a high rate of 0.3 to 0.4 m/s.
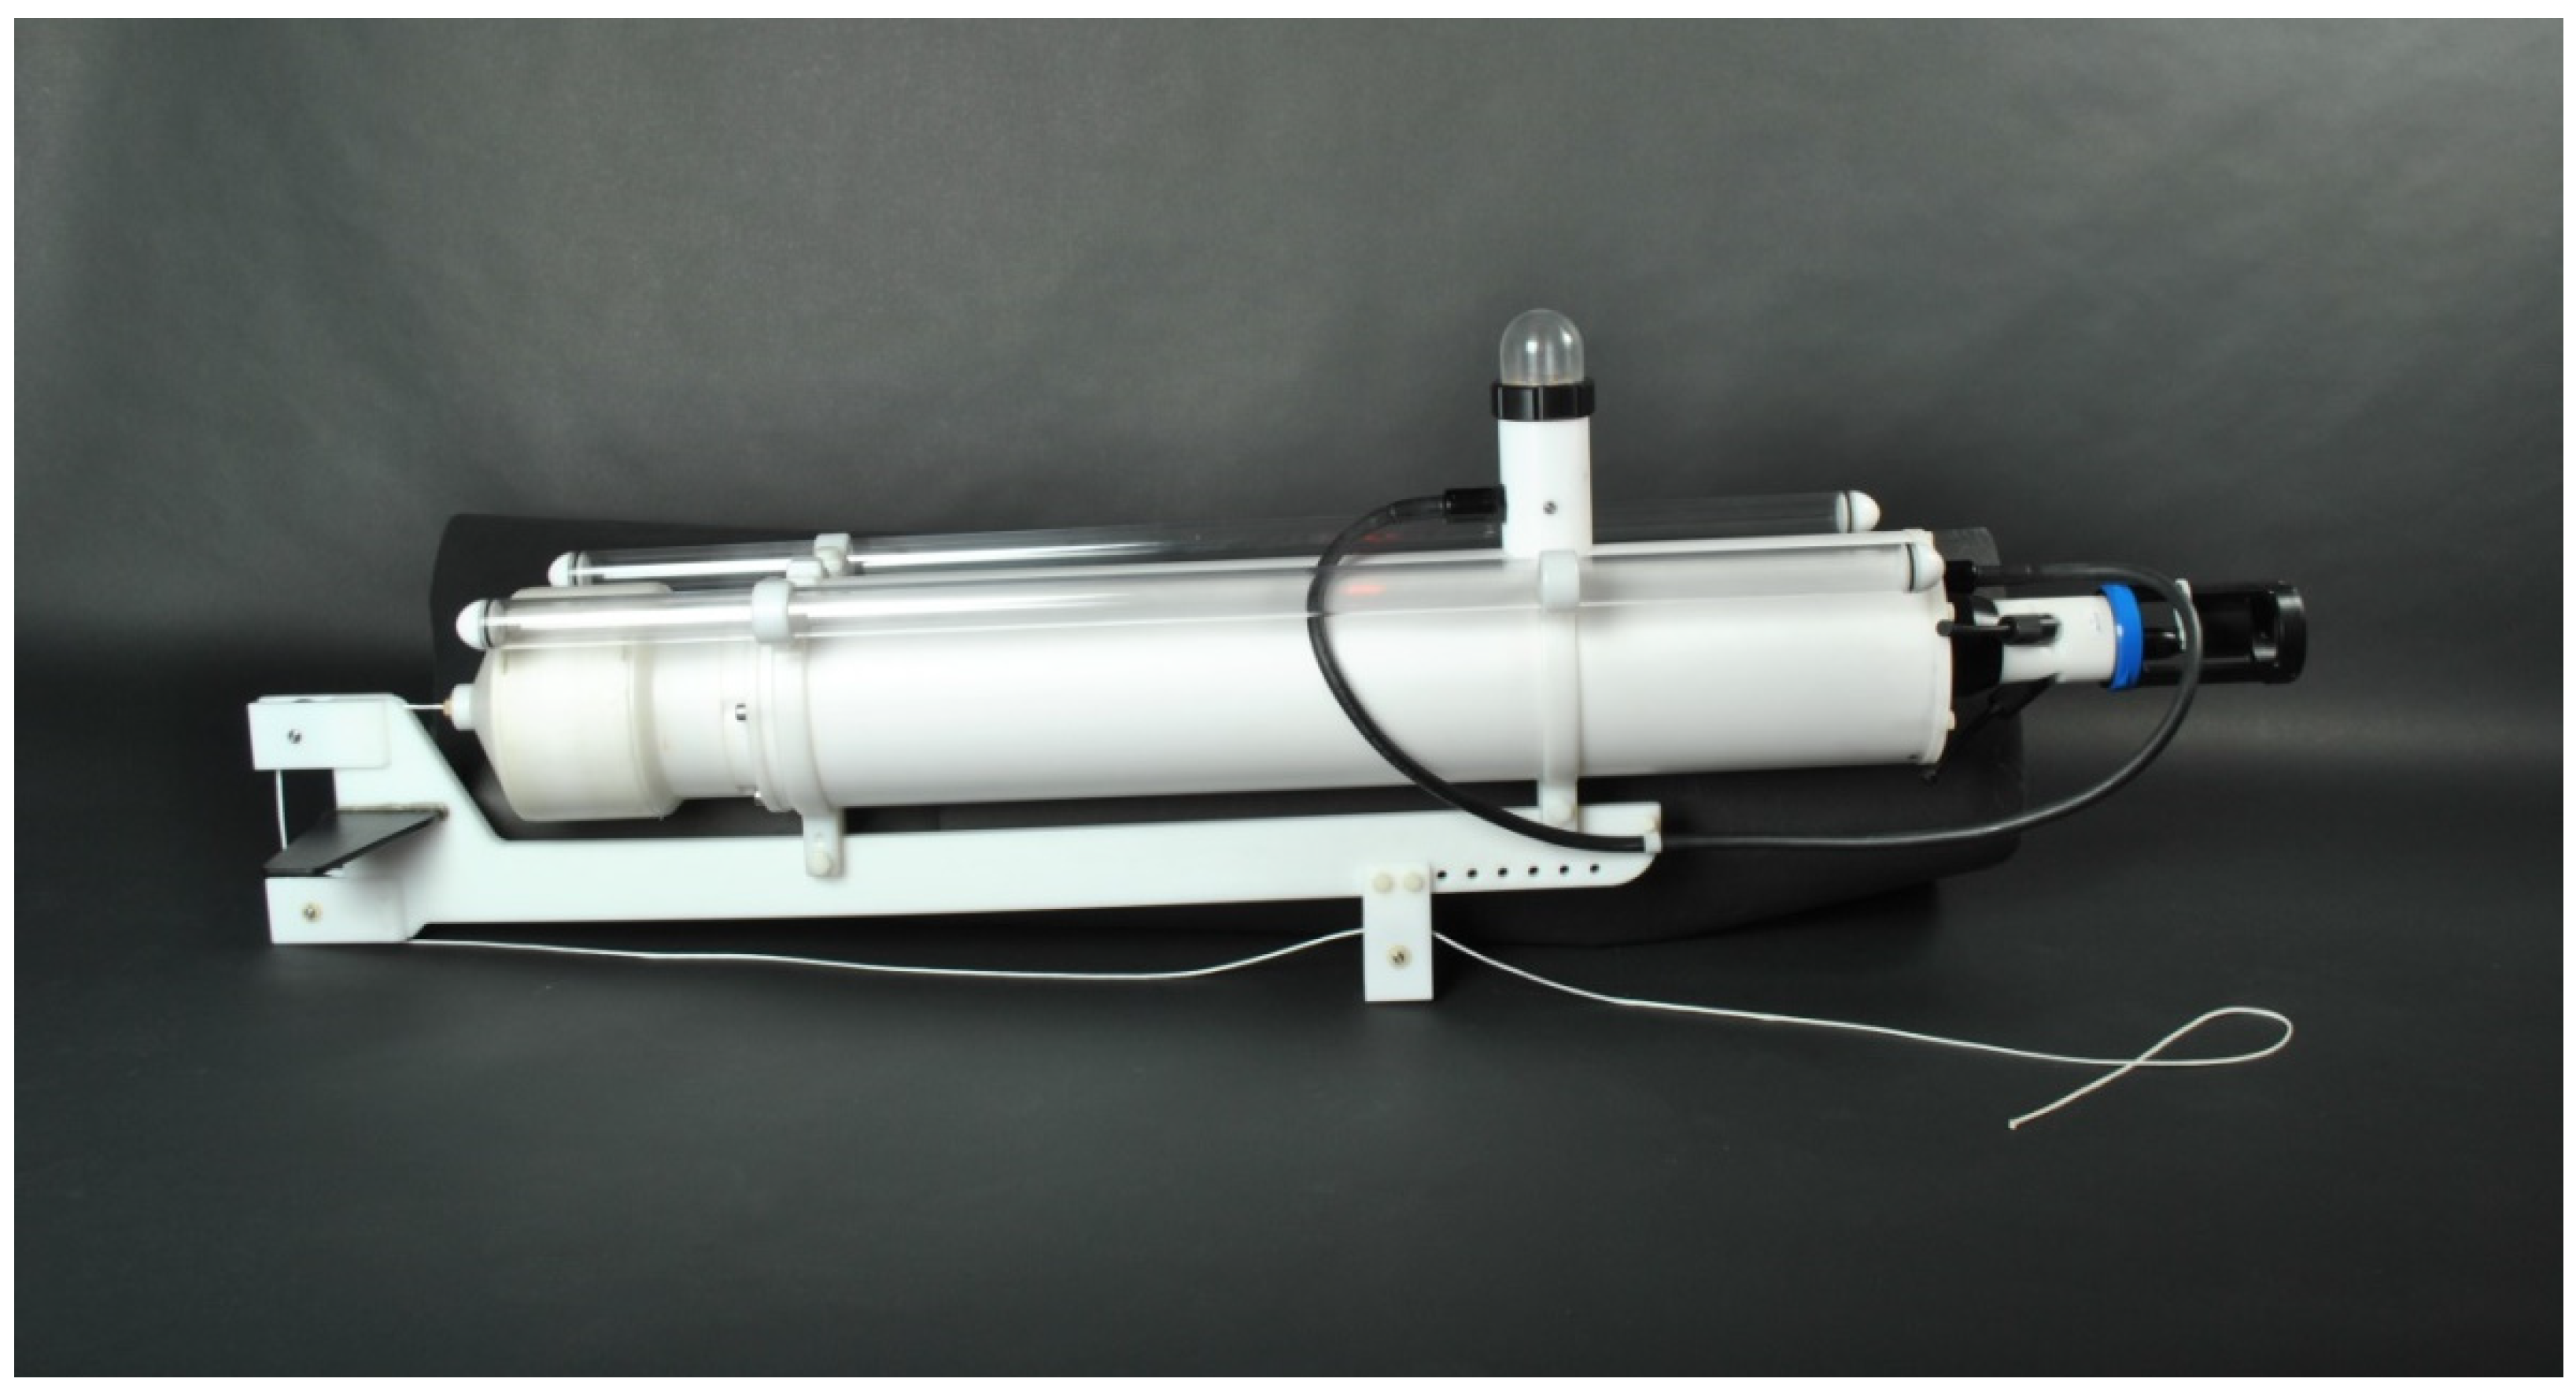
The hydrodynamic drag force can be reduced by maintaining the horizontal position of the profiler in the water flow, such that the longitudinal axis of the profiler cylindrical hull is parallel to the oncoming flow. Therefore, we have redesigned the profiler to comply with the aforementioned requirements. This profiler is known as Winchi (
Figure 3). A suspension bar is designed to maintain the horizontal position of the profiler. Additionally, the profiler is balanced. A polyethylene suspension bar is attached to the profiler hull using two claps. There are two outrigger floats, which are fixed at the structural portions of the clamps to generate buoyancy and lift the GPS and GNSS communication antennas out of the water, thereby mitigating the effect of the waves while the profiler is surfaced. The main hull and two outriggers include the open trimaran platform of the profiler.
For the profiler cylindrical hull in the horizontal position, the winch is located at the rear part of the profiler. The Dyneema
® synthetic low-stretch wire (
Figure 4) connects the spool around the bypass rollers at the tail of the suspension bar and the roller below the cylindrical hull located at a distance of approximately 1/3 of the length of the hull (
Figure 5). There are vertical keels and horizontal stabilizers at the tail that contribute to the longitudinal and directional stabilization and control of the profiler in the flow. The hydrodynamic lift force acting on the horizontal stabilizer helps maintain the horizontal position of the profiler.
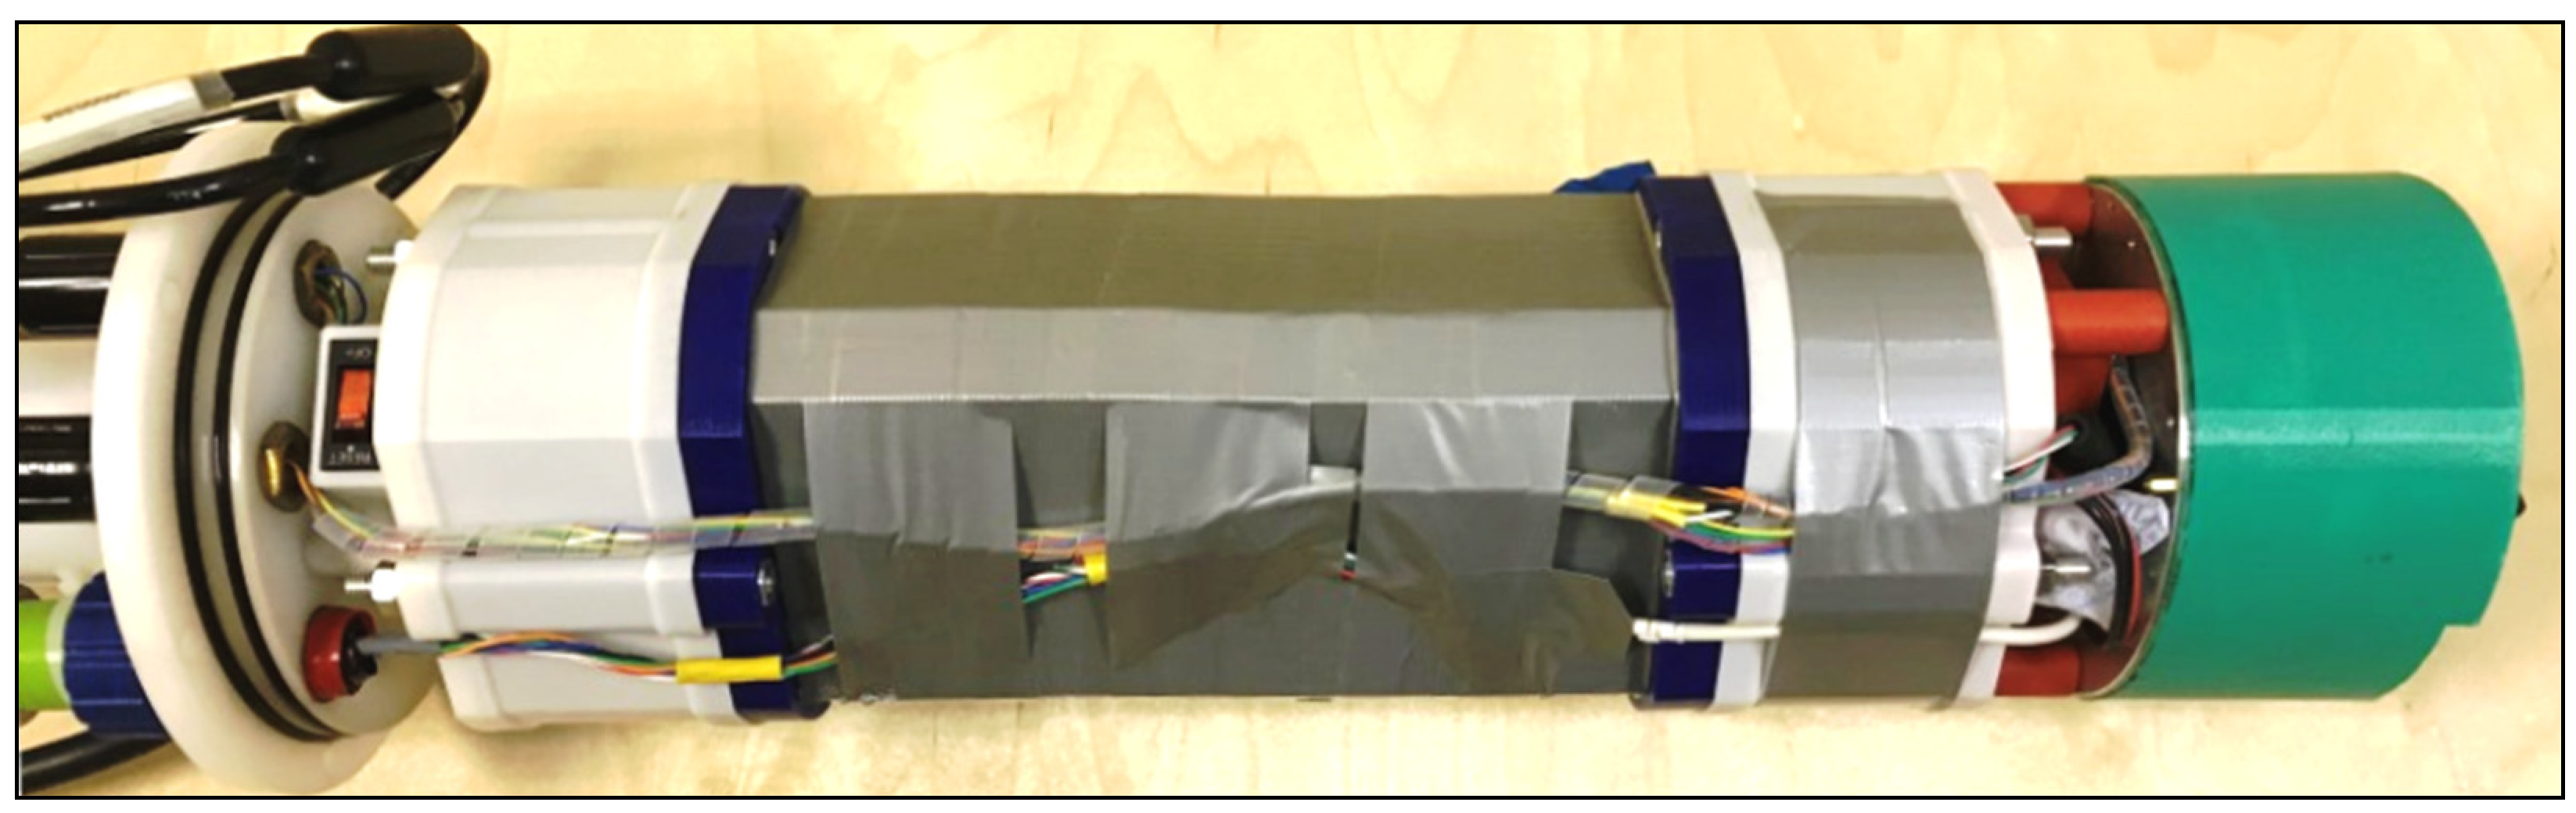
The Winchi profiler includes a wet compartment and pressure-proof housing (
Figure 5). In the wet compartment, stationary oscillating spool and line rollers rotate around the spool. A line roller is mounted on the rotor, which, in turn, is mounted on the shaft of the motor drive. The line roller revolves around the stationary spool, which reciprocates back and forth, winding a line on the spool. The reciprocation is controlled by a mechanism that works with the rotation of the motor shaft. On the winch spool, a wire of 60 m in length and a diameter of 2.5–3 mm can be placed. The Dyneema
® core of the wire has a working stretch of <1%, while the UV stable core cover protects against abrasions and generates the lowest friction in the rollers.
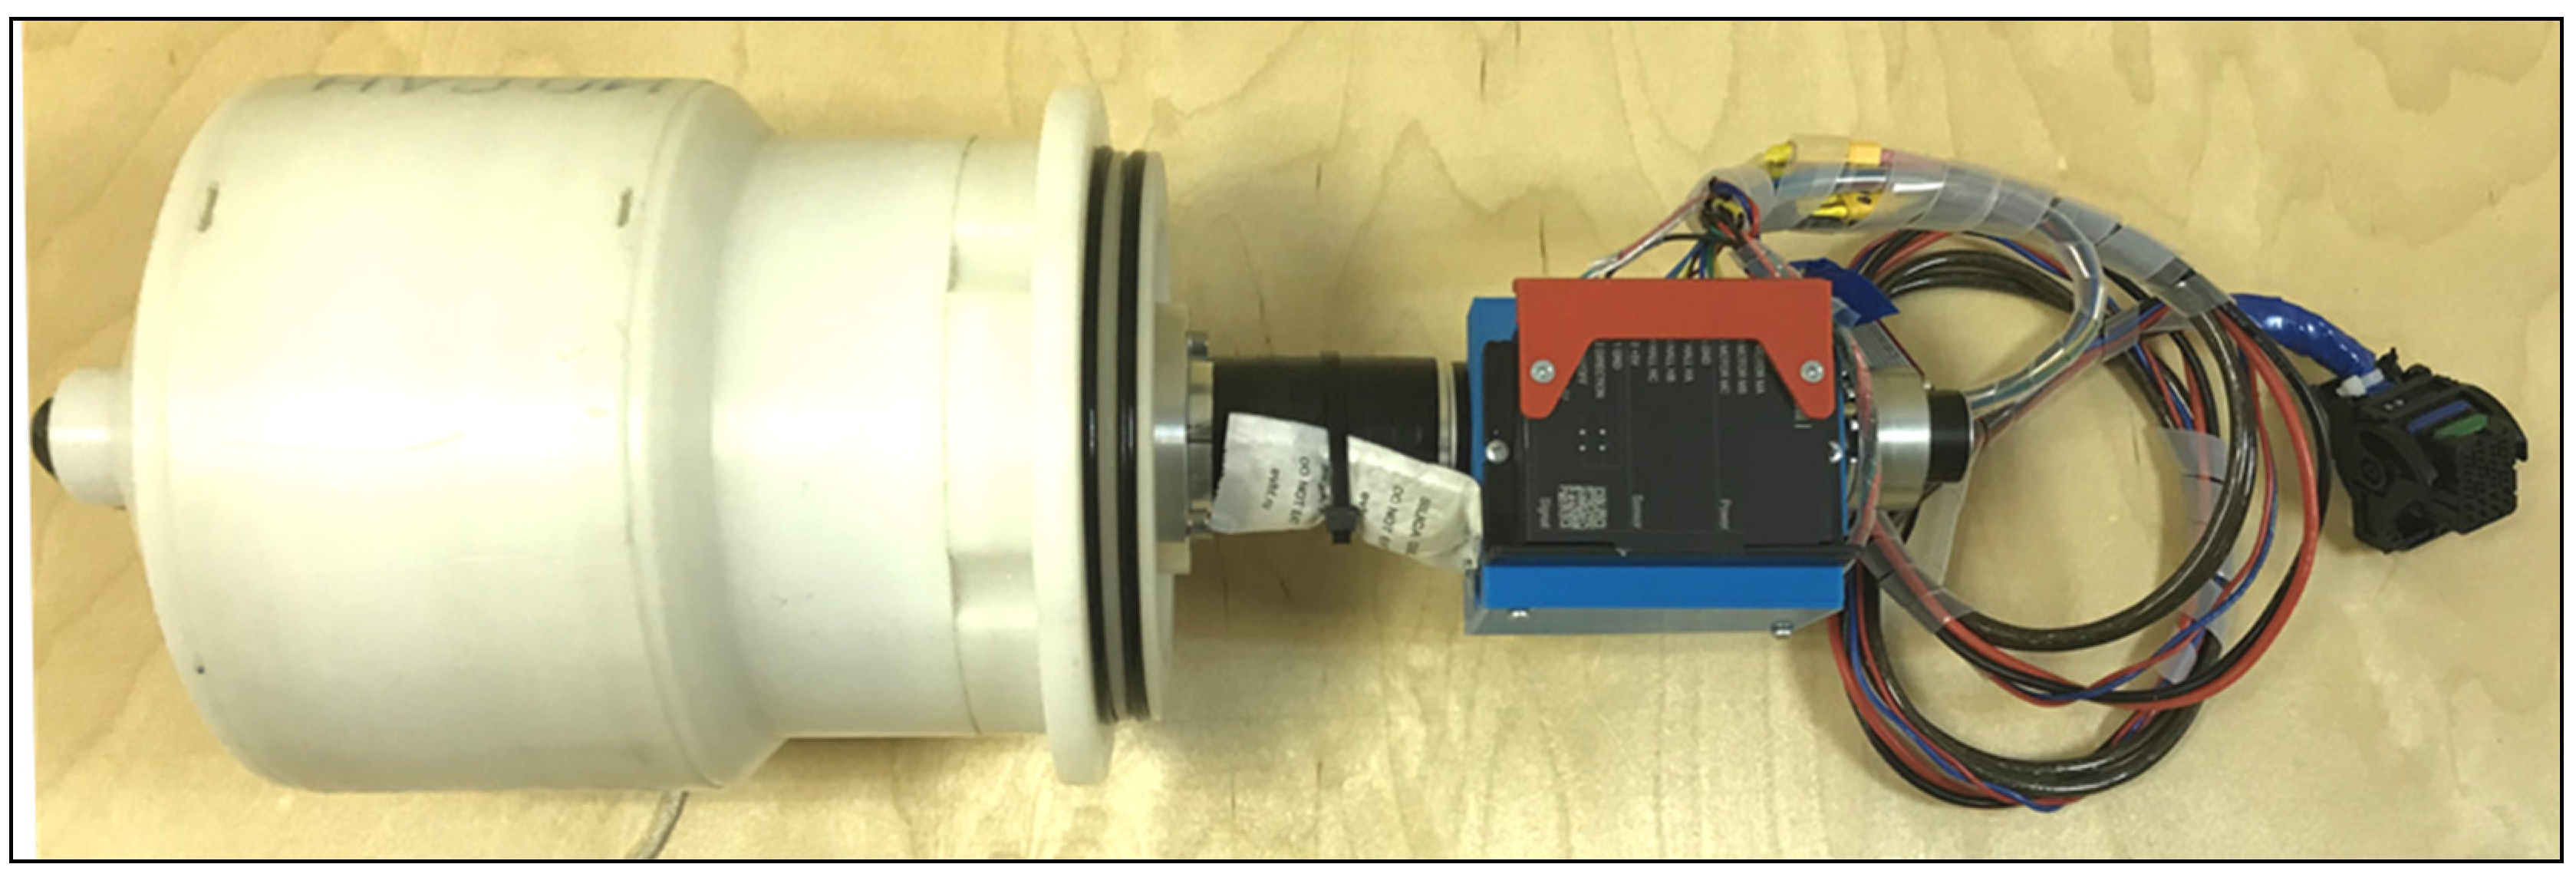
The pressure-proof housing includes a 24-V DC geared motor (
Figure 6), a rechargeable battery pack 930 W h assembled with Nickel Manganese Cobalt cells (
Figure 7), and a microprocessor control unit (MCU). The motor driver is configured to power up to 300 W. The profiler hardware is based on a 32-bit ARM microcontroller.
The profiler enters sleep mode between profiling cycles to conserve energy. For accurate time synchronization in sleep mode, the MCU uses a ±5 ppm clock generator with a consumption of up to 1 uA.
External devices can be connected via four serial ports of UART equipped with converters to the standard RS232, allowing data exchange at 90 kbps (maximum). A 24-bit ADC is used at each of the four analog channels to digitize signals of 0–5 V at 100 Hz (maximum). Two I2C buses with power amplifiers are used to connect low-power digital sensors. The telemetry and measurement data are stored in the SD card supporting the SD input/output (SDIO) specifications. At a short distance, the exchange of the command and data is carried out via Bluetooth. The environmental sensor suite is mounted on the profiler side, opposite to the wet compartment. Connectors are installed at the housing end cap. One connector can be used for an additional sensor. The other one is allocated to connect to the communication module.
The embedded software is an RTOS-based modular framework. Its functionality can be expanded by adding a custom code to accommodate specific functions of the profiler. The diagnostic and programming software is implemented as a cross-platform desktop GUI application, which can be expanded to match additional features.
The overall design of the profiler is compact. One technician of an inflatable boat can deploy and recover the profiler owing to its light weight (~30 kg) and small dimensions (length of 1620 mm and diameter of 170 mm).
2.2. Sensor Suit
The Global Ocean Observing System (GOOS) defines essential ocean variables, which are ancillary to ecosystem observations, to resolve the relevant stratifications as follows: temperature, salinity, dissolved oxygen, chlorophyll, backscatter, and pressure or depth of the measurements [
16]. This set of parameters defines the backbone of the core biogeochemical and physical measurements. Hence, the Winchi profiler sensor suite featured the following: RBRconcerto C.T.D++ logger by RBR Ltd. (Ottawa, Canada) with a Seapoint Chlorophyll Fluorometer (SCF) and Turbidity Meter and Oxygen Optode 4831F of Aanderaa Data Instruments AS (Bergen, Norway) (
Figure 8). The time constants of the temperature and pressure sensors are less than 0.01 and 1 s, respectively. For profiling, fast sensors are used; the dissolved oxygen (O
2) sensor response time (63%) with fast response foil is less than 8 s. The time constants of fluorometer and turbidimeter are about 0.1 s. The conductivity, temperature, and depth (CTD) data sets are obtained at an interval of 0.5 s. Considering 0.25 m s
−1 for the profiler vertical movement speed, the reliable vertical resolution for the temperature profile is ~0.13 m. Dissolved oxygen, chlorophyll, and turbidity data are obtained at an interval of 1 s.
The control electronics provides four serial ports with independent 12-V power supply lines and four 24-bit ADCs for analog sensors with independent 5-V and 12-V power supply lines. There are also two I2C bus ports with 3.3-V power boosters for digital sensors. The current configuration of the sensors can be expanded by 2 sensors with serial ports, 3 analog sensors, and a reasonably sized chains of digital sensors at I2C buses. The power demand of these extra sensors ultimately depends on their specifications. However, taking into account the power draw of the winch motor in motion, especially in the bottom-bound direction, it would be fair to estimate the decrease of the operation time as 10–15%.
In the future, O
2 sensors should be complemented with pH and pCO
2 sensors. However, implementation depends on the availability of sensors to operate stably in sea or land waters during long-term missions. As emphasized by Reference [
17], although O
2 optodes are widely used in oceanography, pH and CO
2 optodes are still at the nascent level.
2.3. Communication and Positioning
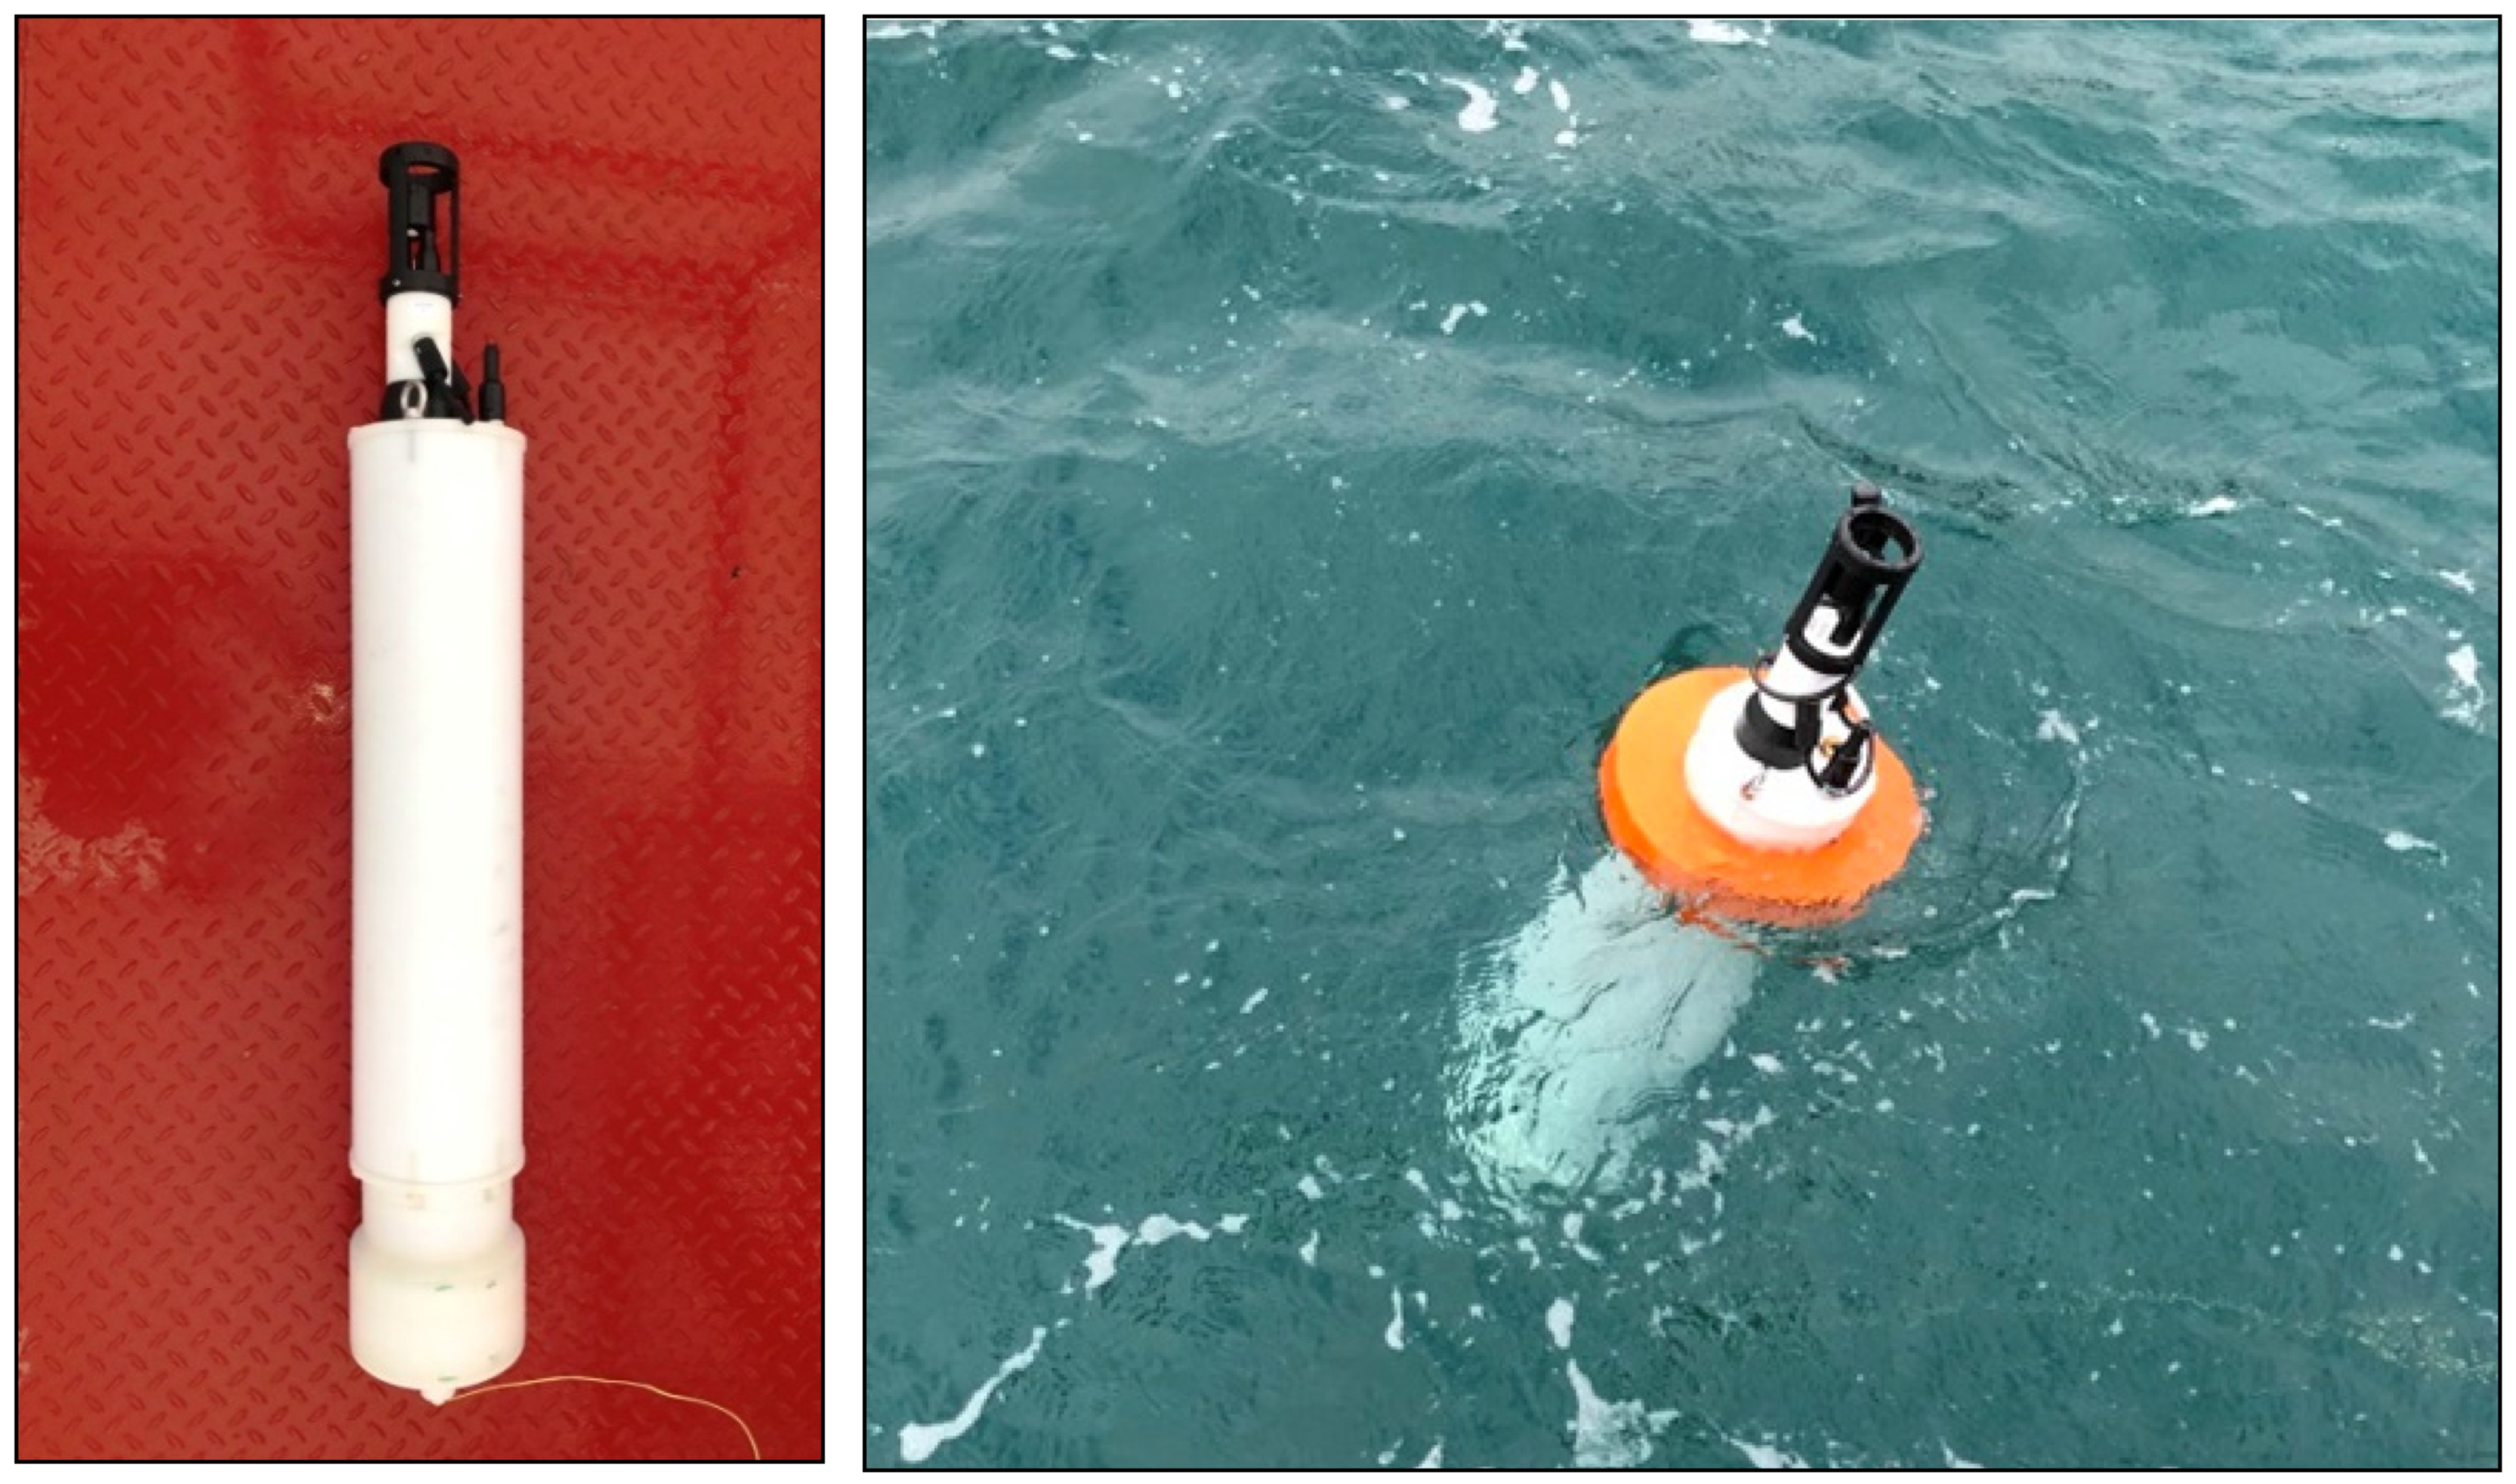
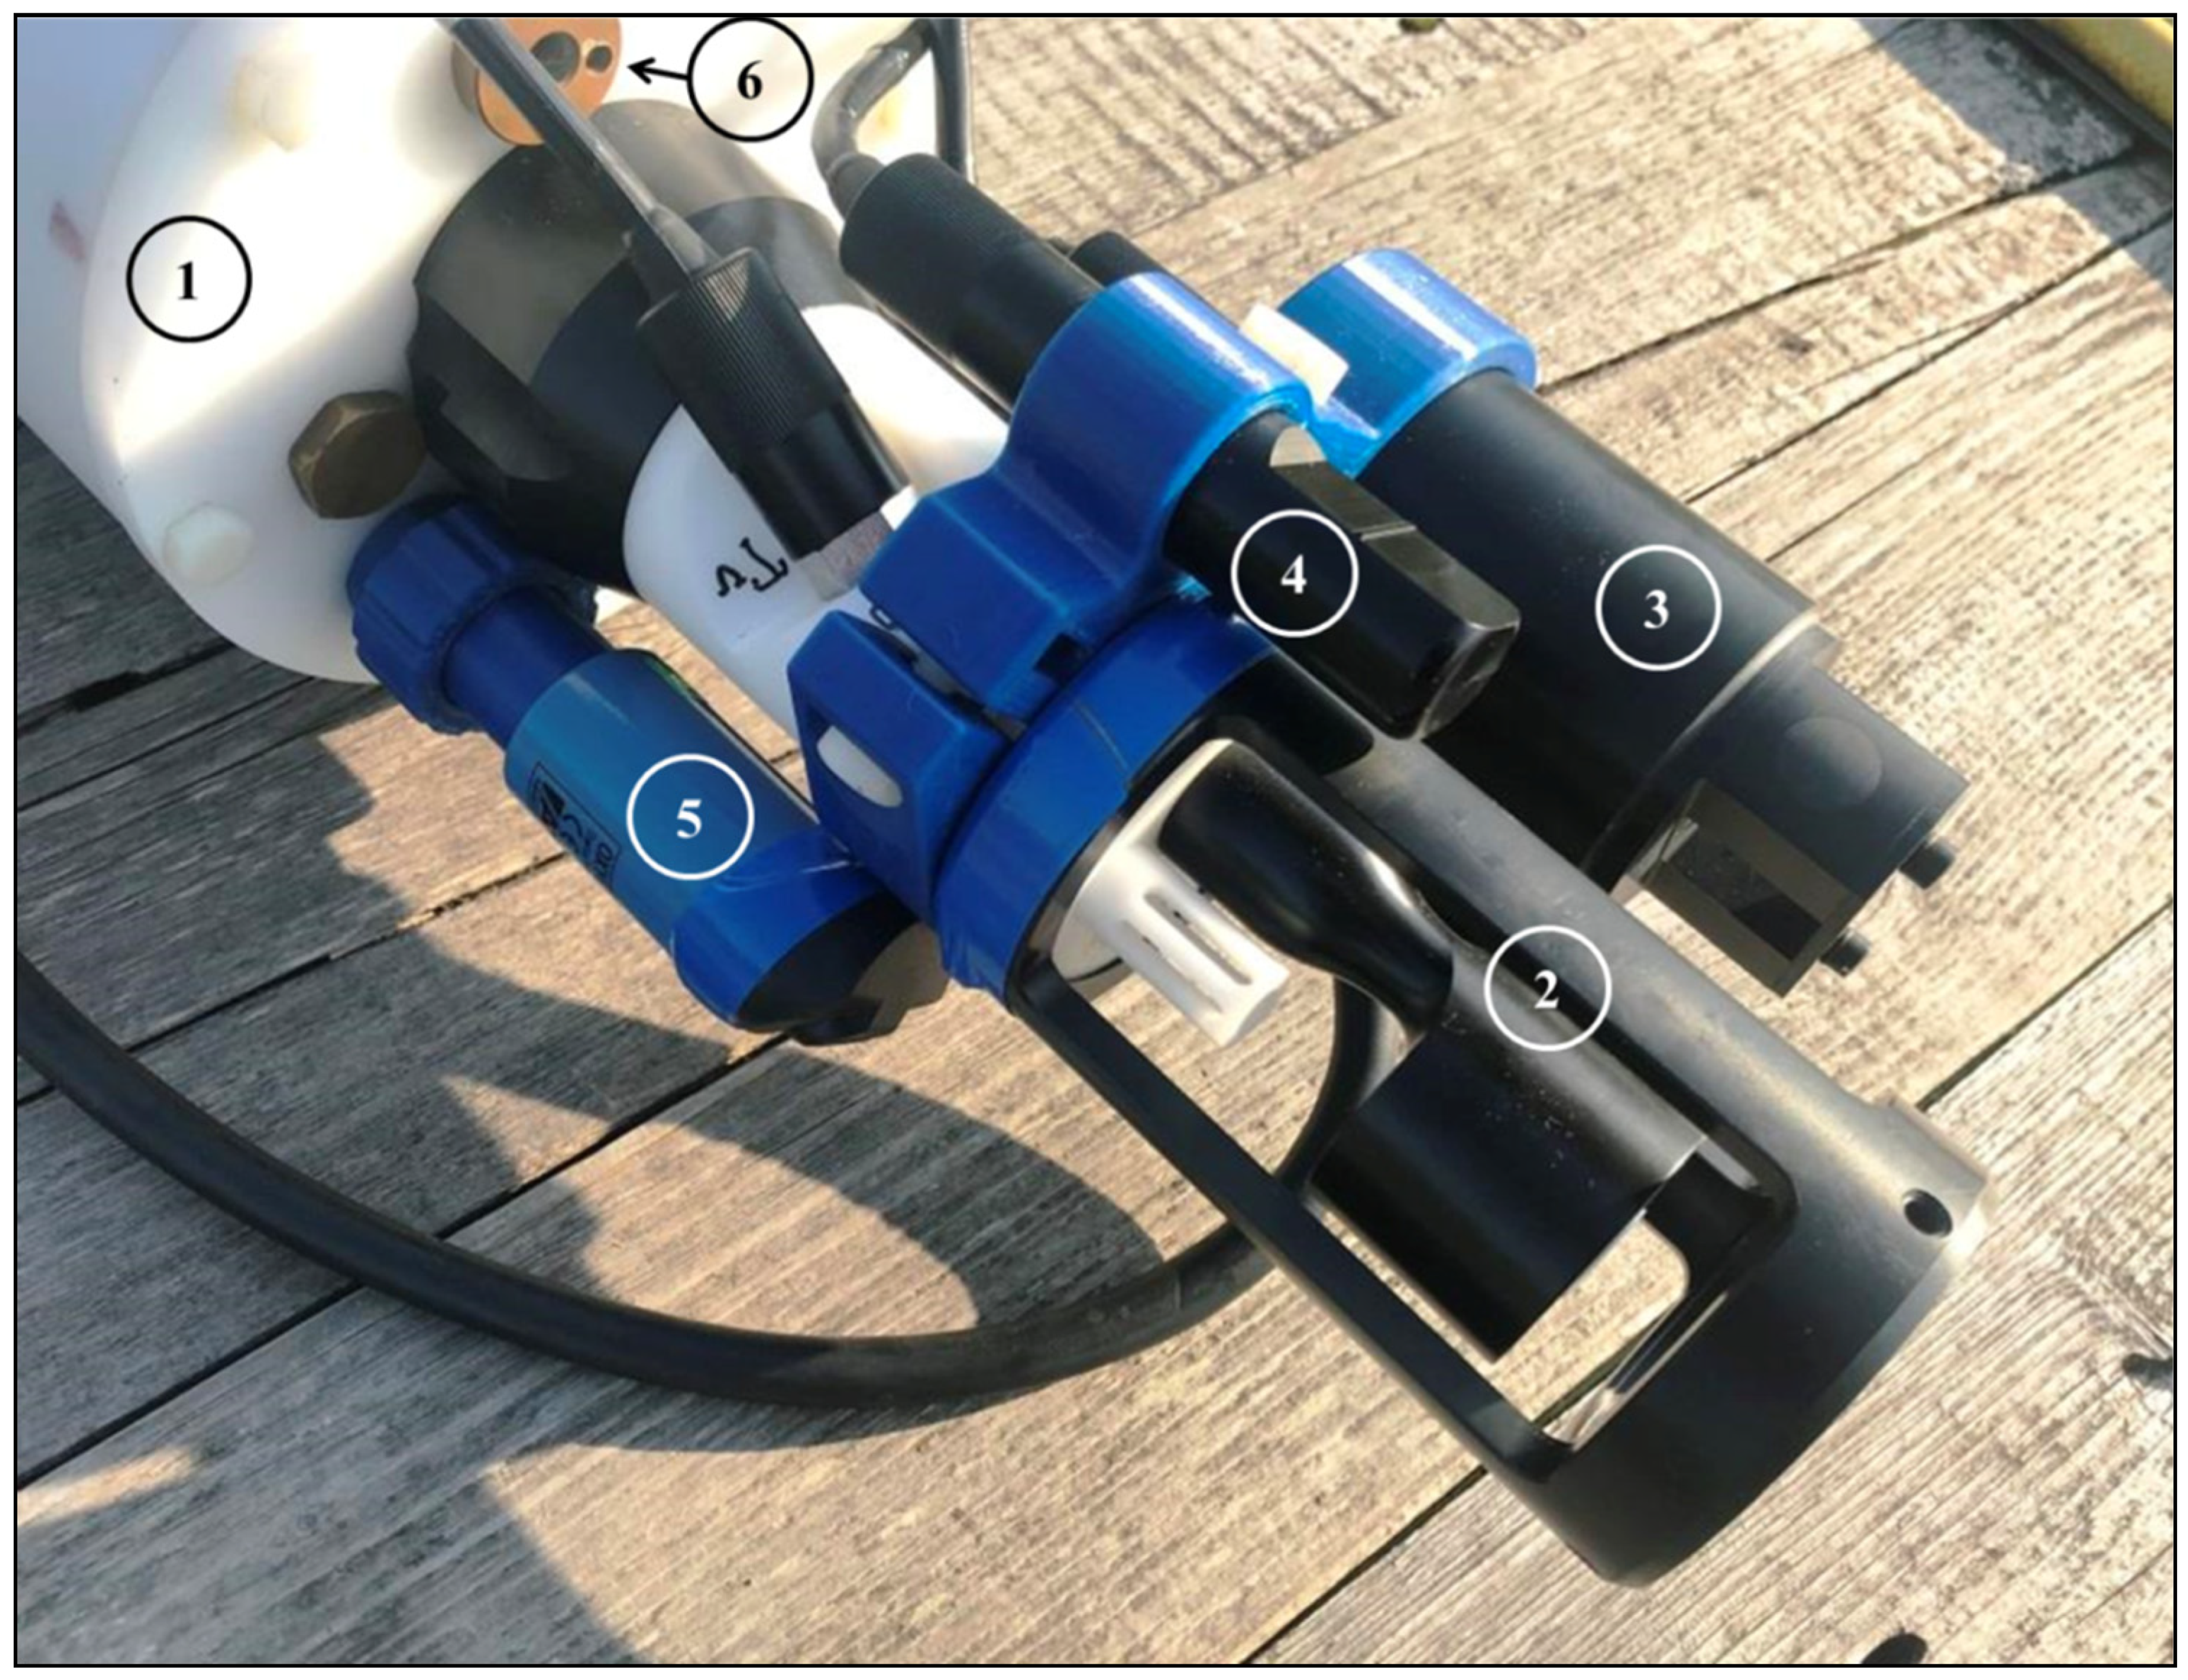
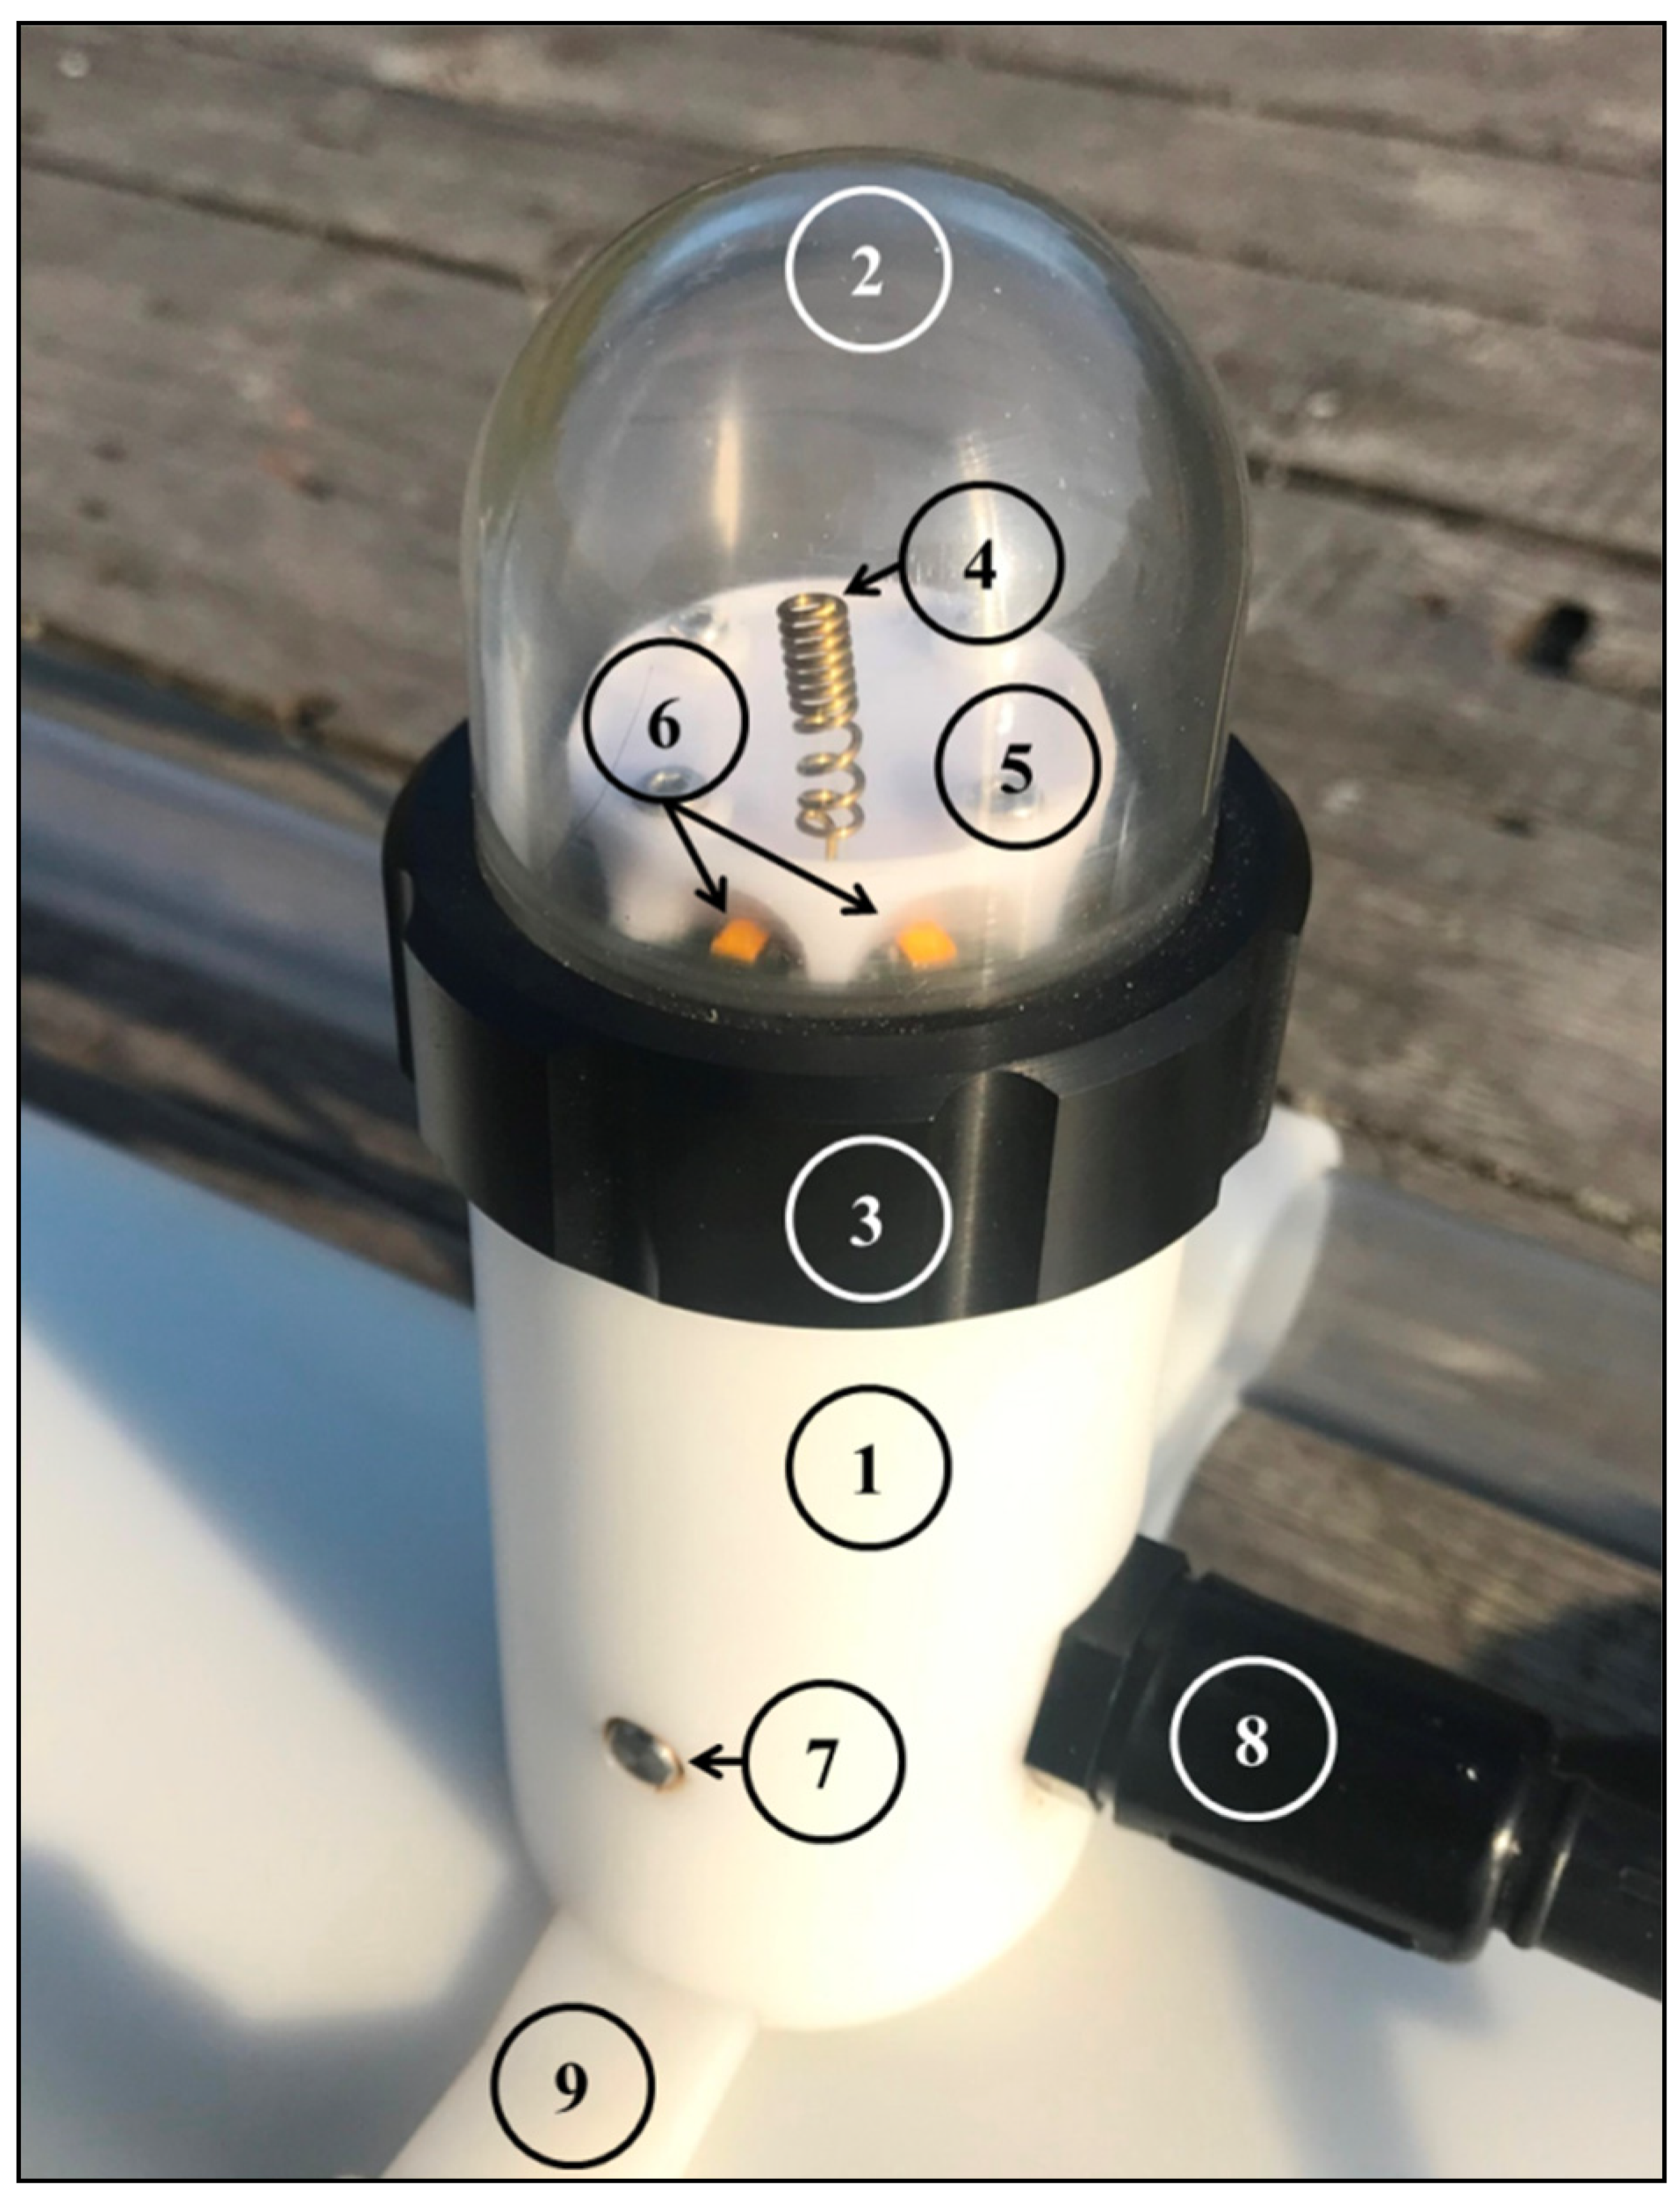
In addition to GSM communication and GPS positioning devices, the external communication module includes a sensor to detect the air–sea interface and a flashing LED beacon to search for the device (
Figure 9). The communication module is placed in a small, sealed housing with a transparent cap at the top. In this case, printed circuit boards are installed. An air–sea interface sensor and cable connector are installed in the lower part of the housing.
The data transfer speed highly depends on the type of cellular network connection (LTE/3G/GSM) and signal strength. In the best-case scenario, the speed is about 38,400 baud. The limiting factor is the baud rate of the serial connection between the MCU and GSM communication modules.
In order to operate in real time, Winchi attempts to transfer data each time it reaches the surface. If the communication conditions are not favorable, Winchi puts the current data set transfer request into the queue for later transmission on the next surfacing. As the data files are stored on a SD card, the transfer queue holds only file names and counts of successfully transferred bytes, so its memory footprint is rather small. The most recent data sets are always transferred first. Furthermore, the user can send a remote operation command to transfer a specific file at any time during the mission. Such a command generates a corresponding data transfer request and puts it at the end of the queue. In normal communication conditions, the transfer of one data set takes about 2 to 3 min.
2.4. Cyclogram of the Winchi Profiler’s Operation
The profiling schedule and control parameters, e.g., motor power rate, can be configured using Bluetooth before deployment, e.g., boarding a boat. In water, the device is operated using the MCU, and it repeats all operations multiple times, including sinking and rising. However, certain parameters can be configured remotely using a GSM link. The parameters are GSM communication timeout, LED flashing, duration of the pressure measurement in parking mode, and threshold height of the sea surface wave, which would be unsafe for profiling. A high-level description of the instructions to complete the profiler mission is defined step by step.
Program the device to operate: set the mission parameters. Upload the mission schedule. Set a timeout prior to the initiation of the mission (up to 30 min (by default)).
Start mission: Initiate automatic operation modes. Switch on the LED beacon. The wire is released to ascend to consider the starting position at the sea surface. Then, the external sensors are turned off.
Profiling cycle
- (a)
Keep the profiler floating on the sea surface—turn on the SurfHold function. When the device submerges for more than 15 s owing to wave action or current, SurfHold switches on the motor to spool more wiring to ensure that the air–sea interface sensor remains above the waterline. As soon as the air–sea interface sensor rises above the waterline or the wire tension drops below a predefined threshold, SurfHold cuts off the motor power.
- (b)
Navigate—Acquire a GPS position.
- (c)
Communicate—Transmit the telemetry and measurement data and receive control commands. Turn off SurfHold after the communication is accomplished or timed out.
- (d)
Count the profiling cycles—If the predefined maximum number of cycles is reached, the device switches to the user direct control mode with the transmission of telemetry every 15 min. Otherwise, a new cycle is initiated.
- (e)
Descend—Switch on the external sensors and motor to wind the wire.
- (f)
Save energy—Turn off the LED beacon while descending below a depth of 2 m.
- (g)
Park—Turn off the sensors after descending to the predefined parking depth.
- (h)
Sleep—Set the MCU to sleep mode. The external pressure is measured every 5 min. If the device depth is less than 2 m, cancel the automatic operation mode, set the error code to WireBreak, switch to the user direct control mode, acquire the GPS position, and transmit the alarm data every 15 min.
- (i)
Wake up—Begin the measurement of the external pressure (the sampling is done every 0.1 s (by default)). Collect data on the pressure fluctuations (for 1 min (by default)) and estimate the surface wave height. If the wave height exceeds the threshold height of the sea surface wave (0.8 m by default), then the MCU program moves to step 3 h of this cyclogram, i.e., it turns to another sleep period.
- (j)
Ascend—Switch on the sensors. The system conditions are checked. Switch on the motor to spool the wire
- (k)
Display—Turn on the LED beacon above a depth of 2 m (the activation of the LED beacon can be canceled remotely using a user command during the next communication session).
- (l)
Surfacing—Slow down the motor at a depth of 1.5 m. Check the air–sea interface sensor every 0.2 s. The MCU program has initiated at the beginning of the profiling cycle.
End of the mission—The device stays on the sea surface or can submerge to the specified depth for a user-defined period of time based on a user command received via the GSM link.
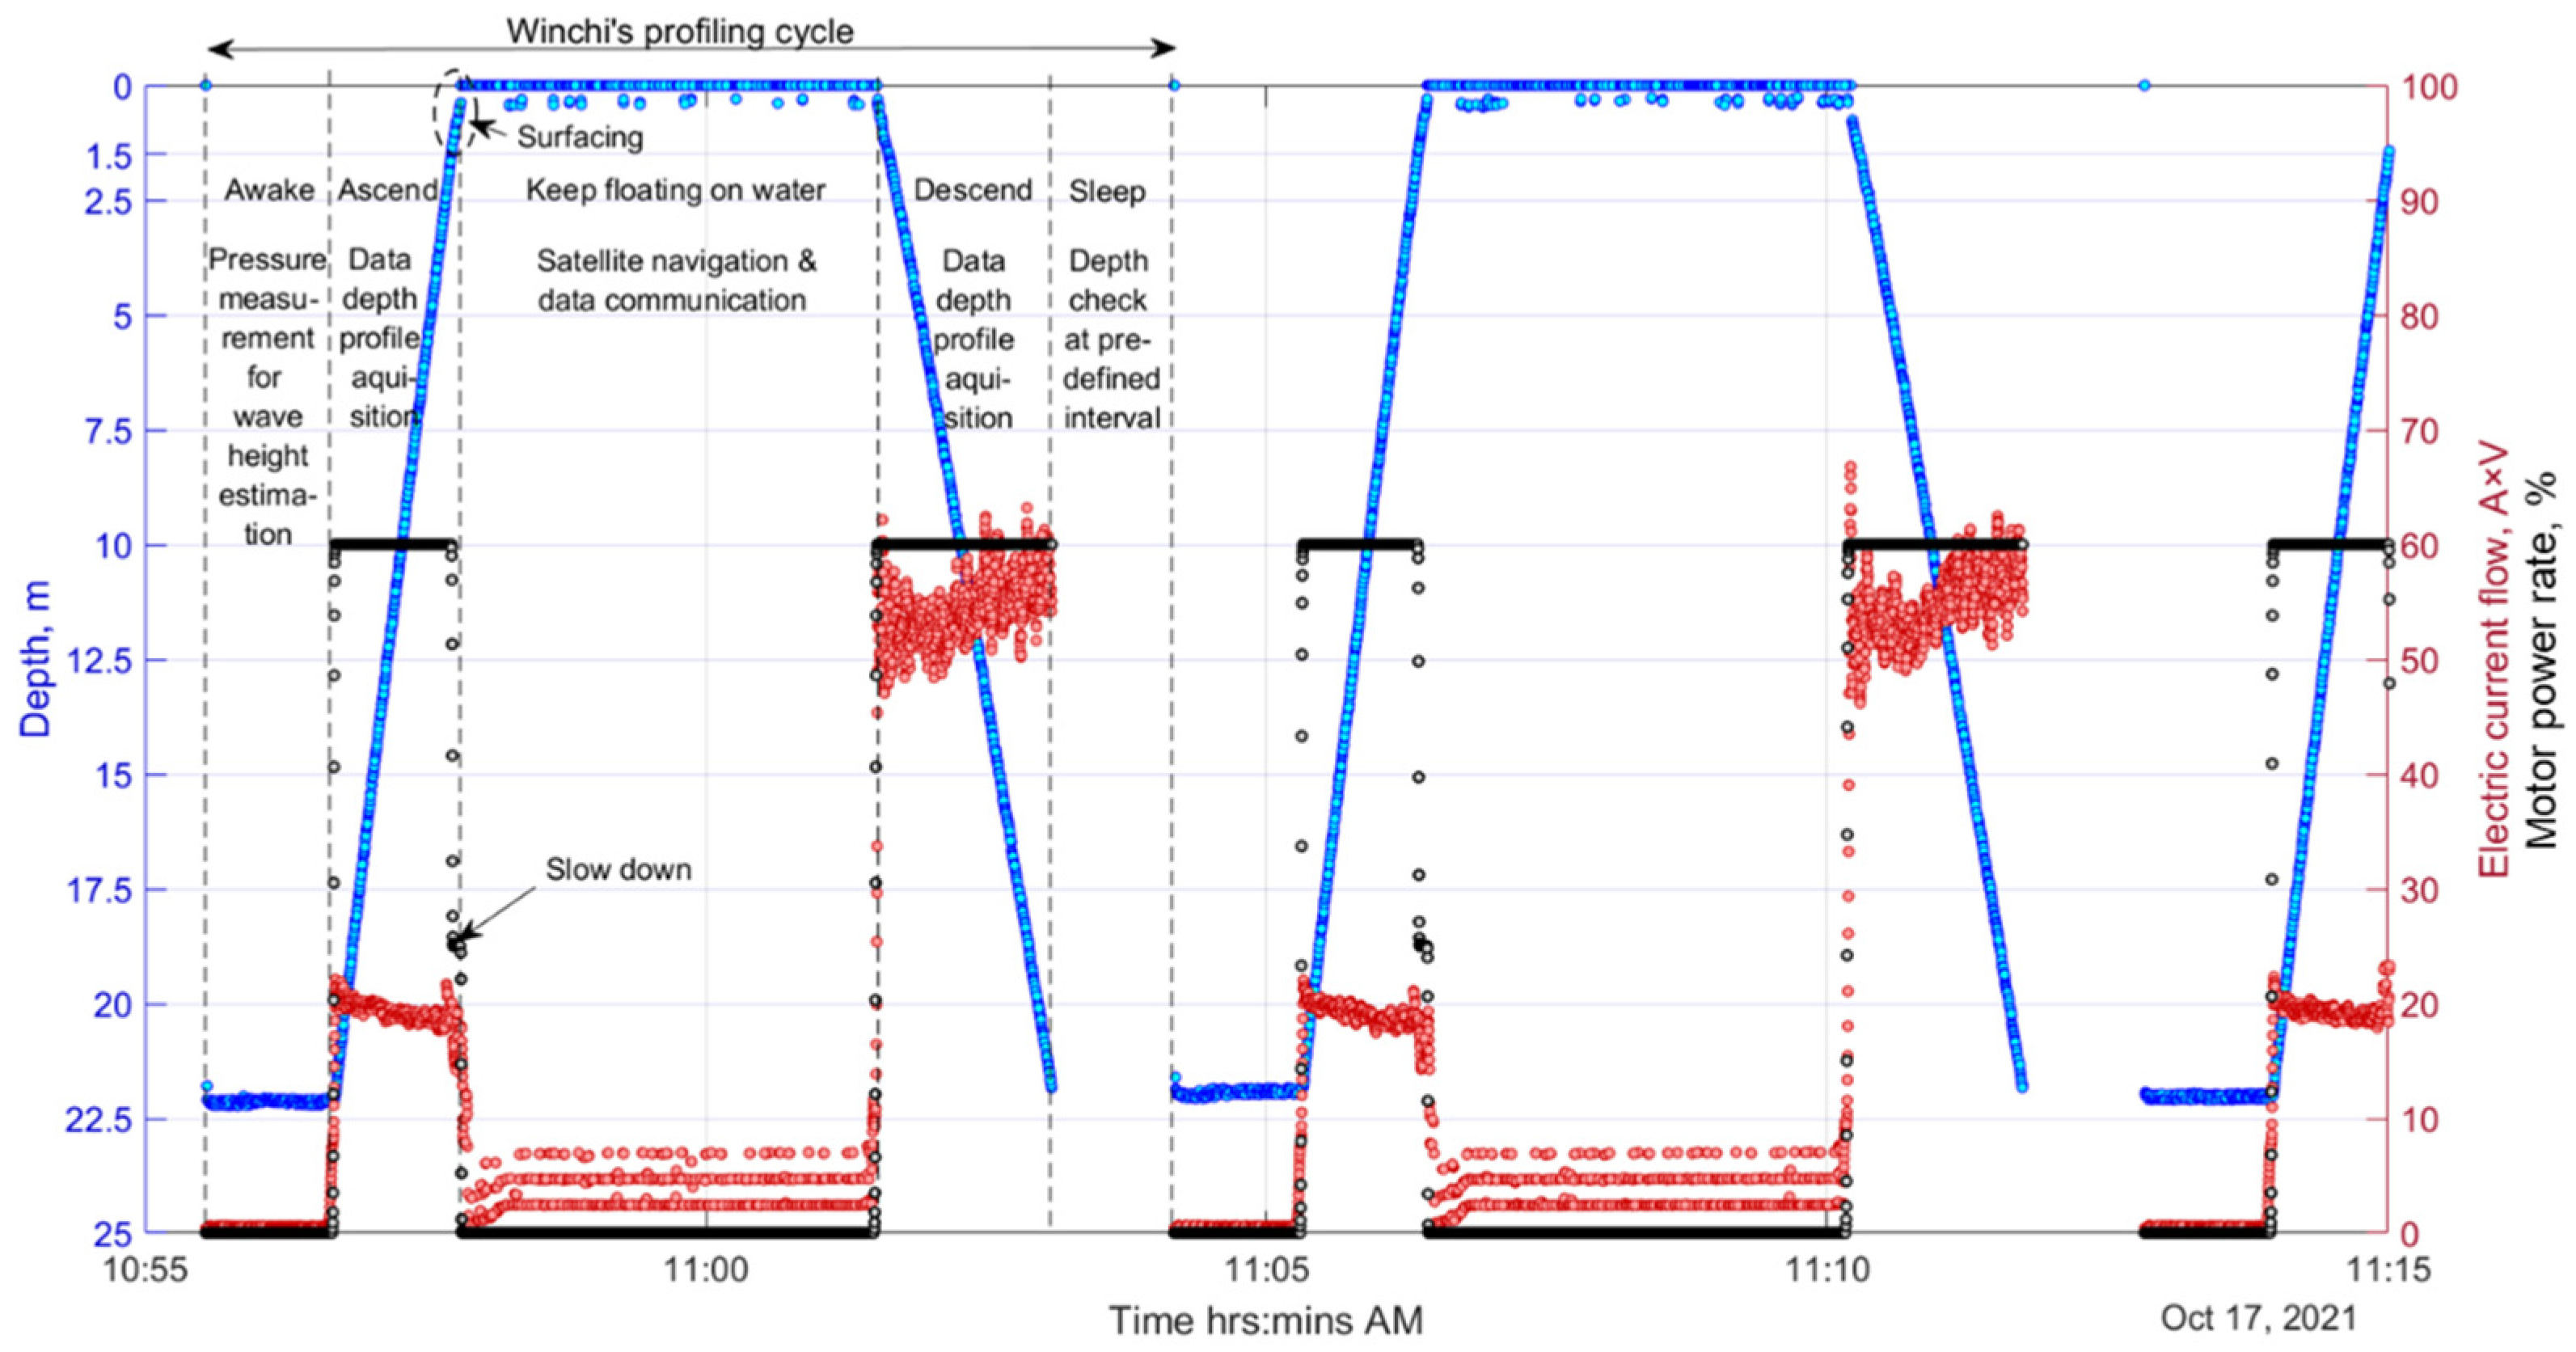
Figure 10 shows a chart of the profiling cycle track. As the profiler was positively buoyant, its vertical speed was 0.33 m/s while ascending and 0.25 m/s while descending.
If the profiler’s battery is drained to the critical level (which can be programmed prior to the mission start or set via remote operation command), it aborts the mission and tries to ascend immediately. At the surface, Winchi sends its telemetry with a low battery warning, location coordinates, and Mission Aborted status. Then, the device continues to send its telemetry every 15 min while waiting for a remote operation command. The user has the option to issue a command to dive to a certain depth until a specified date and time, which would be proper if an immediate retrieval of the device is not possible. After receiving this command, the profiler will sleep safely underwater until the support boat arrives.
If the profiler unexpectedly rises above the sea surface, then it determines its GPS position, sends notification, including its geographical coordinates via the communication module, and starts to flash. Such S.O.S. messages are transmitted every 15 min.
3. Trials
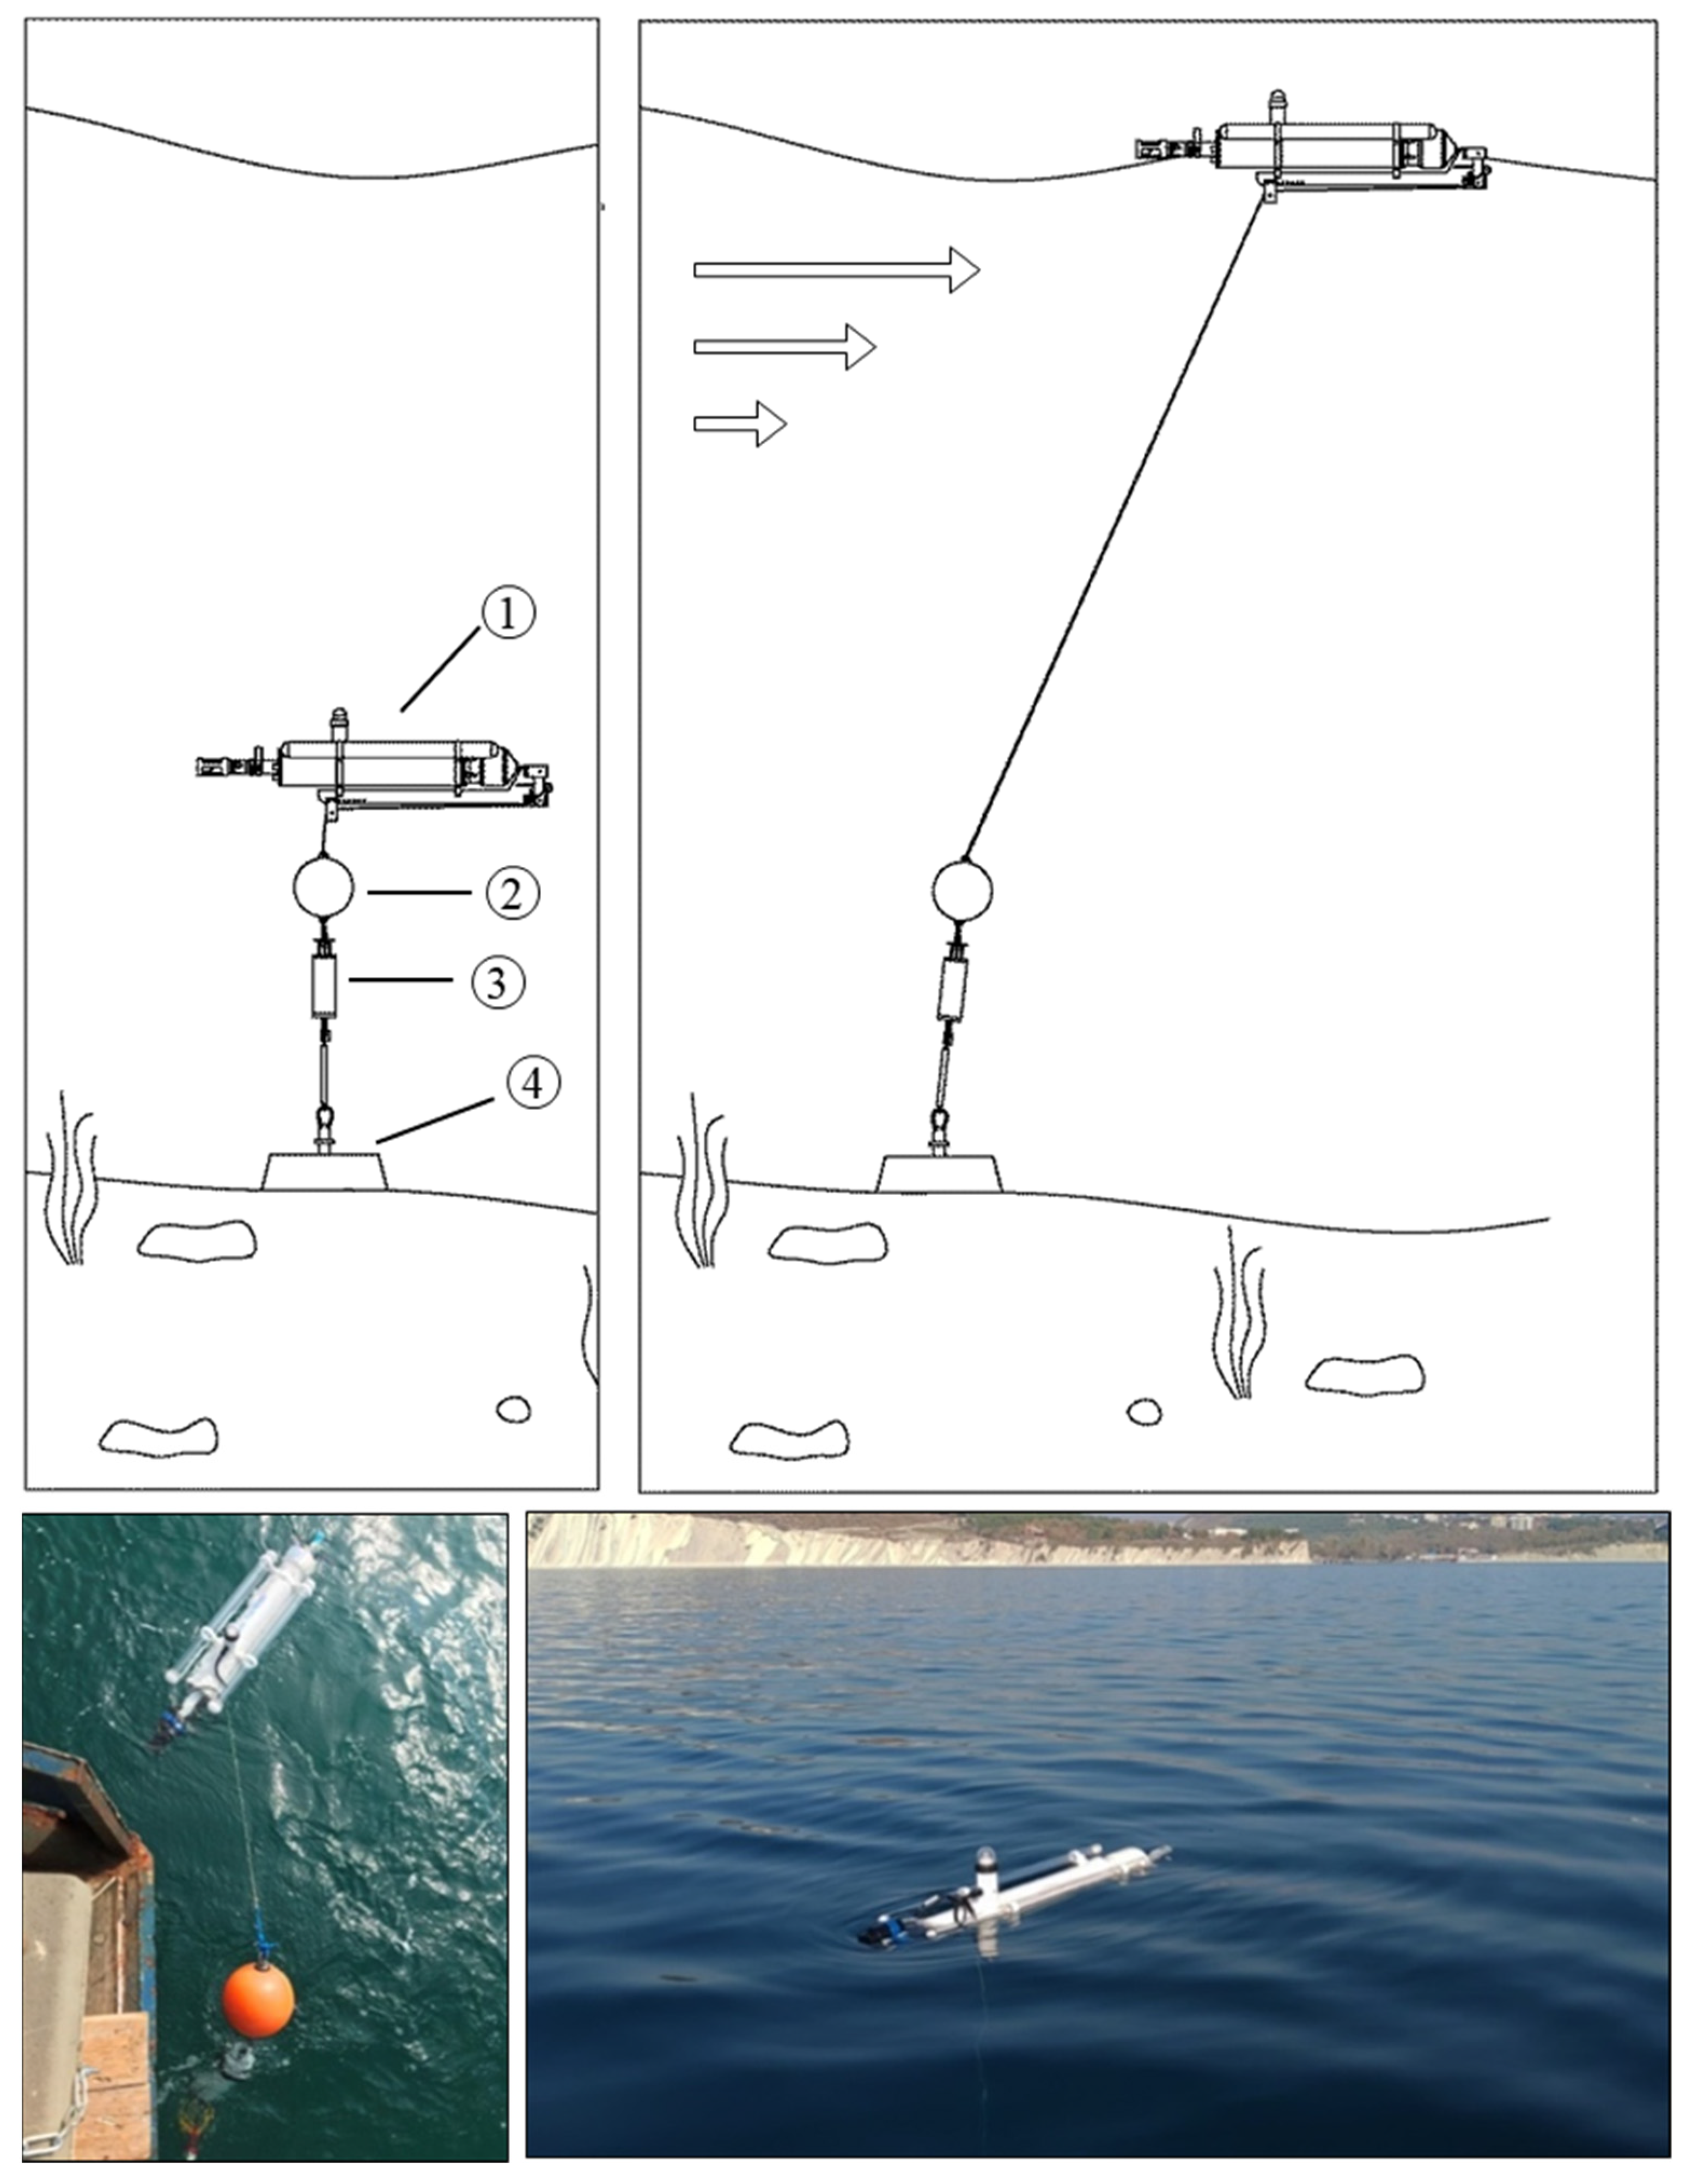
The trials of the profiler Winchi were carried out at Lake Glubokoe (Moscow region) and at the SIO RAS carbon observational site on the Northeastern Black Sea shelf. For sea trials, the profiler mooring system was deployed at 25–30 m (location depicted as circle mark No. 4, as shown in
Figure 1). The overall design of the mooring is shown in
Figure 11. Anchor, acoustic release, and recovery flotation were used in the lower part of the profiler mooring system to recover the mooring. A profiler winch wire was attached to the top of the recovery float. If the data very close to the bottom layer were wanted to be obtained, the U-style mooring could be used.. In a U-style mooring system, a taut line runs from the tethered profiler anchor to the second anchor (located at a distance approximately equal to the depth of the deployment site) which is joined by another line to a surface buoy.
The profiler was configured in advance for automatic operation. The measurement depths, intervals, and other settings could be modified based on GSM communication every time the profiler surfaced. A sample plot of the profiler track is shown in
Figure 12. To check the operability of the profiler, the device was scheduled to generate a few fast cycles at the beginning of the mission; therefore, descent and ascent were carried out without long stops at the parking depth. Subsequently, the device automatically switched to a profiling interval of 2 h. After 4 days, the profiler received a command from the operator to change the profiling interval to 1 h. The next day, this setting was changed (
Figure 12).
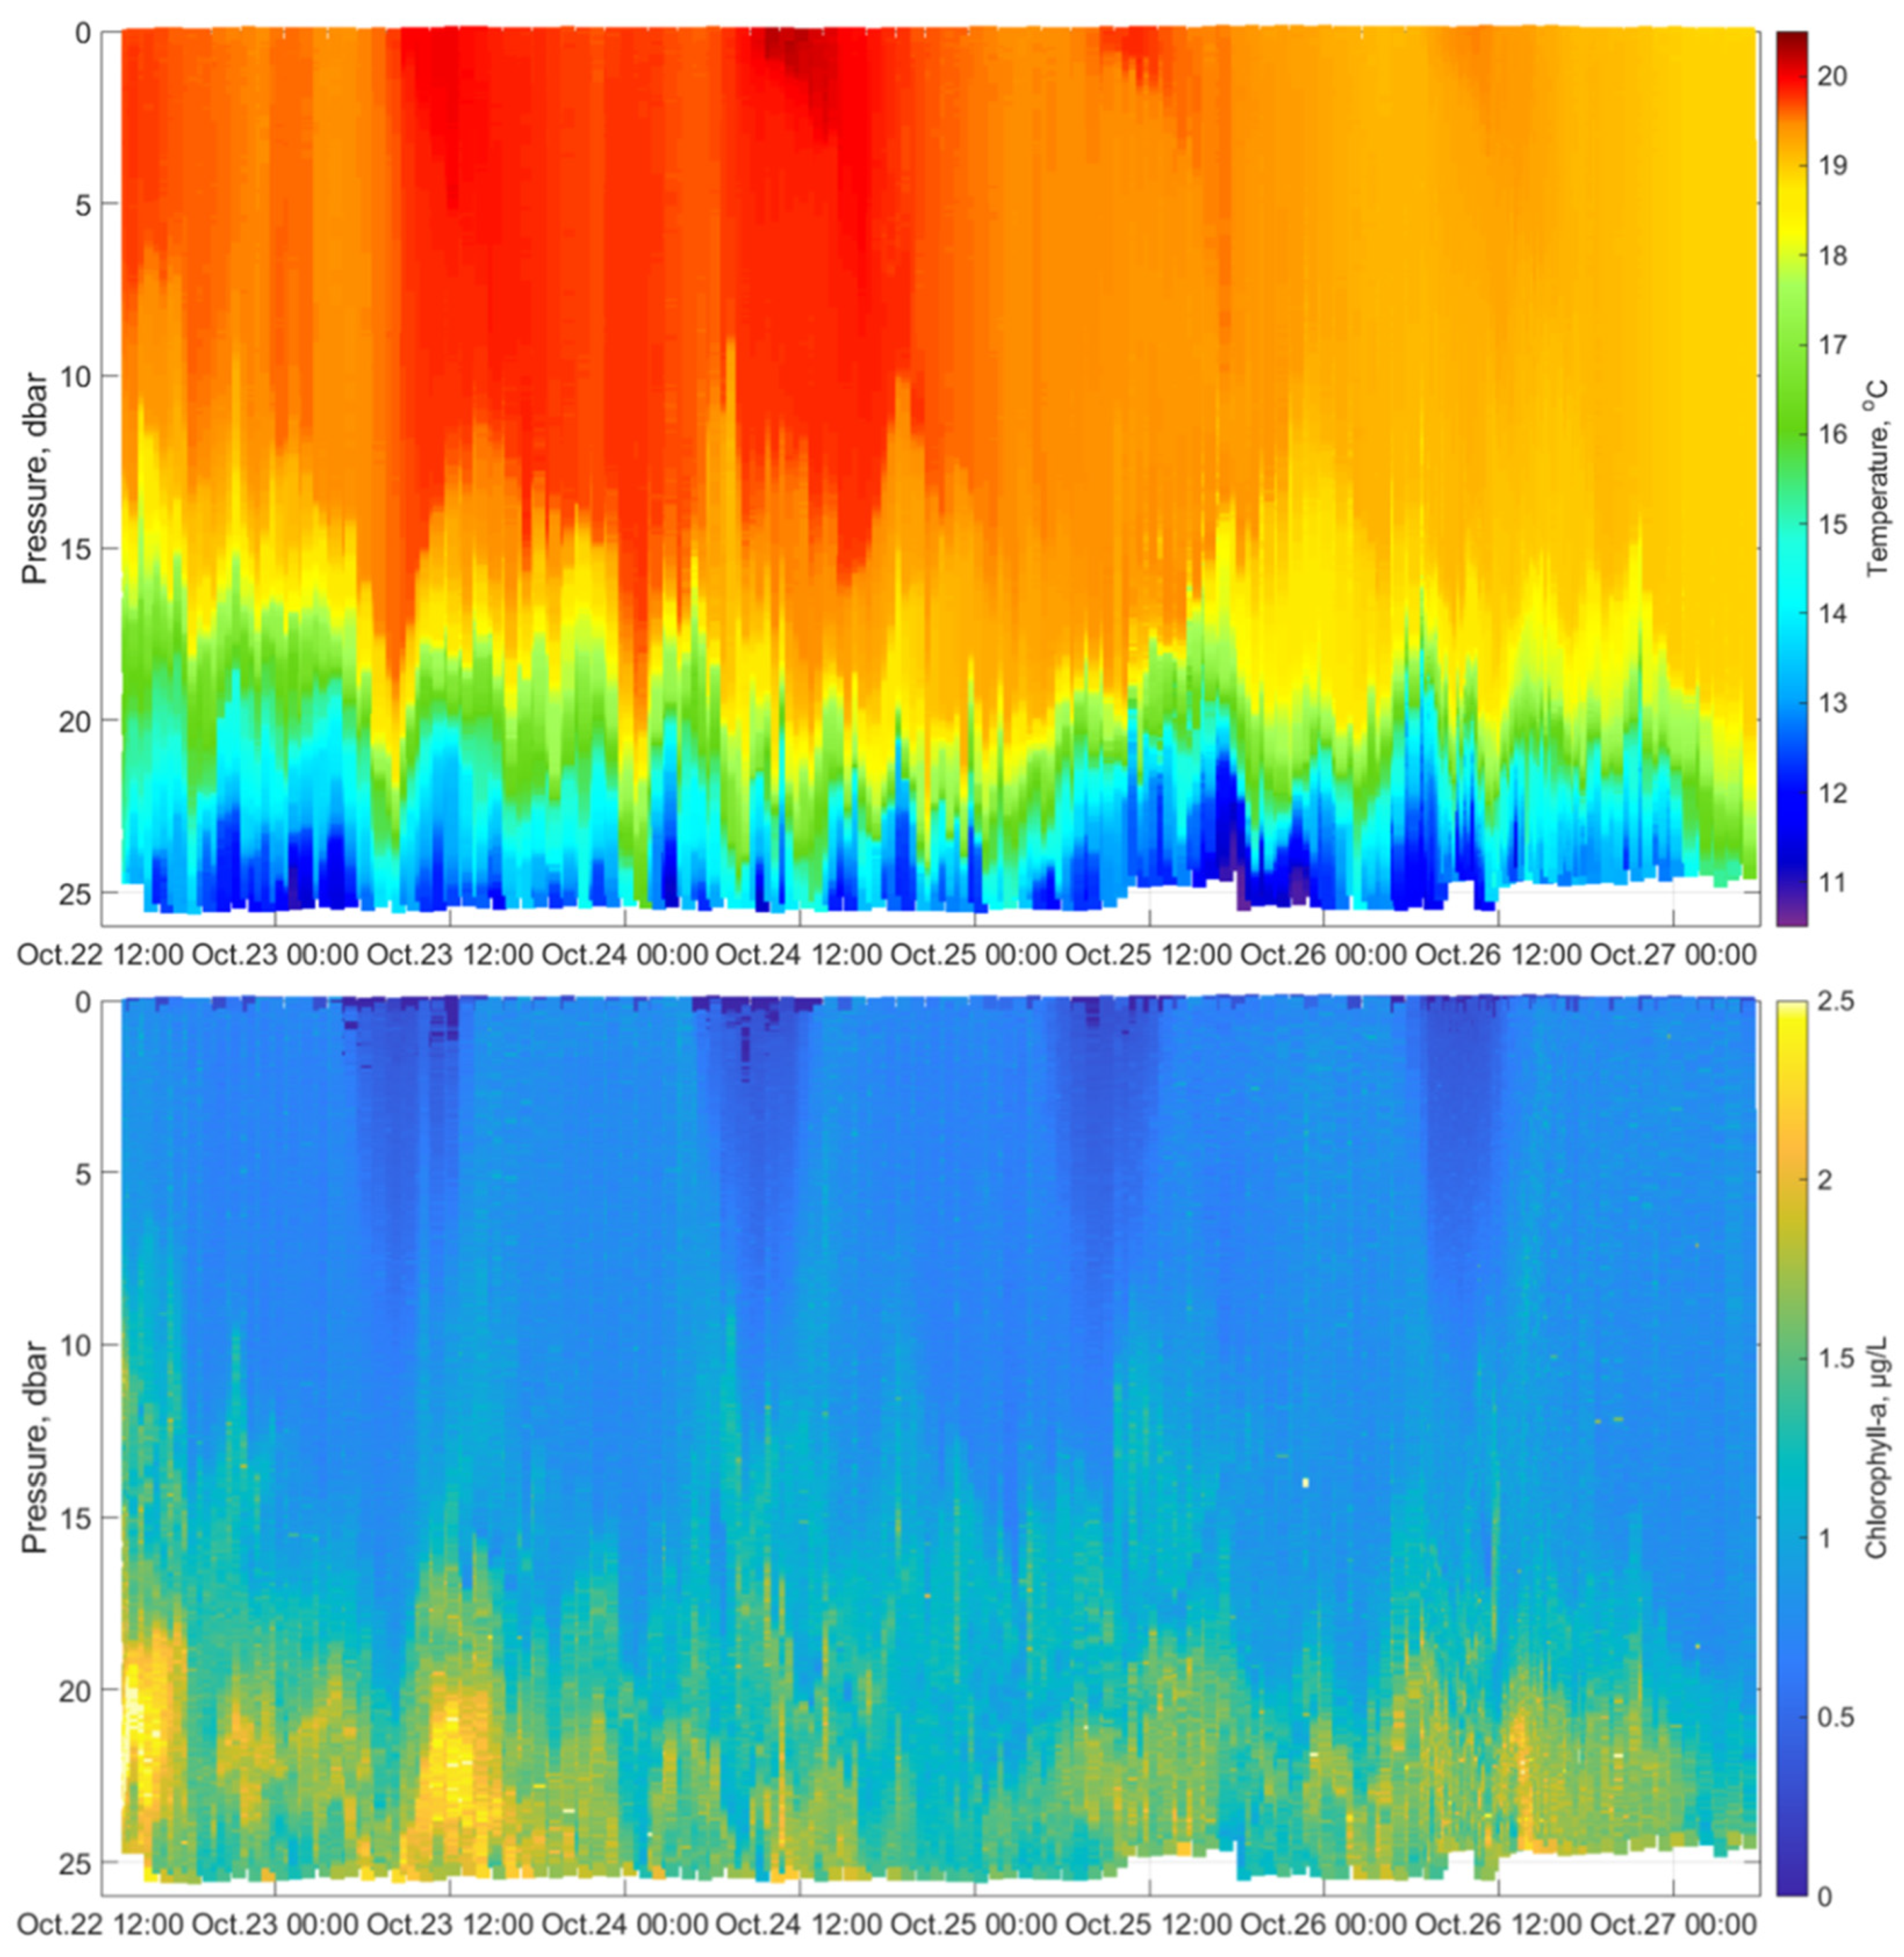
As an example of data that can be obtained using Winchi,
Figure 13 shows the distributions of the temperature and chlorophyll-a for the same period as illustrated in
Figure 12. The profiling allowed us to observe temporal variations in the vertical stratification. The temperature measurements (upper panel of
Figure 13) exhibited a water mass up to 19.5–20.5 °C on the upper layer (15–20 m) of the shelf water. The narrow thermocline separated the warm water mass from the near-bottom layer, which was colder than that at 13 °C. In October, strong stratification can be supported by the along-shelf advection of light, warm water from the southeastern part of the sea and upwelling events, which led to the propagation of dense, cold water from the deep part of the sea above the continental slope and over the shelf [
18].
The warmer upper layer was rather poor in chlorophyll-a (
Figure 13, lower panel). The chlorophyll-a concentration increased to 2–2.5 µg/L near the sea bottom, where the water was thought to be nutrient-rich. The observed maximum of chlorophyll-a below 15 m in depth is a characteristic feature of the Black Sea ecosystem [
19,
20,
21]. The clear-cut diurnal cycle of the chlorophyll-a measurement data obtained by the SCF sensor in the upper 10-m layer (lower panel of
Figure 13) should be treated with caution. A decrease in daytime indicates a period of nonphotochemical quenching under continuous light, particularly at high intensity, and the maximum fluorescence emission settles down to a lower value compared with the value measured shortly after a long dark period [
22]. This period occurred when the solar irradiance increased and a diurnal warm layer developed. The timing of the diurnal minimum coincided with that of the maximum temperature in the surface layer.
In the short-period band, vertical displacements of the thermocline at a depth range of 15–25 m were irregular. However, few of these displacements could be associated with the internal waves of periods of 10 min, which were observed using temperature sensor chains [
23]. Intermittent high-frequency waves are aliased in the Winchi profiler observations, which help sampling low-frequency dynamics, e.g., near-inertial waves.
The profiler sensor can be configured to operate when it ascends and/or descends. The sampling frequency of the CTD probe is set to 0.5 Hz, and the sampling frequencies of the dissolved oxygen, fluorescence, and turbidity sensors are set to 1 Hz. Owing to a sensor response time longer than the sampling period, there can be differences between the data obtained from the ascending leg and those from the descending leg. Such differences should be addressed during post-deployment data analyses.
4. Discussion and Conclusions
The SIO RAS carbon observation site near Blue Bay in the Black Sea includes devices to observe the marine environment. To obtain a long time series of data in the deep part of the site, two subsurface moorings have been installed. The subsurface moored profiler Aqualog stores the observation data in the internal memory for a retrospective study after the recovery of the mooring. Examples of such analyses can be found in References [
6,
24]. In future, these systems should be complemented by sediment traps installed at fixed depths below the profiler’s operational depth to assess the composition of the sinking material in the deep layers of the Black Sea. However, the Aqualog profiler cannot measure through the sea surface layer, because its profiling range is limited to the top by subsurface floatation, which supports the mooring wire in an upright position [
3]. Sampling through the top layer (0–30 m) in the coastal zone of the Black Sea cannot be achieved using Argo floats, because they do not operate in shallow areas [
25]. Sensor chains (strings), which are often used in shallow seas [
18], are not sufficient for carbon sites, because they are usually limited to temperature and salinity sensors such as those developed by RBR Ltd. (Ottawa, Canada) (
https://rbr-global.com/products/standard-loggers/thermistor-strings (accessed on 21 February 2022)), GeoPrecision GmbH (Ettlingen, Germany) (
https://www.thermistor-string.com/ (accessed on 21 February 2022)), Aanderaa Data Instruments AS (Bergen, Norway) (
https://www.aanderaa.com/productsdetail.php?Aanderaa-SeaGuard-String-31 (accessed on 21 February 2022)), Star Oddi Ltd. (Gardabaer, Iceland) (
https://www.star-oddi.com/products/submersible-water-sensors/salinity-logger-probe-CTD (accessed on 21 February 2022)), and others. Therefore, specific instruments are required to study the carbon system. If multidisciplinary profiles are required, the cost of several sensor suits, along with the mooring line, makes a difference. In addition, the sensor chains need to be deployed at subsurface moorings to avoid the impact of waves; the data are not available for the upper ocean boundary layer.
This study describes the new tethered profiler Winchi, which is surface-pierced to obtain full-water column profiles. However, it is capable of sampling through the sea surface layer regularly and frequently during extended deployment. It uses a single sensor suite, thus reducing the cost of the initial investment and maintenance, including post-survey calibration of the sensors. In the future, the profiler will accommodate additional sensors to obtain data on dissolved gases, e.g., carbon dioxide and methane, photosynthetically available radiation (PAR), abundance of chlorophyll, colored dissolved organic matter (CDOM), and pH value, which are required to comprehensively assess the carbon fluxes.
We focused on the control of the movement of Winchi to maintain sufficient tension of the wire. It is risky for the profiler mission to ascend in the high seas. During ascent, loosening and looping of the wire (when it is unwound from the drum) may occur owing to the surface waves, thereby posing a problem for underwater winches. Therefore, before ascent, the profiler obtains data on surface waves to avoid operation in stormy weather conditions. If the wire tension weakens, then overlapping of its turns on the winch drum may occur. Hence, it is of utmost importance to control the wire tension and reverse the direction of the winch drum rotation to generate the required tension for the wire. Another problem is that strong currents can sink the device. To reduce this effect, the winch was programmed to spool more wiring to allow the profiler to rise to the sea surface.
When the profiler surfaced, it transmitted the observational data to a server on the land. This makes the profiler useful for operational oceanography applications, particularly for providing the observational data for assimilation in mathematical models for diagnosis and forecasting. Data transfer to and from the profiler Winchi has been designed with regard to the mobile phone link. In the future, satellite communication options will be included.
The effort to build the carbon observational site in the Gelendzhik area is in accordance with two projects: Advancing Black Sea Research and Innovation to Co-Develop Blue Growth within Resilient Ecosystems (BRIDGE-BS) (
https://cordis.europa.eu/project/id/101000240, last accessed: 12 December 2021) and Developing Optimal and Open Research Support for the Black Sea (DOORS) (
https://cordis.europa.eu/project/id/101000518, last accessed: 12 December 2021), both for 2021–2025 under the umbrella of the EU Horizon 2020 program. In particular, the BRIDGE-BS project targets the development of capabilities necessary to understand and predict the impact of climate-driven and anthropogenic multi-stressors on services stemming from Black Sea ecosystems. The key ecosystem services at the Northeastern Black Sea pilot site, which shares the same infrastructure as the carbon observational site in the Gelendzhik area, will include carbon sequestration in the sea. In a broad oceanographic context, by developing the new observational profiling platform—Winchi, we are taking a step forward to create and apply innovative technologies that can help in long-term multidisciplinary oceanographic observations at fixed locations in the sea coastal zone.


 ,
, 


