Article

Life Cycle Greenhouse Gas Emission Assessment for Using Alternative Marine Fuels: A Very Large Crude Carrier (VLCC) Case Study

1
Merchant Ship Department, Marine Design and Research Institute of China (MARIC), Shanghai 200011, China
2
C-LNG Solutions Pte. Ltd., Singapore 608526, Singapore
3
Australian Maritime College (AMC), College of Sciences and Engineering, University of Tasmania, Launceston, TAS 7248, Australia
4
Naval Architecture and Shipping College, Guangdong Ocean University, Zhanjiang 524088, China
*
Author to whom correspondence should be addressed.
J. Mar. Sci. Eng. 2022, 10(12), 1969; https://doi.org/10.3390/jmse10121969
Submission received: 15 November 2022 / Revised: 9 December 2022 / Accepted: 9 December 2022 / Published: 11 December 2022
(This article belongs to the Section Marine Pollution)

Abstract

:
The International Maritime Organization (IMO) has set decarbonisation goals for the shipping industry. As a result, shipowners and operators are preparing to use low- or zero-carbon alternative fuels. The greenhouse gas (GHG) emission performances are fundamental for choosing suitable marine fuels. However, the current regulations adopt tank-to-wake (TTW) emission assessment methods that could misrepresent the total climate impacts of fuels. To better understand the well-to-wake (WTW) GHG emission performances, this work applied the life cycle assessment (LCA) method to a very large crude carrier (VLCC) sailing between the Middle East and China to investigate the emissions. The life cycle GHG emission impacts of using alternative fuels, including liquified natural gas (LNG), methanol, and ammonia, were evaluated and compared with using marine gas oil (MGO). The bunkering site of the VLCC was in Zhoushan port, China. The MGO and LNG were imported from overseas, while methanol and ammonia were produced in China. Four production pathways for methanol and three production pathways for ammonia were examined. The results showed that, compared with MGO, using fossil energy-based methanol and ammonia has no positive effect in terms of annual WTW GHG emissions. The emission reduction effects of fuels ranking from highest to lowest were full solar and battery-based methanol, full solar and battery-based ammonia, and LNG. Because marine ammonia-fuelled engines have not been commercialised, laboratory data were used to evaluate the nitrous oxide (N2O) emissions. The GHG emission reduction potential of ammonia can be exploited more effectively if the N2O emitted from engines is captured and disposed of through after-treatment technologies. This paper discussed three scenarios of N2O emission abatement ratios of 30%, 50%, and 90%. The resulting emission reduction effects showed that using full solar and battery-based ammonia with 90% N2O abatement performs better than using full solar and battery-based methanol. The main innovation of this work is realising the LCA GHG emission assessment for a deep-sea ship.

1. Introduction

As the world enlarges its efforts against climate change, the shipping industry’s greenhouse gas (GHG) emissions have gained more attention. Due to the large volumes of freight and long distances travelled, international shipping is responsible for about 3% of global anthropogenic GHG emissions on a carbon dioxide (CO2) equivalent basis [1]. The Kyoto Protocol and the Paris Agreement officially handed responsibility for marine emissions to the International Maritime Organization (IMO). After years of efforts, in 2018, the IMO set the target to cut the carbon intensity of all ships by at least 40% by 2030 and reduce total GHG emissions from global shipping by 50% (compared to 2008 levels) by 2050 [2]. Further stringent requirements are expected by the climate change agenda of the IMO’s Marine Environment Protection Committee (MEPC) after the 26th United Nations Climate Change Conference in Glasgow [3]. For example, the IMO MEPC’s 78th session in June of 2022 considered phasing out GHG emissions from international shipping by 2050. The MEPC 80 meeting in July of 2023 may make the final decision [4]. Therefore, to meet the decarbonisation goals, switching to low-carbon or zero-carbon alternative fuels is urgent for the shipping industry [5,6].
Among alternative fuel options, liquified natural gas (LNG), methanol, and ammonia have gained traction for large ships. Liquified natural gas is considered a practicable transitional fuel to address GHG emissions because of its low-carbon nature, vast availability, proven technology, and affordability [7,8,9]. From a long-term perspective, some studies have concluded that using liquefied biomethane (bio-LNG) and green hydrogen-based LNG (synthetic LNG or e-LNG) as drop-in solutions will expand the use of LNG [10,11]. Biomass- or hydrogen-based methanol has the potential to achieve life cycle net zero emissions. It is liquid at standard temperature and pressure and thus easier to handle on ships [12]. As a hydrogen carrier, liquid ammonia has acceptable volumetric energy density and storage conditions (i.e., refrigerated at minus 33 °C at atmospheric pressure or 0.8–1.0 MPa under atmospheric temperature) and is considered a promising alternative fuel as well [13]. According to the Clarksons’ database [14], as of October 2022, 4.8% of the global fleet including coastal and deep-sea ships and 43.8% in the order book in tonnage terms are capable of using alternative fuels. The tonnages of coastal ships are small, and their contributions to emissions are limited; thus, it can be seen from the database that deep-sea ships are playing important roles in reducing emissions. In the order book, 781 ships are set to use LNG, 42 ships will use methanol, and there are 130 ammonia-ready ships. However, there are still some hurdles, particularly the shortage of fuel supply chains [15], to be broken down for the scale-up to an alternative fuel ship fleet.
Currently, ships’ GHG emission assessments are based on tank-to-wake (TTW) analysis. For example, the Energy Efficiency Design Index (EEDI), Energy Efficiency Existing Ship Index (EEXI), and Carbon Intensity Indicator (CII) requirements issued by the IMO are all TTW-based [16,17,18]. The TTW method considers the emissions from consuming fuel once it is already in the tank. The analysis does not include how a fuel is produced and transported to a ship’s tank. Nevertheless, the well-to-wake (WTW) analysis, also known as life cycle assessment (LCA), considers emissions related to every stage of a fuel’s life cycle, from its production, transport, and bunkering until consumption on a ship. Using a TTW approach could misrepresent the total climate impacts of shipping fuels. Therefore, the IMO has been developing life cycle GHG and carbon intensity guidelines to be utilised when assessing the overall climate impact of fuels [19]. A final draft of the guidelines is expected to be adopted by the IMO MEPC 80 meeting in July of 2023.
Some research studies have been conducted regarding the life cycle environmental impacts of using different marine fuels. Brynolf et al. compared the life cycle environmental performance of LNG, bio-LNG, methanol, and bio-methanol as ship fuels. They concluded that bio-LNG and bio-methanol could reduce climate impact [12]. Gilbert et al. evaluated conventional and alternative fuels’ life cycle environmental performances in the shipping industry [20]. Law et al. compared 22 potential alternative marine fuel pathways in terms of LCA for the shipping industry [21]. Kanchiralla et al. conducted a life cycle evaluation of potential decarbonisation solutions for shipping regarding environmental impacts and costs [22]. For case studies, Hwang et al. [23] conducted an environmental LCA of various alternative ship fuels, including marine gas oil (MGO), LNG, and hydrogen, for a coastal ferry. They demonstrated the benefits of using hydrogen as a fuel [23]. Wang et al. implemented a life cycle environmental impact assessment for a battery-powered ferry [24]. Chen and Lam conducted an LCA to compare the environmental impacts of hydrogen fuel cell and diesel engine systems on tugboats, showing that hydrogen-powered tugboats can reduce GHG emissions significantly [25]. Similarly, Fernández-Ríos et al. compared the LCA sustainability and environmental performances between hydrogen fuel cell systems and hydrogen internal combustion engine systems [26]. Wang et al. examined the environmental impacts of various alternative fuels, including MGO, LNG, methanol, biodiesel, and hydrogen for a yacht, and recommended using green hydrogen [27]. Seddiek and Ammar compared the LCA environmental and cost performances between diesel and renewable hydrogen-powered ships sailing in the Red Sea area [28]. Lee et al. compared the life cycle environmental impacts of using MGO, LNG, and hydrogen on a nearshore ferry in Republic of Korea [29]. These efforts have contributed to the literature regarding the life cycle performances of using alternative marine fuels; however, there are still gaps in utilising the LCA method to evaluate GHG emissions of using alternative fuels on large ships sailing internationally. According to the IMO’s fourth GHG study report [1], large ships, including oil tankers, bulk carriers, and container ships, dominate the inventory of international shipping emissions. Therefore, choosing the optimal fuel for deep-sea ships is critical to reducing emissions in the shipping industry.
In this context, this study aimed to perform an LCA to compare the GHG emissions of a very large crude carrier (VLCC) using alternative fuels, including LNG, methanol, and ammonia. The conventional fuel, MGO, was also considered for a comparative purpose.
Of particular interest were the following questions to be addressed in this paper: How to consider the WTT, TTW, and WTW GHG emissions from using different marine fuels for a deep-sea ship? Which is the optimal GHG emission abatement fuel for the target ship?
The remainder of this article is structured as follows. Section 2 outlines the parameters of the VLCC, the LCA methodology, and the data. Section 3 presents the alternative fuels’ LCA performances on the VLCC. Section 4 discusses the results. Finally, Section 5 presents the conclusions.

2. Methods and Materials

This section provides the parameters of the target ship, the framework of the LCA method, and the data.

2.1. Parameters of The VLCC

Table 1 presents the main parameters of the VLCC. Figure 1 shows the side view of the ship. The shipping route of the VLCC was from the Middle East to China, as shown in Figure 2. The loading port was Jebel Ali, and the unloading port was Zhoushan. The voyage of a round trip was 11,082 nautical miles (n.m.). Only one bunkering operation was conducted for each round trip. The ship was bunkered at anchorage in the Port of Zhoushan via ship-to-ship transfer.

2.2. Life Cycle Assessment Method

The ISO 14040 standard was used to perform the LCA [30]. This systematic tool enables the analysis of environmental loads of a product throughout its entire life cycle and the potential impacts of these loads on the environment. “Products” in this paper were marine fuels, which means the emissions from the ship’s building, scraping, and recycling were not in the research scope. An LCA has four phases: goal and scope definition, life cycle inventory analysis (LCI), life cycle impact assessment (LCIA), and life cycle interpretation. The goal and scope and the LCI are presented in this section, the LCIA and the interpretation are reported in Section 3 and Section 4.

2.2.1. Goal and Scope

This study aimed to compare the WTW GHG emission performances associated with using different fuels, including MGO, LNG, methanol, and ammonia. The primary GHG emissions, carbon dioxide (CO2), methane (CH4), and nitrous oxide (N2O), were considered in this study. Carbon dioxide is the main contributor to GHG emissions, followed by CH4. The CO2 emissions mainly come from fuel combustion, with small amounts of CO2 vented during processing. The main sources of the CH4 emissions were vented, fugitive, and unburnt emissions. The N2O only contributes to a minimal extent except in ammonia-fuelled engines. Black carbon emissions from MGO engines were not considered due to the high level of uncertainty and wide range of impact estimates of black carbon on the climate [7]. This represents a conservative approach to the potential benefits of alternative fuels, as CO2-eq emissions from black carbon would increase the GHG emissions from MGO engines.
The mass (tons) of the ship’s fuel consumption in one year was identified as the functional unit. The fuels’ lower heating values (LHVs) (MGO: 42.7 MJ/kg; LNG:50 MJ/kg; methanol:19.9 MJ/kg; ammonia:18.6 MJ/kg) were used to describe the energy consumption in the ship engines. The GHG emissions were expressed in ton CO2-equivalents (CO2-eq).
To better understand the emissions, various fuel production pathways were considered. As the ship bunkering site was considered to be the Port of Zhoushan, China, from the status quo of China’s energy supply [31], the MGO and LNG were considered imported from overseas, and methanol and ammonia were considered produced in China. Given that green methanol and green ammonia production have not yet been scaled up, grey productions, as transitional pathways, were also considered. It was assumed that the methanol and ammonia production factories were located in northwest China, where coal, natural gas, and solar energy resources were abundant [32]. The systems were thus split into nine subsystems:
  • S1: MGO imported from overseas.
  • S2: LNG imported from overseas.
  • S3: Coal-based methanol produced in China.
Coal mining and processing, syngas production, methanol synthesis, and distillation were considered in this pathway.
  • S4: Natural gas-based methanol produced in China.
In this pathway, natural gas extraction and processing, steam reforming processing, methanol synthesis, and distillation were considered.
  • S5: Partial solar-based methanol produced in China.
The CO2 capture, production of hydrogen by water electrolysis, and hydrogeneration of CO2 to synthesise methanol were considered. The CO2 source was exhaust gas from fossil-fuelled power plants, which supplied electricity and steam for the methanol synthesis system. Water electrolysis produces hydrogen powered by solar photovoltaic (PV).
  • S6: Full solar and battery-based methanol produced in China.
Compared with S5, the CO2 source was captured from the air in this pathway. All power requirements required in the system were provided by a solar PV power plant. Solar power generates electricity during the day. The excess PV electricity was stored in a lithium-ion battery to meet electricity requirements at night.
  • S7: Coal-based ammonia produced in China.
Coal mining and processing, syngas production, air separation, ammonia synthesis, and purification were considered.
  • S8: Natural gas-based ammonia produced in China.
In this pathway, natural gas extraction and processing, steam reforming processing, methanol synthesis, and distillation were considered.
  • S9: Full solar and battery-based ammonia produced in China.
In this pathway, solar PV was used as the power source for the whole process, including water electrolysis-based hydrogen production, air separation, ammonia synthesis, and distillation. Similar to S6, a battery was needed for night production.
The produced methanol and ammonia fuels were transported to coastal storage tanks in the Port of Zhoushan through freight trains, and a transport distance of 2100 km was considered in this work. The bunkering ship was loaded at the port, then sailed to the bunkering anchorage to bunker the VLCC. The bunkering ship’s round trip navigation distance was taken as 100 n.m. (between the fuel storage tanks and the anchorage of the VLCC).
The proposed supply chains for the fuels consist of standard processes such as the production of feedstock, production of fuels, storage, transportation, and utilisation as illustrated in Figure 3.

2.2.2. Life Cycle Inventory

The LCI analysis involved a systematic inventory of the input and output for the given systems. To assess the global warming potential in a 100-year timeframe, the following IPCC AR5 characterisation factors were used for calculating GHG emissions: 1 for CO2, 28 for CH4, and 265 for N2O [33].
(1)
Life cycle data of well-to-tank
Life cycle data of fuel productions and transport overseas and in China were mainly based on the literature. The data on production and transport for pathways S1 and S2 were taken from Sphera’s report [7]. The data on production for S3–5 and S7–9 were taken from Zhu’s research data [32], in which the emissions from the utilisations of resources, energy, and materials were considered. The data on production for S6 were taken from Nizami’s study [34]. According to chapter 8 of the IPCC AR5 report [33], the GHG emissions of electric freight trains were 6–33 gCO2-eq per ton of cargo per kilometre; conservatively, this work took 33 gCO2-eq/ton/km as input. Therefore, for 2100 km of domestic train transport, 0.0693 tons of CO2-eq were emitted per ton of cargo. An assumed newbuilt bunkering ship with a capacity of 10,000 DWT provides bunkering service for the VLCC. The emissions were estimated approximately based on the ship’s EEDI calculation [2]. The maximum continuous rating (MCR) of the bunkering ship’s main engine (ME) was estimated to be 5127 kW [35]; consequently, the power of auxiliary engines (AE) was 378 kW based on the calculation according to the IMO’s EEDI guidelines [2]. The design speed was estimated to be 16.9 knots [35]. Conservatively, it was assumed that the bunkering vessel was running on MGO, whose carbon emission factor was 3.151. The fuel consumption rates of ME and AE were estimated to be 190 g/kWh and 250 g/kWh, respectively. As a result, the bunkering vessel’s preliminary EEDI was estimated to be 15.38 g/ton/n.m., which means that 0.001538 tons CO2-eq per ton of cargo were emitted for 100 n.m. of navigation. Table 2 presents the main data for WTT calculation.
(2)
Life cycle data of tank-to-wake
Using different fuels may lead to changes in the ship’s loading capacity and deadweight. In this study, the LNG and ammonia fuel tanks were located on the open deck, and the methanol tanks were in the ship’s wing tanks; thus, the loading capacity of the VLCC was not impacted. Compared with MGO, fuel, fuel tank, and system weight changes of LNG, methanol, and ammonia were −800 tons, +4500 tons, and +6300 tons, respectively, corresponding to −0.26%, +1.45%, and +2.03% compared to the ship’s 310,000 DWT. These slight weight changes were ignored in the ship’s ME power selection.
As the fuel consumption of the ship’s ME varies significantly at different speeds, the following three main navigation conditions were considered:
  • Two cruising speeds, 14.5 knots of the service speed and 13.5 knots of economical speed, were considered to assess the changes in fuel consumption of the engines. At service speed, the ME output was set to be at the MCR point; at the economical speed, the ME output was set to be at 70% of the MCR point, which was suggested by the ship operator.
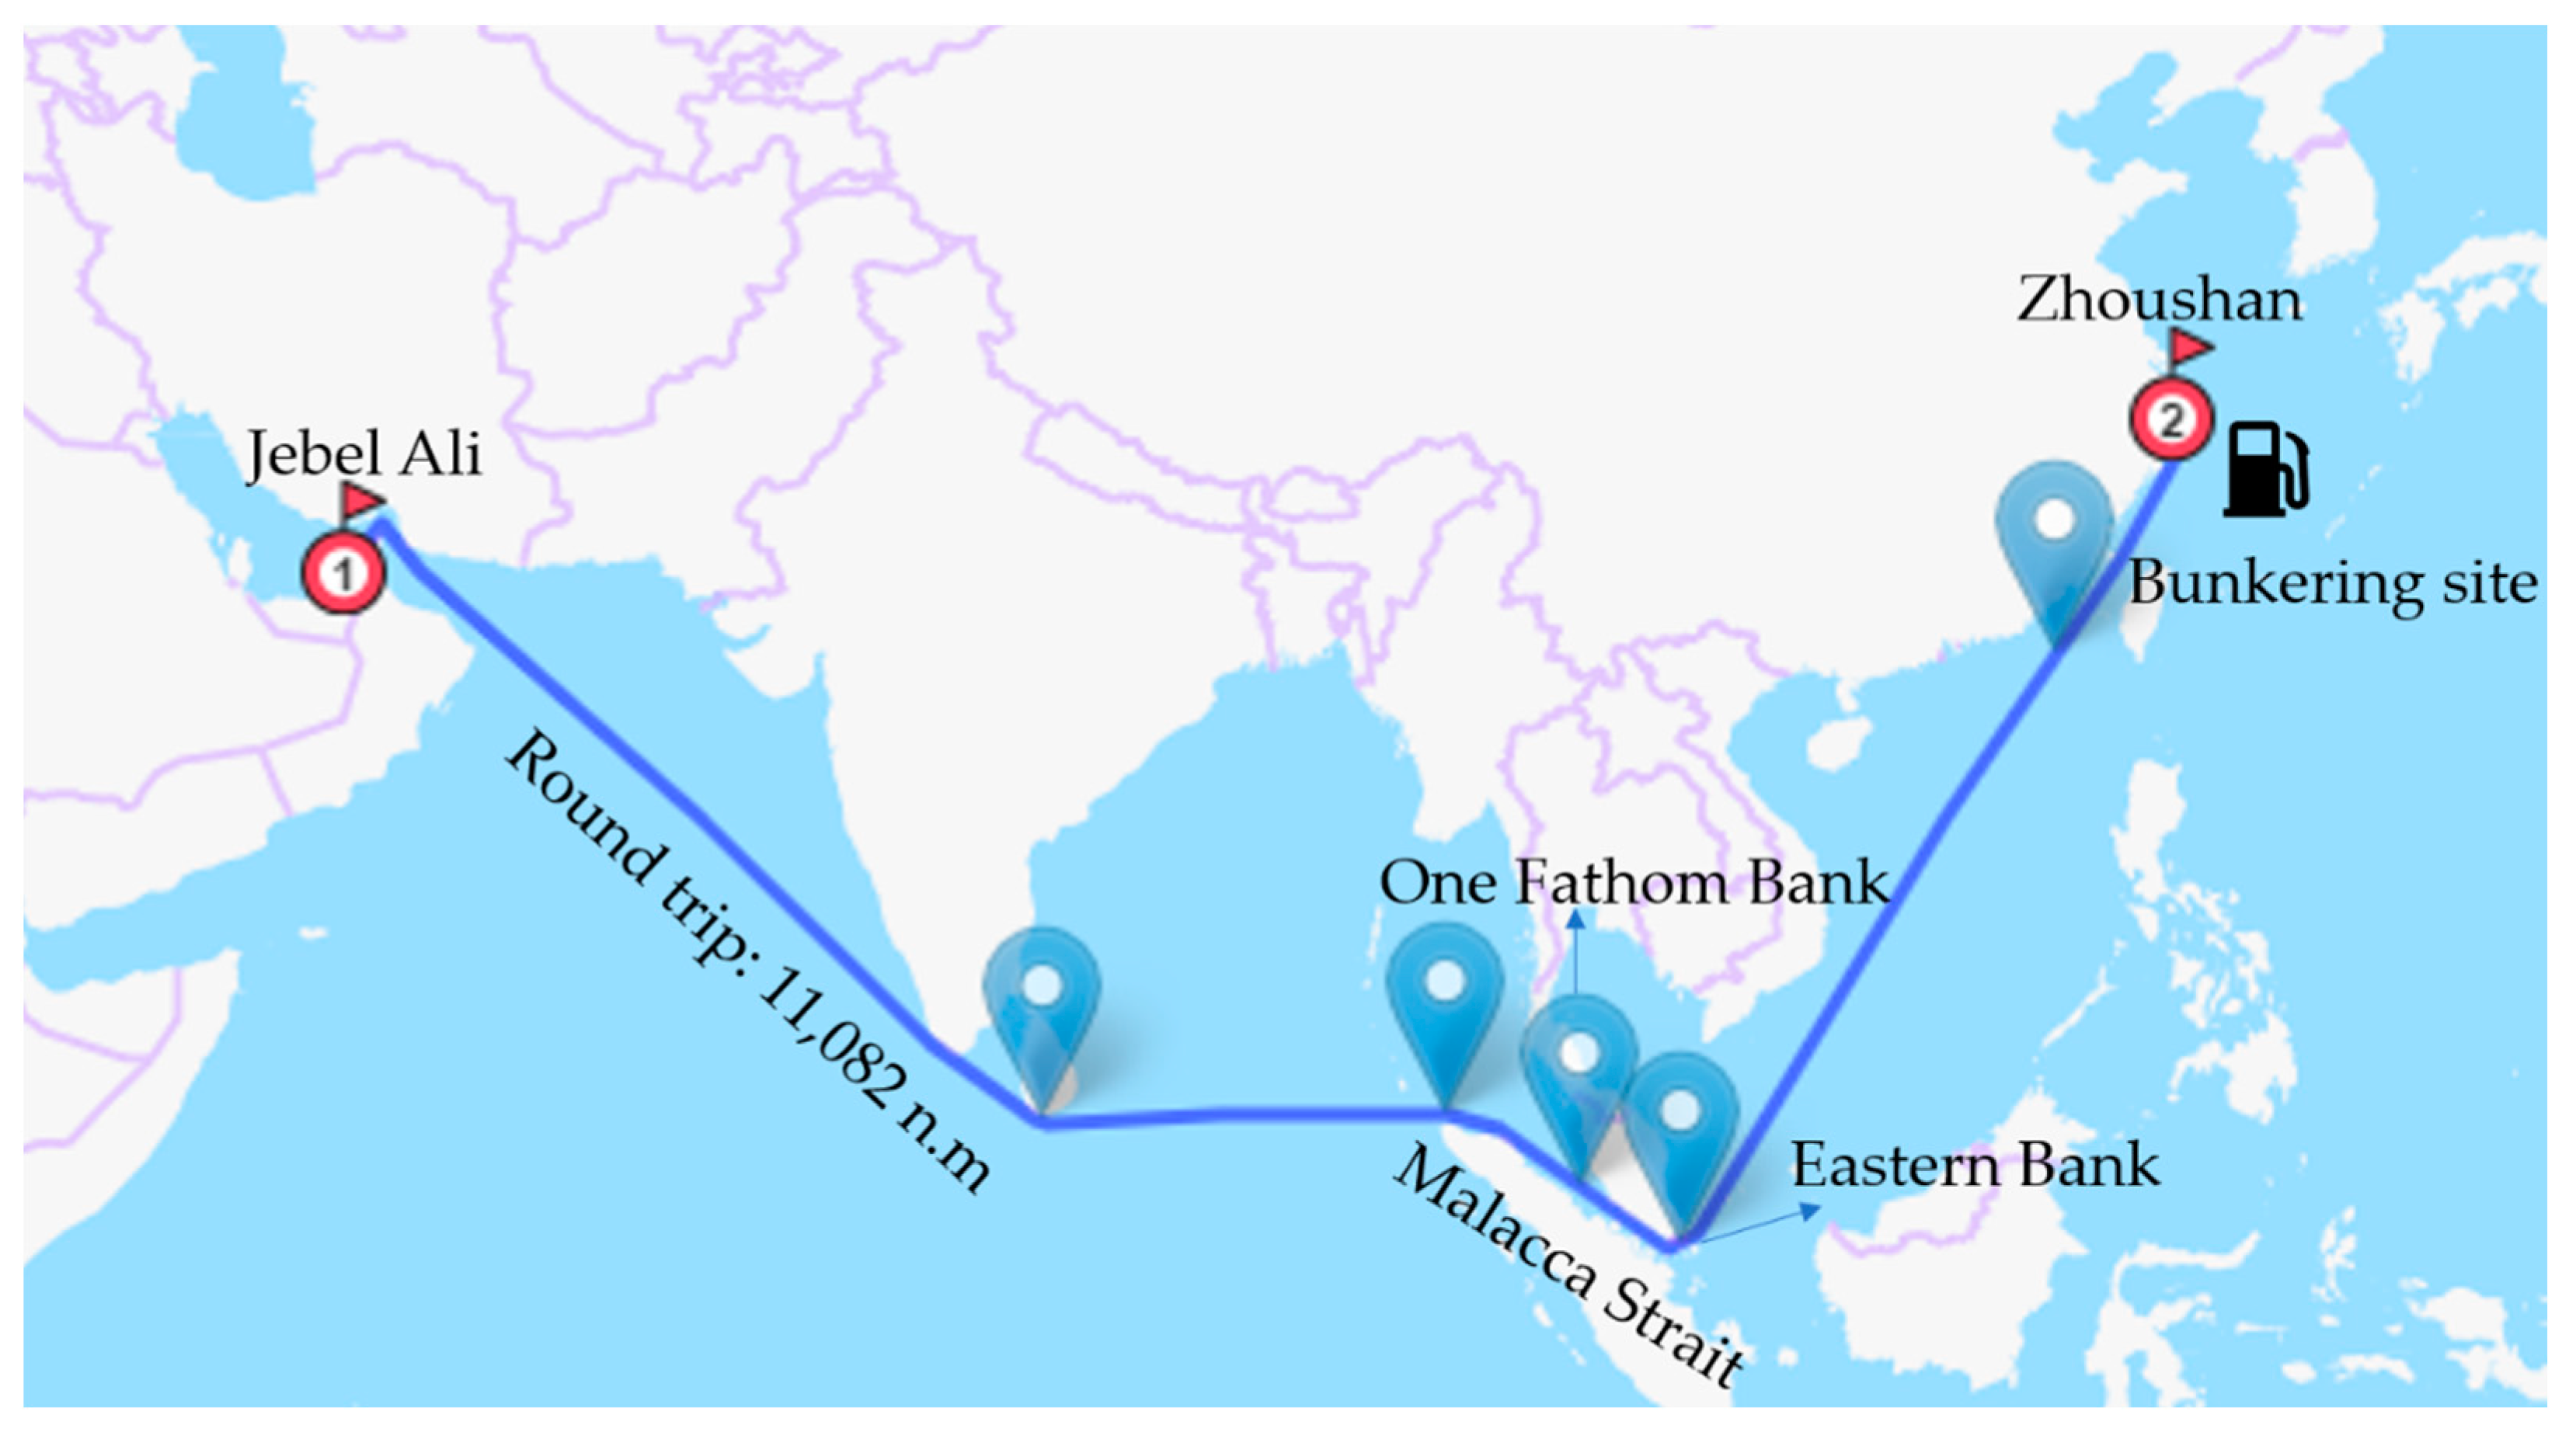
  • For safety considerations, the VLCC’s speed was reduced when entering and leaving ports due to its large mass and inertia. In this regard, the speed of 6 knots was considered for 30 n.m. of in-ports navigation.
  • The ship’s speed was reduced when transiting the Malacca Strait. According to the navigation requirements [36], there were various speed restrictions from the One Fathom Bank to the Eastern Bank (482 n.m.), as shown in Figure 2. This paper considered that 40 h were needed to go through the strait at an average speed of 12 knots.
Some additional conditions were considered for the fuel consumption of the AEs, such as entering and leaving ports, berthing, and cargo loading/unloading. Table 3 presents the data on the navigation conditions.
Considering uncertain factors such as weather and restrictions on ship traffic when entering and leaving the ports, the ship is sometimes on standby. The standby time has uncertainty. In this paper, the standby times under 14.5 knots and 13.5 knots were artificially set to 78 h and 53 h, respectively, the purpose of which was to obtain a consistent annual number of voyages for both conditions, making the GHG emissions comparable. As seen in Table 3, a voyage would take 45 days; eight voyages per year can thus be completed.
The ME type series is MAN 7G80ME, a two-stroke diesel cycle low-speed engine with different versions for different fuels. When using LNG, methanol, or ammonia, a small amount of pilot MGO is needed. The fuel consumption data for each version of the engine are available on MAN’s website [37]. Table 4 presents the fuel consumption and pilot MGO consumption of the ME at the specified maximum continuous rating (SMCR) point. Table 5 presents the fuel consumption and pilot MGO consumption of the AEs. The fuel mass consumptions of methanol and ammonia engines were much higher than MGO and LNG engines due to their differences in energy density.
The four-stroke Otto cycle medium-speed AEs were used. The total fuel consumption of the AEs in a single voyage was calculated according to the engines’ operating power and operating time under different conditions, as shown in Table 3. The total fuel consumption of ME and AEs, as shown in Table 6, was used to calculate the annual fuel consumption of the ship.
Table 7 presents the CO2 equivalent emission factors of the ME and AEs [1]. Ammonia-fuelled marine engines will be commercially available in 2024 [38,39]; there are no published N2O emission data; therefore, the preliminary test data from a laboratory were used.

3. Results

This section presents the WTT, TTW, and WTW GHG emission results of the VLCC using different fuels.

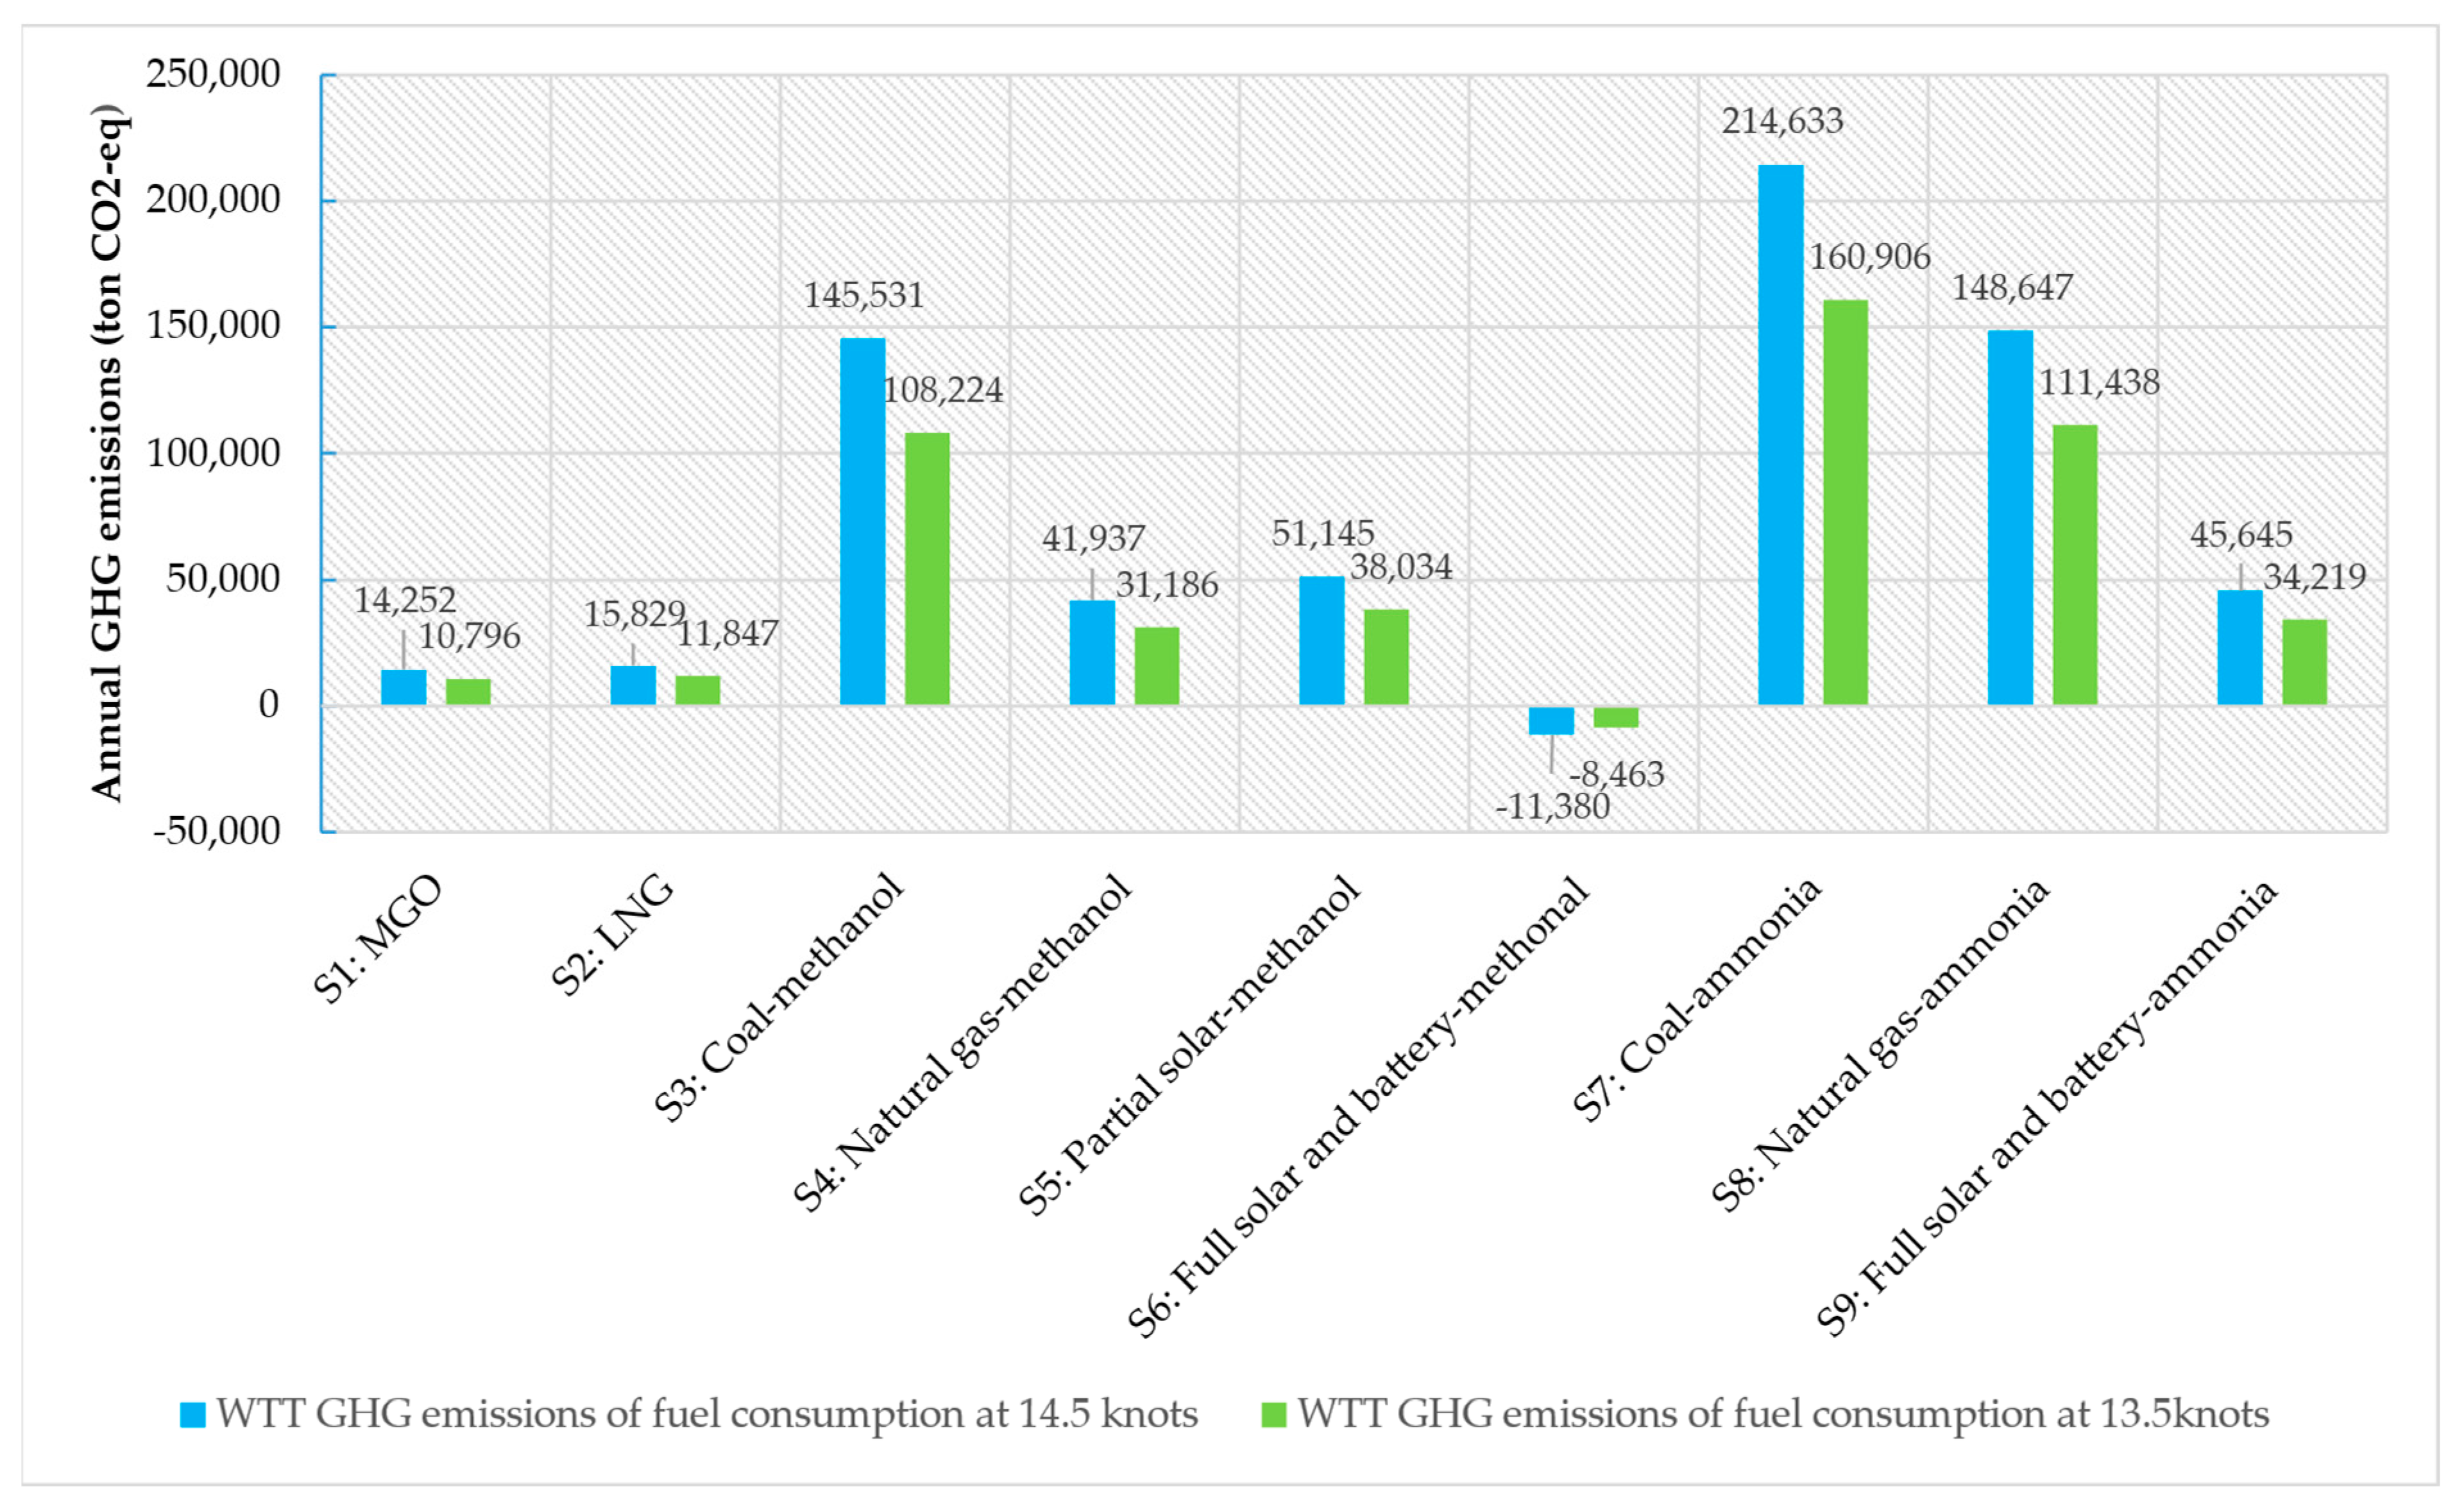
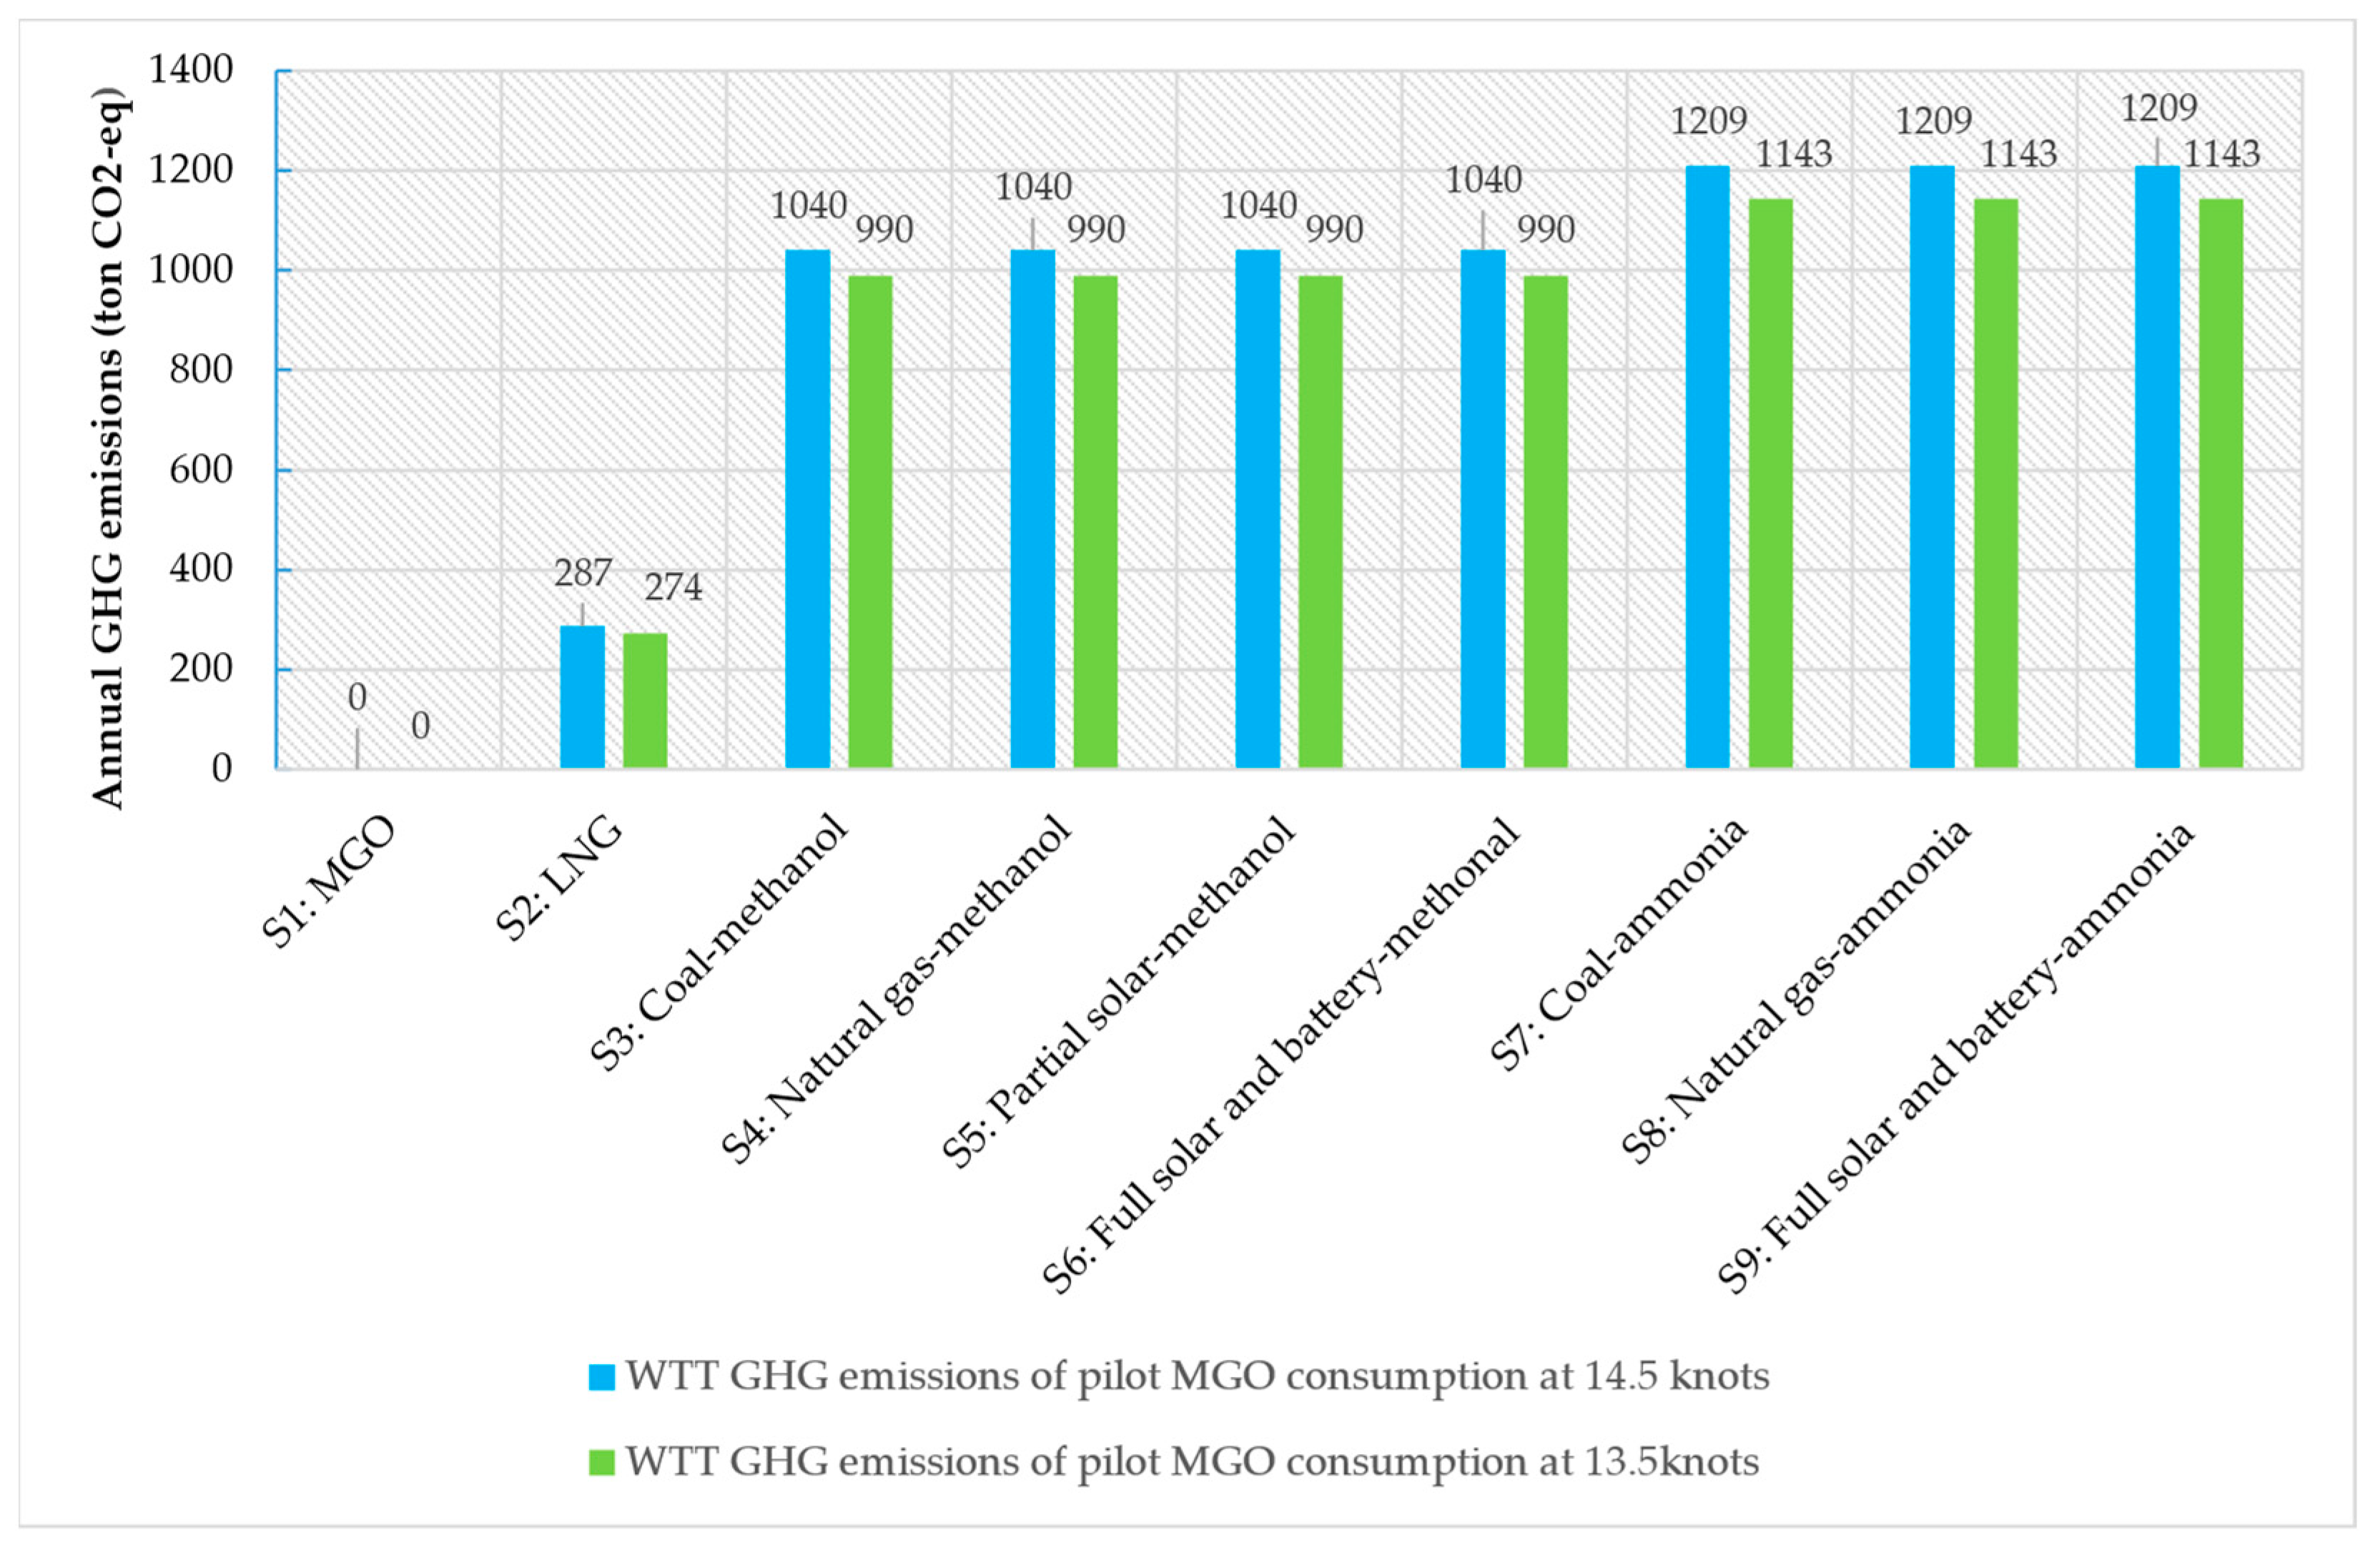
3.1. Well-to-Tank Emissions

Figure 4 presents the annual WTT GHG emission results of subsystems S1–9. The WTT GHG emissions of fossil energy-based methanol and ammonia were significantly higher than those of fossil fuels, MGO, and LNG. Methanol emissions based on partial solar energy were also not competitive. Only methanol produced using a full solar and battery process had obvious advantages as its production process absorbed CO2 as a feedstock and led to net negative emissions.
Figure 5 presents the annual WTT GHG emissions of pilot fuel consumptions for the subsystems.
The WTT GHG emission calculation sheet is attached in Table S1 in the Supplementary Materials available online.

3.2. Tank-to-Wake Emissions

Figure 6 presents the annual TTW GHG emission results of the VLCC. First, the emission reduction effect of reducing speed was noticeable. Taking MGO for example, when the ship sailed at an economical speed of 13.5 knots, it reduced emissions by 24.26% compared to when it sailed at a service speed of 14.5 knots. Using alternative fuels shows varying degrees of advantages compared to MGO. At the speed of 14.5 knots, using LNG could reduce emissions by 24.73%, using methanol could reduce emissions by 7.94%, and using ammonia could reduce emissions by 73.68%. At the speed of 13.5 knots, using LNG could reduce emissions by 24.57%, using methanol could reduce emissions by 7.60%, and using ammonia could reduce emissions by 70.06%.
The TTW GHG emission calculation sheet is attached in Table S2 in the Supplementary Materials available online.

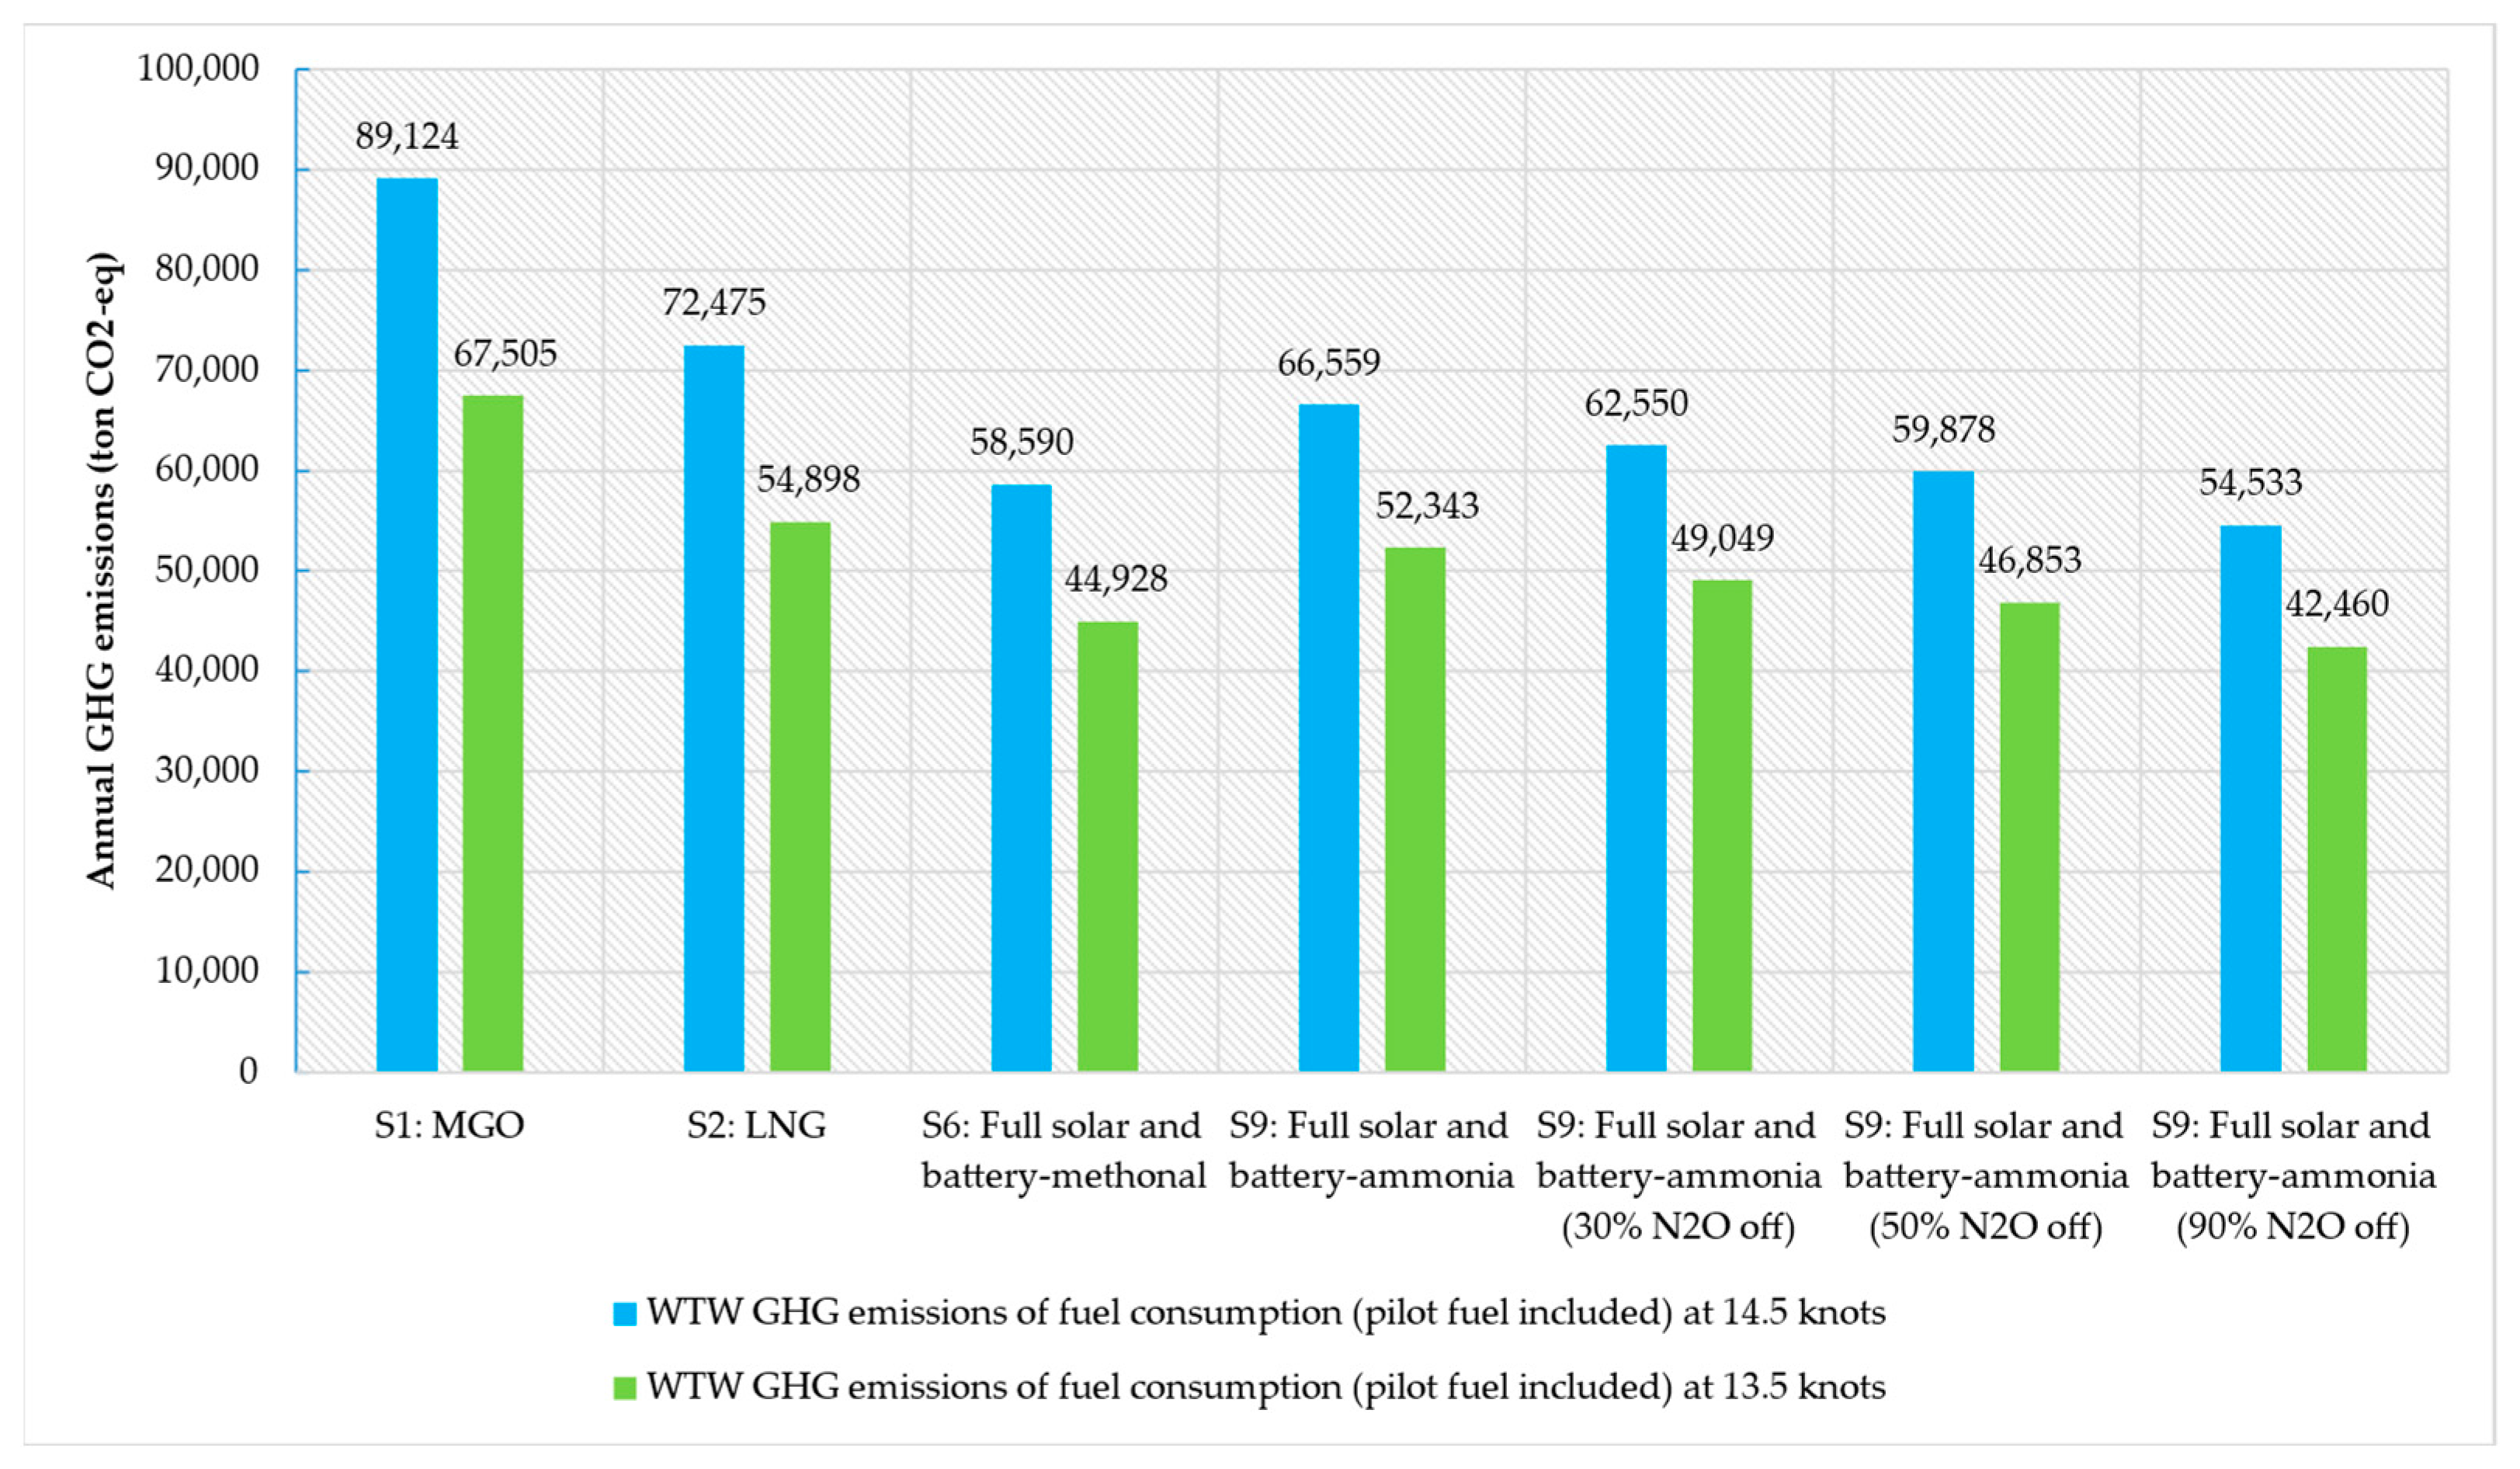
3.3. Well-to-Wake Emissions

Figure 7 presents the annual WTW GHG emission results of the VLCC. Fossil fuel-based methanol (S3 and S5) and ammonia (S7 and S8), and partial solar-based methanol (S5) had no emissions reduction effect. Compared with MGO, under the service speed of 14.5 knots, using LNG could reduce emissions by 18.68%; using full solar and battery-based methanol could reduce emissions by 34.26%; using full solar and battery-based ammonia could reduce emissions by 25.32%. Under the economical speed of 13.5 knots, using LNG could reduce emissions by 18.68%; using full solar and battery-based methanol could reduce emissions by 33.44%; using full solar and battery-based ammonia could reduce emissions by 22.46%.
The WTW GHG emissions calculation sheet is attached in Table S3 in the Supplementary Materials available online.

4. Discussion

This section discusses the N2O emissions of ammonia engines and the emission reduction potentials of different fuels.

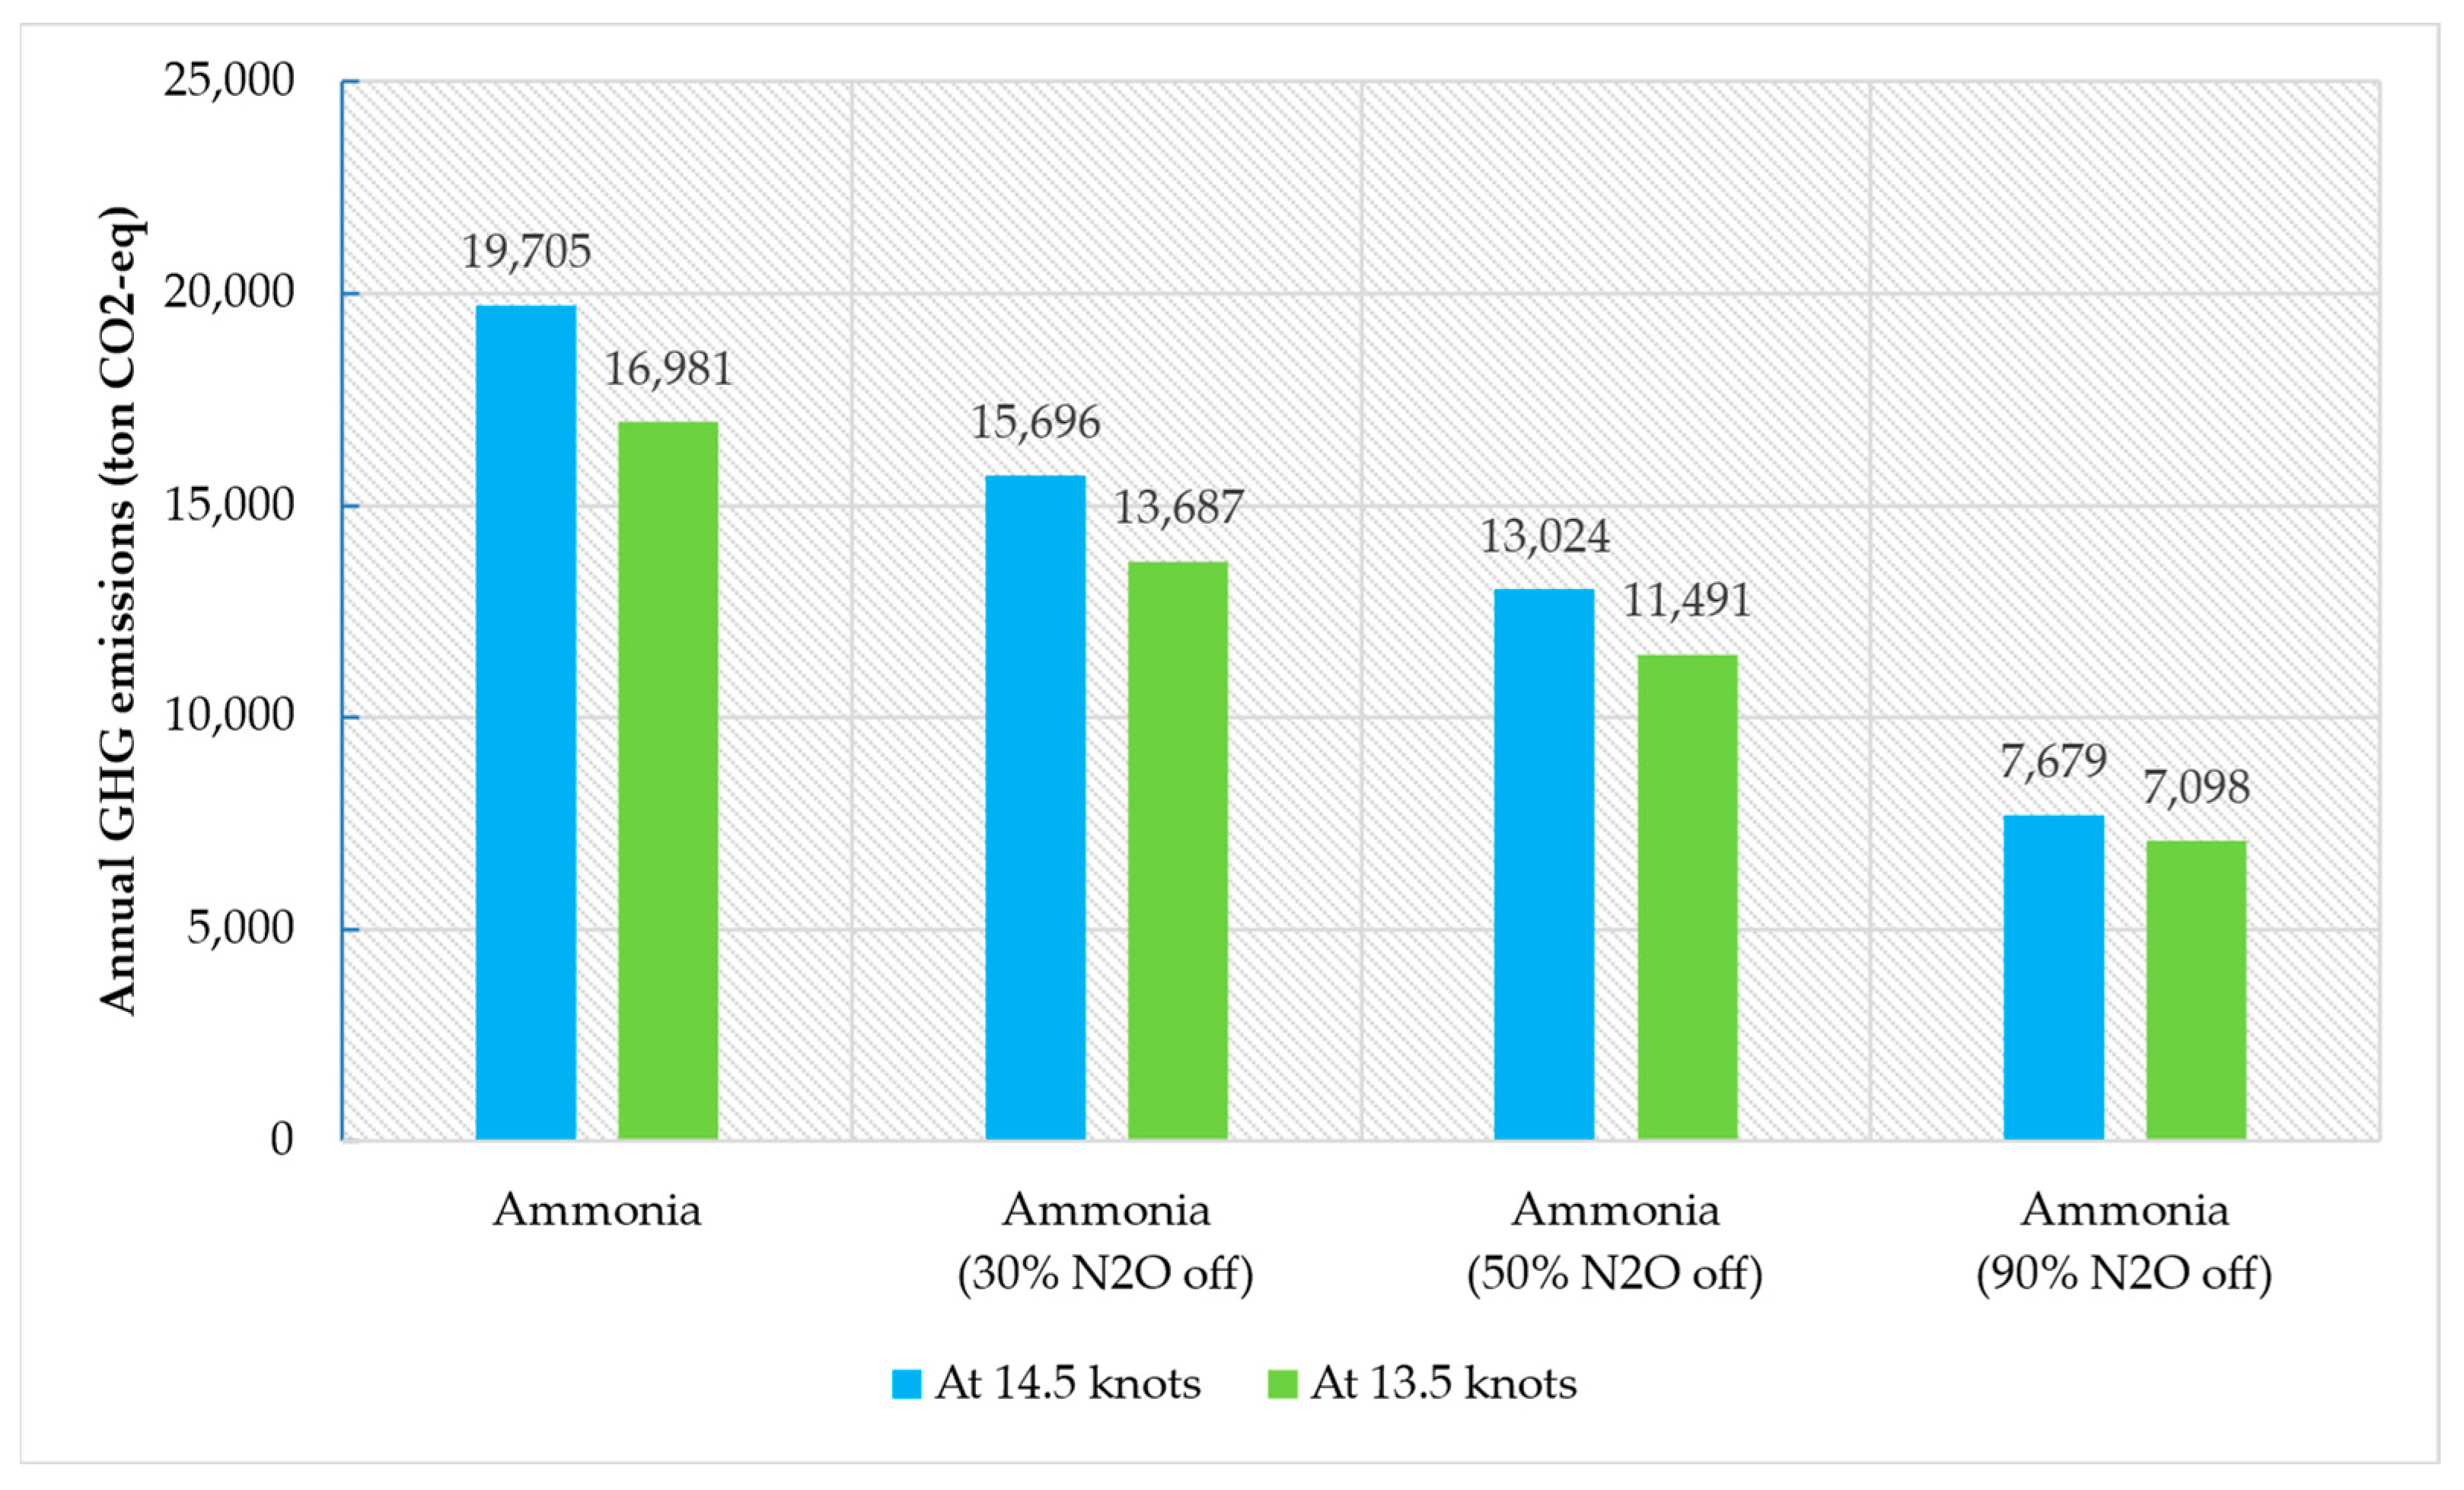
4.1. N2O Emission Abatement from Ammonia Fuelled Engines

The only primary GHG emission from ammonia-fuelled engines is N2O. However, it could be captured using after-treatment systems on ships, which the engine manufacturer has been working on [40]. This subsection assumed three N2O emission abatement scenarios to study their sensitivity to the VLCC’s TTW and WTW GHG emissions. The three scenarios were: (1) 30% N2O was removed; (2) 50% N2O was removed; (3) 90% N2O was removed. The TTW and WTW results are illustrated in Figure 8 and Figure 9, respectively.
Compared with emissions without N2O abatement measures, under the service speed of 14.5 knots, 20.35% of TTW emissions could be reduced for the 30%-N2O-off scenario, 33.91% for the 50%-N2O-off scenario, and 61.03% for the 90%-N2O-off scenario. Under the economical speed of 13.5 knots, 19.40% of TTW emissions could be reduced for the 30%-N2O-off scenario, 32.33% for the 50%-N2O-off scenario, and 58.20% for the 90%-N2O-off scenario.
Figure 9 considers all scenarios with emission reduction advantages over MGO. Compared with MGO, under the service speed of 14.5 knots, using ammonia with 30%-N2O-off measures could reduce the WTW GHG emissions by 29.82%, 32.81% for the 50%-N2O-off scenario, and 38.81% for the 90%-N2O-off scenario. Under the economical speed of 13.5 knots, by 27.34% for the 30%-N2O-off scenario, 30.59% for the 50%-N2O-off scenario, and 37.10% for the 90%-N2O-off scenario.
The calculation sheet considering N2O abatements can be found in Tables S2 and S3 in the Supplemental Materials available online.

4.2. GHG Emission Reduction Potential

According to the results, even full solar and battery-based methanol and ammonia have limited advantages over LNG in terms of total annual WTW GHG emissions. There were two main reasons for this:
  • Solar PV cannot generate electricity at night; thus, electricity supply for fuel production relies on the electricity generated during the day stored in the battery system. The GHG emissions from battery manufacturing were also included in the total emissions of the fuel production process. This led to the conclusion that the emissions from the full solar and battery-based methanol and ammonia production were higher than expected.
  • The calorific value of these low-carbon fuels was relatively low, resulting in more significant annual fuel consumption, which led to higher emissions.
Methanol and ammonia production will achieve ideal emission effects provided the electricity grid providing energy for fuel production processes is fully based on renewable energy. However, forming a fully green grid is still challenging [41]. The combined use of solar and wind energy can also achieve emission-free production of methanol and ammonia; however, this is only applicable to areas with abundant wind and solar resources.

5. Conclusions

The life cycle GHG emissions when using different fuels, including MGO, LNG, methanol, and ammonia, on a VLCC navigating on the Middle East to China route were investigated. The study had the following main results:
  • The WTT GHG emissions of fossil energy-based methanol and ammonia were significantly higher than those of fossil fuels, MGO, and LNG. Partial solar-based methanol was also not competitive. Only full solar and battery-based methanol had apparent advantages.
  • The TTW GHG emissions of using alternative fuels showed varying degrees of advantages compared to MGO. The emission reduction effect of ammonia was the most significant, followed by LNG and methanol.
  • From a WTW perspective, fossil fuel-based methanol and ammonia and partial solar-based methanol had no emissions reduction effects. Compared to MGO, full solar and battery-based methanol was the optimal option, followed by full solar and battery-based ammonia and LNG. However, if the N2O emitted from the ammonia engine was disposed of, then using full solar and battery-based ammonia with 90%-N2O-off after-treatment technology would be preferable to using full solar and battery-based methanol.
  • Within the scope considered in this paper, compared to MGO, the ranking of the WTW GHG emission reduction effect of alternative fuels was as follows: full solar and battery-based ammonia with 90%-N2O-off, full solar and battery-based methanol, full solar and battery-based ammonia with 50%-N2O-off, full solar and battery-based ammonia with 30%-N2O-off, full solar and battery-based ammonia without N2O-off, and LNG.
The main scientific findings can be summarised as follows:
  • Pilot fossil fuels are required in current internal combustion engines, therefore, even using zero-carbon fuels, ships cannot achieve zero GHG emissions.
  • Under ideal conditions, solar-based hydrogen-to-methanol could be approximately carbon-neutral over the entire life cycle. In fact, due to the discontinuity of solar power generation, lithium batteries are needed to store electricity. The GHG emissions of lithium batteries in the production process were included in the produced methanol, which makes the use of methanol as a marine fuel unable to achieve carbon neutrality. In the future, with the formation of a green power grid and the combined application of various renewable energy sources, the emission reduction potential of methanol could be further explored.
  • Slowing the ship’s speed had a significant emission reduction effect.
The findings of this research fill a gap in the literature regarding life cycle GHG emission assessment for VLCCs. However, due to the limitation of available data, the types of alternative fuels discussed in this paper were limited; for example, bio-LNG, hydrogen-based synthetic LNG, and biomass-based methanol were not included in this work. In future studies, the above fuels need to be considered.
This research was conducted to provide a clear image of applying the LCA GHG emission assessment to choosing suitable fuels for deep-sea ships. With the help of existing fuel production and transport data and ships’ actual operational data, using the LCA method could potentially provide a solid basis for fuel selection.
It is worth noting that different production pathways for fuels have divergent effects on GHG emissions. Therefore, care must be taken when considering ships’ GHG emissions reported in the literature because fuel supply chains’ definitions are various.

Supplementary Materials

The following are available online at https://www.mdpi.com/article/10.3390/jmse10121969/s1. Table S1: WTT GHG emission calculation sheet; Table S2: TTW GHG emission calculation sheet; Table S3: WTW GHG emission calculation sheet.

Author Contributions

Conceptualization, J.H., H.F. and X.X.; methodology, J.H., H.F. and X.X.; validation, J.H., H.F., X.X. and Z.L.; formal analysis, J.H. and H.F.; resources, J.H. and H.F.; data curation, J.H. and H.F.; writing—original draft preparation, J.H. and H.F.; writing—review and editing, J.H., H.F., X.X. and Z.L.; project administration, J.H. and H.F. All authors have read and agreed to the published version of the manuscript.

Funding

This research received no external funding.

Institutional Review Board Statement

Not applicable.

Informed Consent Statement

Not applicable.

Data Availability Statement

Not applicable.

Conflicts of Interest

The authors declare no conflict of interest.

Abbreviations

AEAuxiliary engine
CH4Methane
CIICarbon Intensity Indicator
CO2Carbon dioxide
CO2-eqCarbon dioxide equivalent
DWTDeadweight tonnage
EEDIEnergy Efficiency Design Index
EEXIEnergy Efficiency Existing Ship Index
GHGGreenhouse gas
IMOThe International Maritime Organization
LCALife cycle assessment
LCILife cycle inventory analysis
LCIALife cycle impact assessment
LHVLower heating value
LNGLiquified natural gas
MCRMaximum continuous rating
MEMain engine
MEPCMarine environment protection committee
MGOMarine gasoil
N2ONitrous oxide
PVPhotovoltaic
SFCSpecific fuel consumption
SMCRSpecified maximum continuous rating
SPOCSpecific pilot oil consumption
TTWTank-to-wake
VLCCVery large crude carrier
WTTWell-to-tank
WTWWell-to-wake

References

  1. IMO. Reduction of GHG Emissions from Ships—Fourth IMO GHG Study 2020—Final Report; IMO MEPC: London, UK, 2020.
  2. IMO. Guidelines on the Method of Calculation of the Attained Energy Efficiency Design Index (EEDI) for New Ships; IMO: London, UK, 2018.
  3. IPCC. Climate Change 2021: The Physical Science Basis; Cambridge University Press: Cambridge, UK, 2021. [Google Scholar]
  4. ABS. News Brief: MEPC 78; ABS: Houston, TX, USA, 2022. [Google Scholar]
  5. Al-Enazi, A.; Okonkwo, E.C.; Bicer, Y.; Al-Ansari, T. A review of cleaner alternative fuels for maritime transportation. Energy Rep. 2021, 7, 1962–1985. [Google Scholar] [CrossRef]
  6. Mallouppas, G.; Yfantis, E.A. Decarbonization in Shipping Industry: A Review of Research, Technology Development, and Innovation Proposals. J. Mar. Sci. Eng. 2021, 9, 415. [Google Scholar] [CrossRef]
  7. Schuller, O.; Kupferschmid, S.; Hengstler, J.; Whitehouse, S. 2nd Life Cycle GHG Emission Study on the Use of LNG as Marine Fuel; Sphera: Leinfelden-Echterdingen, Germany, 2021. [Google Scholar]
  8. Wang, S.; Qi, J.; Laporte, G. Governmental subsidy plan modeling and optimization for liquefied natural gas as fuel for maritime transportation. Transp. Res. Part B Methodol. 2022, 155, 304–321. [Google Scholar] [CrossRef]
  9. Lagemann, B.; Lindstad, E.; Fagerholt, K.; Rialland, A.; Ove Erikstad, S. Optimal ship lifetime fuel and power system selection. Transp. Res. Part D Transp. Environ. 2022, 102, 103145. [Google Scholar] [CrossRef]
  10. SEA\LNG. LNG—A Fuel in Transition. Available online: https://sea-lng.org/wp-content/uploads/2022/03/LNG-2022_A-view-from-the-bridge_.pdf (accessed on 10 January 2022).
  11. Fan, H.; Enshaei, H.; Jayasinghe, S.G. Formation of Dataset for Fuzzy Quantitative Risk Assessment of LNG Bunkering SIMOPs. Data 2022, 7, 60. [Google Scholar] [CrossRef]
  12. Brynolf, S.; Fridell, E.; Andersson, K. Environmental assessment of marine fuels: Liquefied natural gas, liquefied biogas, methanol and bio-methanol. J. Clean. Prod. 2014, 74, 86–95. [Google Scholar] [CrossRef]
  13. Fan, H.; Enshaei, H.; Jayasinghe, S.G.; Tan, S.H.; Zhang, C. Quantitative risk assessment for ammonia ship-to-ship bunkering based on Bayesian network. Process Saf. Prog. 2022, 41, 395–410. [Google Scholar] [CrossRef]
  14. Mandra, J.O. Clarksons: There Are 130 Ammonia-Ready and 6 Hydrogen-Ready Vessels On Order. Available online: https://www.offshore-energy.biz/clarksons-there-are-130-ammonia-ready-and-6-hydrogen-ready-vessels-on-order/ (accessed on 21 October 2022).
  15. Grzelakowski, A.S.; Herdzik, J.; Skiba, S. Maritime Shipping Decarbonization: Roadmap to Meet Zero-Emission Target in Shipping as a Link in the Global Supply Chains. Energies 2022, 15, 6150. [Google Scholar] [CrossRef]
  16. IMO. MEPC 76/7/4 Draft Guidelines on the Method of Calculation of the Attained Energy Efficiency Exist-Ing Ship Index (EEXI); IMO: London, UK, 2021.
  17. IMO. Resolution MEPC.281(70) Amendments to the 2014 Guidelines on the Method of Calculation of the Attained Energy Effi-Ciency Design Index (EEDI) for New Ships (Resolution MEPC.245(66), as Amended by Resolution MEPC.263(68)); IMO: London, UK, 2016.
  18. IMO. Resolution MEPC.336(76)—2021 Guidelines on Operational Carbon Intensity Indicators and the Calculation Methods (CII Guidelines, G1); IMO: London, UK, 2021.
  19. The IMO. Intersessional Working Group on Reduction of GHG Emissions from Ships (ISWG-GHG 9), 15–17 September 2021. Available online: https://www.imo.org/en/MediaCentre/MeetingSummaries/Pages/ISWG-GHG-9.aspx (accessed on 21 October 2022).
  20. Gilbert, P.; Walsh, C.; Traut, M.; Kesieme, U.; Pazouki, K.; Murphy, A. Assessment of full life-cycle air emissions of alternative shipping fuels. J. Clean. Prod. 2018, 172, 855–866. [Google Scholar] [CrossRef]
  21. Law, L.C.; Foscoli, B.; Mastorakos, E.; Evans, S. A Comparison of Alternative Fuels for Shipping in Terms of Lifecycle Energy and Cost. Energies 2021, 14, 8502. [Google Scholar] [CrossRef]
  22. Kanchiralla, F.M.; Brynolf, S.; Malmgren, E.; Hansson, J.; Grahn, M. Life-Cycle Assessment and Costing of Fuels and Propulsion Systems in Future Fossil-Free Shipping. Environ. Sci. Technol. 2022, 56, 12517–12531. [Google Scholar] [CrossRef] [PubMed]
  23. Hwang, S.S.; Gil, S.J.; Lee, G.N.; Lee, J.W.; Park, H.; Jung, K.H.; Suh, S.B. Life Cycle Assessment of Alternative Ship Fuels for Coastal Ferry Operating in Republic of Korea. J. Mar. Sci. Eng. 2020, 8, 660. [Google Scholar] [CrossRef]
  24. Wang, H.; Boulougouris, E.; Theotokatos, G.; Zhou, P.; Priftis, A.; Shi, G. Life cycle analysis and cost assessment of a battery powered ferry. Ocean Eng. 2021, 241, 110029. [Google Scholar] [CrossRef]
  25. Chen, Z.S.; Lam, J.S.L. Life cycle assessment of diesel and hydrogen power systems in tugboats. Transp. Res. Part D Transp. Environ. 2022, 103, 103192. [Google Scholar] [CrossRef]
  26. Fernández-Ríos, A.; Santos, G.; Pinedo, J.; Santos, E.; Ruiz-Salmón, I.; Laso, J.; Lyne, A.; Ortiz, A.; Ortiz, I.; Irabien, Á.; et al. Environmental sustainability of alternative marine propulsion technologies powered by hydrogen—A life cycle assessment approach. Sci. Total Environ. 2022, 820, 153189. [Google Scholar] [CrossRef]
  27. Wang, Y.; Maidment, H.; Boccolini, V.; Wright, L. Life cycle assessment of alternative marine fuels for super yacht. Reg. Stud. Mar. Sci. 2022, 55, 102525. [Google Scholar] [CrossRef]
  28. Seddiek, I.S.; Ammar, N.R. Carbon footprint and cost analysis of renewable hydrogen-fuelled ships. Ships Offshore Struct. 2022, 17, 1–10. [Google Scholar] [CrossRef]
  29. Lee, G.N.; Kim, J.M.; Jung, K.H.; Park, H.; Jang, H.S.; Lee, C.S.; Lee, J.W. Environmental Life-Cycle Assessment of Eco-Friendly Alternative Ship Fuels (MGO, LNG, and Hydrogen) for 170 GT Nearshore Ferry. J. Mar. Sci. Eng. 2022, 10, 755. [Google Scholar] [CrossRef]
  30. ISO. ISO 14040:2006 Environmental Management—Life Cycle Assessment—Principles and Framework; ISO: London, UK, 2006. [Google Scholar]
  31. Clemente, J. China Is The World’s Largest Oil & Gas Importer. Available online: https://www.forbes.com/sites/judeclemente/2019/10/17/china-is-the-worlds-largest-oil--gas-importer/?sh=462e73945441 (accessed on 23 October 2022).
  32. Zhu, R.; Wang, Z.; He, Y.; Zhu, Y.; Cen, K. LCA comparison analysis for two types of H2 carriers: Methanol and ammonia. Int. J. Energy Res. 2022, 46, 11818–11833. [Google Scholar] [CrossRef]
  33. IPCC. Climate Change 2014: Synthesis Report. Contribution of Working Groups I, II and III to the Fifth Assessment Report of the Intergovernmental Panel on Climate Change; IPCC: Geneva, Switzerland, 2014. [Google Scholar]
  34. Nizami, M.; Slamet; Purwanto, W.W. Solar PV based power-to-methanol via direct CO2 hydrogenation and H2O electrolysis: Techno-economic and environmental assessment. J. CO2 Util. 2022, 65, 102253. [Google Scholar] [CrossRef]
  35. Sun, X.; Tian, Z.; Malekian, R.; Li, Z. Estimation of Vessel Emissions Inventory in Qingdao Port Based on Big data Analysis. Symmetry 2018, 10, 452. [Google Scholar] [CrossRef] [Green Version]
  36. IMO. Rules For Vessels Navigating Through the Straits of Malacca and Singapore; IMO: London, UK, 1998.
  37. MAN Energy Solutions. CEAS Engine Calculations. Available online: https://www.man-es.com/marine/products/planning-tools-and-downloads/ceas-engine-calculations (accessed on 15 October 2022).
  38. Lindstrand, N. MAN Energy Solutions is developing a Fuel-Flexible, Two-Stroke Ammonia Engine as a Key Technology in the Maritime Energy Transition. Available online: https://www.man-es.com/discover/two-stroke-ammonia-engine (accessed on 2 November 2022).
  39. Atchison, J. WinGD to Develop Ammonia Maritime Engines by 2025. Available online: https://www.ammoniaenergy.org/articles/wingd-to-develop-ammonia-maritime-engines-by-2025/ (accessed on 2 November 2022).
  40. Laursen, R.S. Ship Operation Using LPG and Ammonia As Fuel on MAN B&W Dual Fuel ME-LGIP Engines. Available online: https://nh3fuelassociation.org/wp-content/uploads/2018/12/0900-Ammonia_vision-Rene-Sejer-Laursen-MAN.pdf (accessed on 2 November 2022).
  41. IEA. World Energy Outlook 2022. Available online: https://www.iea.org/reports/world-energy-outlook-2022 (accessed on 1 November 2022).
Figure 1. Side view of the VLCC.
Jmse 10 01969 g001
Figure 2. Shipping route and bunkering site.
Jmse 10 01969 g002
Figure 3. Supply chains of the fuels.
Jmse 10 01969 g003
Figure 4. Annual WTT GHG emissions based on annual fuel consumption.
Jmse 10 01969 g004
Figure 5. Annual WTT GHG emissions of annual pilot MGO consumption.
Jmse 10 01969 g005
Figure 6. Annual TTW GHG emissions based on annual fuel consumption.
Jmse 10 01969 g006
Figure 7. Annual WTW GHG emissions based on annual fuel consumption.
Jmse 10 01969 g007
Figure 8. Annual TTW GHG emissions of using ammonia considering N2O abatements.
Jmse 10 01969 g008
Figure 9. Comparison of annual WTW GHG emissions considering N2O abatements of using ammonia.
Jmse 10 01969 g009
Table 1. Parameters of the VLCC.
ParameterValueUnit
Maximum deadweight tonnage (DWT)310,000tons
Length between perpendiculars333.0m
Moulded breadth60.0m
Depth30.0m
Design draft20.5m
Scantling draft22.0m
Service speed14.5knots
Economical speed13.5knots
Main engine rated power22,000kW
Table 2. GHG emission data for WTT calculation (ton CO2-eq/ton fuel).
SubsystemProduction 1TransportBunkeringIn Total
S10.620.00150.62
S20.730.120.00150.85
S33.090.0690.00153.16
S40.840.0690.00150.91
S51.040.0690.00151.11
S6−0.32 20.0690.0015−0.25
S73.930.0690.00154.00
S82.70.0690.00152.77
S90.780.0690.00150.85
1 The data for S1 and S2 were taken from the literature [7]; The data for S3–5 and S7–9 were taken from the literature [32]. 2 The data for S6 were based on the literature [34]. The highest emission in this pathway was released from the lithium-ion battery production process. The CO2 captured has a negative value due to its inputted to the process. As a result, the net emission is a negative value (−0.016 kg CO2-eq/MJ methanol, which is equivalent to −0.32 tons of CO2-eq per ton of methanol).
Table 3. Data on the navigation conditions.
CruisingEntering and Leaving PortsAcross the Malacca StraitAt Ports
Speed
(Knots)
Time
(h)
Distance
(n.m.)
Speed
(Knots)
Time
(h)
Distance
(n.m.)
Speed
(Knots)
Time
(h)
Distance
(n.m.)
Loading Time
(h)
Unloading Time
(h)
Standby Time
(h)
At 14.5 knots14.5347502965301240482363678
ME Propulsion Power (kW)22,000550012,1000
AE Power (kW)14001600120016002000800
At 13.5 knots13.5373502965301240482363653
ME Propulsion Power (kW)15,400550012,1000
AE Power (kW)12001600120016002000800
Table 4. The ME’s fuel consumptions at the SMCR point.
MGOLNGMethanolAmmonia
ME Type7G80ME-C10.5-EGRTC7G80ME-C10.5-GI-EGRTC7G80ME-C10.5-LGIM-EGRTC7G80ME-C10.5-LGIA-EGRTC
At 14.5 knotsSMCR (kW)22,00022,00022,00022,000
SFC (g/kWh)159.3129318.9376.5
SPOC (g/kWh)03.210.6710.6
Fuel Consumption (kg/h)3505283870168283
Pilot Consumption (kg/h)0 70235233
At 13.5 knotsSMCR (kW)15,40015,40015,40015,400
SFC (g/kWh)153.2122.2299.6358.6
SPOC (g/kWh)04.0613.5313.4
Fuel Consumption (kg/h)2359188246145522
Pilot Consumption (kg/h)063208206
Note: SFC = Specific fuel consumption; SPOC = Specific pilot oil consumption.
Table 5. The AEs’ fuel consumptions.
MGOLNGMethanolAmmonia
At 14.5 knotsSMCR (kW)1400140014001400
SFC (g/kWh)187155.3395406
SPOC (g/kWh)02.62044
Fuel Consumption (kg/round trip)274,426227,935579,669595,812
Pilot Consumption (kg/round trip)0381629,35064,571
At 13.5 knotsSMCR (kW)1200120012001200
SFC (g/kWh)187155.3395406
SPOC (g/kWh)02.62044
Fuel Consumption (kg/round trip)252,533209,751533,426548,280
Pilot Consumption (kg/round trip)0351127,00959,420
Note: SFC = Specific fuel consumption; SPOC = Specific pilot oil consumption.
Table 6. Fuel consumption of ME and AEs.
SpeedConsumption (Ton/Year)MGOLNGMethanolAmmonia
At 14.5 knotsME Fuel 20,73616,76641,40548,881
ME Pilot MGO043114381428
AE Fuel 2195182346374766
AE Pilot MGO0 31235517
At 13.5 knotsME Fuel 15,35012,23429,97235,832
ME Pilot MGO041313771364
AE Fuel 2020167842674386
AE Pilot MGO028216475
Table 7. The CO2 equivalent emission factors (ton/ton fuel) of the engines.
EngineFuelCO2CH4CO2-eq (CH4)N2OCO2-eq (N2O)CO2-eq (Total)
Two-stroke low-speed Diesel cycle MEMGO3.216.53 × 10−51.83 × 10−32.22 × 10−45.88 × 10−23.27
LNG2.751.64 × 10−34.58 × 10−22.45 × 10−46.51 × 10−22.86
Methanol1.383.34 × 10−59.35 × 10−41.00 × 10−52.65 × 10−31.38
Ammonia0005.42 × 10−41.44 × 10−10.14
Four-stroke medium -speed Otto cycle AEMGO3.215.35 × 10−51.50 × 10−31.60 × 10−44.25 × 10−23.25
LNG2.753.54 × 10−29.92 × 10−11.29 × 10−43.41 × 10−23.78
Methanol1.382.53 × 10−57.09 × 10−47.59 × 10−62.01 × 10−31.38
Ammonia0005.02 × 10−31.331.33
Publisher’s Note: MDPI stays neutral with regard to jurisdictional claims in published maps and institutional affiliations.

