
Failure Rate Assessment for Onshore and Floating Offshore Wind Turbines

Abstract
:1. Introduction
- (i)
- A new operation dataset of wind turbines is opened, which is the most up-to-date and can better reflect the failure and maintenance properties of recent wind turbines and strengthen the database of the wind energy sector.
- (ii)
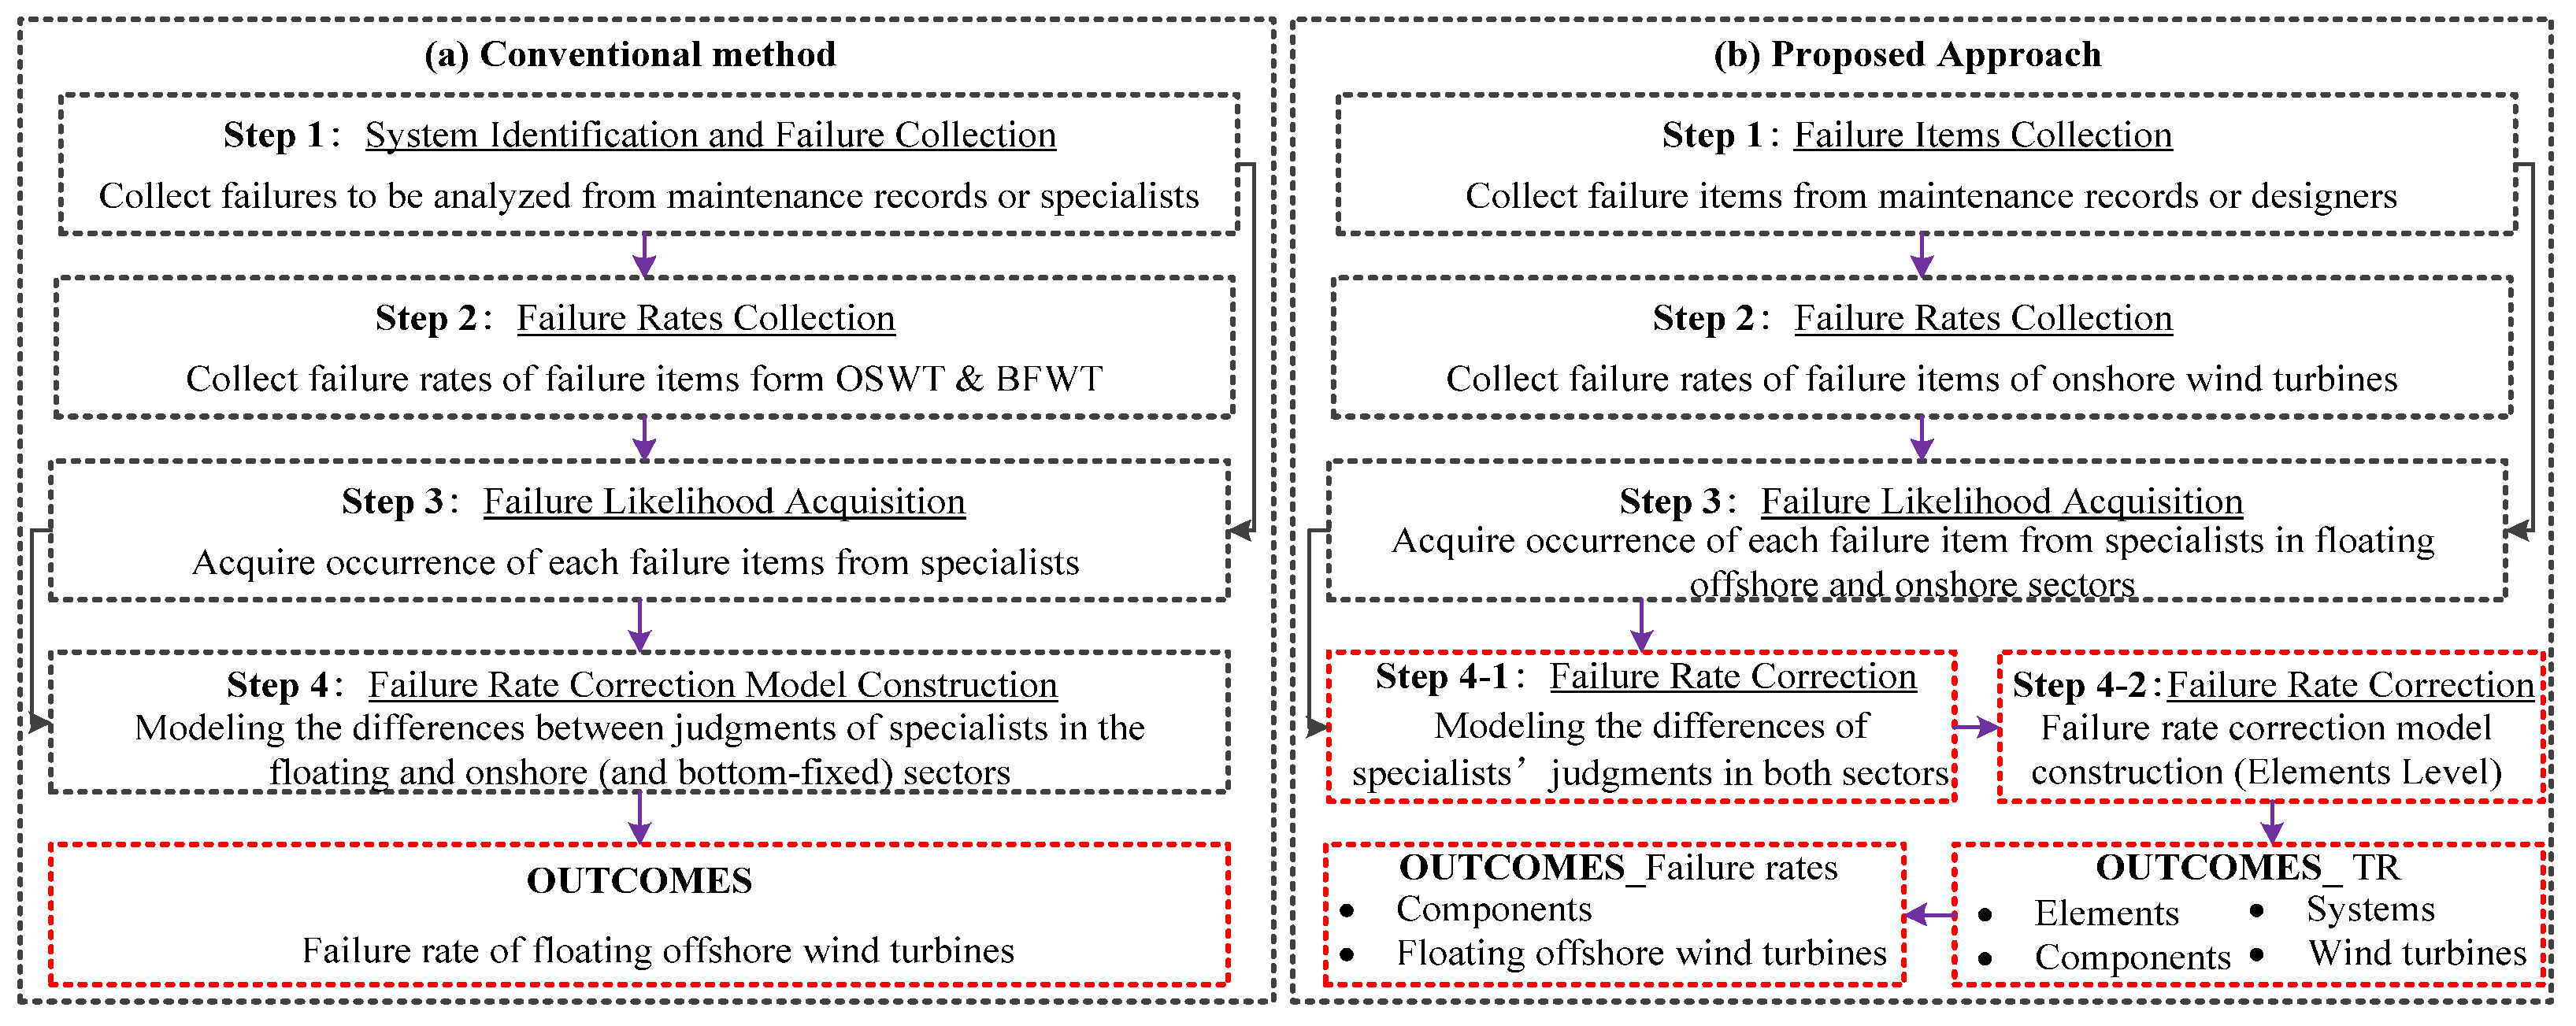
- A failure rate correction approach is proposed to transfer well-accumulated onshore wind turbines to supplement the insufficient operation data of the floating offshore wind sector. This extends the model in [33], in which the failure rate correction calculates a general indicator to reflect the overall differences between onshore and floating offshore wind turbines, and cannot reflect the discrepancies between each component. Meanwhile, in the present paper, the failure rate correction model is constructed using a bottom-up approach from elements to components until the wind turbine level is reached, to examine the failure rate differences of all the components.
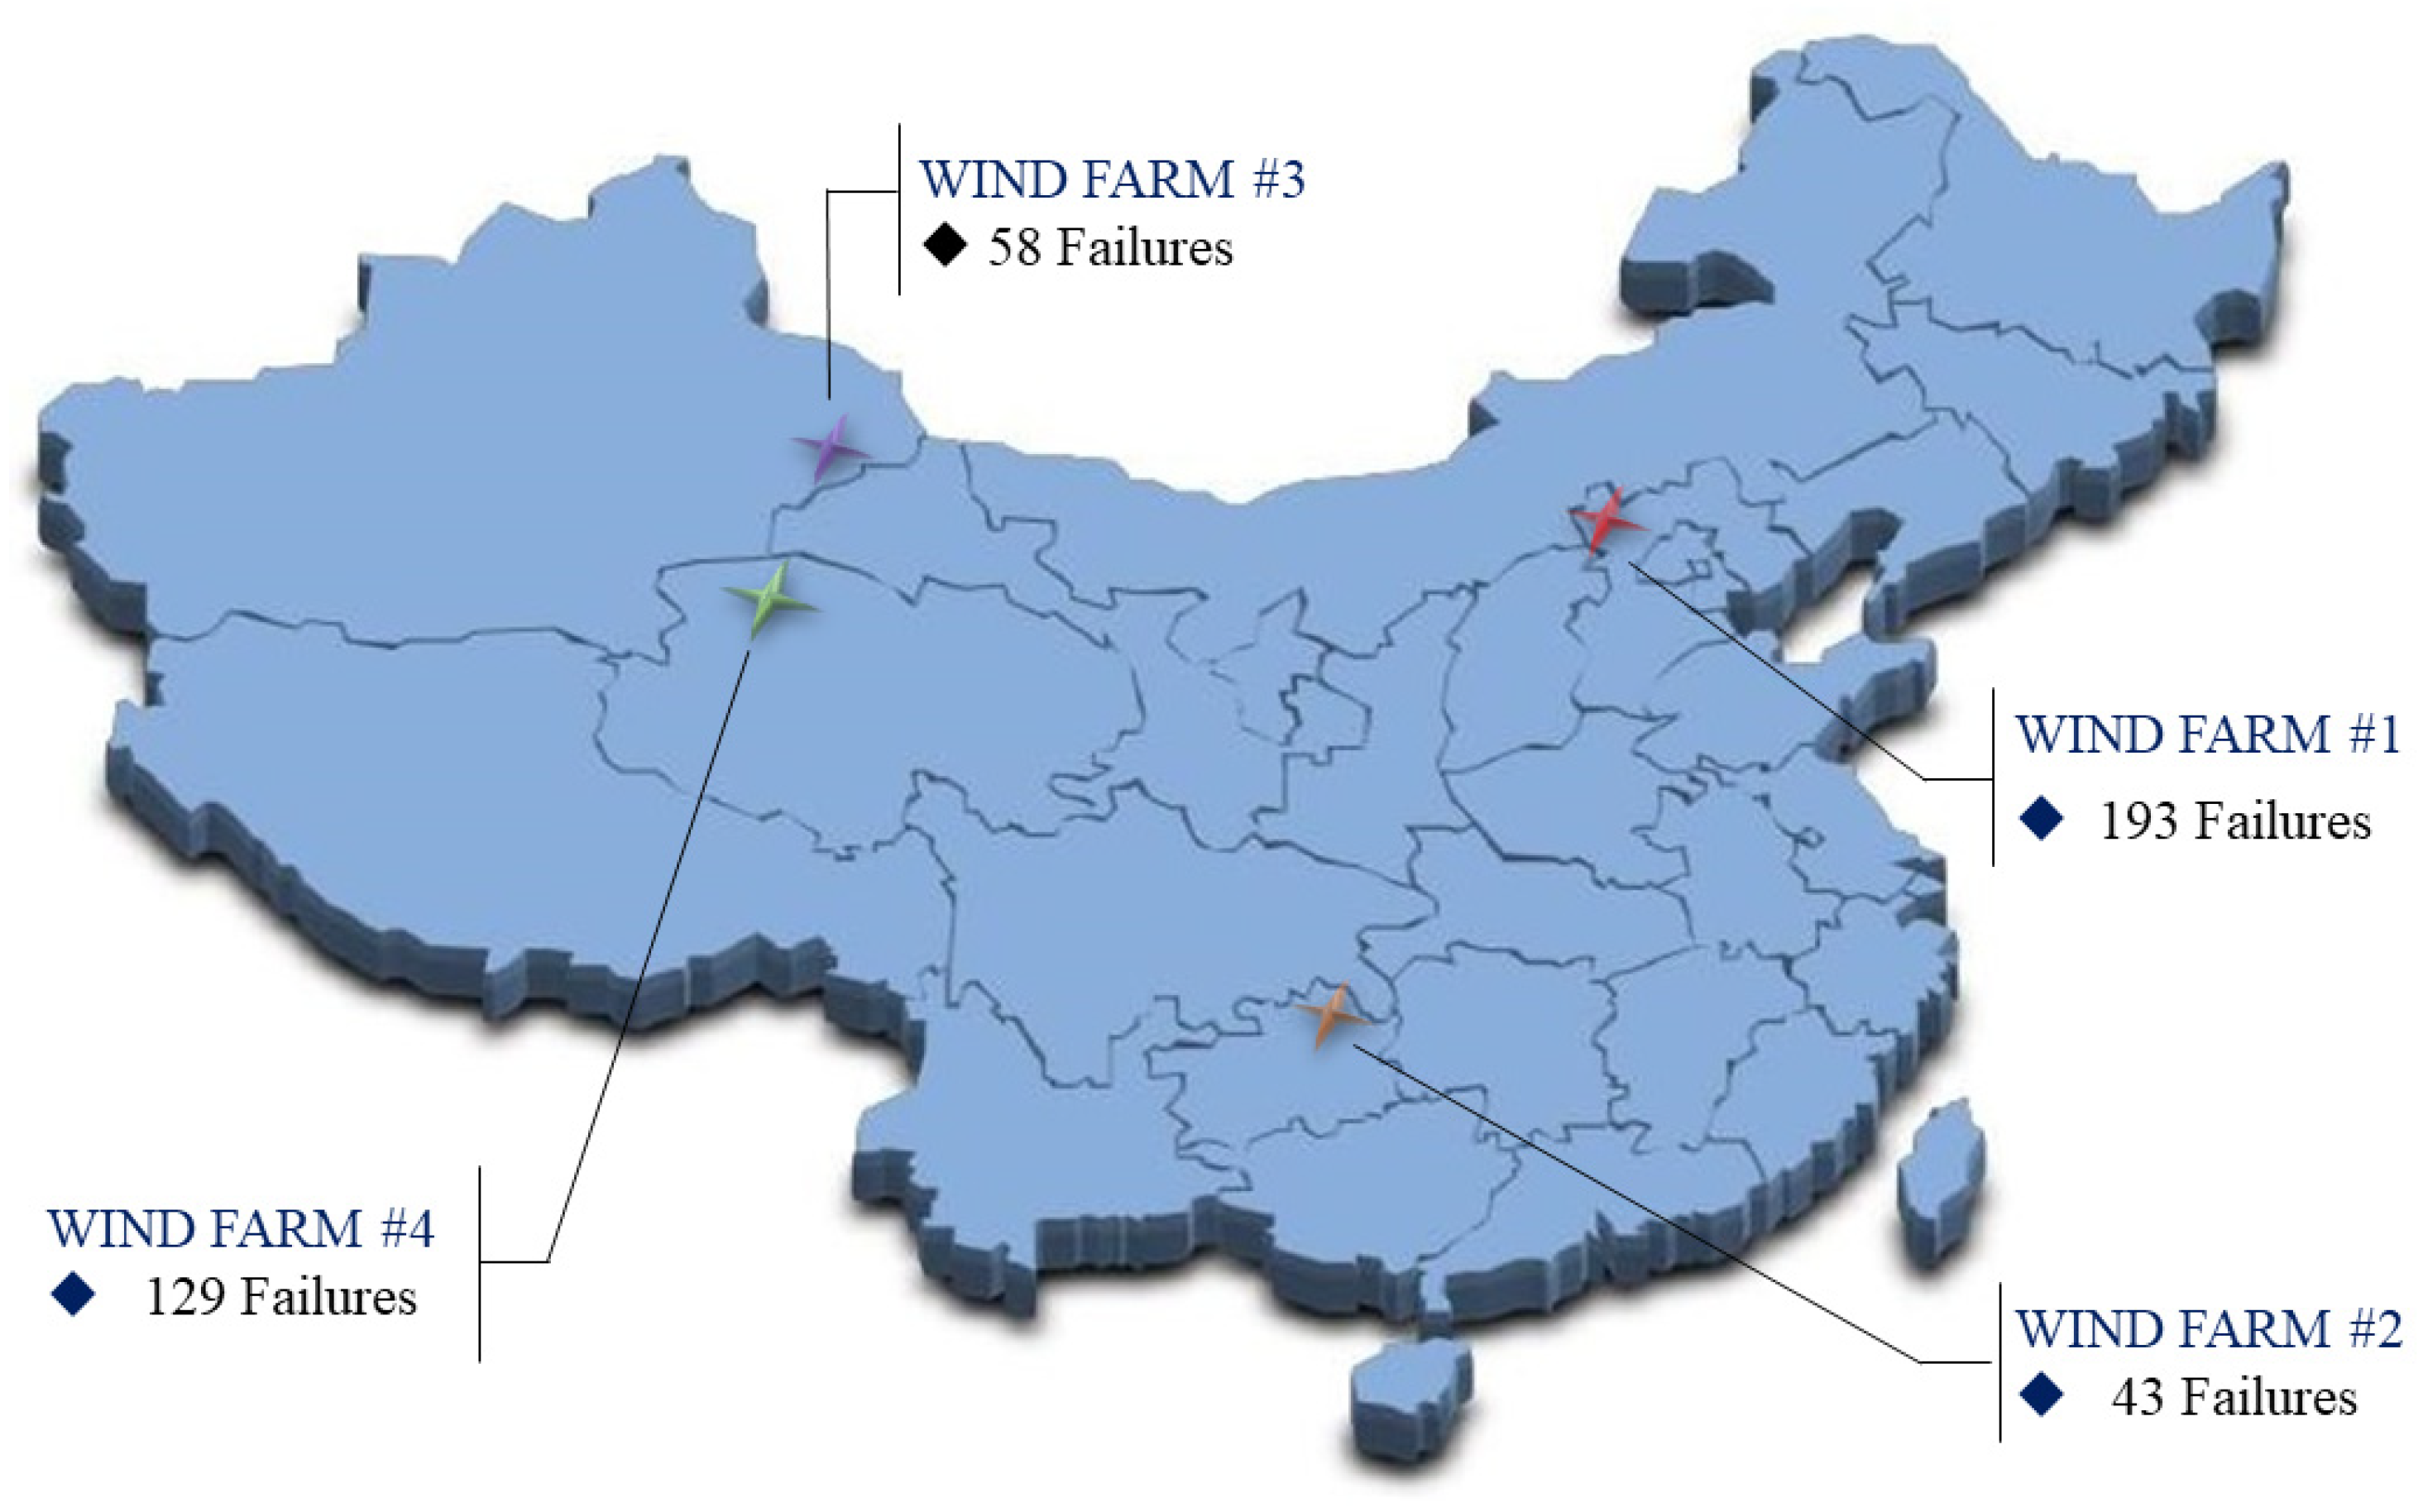
2. Features of the Dataset
3. Failure Data Analysis
3.1. Failure Definition
3.2. Failure Properties
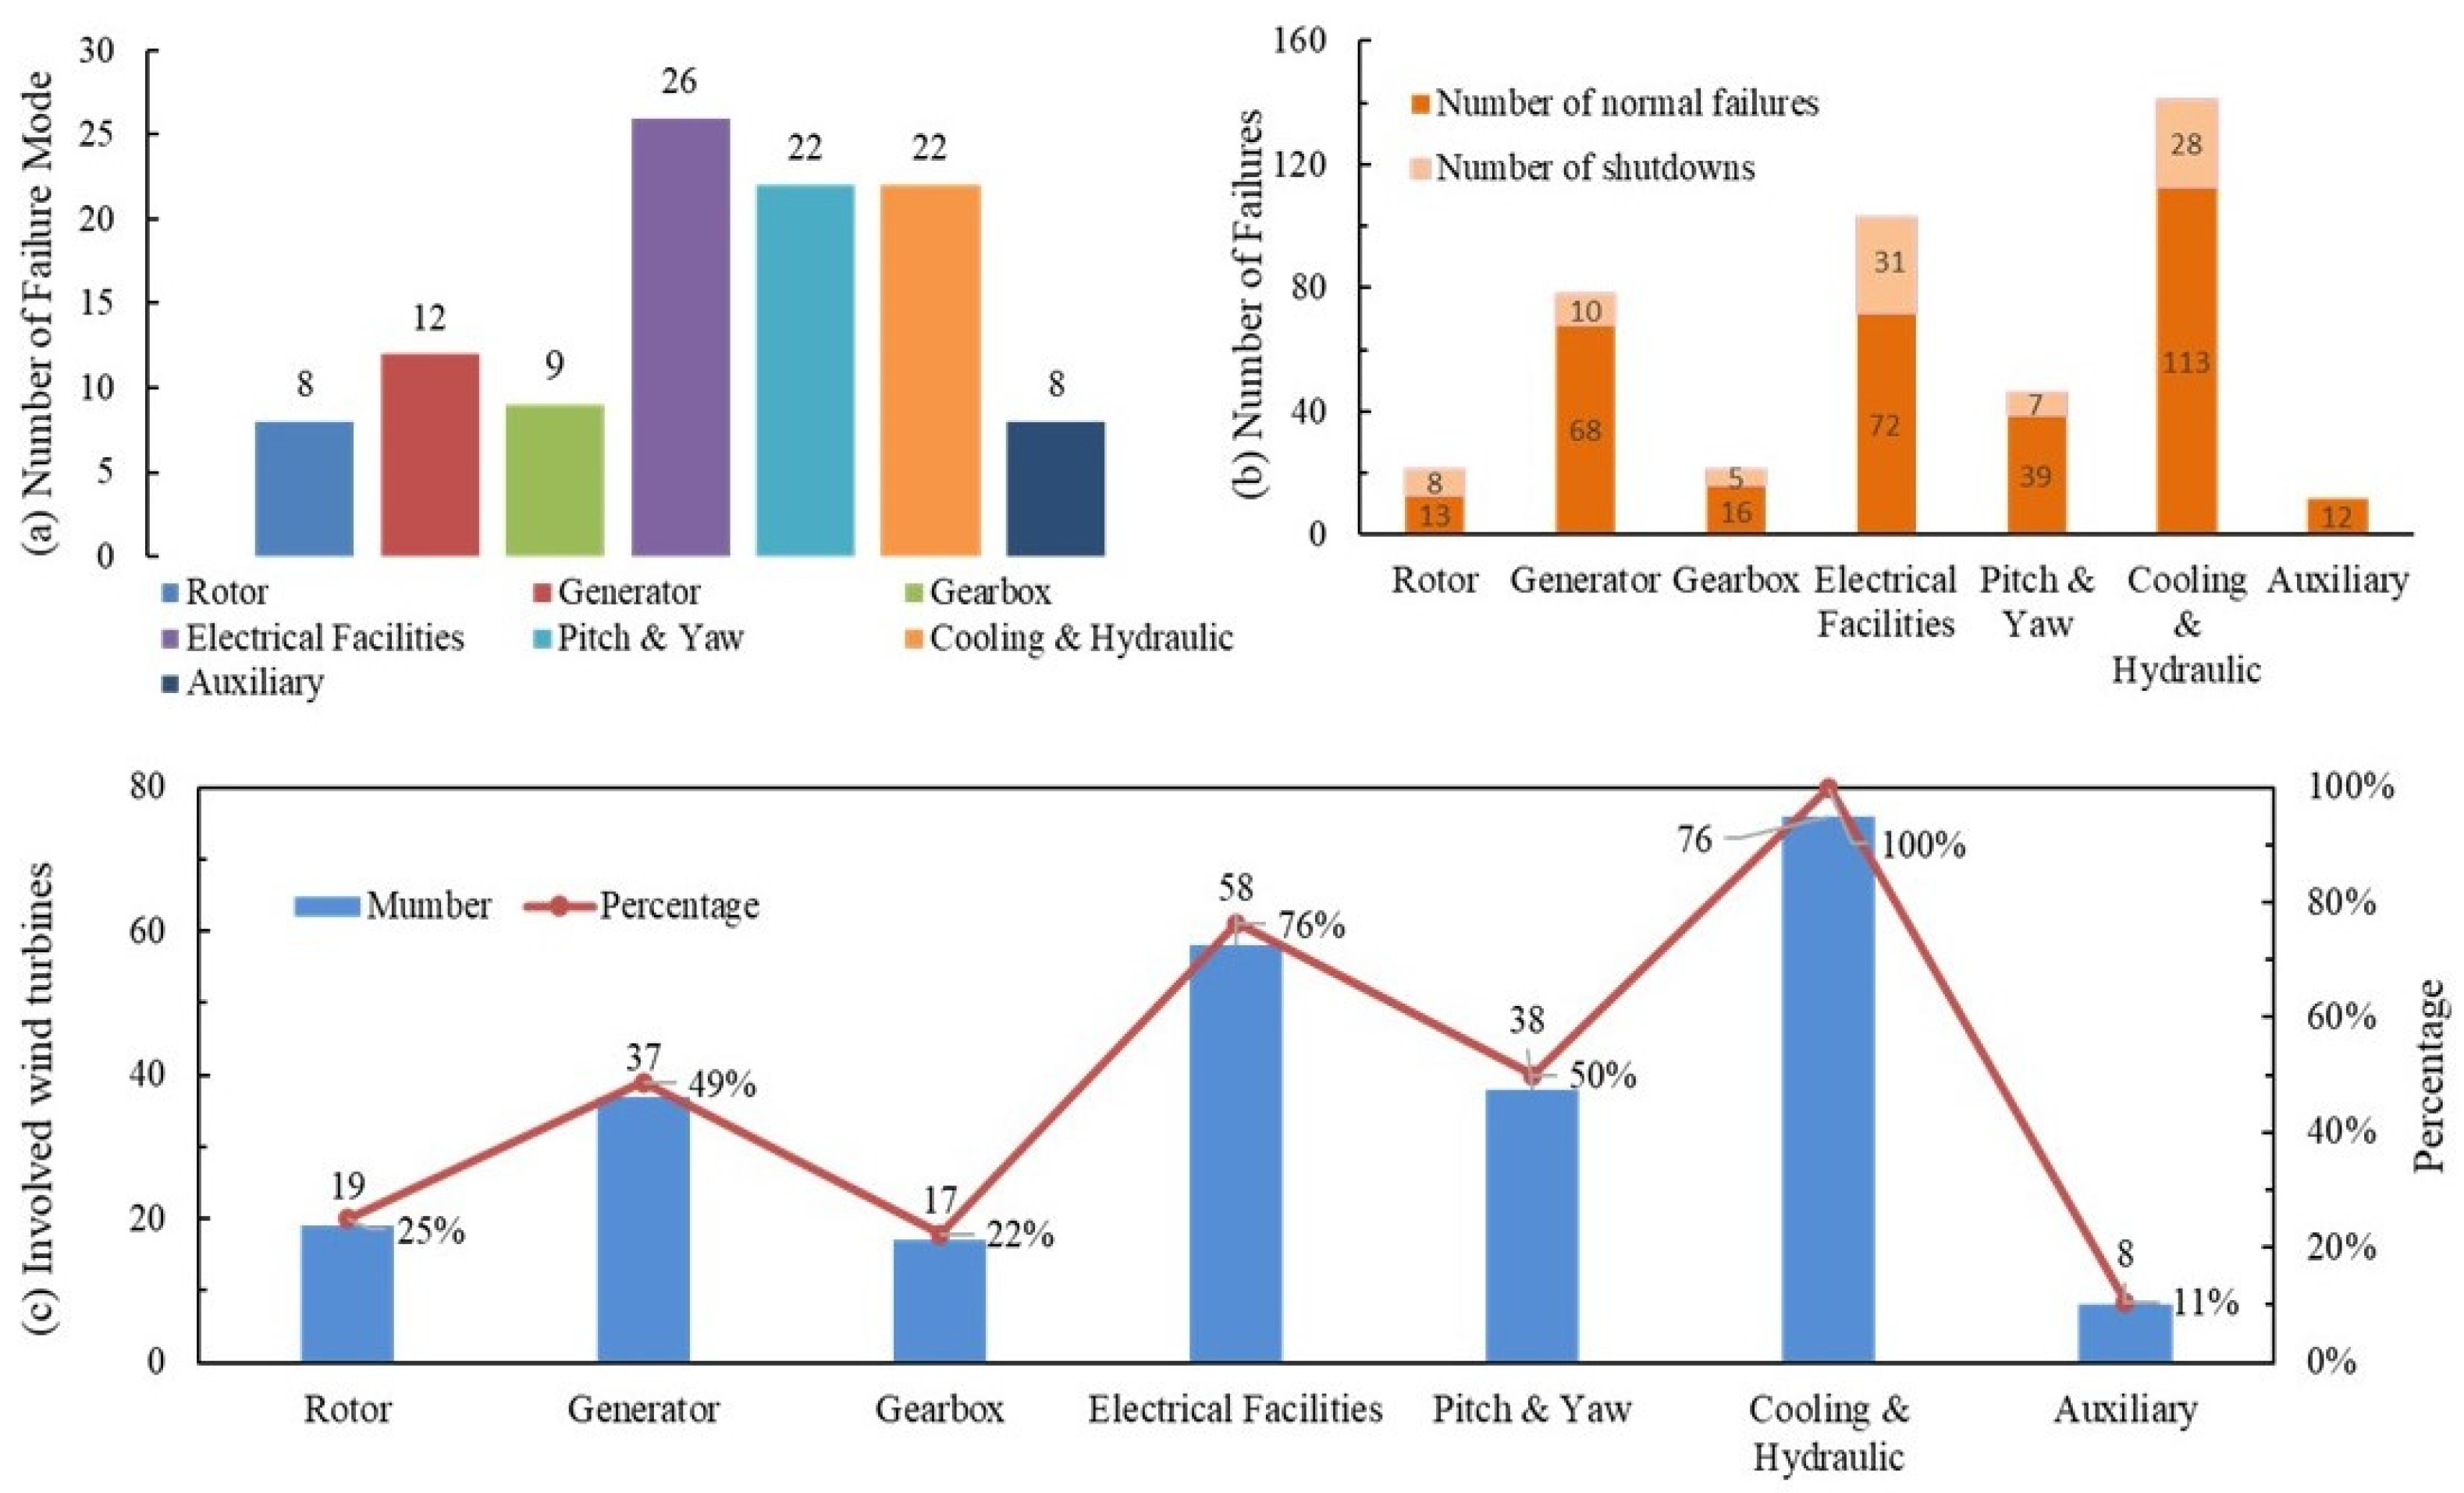
3.2.1. Failure Mode and Failure Criticality
- From a component point of view, the Gearbox and Generator fail less in frequency but result in more critical consequences than the failure of Pitch & Yaw and Cooling & Hydraulics, followed by the Electrical Facilities, Rotor, and Auxiliary components; Electrical Facilities frequently fail, with limited impact on power generation. Failures of components that are directly involved in electricity generation, such as the Gearbox and Generator, are more critical than appendant ones such as Cooling & Hydraulics. No transformer failure was observed.
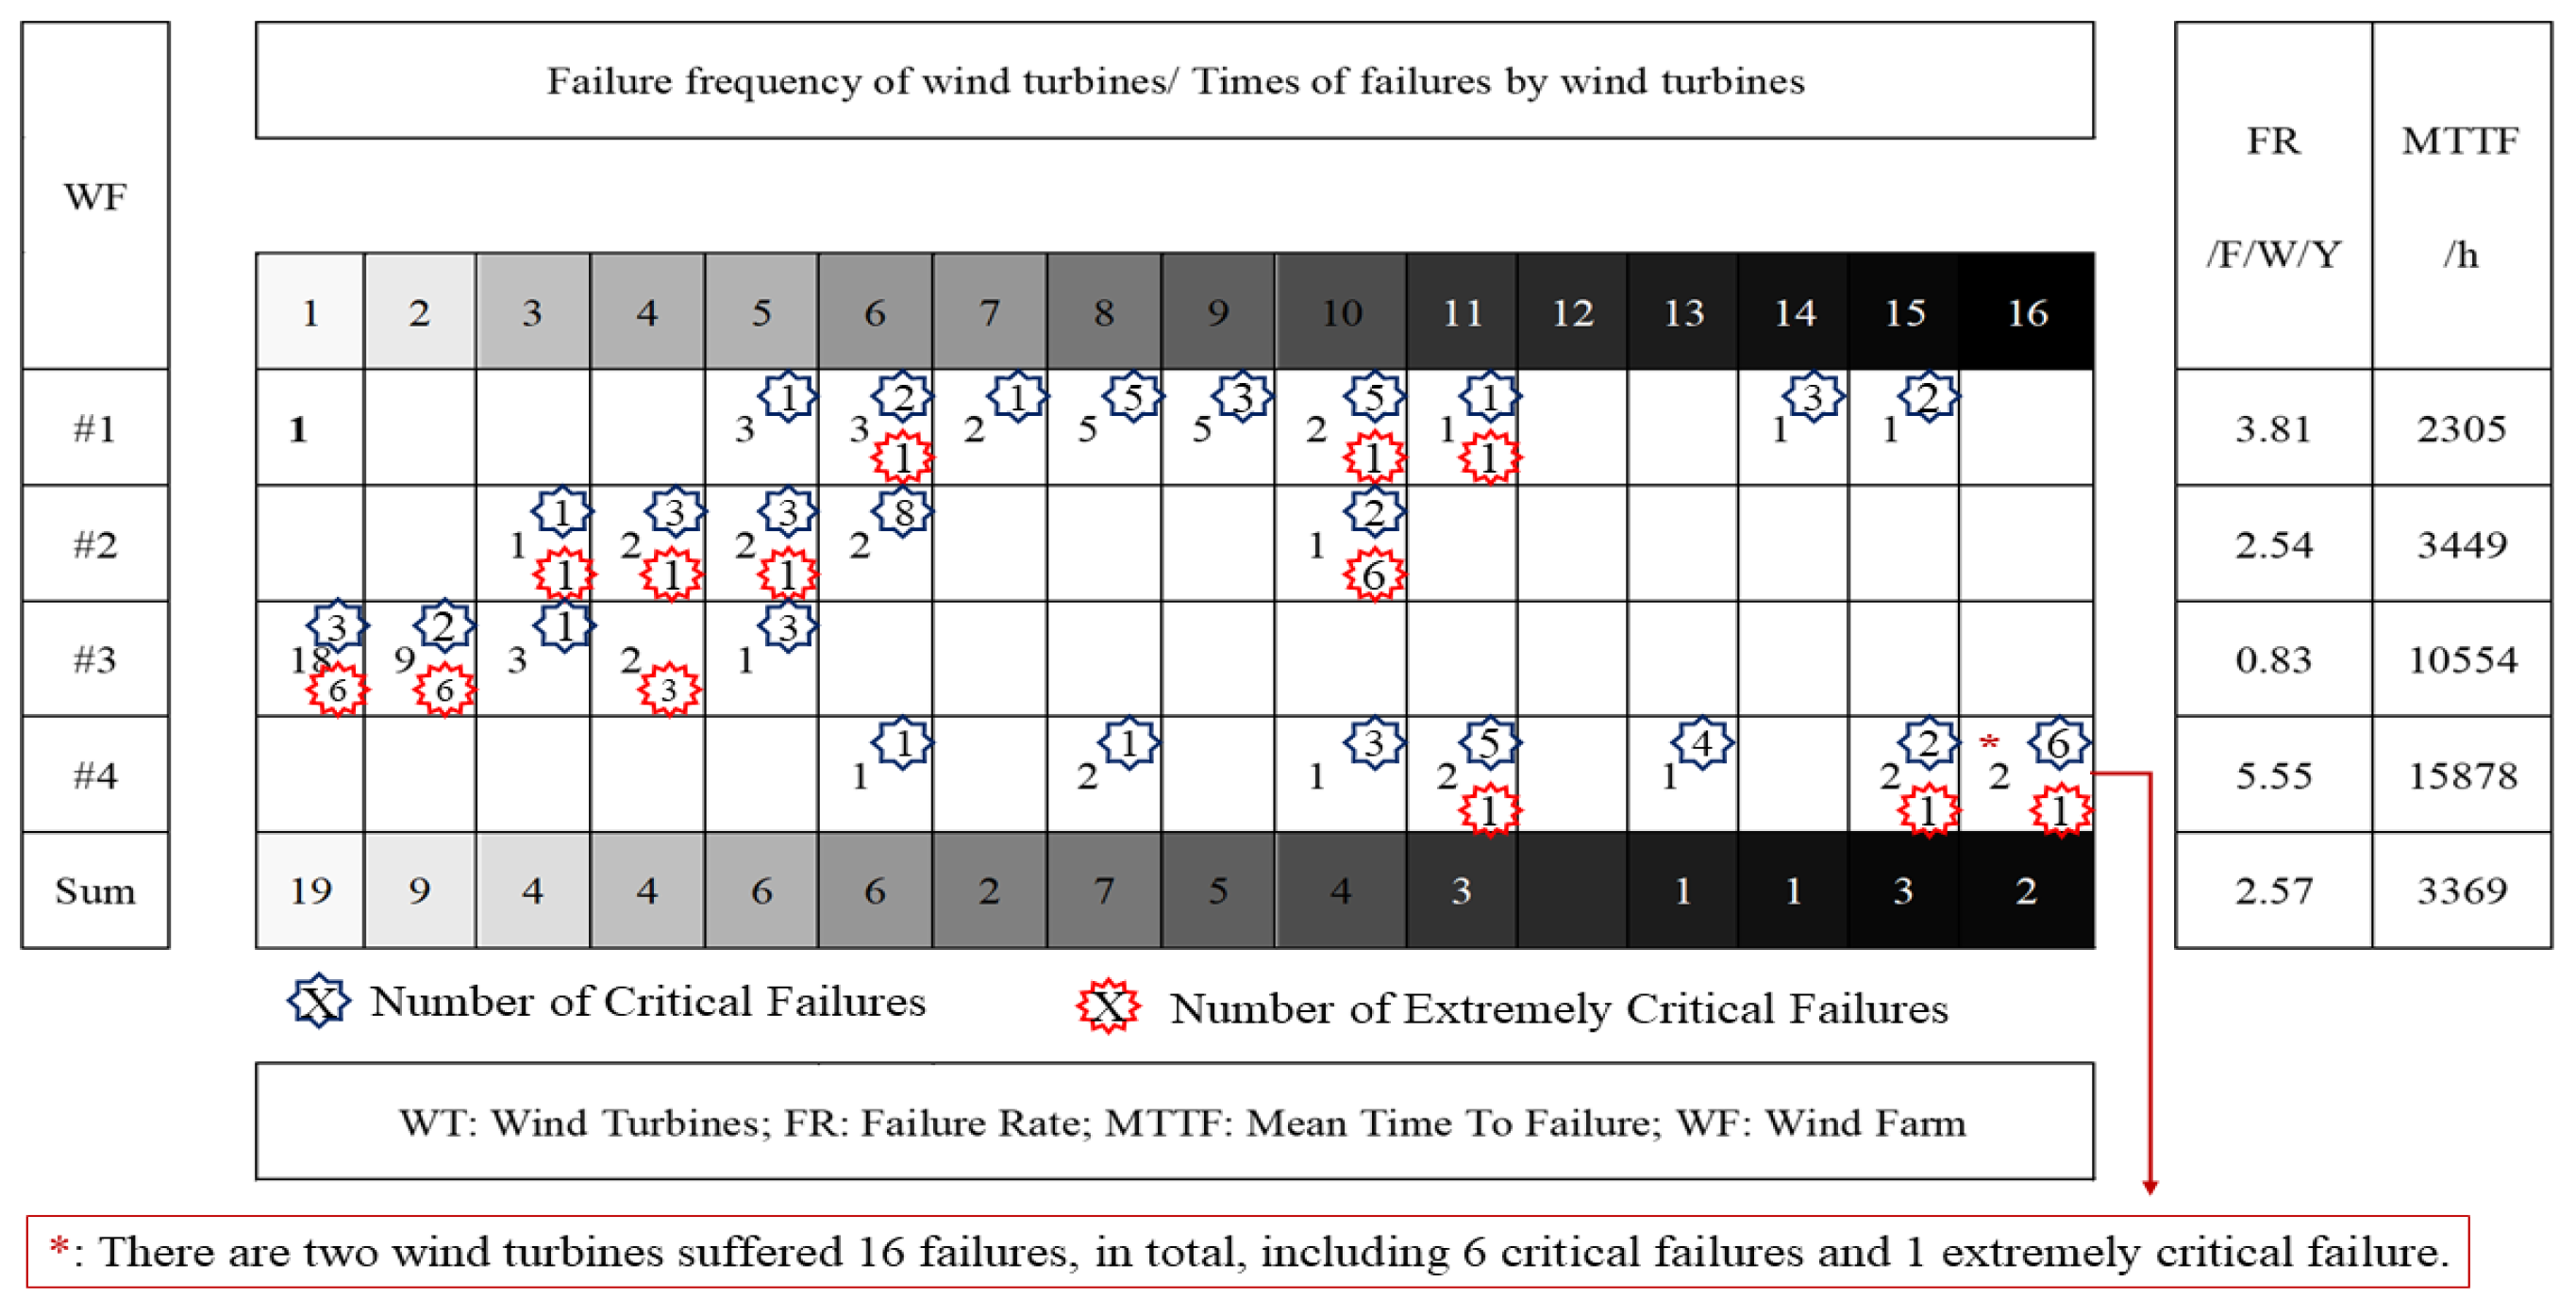
- From a wind turbine point of view, the component selection impacts the failure features of wind turbines. For instance, only a limited number of critical failures (including extremely critical ones) are observed in wind turbine models #1 and #4. The wind turbines in model #5 suffer more critical failures (see Table 3). The root reason can be traced to the component selection, supplier, and maintenance measures.
- From a wind farm point of view, the weather conditions significantly affect the failure features of wind turbines. For instance, most failures of wind farms #1 and #4 are normal failures, while the proportion of critical failures (including extremely critical failures) is markedly higher in the remaining wind farms. This indicates that the wind profile affects, to some extent, the failure criticalities of wind turbines. Generally, higher wind speed, longer uninterrupted working time (wind farm #1), and operation at higher altitudes (wind farm #4) introduce additional failure criticalities to wind turbines (see Table 4).
3.2.2. Failure Statistics
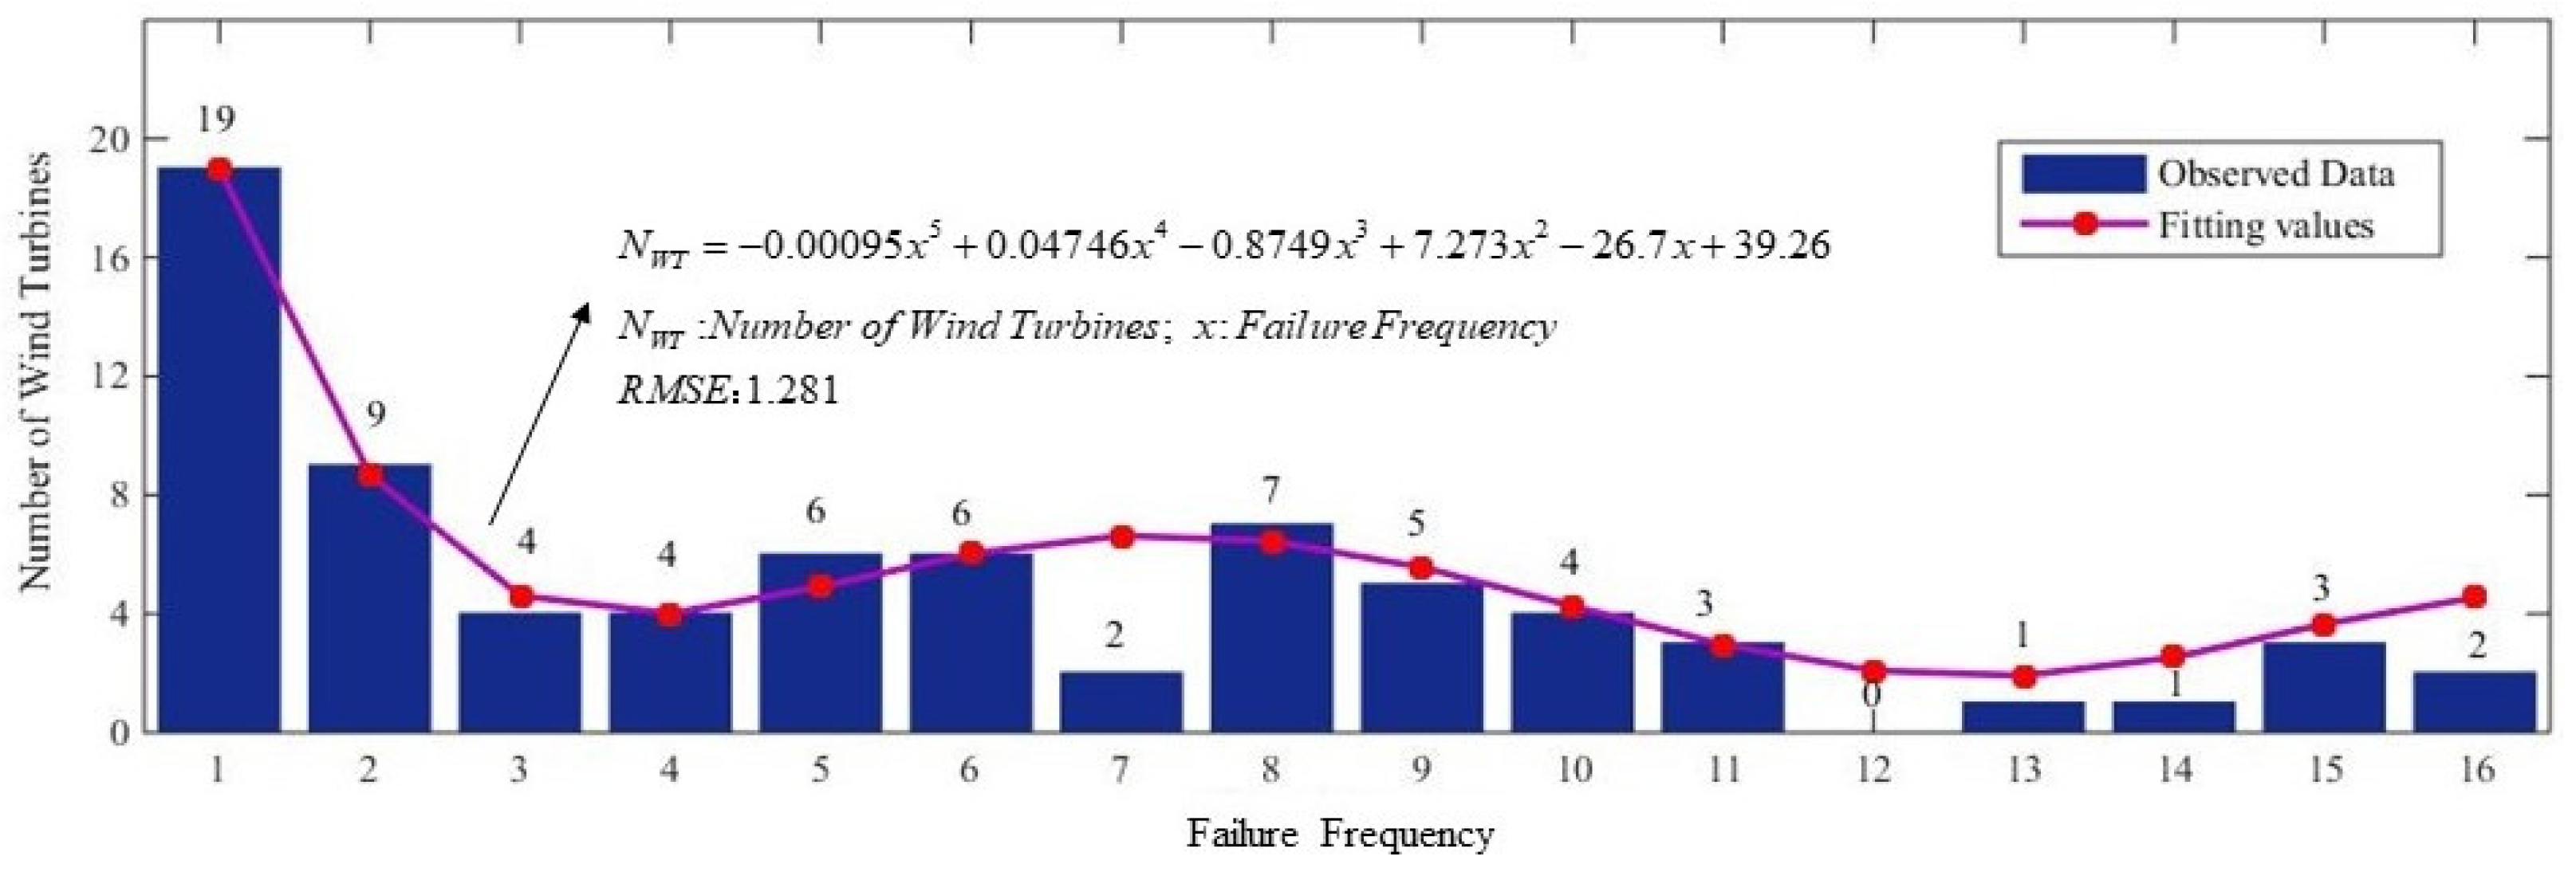
Failure Frequency
Failure Criticality
- The critical failure frequencies in wind farms #2 and #3 are relatively low. The manufacturer and maintenance measures contribute to this conclusion, as all the wind turbines in wind farm #2 and 7 out of 33 wind turbines installed in wind farm #3 are manufactured by one factory. On the contrary, similar wind turbines are not used in wind farms #1 and #4. Hence, the capability of manufacturers is a core factor in wind turbine quality.
- The distribution of (extremely) critical failures and critical failures in each wind farm is not even; moreover, the regular pattern of failure occurrence and the relationships between critical failures, extremely critical failures, and normal failures are not obvious.
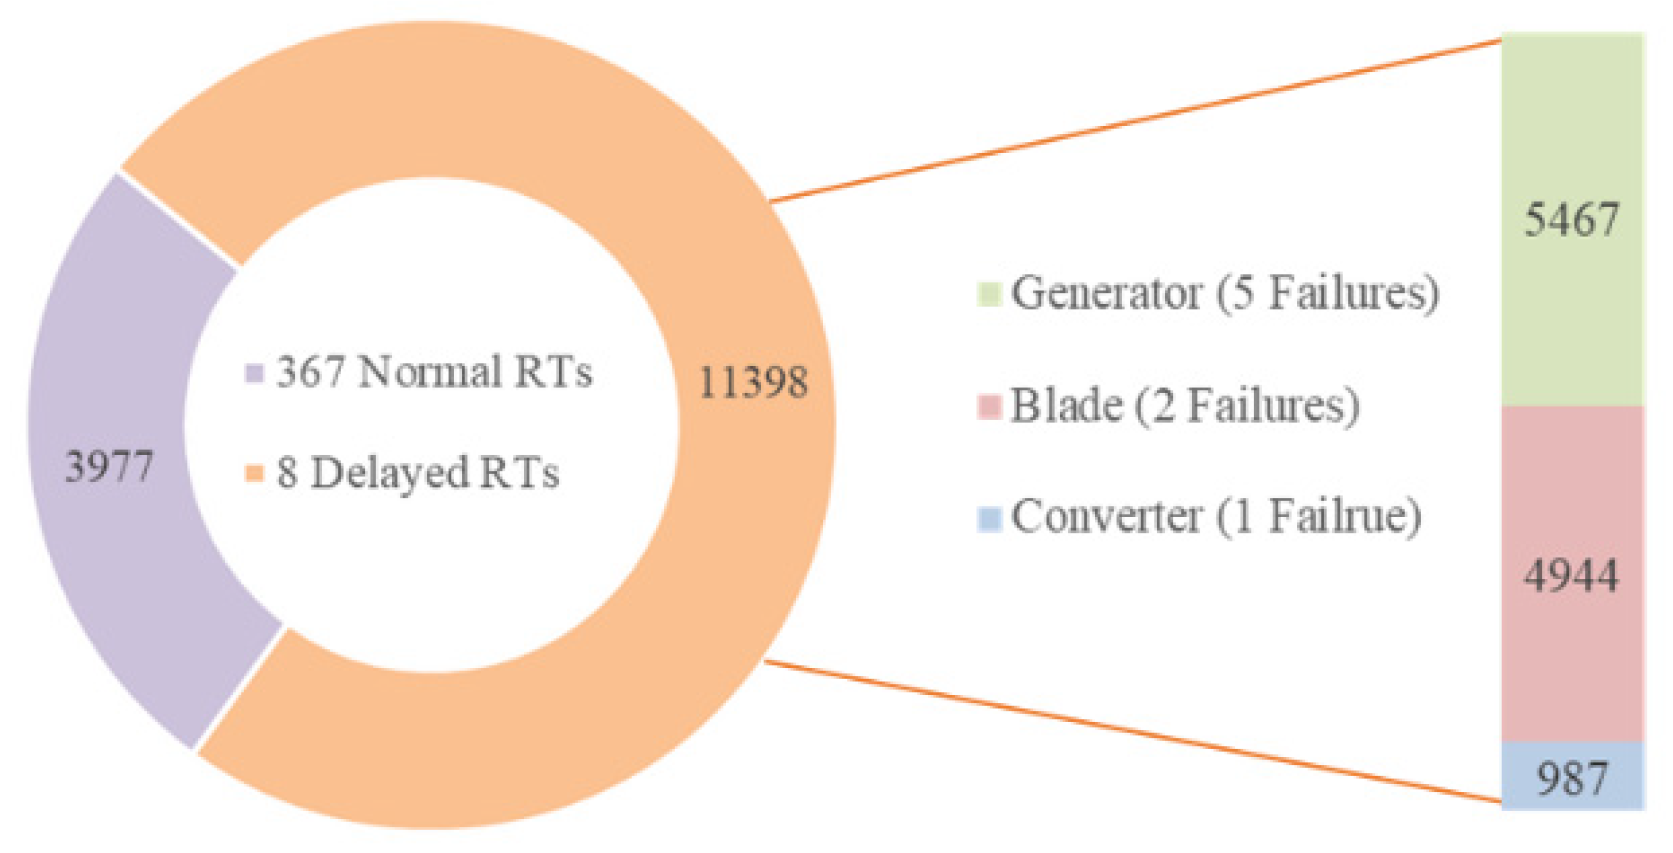
- Wind turbines in wind farm #3 fail less, but their failures have severe consequences; for instance, 55% of wind turbines suffer only one failure during the observation period, of which 50% are extremely critical failures (6 failures) and critical failures (3 failures). Critical failures requiring complex maintenance, additional materials, or professional personnel would introduce additional downtime and maintenance costs and reduce wind turbines’ availability and economic competitiveness. To this end, failure rates and failure criticalities should be considered in supplier management of wind projects.
Failure Rate
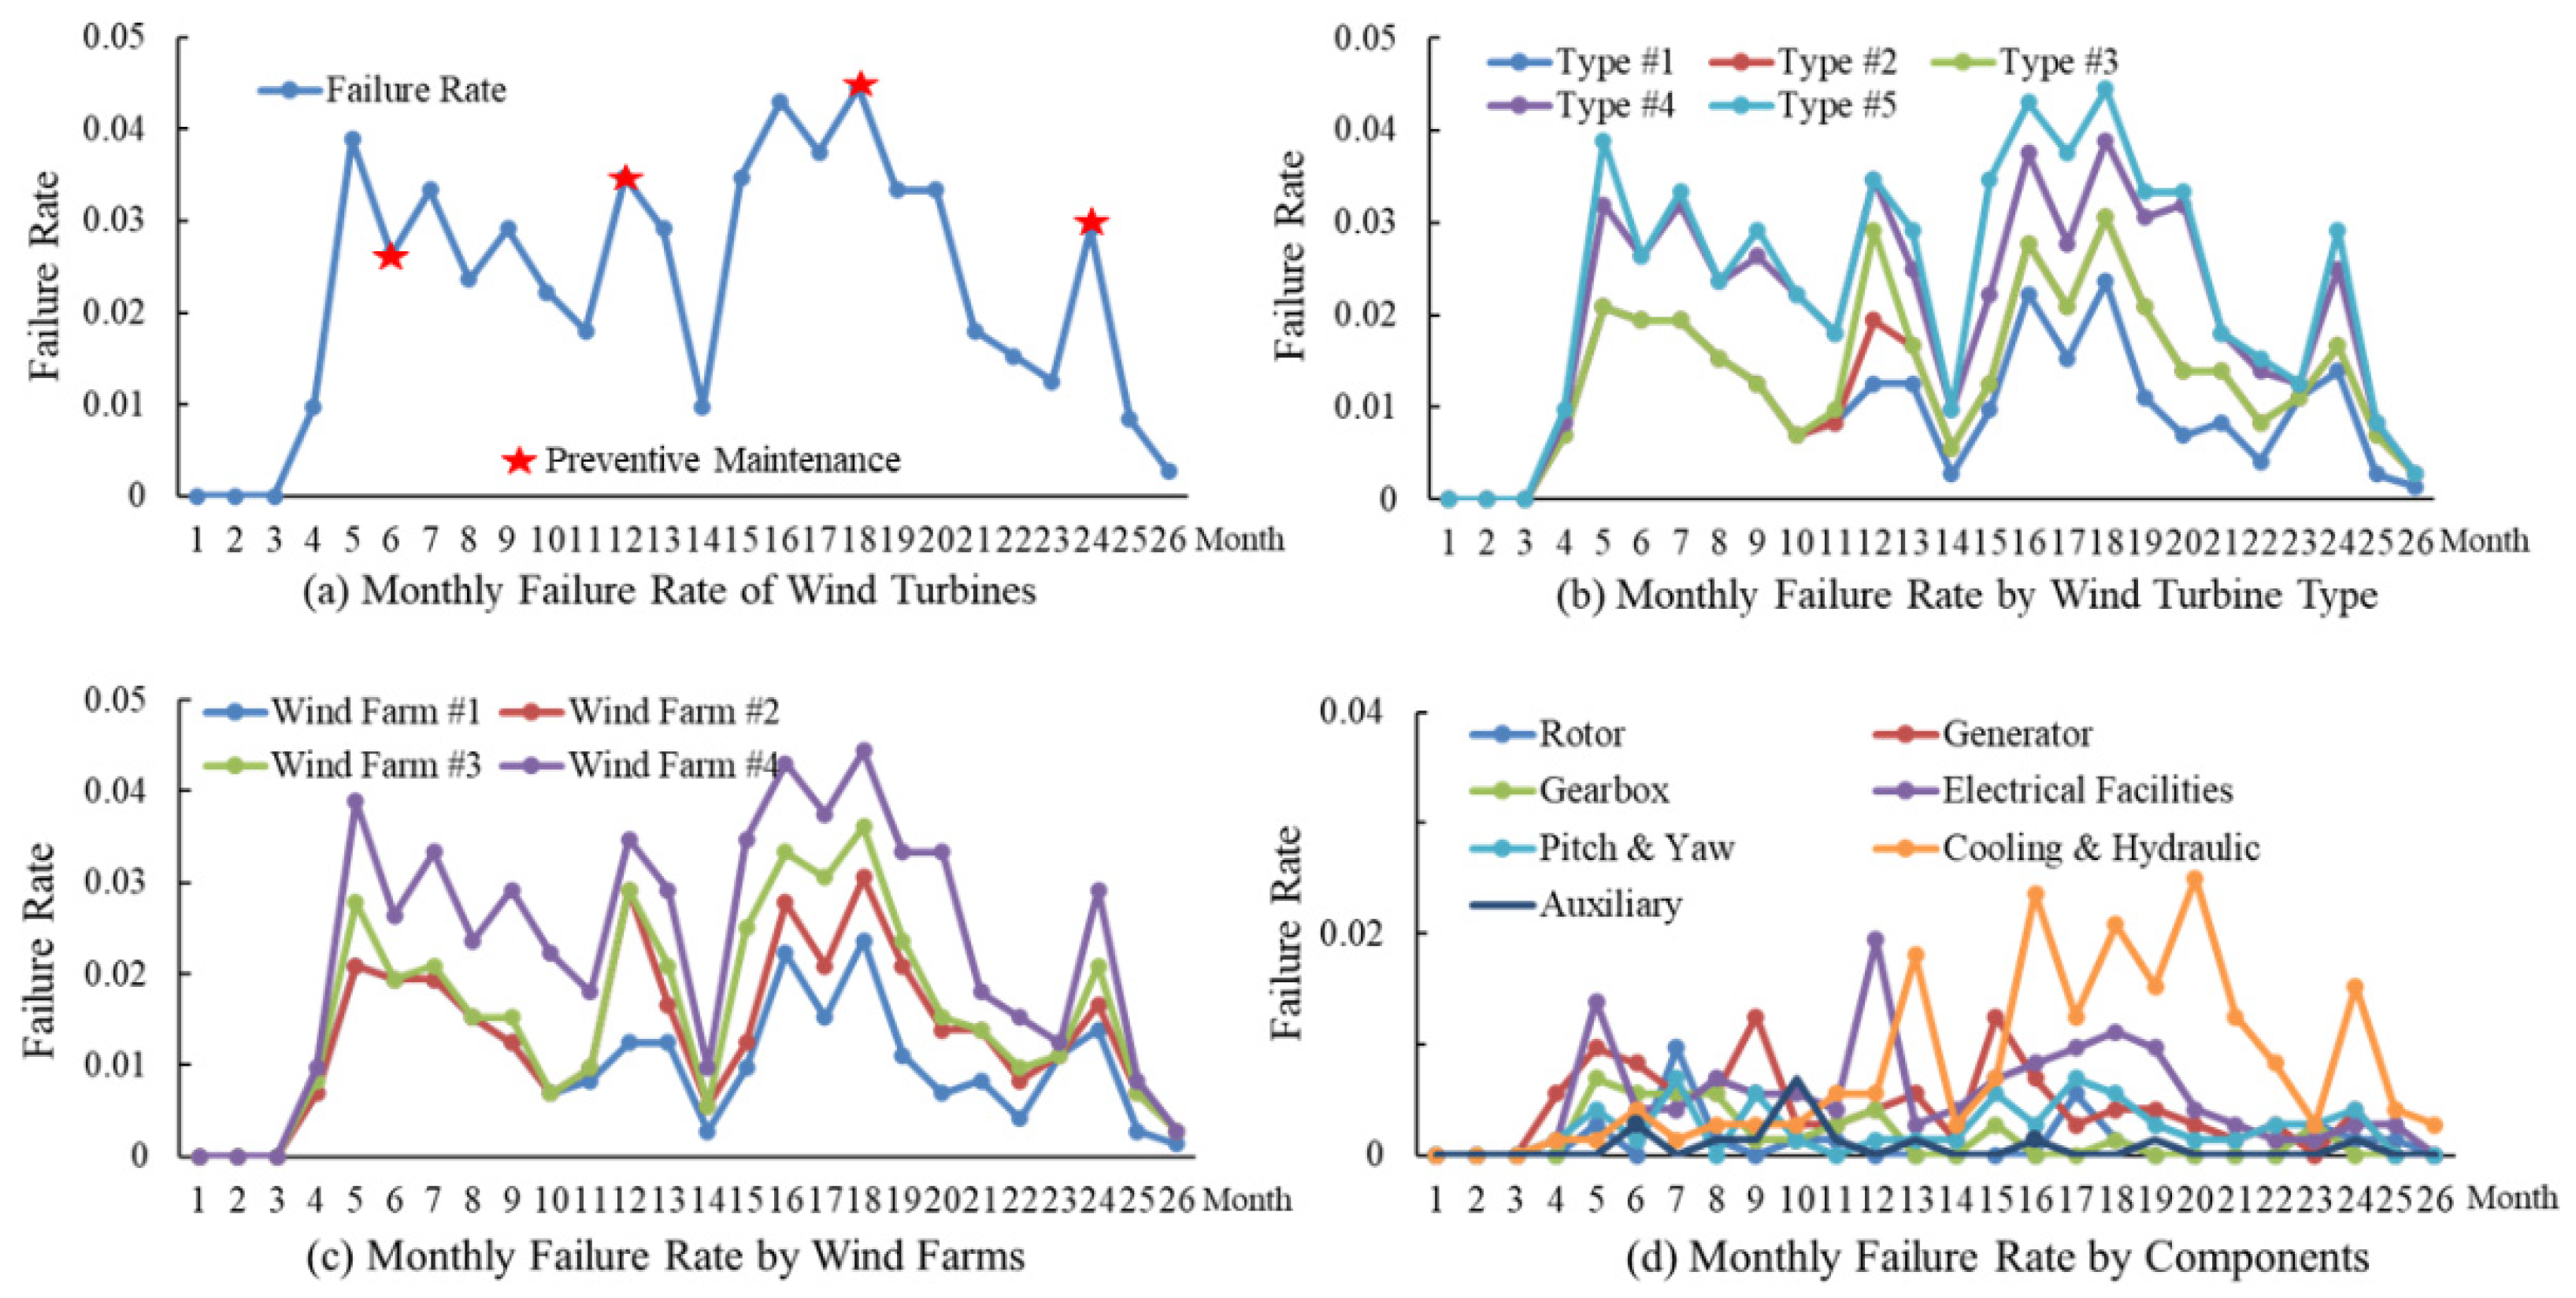
- Approximately 18 months is the inflexion point of the failure rate of wind turbines. The failure rate of the wind turbines changes irregularly before the inflexion point, and then, decreases obviously. Preventive maintenance supports the failure prevention of wind turbines, and carrying out preventive maintenance every six months is suitable according to the failure rate inflexion point of the wind turbines.
- The trends of failure rates of different types of wind turbines are similar. A total of 15 to 20 months of working is the limit for all types of wind turbines and wind farms, which almost always results from Cooling & Hydraulics failures. Hence, quality control for the Cooling & Hydraulics of wind turbines is essential. The quality of wind turbines varies a lot depending on their type; for instance, the failure rate of the wind turbines of type #1 is almost half of that of type #5, which encourages users and investors to pay close attention to their supplier selection.
- The trend of failure rate in terms of wind farms is similar to that concluded for the types of wind turbines. According to Figure 6c, flatland wind farms hold lower failure rates than those installed in mountains and desert areas. More specifically, wind turbines in the mountains fail more in frequency than those operating in desert areas and, in turn, more than wind turbines that stand in flatland spaces.
- Cooling & Hydraulics failures are the decisive factors that increase the failure rate of wind turbines, especially over 15 to 20 months, considering that failures of wind turbines are dynamic processes that result from coupled components. Hence, dynamic, correlated, and real-time failure rate analyses of components benefit the O&M of wind turbines.
4. Maintenance Data
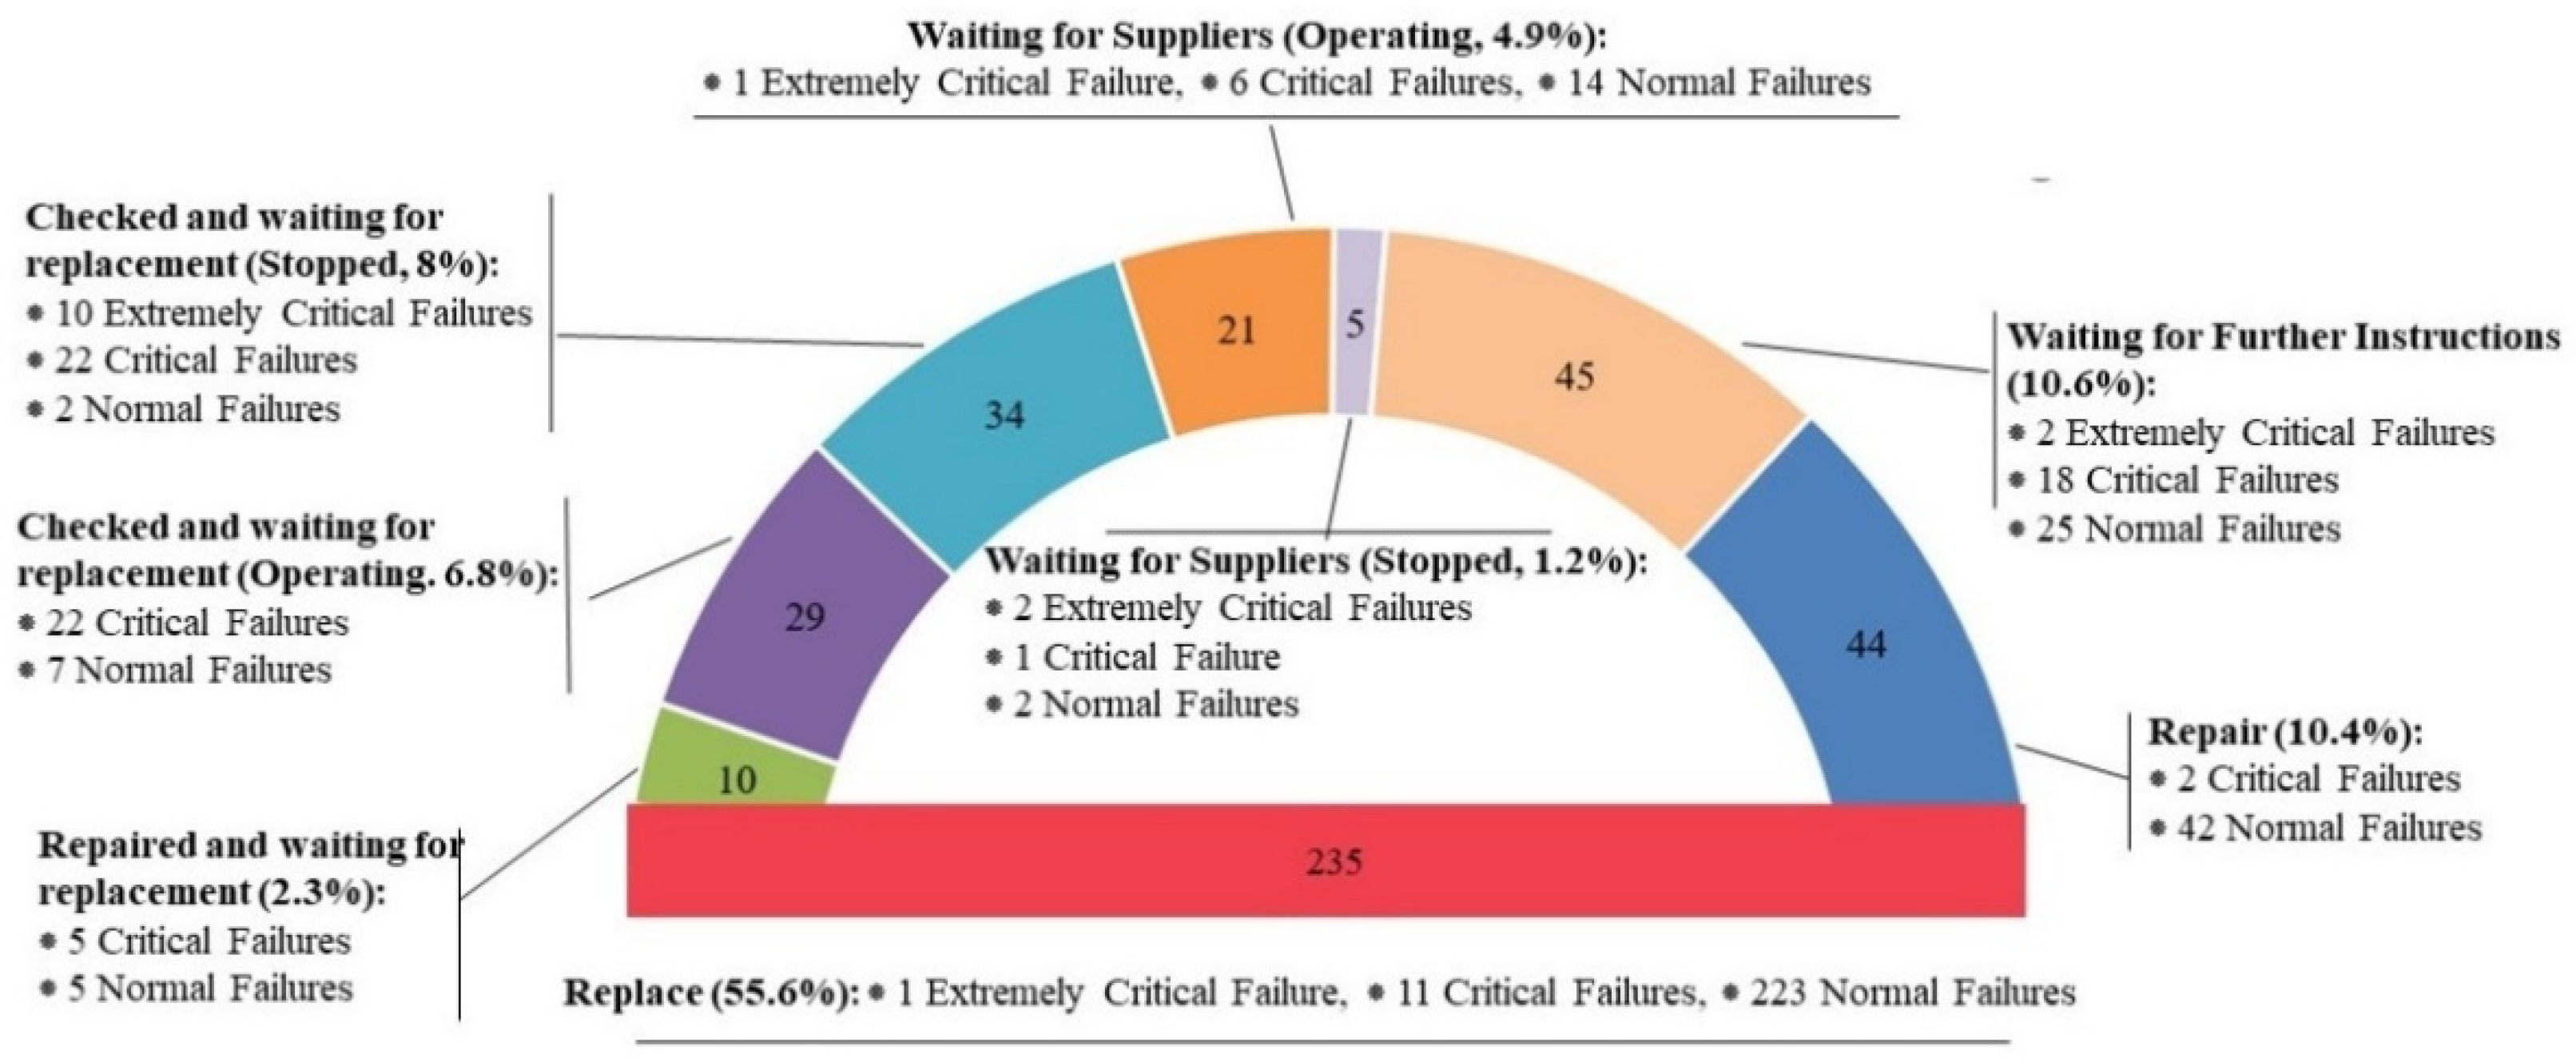
4.1. Maintenance Measures
- Repaired: Repairing without replacement and no additional material is needed.
- Replaced: Repairing with replacement.
- Repaired and waiting for replacement: Repaired and waiting for additional materials for further replacement.
- Checked and waiting for replacement (operating): Checked without repair and waiting for additional materials for replacement. The failed wind turbine is operating.
- Checked and waiting for replacement (stopped): Checked without repair and waiting for additional materials for replacement. The failed wind turbine is stopped.
- Waiting for the supplier (operating): Waiting for the maintenance crew of suppliers. The failed wind turbine is operating.
- Waiting for the supplier (stopped): Waiting for the maintenance crew of suppliers. The failed wind turbine is stopped.
- Waiting for further instructions: The failure is unable to be repaired due to: (i) an unknow failure cause; (ii) a lack of maintenance experience; (iii) minor failures with limited impact; (iv) a problem beyond the authority of the maintenance crew; (v) huge and expensive structural failure.
4.2. Spare Parts
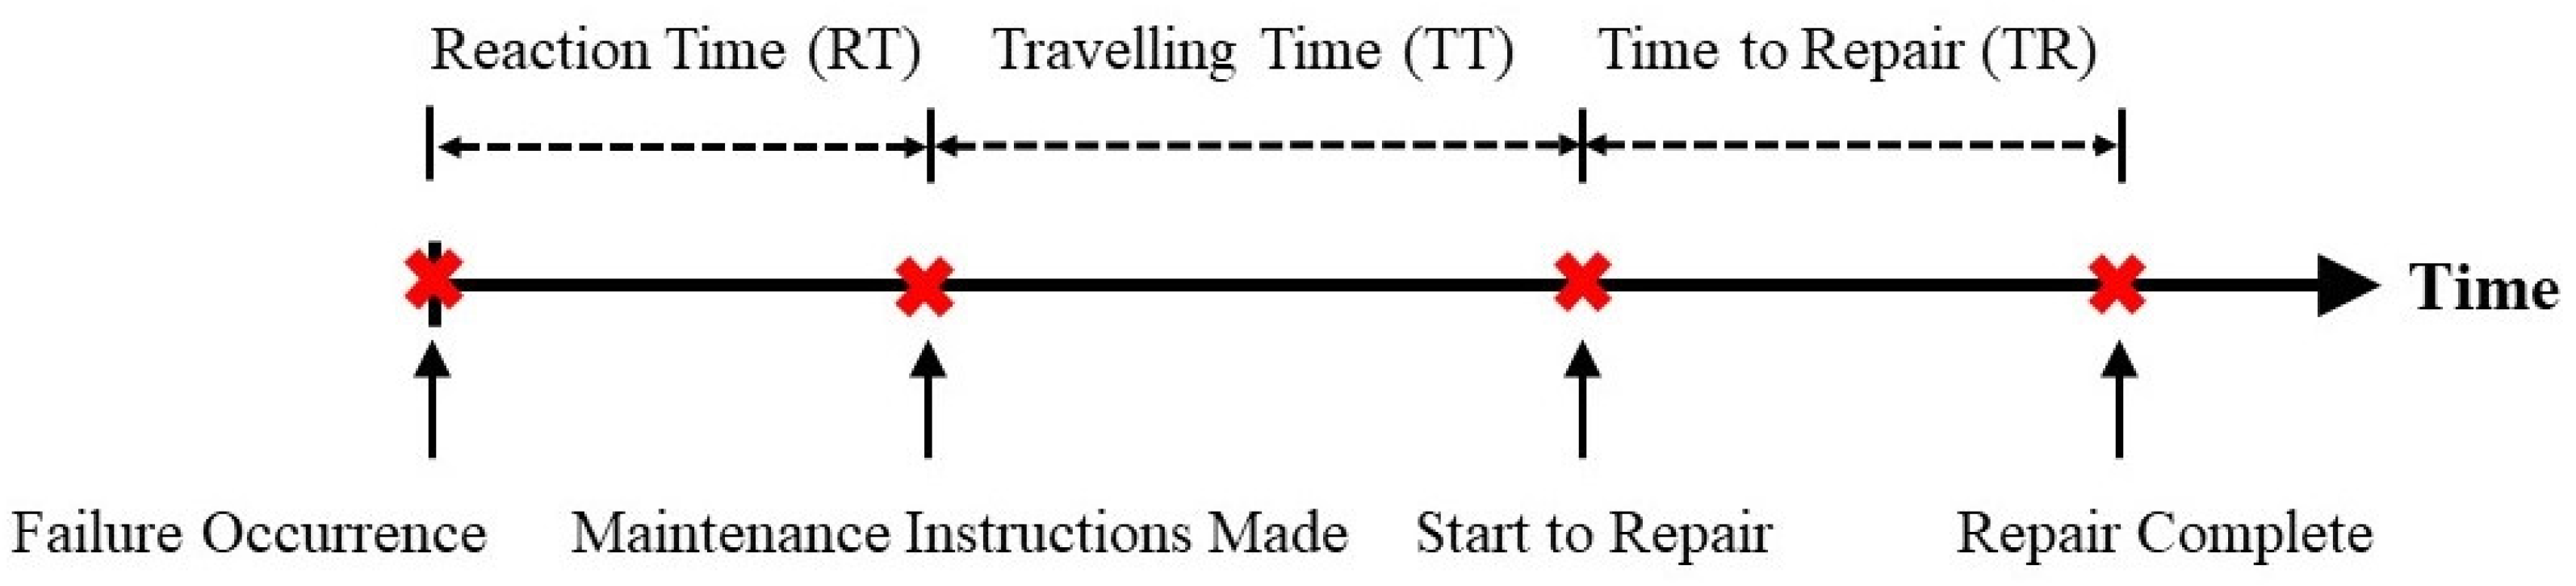
4.3. Maintenance Times
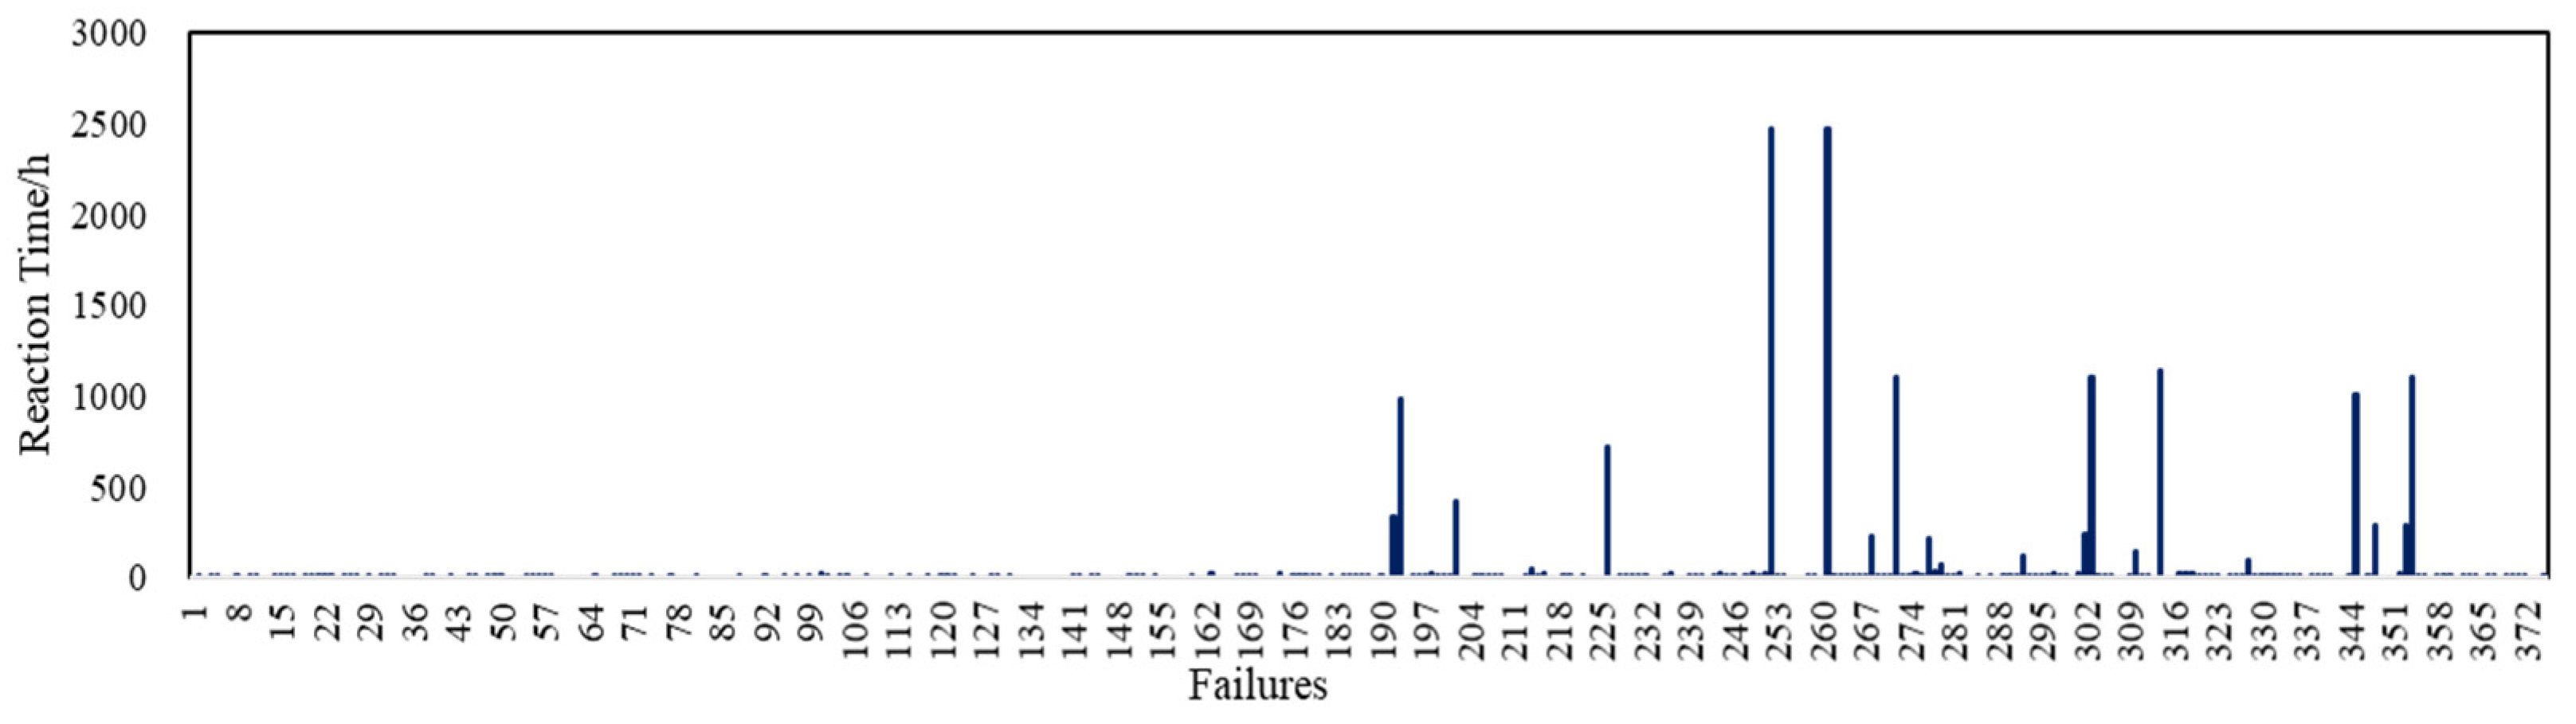
4.3.1. Reaction Time
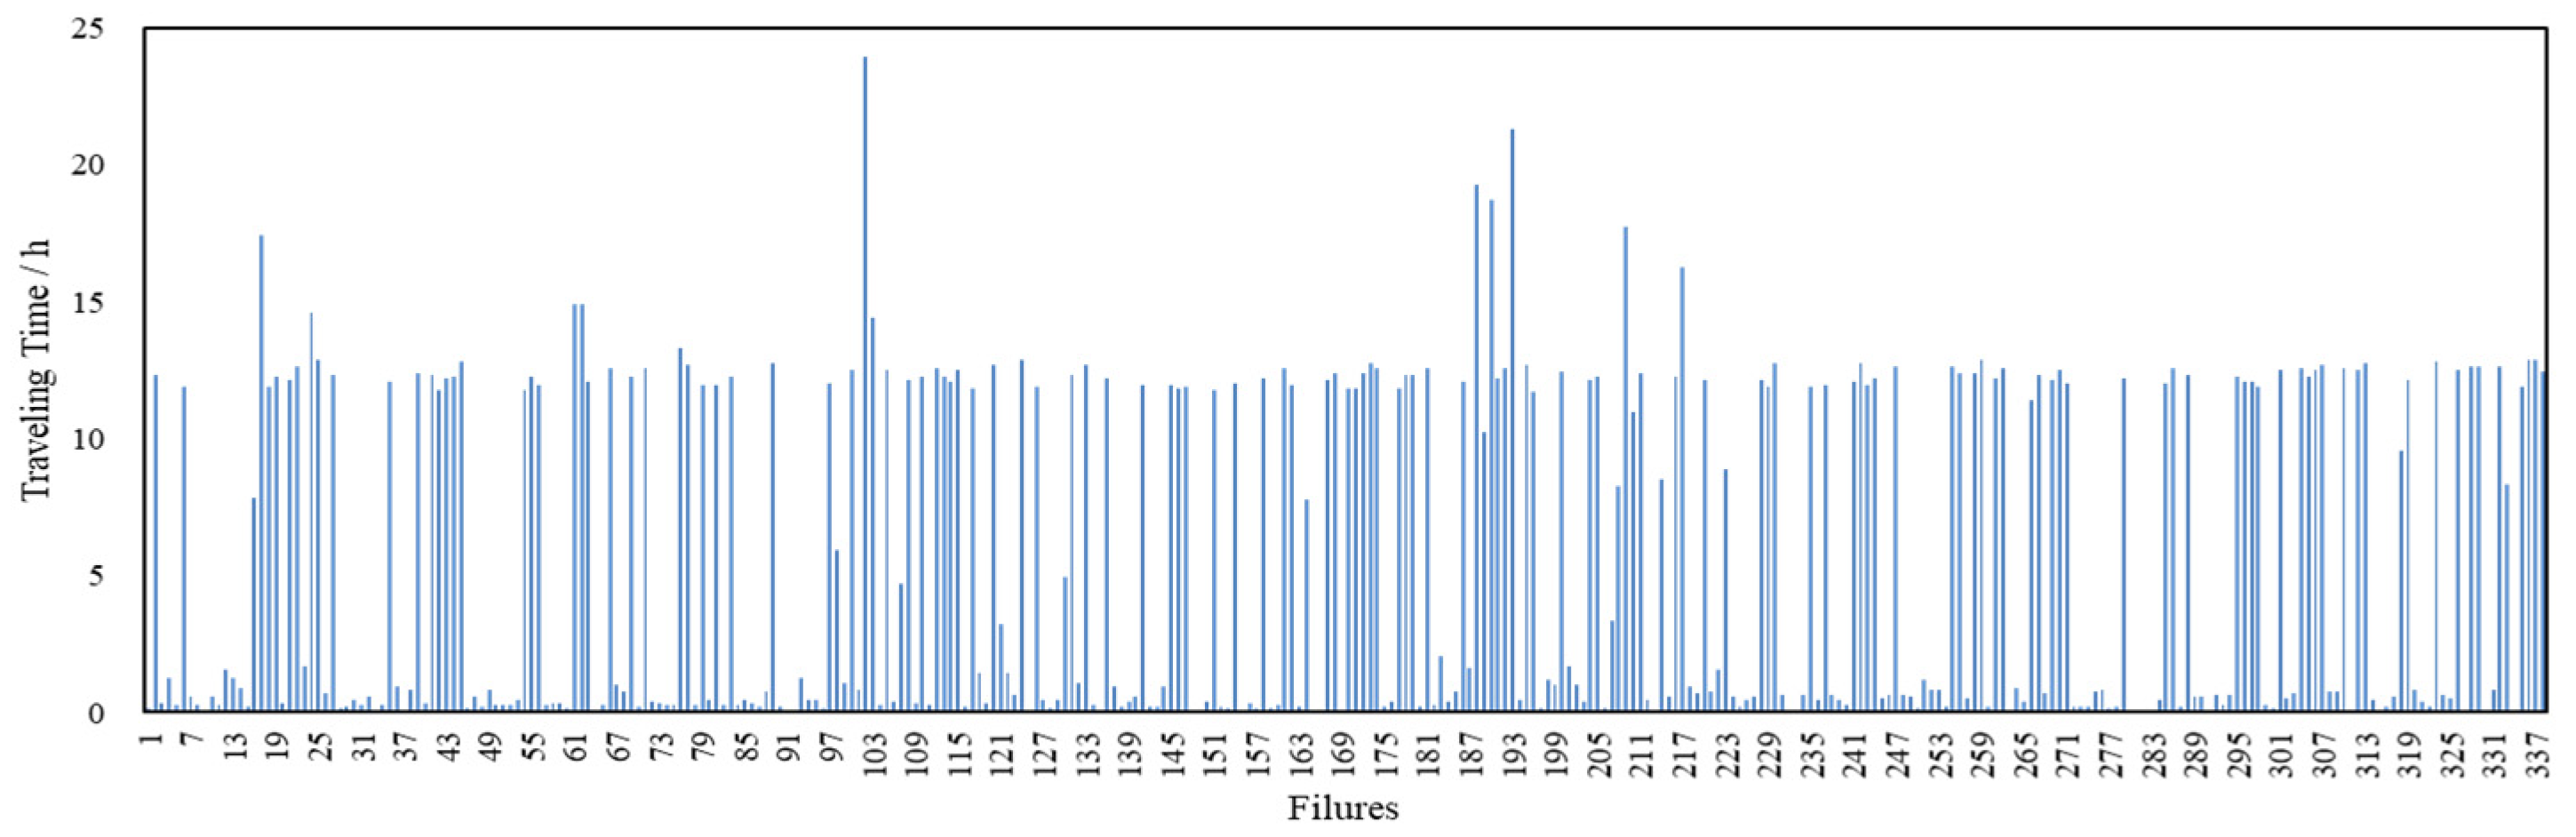
4.3.2. Traveling Time
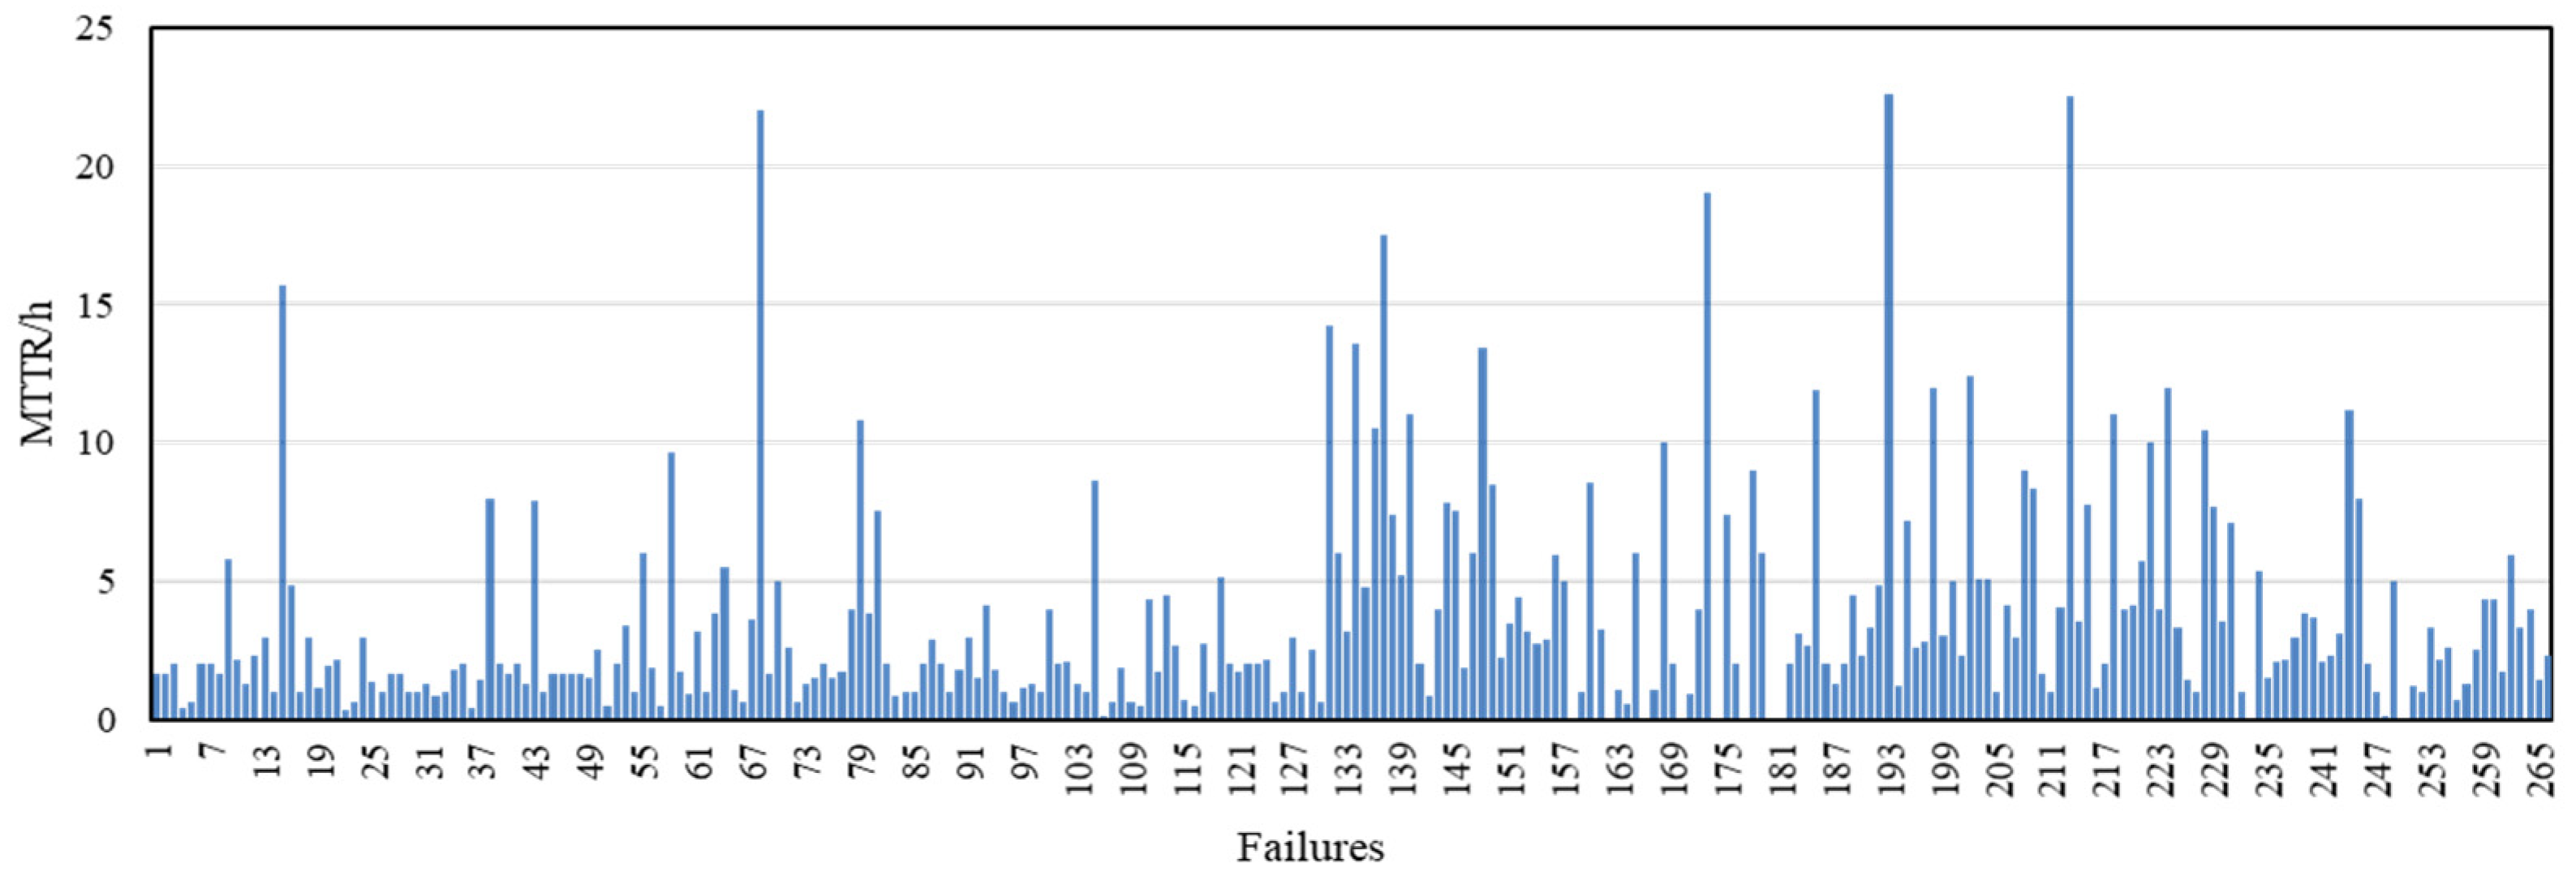
4.3.3. Time to Repair
5. The Proposed Failure Rate Correction Methodology
6. Results, Comparisons, Validations, and Discussions
6.1. Results
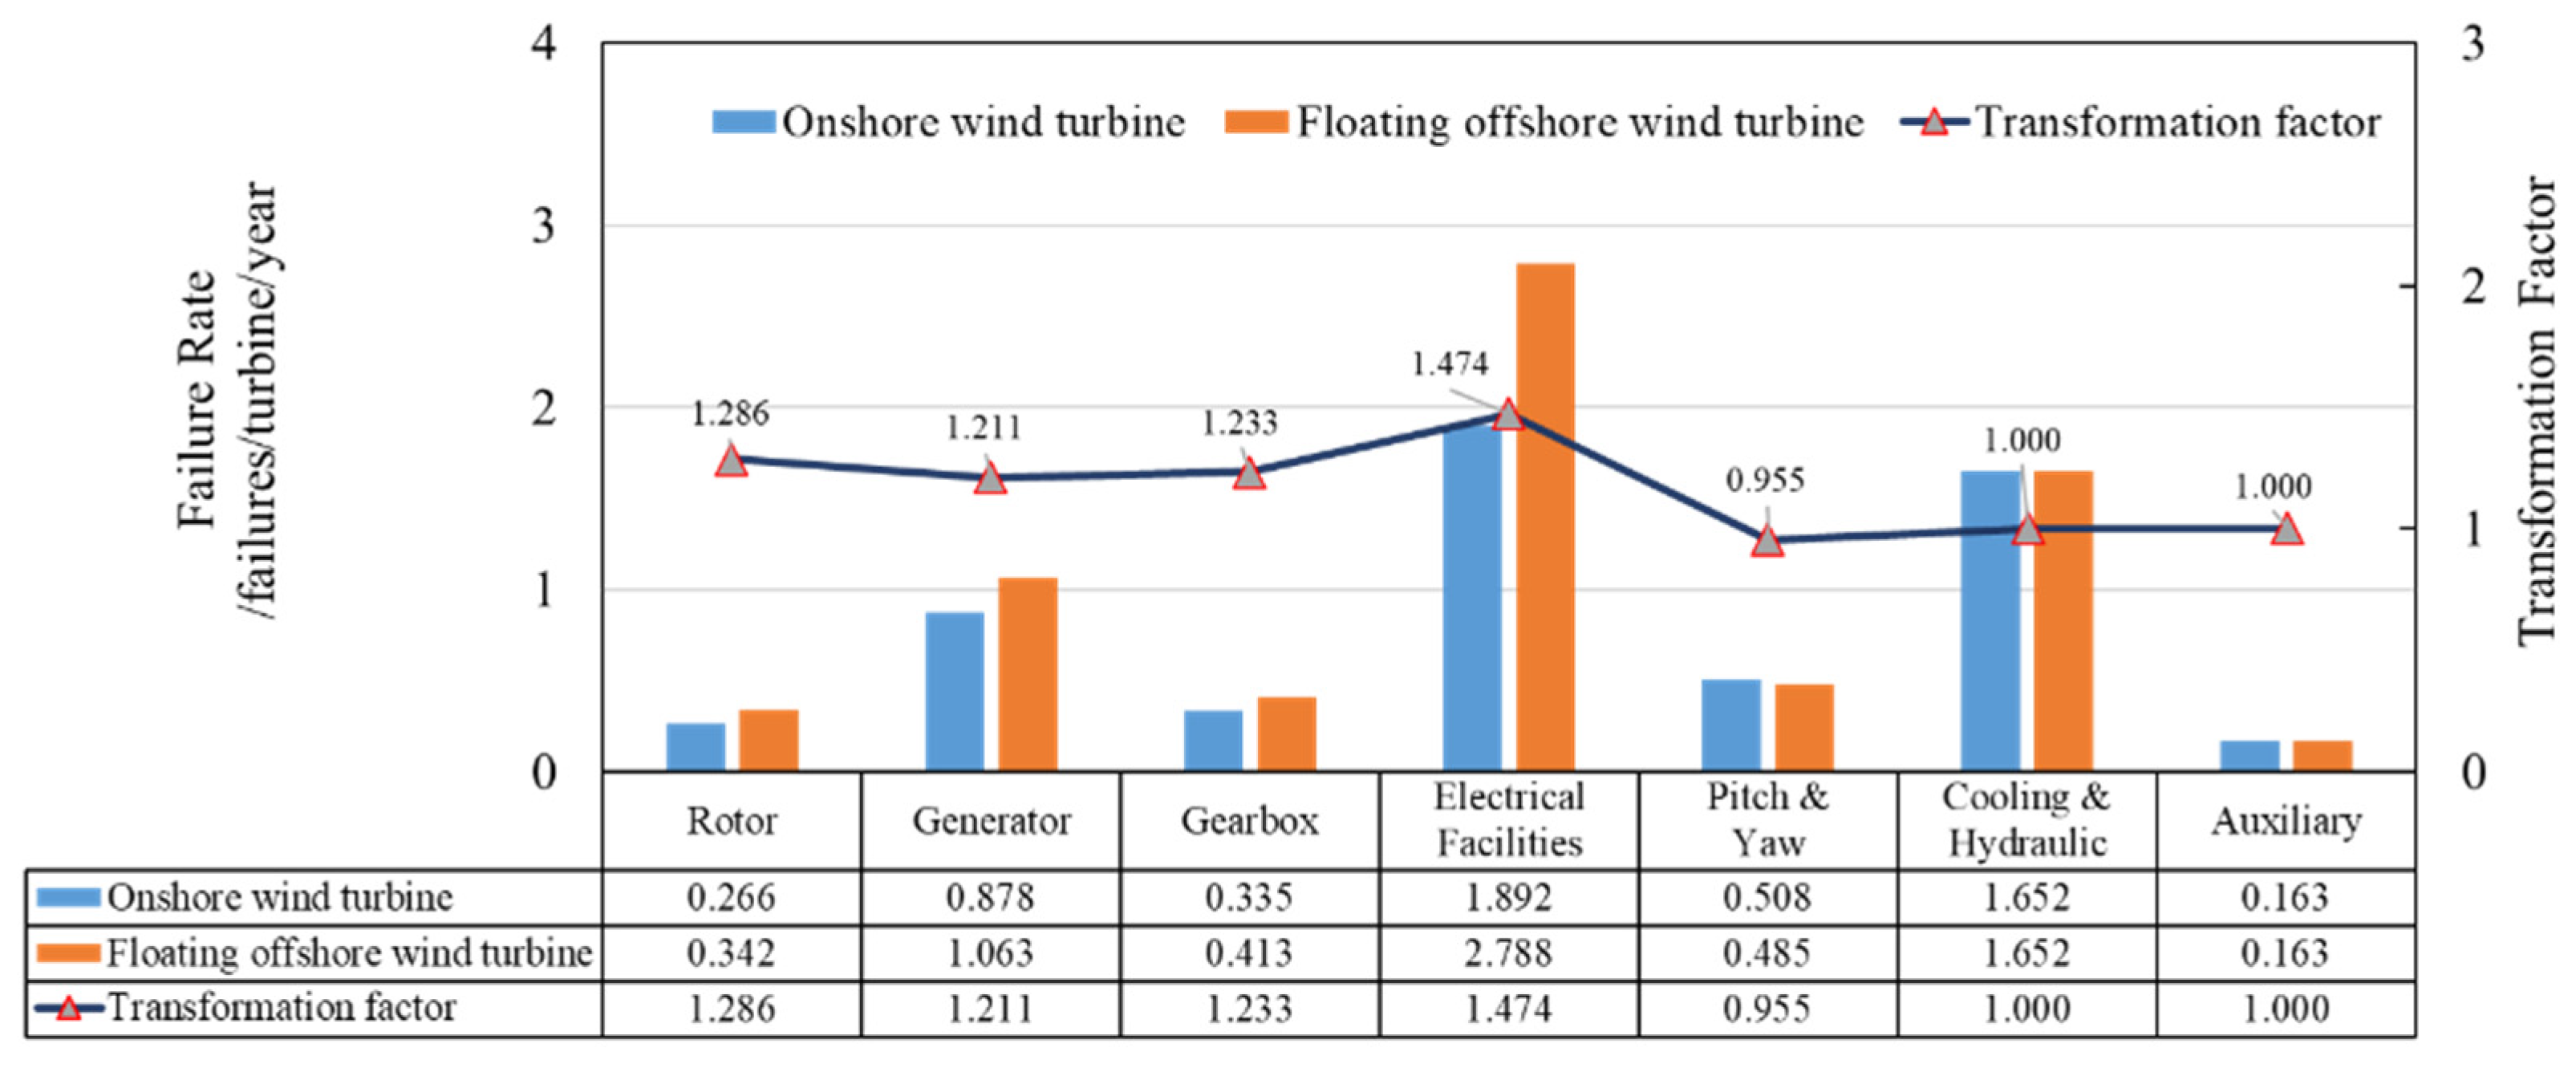
- The proposed method predicts higher failure rates of the components equipped in floating offshore wind turbines than for onshore devices, except for the Cooling & Hydraulics, Auxiliary, and Pitch & Yaw components. The failure rates of the Cooling & Hydraulics and Auxiliary components are not corrected due to insufficient expert judgment.
- The lower predicted failure rate of Pitch & Yaw confirms that the judgment of experts and the proposed approach reflect that: (i) the advances in materials, manufacturing, and operation and management would increase the robustness of components, and thus, reduce their failure rates; and (ii) the harmful sea conditions introduce additional fragility to floating offshore wind turbines and, in turn, increase the failure rates of several components. The final transformation factor of each component is a balance between at least the two aspects mentioned above.
- Failure rates of Electrical Facilities and of electromechanical components such as the Generator are higher than those of mechanical components such as the Rotor and Gearbox. This indicates that the harmful sea conditions introduce additional failures to fragile electrical, electromechanical, and hydraulic elements, and mechanical components are relatively robust in withstanding the environmental effects. The conclusions above suggest weak links to floating offshore wind turbine operation and maintenance.
6.2. Comparisons, Validations, and Discussions
- From a holistic point of view, failure rate correction/prediction models agree that the failure rate of floating offshore wind turbines is higher than that of onshore devices. RIF-based models predict that the failure rate disparity with onshore wind turbines is less than 30%; this can be compared with the result of the stress factor-based model, which computed 75% differences between the two types of wind turbines. The evidence is insufficient to select the model that can best provide convincing and precise results. However, it should be mentioned that the model selection should follow the features of the methods. Specifically, stress factor-based methods correct failure rates via global factors related to environmental and power utilization aspects. However, the RIF-based method produces a cluster map of the disparity of wind turbines according to the failure features of detailed failure cases of components.
- RIF and subjective data-based failure rate correction models, including the localized model presented in this paper and the globalized model published in [33], and the stress factor-based model [31] predict higher failure rates of floating offshore wind turbines than the others. Considering that the larger and more complex structures assembled, and further and deeper wind farms, resulted in insufficient maintenance and accessibility, floating equipment tended to fail more frequently than other types. Accordingly, the aforementioned method, including the proposed approach, corrected the failure rate in the right way.
- The relative error of the predicted failure rate from a holistic wind turbine point of view is less than 1% compared with the RIF- and risk-based models [33] (more than 1%) and the stress factor-based model (more than 2%). According to the results in Table 14, the relative error of the proposed method is not the lowest. However, it is worth adding that the primary contribution of the presented approach is that the approach extends the globalized RIF-and-subjective data-based models so that the failure rate correction can extend to component and element levels; this is the foundation of failure, risk, reliability, availability, and operation and maintenance investigations of floating offshore wind turbines with insufficient data.
7. Conclusions
Author Contributions
Funding
Institutional Review Board Statement
Informed Consent Statement
Data Availability Statement
Conflicts of Interest
Appendix A

| Components | Subcomponents | Failure Descriptions |
|---|---|---|
| Rotor | Hub | Hub broken |
| Main bearing | Bearing overheating; bearing seat failure | |
| Blade | Cracked; comes off; delamination; wear with Hub; replaced for a new standard | |
| Generator | Generator | Carbon brush failure *; slip ring failure *; cooling water pump failure *; generator elastic support failure; lubrication pump motor failure; cooling water tank failure; cooling fan failure; generator encoder failure; bearing failure; insufficient bearing grease; cable failure; generator converter short circuit. |
| Gearbox | Components | Temperature control valve failure; abnormal gear wear; gearbox respirator |
| Lubrication | Fe content exceeded; leak; lubrication pump filter failure *; lubrication pump motor failure *; seal damage; cooling water pump failure | |
| Electrical Facilities | Converter | Cooling failure; cable failure; contactor damage; fuse is blown; breaker failure; power failure *; circuit failure *; reactor damaged *; crowbar board failure *; current transformer failure *; communication module failure |
| SCADA | SCADA reports unknown data | |
| Control System | Yaw fuse failure; yaw contactor failure *; communication module; fiber damage *; yaw starter failure; unknown failure *; cooling fan; cable failure; shutdown | |
| Weather Units & Sensors | The wrong temperature reported *; pressure sensor damage; brake sensor failure; anemometer damage *; anemometer failure | |
| Pitch & Yaw | Gearbox & Motor | Wrong pitch angle *; Fe exceeding standard; leak, encoder damage *, malfunction |
| Electric & Controller | Fuse blown *; motor damage *; cable failure; power failure; blockage; pump damaged; pitch reducer leak, capacitor damage *; contactor damage; power overload *; cable failure; fuse blown; limit switch triggered by mistake *; slip rings * | |
| Yaw | Leak; structural damage; yaw reducer broken tooth | |
| Cooling & Hydraulics | Internal Cooling | Water cooling pump failure *; lubrication pump motor failure *; cooling water tank failure; seal damage *; water cooling switch *; water pump seal failure; air cooler failure; lubrication pump filter failure |
| External Colling | Motor failure *; blade failure *; cover failure; fan failure | |
| Hydraulic Units | Storage tank damage; storage tank leak gas and oil*; improper maintenance; electromagnetic valve damage *; storage tank low pressure (unknown reasons); periodical replacement of filter (half a year) **; hydraulic tubing leaks; brake pressure switch failure; hydraulic motor failure; filter failure | |
| Auxiliary | Auxiliary Components | Lightning protection belt broken; water leak; sunroof support rod damage; guardrail damage; shroud broken; beam crack; brake wear; climbing aid control element failure |
| Components | Subcomponents | RP | RPA | RWR | CWRO | CWRS | WSO | WSS | WFI | MTTR Average |
|---|---|---|---|---|---|---|---|---|---|---|
| Rotor | Blade | — | 8/4.5 | — | — | — | 3/0 | — | — | 3.3 |
| Hub | — | — | — | 1/2 | — | — | — | — | 2 | |
| Main Bearing | — | 2/0.6 | — | — | — | — | — | — | 0.6 | |
| Generator | Generator | 6/2.3 | 28/3.3 | 1/10 | — | 1/6 | — | 1/11 | — | 3.6 |
| Gearbox | Gearbox | — | 12/2.7 | — | — | — | — | — | — | 2.7 |
| Electrical Facilities | Converter | 8/5 | 41/3.4 | 1/1 | — | — | — | — | — | 3.6 |
| Monitoring and SCADA | 7/6.8 | 9/3.2 | — | — | — | — | — | 1/1 | 4.4 | |
| Weather Unit | 2/7.8 | 2/7 | — | — | — | — | — | — | 7.3 | |
| Pitch & Yaw | Pitch System | 6/3.8 | 18/3.3 | — | — | — | — | — | — | 3.4 |
| Yaw System | — | 4/4.2 | 1/0 | 1/0 | — | — | — | — | 2.8 | |
| Cooling & Hydraulics | Cooling System | 1/1 | 35/4 | 3/5.2 | 1/2 | 1/4 | — | — | — | 3.8 |
| Hydraulics | 3/3.9 | 53/3.2 | 1/0 | — | — | — | — | — | 3.2 | |
| Auxiliary | Brake | 1/19 | 2/1 | — | — | — | — | — | — | 7 |
| Sensor | — | 1/2 | — | — | — | — | — | — | 2 | |
| Nacelle | — | — | — | — | — | — | 1/7 | — | 7 | |
| MTTR Average | 5 | 3.4 | 3.8 | 1.3 | 5 | 0 | 9 | 1 | 3.6 | |
| Components | Subcomponents | Wind Farm #1 | Wind Farm #2 | Wind Farm #3 | Wind Farm #4 | ||||||||
|---|---|---|---|---|---|---|---|---|---|---|---|---|---|
| RT | TT | MTTR | RT | TT | MTTR | RT | TT | MTTR | RT | TT | MTTR | ||
| Rotor | Blade | — | — | — | 1236 | — | 0 | — | — | — | 0 | 2 | 4.5 |
| Hub | 0 | — | 2 | — | — | — | — | — | — | 1 | 0 | — | |
| Main Bearing | 0 | 7 | 0.6 | — | — | — | — | — | — | — | — | — | |
| Generator | Generator | 0 | 3 | 2.4 | 5 | 10 | 4.3 | 8 | 0 | 9.8 | 280 | 6 | 4.4 |
| Gearbox | Gearbox | 1 | 5 | 2.3 | 0 | — | — | 3 | 12 | 4.7 | 1 | — | 2.6 |
| Electrical Facilities | Converter | 1 | 6 | 2 | — | — | — | 467 | 0 | 9.8 | 6 | 5 | 4.7 |
| Monitoring and SCADA | 1 | 8 | 1 | 12 | — | 6 | 4 | 9 | 4.2 | 3 | 10 | 7 | |
| Sensor | — | — | — | — | — | — | — | — | — | 0 | 13 | 2 | |
| Weather Unit | — | — | — | 13 | — | 9 | 0 | 4 | 5 | 3 | 0 | 7.8 | |
| Pitch & Yaw | Pitch System | 2 | 9 | 3.6 | — | — | — | — | — | — | 7 | 7 | 3.2 |
| Yaw System | 0 | 0 | 4.2 | 0 | — | 0 | 0 | — | — | — | — | — | |
| Cooling & Hydraulic | Cooling System | 2 | 2 | 2.4 | 2 | 5 | 9 | 69 | 6.5 | 6.8 | 70 | 5 | 4.5 |
| Hydraulic | 0 | 5 | 2.6 | 8 | 6 | 1.7 | 63 | 7 | 5.9 | 1 | 5 | 4.2 | |
| Auxiliary | Brake | — | — | — | 14 | 12 | 9.5 | — | — | — | — | 13 | 2 |
| Nacelle | 0 | 1 | — | 3 | — | 7 | — | — | — | 0 | 7 | — | |
| Climbing Aid | — | — | — | 1 | — | — | — | — | — | — | — | ||
| Crane | — | — | — | — | — | — | — | — | — | 0 | 0 | — | |
| Average | 1 | 5 | 2.5 | 4 | 7 | 3.4 | 50 | 6 | 6.2 | 67 | 5 | 4.4 | |
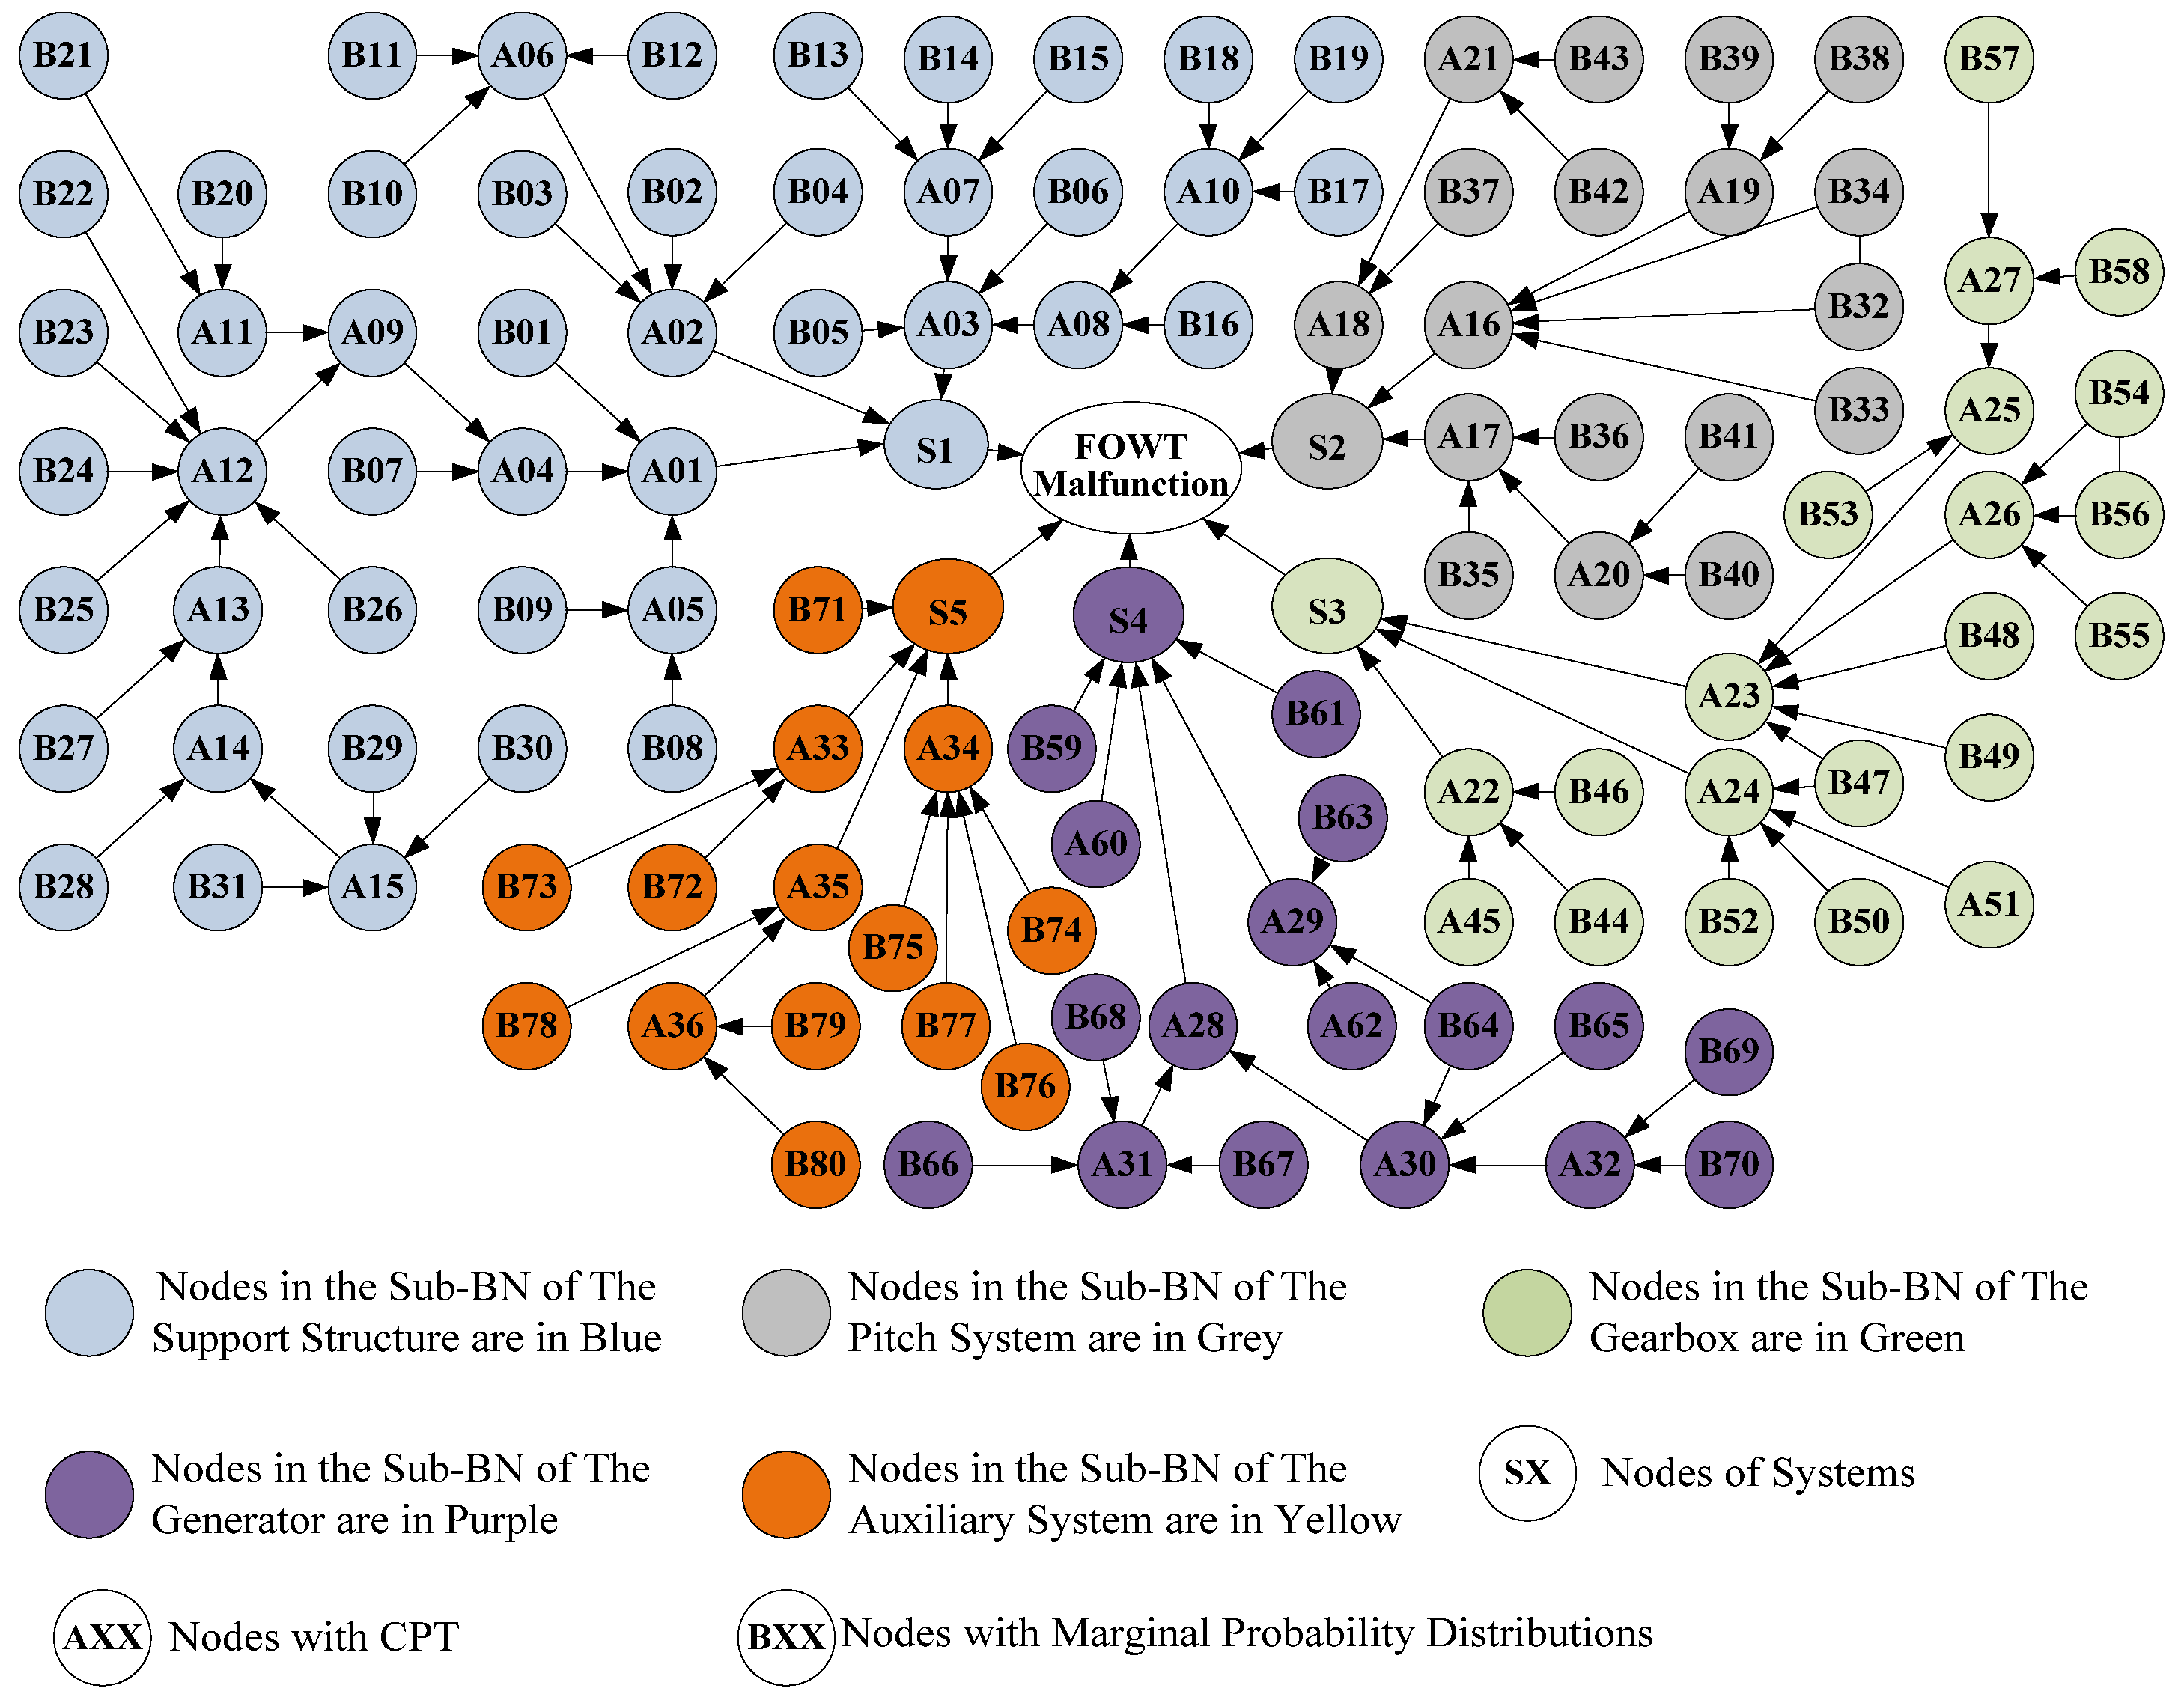
| Code | Failures | Code | Failures |
|---|---|---|---|
| S1—Support Structure | |||
| A01 | Mooring subsystem failure | B09 | Insufficient emergency measurement |
| A02 | Tower failure | B10 | Strong waves |
| A03 | Floating foundation failure | B11 | Lightning Strike |
| A04 | Device failure | B12 | Storm |
| A05 | Extreme sea conditions | B13 | Typhoon |
| A06 | Collapse due to environment | B14 | Plane crash |
| A07 | Hit by dropped objects | B15 | Biological collision |
| A08 | Watertightness fault | B16 | Inefficient detection |
| A09 | Other devise failures | B17 | Pipe joint corrosion |
| A10 | Pipe joint failure | B18 | Pipe joint weld defect |
| A11 | Fairlead failure | B19 | Pipe joint fatigue |
| A12 | Mooring lines broken | B20 | Fairlead corrosion |
| A13 | Mooring line breakage | B21 | Fairlead fatigue |
| A14 | Mooring line wear | B22 | Transitional chain wear |
| A15 | Accumulating wear | B23 | Friction chain wear |
| B01 | Human Error | B24 | Mooring winch failure |
| B02 | Resonance | B25 | Buoy friction chain wear |
| B03 | Faulty welding | B26 | Anchor pickup device damage |
| B04 | Material fatigue | B27 | Abnormal stress |
| B05 | Pillar damage | B28 | Invalid maintenance |
| B06 | Capsizing | B29 | Mooring line wear |
| B07 | Anchor failure | B30 | Mooring line fatigue |
| B08 | Poor operation environment | B31 | Mooring line corrosion |
| S2—Pitch System | |||
| A16 | Hydraulic system failure | B35 | Lighting protection failure |
| A17 | Alarm facility failure | B36 | Limit switch failure |
| A18 | Wrong pitch angle | B37 | Abnormal vibration |
| A19 | Hydraulic oil failure | B38 | Oil leakage |
| A20 | Power failure | B39 | Filter failure |
| A21 | Meteorological unit failure | B40 | Power 1 failure (the main power) |
| B32 | Hydraulic motor failure | B41 | Power 2 failure (the backup power) |
| B33 | Overpressure | B42 | Vane damage |
| B34 | Accumulator failure | B43 | Anemometer damage |
| S3—Gearbox | |||
| A22 | Lubrication failure | B49 | Pitting (gear) |
| A23 | Abnormal gear | B50 | Corrosion of pins |
| A24 | Bearing fault | B51 | Abrasive wear |
| A25 | Tooth wear (gears) | B52 | Pitting (gear bearing) |
| A26 | Cracks in gears | B53 | Gear tooth deterioration |
| A27 | The offset of tooth gears | B54 | Excessive pressure |
| B44 | Abnormal filter | B55 | Excess temperature |
| B45 | Poor-quality lubrication oil | B56 | Fatigue (gear) |
| B46 | Dirty lubrication oil | B57 | Poor design of tooth gears |
| B47 | Abnormal vibration (GB) | B58 | Tooth surface defects |
| B48 | Glued | ||
| S4—Generator | |||
| A28 | Rotor and stator failure | B63 | Structural deficiency |
| A29 | Bearing failure | B64 | Abnormal vibration (GE) |
| A30 | Abnormal signals | B65 | Abnormal instrument reading |
| A31 | No centricity generation | B66 | Failure to synchronize |
| A32 | Overheating | B67 | Broken bars |
| B59 | Measurement facility failure | B68 | Failure to start on demand |
| B60 | Wire fault | B69 | Sensor failure |
| B61 | Leak | B70 | Temperature above limitation |
| B62 | Asymmetry | ||
| S5—Auxiliary System | |||
| A33 | Speed train failure | B74 | Controller failure |
| A34 | Electric component failure | B75 | Transformer failure |
| A35 | Blade failure | B76 | Sensor failure |
| A36 | Rotor failure | B77 | Converter failure |
| B71 | Yaw subsystem failure | B78 | Blade structure failure |
| B72 | Drive train failure | B79 | Hub failure |
| B73 | Brake failure | B80 | Bearing failure |
References
- Sadorsky, P. Wind energy for sustainable development: Driving factors and future outlook. J. Clean. Prod. 2021, 289, 125779. [Google Scholar] [CrossRef]
- Willis, D.J.; Niezrecki, C.; Kuchma, D.; Hines, E.; Arwade, S.R.; Barthelmie, R.J.; DiPaola, M.; Drane, P.J.; Hansen, C.J.; Inalpolat, M.; et al. Wind energy research: State-of-the-art and future research directions. Renew. Energy 2018, 125, 133–154. [Google Scholar] [CrossRef]
- Díaz, H.; Guedes Soares, C. Review of the current status, technology and future trends of offshore wind farms. Ocean Eng. 2020, 209, 107381. [Google Scholar] [CrossRef]
- Díaz, H.; Serna, J.; Nieto, J.; Guedes Soares, C. Market needs, opportunities and barriers for the floating wind industry. J. Mar. Sci. Eng. 2022, 10, 934. [Google Scholar] [CrossRef]
- Johnston, B.; Foley, A.; Doran, J.; Littler, T. Levelised cost of energy, A challenge for offshore wind. Renew. Energy 2020, 160, 876–885. [Google Scholar] [CrossRef]
- Hussain, W.; Khan, S.; Mover, A.H. Development of quality, environment, health, and safety (QEHS) management system and its integration in operation and maintenance (O&M) of onshore wind energy industries. Renew. Energy 2022, 196, 220–233. [Google Scholar]
- Li, H.; Huang, C.G. Guedes Soares, C. A real-time inspection and opportunistic maintenance strategies for floating offshore wind turbines. Ocean Eng. 2022, 256, 111433. [Google Scholar] [CrossRef]
- Castro-Santos, L.; Bento, A.R.; Silva, D.; Salvação, N.; Guedes Soares, C. Economic feasibility of floating offshore wind farms in the north of Spain. J. Mar. Sci. Eng. 2020, 8, 58. [Google Scholar] [CrossRef] [Green Version]
- Scheu, M.N.; Tremps, L.; Smolka, U.; Kolios, A.; Brennan, F. A systematic Failure Mode Effects and Criticality Analysis for offshore wind turbine systems towards integrated condition based maintenance strategies. Ocean Eng. 2019, 176, 118–133. [Google Scholar] [CrossRef]
- Li, H.; Díaz, H.; Guedes Soares, C. A failure analysis of floating offshore wind turbines using AHP-FMEA methodology. Ocean Eng. 2021, 234, 109261. [Google Scholar] [CrossRef]
- Castro-Santos, L.; Silva, D.; Bento, A.R.; Salvacao, N.; Guedes Soares, C. Economic feasibility of floating offshore wind farms in Portugal. Ocean Eng. 2020, 207, 107393. [Google Scholar] [CrossRef]
- Li, H.; Diaz, H.; Guedes Soares, C. A developed failure mode and effect analysis for floating offshore wind turbine support structures. Renew. Energy 2021, 164, 133–145. [Google Scholar] [CrossRef]
- Li, H.; Teixeira, A.P.; Guedes Soares, C. A two-stage Failure Mode and Effect Analysis of offshore wind turbines. Renew. Energy 2020, 162, 1438–1461. [Google Scholar] [CrossRef]
- Bento, N.; Fontes, M. Emergence of floating offshore wind energy: Technology and industry. Renew. Sustain. Energy Rev. 2019, 99, 66–82. [Google Scholar] [CrossRef]
- Li, H.; Teixeira, A.P.; Guedes Soares, C. An Improved Failure Mode and Effect Analysis of Floating Offshore Wind Turbines. J. Mar. Sci. Eng. 2022, 10, 1616. [Google Scholar] [CrossRef]
- Sinha, Y.; Steel, J.A. A progressive study into offshore wind farm maintenance optimisation using risk based failure analysis. Renew. Sustain. Energy Rev. 2015, 42, 735–742. [Google Scholar] [CrossRef]
- Martinez, A.; Iglesias, G. Mapping of the levelised cost of energy for floating offshore wind in the European Atlantic. Renew. Sustain. Energy Rev. 2022, 154, 111889. [Google Scholar] [CrossRef]
- Li, H.; Guedes Soares, C.; Huang, H.Z. Reliability analysis of a floating offshore wind turbine using Bayesian Networks. Ocean Eng. 2020, 217, 107827. [Google Scholar] [CrossRef]
- Dao, C.; Kazemtabrizi, B.; Crabtree, C. Wind turbine reliability data review and impacts on levelised cost of energy. Wind Energy 2019, 22, 1848–1871. [Google Scholar] [CrossRef] [Green Version]
- Santos, F.P.; Teixeira, A.P.; Guedes Soares, C. Review of wind turbine accident and failure data. In Renewable Energies Offshore; Guedes Soares, C., Ed.; Taylor & Francis Group: London, UK, 2015; pp. 953–959. [Google Scholar]
- Carroll, J.; McDonald, A.; Dinwoodie, I.; McMillan, D.; Revie, M.; Lazakis, I. Availability, operation and maintenance costs of offshore wind turbines with different drive train configurations. Wind Energy 2017, 20, 361–378. [Google Scholar] [CrossRef] [Green Version]
- Tavner, P.J.; Xiang, J.; Spinato, F. Reliability analysis for wind turbines. Wind Energy 2007, 10, 1–18. [Google Scholar] [CrossRef]
- Ribrant, J.; Bertling, L. Survey of failures in wind power systems with focus on Swedish wind power plants during 1997–2005. In Proceedings of the 2007 IEEE Power Engineering Society General Meeting, Tampa, FL, USA, 24–28 June 2007; pp. 1–8. [Google Scholar] [CrossRef]
- Faulstich, S.; Hahn, B.; Tavner, P.J. Wind turbine downtime and its importance for offshore deployment. Wind Energy 2011, 14, 327–337. [Google Scholar] [CrossRef]
- Stenberg, A.; Holttinen, H. Analysing failure statistics of wind turbines in Finland. In Proceedings of the 2010 European Wind Energy Conference and Exhibition, Warsaw, Poland, 20–23 April 2010; pp. 3985–3995. [Google Scholar]
- Crabtree, C.J.; Zappalá, D.; Hogg, S.I. Wind energy: UK experiences and offshore operational challenges. Proc. Inst. Mech. Eng. Part A J. Power Energy 2015, 229, 727–746. [Google Scholar] [CrossRef] [Green Version]
- Carroll, J.; McDonald, A.; McMillan, D. Failure rate, repair time and unscheduled O&M cost analysis of offshore wind turbines. Wind Energy 2016, 19, 1107–1119. [Google Scholar]
- Spinato, F.; Tavner, P.J.; Van Bussel, G.J.; Koutoulakos, E. Reliability of wind turbine subassemblies. IET Renew. Power Gener. 2009, 3, 387–401. [Google Scholar] [CrossRef] [Green Version]
- Adedipe, T.; Shafiee, M.; Zio, E. Bayesian network modelling for the wind energy industry: An overview. Reliab. Eng. Syst. Saf. 2020, 202, 107053. [Google Scholar] [CrossRef]
- Yeter, B.; Garbatov, Y.; Guedes Soares, C. Risk-based maintenance planning of offshore wind turbine farms. Reliab. Eng. Syst. Saf. 2020, 202, 107062. [Google Scholar] [CrossRef]
- Yeter, B.; Garbatov, Y.; Guedes Soares, C. Life-extension classification of offshore wind assets using unsupervised machine learning. Reliab. Eng. Syst. Saf. 2022, 219, 108229. [Google Scholar] [CrossRef]
- Eryilmaz, S. Reliability analysis of multi-state system with three-state components and its application to wind energy. Reliab. Eng. Syst. Saf. 2018, 172, 58–63. [Google Scholar] [CrossRef]
- Li, H.; Guedes Soares, C. Assessment of failure rates and reliability of floating offshore wind turbines. Reliab. Eng. Syst. Saf. 2022, 228, 108777. [Google Scholar] [CrossRef]
- Zhang, X.; Sun, L.; Sun, H.; Guo, Q.; Bai, X. Floating offshore wind turbine reliability analysis based on system grading and dynamic FTA. J. Wind Eng. Ind. Aerodyn. 2016, 154, 21–33. [Google Scholar] [CrossRef]
- Kang, J.; Guedes Soares, C. An opportunistic maintenance policy for offshore wind farms. Ocean Eng. 2020, 216, 108075. [Google Scholar] [CrossRef]
- Santos, F.P.; Teixeira, A.P.; Guedes Soares, C. An age-based preventive maintenance for offshore wind turbines. In Safety and Reliability: Methodology and Applications; Nowakowski, T., Mlynczak, M., Jodejko-Pietruczuk, A., Werbinska-Wojciechowska, S., Eds.; CRC Press: Boca Raton, FL, USA, 2014; pp. 1183–1192. [Google Scholar]
- Rahimi, M.; Rausand, M. Prediction of failure rates for new subsea systems: A practical approach and an illustrative example. Proc. Inst. Mech. Eng. Part O J. Risk Reliab. 2013, 227, 629–640. [Google Scholar] [CrossRef]
- Bhardwaj, U.; Teixeira, A.P.; Guedes Soares, C. Bayesian framework for reliability prediction of subsea processing systems accounting for influencing factors uncertainty. Reliab. Eng. Syst. Saf. 2022, 218, 108143. [Google Scholar] [CrossRef]
- Brissaud, F.; Charpentier, D.; Fouladirad, M.; Barros, A.; Bérenguer, C. Failure rate evaluation with influencing factors. J. Loss Prev. Process Ind. 2010, 23, 187–193. [Google Scholar] [CrossRef]
- Wilkinson, M.; Harman, K.; Hendriks, B.; Spinato, F.; van Delft, T. Measuring wind turbine reliability-results of the Reliawind project. In Proceedings of the 2011 EWEA Conference, Brussels, Belgium, 14–17, March 2011; pp. 1–8. [Google Scholar]
- Santos, F.; Teixeira, A.P.; Guedes Soares, C. Modelling and simulation of the operation and maintenance of offshore wind turbines. Proc. Inst. Mech. Eng. Part O J. Risk Reliab. 2015, 229, 385–393. [Google Scholar] [CrossRef]
- Kang, J.; Sun, L.; Guedes Soares, C. Fault Tree Analysis of floating offshore wind turbines. Renew. Energy 2019, 133, 1455–1467. [Google Scholar] [CrossRef]
- Bhardwaj, U.; Teixeira, A.P.; Guedes Soares, C. Reliability prediction of an offshore wind turbine gearbox. Renew. Energy 2019, 141, 693–706. [Google Scholar] [CrossRef]


| Country | Names of Databases | Number of WTs | Years |
|---|---|---|---|
| Germany | WindStats Germany, LWK, WMEP | 6428 | 1989–2006 |
| Denmark | WindStats Denmark | 2345 | 1994–2004 |
| Finland | VTT | 72 | 1996–2008 |
| Sweden | Sweden | 723 | 1997–2005 |
| Spain | CIRCE | 4300 | ~2013 |
| USA | CREW | 800–900 | 2011–2015 |
| India | India | 15 | 2000–2004 |
| China | Huadian, East China, SE China | 1555 | 2009–2013 |
| UK | Round 1 UK *, SPARTA *, Strathclyde | 1516 | 2004–2016 |
| Netherlands | NoordzeeWind | 36 | 2007–2009 |
| —— | LGS-Onshore ** | 76 | 2018–2020 |
| Component | Normal Failure | Critical Failure | Extremely Critical Failure |
|---|---|---|---|
| Rotor | 17 | 3 | 1 |
| Generator | 49 | 22 | 7 |
| Gearbox | 14 | 5 | 2 |
| Electrical Facilities | 89 | 8 | 7 |
| Pitch & Yaw | 36 | 10 | _ |
| Cooling & Hydraulics | 109 | 23 | 9 |
| Auxiliary | 11 | 1 | _ |
| Summary | (327 failures) | (82 failures) | (25 failures) |
| Wind Turbine Type | Wind Farm Installed | Normal Failure | Critical Failure | Extremely Critical Failure |
|---|---|---|---|---|
| Wind turbine model #1 | #1 | 167 | 23 | 3 |
| Wind turbine model #2 | #3 | 30 | 9 | 11 |
| Wind turbine model #3 | #3 | 2 | 2 | 4 |
| Wind turbine model #4 | #4 | 104 | 22 | 3 |
| Wind turbine model #5 | #2 | 17 | 21 | 5 |
| Wind Farms | Normal Failure | Critical Failure | Extremely Critical Failure |
|---|---|---|---|
| Wind farm #1 | 167 | 23 | 3 |
| Wind farm #2 | 17 | 21 | 5 |
| Wind farm #3 | 32 | 11 | 15 |
| Wind farm #4 | 104 | 22 | 3 |
| Wind Farm | Wind Farm #1 | Wind Farm #2 | Wind Farm #3 | Wind Farm #4 | Average |
|---|---|---|---|---|---|
| CFR | 11.9% | 39.5% | 15.5% | 16.3% | 20.8% |
| ECFR | 1.2% | 20.9% | 25.9% | 2.3% | 12.6% |
| CFWT/MTTF | 0.45/2.2 | 1/1 | 0.13/7.7 | 0.9/1.1 | 0.62/1.6 |
| ECFWT/MTTF | 0.06/16.7 | 0.53/1.9 | 0.31/3.2 | 0.13/7.7 | 0.34/2.9 |
| Components | Subcomponents | MTTF/h | Failure Rate/Year |
|---|---|---|---|
| Rotor | Blades | 50,563 | 0.1732 |
| Hub | 126,407 | 0.0693 | |
| Main Bearing | 758,441 | 0.0116 | |
| Main Shift | 758,441 | 0.0116 | |
| Generator | Generator | 9979 | 0.8778 |
| Gearbox | Gearbox | 26,153 | 0.3350 |
| Electrical Facilities | Converter | 12,641 | 0.6930 |
| Monitoring and SCADA | 29,171 | 0.3003 | |
| Weather Unit | 68,949 | 0.1271 | |
| Pitch & Yaw | Pitch System | 21,068 | 0.4158 |
| Yaw System | 94,805 | 0.0924 | |
| Cooling & Hydraulics | Cooling System | 10,835 | 0.8085 |
| Hydraulic | 10,390 | 0.8431 | |
| Auxiliary | Crane | 758,441 | 0.0116 |
| Climbing Aid | 758,441 | 0.0116 | |
| Brake | 252,814 | 0.0346 | |
| Nacelle | 84,271 | 0.1040 |
| Integrated Components | Lifetime/ Weibull’s Distribution | Integrated Components | Lifetime/ Weibull’s Distribution |
|---|---|---|---|
| Rotor | SC (1321); SP (0.79) | Pitch & Yaw | SC (2144); SP (0.77) |
| Generator | SC (1894); SP (0.8) | Cooling & Hydraulics | SC (2793); SP (0.78) |
| Gearbox | SC (2449); SP (0.81) | Auxiliary | SC (759); SP (0.6) |
| Electrical Facilities | SC (2829); SP (0.83) | SC: scale parameter; SP: shape parameter | |
| Subcomponent | Elements | Number of Failures | Subcomponent | Elements | Number of Failures |
|---|---|---|---|---|---|
| Generator | Pump Motor | 2 | Hub | Steel Frame | 3 |
| Screw Nut | 1 | Pitch System | Lubrication Oil | 3 | |
| Cooling Fan | 1 | Convertor | Cooling Fan | 1 | |
| Slip Ring | 6 | Circuit Board | 2 | ||
| Encoder | 4 | Gearbox | Pump Motor | 4 | |
| Bearing | 1 | Lubrication Oil | 2 | ||
| Water Pump | 1 | Nacelle | Sunroof Support | 2 | |
| Sensor | 1 | Guardrail | 1 | ||
| Hydraulic | Storage tank | 1 | Cooling System | Sensor | 2 |
| Electromagnetic valve | 1 | Water Tank | 1 | ||
| Oil Hose | 1 | Pump Motor | 3 | ||
| Switch | 1 | Cooling Fan | 1 | ||
| Filter | 1 | Switch | 4 | ||
| Nacelle Cooling | Motor | 3 | Control System | Cable | 3 |
| Fan | 2 | Switch | 1 | ||
| Weather Unit | Anemometer | 5 | Yaw System | Brake | 1 |
| Climbing Aid | Control elements | 1 | Oil Hose | 1 |
| RTs of Maintenance/Hour (Average RT) | Extremely Critical Failures | Critical Failures | Normal Failures | RT Average |
|---|---|---|---|---|
| Repaired | — | 12 | 6 | 6.3 |
| Replaced | — | 1 | 4 | 3.9 |
| Repaired and waiting for replacement | — | 1 | 2 | 1.5 |
| Checked and waiting for replacement (operating) | — | 4 | 1 | 3.2 |
| Checked and waiting for replacement (stopped) | — | 1 | — | 1 |
| Waiting for Suppliers (operating) | — | 1 | 1 | 1 |
| Waiting for Suppliers (stopped) | — | 0 | 25 | 16.7 |
| Waiting for further instructions | 13 | 1 | 1 | 1 |
| RT Average | 13 | 2.2 | 4 | 4.3 |
| STS of Components/h (Number of Failures/Average TT) | Spare parts in Wind Farm Storeroom | Spare Parts in Manufacturer Storeroom | TT Average |
|---|---|---|---|
| Rotor | — | 9/1.6 | 1.6 |
| Generator | 8/3 | 14/5.3 | 4.5 |
| Gearbox | 4/3 | 10/6 | 5.1 |
| Electrical Facilities | 20/3.9 | 22/7.7 | 5.9 |
| Pitch & Yaw System | 13/6.9 | 7/8 | 7.3 |
| Cooling & Hydraulics | 55/6.2 | 25/3.6 | 5.4 |
| Auxiliary | 2/12.5 | 1/1 | 8.7 |
| Average | 5.6 | 5.3 | 5.5 |
| Rating | Occurrence | Rating | Occurrence | ||
|---|---|---|---|---|---|
| Probability (P) | Description | Probability (P) | Description | ||
| 1 | P < 10−5 | Extremely low | 6 | 2 × 10⁻³ < P < 1 × 10⁻² | Moderate |
| 2 | P = 10−5 | Remote | 7 | 10−2 < P < 4 × 10⁻² | Frequent |
| 3 | P = 10−5 | Very slight | 8 | 4 × 10⁻³ < P < 0.2 | High |
| 4 | 10−5 < P < 4 × 10⁻⁴ | Slight | 9 | 0.2 < P<0.33 | Very high |
| 5 | 4 × 10⁻⁴ < P < 2 × 10⁻³ | Occasional | 10 | P > 0.33 | Extremely high |
| Components | Subcomponents | Transformation Factor | Failure Rates, Onshore | Failure Rates, Corrected | |
|---|---|---|---|---|---|
| Amount/Year | Rank | ||||
| Rotor | Blades | 1.353 | 5 | 0.173 | 0.234 |
| Hub | 1.224 | 7 | 0.069 | 0.085 | |
| Main Bearing | 0.909 | 10 | 0.012 | 0.011 | |
| Main Shift | 1.371 | 4 | 0.012 | 0.012 | |
| Generator | Generator | 1.211 | 8 | 0.878 | 1.063 |
| Gearbox | Gearbox | 1.232 | 6 | 0.335 | 0.413 |
| Electrical Facilities | Converter | 1.531 | 3 | 0.693 | 1.060 |
| Transformer | 1.555 | 2 | 0.042 ** | 0.066 | |
| Monitoring and SCADA | — | — | 0.300 | 0.300 * | |
| Weather Unit | — | — | 0.127 | 0.127 * | |
| Electronics & Controller | 1.688 | 1 | 0.730 ** | 1.235 | |
| Pitch & Yaw | Pitch System | 0.906 | 11 | 0.416 | 0.377 |
| Yaw System | 1.166 | 9 | 0.092 | 0.108 | |
| Cooling & Hydraulics | Cooling System | — | — | 0.809 | 0.809 * |
| Hydraulics | — | — | 0.843 | 0.843 * | |
| Auxiliary | Crane | — | — | 0.012 | 0.012 * |
| Climbing Aid | — | — | 0.012 | 0.012 * | |
| Brake | — | — | 0.035 | 0.035 * | |
| Nacelle | — | — | 0.104 | 0.104 * | |
| Models | Failure Rate Disparity with Onshore Devices | ||
|---|---|---|---|
| Amount * | Higher/Lower | Model Features | |
| [33] | 26% | Higher | RIF- and subjective data-based models—Globalized |
| [36] | 75% | Higher | Stress factor-based model |
| [37] | 3.3% | Higher | RIF- and risk-based models |
| [38] | 19% | Higher | RIF- and uncertainty-based models |
| [39] | 18% ** | Higher | RIF interval-based model |
| [Present] | 28.6% | Higher | RIF- and subjective data-based model—Localized |
| Failure Rate Correction Models | Failure Rate/ Failure/Turbine/Year | MTTF/Hour | Relative Error / in % | ||
|---|---|---|---|---|---|
| Onshore | Offshore * | Onshore | Offshore * | ||
| [Present] | 8.3 | 8.37 | 1055 | 1046 | −0.85 |
| [33] | 8.34 | 1050 | −0.47 | ||
| [36] | 8.49 | 1031 | −2.27 | ||
| [37] | 8.21 | 1066 | 1.04 | ||
| [38] | 8.25 | 1061 | 0.57 | ||
| [39] | 8.24 | 1063 | 0.76 | ||
Publisher’s Note: MDPI stays neutral with regard to jurisdictional claims in published maps and institutional affiliations. |
© 2022 by the authors. Licensee MDPI, Basel, Switzerland. This article is an open access article distributed under the terms and conditions of the Creative Commons Attribution (CC BY) license (https://creativecommons.org/licenses/by/4.0/).
Share and Cite
Li, H.; Peng, W.; Huang, C.-G.; Guedes Soares, C. Failure Rate Assessment for Onshore and Floating Offshore Wind Turbines. J. Mar. Sci. Eng. 2022, 10, 1965. https://doi.org/10.3390/jmse10121965
Li H, Peng W, Huang C-G, Guedes Soares C. Failure Rate Assessment for Onshore and Floating Offshore Wind Turbines. Journal of Marine Science and Engineering. 2022; 10(12):1965. https://doi.org/10.3390/jmse10121965
Chicago/Turabian StyleLi, He, Weiwen Peng, Cheng-Geng Huang, and C. Guedes Soares. 2022. "Failure Rate Assessment for Onshore and Floating Offshore Wind Turbines" Journal of Marine Science and Engineering 10, no. 12: 1965. https://doi.org/10.3390/jmse10121965