Article

Design and Implementation of 3-D Measurement Method for Container Handling Target

1
Container Supply Chain Technology Engineering Research Center, Ministry of Education, Shanghai Maritime University, Shanghai 201306, China
2
Logistics Science and Engineering Research Institute School, Shanghai Maritime University, Shanghai 201306, China
3
Logistics Engineering College, Shanghai Maritime University, Shanghai 201306, China
4
Shanghai SMUVision Smart Technology Ltd., Shanghai 201306, China
5
Instituto de Telecomunicações ISCTE—Instituto Universitário de Lisboa, 1649-026 Lisbon, Portugal
*
Author to whom correspondence should be addressed.
J. Mar. Sci. Eng. 2022, 10(12), 1961; https://doi.org/10.3390/jmse10121961
Submission received: 30 September 2022 / Revised: 8 November 2022 / Accepted: 2 December 2022 / Published: 9 December 2022
(This article belongs to the Section Ocean Engineering)

Abstract

:
In the process of automatic container terminal loading and unloading, the three-dimensional attitude of the container affects the security of loading and unloading operations, so the three-dimensional attitude positioning of the container is very important. In this paper, a visual non-contact measurement method is used to realize the real-time orientation of the three-dimensional attitude of the container. First, the container corner is coarsely positioned by a small-scale deep learning network. Secondly, the precise position of the container keyhole is obtained by the secondary positioning of the container corner through the traditional image processing algorithm, and the container posture is measured in three dimensions by combining the physical motion model of the container during loading and unloading. After testing, unlike previous measurement methods, the measurement accuracy of this method met the requirements of automatic loading and unloading of container terminals, and the measurement time met the requirements of real-time measurement.

1. Introduction

An automated container terminal replaces manual operation by machine, and offers the advantages of high operative efficiency, high safety and reliability, low environmental pollution, and saving of manpower [1], all of which are vital to the inevitable development trend of the container terminals of the future. Rail-mounted gantry cranes are the main equipment for automated container terminal yard operations, responsible for container loading and unloading between the container yard and container trucks (hereinafter referred to as trucks). In the process of container loading and unloading, if an accident occurs, such as the truck lifting up or the container overturns, it is necessary to obtain the attitude information of the container and frame through three-dimensional measurement, re-position the container and lift it again. In order to avoid serious economic and safety losses caused by accidents during the container lifting process, it is particularly important to measure the three-dimensional attitude of the container. The three-dimensional attitude of the container means that, during the loading and unloading of the container, due to improper operation of the spreader, the container shifts to different degrees in the three directions of X, Y, and Z in the space coordinate system.
The traditional three-dimensional attitude positioning of containers relies on LiDAR [2,3], which can scan the contour of a container and analyze the posture change of a container in real time. LiDAR has the advantages of high detection accuracy and is not easily affected by weather and light conditions. However, in practical applications, LiDAR calibration is difficult and the cost is too high to be suitable for most terminals.
With the rapid development of machine vision technology, vision-based measurement adopts a non-contact mode of operation [4], which has the advantages of low cost, high precision, and all-weather work. It is widely used in different fields, such as navigation [5], aerospace [6], industry [7] and military [8]. Vision-based 3D attitude measurement can be divided into monocular vision measurement, binocular vision measurement and multi-view vision measurement [9], according to the number of cameras. The monocular vision system only uses a single vision sensor and has the advantages of simple structure and fast calculation speed, so it is widely used in practical projects.
The attitude measurement based on monocular vision is divided into traditional image processing algorithms and deep learning algorithms. Traditional image processing algorithms can achieve high accuracy but lack real-time performance, and cannot cope with complex environments [10]. The deep learning algorithms use convolutional neural networks to extract deeper features in an end-to-end manner to detect and classify targets [11,12].
The attitude measurement method based on deep learning is roughly divided into three directions:
(1)
Directly detect the three-dimensional attitude of the target in RGB images, such as YOLO-6D [13], Pose-RCNN [14], DOPE [15] and other algorithms. The key is to find the center of the target in the RGB image, and then return to the centroid of the target in the camera coordinate system, to realize the pose detection of the target. Although the attitude detection of the target can be performed directly, the algorithm is usually too complicated and the real-time performance is relatively poor, so it must rely on high-performance computers.
(2)
Define multiple target attitudes in advance as annotation information, and transform the attitude estimation problem into a classification problem. This method is often used for attitude detection of non-cooperative targets [16,17]. For example, Sharma et al. [18], at Stanford University, proposed a non-cooperative target attitude estimation method, based on convolutional neural network. However, the actual application of the target attitude changes was diverse and could not be directly applied.
(3)
The deep learning network is combined with traditional image processing methods to solve the target attitude by establishing a model [19,20]. This method can not only detect targets well in environments with poor lighting and weather conditions, but also greatly reduces the complexity of the model, so that it can meet the requirements of real-time detection in embedded computing devices with low performance and limited working space. Our team used the above methods to identify and measure the truck wheel target [21] and the top hole of the container corner [22] in the early stage, but could only complete the measurement in a single direction, and could not measure the attitude of the container in three dimensions with the methods.
In this paper, we propose an algorithm that combines deep learning networks with traditional image processing algorithms to detect, in real time, the three-dimensional posture of containers during loading and unloading. Firstly, the method uses a small-scale deep learning network to quickly locate the container corner, and combines the target tracking network to accurately track the target during the loading and unloading process. Since the container keyhole target belongs to a small target, we modified the single-stage target detection algorithm SSD [23] to adapt it to small target detection. Secondly, the traditional image processing algorithm was used to re-locate the container corner to obtain the accurate position of the container keyhole, and, according to the movement of the container during the loading and unloading process, to establish the measurement model to measure the container attitude in three dimensions. This article is organized as follows: Section 2 introduces the measurement system and its principles. Section 3 gives the method of measurement of container three-dimensional attitude. Section 4 is the experimental part.

2. Vision-Based Measurement System

The vision-based measurement system for container handling proposed in this work consists of an image processing unit, several industrial cameras, and brackets for fixing the cameras, as presented in Figure 1. The camera is used to capture the image of the side of the container during the unloading operation. There are no less than two cameras. The resolution of the camera is 1980×1080, the FPS is 24 and the installation position of the camera can capture the position of the front and rear lock pins of the container.
In the process of container loading and unloading, accidents, such as the truck lifting and overturning of the container, can occur. In order to avoid such accidents, the proposed system uses a camera to collect the three-dimensional attitude changes of the container keyhole during the loading and unloading process, and realizes three-dimensional measurement during container loading and unloading. The container keyhole is shown in Figure 2. The container keyhole is also called the container corner hole. The container corner hole is divided into a top hole, a bottom hole, an end hole and a side hole. The container corner piece side hole is used to fix the container, and so plays a huge role in the container lifting operation. The research object of this paper was mainly the side hole of container corner parts.

3. Visual Measurement Algorithm

The proposed visual measurement algorithm includes three parts: the tracking network, based on detection, the target secondary positioning network and the three-dimensional measurement algorithm. The detection-based tracking network is divided into two parts: target detection and target tracking. The target detection network uses a convolutional network structure and introduces an attention mechanism to improve the ability to extract keyhole features. The tracking part uses the simplified Deep SORT [24] (Deep Simple Online and Realtime Tracking) to predict the trajectory of the keyhole target in subsequent frames and calculates the Mahalanobis distance and GIOU (Generalized Intersection over Union) distance of the detection frame and the tracking frame for data association to obtain the keyhole tracking trajectory. The target secondary positioning network uses the traditional image detection algorithm to perform secondary positioning of the container keyhole on the basis of target detection and tracking, and obtains the accurate position of the container keyhole. The three-dimensional measurement algorithm uses the camera imaging principle to measure the three-dimensional attitude of the container keyhole to estimate the container attitude, so as to realize the three-dimensional measurement of the container loading and unloading process. The overall flowchart of the algorithm is shown in Figure 3.

3.1. Detection-Based Tracking Algorithm

3.1.1. Target Detection Algorithm

The detected object is expressed by the container keyhole, and is a small target. The current algorithms, such as the single-stage target detection algorithm or the two-stage target detection algorithm, cannot balance the accuracy and speed of small target detection. SSD has the advantages of a simple model and fast detection speed in the target detection algorithm, and also has good performance on low-performance devices. Therefore, this paper uses the backbone network Resnet-18 [25] with stronger feature extraction ability in the original SSD network instead of VGG-16 [26]. An attention mechanism, namely, R-E-SSD, is introduced to improve the accuracy of small target detection while maintaining a faster detection speed. The residual network (Resnet-18) can deepen the network depth, improve the network feature extraction ability and solve the problem of gradient disappearance very well. The R-E-SSD algorithm architecture is shown in Figure 4.
The original SSD model uses VGG-16 as the feature extraction network, but the VGG-16 network has a large number of parameters and slow calculation speed, which cannot meet the requirements of real-time classification and detection of container keyholes. Therefore, in this work, Resnet-18 deep residual network was considered for feature extraction. The network has only 18 layers and has faster calculation speed. Its floating-point calculation amount is one tenth that of the VGG-16 network, and can better meet the requirements of real-time classification detection, as well as ensuring the model converges faster during training, and, thus, reducing training time.
In order to enable the network to automatically learn the correlation between feature map channels, a lightweight and efficient attention mechanism, ECA-Net [27], is introduced to enhance useful information and remove redundant features without increasing network computation. ECA-Net is a non-dimensionality local cross-channel interaction strategy and kernel size adaptive selection method, which acquires cross-channel interaction information in an extremely lightweight way. The network first pools each channel of the input feature map to obtain a global receptive field, and then directly performs local cross-channel connections; that is, a one-dimensional convolution operation is performed by considering each channel obtained by the pooling operation and its k adjacent channels. The value of k is adaptively determined by the number of channels C :
ψ C = log 2 C γ + b γ o d d
Among them,   o d d represents the odd number close to the result, and γ , b represent constants, which are 2 and 1, respectively. The structure diagram of the ECA-Net network model is shown in Figure 5.

3.1.2. Tracking Algorithm

In the process of container loading and unloading, relying only on the deep learning algorithm, to detect the targets of each frame of image, consumes a lot of memory and it is difficult to achieve real-time results. Therefore, Deep SORT, a detection-based tracking network, was used to track the movement of container keyholes in subsequent frames. The tracking effect of Deep SORT largely depends on the detection effect of the detector. The Deep SORT detector is the R-E-SSD proposed above.
The Deep SORT workflow is divided into three steps: prediction, observation, and update. In the prediction stage, Kalman filtering is used to initialize the motion variables and predict the target position in the next frame. Kalman filter is a widely used optimal tracking algorithm for linear systems. The detection frame rate obtained by the above detection algorithm is 30.7 frames/s. During the truck loading and unloading operation, the spreader is lifted vertically, and the vertical position of the container keyhole between the video sequences changes very little, so the motion can be considered uniform. Therefore, the time change of the container keyhole tracking system is considered linearly correlated. The Kalman filter uses uniform and linear observation models to predict and update the target trajectory. The Kalman filter state variable is constructed as shown in (2), where u and v are the center coordinates of the target detection result, and τ , h are the aspect ratio and height of the target detection result, respectively. The values u · , v · , τ · , h · are the target position of the next frame predicted by the Kalman filter:
X = [ u , v , τ , h , u · , v · , τ · , h · ] T
The Hungarian algorithm is a combinatorial optimization algorithm for solving the task assignment problem in polynomial time. In computational complexity theory, polynomial time means that the computational time of a problem is not greater than a polynomial multiple of the problem size. The mathematical description is: m ( n ) = O ( n k ) , where k is a constant value. In this paper, it was used to establish the relationship between the detection target and the prediction target, that is, to match the target data. The detection results and the prediction results were obtained by the R-E-SSD algorithm and the Kalman filter, respectively, and the similarity between the prediction results and the detection results was measured by Mahalanobis distance. The calculation of Mahalanobis distance is shown in Formula (3), where d i , j is the motion matching value between trajectory i and detection result j , S i is the covariance matrix of the observation space of the frame, which is obtained by Kalman filter:
d i , j = ( d j y j ) T S i 1 ( d j y j )
In the data matching stage, the Hungarian algorithm was used to find the optimal matching solution between the prediction result and the detection result, as shown in Formula (4):
min Z = i = 1 m j = 1 n d i , j x i , j
If the matching is successful, it enters the update stage of the Kalman filter, where m and n are the number of tracked targets and the number of detected targets, respectively.
Data matching failure is mainly divided into tracking target matching failure and detection target matching failure. The failure to match the tracking target is caused by missed detection of the R-E-SSD network or the disappearance of the target in the video. Since there is almost no occlusion in the container handling operation, the reason for failure to match the target in the detection frame is that the target is new in the video. Focusing on the above matching failure problem, GIOU matching was performed between the tracking target that failed to match and the detection target that failed to match, as shown in the relations (5) and (6). At the same time, the maximum threshold was determined experimentally to remove the matching between the detection frame and the tracking frame with low correlation. If the matching is successful, it enters the update stage of the Kalman filter:
G I o U = I o U A c U A c
I o U = A B A B , U = A B
where A is the detection result, B is the prediction result, and A c is the minimum closure area of the detection result and the prediction result frame. The detection results closest to the predicted results are classified as the same target.

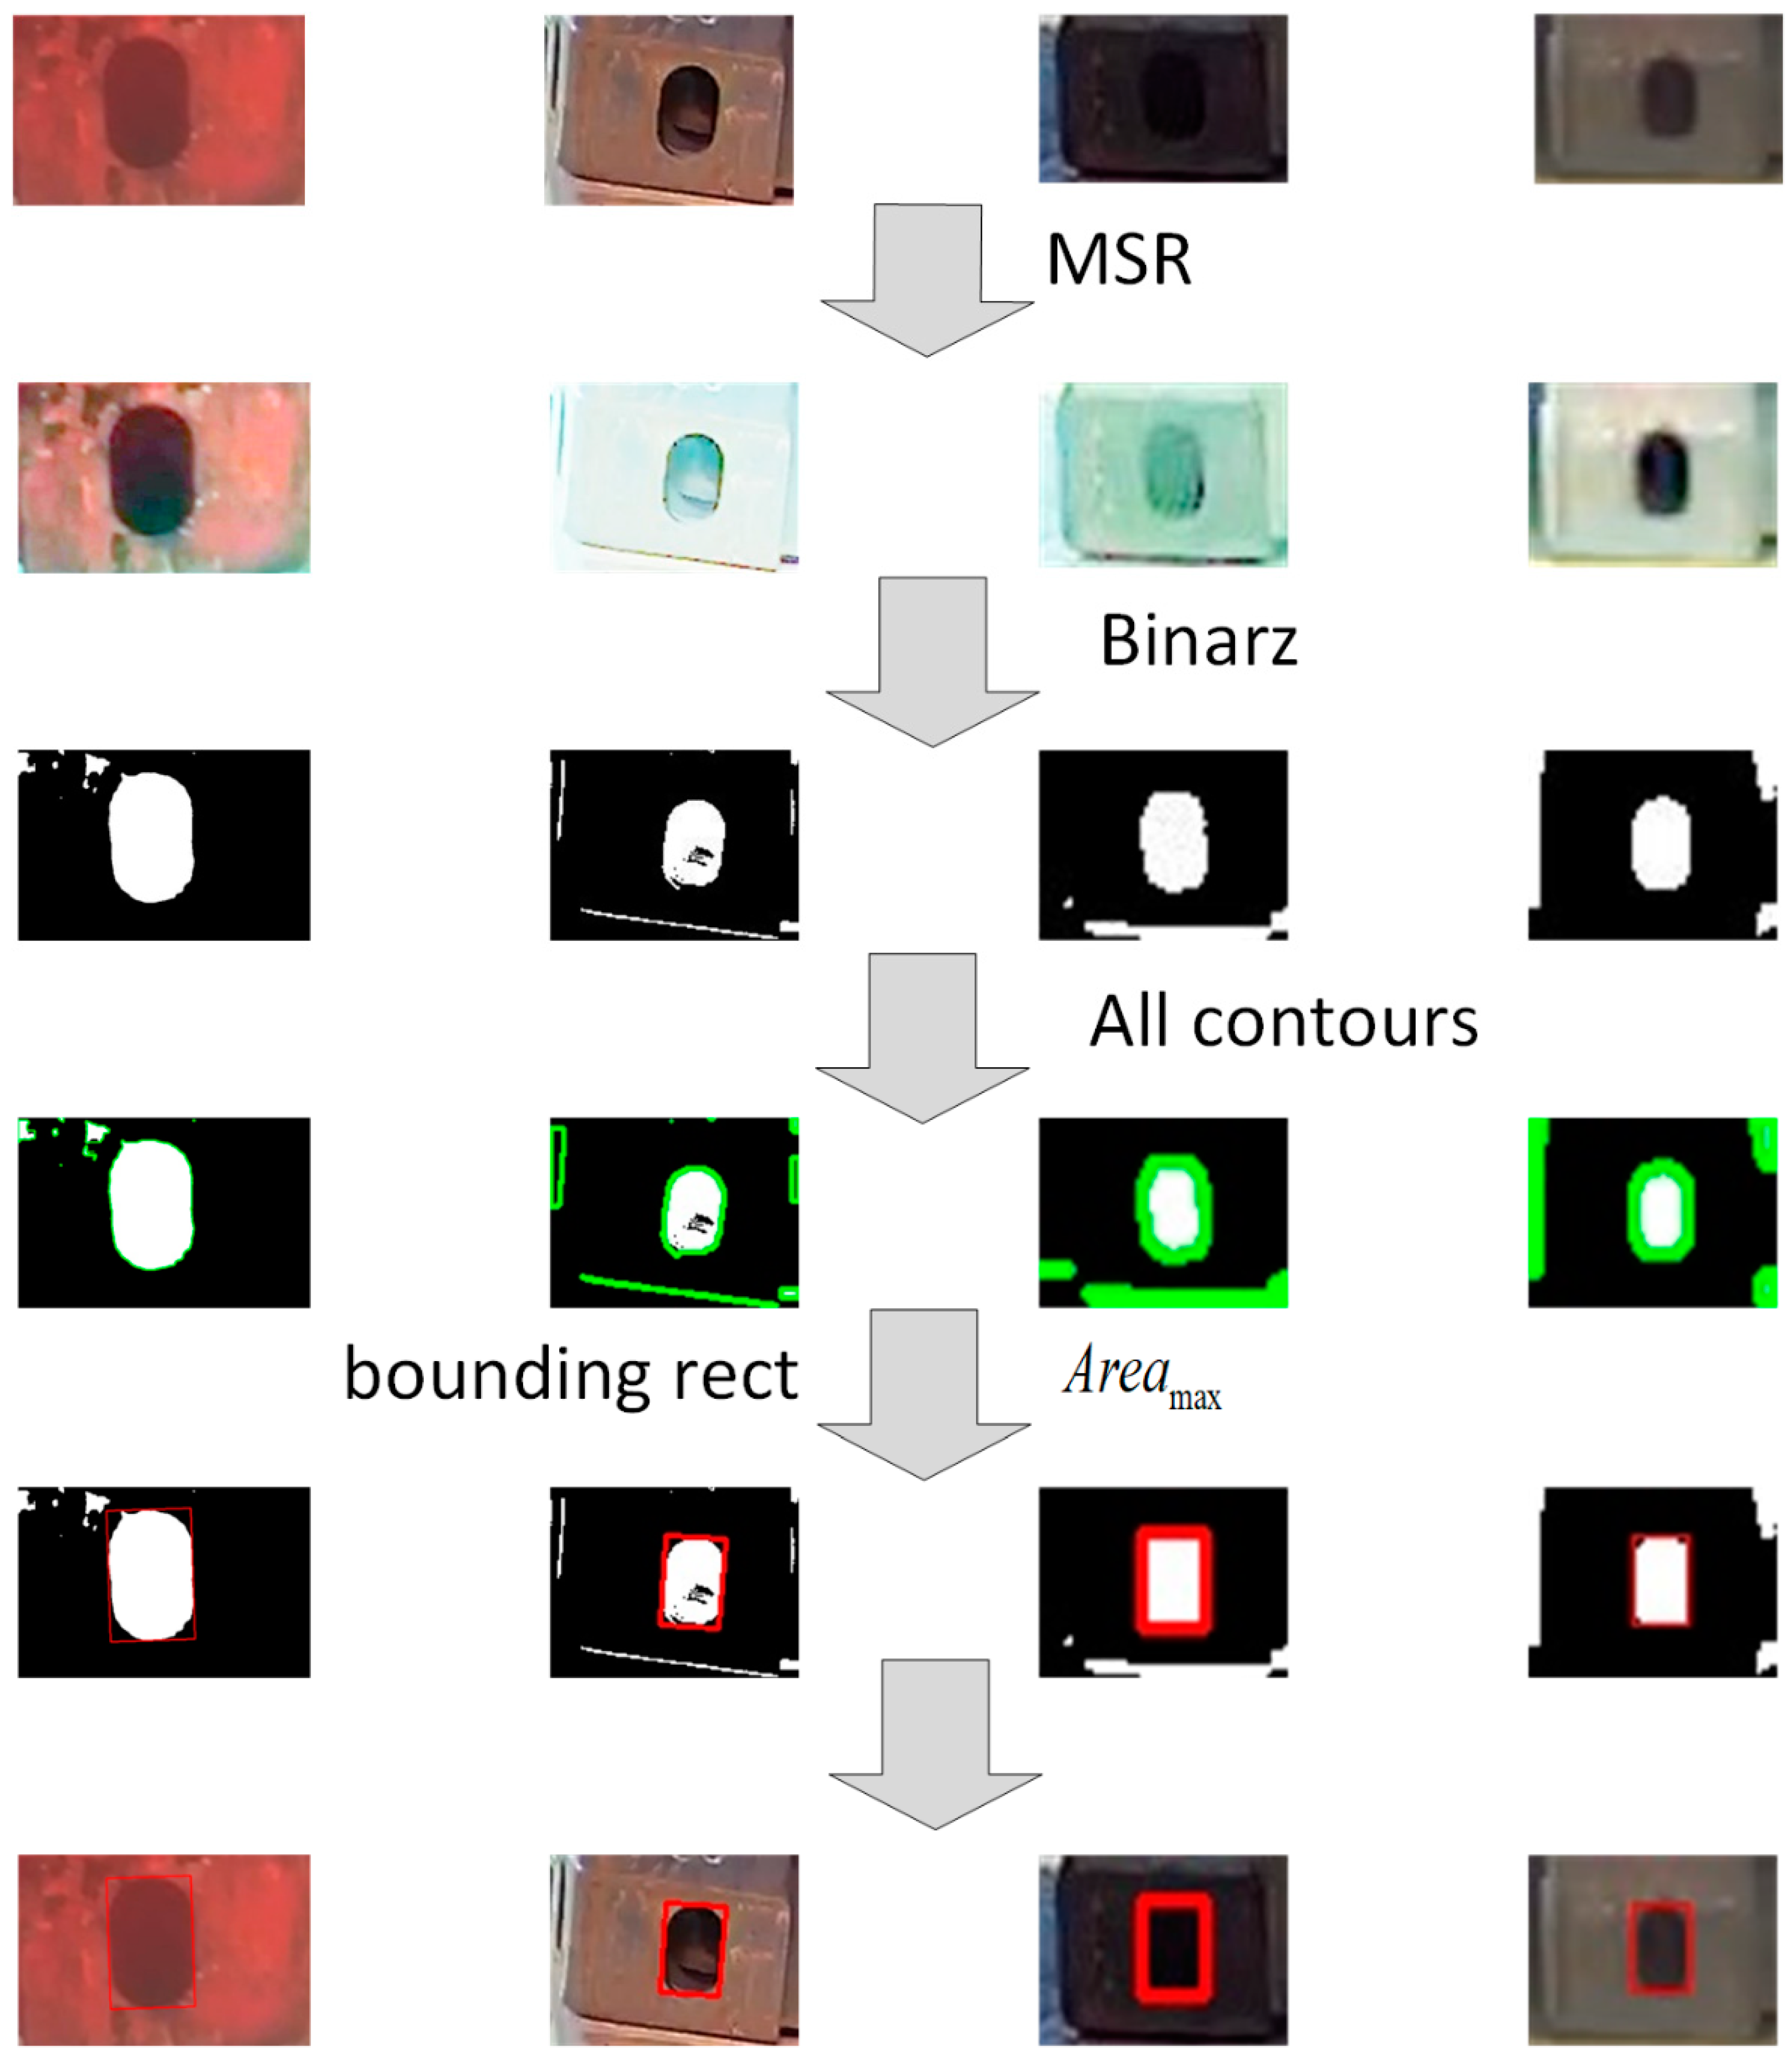
3.2. Target Secondary Positioning Algorithm

The result of deep learning network detection is often not the target itself but the largest area containing the target. In order to obtain the accurate positioning of the container keyhole target, we used the traditional image processing algorithm to locate the container keyhole target twice. The keyhole image obtained by the above detection and tracking algorithm is shown in Figure 6.
As can be seen from the above figure, due to the long-term exposure of the container keyhole to the open air, rust wear occurred around the container keyhole, which caused great difficulties in the accurate positioning of the container keyhole. To this end, the image was first preprocessed to enhance the image quality and remove some noise, and, then, the container keyhole was accurately located, as shown in Figure 7.
Firstly, the MSR algorithm was used to preprocess the image to enhance the image quality. The MSR algorithm is a classical algorithm for image enhancement, based on Retinex theory [28]. The MSR algorithm is described in Formula (7):
R ( x , y ) = k = 1 N ω k log I i x , y log F k x , y · I i ( x , y )
where ω k is the weighting coefficient corresponding to different scales, k = 1 N ω k = 1 ; N represents the number of scale parameters, usually 3; is the surround convolution function of different scales, F k x , y can be described by relation (8):
F k x , y = λ e ( x 2 + y 2 ) / c k 2
where c k 2 is a scale parameter with different sizes, and, generally, three parameters with different scales are selected, so that the scale factor covers a larger range.
Regarding the container keyhole image after image enhancement, there is often a certain amount of noise. Gaussian filtering is a linear smoothing filter that is widely used for noise reduction in image processing. Therefore, Gaussian filtering was used to denoise the enhanced image, and, then, the image was binarized after threshold segmentation.
It can be seen from the binarized image that, although Gaussian filtering removed a lot of noise and retained the container keyhole area, there were still shadows on the edge of the lock and the interior of the keyhole. In order to avoid the interference of other parts on the positioning of the container keyhole, all of the closed contour C i in the binarized image, was found and all the closed contour area A r e a i was calculated. The area of the closed contour was compared and the closed contour represented by the MAX of the maximum area A r e a i was found to be the outer contour C max of the container keyhole. Finally, the minimum circumscribed rectangle was used to fit the container keyhole contour to achieve the accurate positioning of the container keyhole.

3.3. Three Dimensional Measurement Algorithm

Considering that, in the process of container loading and unloading, in the event of an accident, such as hoisting or turning of the container, it is necessary to obtain the attitude information of the container and the frame through three-dimensional measurement to re-align the container and then lift it again, we need to study container attitude when the truck is lifted.
As shown in Figure 8, the international standard ISO1161 stipulates that the size of container corner fittings is 178 mm × 18 mm × 162 mm, and the size of the container keyhole on the side is about 79 mm × 52 mm. The three-dimensional coordinates of the container keyhole are obtained by establishing a relationship between the size of the pixels imaged in the image of the container keyhole by the secondary positioning and the actual size of the keyhole, so as to realize the three-dimensional measurement of the container keyhole.

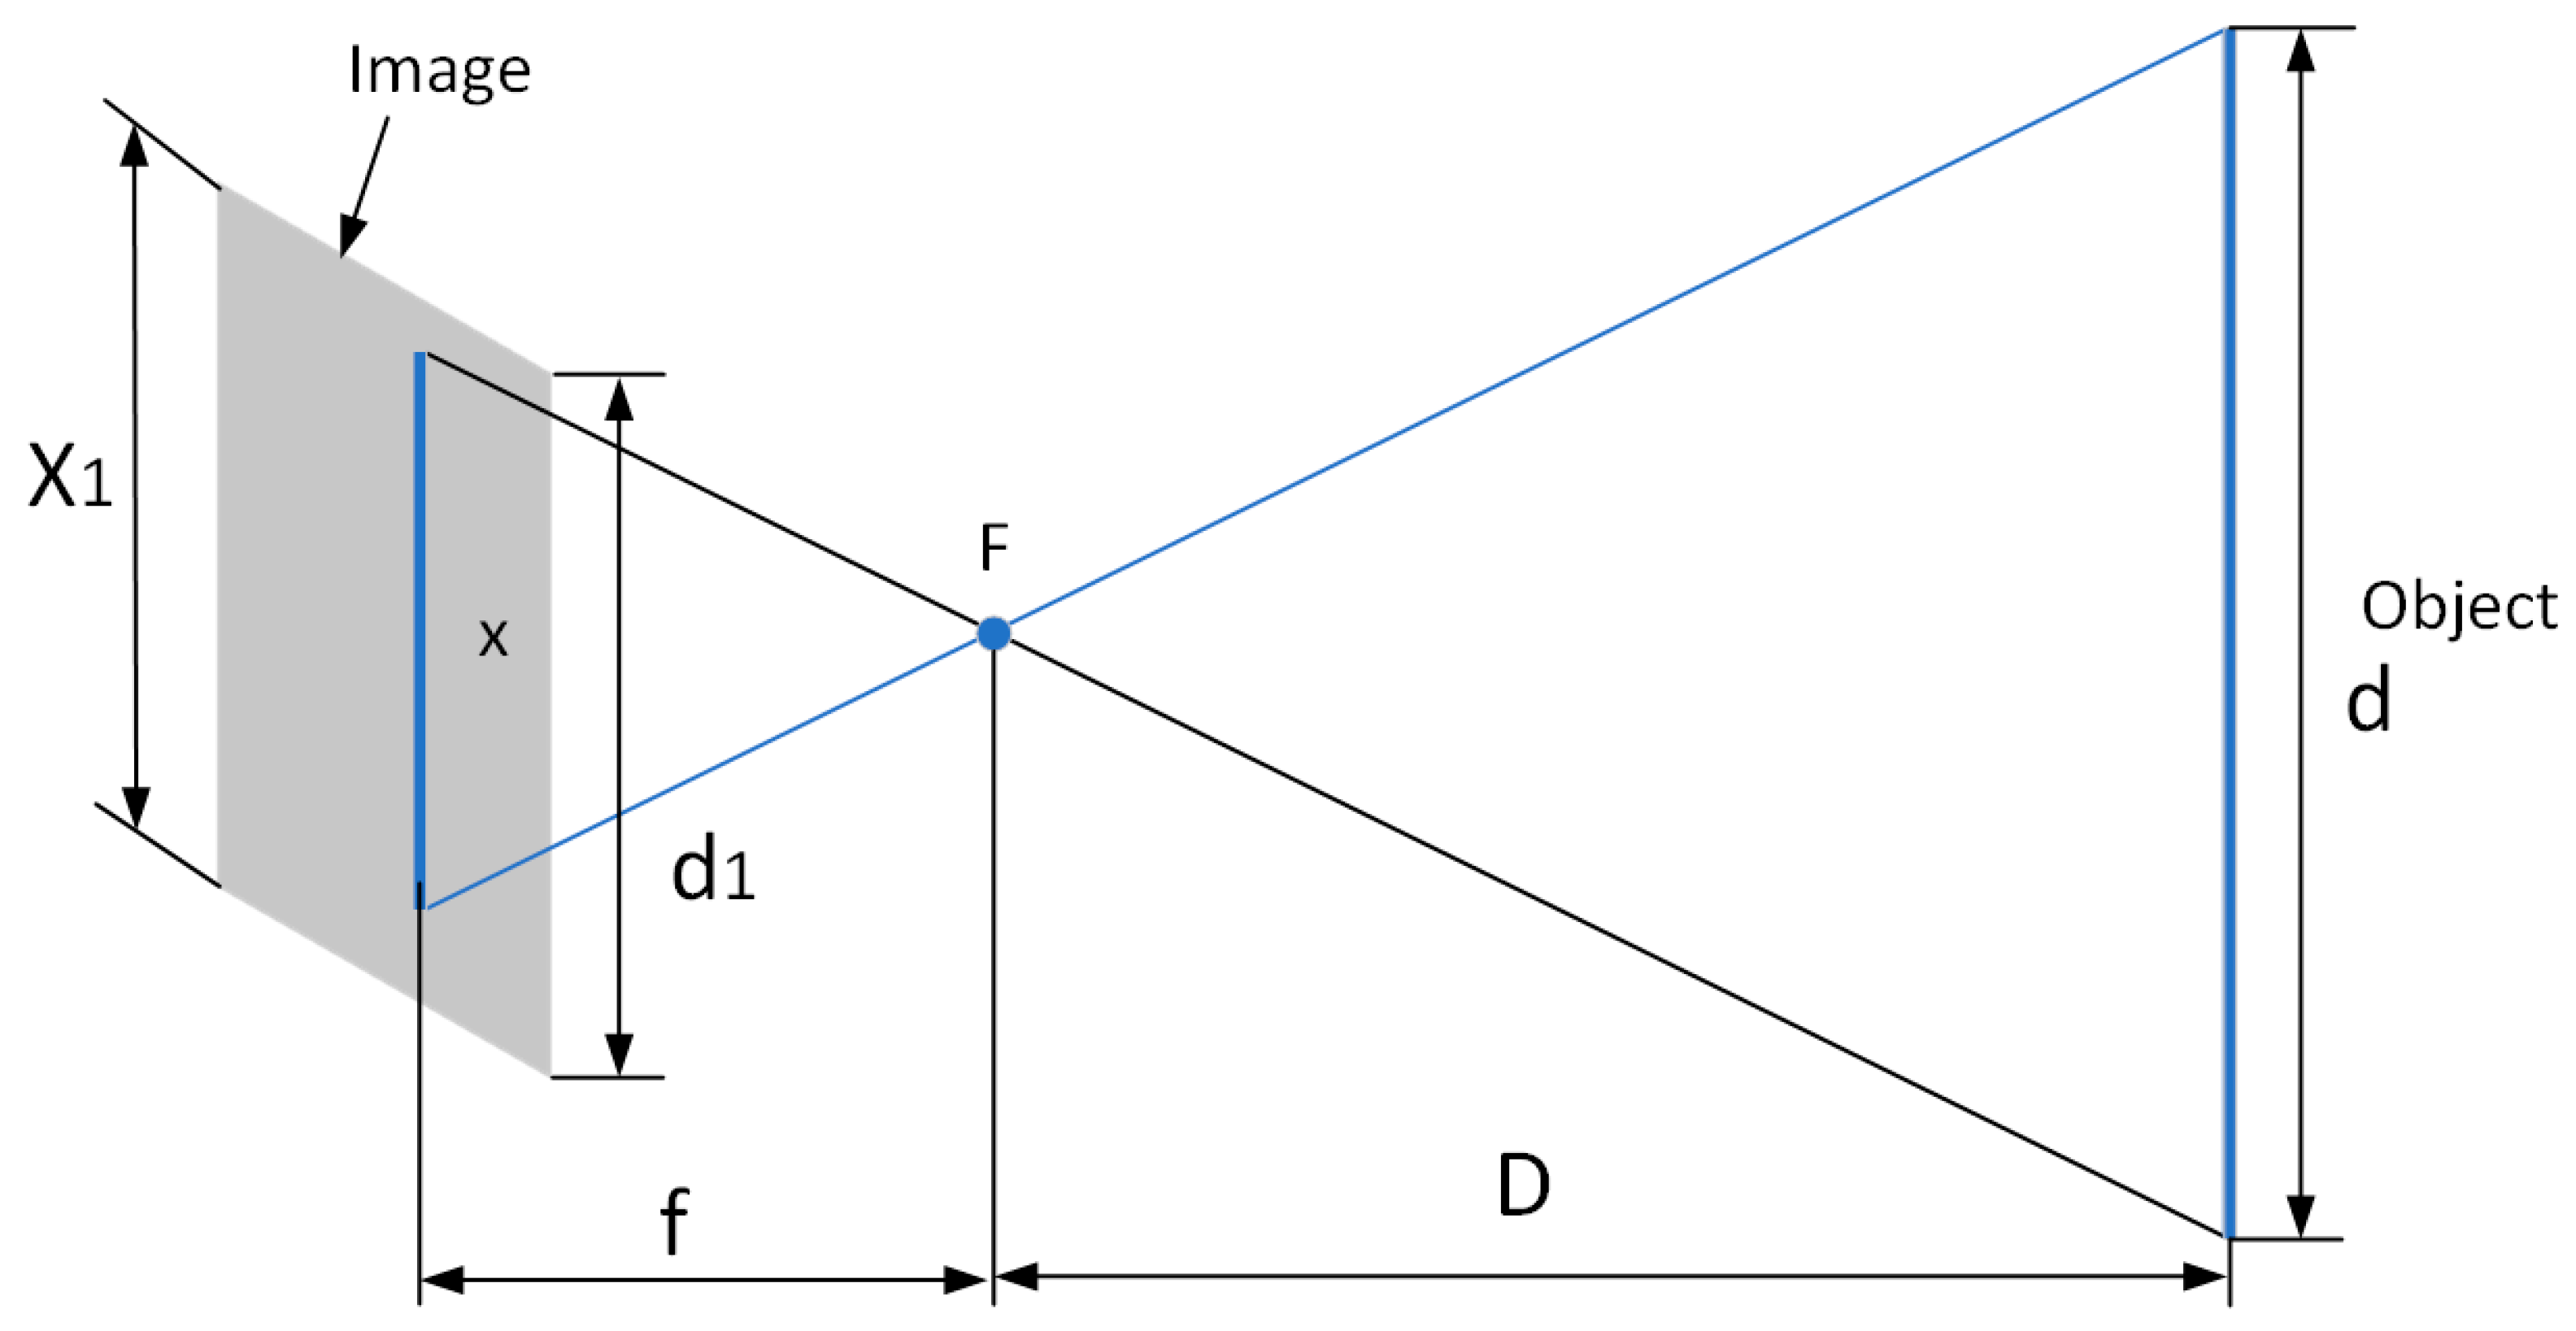
3.3.1. Convert Pixel Distance to Actual Distance

We used the similar triangle principle to get the correspondence between image pixels and actual distances, as shown in Figure 9. The method is based on the characteristics of the pinhole camera, and its calculation is simple and accurate.
As shown in the figure, F is the focus of the camera, f is the focal length of the camera, D is the distance between the object to be measured and the focus of the camera, d is the actual length of the object to be measured, d 1 is the length of the image, x 1 is the total pixels of the image, and x is the pixel size of the object to be imaged in the image. The triangle formed by the measured object and the camera focus is similar to the triangle formed by the image and the camera focus. According to the triangle similarity principle, the relationship between d and x can be obtained, as shown by the Formula (9):
d = D f · d 1 x 1 · x
If the distance D , between the measured object and the focal point of the camera, is known, then d is proportional to x ; that is, κ = D f · d 1 x 1 , where κ is defined as the conversion factor between the pixel size and the actual distance. Under ideal conditions, the conversion factor in the horizontal direction of the image is the same as that in the vertical direction, that is, κ x = κ y :
d = κ · x
Before calculating distances, it is important to note that most cameras have some image distortion, due to lens distortion and coordination issues during assembly. Therefore, before calculating the position parameters, we used the calibration method described by Zhang [29] to calibrate the image.

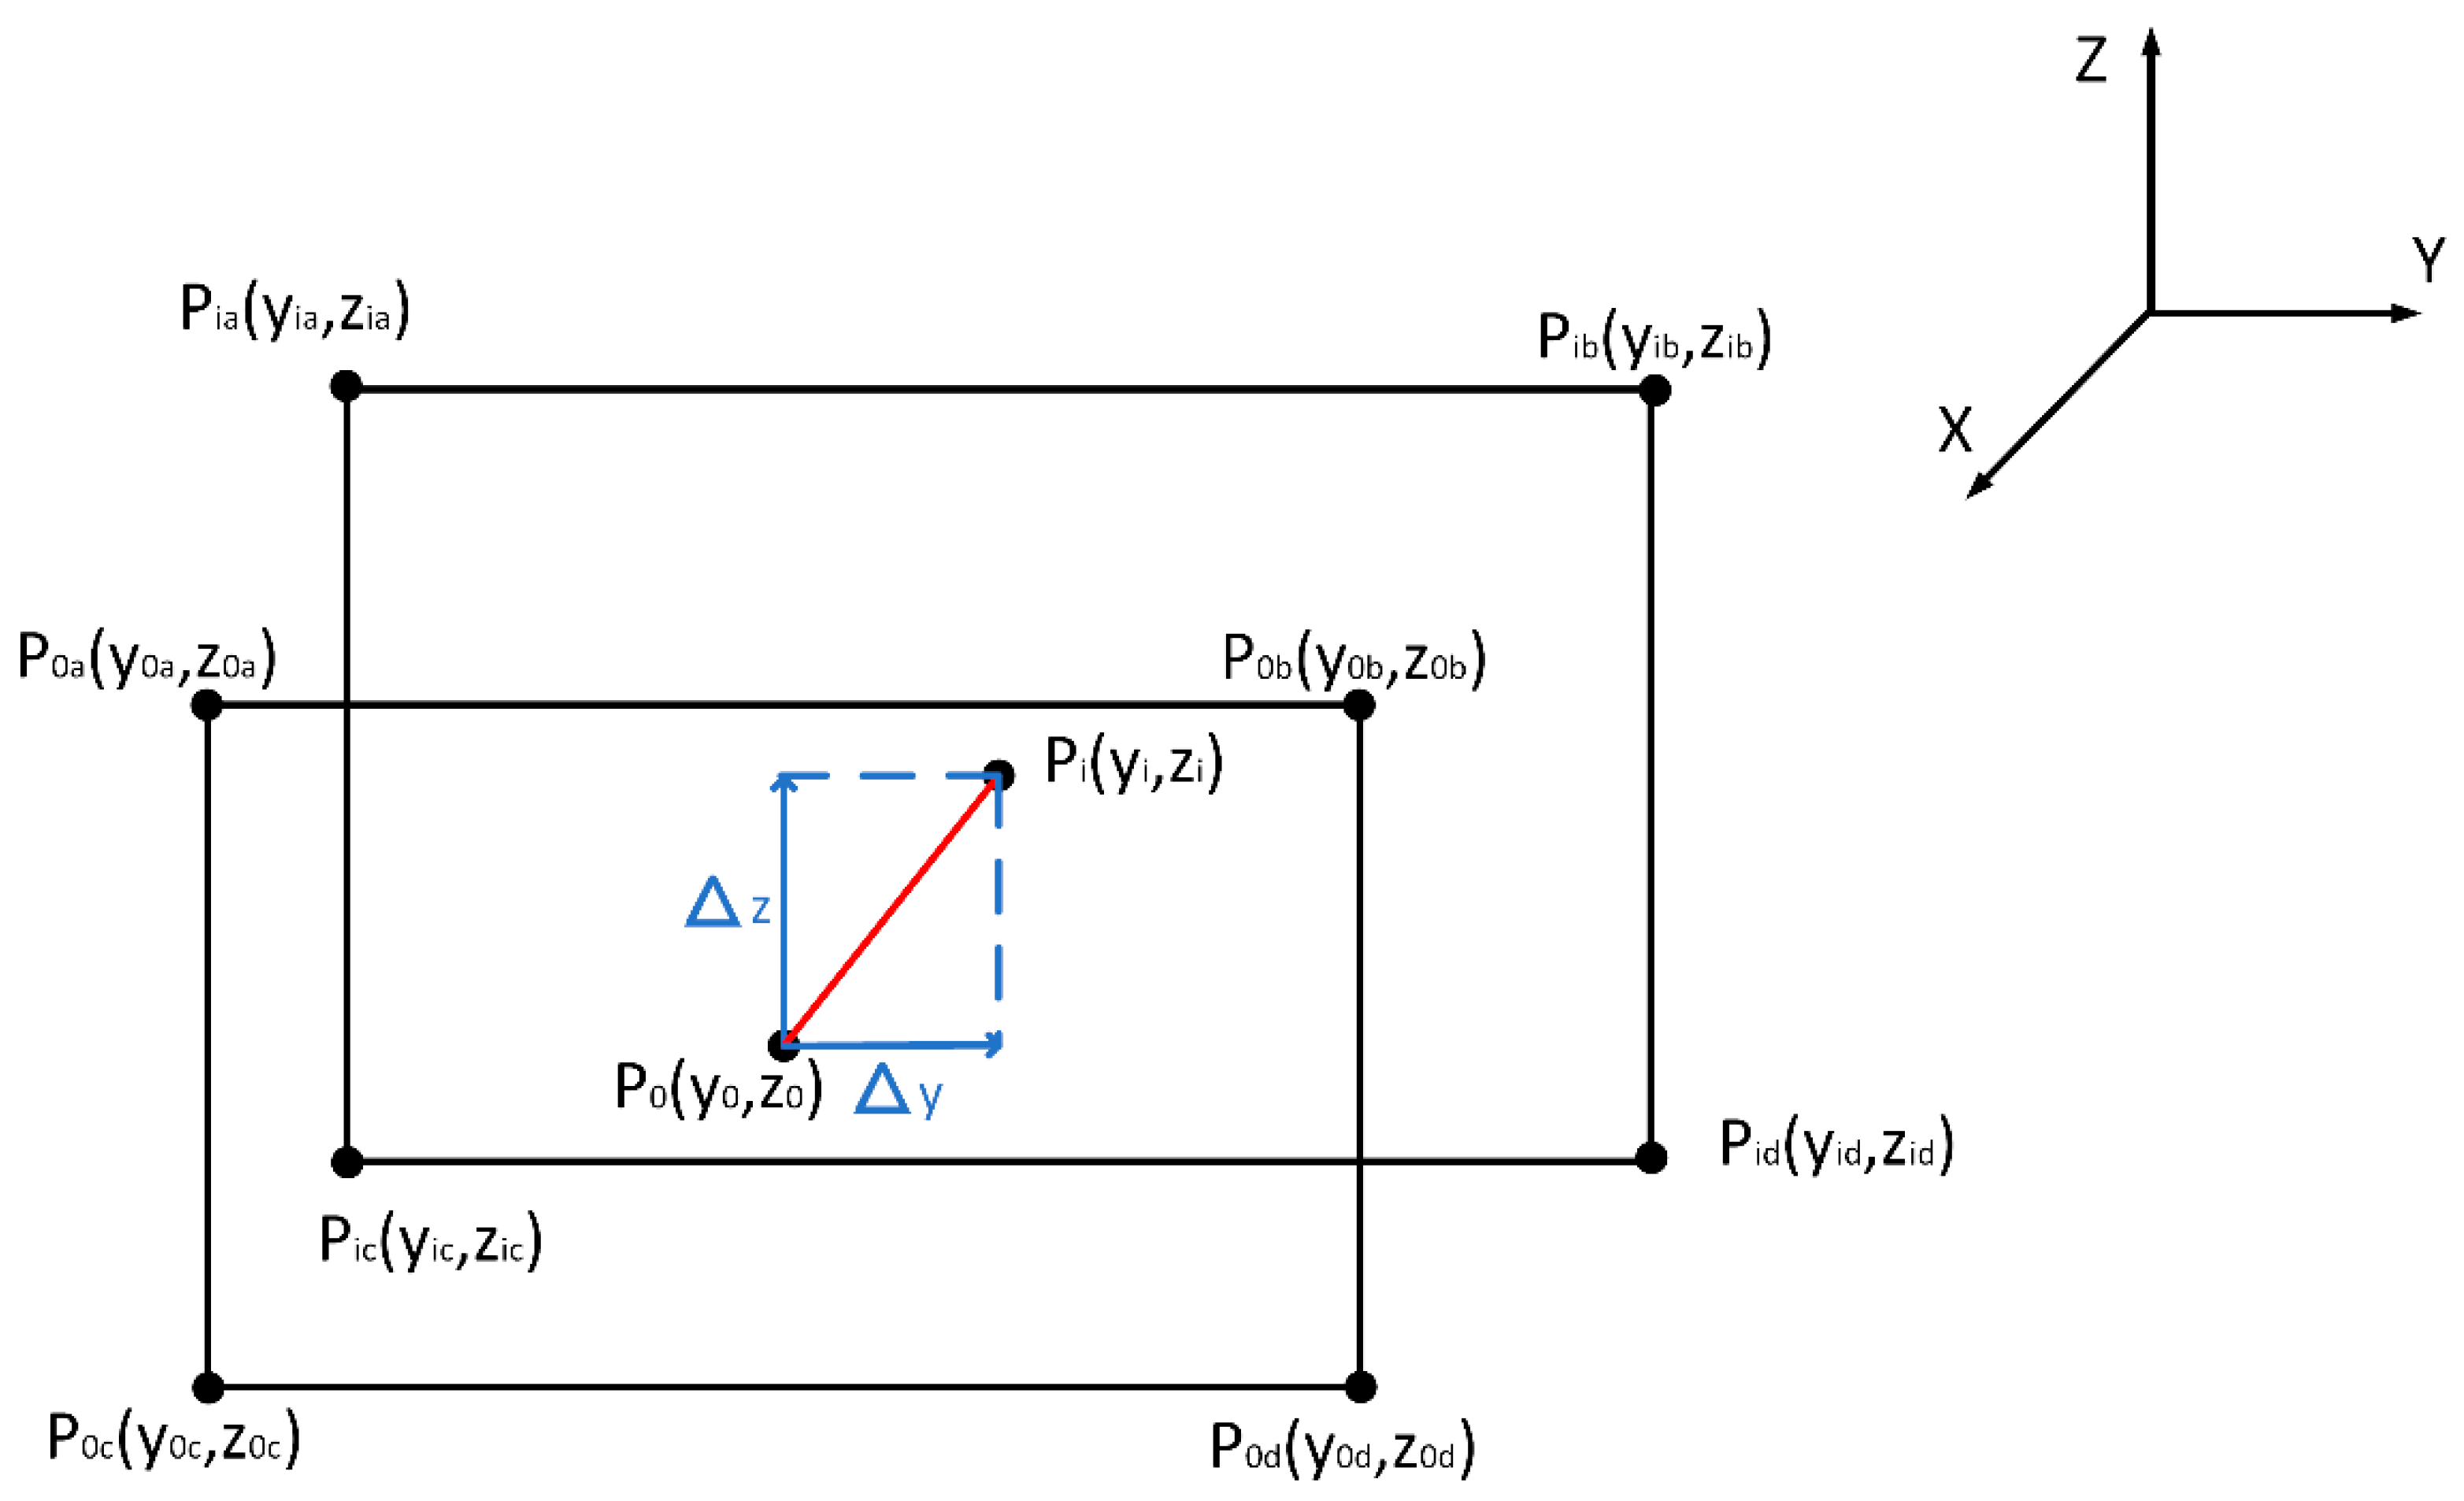
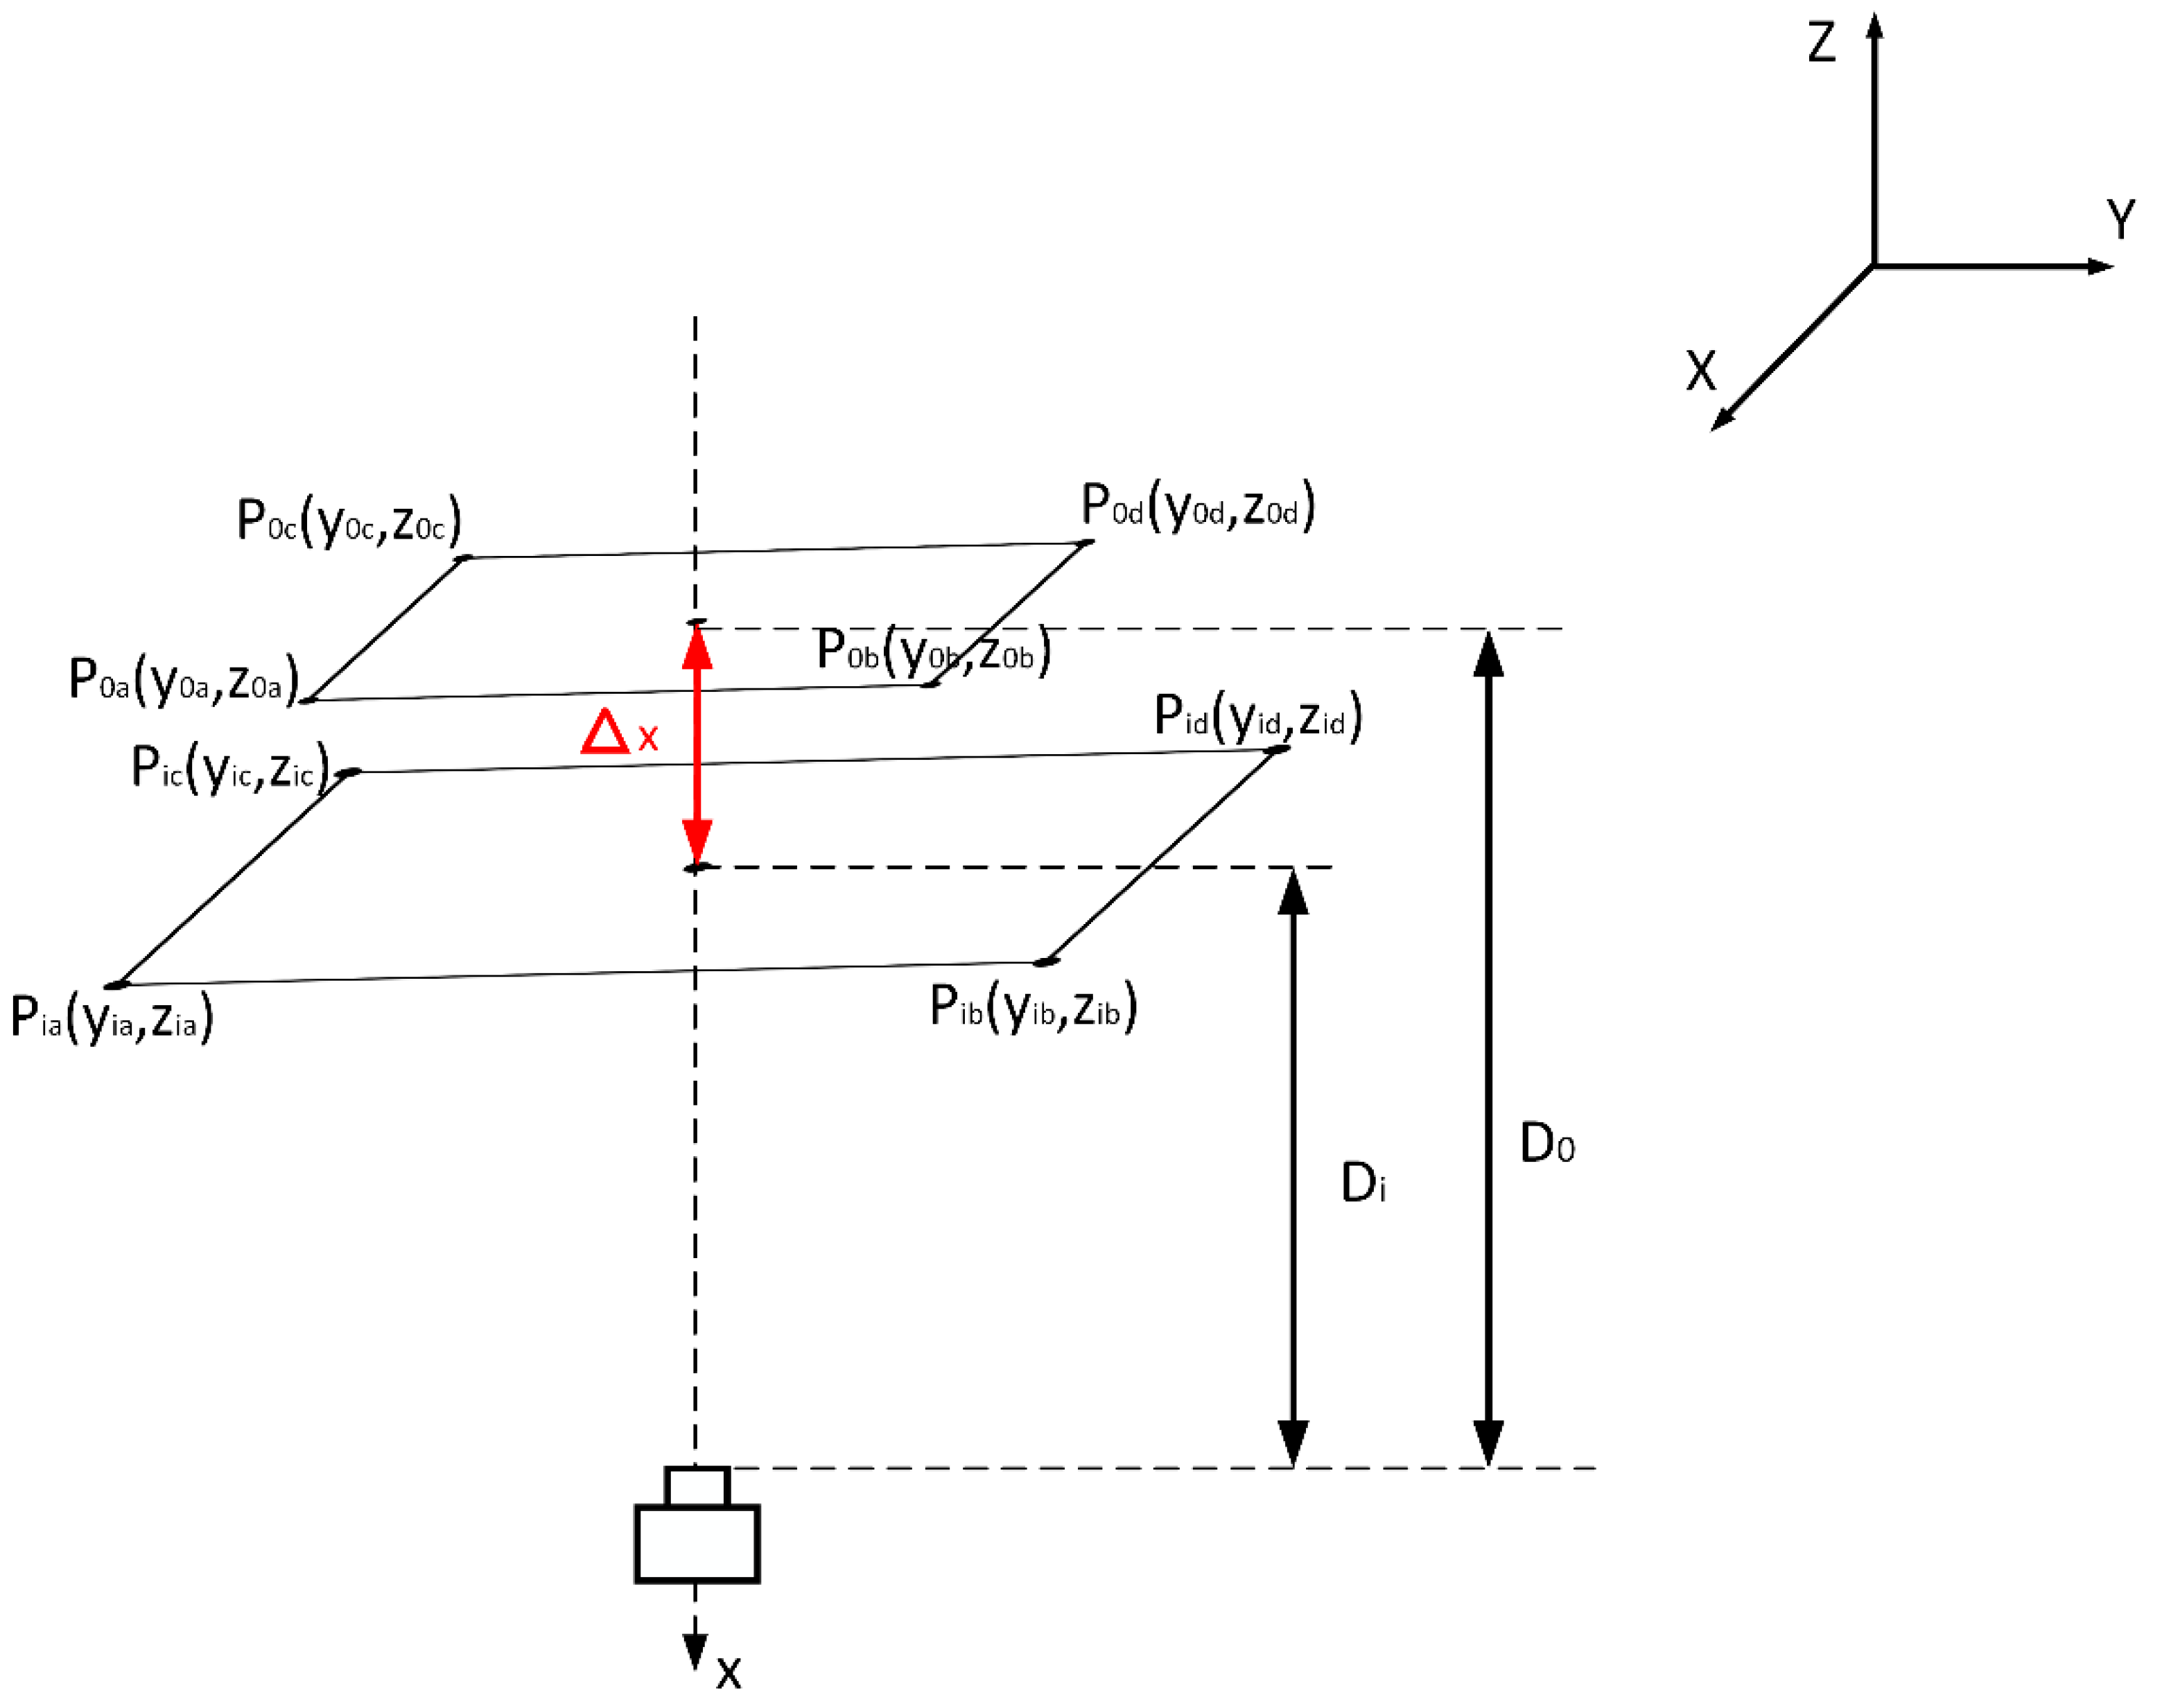
3.3.2. Keyhole Offset Distance

In order to realize the three-dimensional measurement of the container target during the container loading and unloading process, the vertical direction is considered the be the Z-axis, the truck driving direction the Y-axis, and the camera’s direction the X-axis, so as to measure the three-dimensional position change of the container keyhole during the loading and unloading process.
As shown in Figure 10, the offset distances of the container keyholes in the Y and Z directions refer to the moving distances in the Y and Z directions between the detected container keyhole center position P i and the initial position P 0 . According to the secondary positioning of the container keyhole mentioned above, the central positions P 0 ( y 0 , z 0 ) and P i ( y i , z i ) of the container keyhole in the initial state and time can be obtained. The initial position D of the container from the camera is known, and the proportional relationship κ 0 = D 0 f · d 1 x 1 between the pixel size of the container and the actual distance in the initial state is obtained according to the camera imaging principle, and after the secondary positioning, the center position P i of the container keyhole is obtained, so the container keyhole is in the Y direction and the Z direction. The offset distances Δ Y and Δ Z in the direction are given by the following relation (11):
Δ Y = κ 0 y i y 0 Δ Z = κ 0 z i z 0
As shown in Figure 11, the offset distance of the container keyhole in the X direction refers to the detected moving distance between the center position P i of the container keyhole and the initial position P 0 in the direction of the camera. According to the camera imaging principle, the proportional relationship between the distance D of the measured object from the camera and the image pixel size x is: D = f · x 1 · d d 1 · 1 x . It can be seen that D is inversely proportional to the pixel x , where Κ = f · x 1 · d d 1 is the proportional coefficient.
According to the proportional relationship between D and pixel x , the distance D i from the container keyhole to the camera at time i can be obtained, thereby obtaining the distance Δ X from which the container keyhole moves in the X direction:
D i = f · x 1 · d d 1 · 1 x i Δ X = D 0 D i

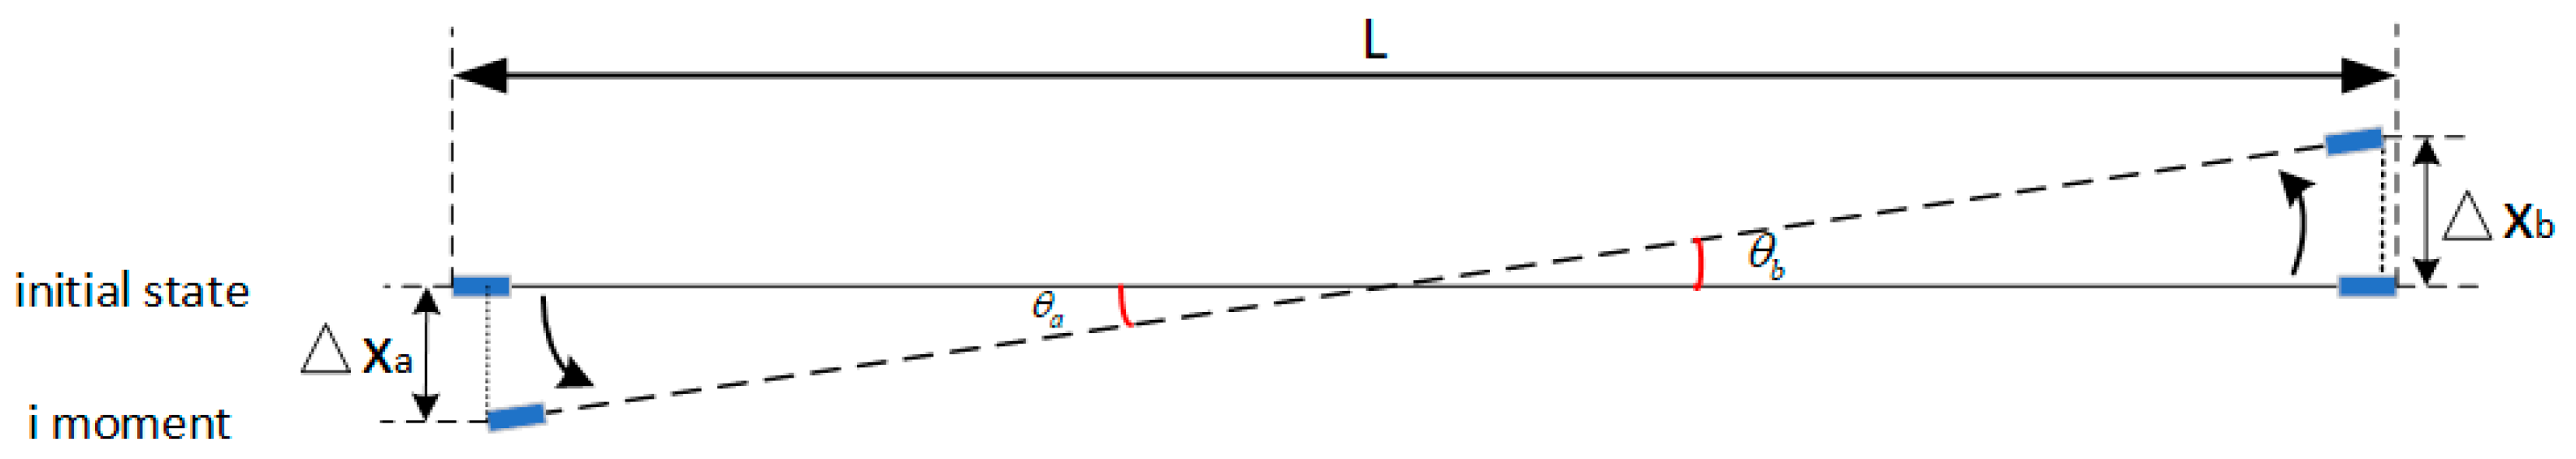
3.3.3. Keyhole Offset Angle

In the container loading and unloading task, in addition to paying attention to the offset distance of the container during the loading and unloading process, the offset angle, and the direction of the offset of the container, are also worthy of attention. The container is often deflected in the X direction during the lifting process of the spreader. Figure 12 shows the attitude change of the container after deflection in the X direction, with the top view, during the loading and unloading of the container, and the side view of the container captured by the camera.
As can be seen from the above figure, once the container is deflected, the imaging size of the container corner piece collected by the camera also changes in the image. According to the Formula (13), the container keyhole-a and keyhole-b move at the time i compared to the initial state. The distances are Δ X a and Δ X b , and the length of the container is L . Firstly, the deflection angles θ a and θ b on both sides of the container keyhole a and b are calculated. The schematic diagram and specific calculation of the offset angles θ = θ a + θ b 2 , θ a and θ b of the container relative to the initial state at time i are shown in Figure 13.
θ a = arcsin 2 Δ x a L θ b = arcsin 2 Δ x b L

4. Experiment

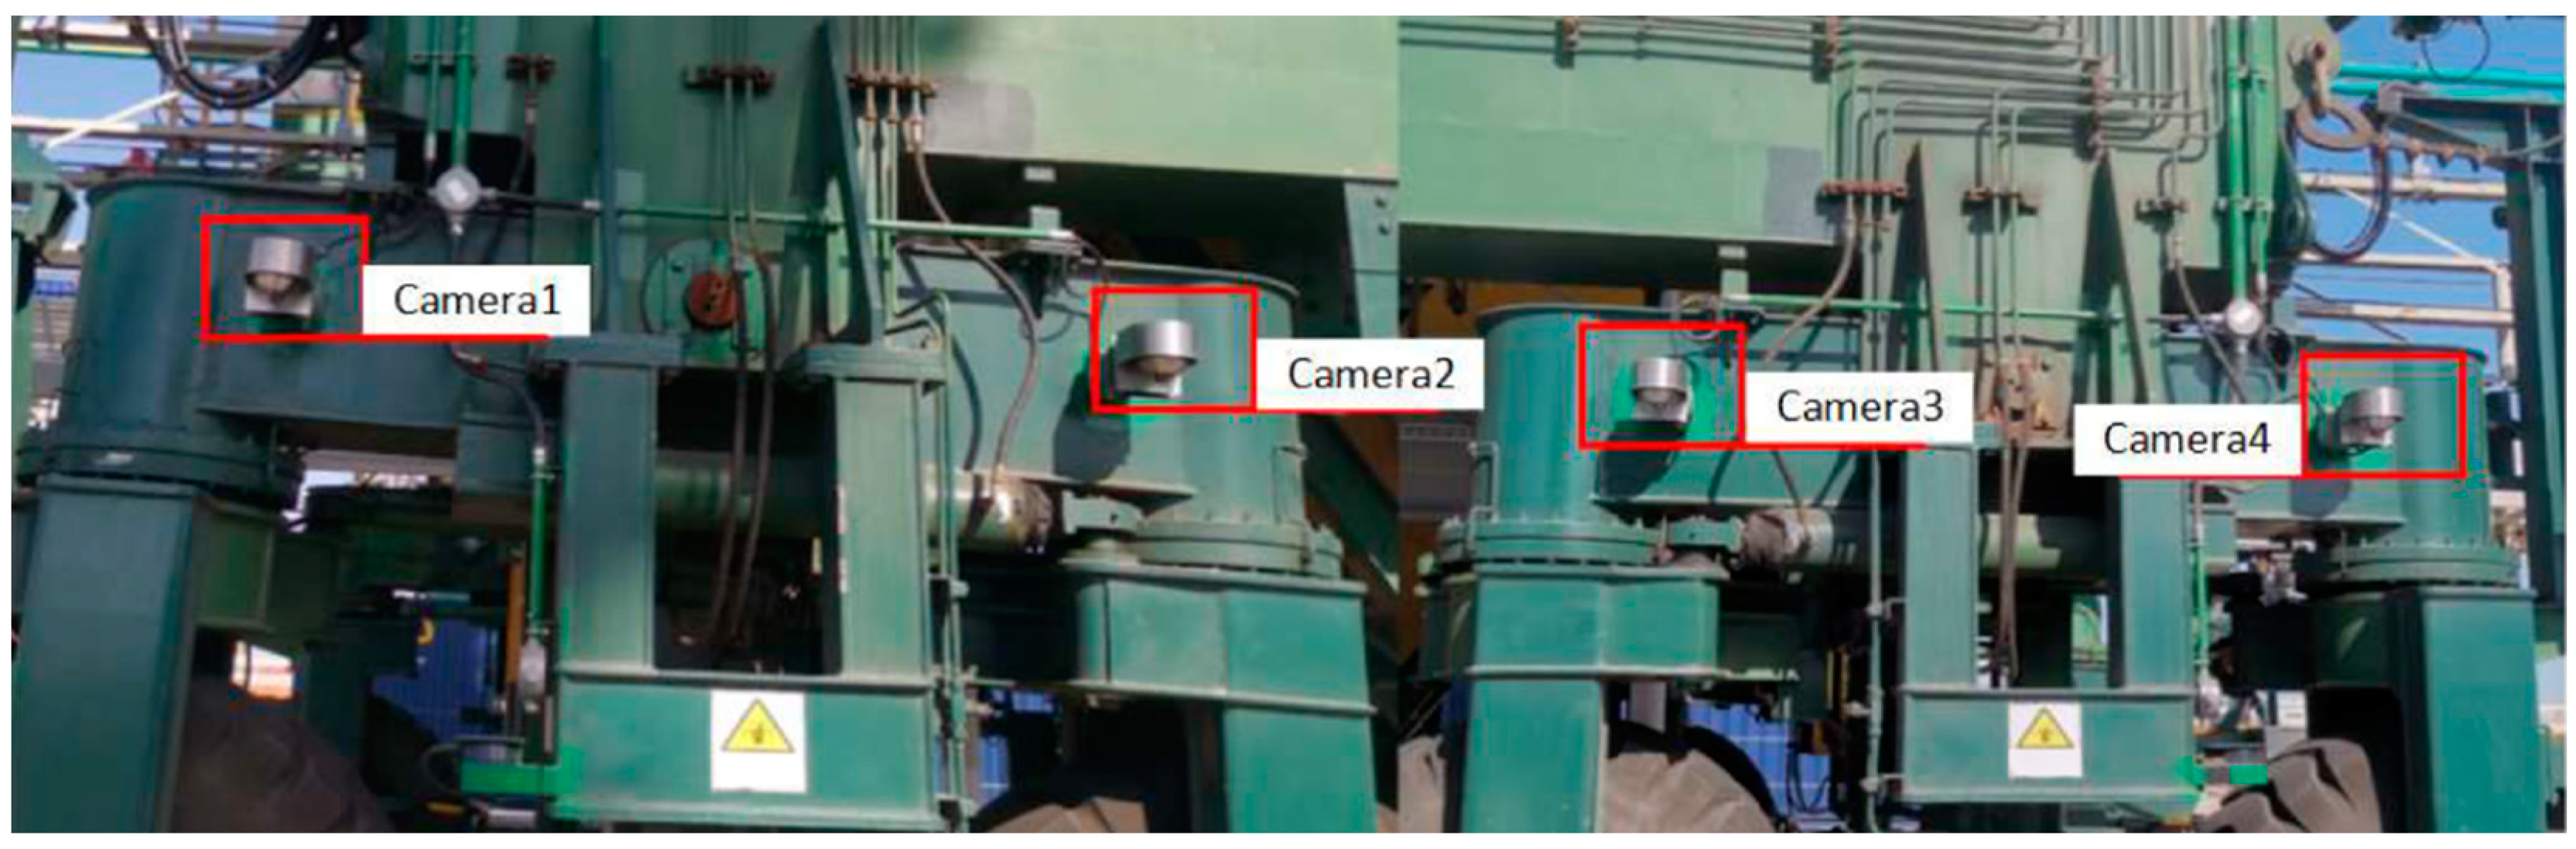
4.1. Experimental Platform

The training environment of this experiment was Ubuntu20.04 system. The GPU adopted Nvidia Tesla M40 (24GB), the CPU adopted Intel i7-6700, and CUDA 10.1 was used for accelerated training under the Python library.

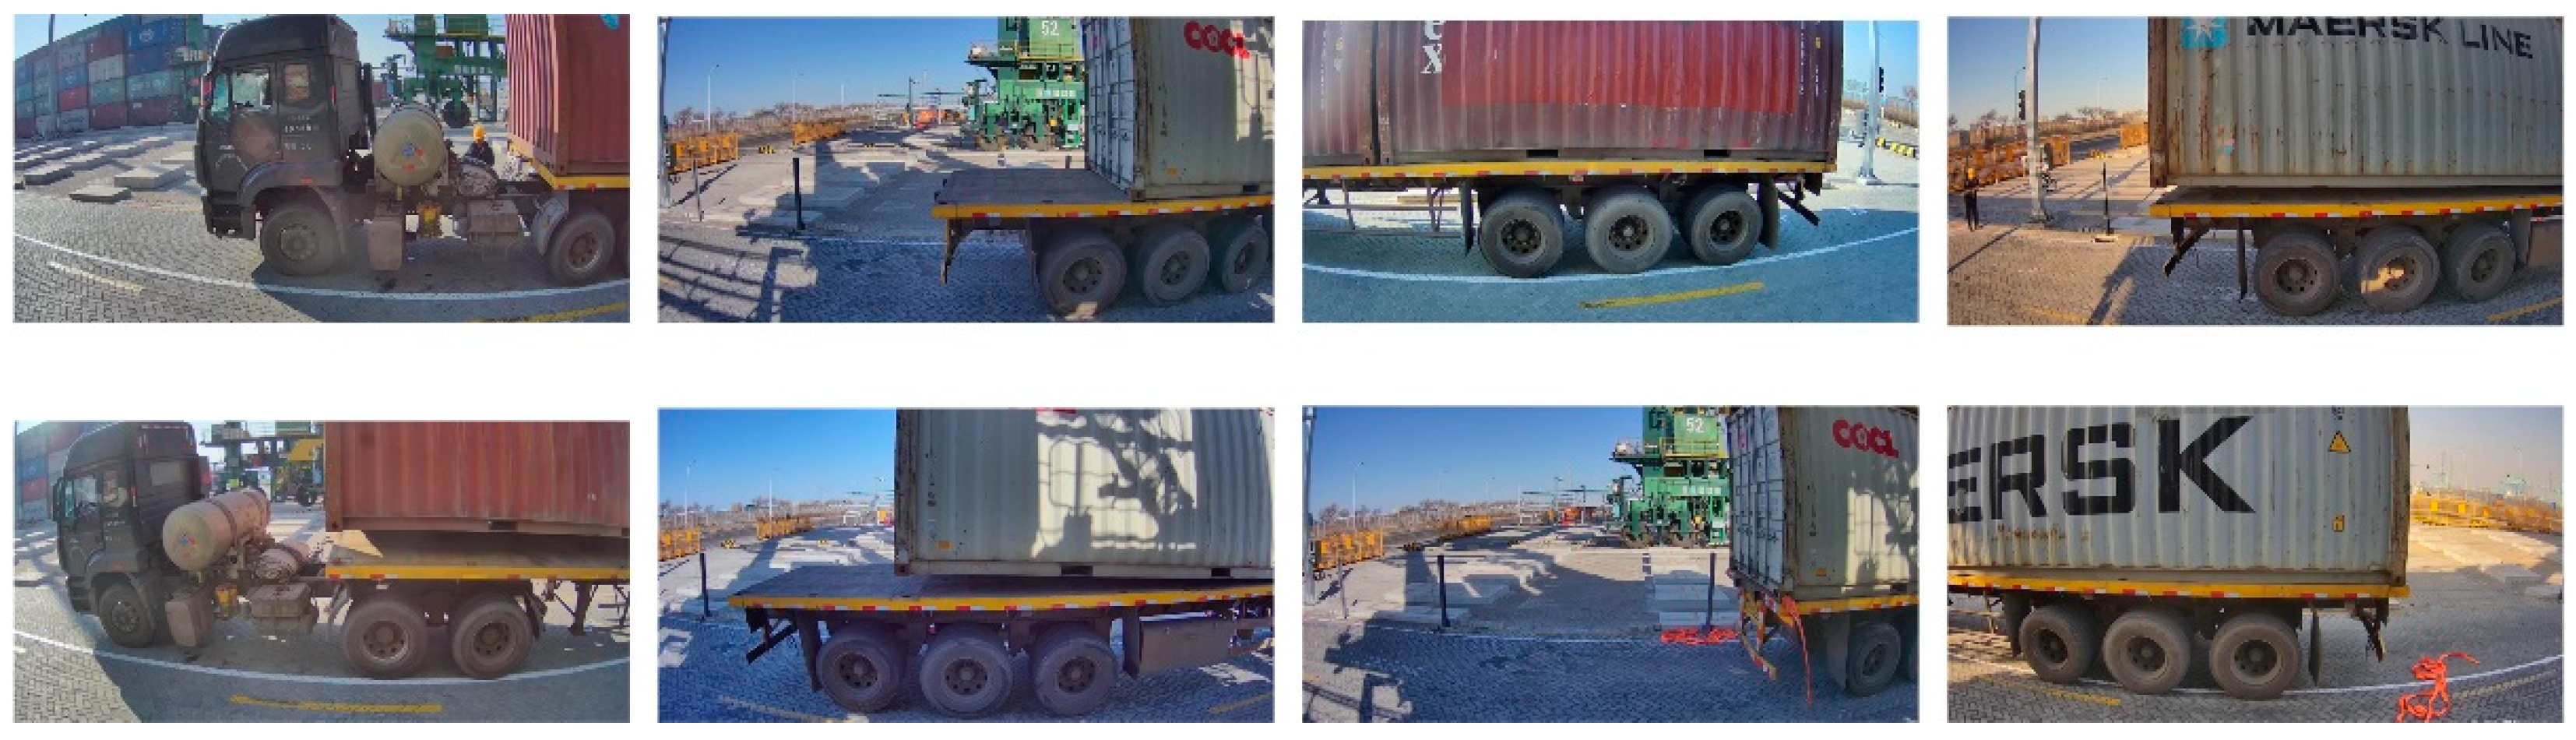
4.2. Experimental Data

In order to verify the reliability of the system designed in this paper, the data used in the experiment were all from the container loading and unloading tasks of container trucks of different sizes in a terminal in Tianjin. The schematic diagram of the on-site camera installation is shown in Figure 14. The resolution of the image was 1980 × 1080, and the fps was 24.
A total of 40-foot and front, middle, and rear 20-foot box positions were selected for the experiment. The Figure 15 shows the pictures collected by different cameras in different box positions.

4.3. Experimental Results and Analysis

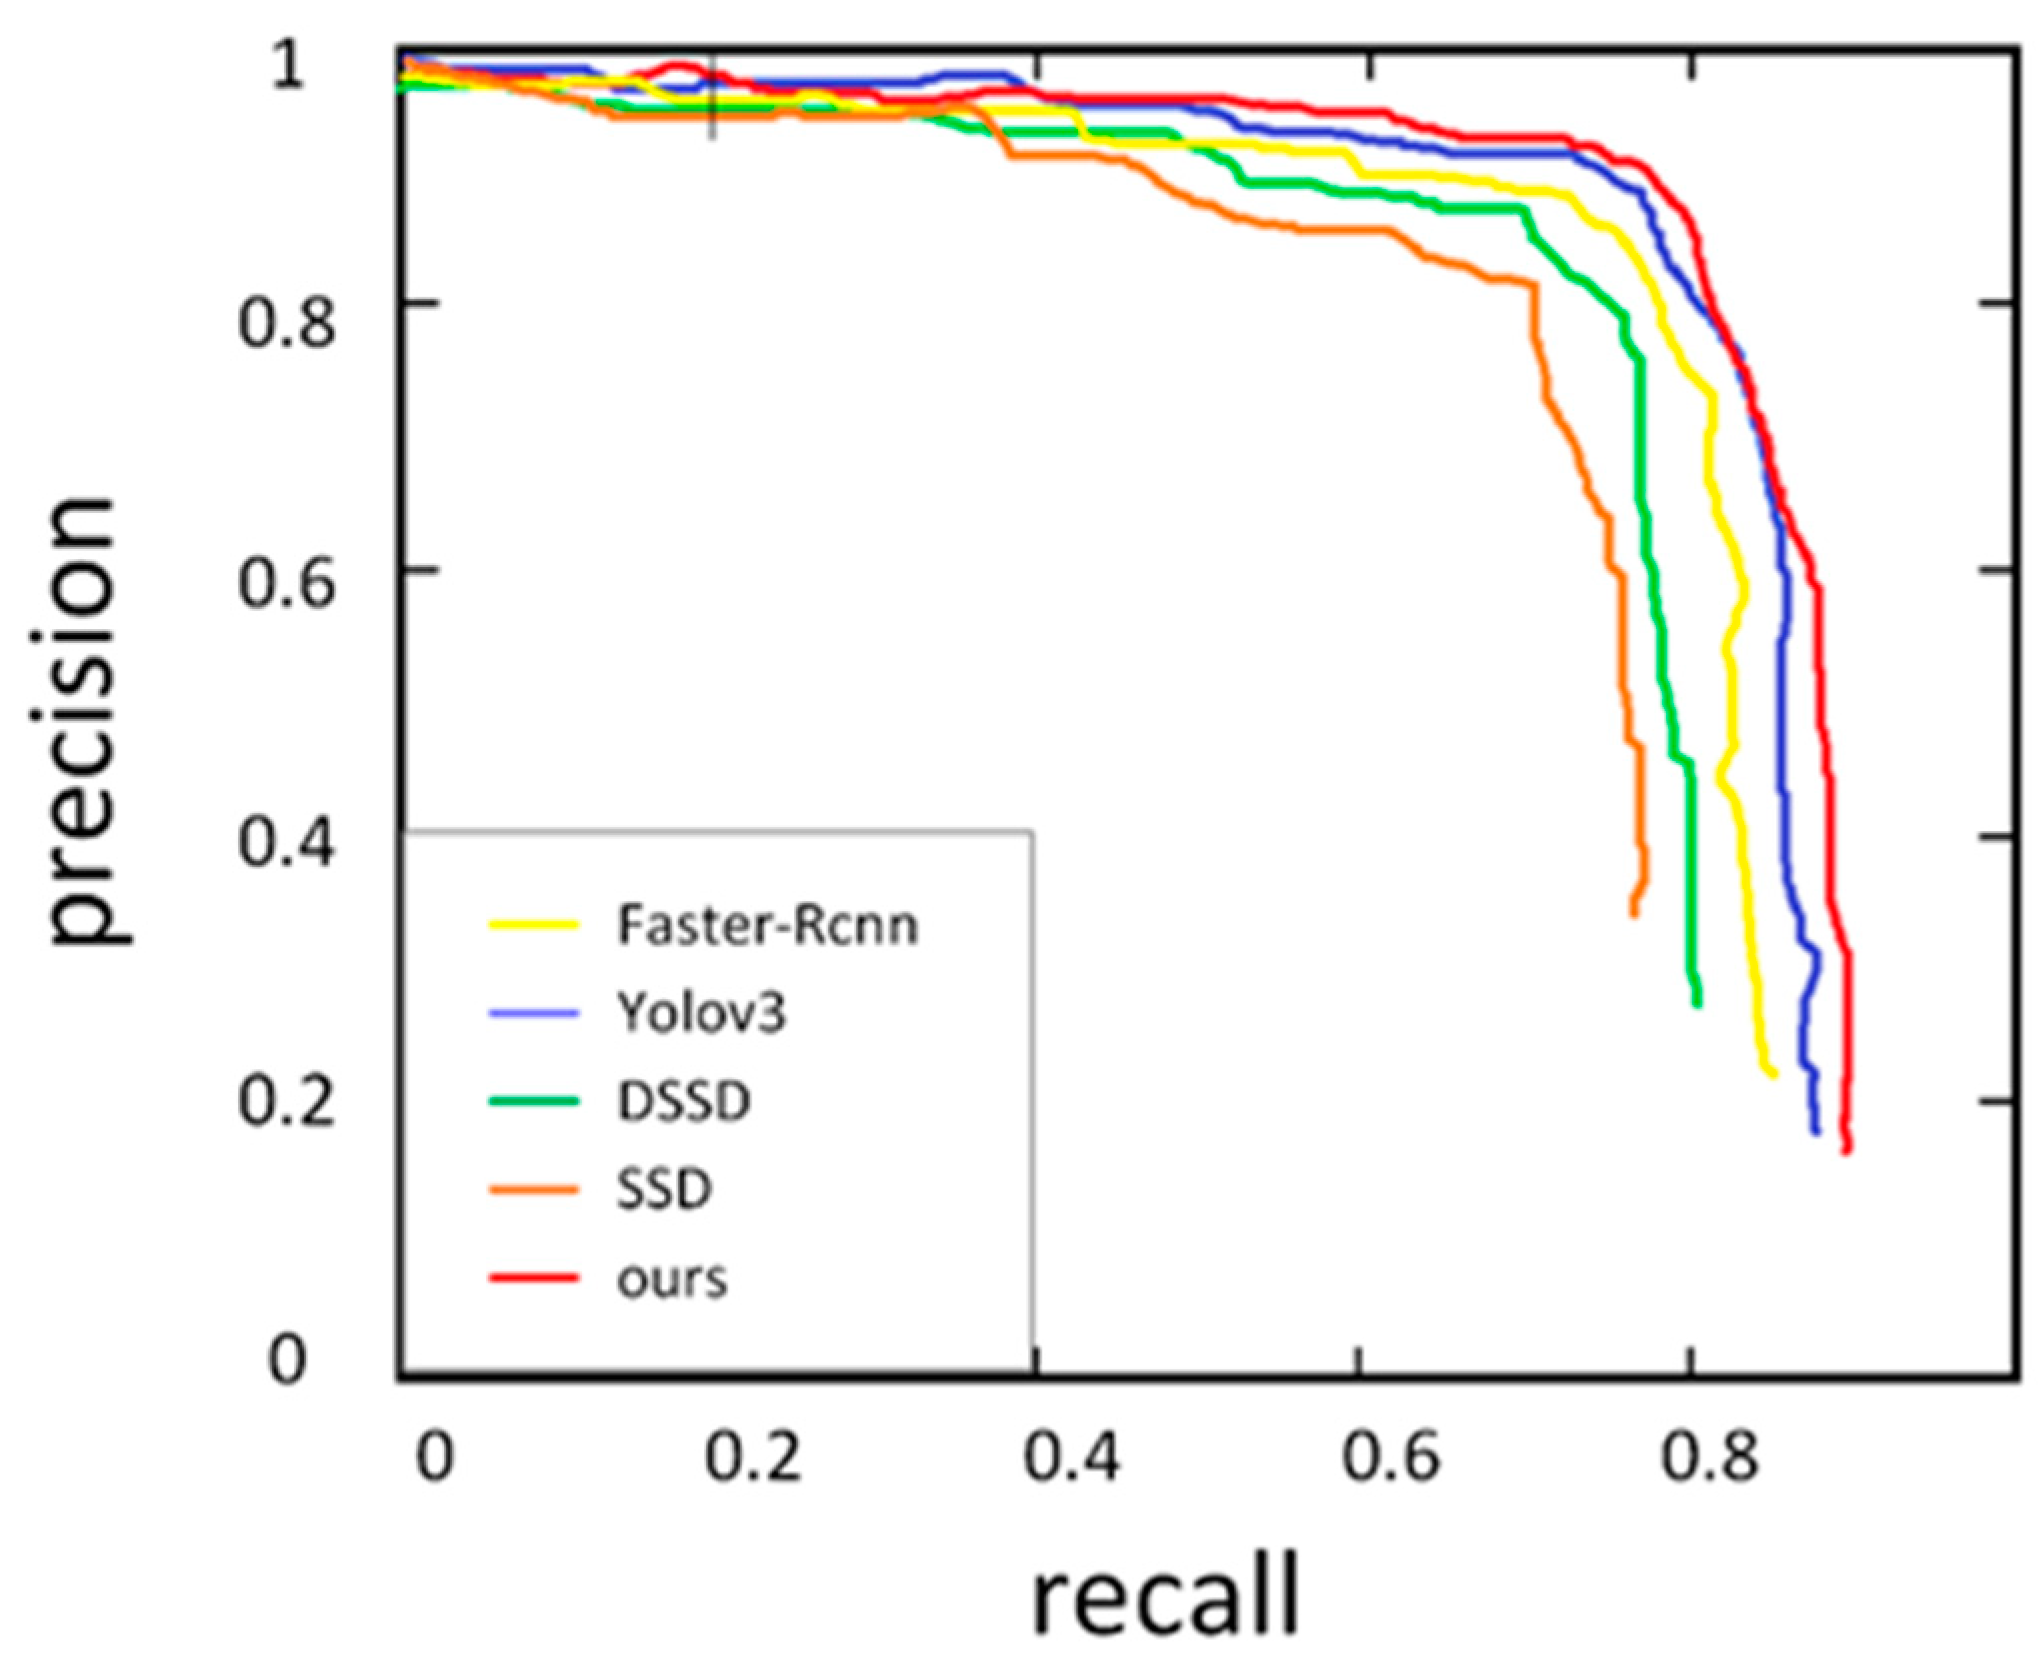
4.3.1. Target Detection Experiment

In order to compare the detection effect of the R-E-SSD designed in this paper and other typical target detection algorithms, on container keyhole targets, the data collected by the team through experiments on the spot were used as the data set, with a total of 2783 images, and the data set was divided in the ratio 8:1:1. The comparison results are shown in Table 1. The evaluation index of detection speed was FPS (Frame Per Second, FPS), which is defined as the number of frames processed by the network per second; the detection accuracy was made into a curve according to Precision and Recall, ranging from 0 to 1. The area between the drawn curve and the coordinates was the precision (AP), A P = 0 1 P ( R ) d R , and the definition of precision and recall is as follows:
p r e c i s i o n = T P T P + F P r e c a l l = T P T P + F N
where T P is the positive example in the positive sample, and F P is the positive example in the negative sample, F N is a negative example in the positive sample.
Analyzing the results presented in Table 1, the detection accuracy of the proposed R-E-SSD algorithm was better than those of other models. Enlarging the input image could significantly improve the detection effect of small targets. The input image sizes of Faster RCNN [30], YOLOv3 [31] and DSSD [32] were much larger than that of SSD, but the R-E-SSD algorithm designed in this paper replaced the deep residual network with stronger feature extraction ability as the backbone network and introduced a lightweight channel attention mechanism to improve the detection accuracy of container keyhole targets, without significantly increasing the model size. So, the R-E-SSD algorithm designed in this paper exhibited a better detection effect in the case of small input images. The algorithm designed in this paper was compared with the comparison algorithms SSD, DSSD, Yolov3, Faster-RCNN. The AP increased by 22.89%, 21.29%, 12.8% and 7.21%, respectively. In terms of detection speed, compared with SSD and Yolov3, the detection speed of the R-E-SSD algorithm designed in this paper was slightly reduced, but also met the requirements of real-time detection. Although the algorithm designed in this paper replaced the backbone network and introduced the attention mechanism, while deleting some convolutional layers, the model was still relatively simple. Compared with DSSD and the two-stage object detection algorithm, Faster-RCNN, the detection speed of the algorithm designed in this paper was significantly faster. The experimental results showed that the improved algorithm could effectively improve the detection accuracy of container keyhole targets in complex backgrounds on the basis of real-time testing.
Figure 16 shows the PR curves of each target detection algorithm when IOU = 0.5 (Intersection Over Union). It can be seen intuitively from the PR curve in the figure that the algorithm proposed in this paper was better than other detection models in both precision and recall; that is, the R-E-SSD algorithm designed in this paper had better regression ability on the target position of the container keyhole than did the other detection models.

4.3.2. Target Tracking Experiment

In the container loading and unloading task, the tracking effect of the container keyhole movement mainly depends on the detection effect. Therefore, for the target tracking during the loading and unloading process, we were more concerned about the real-time performance of the target tracking. We used several container loading and unloading videos as tests. and intercepted different frames to show the tracking effect of the algorithm, as shown in Figure 17.
In order to verify the effect of algorithm tracking, MOTA (the accuracy of multi-target tracking, which is reflected in the number of targets and the accuracy of the relevant attributes of the target, used to count the accumulation of errors in tracking) and FPS (the number of frames transmitted per second) is an indicator to judge the accuracy and real-time performance of the algorithm. After testing, the target tracking accuracy MOTA was 97.3 %, and the tracking speed was 21.7 frames/s, which met real-time requirements.

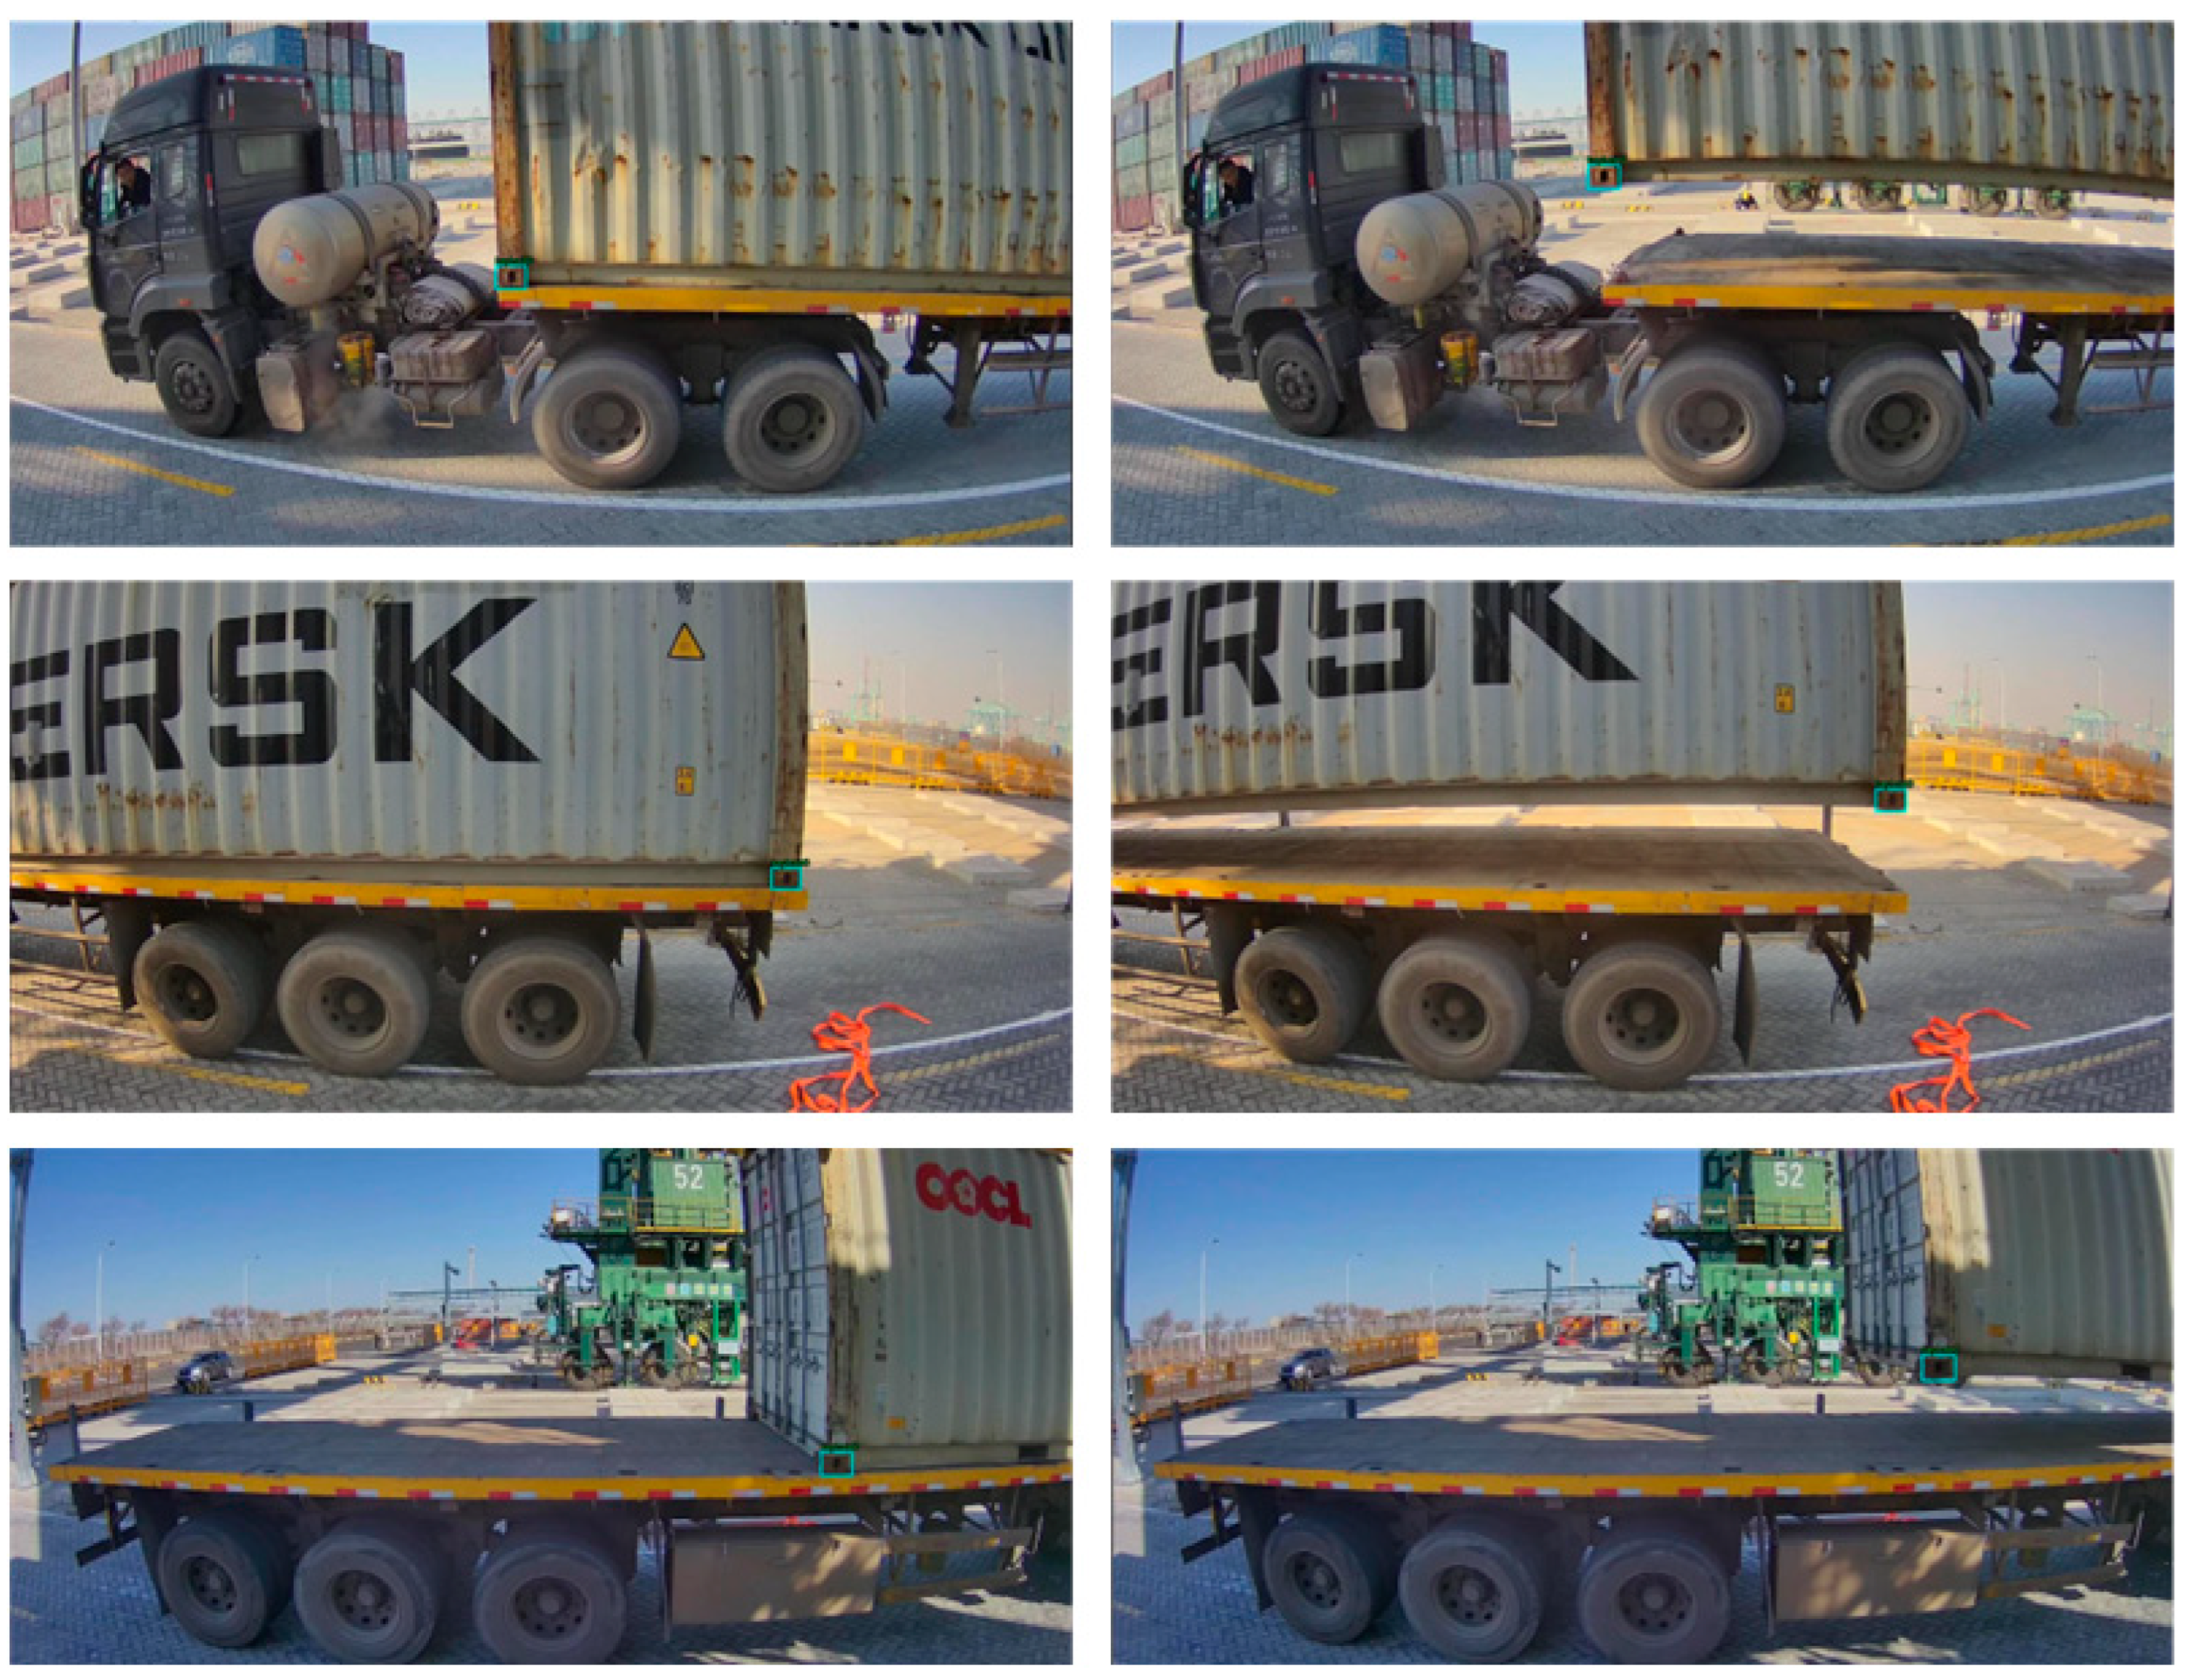
4.3.3. Secondary Positioning Experiment

The secondary positioning of the container keyhole adopted the traditional image processing algorithm to perform secondary detection on the tracking results, and the detection accuracy depended on the accuracy of the R-E-SSD. Therefore, the experiment mainly tested the positioning error and detection speed of traditional image processing algorithms.
The implementation of image processing algorithms was based on Python and OpenCV. In the experimental part, we used a set of 278 images of container keyholes detected by R-E-SSD. These images included a collection of containers with different types of containers at different times during the day and night. Figure 18 shows the results after detection by traditional image processing algorithms. It can be seen from the figure that the traditional image processing algorithm had a good detection effect on the secondary positioning of the container keyhole.
Combined with the above detection and tracking algorithms, the secondary positioning experiment was carried out on the container keyhole to judge the performance of the overall detection algorithm. The detection time of the overall algorithm was the sum of the rough positioning of R-E-SSD of the container keyhole, tracking during loading and unloading, and the traditional image algorithm’s secondary positioning detection of the container’s keyhole, to test the real-time performance of the overall algorithm. The detection accuracy was the product of detection rate of the R-E-SSD algorithm, and the tracking accuracy and traditional image processing algorithm. The detection time of the whole algorithm was about 80.3 ms, and about 12.5 frames / s, and the success rate was about 92.86%.

4.3.4. Three-Dimensional Measurement Experiment

In the initial state, the actual distance D 0 from the container to the camera was 2.7 m, and the resolution of the camera was 1920 × 1080. A 40-foot container was used to simulate loading and unloading operations. The size of the 40-foot container was 12.19 × 2.438 × 2.591 m. According to the scale factor of the pixel distance and the actual distance mentioned above, in the initial state: κ x = 3.59 , κ y = 3.25 , the scale factor of the distance between the measured object and the camera and the image pixel size κ = 60 .
The accuracy of the container offset distance measurement proposed in this paper was checked by controlling the spreader to move only in a single direction at any one time, where the spreader moved a fixed distance in different directions. The moving distance in the Z direction was 30 cm, the moving distance in the Y direction was 30 cm, and the moving distance in the X direction was 50 cm. The container offset distance evaluation index was the difference between the calculated distance and the actual distance moved by the spreader, which were X-error, Y-error, and Z-error. The scaling factors κ x and κ y of the pixel distance to the actual distance remained the same as the spreader moved in the Z and Y directions. When the spreader moved 50 cm in the X direction, the scale factor of the pixel distance and the actual distance: κ x = 3.89 , κ y = 3.54 , the distance from the measured object to the camera and the scale factor of the image pixel size κ = 54 .
The container deflection angle was controlled by the spreader to turn horizontally at a fixed angle of 5° in the X direction, and, at this time, the container keyhole moved about 54 cm in the X direction. The difference between the measured angle and the actual turning angle θ -error was calculated as the container deflection angle measurement index. The data collected the movement in the three directions each time and the flips in the X direction were completed as a group of experimental data, with a total of 10 groups. The experimental results are shown in Table 2.
It can be seen from Table 2 that, among the 10 measurement results, the average accuracy of the offset distance in the three directions of X, Y, and Z by the three-dimensional measurement algorithm of container attitude designed in this paper were 4.48 cm, 1.79 cm and 1.37 cm, respectively. The average accuracy of the offset angle in the X direction was 0.42°. It is not difficult to see from the above data that the detection accuracy of the 3D measurement algorithm designed in this paper was slightly lower than the detection accuracy in the Y and Z directions in the X direction. The reason was that, when the container only moved in the vertical lifting and horizontal directions, the scale factor κ between the container pixel size and the actual distance was almost unchanged. When the container flipped and moved in the X direction, the scale factor κ between the container pixel size and the actual distance and the scale factor κ between the distance of the measured object from the camera and the image pixel size changed, resulting in a certain measurement error, but it still met the requirements of automated loading and unloading of container terminals.
The traditional container loading and unloading operation adopts the “two-step” strategy; that is, the spreader grabs the container and lifts it to a certain height. Then, the driver checks the container lifting condition. If the container is normally lifted, the driver sends the normal lifting signal to the remote-control room to continue lifting the container. The device designed in this paper does not require the “driver confirmation” step, saving at least 10 s. Usually, within an hour, 30 container cranes can be lifted. used in this paper, The design of the equipment used in this paper meant that, within one hour, about 32.7 containers could be lifted, improving the efficiency of container loading and unloading. Furthermore, the design of the adopted device with its automatic monitoring meant it saved on human resources.

5. Conclusions

In order to ensure the safety of container trucks in the process of container loading and unloading, this paper proposed a vision-based container loading and unloading measurement system, and designed a target 3D measurement algorithm, based on deep learning. For all-weather work in complex environments, the algorithm took the container keyhole as the goal. Firstly, a small-scale deep learning network is used to quickly locate the container corners. Secondly, the traditional image processing algorithm is used to perform secondary positioning of the container corner fittings to obtain the accurate position of the container keyhole. Combined with the motion model of the container during loading and unloading, the three-dimensional measurement of the container attitude is carried out. The experimental results showed that, unlike the previous LiDAR detection methods, the measurement accuracy of this algorithm was up to 92.86%, and the measurement time was about 80.3 ms, which met the measurement accuracy of automatic container loading and unloading and realized real-time measurement.

Author Contributions

Conceptualization, C.M. and S.H.; methodology, C.M. and S.H.; software, Pytorch.; validation, C.M. and S.H.; formal analysis, C.M. and S.H.; investigation, C.M., S.H. and Y.Z.; resources, C.M. and Z.Z.; data curation, C.M. and Z.Z.; writing—original draft preparation, S.H.; writing—review and editing, C.M. and O.P.; visualization, S.H.; supervision, C.M., Y.Z. and Z.Z.; project administration, C.M. and Z.Z. All authors have read and agreed to the published version of the manuscript.

Funding

This research was supported by the EDD of China (No. 80912020104), the Science and Technology Commission of Shanghai Municipality (No. 22ZR1427700), China (Shanghai) Pilot Free Trade Zone Lin-gang Special Area Administration (No. SH-LG-GK-2020-21).

Institutional Review Board Statement

Not applicable.

Informed Consent Statement

Not applicable.

Data Availability Statement

The data used in this study did not involve any public data sets.

Conflicts of Interest

The authors declare no conflict of interest.

References

  1. Mi, C.; Huang, Y.; Fu, C.; Zhang, Z.; Postolache, O. Vision-Based Measurement: Actualities and Developing Trends in Automated Container Terminals. IEEE Instrum. Meas. Mag. 2021, 24, 65–76. [Google Scholar] [CrossRef]
  2. Schwalbe, E.; Maas, H.G.; Seidel, F. 3D building model generation from airborne laser scanner data using 2D GIS data and or-thogonal point cloud projections. In Proceedings of the ISPRS WG III/3, III/4, V/3 Workshop “Laser Scanning 2005”, Enschede, The Netherlands, 12–14 September 2005; IEEE: Piscataway, NJ, USA, 2005. [Google Scholar]
  3. Miao, Y.; Li, C.; Li, Z.; Yang, Y.; Yu, X. A novel algorithm of ship structure modeling and target identification based on point cloud for automation in bulk cargo terminals. Meas. Control. 2021, 54, 155–163. [Google Scholar] [CrossRef]
  4. Yang, J.; Man, J.; Xi, M.; Gao, X.; Lu, W.; Meng, Q. Precise Measurement of Position and Attitude Based on Convolutional Neural Network and Visual Correspondence Relationship. IEEE Trans. Neural Networks Learn. Syst. 2020, 31, 2030–2041. [Google Scholar] [CrossRef] [PubMed] [Green Version]
  5. Wang, Y.; Zhang, Y.; Xu, D.; Miao, W. A Deformation Measurement Algorithm Based on Adaptive Variable Parameter Multiple Model for Large Ships. IEEE Trans. Instrum. Meas. 2021, 70, 1–10. [Google Scholar] [CrossRef]
  6. Yin, Z.; Cai, Y.; Ren, Y.; Wang, W.; Chen, X. A High Precision Attitude Measurement Method for Spacecraft Based on Magnetically Suspended Rotor Tilt Modulation. IEEE Sens. J. 2020, 20, 14882–14891. [Google Scholar] [CrossRef]
  7. Wang, K.; Liu, Y.; Li, L. Vision-Based Tracking Control of Underactuated Water Surface Robots Without Direct Position Measurement. IEEE Trans. Control Syst. Technol. 2015, 23, 2391–2399. [Google Scholar] [CrossRef]
  8. Xia, C.; Weng, C.-Y.; Zhang, Y.; Chen, I.-M. Vision-Based Measurement and Prediction of Object Trajectory for Robotic Manipulation in Dynamic and Uncertain Scenarios. IEEE Trans. Instrum. Meas. 2020, 69, 8939–8952. [Google Scholar] [CrossRef]
  9. Yoon, H.-J.; Hwang, Y.-C.; Cha, E.-Y. Real-time container position estimation method using stereo vision for container auto-landing system. In Proceedings of the ICCAS, Gyeonggi-do, Republic of Korea, 27–30 October 2010; pp. 872–876. [Google Scholar] [CrossRef]
  10. Ulrich, I.; Nourbakhsh, I.R. Appearance-Based Obstacle Detection with Monocular Color Vision. AAAI/IAAI 2000, 866–871. [Google Scholar]
  11. Shen, Y.; Lin, W.; Wang, Z.; Li, J.; Sun, X.; Wu, X.; Wang, S.; Huang, F. Rapid Detection of Camouflaged Artificial Target Based on Polarization Imaging and Deep Learning. IEEE Photon J. 2021, 13, 7800309. [Google Scholar] [CrossRef]
  12. Liu, M.; Zhu, Q.; Yin, Y.; Fan, Y.; Su, Z.; Zhang, S. Damage Detection Method of Mining Conveyor Belt Based on Deep Learning. IEEE Sens. J. 2022, 22, 10870–10879. [Google Scholar] [CrossRef]
  13. Tekin, B.; Tekin, B.; Sinha, S.N.; Sinha, S.N.; Fua, P.; Fua, P. Real-Time Seamless Single Shot 6D Object Pose Prediction. In Proceedings of the 2018 IEEE/CVF Conference on Computer Vision and Pattern Recognition, Salt Lake City, UT, USA, 18–22 June 2018; pp. 292–301. [Google Scholar] [CrossRef] [Green Version]
  14. Braun, M.; Rao, Q.; Wang, Y.; Flohr, F. Pose-RCNN: Joint object detection and pose estimation using 3D object proposals. In Proceedings of the 2016 IEEE 19th International Conference on Intelligent Transportation Systems (ITSC), Rio de Janeiro, Brazil, 1–4 November 2016; pp. 1546–1551. [Google Scholar] [CrossRef]
  15. Weinzaepfel, P.; Brégier, R.; Combaluzier, H.; Leroy, V.; Rogez, G. DOPE: Dis-tillation Of Part Experts for whole-body 3D pose estimation in the wild. In Proceedings of the European Conference on Computer Vision, Glasgow, UK, 23–28 August 2020. [Google Scholar]
  16. Zhang, L.; Wu, D.-M.; Ren, Y. Pose Measurement for Non-Cooperative Target Based on Visual Information. IEEE Access 2019, 7, 106179–106194. [Google Scholar] [CrossRef]
  17. Long, C.; Bai, Z.; Zhi, S.; Qiu, C.; Wang, Y.; Hu, Q. A Pose Measurement Method of Non-cooperative Target Based on Monocular Vision. In Proceedings of the 33rd Chinese Control and Decision Conference (CCDC), Kunming, China, 22–24 May 2021; pp. 3110–3115. [Google Scholar] [CrossRef]
  18. Sharma, S.; Beierle, C.; D’Amico, S. Pose estimation for non-cooperative spacecraft rendezvous using convolutional neural networks. In Proceedings of the 2018 IEEE Aerospace Conference, Big Sky, MT, USA, 3–10 March 2018; pp. 1–12. [Google Scholar] [CrossRef] [Green Version]
  19. Shamsafar, F.; Ebrahimnezhad, H. Uniting holistic and part-based attitudes for accurate and robust deep human pose estimation. J. Ambient Intell. Humaniz. Comput. 2021, 12, 2339–2353. [Google Scholar] [CrossRef]
  20. Yang, J.; Xi, M.; Jiang, B.; Man, J.; Meng, Q.; Li, B. FADN: Fully Connected Attitude Detection Network Based on Industrial Video. IEEE Trans. Ind. Inform. 2020, 17, 2011–2020. [Google Scholar] [CrossRef]
  21. Huang, Q.; Huang, Y.; Zhang, Z.; Zhang, Y.; Mi, W.; Mi, C. Truck-Lifting Prevention System Based on Vision Tracking for Container-Lifting Operation. J. Adv. Transp. 2021, 2021, 1–9. [Google Scholar] [CrossRef]
  22. Zhang, Y.; Huang, Y.; Zhang, Z.; Postolache, O.; Mi, C. A vision-based container position measuring system for ARMG. Meas. Control 2022, 1–10. [Google Scholar] [CrossRef]
  23. Liu, W.; Anguelov, D.; Erhan, D.; Szegedy, C.; Reed, S.; Fu, C.Y.; Berg, A.C. Ssd: Single shot multi-box detector. In Proceedings of the European Conference on Computer Vision, Amsterdam, The Netherlands, 11–14 October 2016; Springer: Cham, Switzerland, 2016; pp. 21–37. [Google Scholar]
  24. Wojke, N.; Bewley, A.; Paulus, D. Simple online and realtime tracking with a deep association metric. In Proceedings of the 2017 IEEE International Conference on Image Processing (ICIP), Beijing, China, 17–20 September 2017; pp. 3645–3649. [Google Scholar]
  25. He, K.; Zhang, X.; Ren, S.; Sun, J. Deep residual learning for image recognition. In Proceedings of the IEEE Conference on Computer Vision and Pattern Recognition, Las Vegas, NV, USA, 27–30 July 2016; pp. 770–778. [Google Scholar]
  26. Simonyan, K.; Zisserman, A. Very deep convolutional networks for large-scale image recognition. arXiv 2014, arXiv:1409.1556. [Google Scholar]
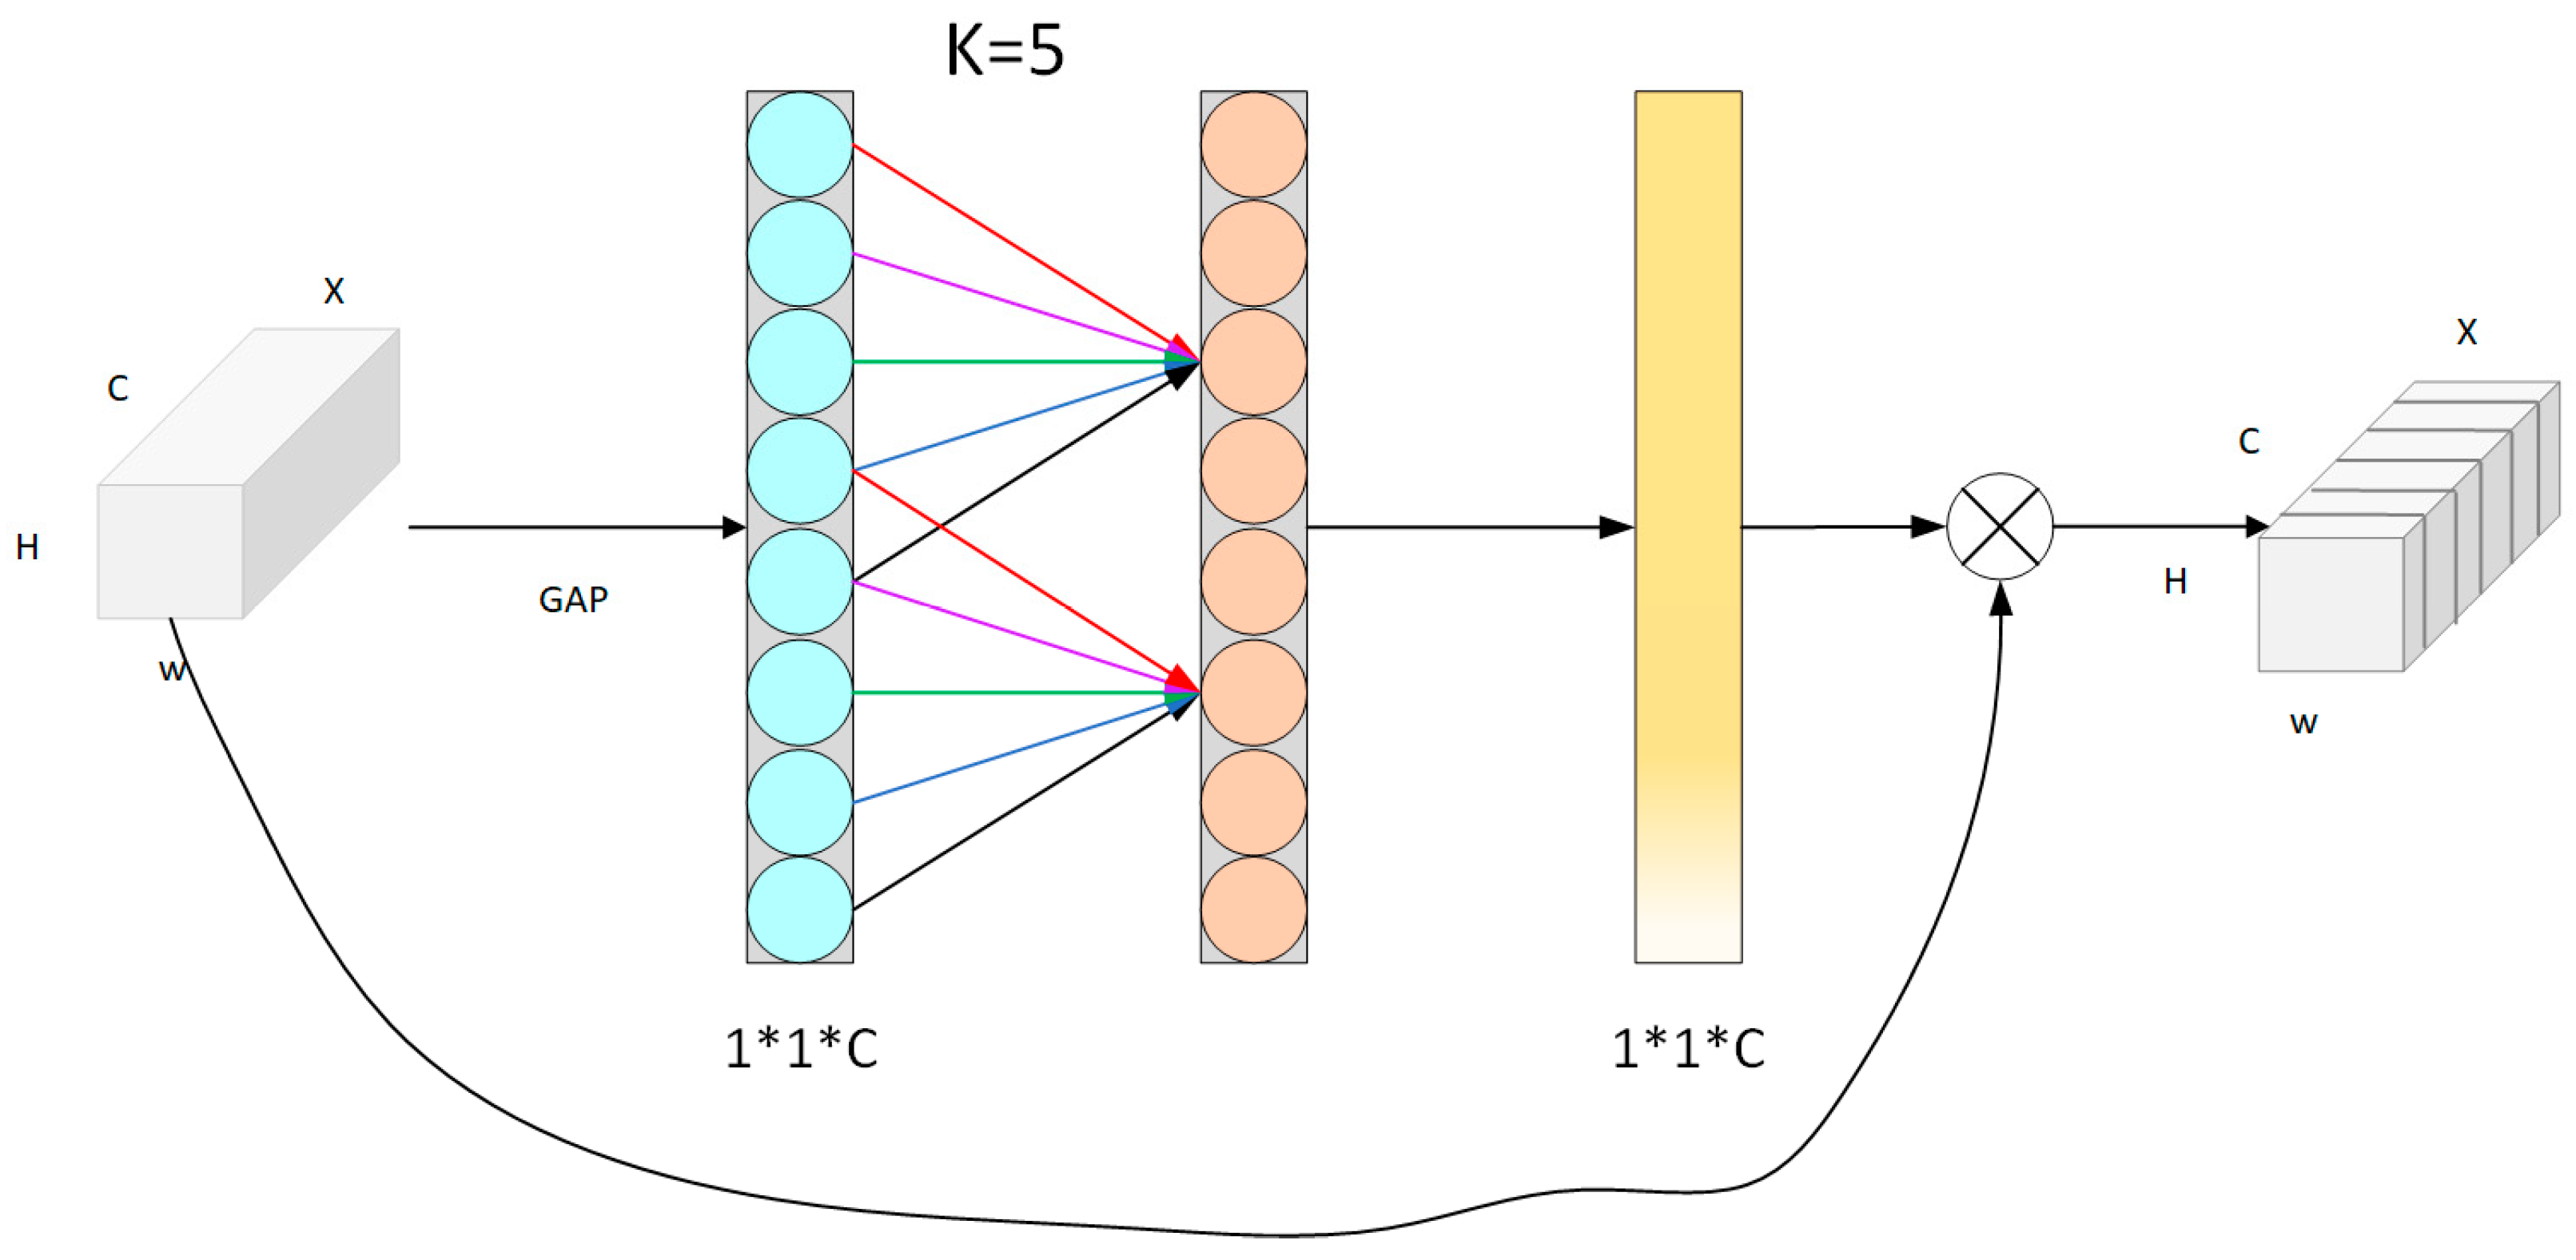
  27. Wang, Q.; Wu, B.; Zhu, P.; Li, P.; Zuo, W.; Hu, Q. ECA-Net: Efficient Channel Attention for Deep Convolutional Neural Networks. In Proceedings of the 2020 IEEE/CVF Conference on Computer Vision and Pattern Recognition (CVPR), Seattle, WA, USA, 14–19 June 2020. [Google Scholar] [CrossRef]
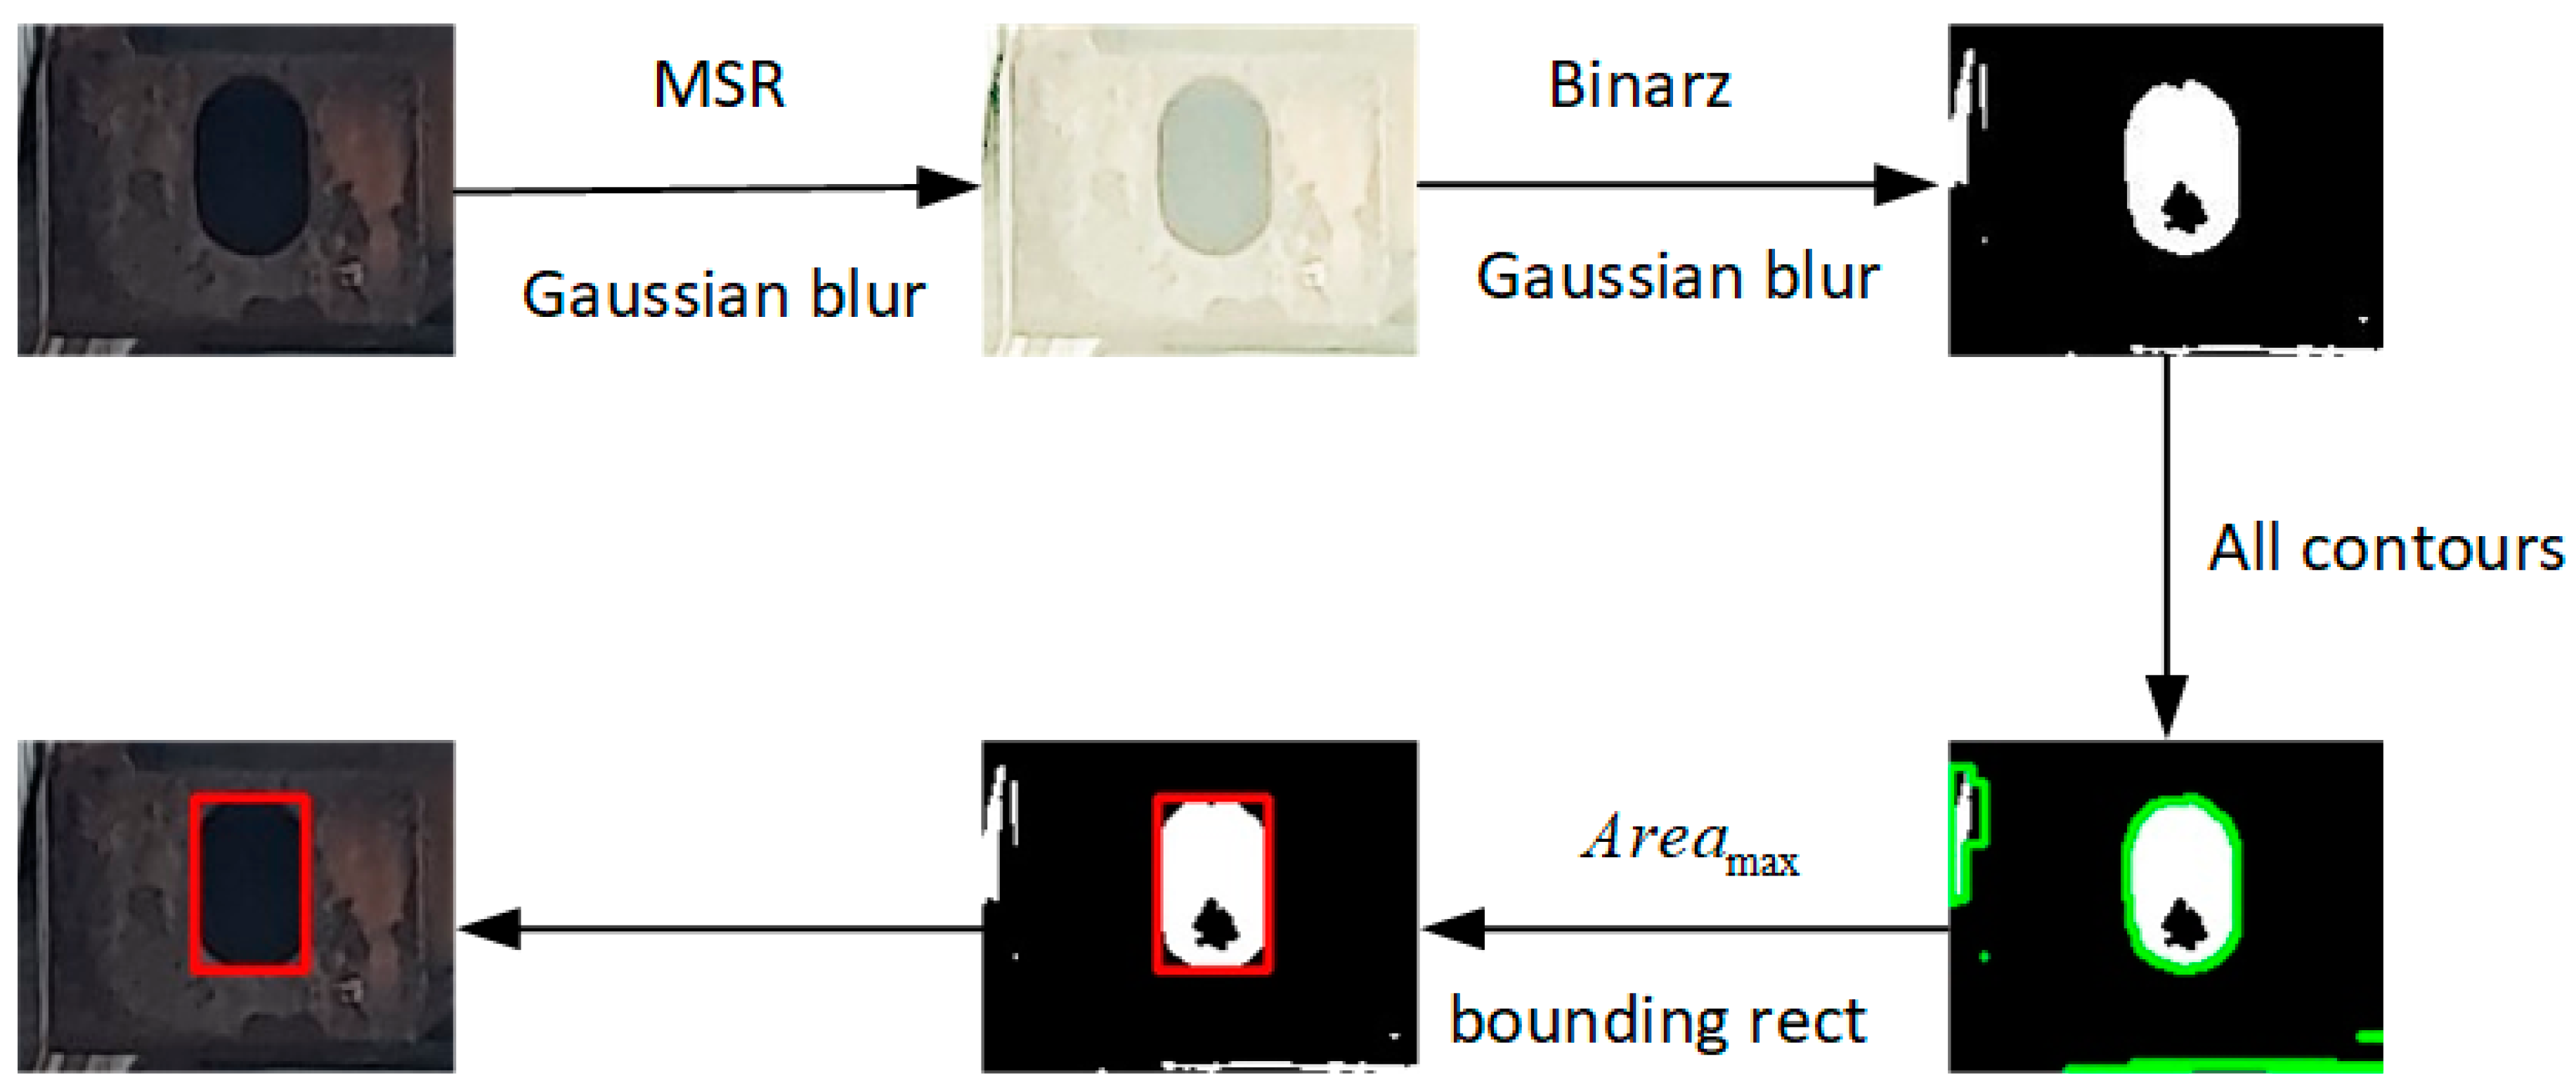
  28. Zotin, A. Fast Algorithm of Image Enhancement based on Multi-Scale Retinex. Procedia Comput. Sci. 2018, 131, 6–14. [Google Scholar] [CrossRef]
  29. Zhang, Z. A flexible new technique for camera calibration. IEEE Trans. Pattern Anal. Mach. Intell. 2000, 22, 1330–1334. [Google Scholar] [CrossRef] [Green Version]
  30. Ren, S.; He, K.; Girshick, R.; Sun, J. Faster R-CNN: Towards real-time object detection with region proposal networks. IEEE Trans. Pattern Anal. Mach. Intell. 2017, 39, 1137–1149. [Google Scholar] [CrossRef] [PubMed]
  31. Redmon, J.; Farhadi, A. YOLOv3: An Incremental Improvement. arXiv 2018, arXiv:1804.02767. [Google Scholar]
  32. Fu, C.Y.; Liu, W.; Ranga, A.; Tyagi, A.; Berg, A.C. DSSD: Deconvolutional Single Shot Detector. In Proceedings of the 2017 IEEE/CVF Computer Vision and Pattern Recognition (CVPR), Honolulu, HI, USA, 21–26 July 2017. [Google Scholar]
Figure 1. Hardware installation diagram.
Jmse 10 01961 g001
Figure 2. Container keyhole.
Jmse 10 01961 g002
Figure 3. Algorithm flowchart.
Jmse 10 01961 g003
Figure 4. R-E-SSD network structure. ECA-Net, a lightweight and efficient channel attention module, ensures the neural network focuses on certain channels with large weight values, and resnet-18 provides the feature extraction backbone network.
Jmse 10 01961 g004
Figure 5. ECA-Net structure. H, W, and C are the length, width and channel of the feature map X, respectively.
Jmse 10 01961 g005
Figure 6. The container keyhole detected by the above method.
Jmse 10 01961 g006
Figure 7. Secondary location algorithm.
Jmse 10 01961 g007
Figure 8. Standard container corner piece.
Jmse 10 01961 g008
Figure 9. Camera imaging principle.
Jmse 10 01961 g009
Figure 10. Y, Z offset distance.
Jmse 10 01961 g010
Figure 11. X offset distance.
Jmse 10 01961 g011
Figure 12. Container X direction offset.
Jmse 10 01961 g012
Figure 13. Calculate offset angle.
Jmse 10 01961 g013
Figure 14. Camera installation drawing.
Jmse 10 01961 g014
Figure 15. Part of the dataset images.
Jmse 10 01961 g015
Figure 16. P-R curve, Yellow is the PR curve of Faster-RCNN; purple is the PR curve of YOLOv3; green is the PR curve of DSSD; orange is the PR curve of SSD; red is the PR curve of our algorithm.
Jmse 10 01961 g016
Figure 17. Tracking results.
Jmse 10 01961 g017
Figure 18. Secondary positioning results. The first row shows the input image after the above detection and tracking. The second row shows the results after MSR image enhancement. The third row shows the results after binarization. The fourth row shows all the contour results in the marked image. The fifth row shows the result of fitting the largest contour using the smallest rectangle. The sixth row shows the result after secondary positioning.
Jmse 10 01961 g018
Table 1. Comparison of test results.
BackboneInputAP/%FPS
SSDVGG-16300*30071.8636
DSSDResnet-101320*32073.4617
Faster-RCNNResnet-50600*60081.957.8
Yolov3Darknet-53416*41687.5431.4
oursResnet-18300*30094.7530.7
Table 2. 3D measurement results.
X-Error (cm)Y-Error (cm)Z-Error (cm) θ - e r r o r (°)
First4.751.881.430.45
Second4.721.721.470.41
Third4.261.681.170.46
Fourth4.631.751.580.45
Fifth4.811.921.270.37
Sixth4.181.751.320.46
Seventh4.721.681.540.35
Eighth4.381.951.040.53
Nineth4.091.731.450.38
Tenth4.311.831.410.37
Publisher’s Note: MDPI stays neutral with regard to jurisdictional claims in published maps and institutional affiliations.

