Article

A Potential Beach Monitoring Based on Integrated Methods

1
Dipartimento di Scienze della Terra e Geoambientali, Campus Universitario, Università degli Studi di Bari “Aldo Moro”, Via Edoardo Orabona 4, 70125 Bari, Italy
2
Interdepartmental Research Centre for Coastal Dynamics, Campus Universitario, Università degli Studi di Bari “Aldo Moro”, Via Edoardo Orabona 4, 70125 Bari, Italy
3
CNR-IMAA, National Research Council, Institute of Methodologies for Environmental Analysis, 85050 Tito, Italy
4
Environmental Surveys Srl, Via Dario Lupo 65, 74121 Taranto, Italy
5
Dipartimento di Scienze della Terra, Sapienza Università di Roma, Piazzale Aldo Moro 5, 00185 Rome, Italy
6
CNR-IGAG, National Research Council, Institute of Environmental Geology and Geoengineering, Montelibretti, 00010 Rome, Italy
7
Aix-Marseille Université CNRS, IRD, Coll France, CEREGE, Technopôle de l’Arbois-Méditerranée BP80, 13545 Aix-en-Provence, France
*
Author to whom correspondence should be addressed.
J. Mar. Sci. Eng. 2022, 10(12), 1949; https://doi.org/10.3390/jmse10121949
Submission received: 11 November 2022 / Revised: 29 November 2022 / Accepted: 1 December 2022 / Published: 8 December 2022
(This article belongs to the Special Issue Recent Advances in Sedimentology)

Abstract

:
This study focuses on the analysis of sandy beaches by integrating sedimentological, geomorphological, and geophysical investigations. The beach represents an extremely variable environment where different natural processes act simultaneously with human activities, leading to the gathering of different methodologies of the Earth Sciences to study its evolution in space and time. The aim of this research is to propose a potential procedure for monitoring the morpho-sedimentary processes of sandy beaches by analyzing the textural and compositional characteristics of the sands and quantifying the volumes involved in the coastal dynamics. The study area includes two Apulian sandy beaches (Torre Guaceto and Le Dune beach) that are representative of the coastal dynamics of a large sector of the central/northern Mediterranean Sea involving the southern Adriatic Sea and the northern Ionian Sea. Sedimentological and ecological investigations allowed to describe the textural and compositional characteristics of the beach sands by interpreting their sand provenance and the physical/biological interactions within the beach. The topographic surveys carried out with a Terrestrial Laser Scanner and an Optical Total Station, aimed to quantify the variations of sediment volume over time, whereas the Delft3d software was applied to analyze the effects of the dominant wave motion on the sedimentary dynamics. Lastly, the geophysical techniques which included Sub Bottom Profiler procedures, Ground Penetrating Radar investigation, and resistivity models enabled us to calculate the sand sediment thickness above the bedrock.

1. Introduction

Coastal zones can be defined as complex natural ecosystems where hydrodynamic, sedimentary, morphological, and biological conditions and human disturbance interact at different spaces and time scales [1,2,3]. Coasts are often seen as fundamental resources to be “exploited”, especially for touristic and economic purposes. However, social interests, economic investments, and the protection of natural ecosystems must meet the requirements of Integrated Coastal Zone Management (ICZM), which considers the fragility of coastal ecosystems and landscapes.
As reported from the latest United Nations reports, about 37% of the world’s population lives within 100 km of the coast. This area is settled by a wide range of activities and infrastructures that have significantly changed the natural response of littoral sectors to extreme events and sea level rise. Indeed, the scientific community agrees on the increasing exposure of coastal areas to the hazard of erosion due to climate change [4,5] intensifying coast vulnerabilities [6,7,8,9,10], and the attention of decision-makers to find sustainable solutions for their protection, disaster risk reduction, and building community resilience [11,12,13,14].
The most threatened regions are Europe with 86% and Asia with 69% of their coastal ecosystems at risk [15]. In Europe, most of the impact zones (15,100 km) are actively retreating, some of them despite coastal protection works (2900 km), and another 4700 km have become artificially stabilized [16]. Only the magnitude and nature of erosion change from place to place.
Several European research projects (Eurosion, Conscience, Micore, Peseta, Coastgap) focus on sustainable management along Mediterranean coastal areas. These littoral sectors are mainly wave-dominated and the effect of tides on sedimentation is negligible (microtidal regime). Mediterranean sandy beaches are characterized by terrigenous sediments coming from delta deposits and/or from the erosion of cliffs or headlands occurring in the same coastal site. However, a significant percentage of sandy beaches are constituted by carbonate bioclast components that derive from shells or fragments of the organisms that populate the proximal marine environment of the Mediterranean area [17,18,19]. Bioclasts become of primary importance in a geological context characterized by the absence of rivers and deltas.
Apulian sandy beaches (Southern Italy) represent a significant Mediterranean example of beach sand composition variability. The composition is connected to the typical coastal geomorphological and sedimentological features in karst areas, often lacking important fluvial courses capable of transporting large quantities of sediments into the sea [20]. At the regional level, many studies analyze the features of Apulian sandy beaches (Figure 1) also showing the processes concerning their susceptibility to erosion. From a granulometric and mineralogical point of view, beach sediments show significantly different features between the Ionian and Adriatic side [21]. Sediments are essentially bioclastic on the Ionian side as the littoral sector of Porto Cesareo (Figure 1 [20,22]) and terrigenous on the Adriatic Seaside [23,24,25,26] as it is detected along Torre Mileto, Rosa Marina, Pilone, Torre Canne, and Alimini coastal sectors (Figure 1 [17,21,27]). These beaches are mainly composed of fine- to coarse-grained sands characterized by carbonates (either lithoclasts or bioclasts), quartz, and other minerals such as pyroxene, amphibole, and feldspar [18]. In terms of evolutionary tendency, stable conditions are recorded along the Ionian coast [28,29,30], whereas retreating tendencies are detected along the Adriatic littoral stretch [17,18,25,31,32,33,34,35,36,37].
Evaluating the evolutionary tendency of a beach (accretion/erosion) requires various monitoring techniques, applied to the emerged and submerged sectors, in order to quantify the volume involved in coastal dynamics. In the specific literature, primary studies aimed at the description of sand movements along beaches [38], the recognition of sand textural parameters as a tool to evaluate the health state of the beach [39], the concept of equilibrium profile [40], and the role of dissipative and reflective characteristics [41] for a morphodynamic beach classification [42,43]. Later, the study of sandy beaches experienced significant progress. Table 1 represents an overview of the different studies carried out on the beach environment. The list of authors provides an example of the large number of techniques for beach investigation.
Recently, the implementation of different methodologies contributes to gain relevant information for sandy beach nourishment interventions [83,84,85,86,87,88,89] and leads to necessarily integrate the single techniques within an interdisciplinary approach. This type of analysis could provide more manageable and focused actions for safeguarding, protecting, and restoring sandy littoral sectors [17,90,91,92].
For this reason, this work focuses on the mechanism of erosion, transport, and sedimentation of two Apulian sandy littoral sectors through a multidisciplinary approach. We suggest a reliable guideline for monitoring sandy beaches aiming to:
  • a description of the textural and compositional features of beach sands;
  • a short-term erosional/prograding tendency evaluation;
  • an overall sketch scheme of beach dynamics;
  • a measurement of the beach sediment thickness above the bedrock and therefore of the sand amount virtually involved in the beach sedimentary dynamics.
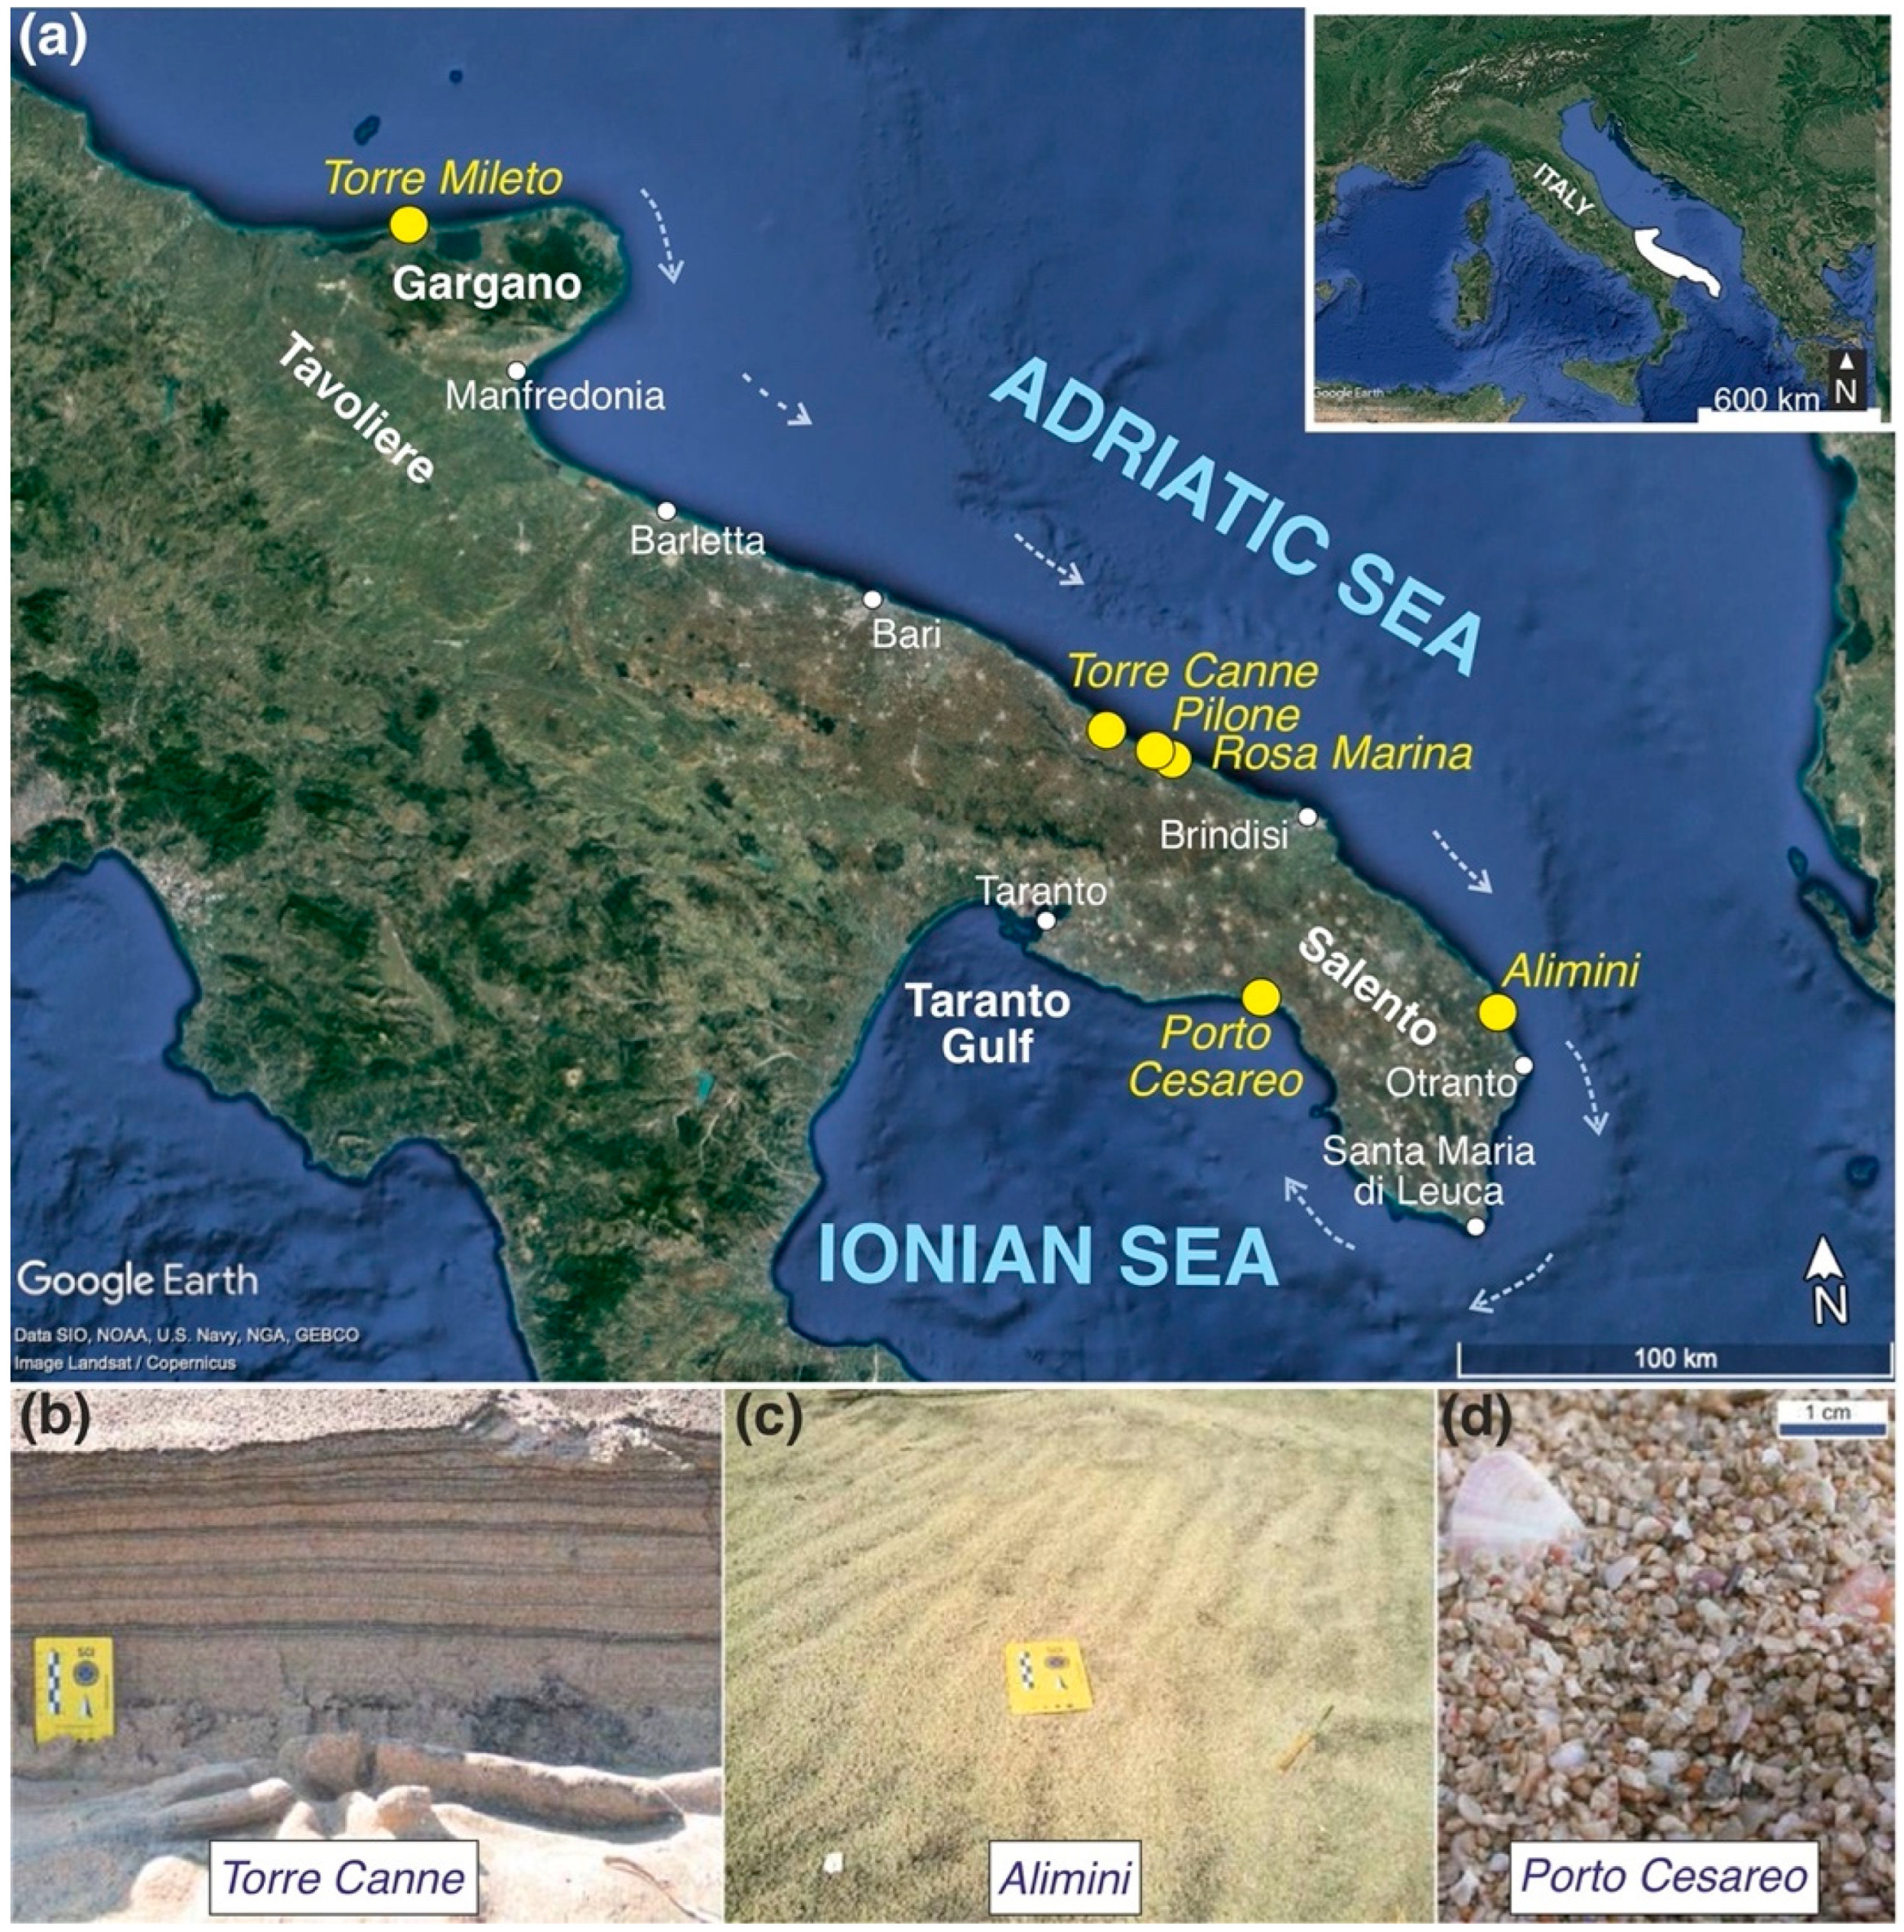
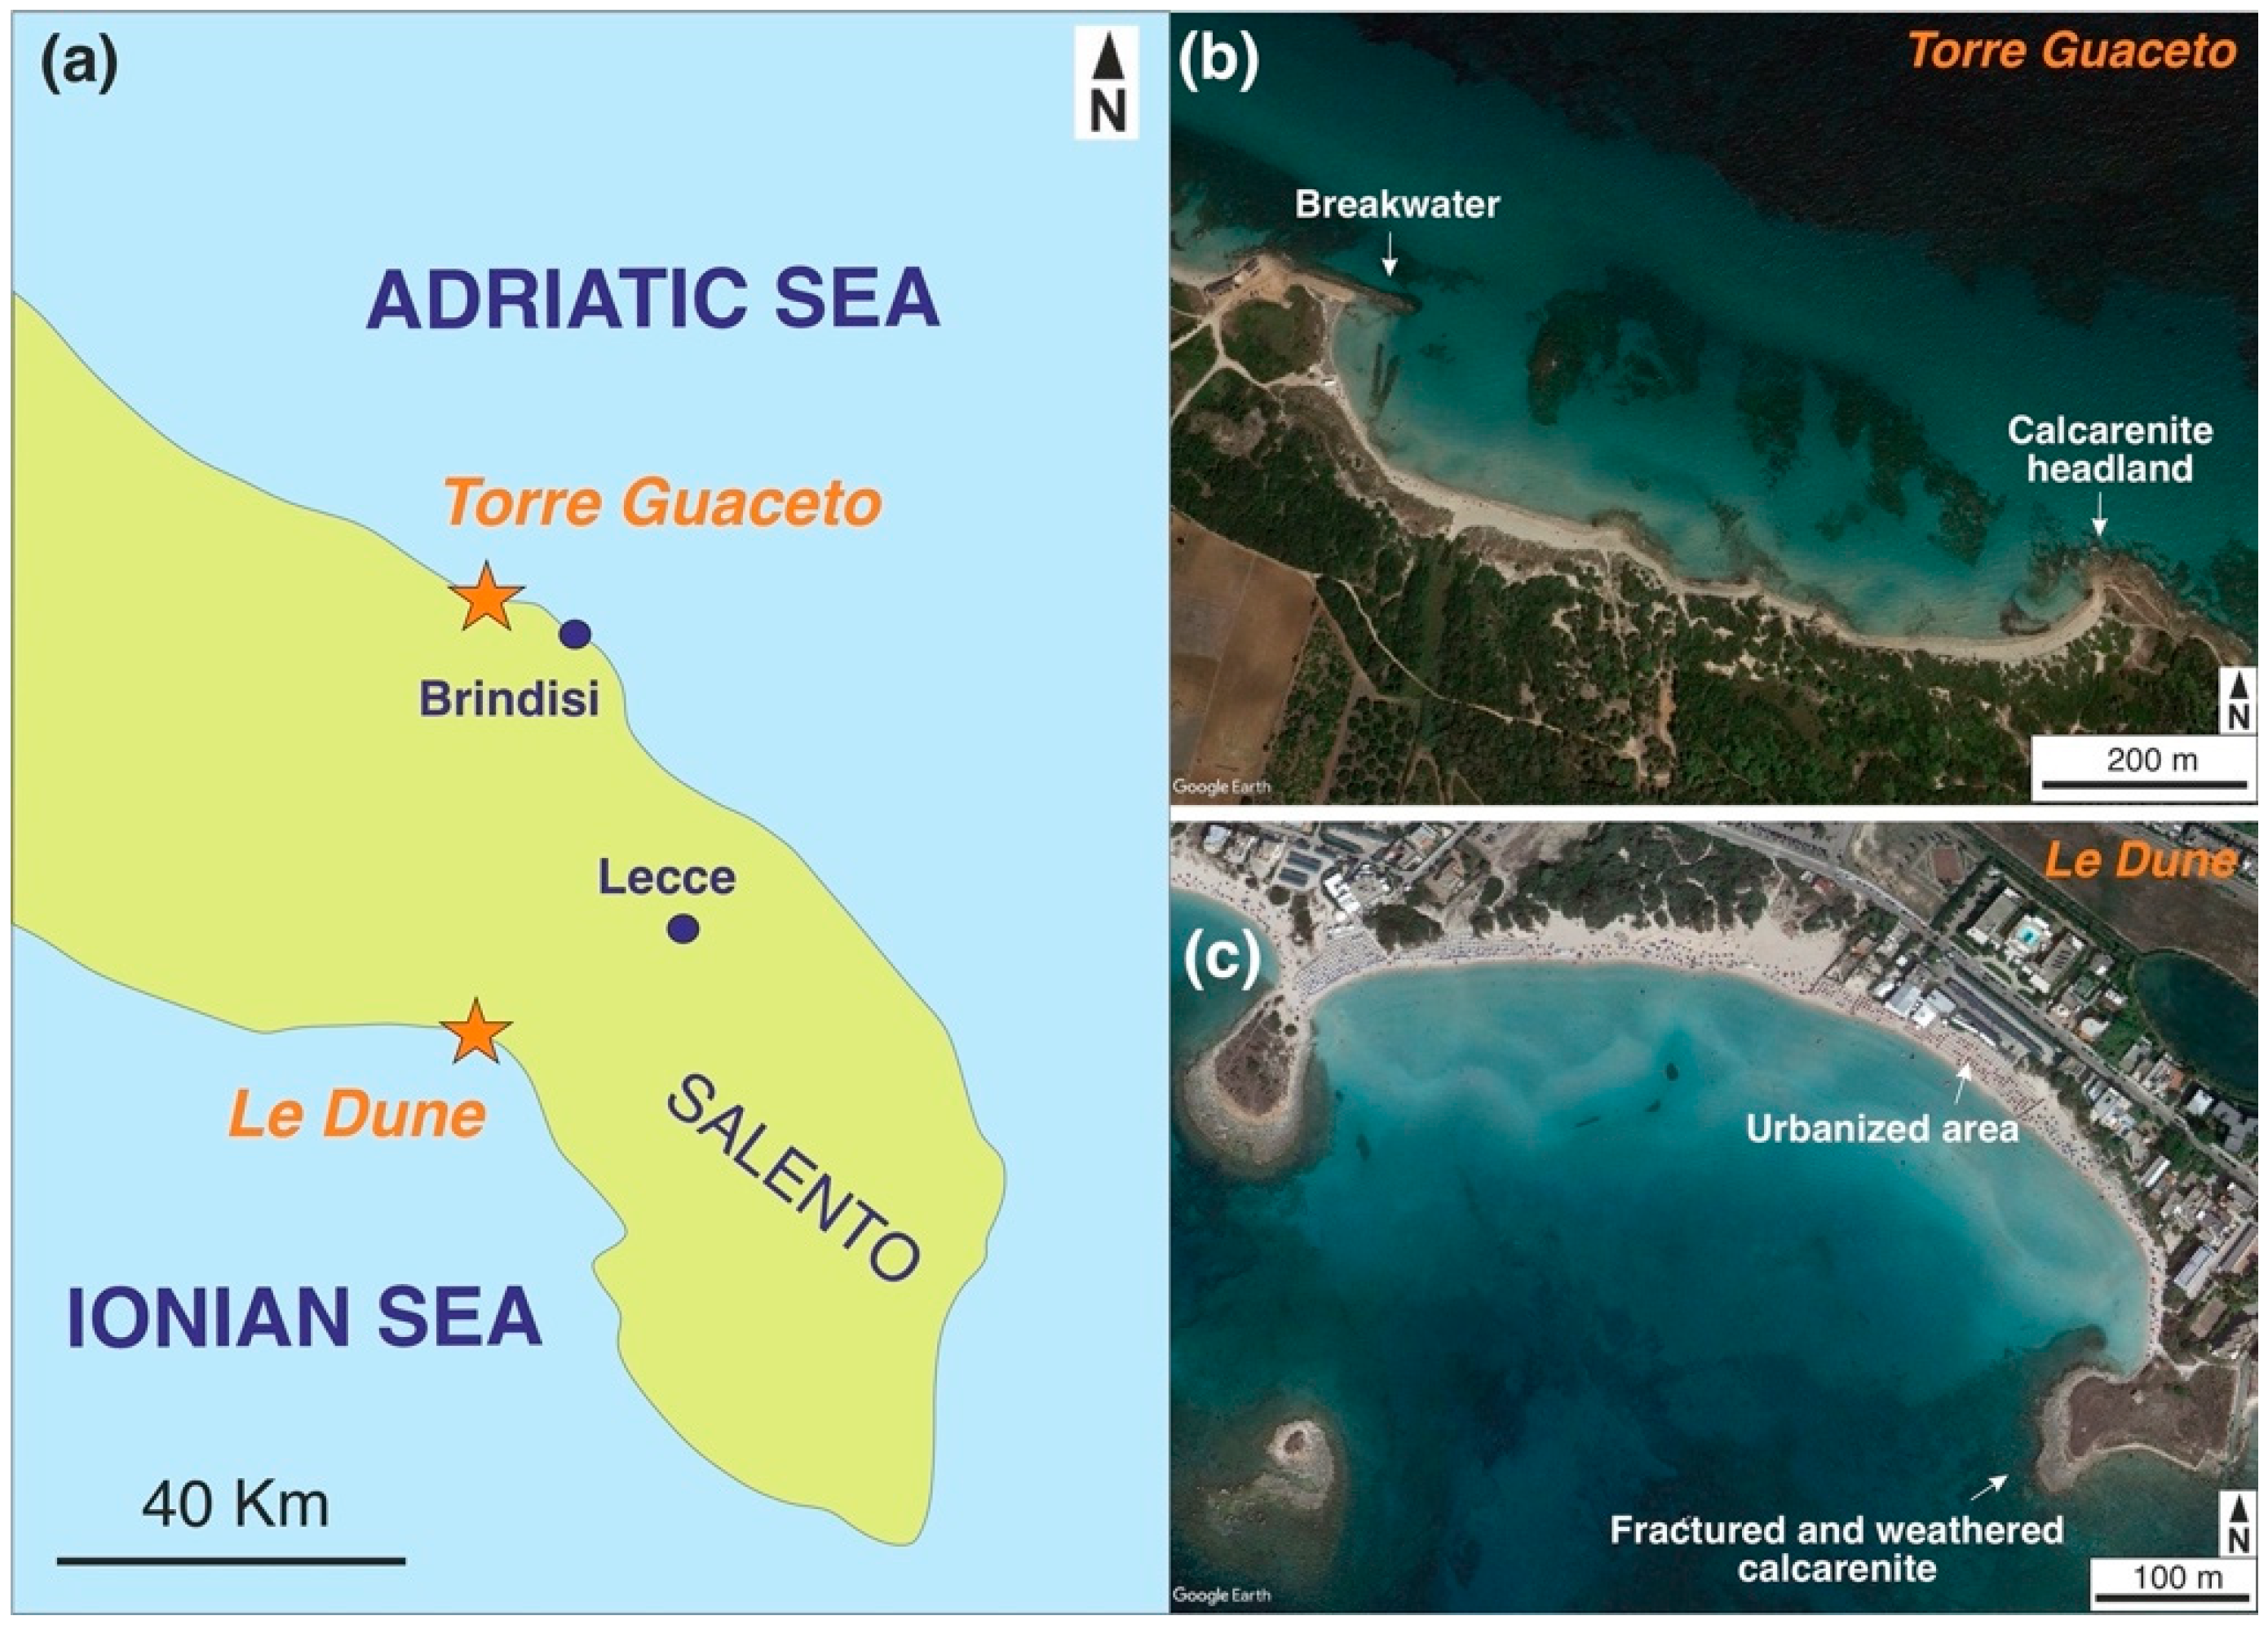
The research proposes a methodological approach that could be useful for scientific communities or private/public coastal management. After a brief description of the study areas, the main part of the research focuses on testing the procedures for beach investigation. In the final paragraphs, a suggestion regarding data management is also provided by using the result of this research as an example of data interpretation.
The possibility to obtain measurements through modern technologies in an interdisciplinary framework represents a development in the reliable understanding of the interactions between complex physical and biological processes occurring in beach environments.

2. Study Area

The study area includes two Apulian sandy littoral stretches (Figure 2a): Torre Guaceto (40,71 lat. N; 17,77 long. E) and Le Dune beach (40,27 lat. N; 17,87 long. E) occurring in the Adriatic and Ionian sectors of the Salento Peninsula, respectively (Brindisi and Lecce provinces). Both beaches are in two of the most important Marine Protected Areas (MPA) which include 15 different habitats of the typical Mediterranean submerged populations and the presence of Posidonia oceanica meadows. They can be considered endmembers of the coastal dynamics of a large sector of the central/northern Mediterranean Sea involving the southern Adriatic Sea and northern Ionian Sea with negligible anthropogenic impact.
Torre Guaceto (Figure 2b) is a pocket beach that stretches for about 1 km. The embayment is delimited by two rocky headlands: the south-eastern Lower Pleistocene shallow-water skeletal calcarenites (Punta Penna Grossa outcrop) and an anthropogenic structure of the 20th century in the north-westward [93]. The area is characterized by high coastal dunes and a rocky and sandy sea bottom. The beach is affected by a slight human impact, and it can be representative of sandy beaches lying on the northern coastal sector of Brindisi in terms of wind and wave weather, sand composition, and granulometric features. Beach sediments range from coarse to fine sands mainly composed of carbonate grains (bioclasts or lithoclasts) and siliciclastic minerals. Wave directions are mainly between 330° (16.79%) and 120° (15.36%). It is also observed that the highest frequency of appearance (22.15%) and the highest significant wave heights (Hs between 3 m and 4 m) derive from the 0° direction [94].
On the contrary, Le Dune beach (Figure 2c) is located along the Ionian Seaside and stretches for about 800 m. The small embayment has a slight Z-shaped form with an increased sediment accumulation on its western limit. Beach sediments range from very coarse to medium-fine sands and they are mainly made up of bioclast fragments. The pocket beach is bounded landward by aeolian dunes and by promontories where Cretaceous limestone crops out. At deeper depths, the shelf extends between the isobaths at −5 m and 100–110 m, and it is predominantly covered by bioclastic sands. Within the inner portion of the shelf, Posidonia oceanica meadows form large patches which are replaced at depth by coralligenous platform deposits [95]. Le Dune can be considered representative of the Ionian sandy beaches that have experienced a remarkable urbanization of the coastal areas in the last decades. Generally, wave directions are between 150° (15.91%) and 300° (8.47%), and seas from the south (24.48%) and southeast (15.91%) have the highest frequencies [96]. A rip current phenomenon is often observed during storm events [22].

3. Materials and Method

Since this work is based upon a multidisciplinary approach, some of the main techniques used in the field of sedimentology, petrography, biogeology–paleontology, geomorphology, and applied geophysics were used for beach investigation. However, according to the objectives to be achieved, some procedures were constructed within the current research in order to obtain a detailed outline of beach dynamics and sediment thickness quantification.

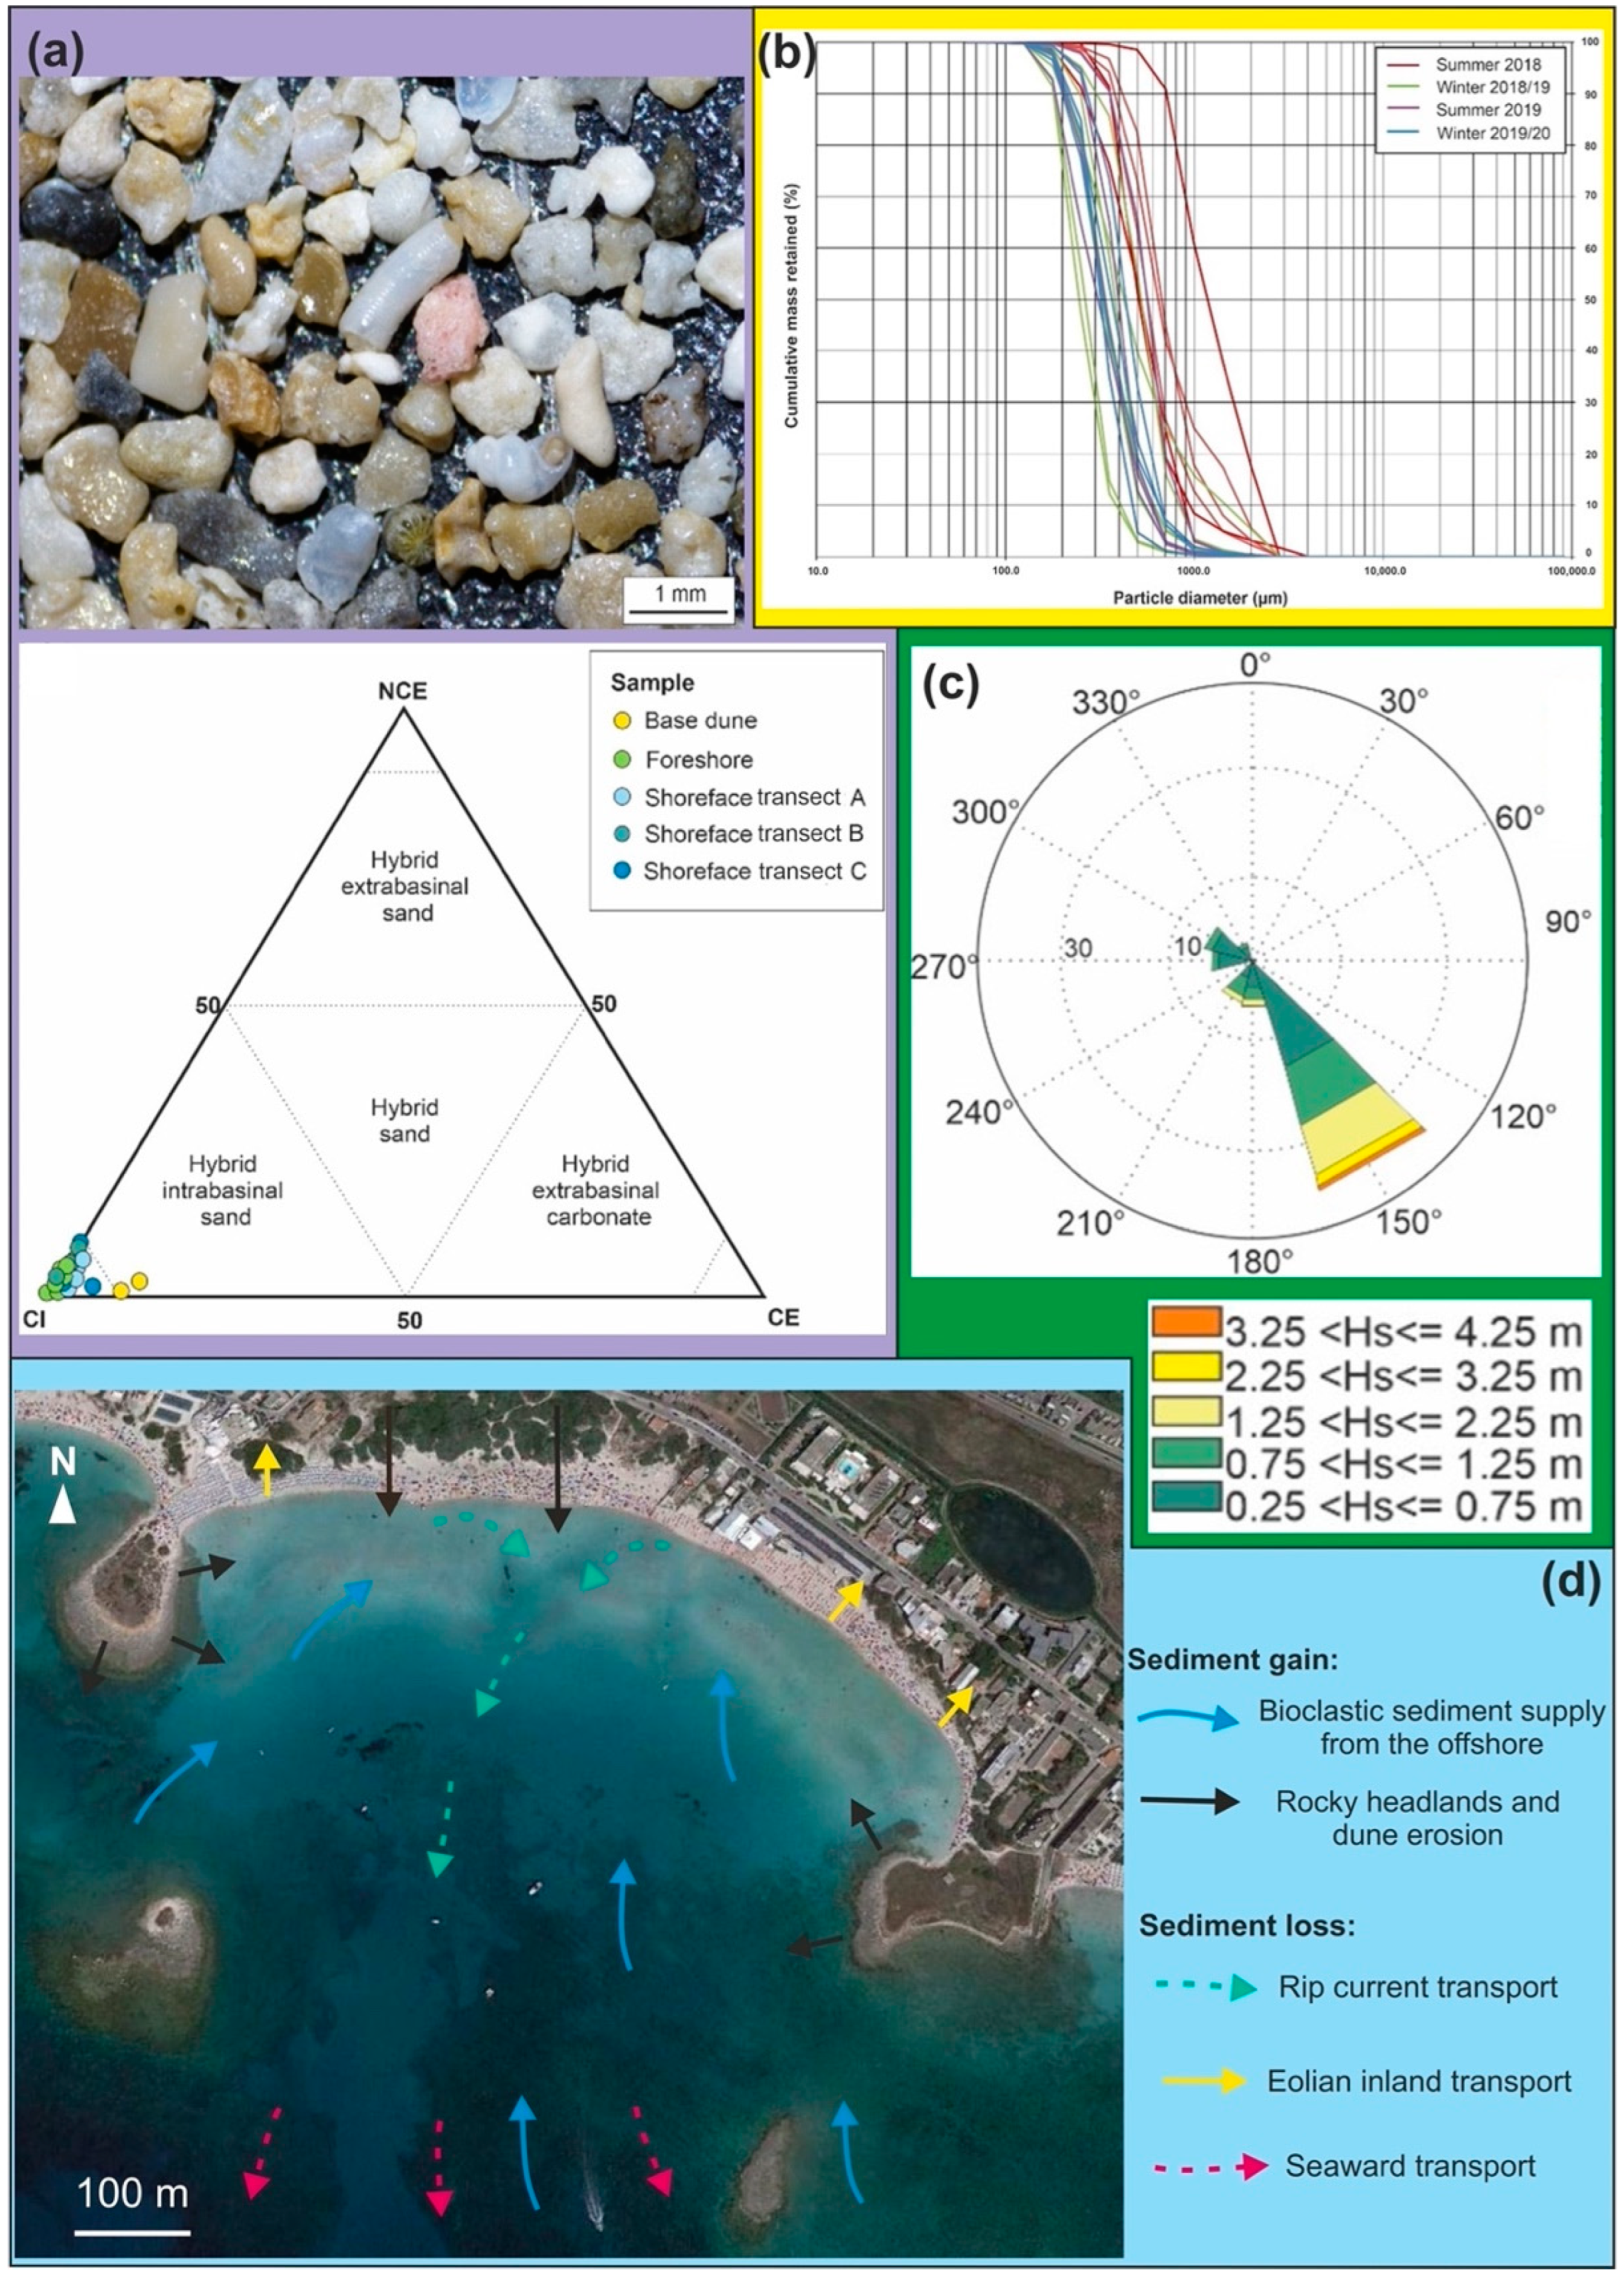
3.1. Beach Sand Analysis
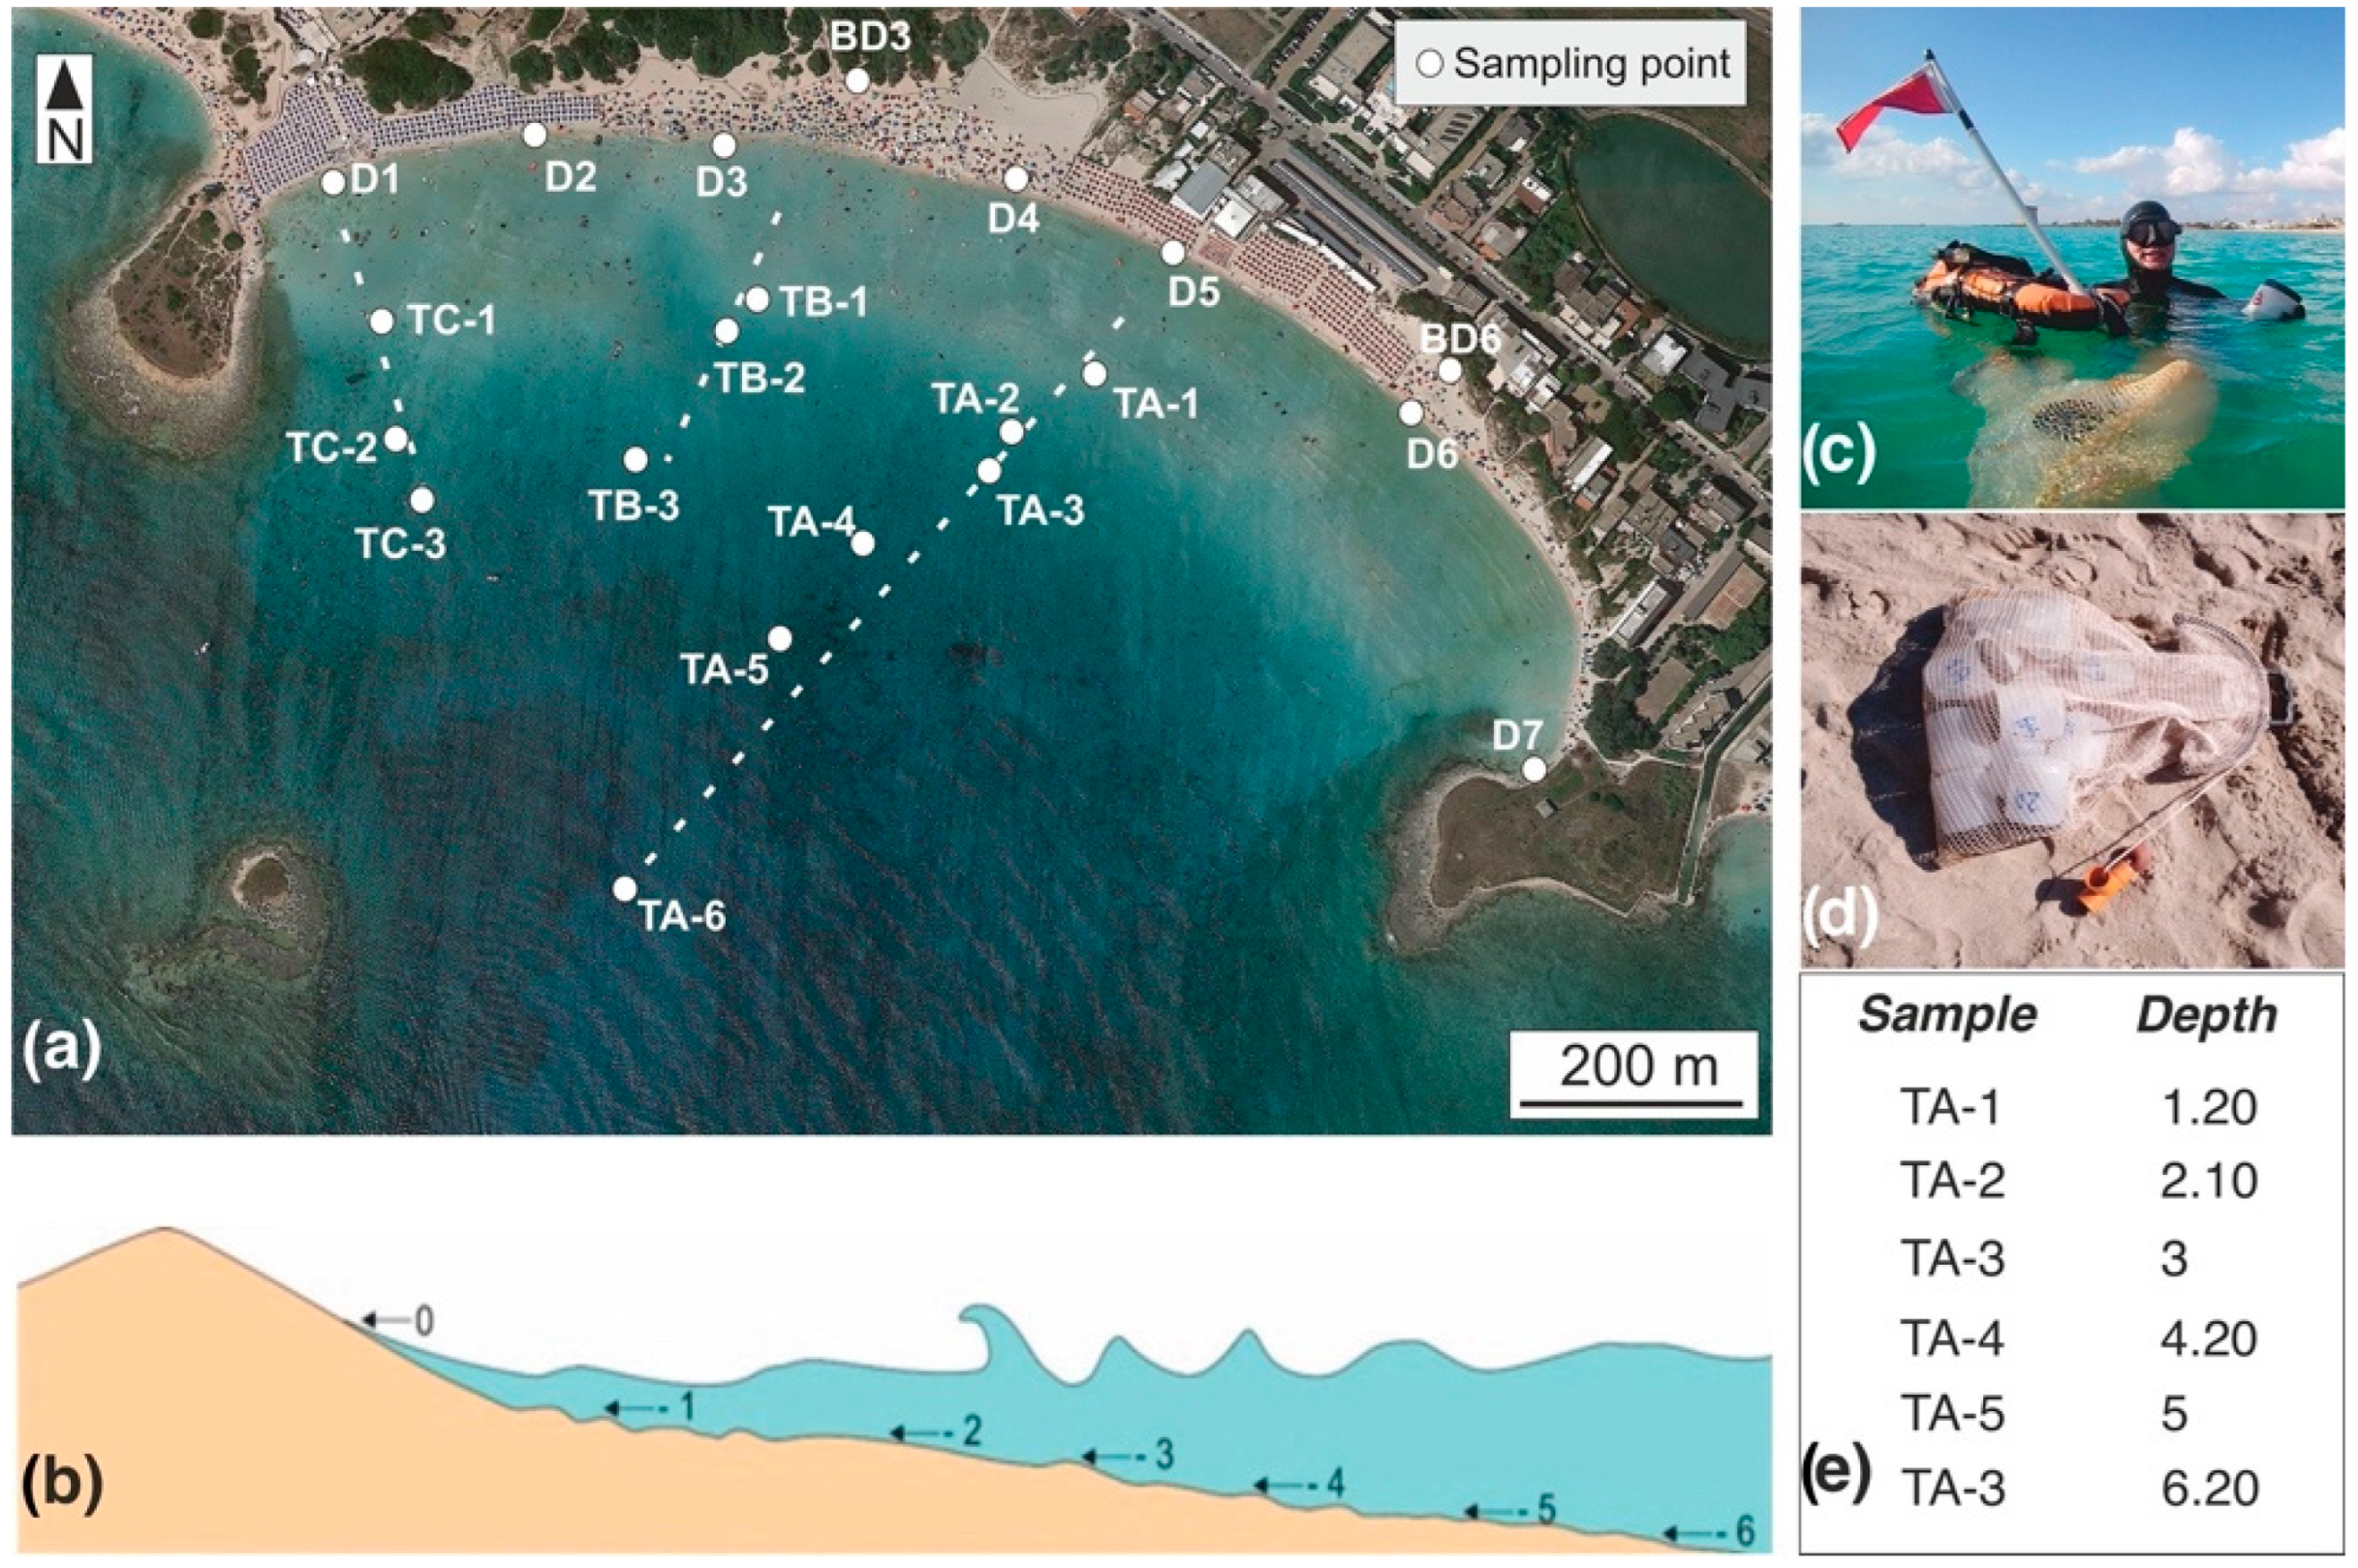
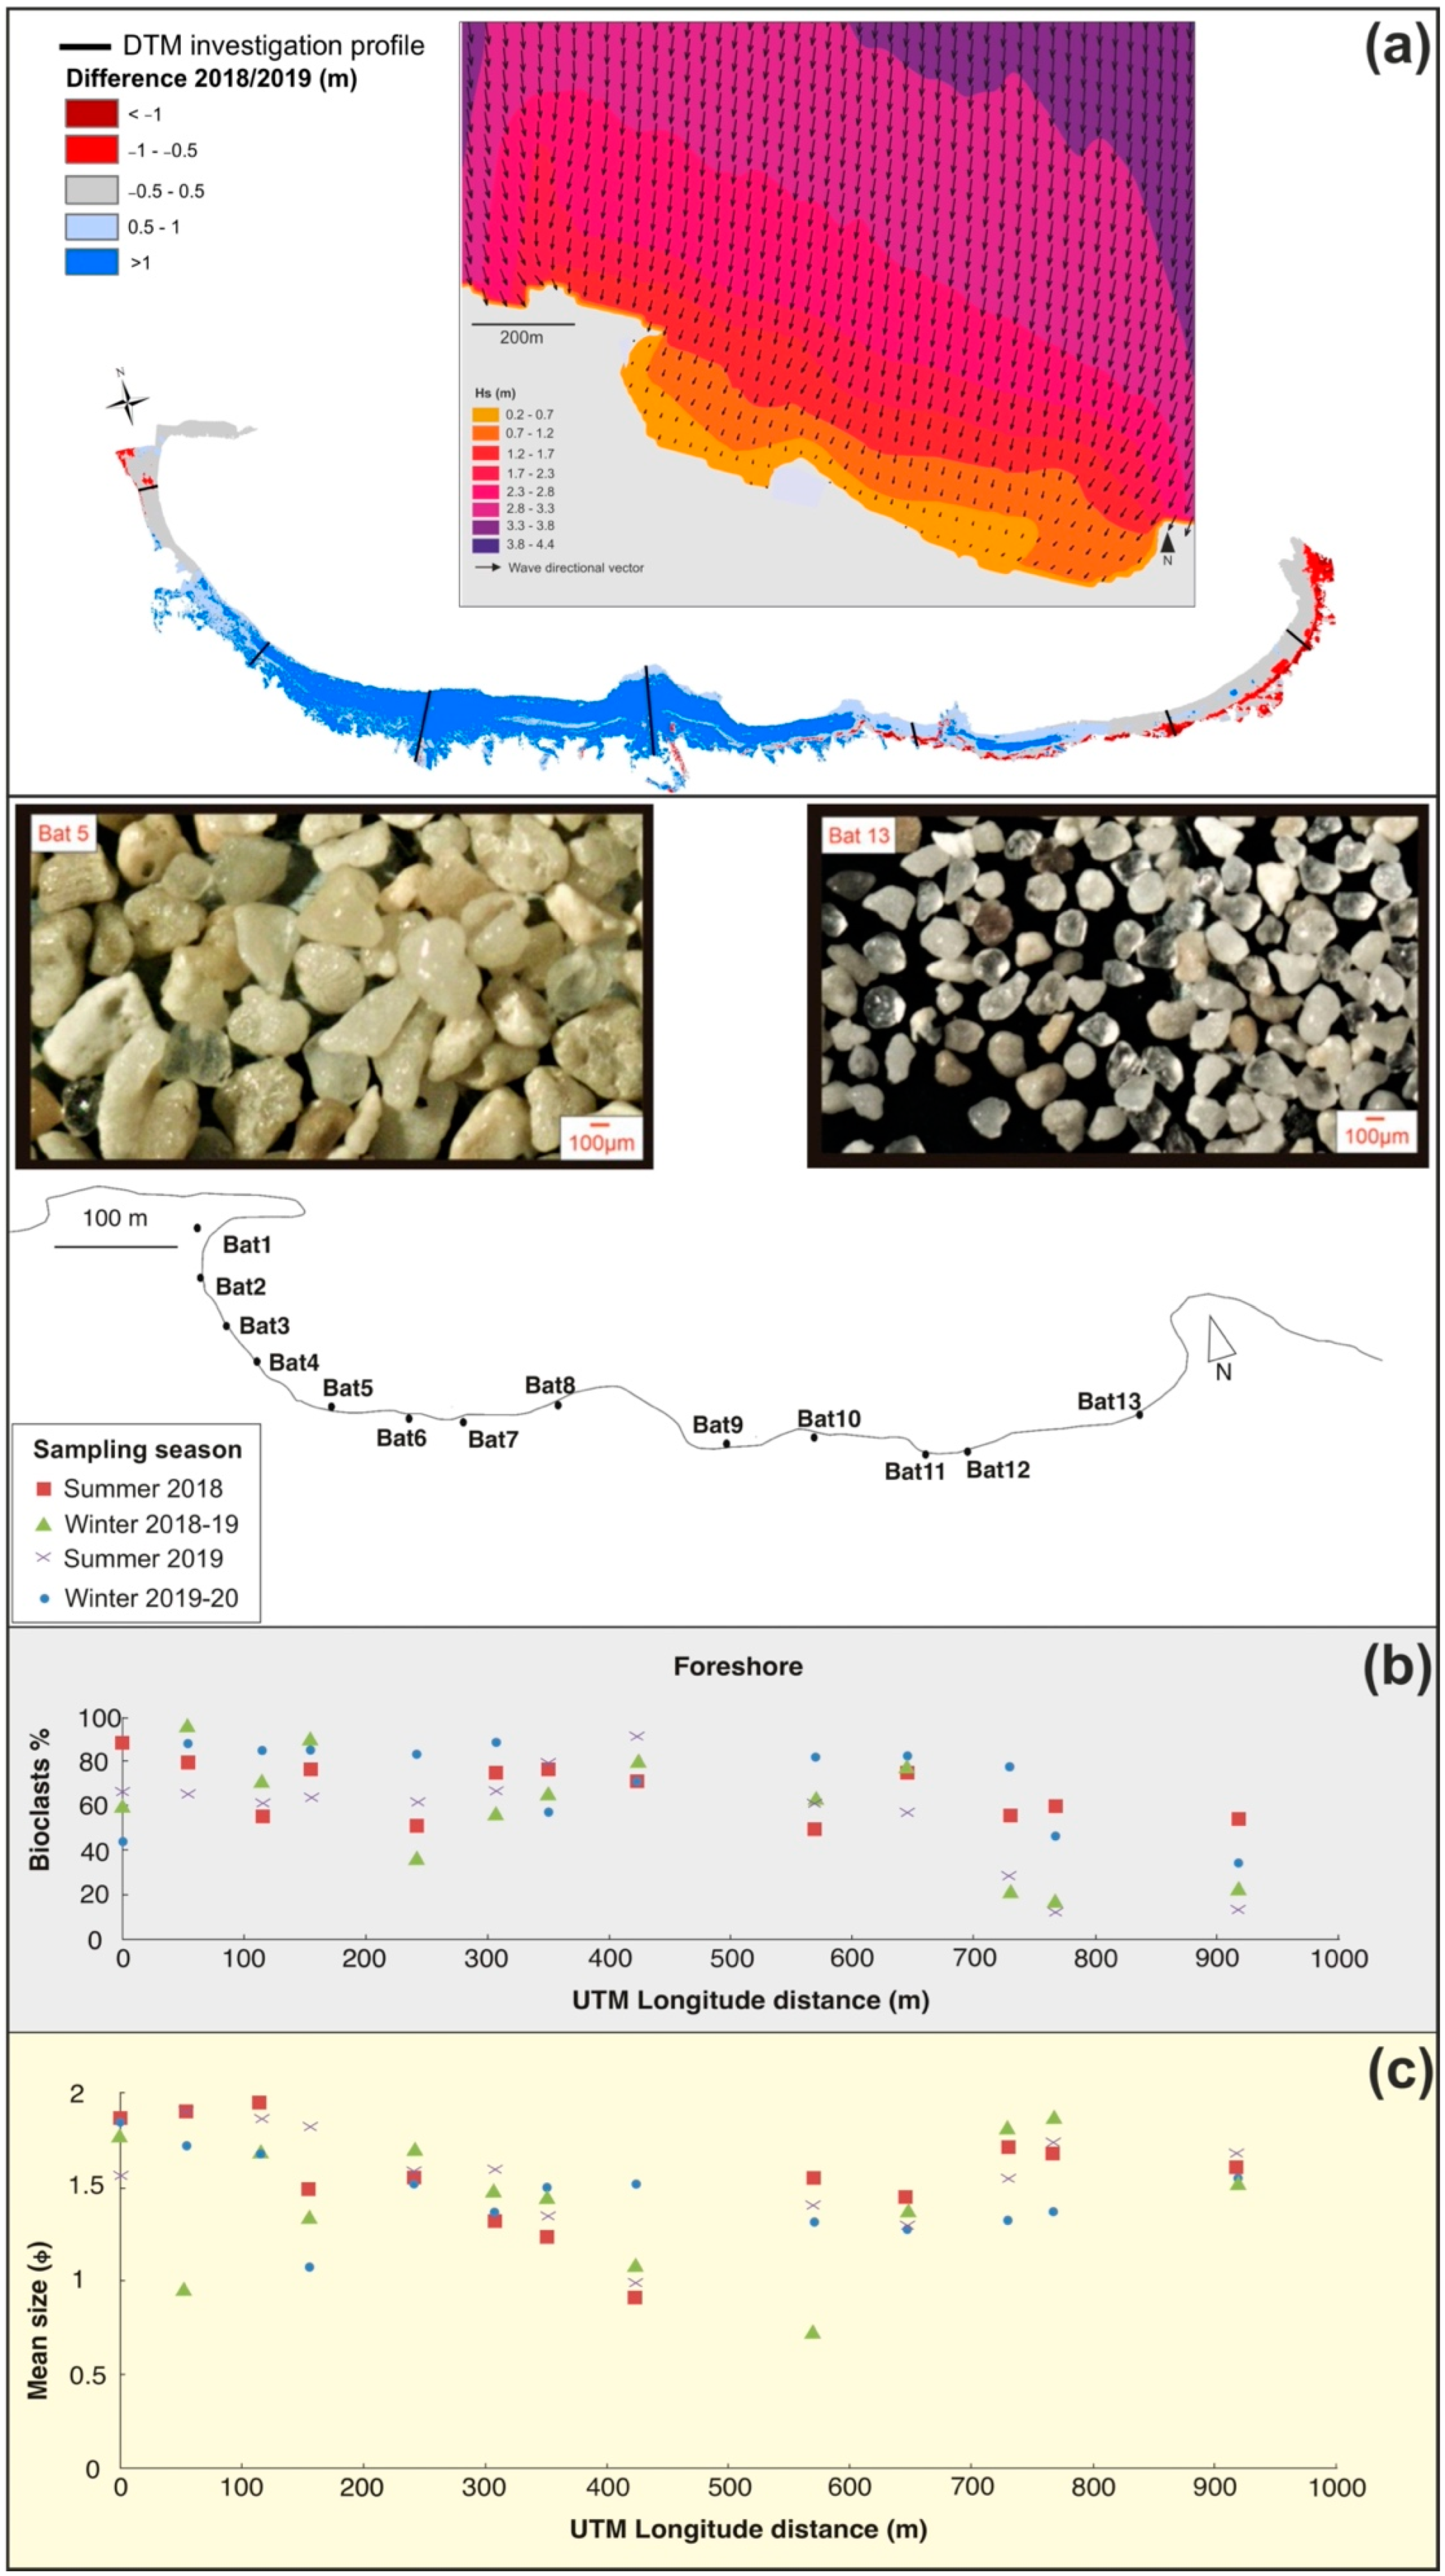
3.1.1. Sampling

Sampling procedures were carried out every six months along the backshore, foreshore, and shoreface sectors (example in Figure 3). Ground control points were used as collection points to compare the texture and the composition of the sand and to record the sampling depth variations over time. Samplings were carried out from the base of the foredune until 6 m depth of the shoreface (the local storm-wave base in the Adriatic and the Ionian Sea). Along the shoreline, the collecting points were spaced at around 100–200 m from each other, whereas shoreface samples were collected at each meter depth through diving techniques along two or three cross-shore transects. Around 300 gr of sand was collected between 0 and 2 cm depth down from the water/sediment interface by following the standard sampling procedure for marine sediments proposed by [97].

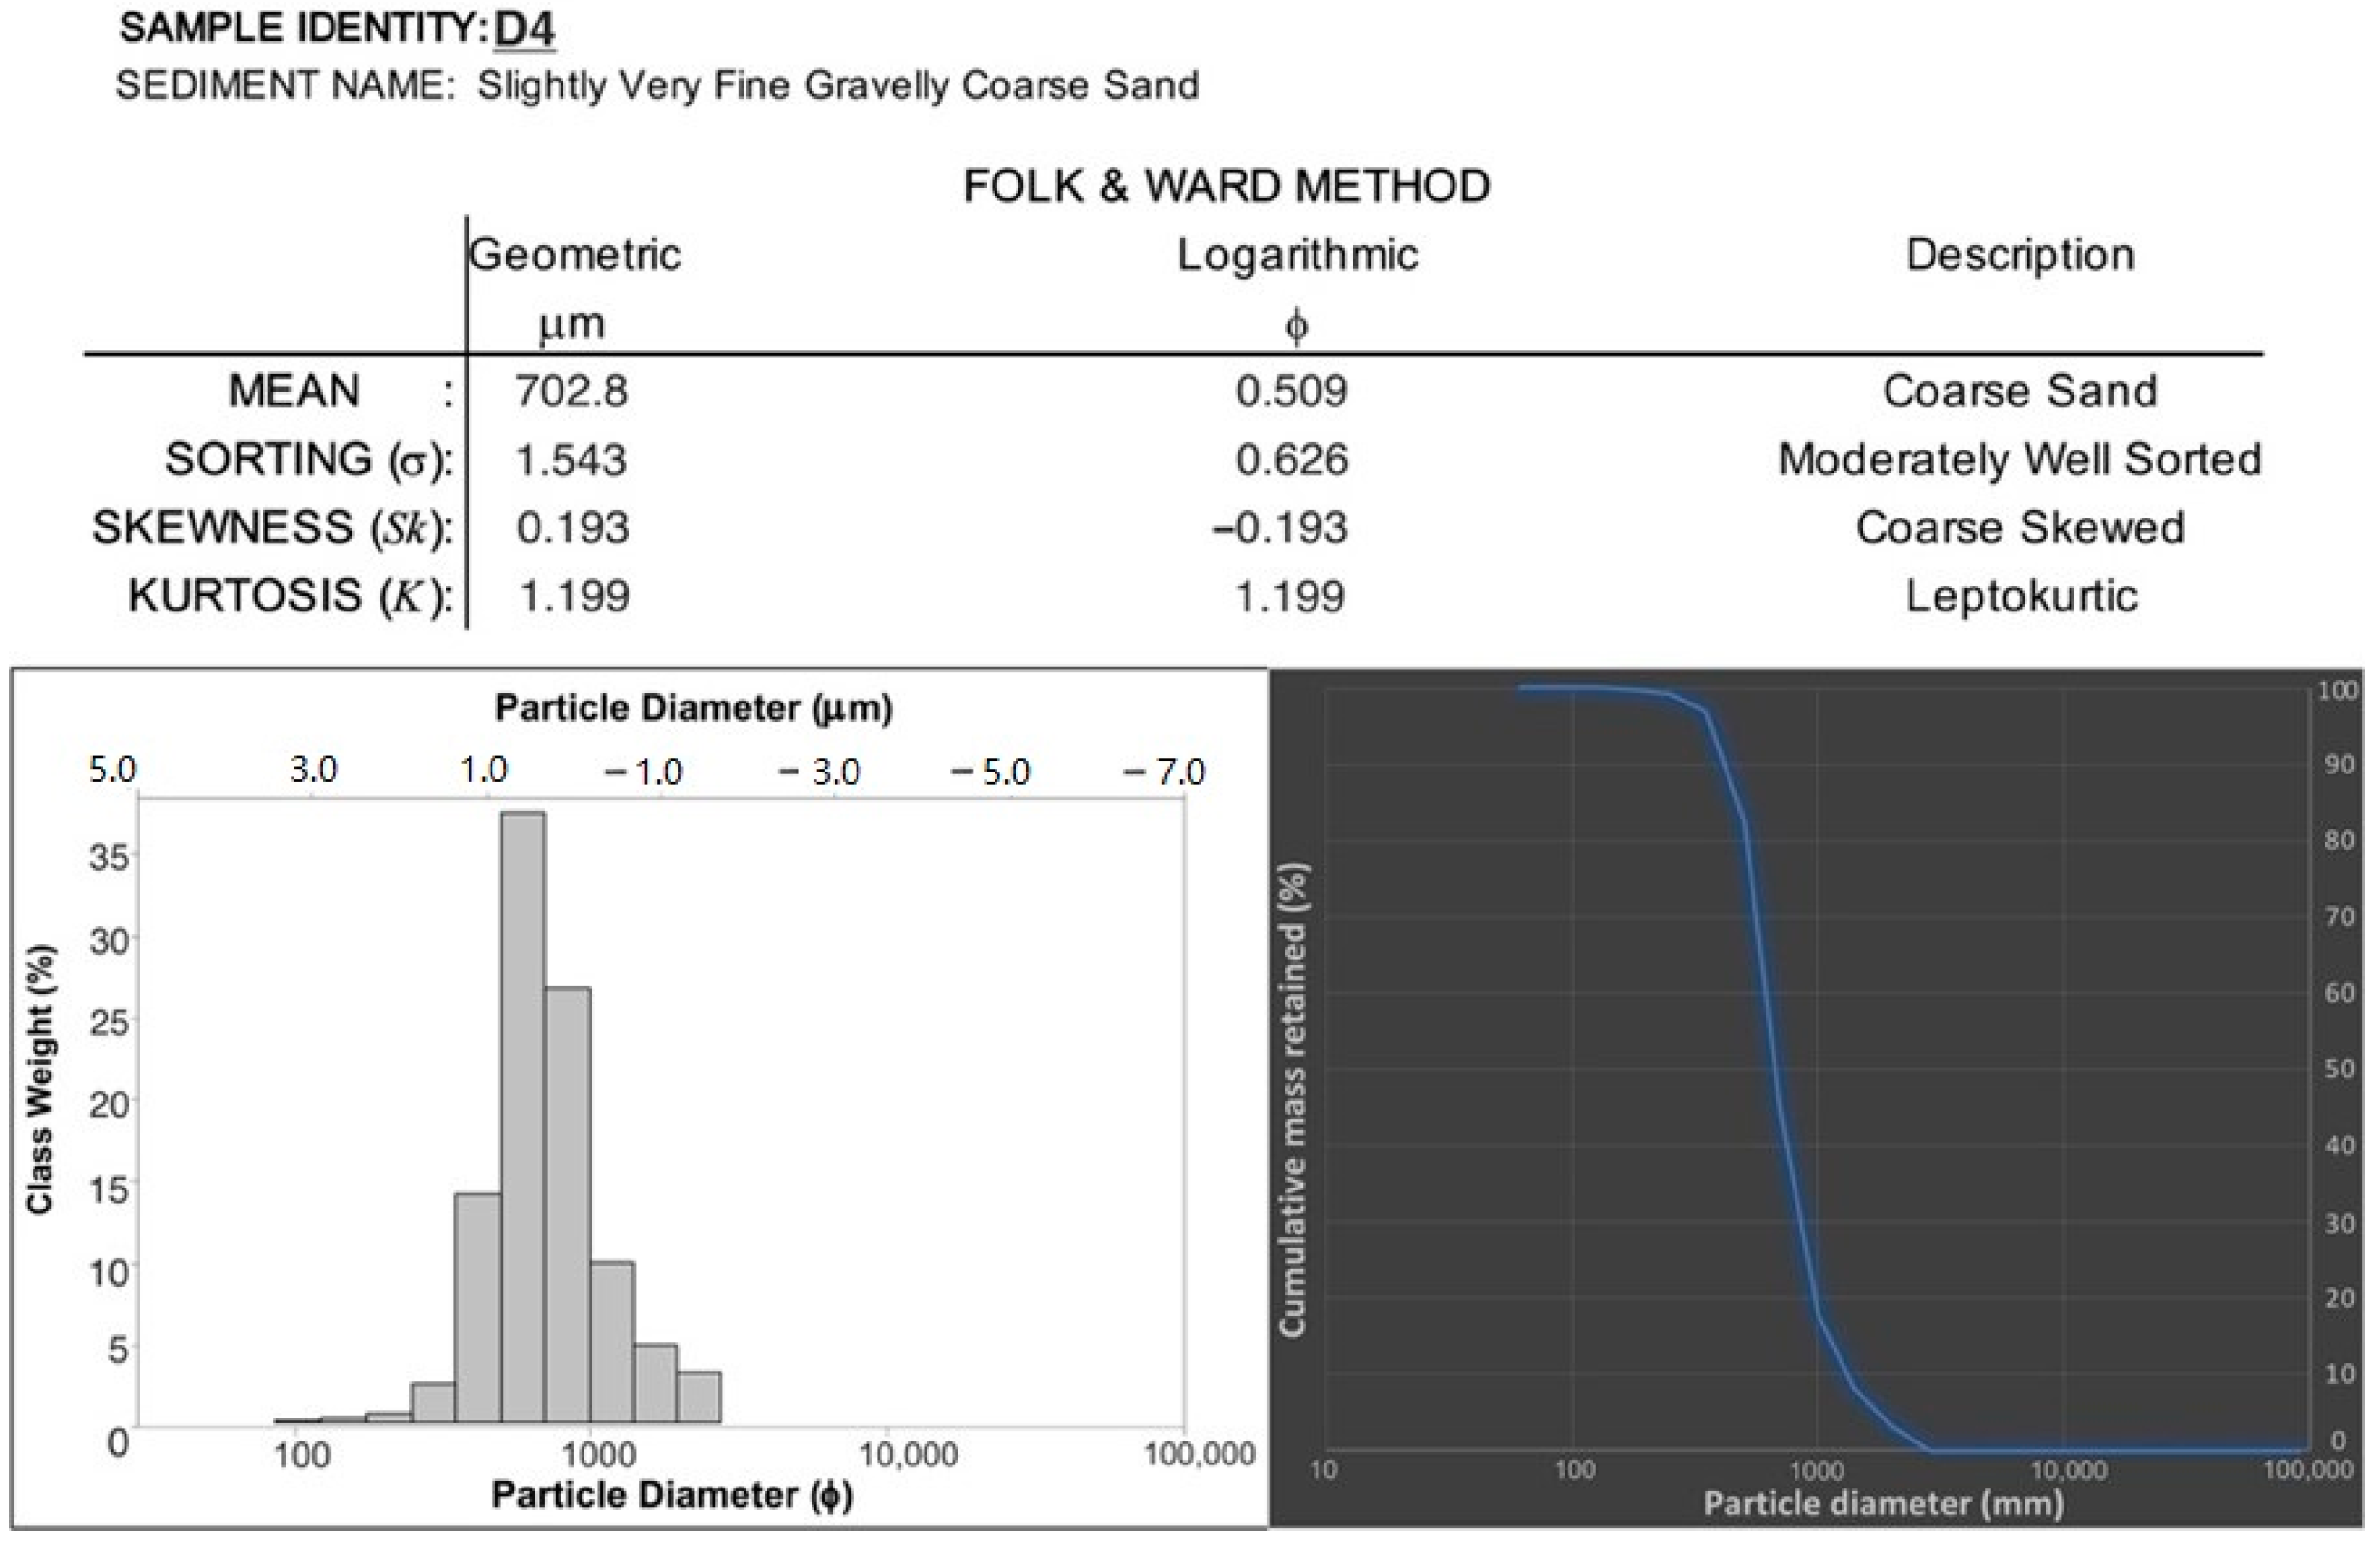
3.1.2. Grain-Size Analysis

The grain-size analyses were carried out by using the standard procedures provided by the American Society for Testing and Materials and the British Standard. For the sieving, a set of ASTM sieves with meshes of ½ phi from 2 mm to the minimum granulometric fraction (<0.125 mm) was used. The grain fractions with diameters less than 0.062 mm were excluded from the analysis because they were represented by less than 1–2%. In the laboratory, samples were dried in the oven at a temperature of 80° for 24 h and each individual sample was quartered and set in a sieve column. The sand sediments from 2.0 mm to 0.125 mm were sieved with the vibrating screen for a duration of 20 min. Subsequently, each held fraction was weighed and the results were processed with a specific application for Microsoft Excel (Gradistat© v8, Figure 4), which yield distribution cumulative curves, histograms, and statistically evaluate the main textural parameters: mean size (Mz), sorting (σ), skewness (Sk), and Kurtosis (KG) (Figure 4). Lastly, a seasonal comparison of the granulometric parameters was carried out in order to evaluate their temporal changes.

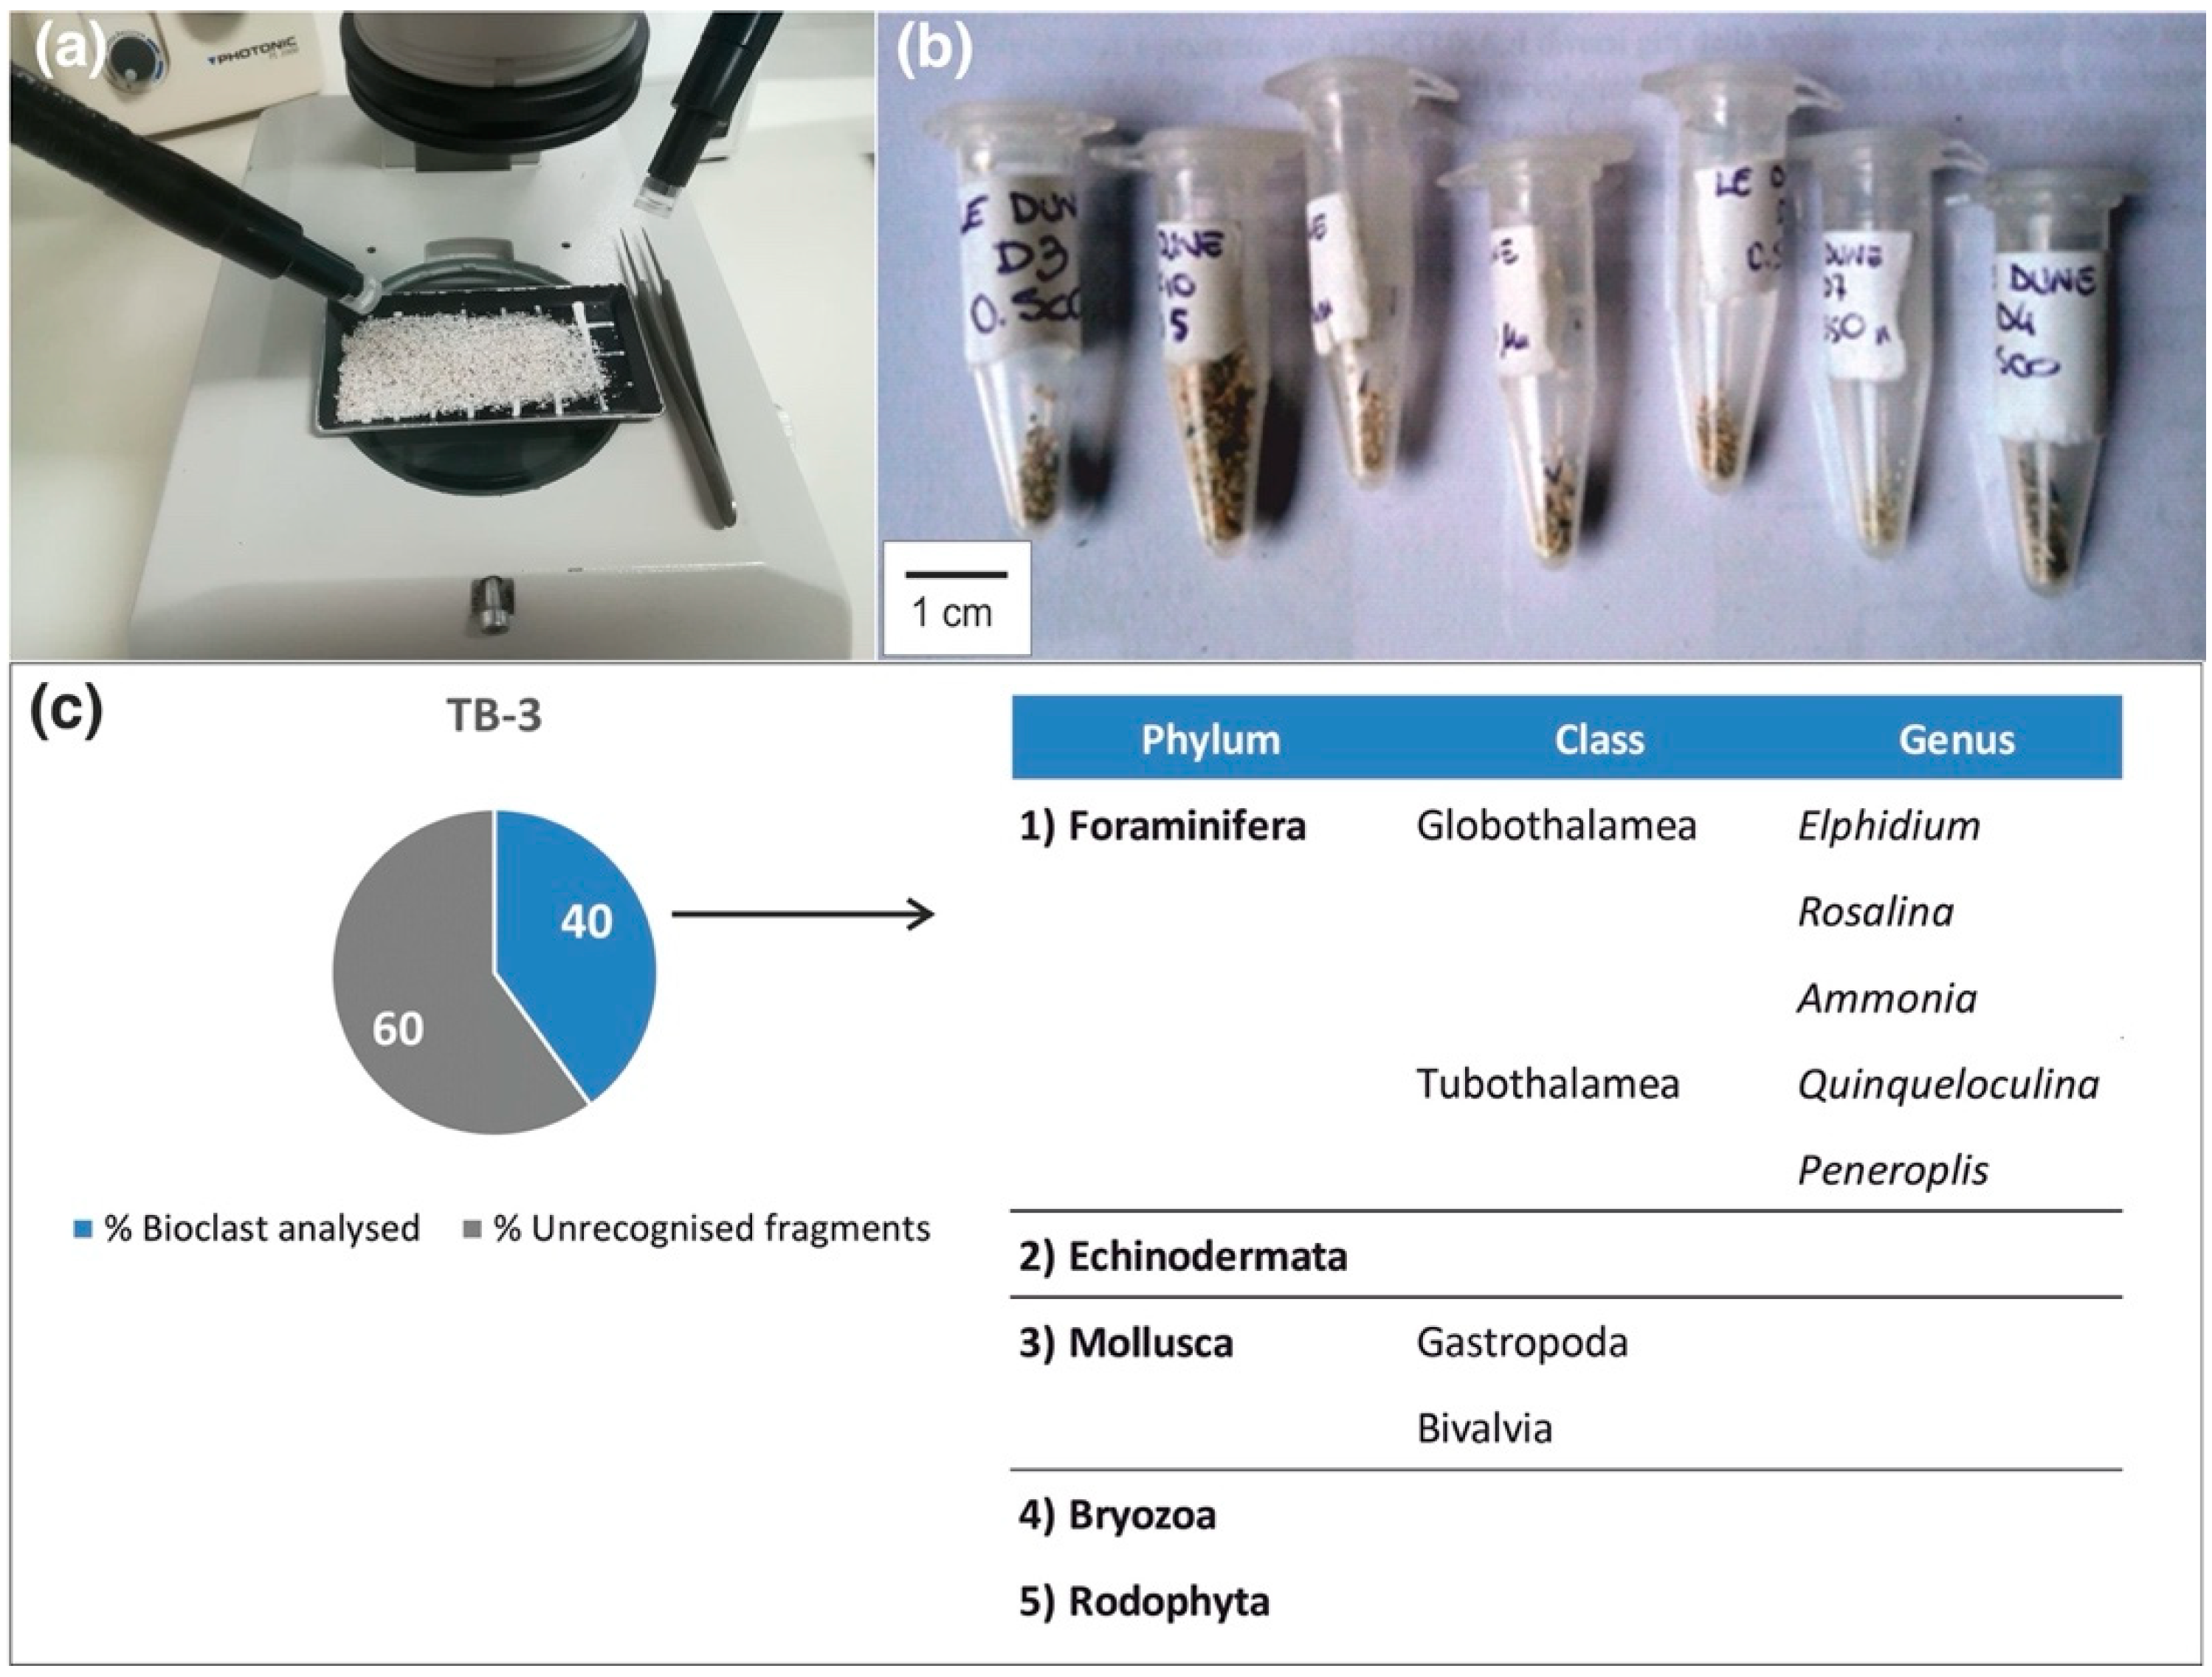
3.1.3. Compositional Analysis and Bioclasts Quantification/Recognition

The most frequent size class of the statistical distribution was investigated through a binocular optical microscope (Figure 5a). The percentages of the main constituents of sands were evaluated to obtain quantitative and qualitative information in terms of petrographic composition. Since the investigation was carried out on Apulian beach sands, which generally include carbonates (lithoclasts or bioclasts) and siliciclastic minerals, the sands were analyzed by considering the diagram proposed by [98,99]. This method provides the recognition of three main classes: CE carbonate extrabasinal (lithoclasts), CI carbonate intrabasinal (bioclasts), and NCE non-carbonate extrabasinal grains. In particular, the sediment fraction was spread on a rigid base divided into five fields (Figure 5b). Each field was analyzed in detail under the microscope (Figure 5c) and for each field, the particles belonging to the NCE, CE, and CI class were counted. Once the counting operation for each field was completed, the results obtained were summed and the percentage of each component was calculated and inserted in the final classification diagram (Figure 5d).
Furthermore, the whole shells and fragmented particles were isolated and analyzed by mean of a binocular optical microscope in more detail (example in Figure 6). In this context, a set of tweezers was used to manually separate the fragmented and unrecognizable fraction from the rest of the sample. The percentage was defined among three classes: 0–30%, 30–60%, 60–90%. The whole shells were analyzed and separated on the base of their Phylum to provide a first classification. The class and genus of shells were also evaluated in the case of foraminifers.
The main bioclast classification was carried out on the first sampling season. Successively, the bioclast evaluation was conducted by analyzing any differences in the Phylum already identified.
It is essential to specify that the recognition of the nature of sands was relatively simpler than expected. It recorded a maximum of 3% of grains with uncertain nature mainly related to the distinction between lithoclasts and bioclasts without a recognizable internal structure. The sandy particles with uncertain origin were not considered, while fossils were included in the class of lithoclasts as they were considered part of older deposits.

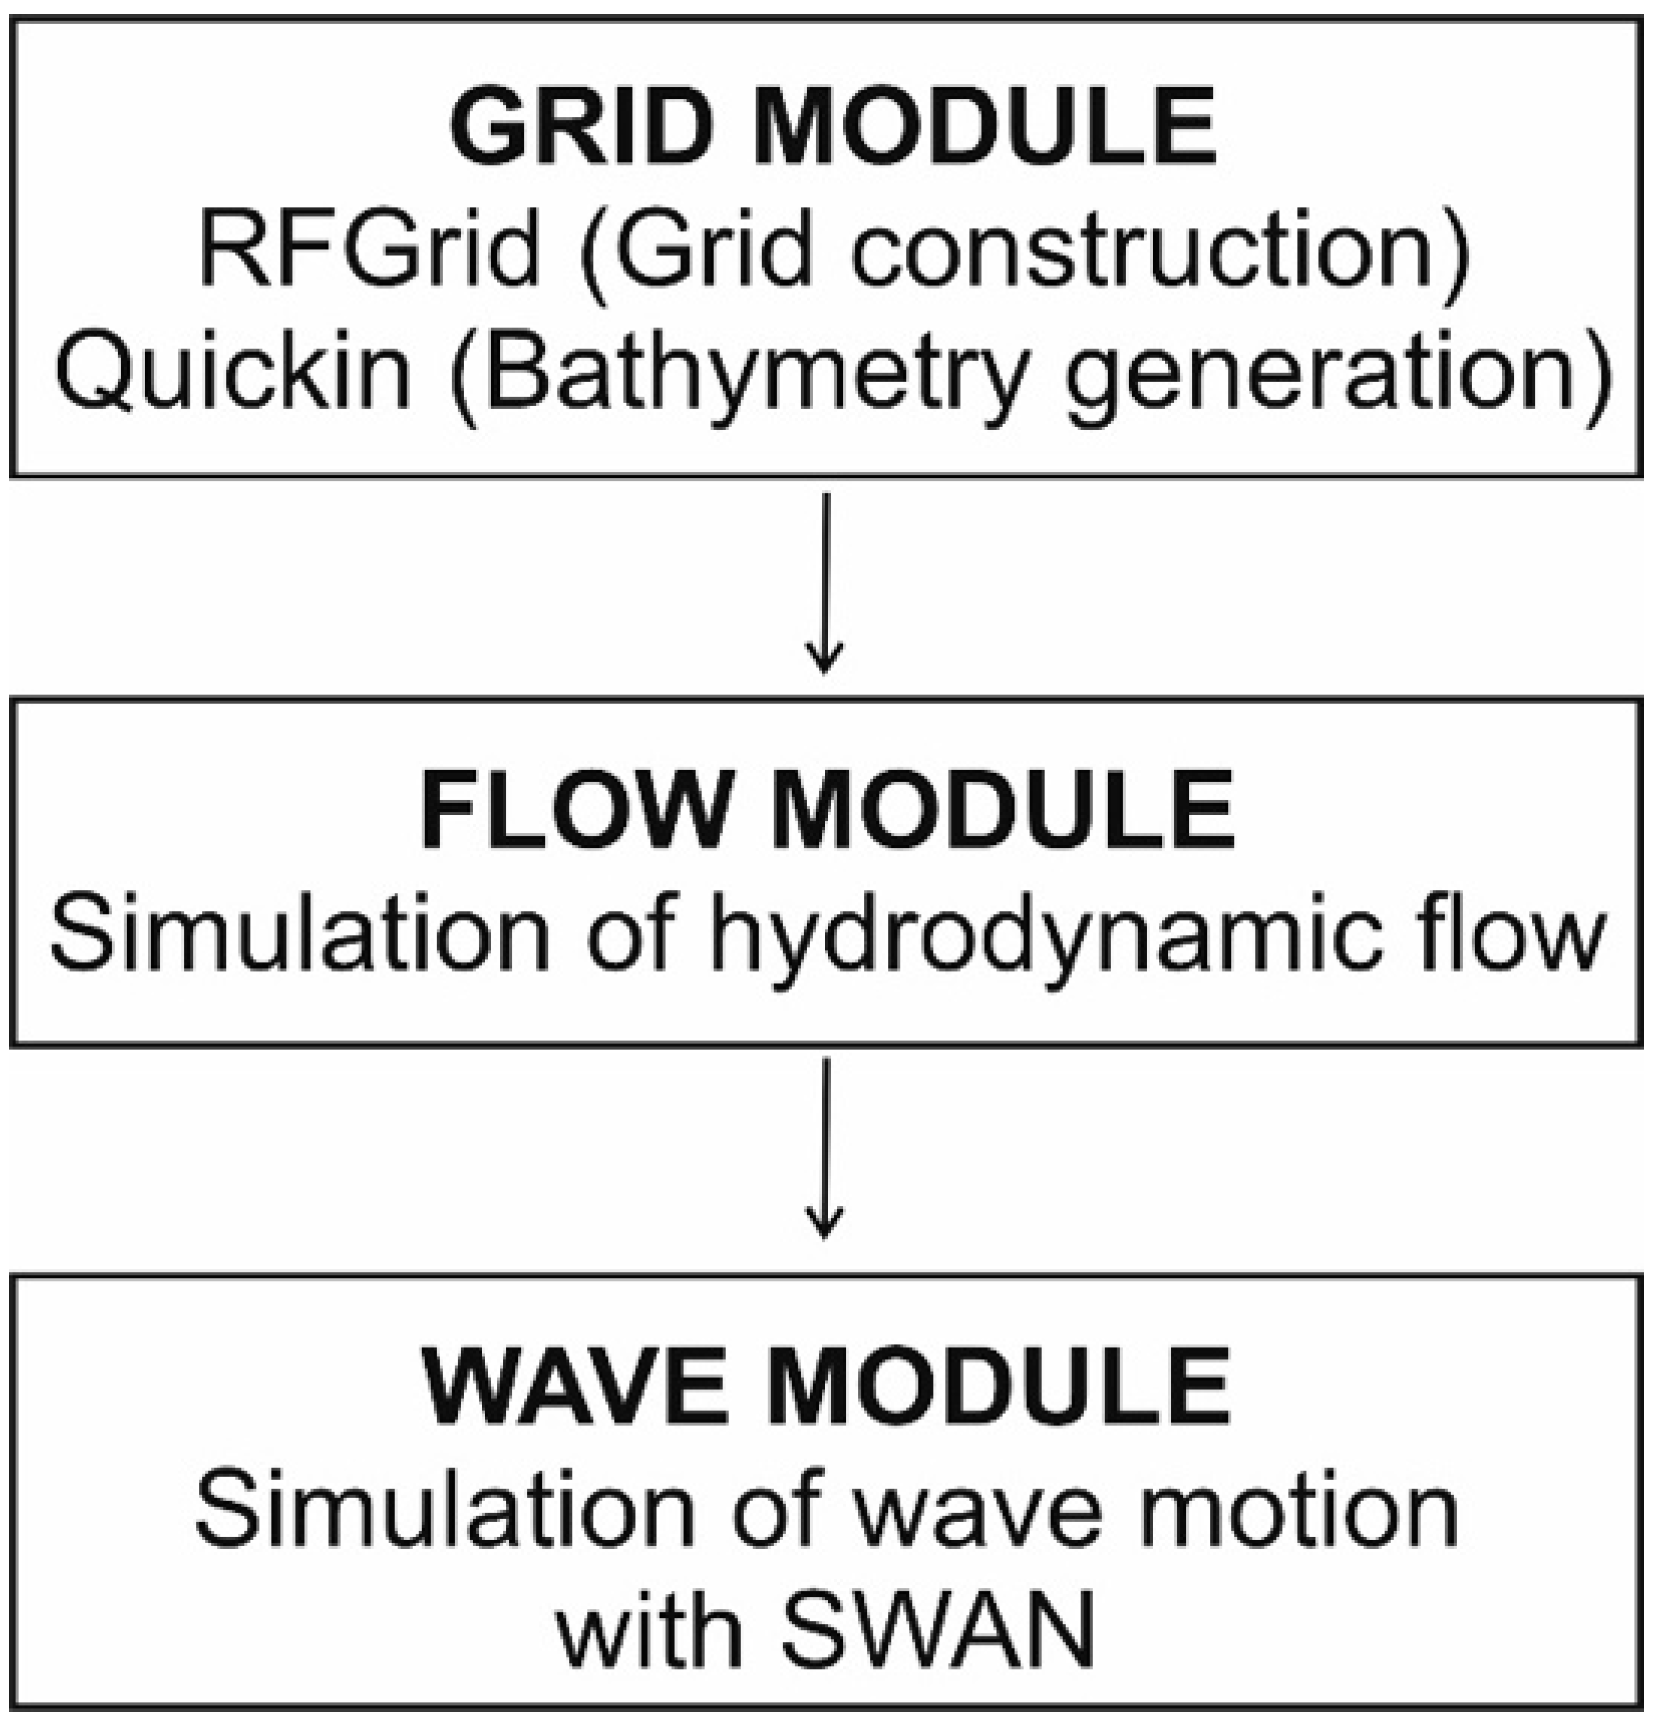
3.2. Wave Simulations and Hydrodynamic Model

Software Delft3D was used to analyze the correlation between sedimentological parameters and wave processes. As shown in Figure 7, GRID, FLOW, and WAVE modules were applied to calculate the hydrodynamic flow and to simulate the wave motion. In particular, coupled simulations were performed by means of Delft3D-WAVE with Delft3D-FLOW to incorporate wave-current interaction. Delft3DFLOW was used to assess the hydrodynamic flow, and Delft3D-WAVE was used to simulate the wave propagation, based on the SWAN (Simulating WAves Nearshore) model. The model was based on two main datasets: bathymetry and climatic information (waves and wind data). The bathymetric data were provided by the EMODnet website (https://portal.emodnet-bathymetry.eu/, accessed on 1 November 2022). The wave data were acquired from SIT Puglia website (http://cartografia.sit.puglia.it/download/PRC/Relazione%20Generale_allegato711.pdf, accessed on 30 October 2022) and from a wave buoy located in the Ionian Sea (Datawell Directional Waverider—Mk-III property of Autorità di Bacino Distrettuale dell’Appennino Meridionale, located at 40,40 N, 17,18 E). The bathymetric data were provided by the EMODnet website (https://portal.emodnet-bathymetry.eu/, accessed on 25 October 2022).

3.3. Topographic Surveys

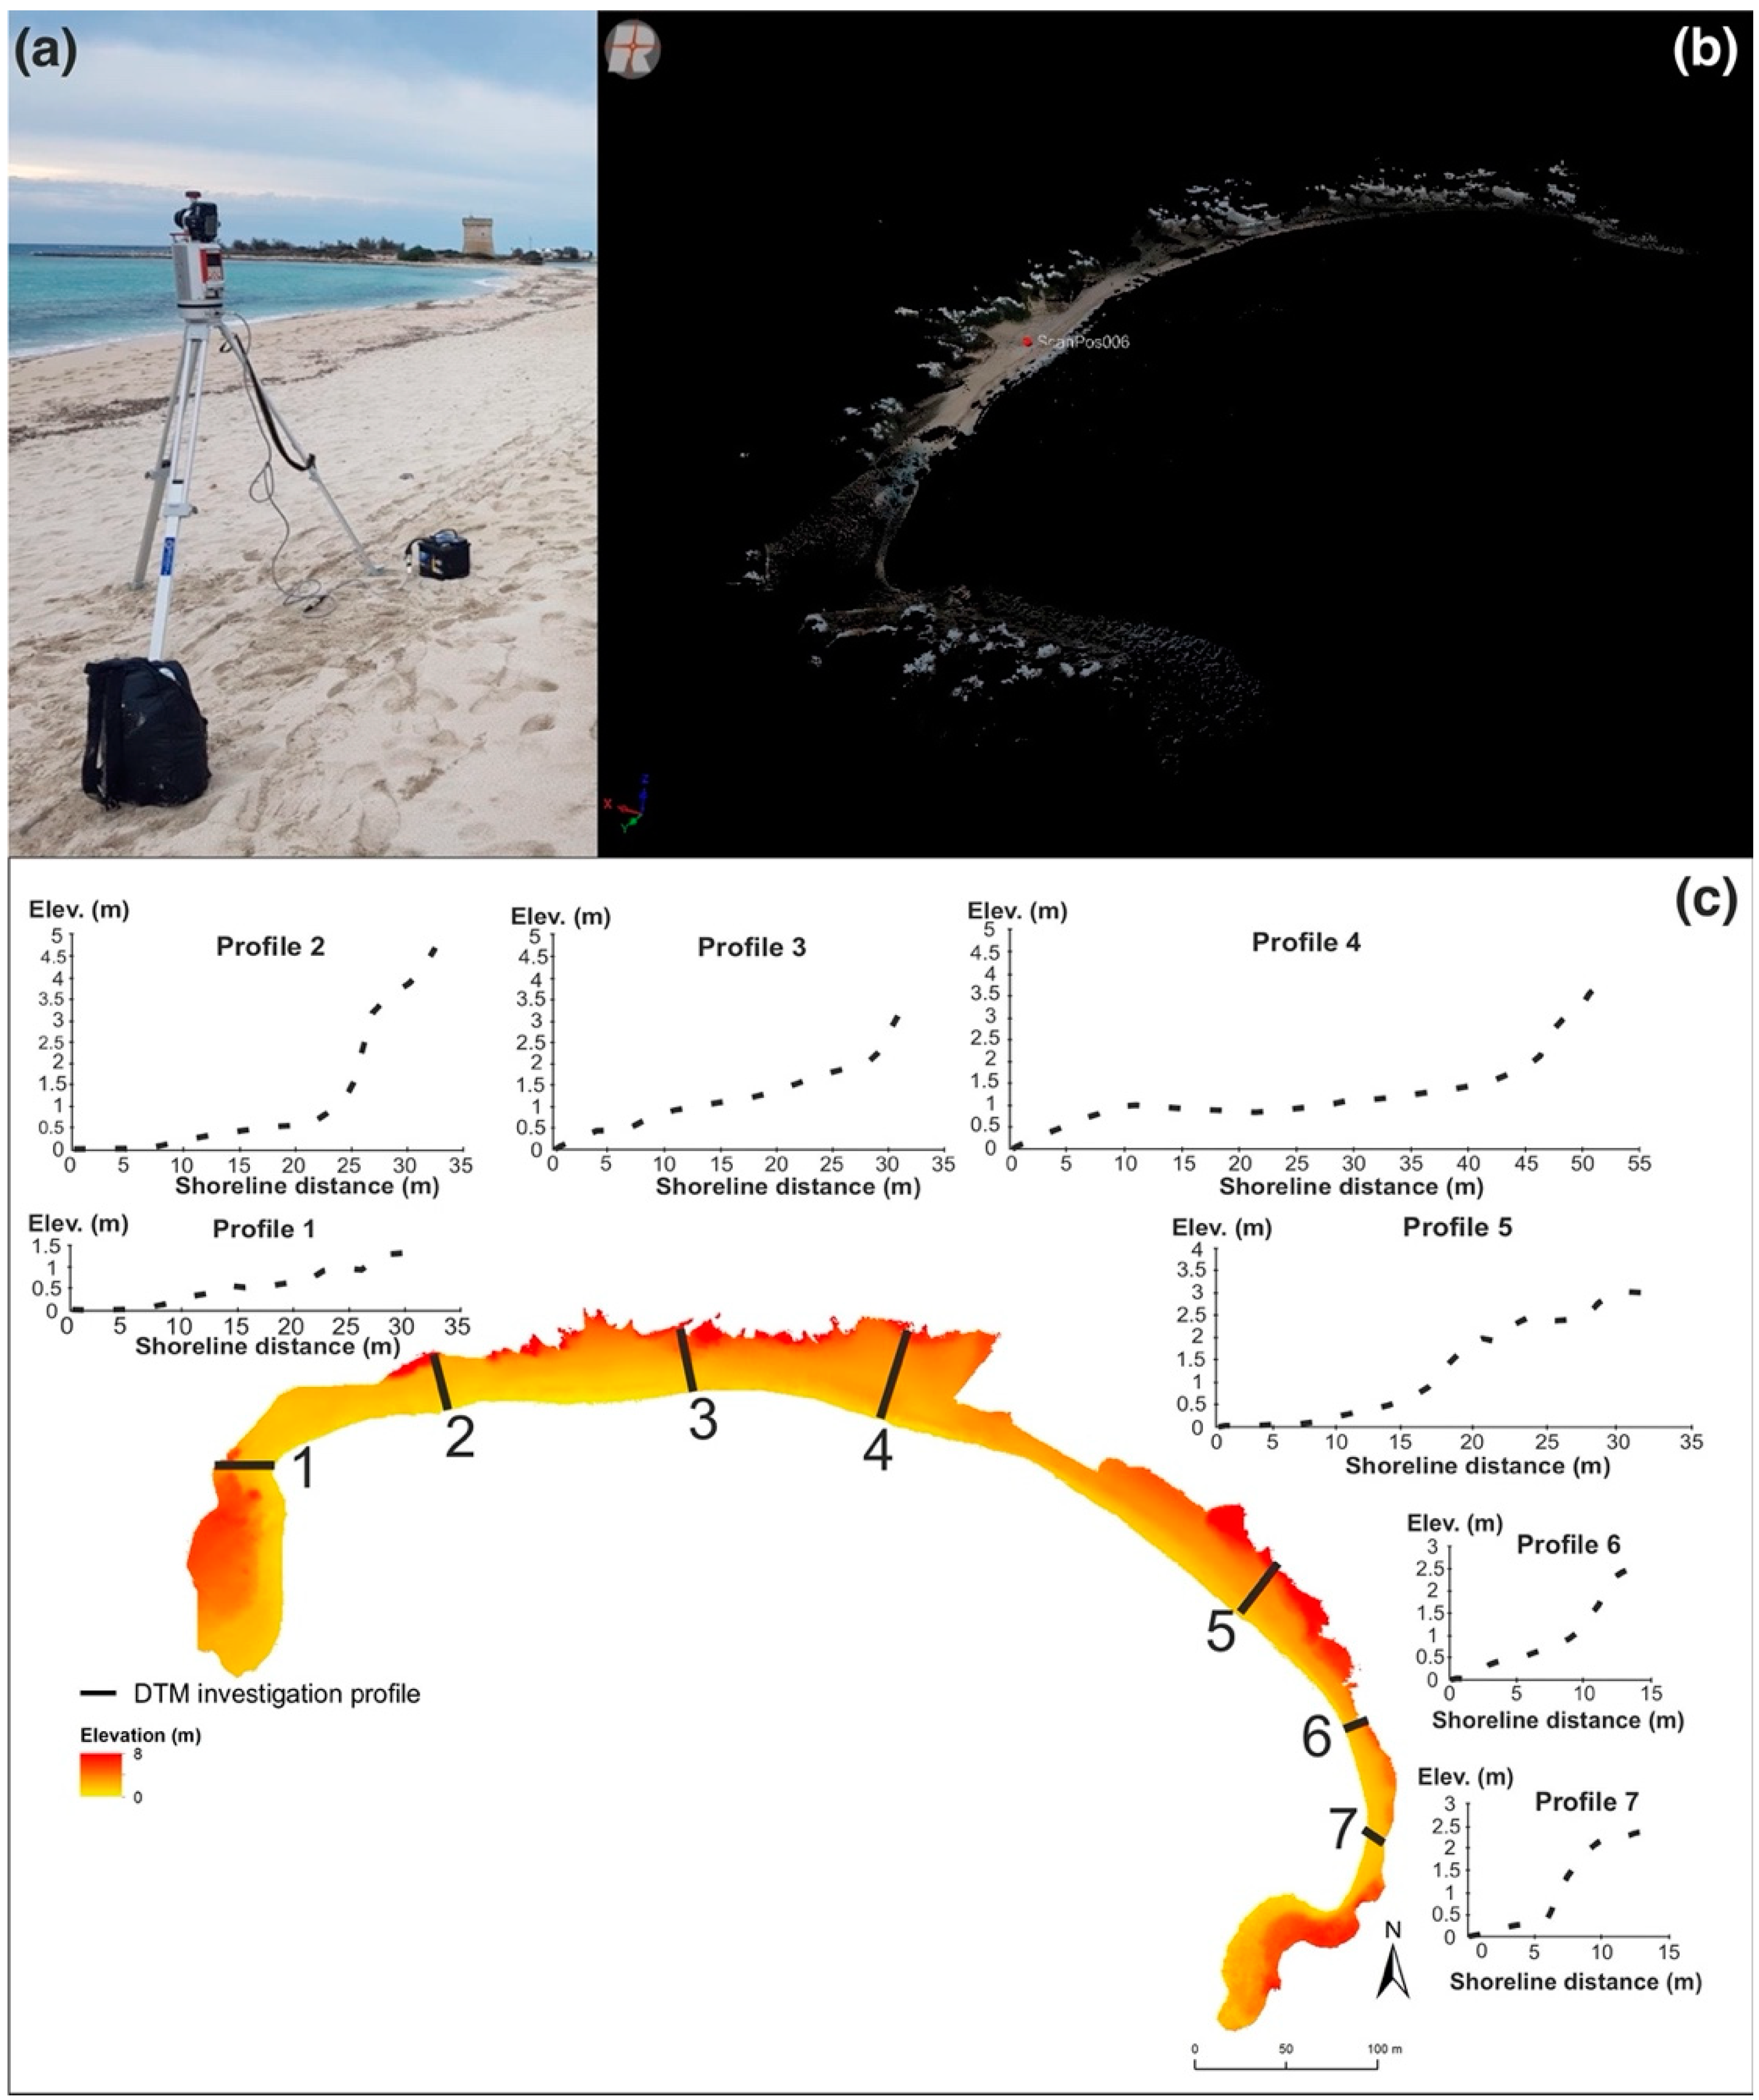
3.3.1. The Terrestrial Laser Scanner (TLS)

The topography of the emerged beach sector was investigated using a Terrestrial Laser Scanner (TLS) that allows constructing 3D elevation models and quantifying the morphological changes over time. In particular, the instrument acquires the spatial coordinates of many points by measuring the distance between the TLS and the object of study in order to build point clouds and successive three-dimensional elevation models. Two repeated survey campaigns were carried out during the summer of 2018 and the summer of 2019 by using a Riegl VZ-400 laser scanner, which is characterized by a theoretical range of 400 m. The instrumental accuracy is ±0.003 m for 50 m (example in Figure 8a).
Due to the length of both beaches, several scans were carried out from four stations with a distance of about 250 m from each other. The point clouds were processed through different stages: scans registration; multi-scan adjustment and georeferencing; 3D point cloud cleaning; triangulation (mesh) and Digital Terrestrial Model DTM creation with a size cell of 50 cm. The Riscan Pro and CloudCompare software were used for point cloud processing (Figure 8b), filtering, and rasterization, while the elevation correction and the comparison of the seasonal DTMs were carried out with ArcMap © 10.1 (Figure 8c).
As the sampling procedure, the TLS acquisition was carried out every six months to detect the main morphological changes in the emerged sectors of the beach.

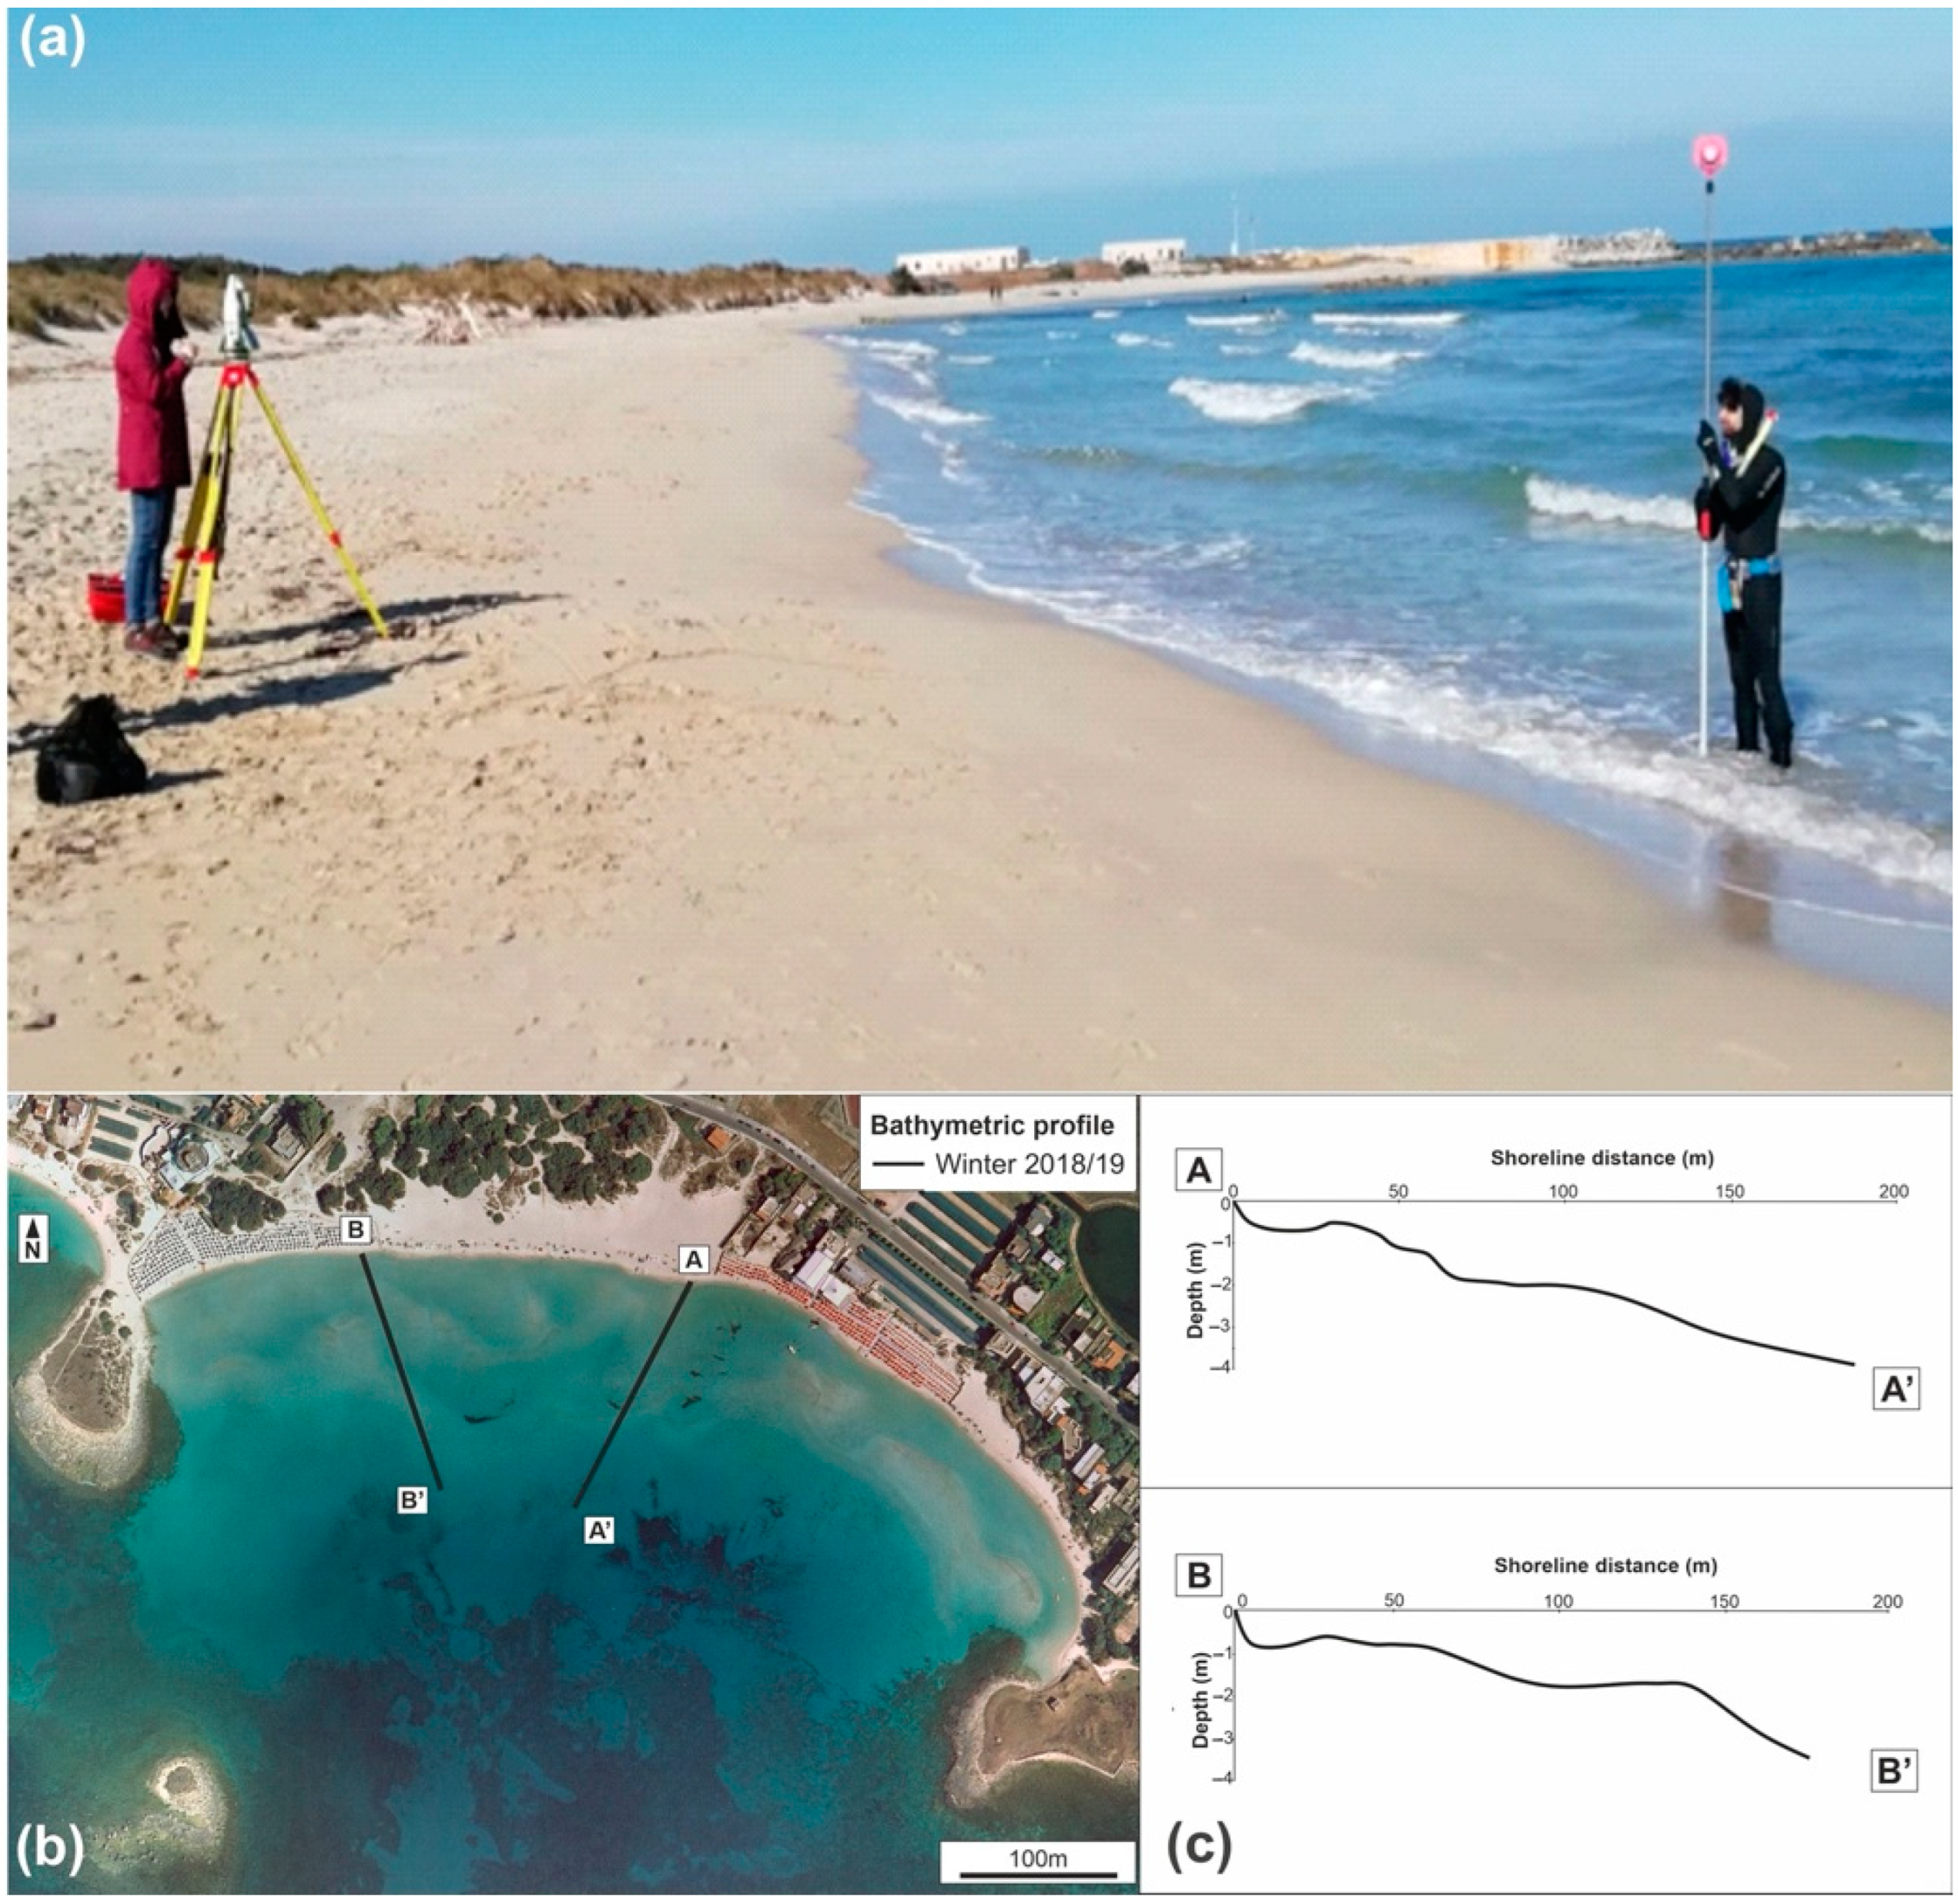
3.3.2. The Optical Total Station (OTS)

With regards to the shoreface investigation, two profile surveys were performed using the Optical Total Station (OTS) Leica TS15 to collect seasonal bathymetric information. The OTS is composed of an electromagnetic distance measure instrument and electronic theodolite that is also integrated with a computer storage system (Figure 9). The instrument allows the measuring of horizontal and vertical angles as well as the sloping distance between the object and the instrument.
During the seasonal field surveys, the measurements were performed along two cross-shore transects in georeferenced points following the direction of the sampling profiles. About 20 bathymetric points were measured for each transect from the shoreline to a 4 m depth on both beaches.

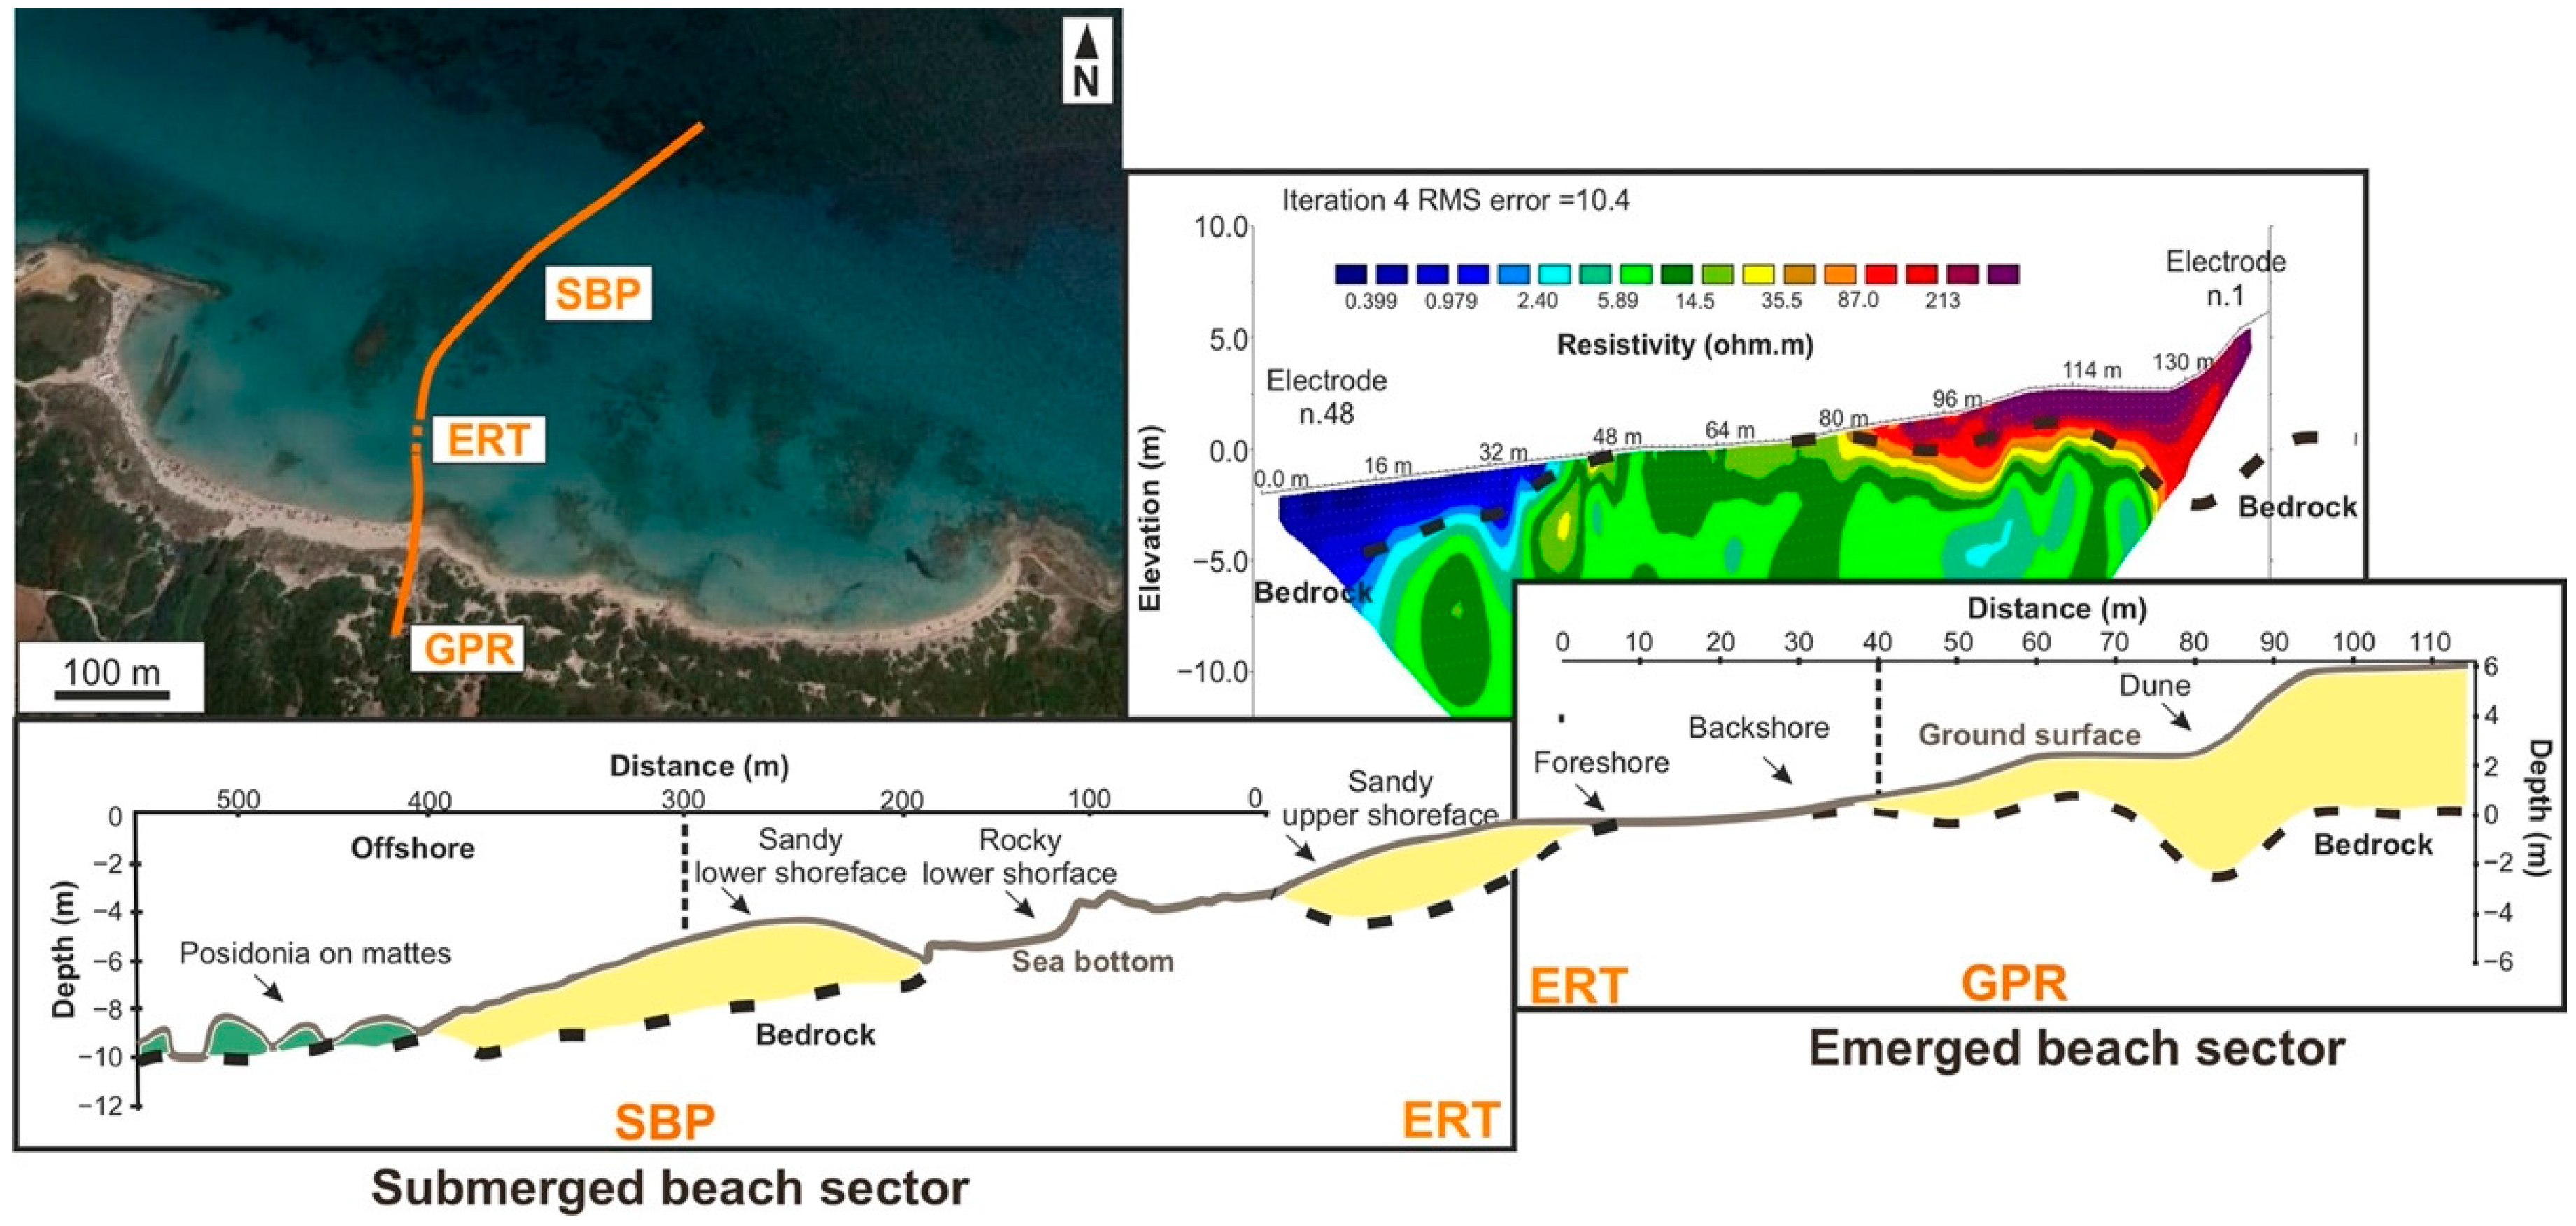
3.4. Geophysical Investigation

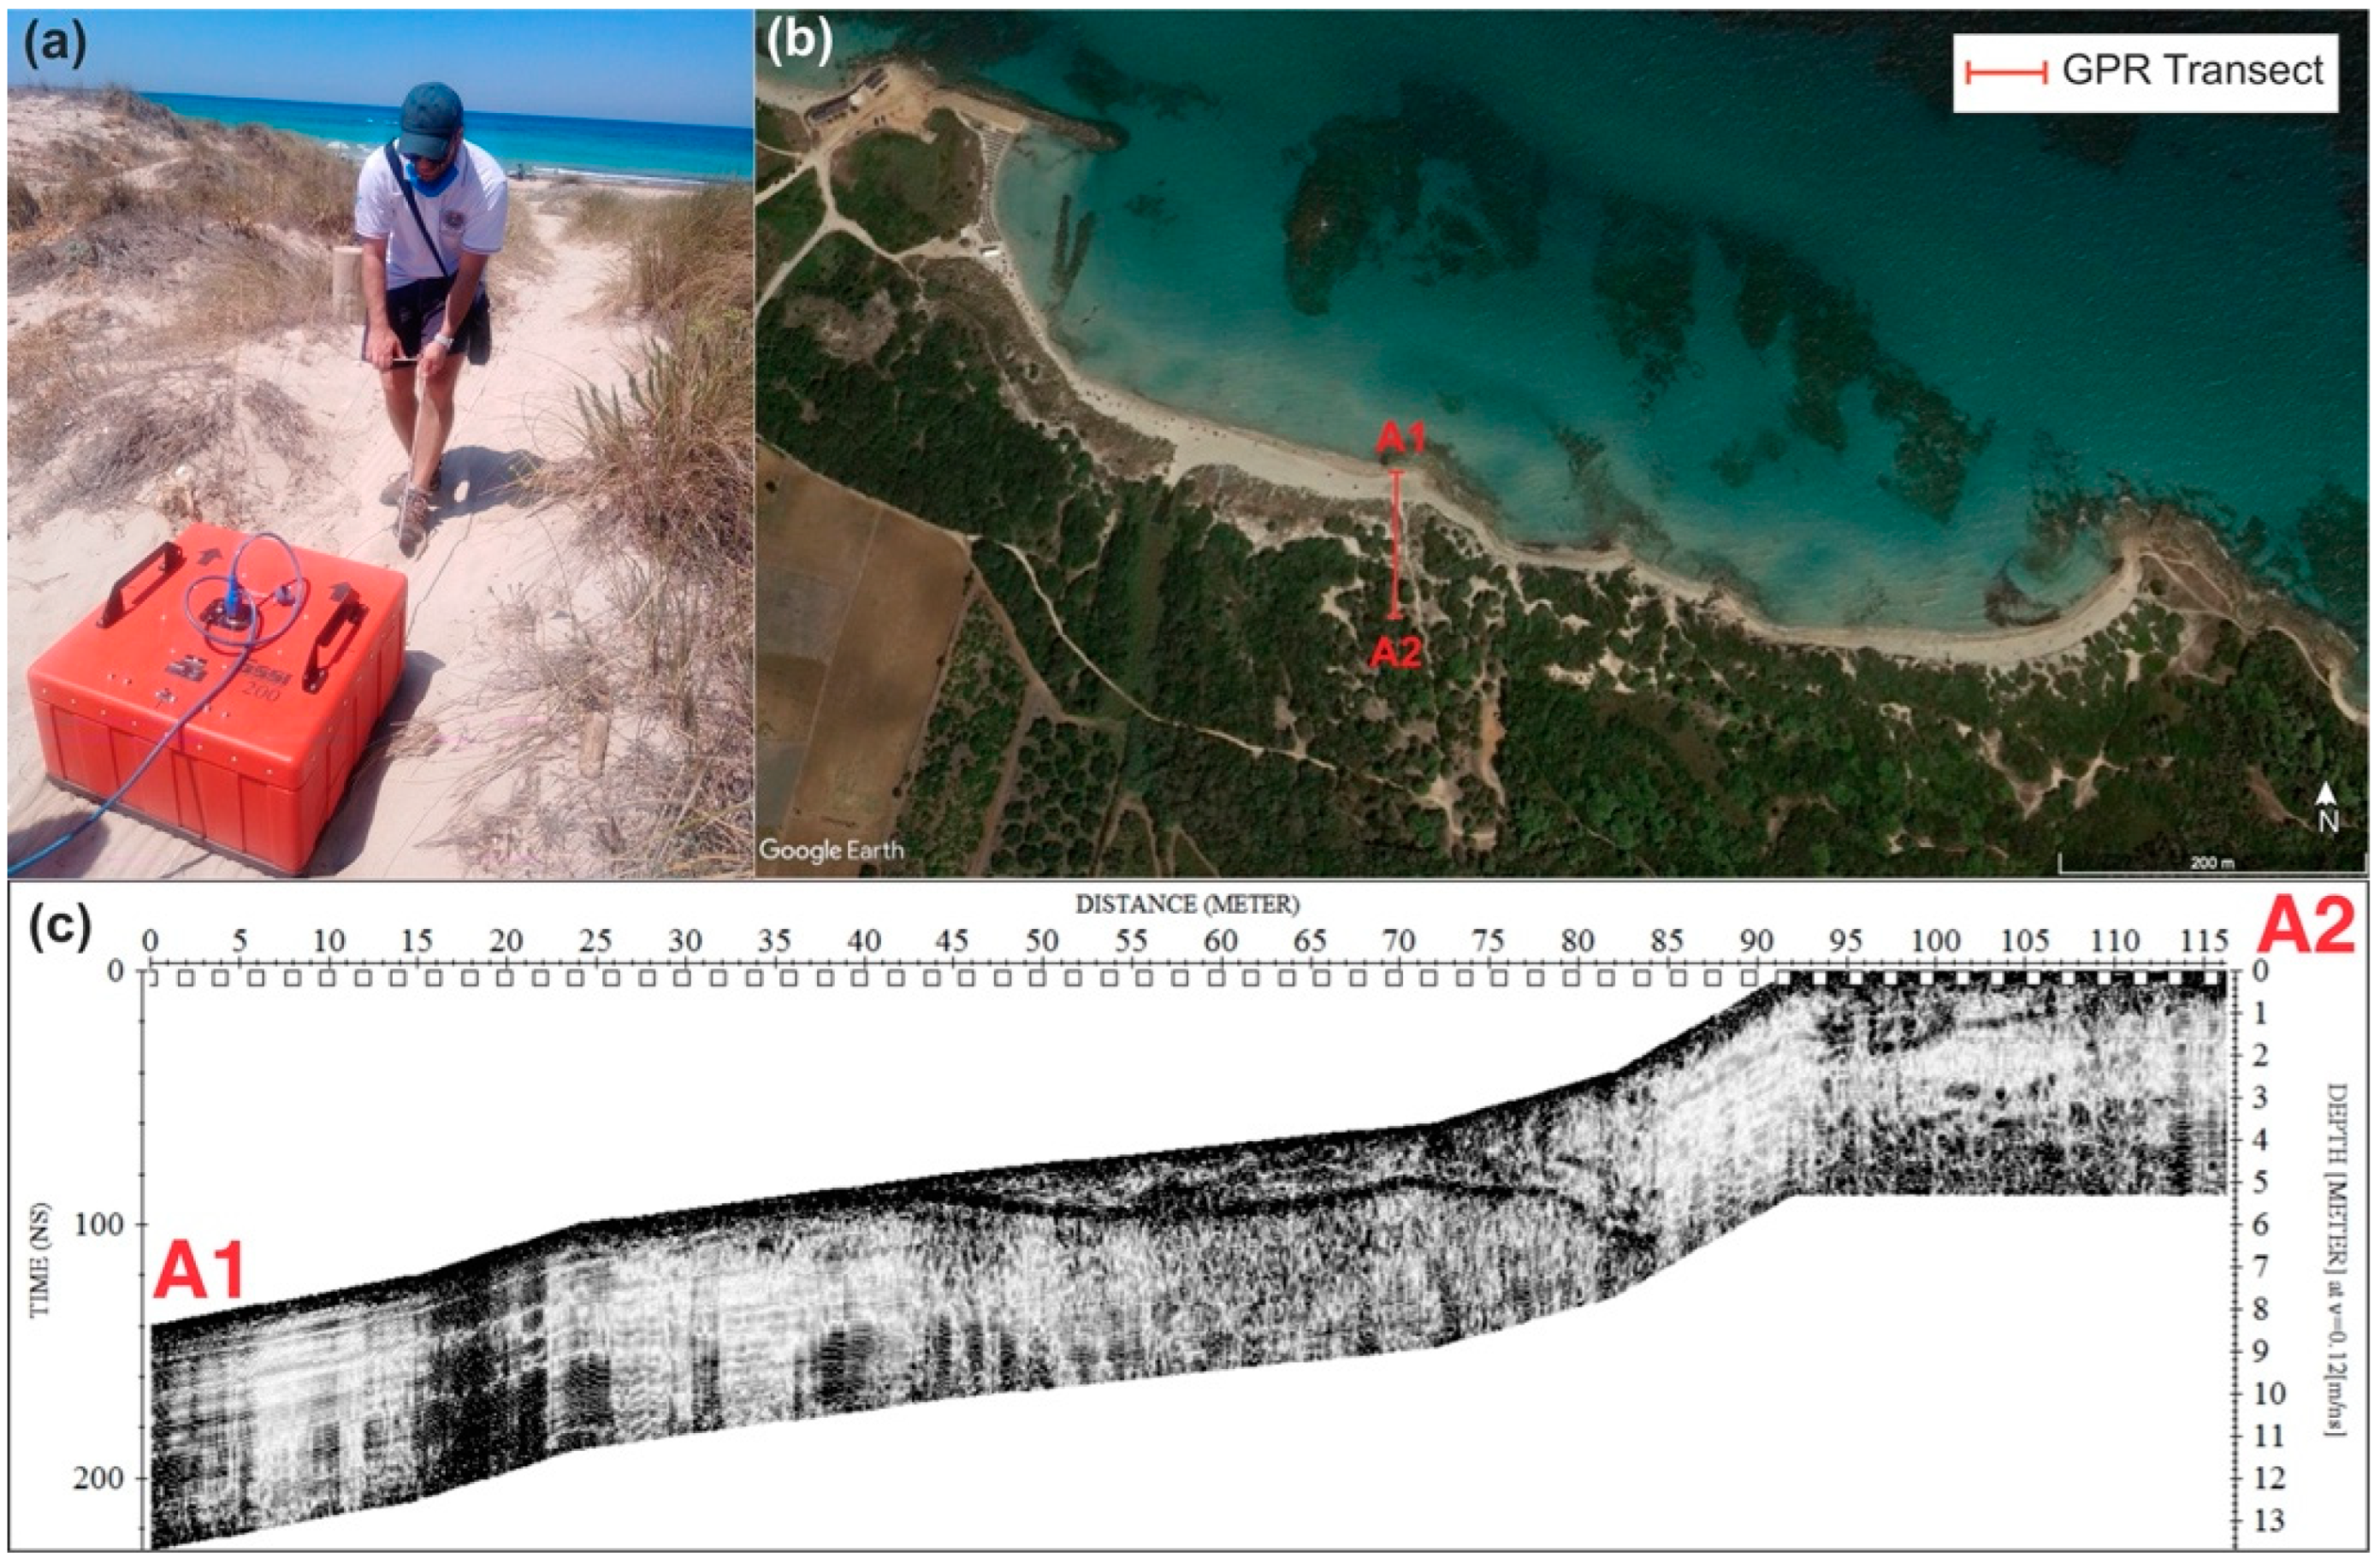
3.4.1. Ground Penetrating Radar (GPR)

The GPR investigation was applied for evaluating the sediment thicknesses in the emerged beach sector. The choice of this technique depends on the dynamic nature of this sub-environment that constantly changes with the amount of available material for transport and sedimentation. Generally, these variations are recorded within the sand deposits and particularly in the dune environment, whose stratigraphic horizons can be explored with the GPR technique. The instrument operation is based on the input of high frequency electromagnetic pulses deriving from an antenna, which is placed in contact with the surface to be investigated. The depth of the investigation depends on the frequency used and therefore on the type of antenna. As the signal frequency increases, there is a growth in data resolution but a decreasing in the investigation depth.
A survey campaign through a 200 Mhz antenna was carried out at Torre Guaceto and Le Dune beach (Figure 10a). The choice of this frequency depended on some tests carried out previously with 400 and 40 Mhz in order to detect the most significant radar stratigraphy section (Figure 10c). The data acquisition was performed along a cross-shore transect from the swash zone to the dune environment (Figure 10b).
With regards to the data processing, the Reflexw software was used to analyze and elaborate the 2D radar stratigraphic sections.

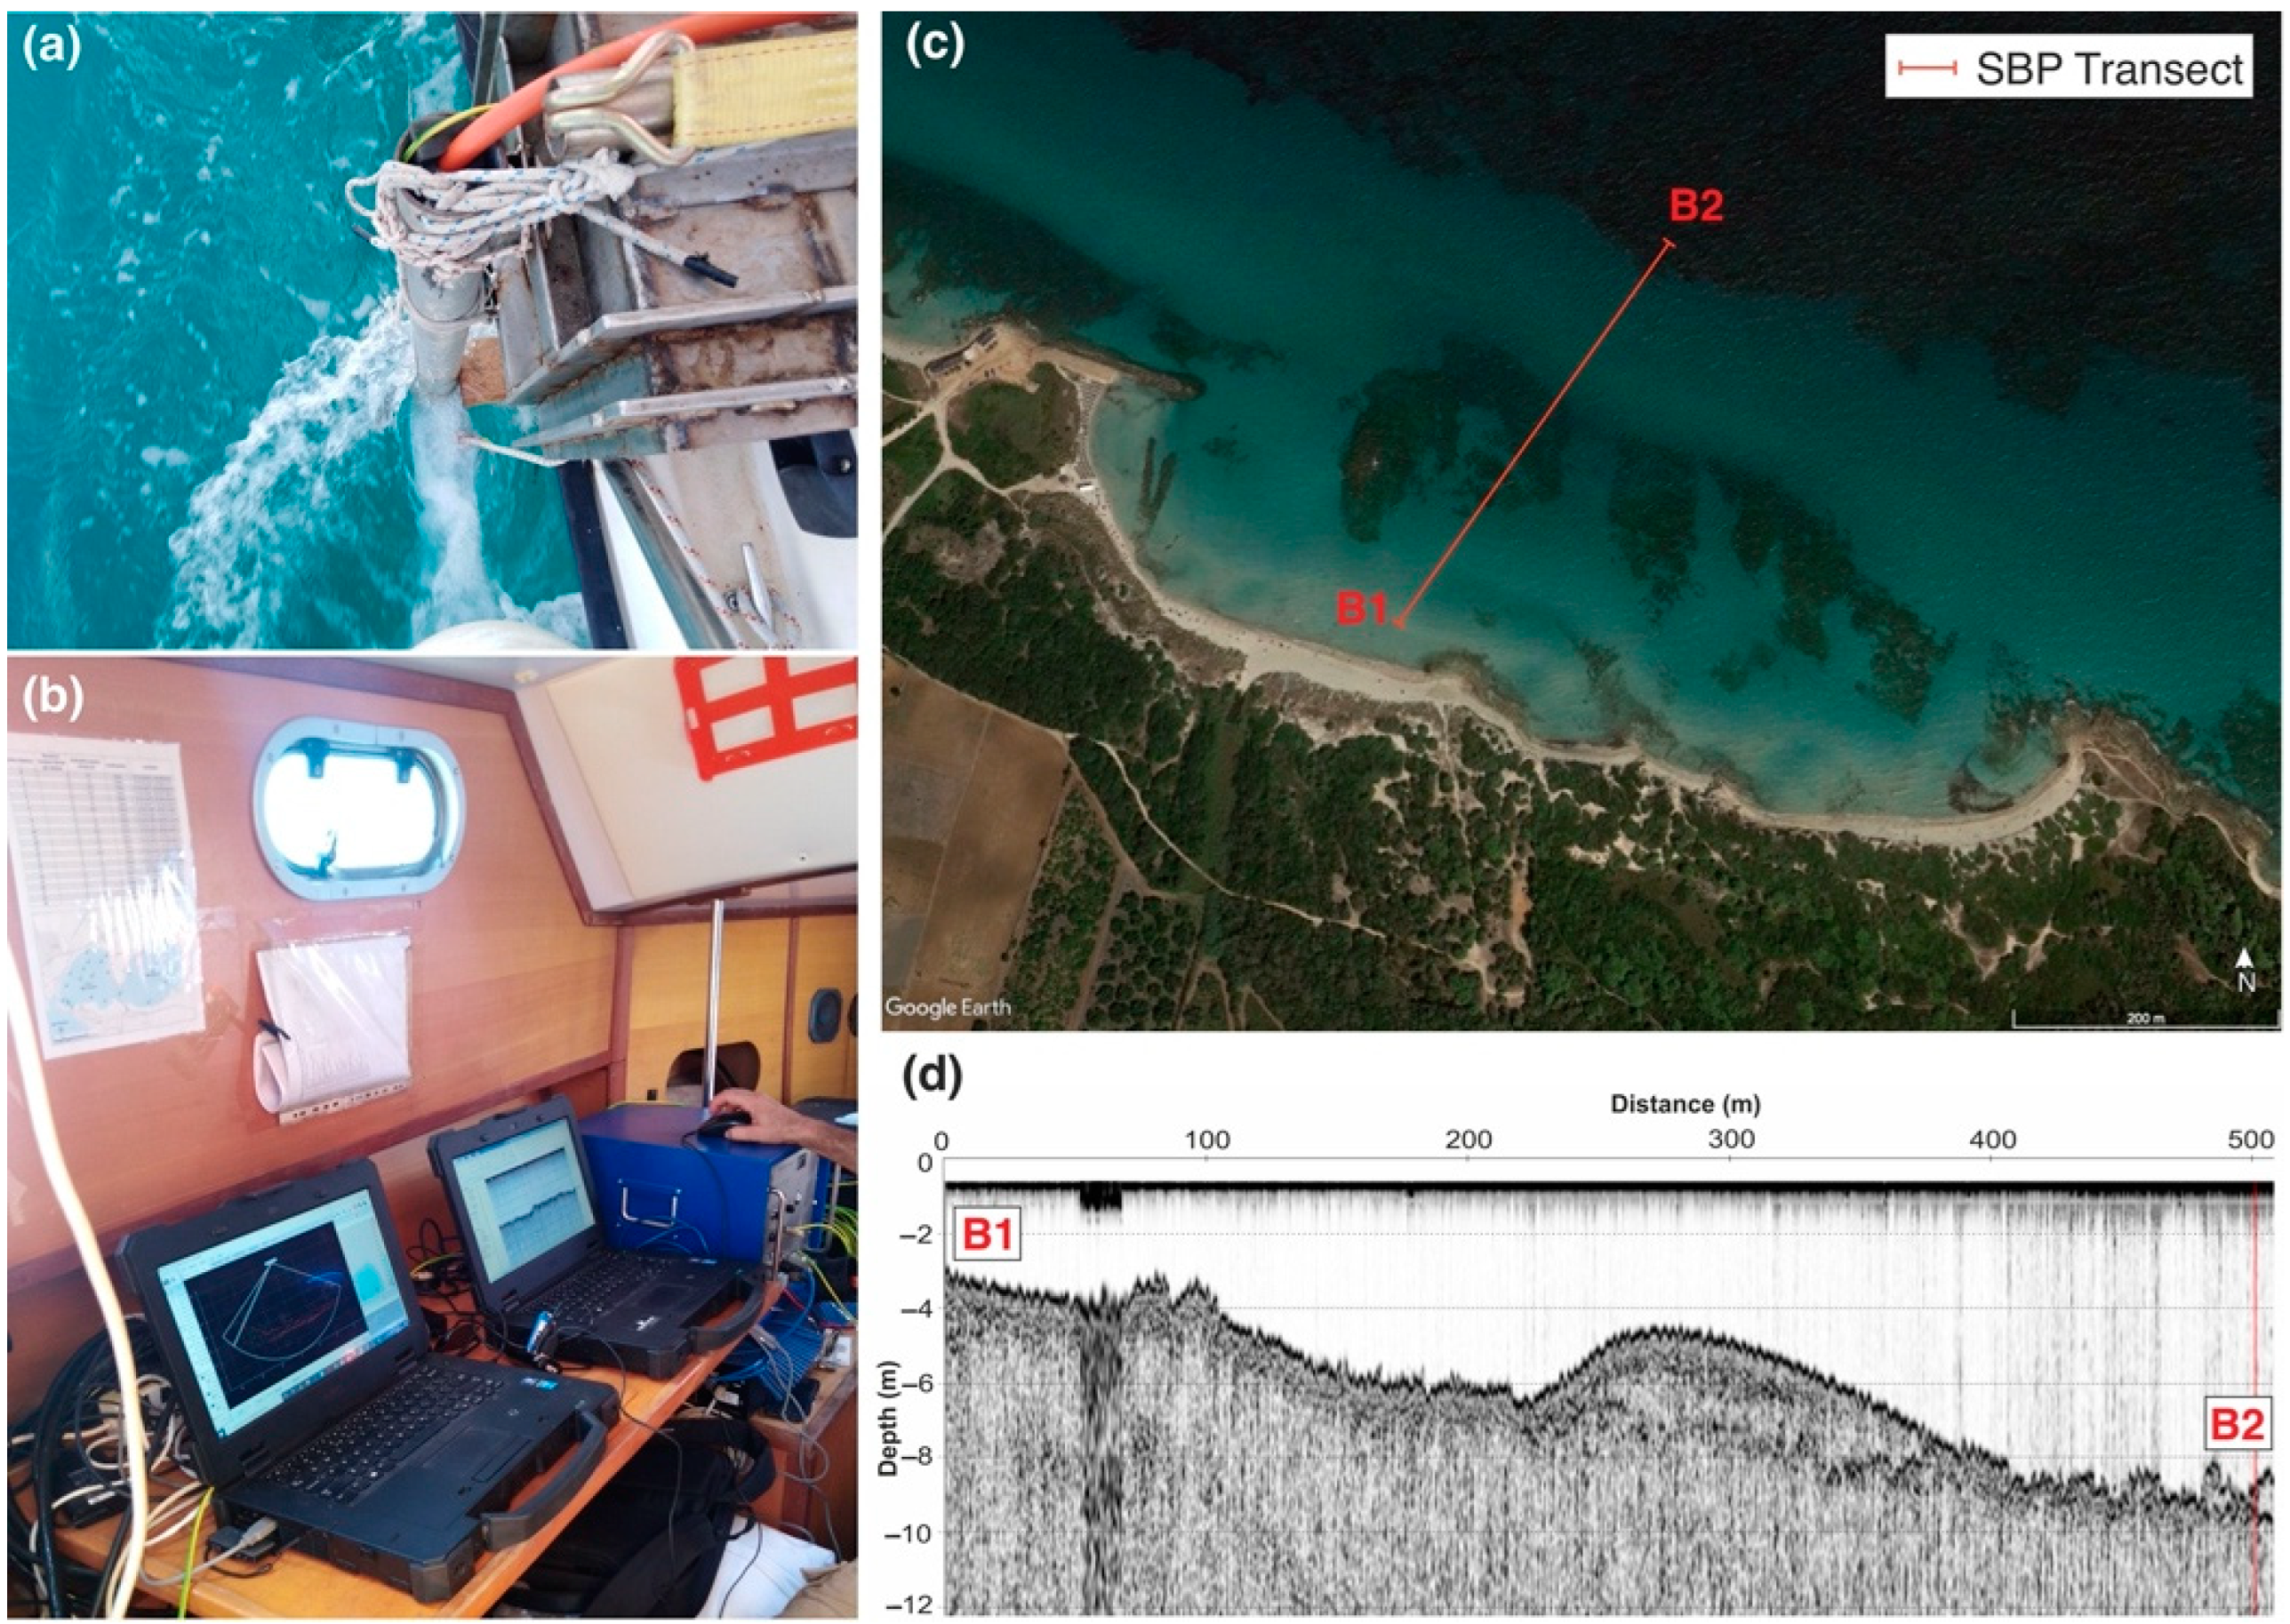
3.4.2. Sub Bottom Profiler (SBP)

As the GPR investigation, the sub bottom profiler was carried out to quantify the sand thicknesses within the submerged sector of the beach. This technique is widely applied in the field of marine geology. The SBP exploits the elastic properties of the ground to reconstruct the stratigraphic succession of deposits occurring below the seabed. Each surface that marks a lithological transition or any acoustic impedance such as the water/sediment passage represents an elastic discontinuity capable of reflecting part of the seismic energy. The reflected signal is received by a transducer and sent to the visualization program by creating a seismic section. The signal penetration and reflection depend on the frequency and the physical properties of the sediment.
In this study case, one marine field survey was carried out for each study area by applying low signal frequencies (85–115 kHz). The investigation was organized by following the same cross-shore transect of the georadar investigation from 6–2 m depth (example in Figure 11).
Moreover, a boat capable of reaching shallow waters was utilized for the investigation and the instrumentation was characterized by an Innomar SBP SES 2000 Compact system. The SBP transducer was installed on one side of the boat (Figure 11a), while the hardware system and the data management laptop were positioned inside the boat. Moreover, the whole system was connected to a GPS RTK, and interfaced with the instrument management software to acquire the exact data location. Regarding data acquisition, SES WIN software was utilized to obtain seismic sections in real-time. The program produces a *.SES file which displays the width of the acoustic signal reflected at different depths; it also contains data relating to the longitude, latitude, depth of the seabed, and acquisition parameters. All these data were transferred to Delph Seismic software to analyze the 2-dimensional stratigraphic cross sections, define the bedrock location, and obtain strata thicknesses.

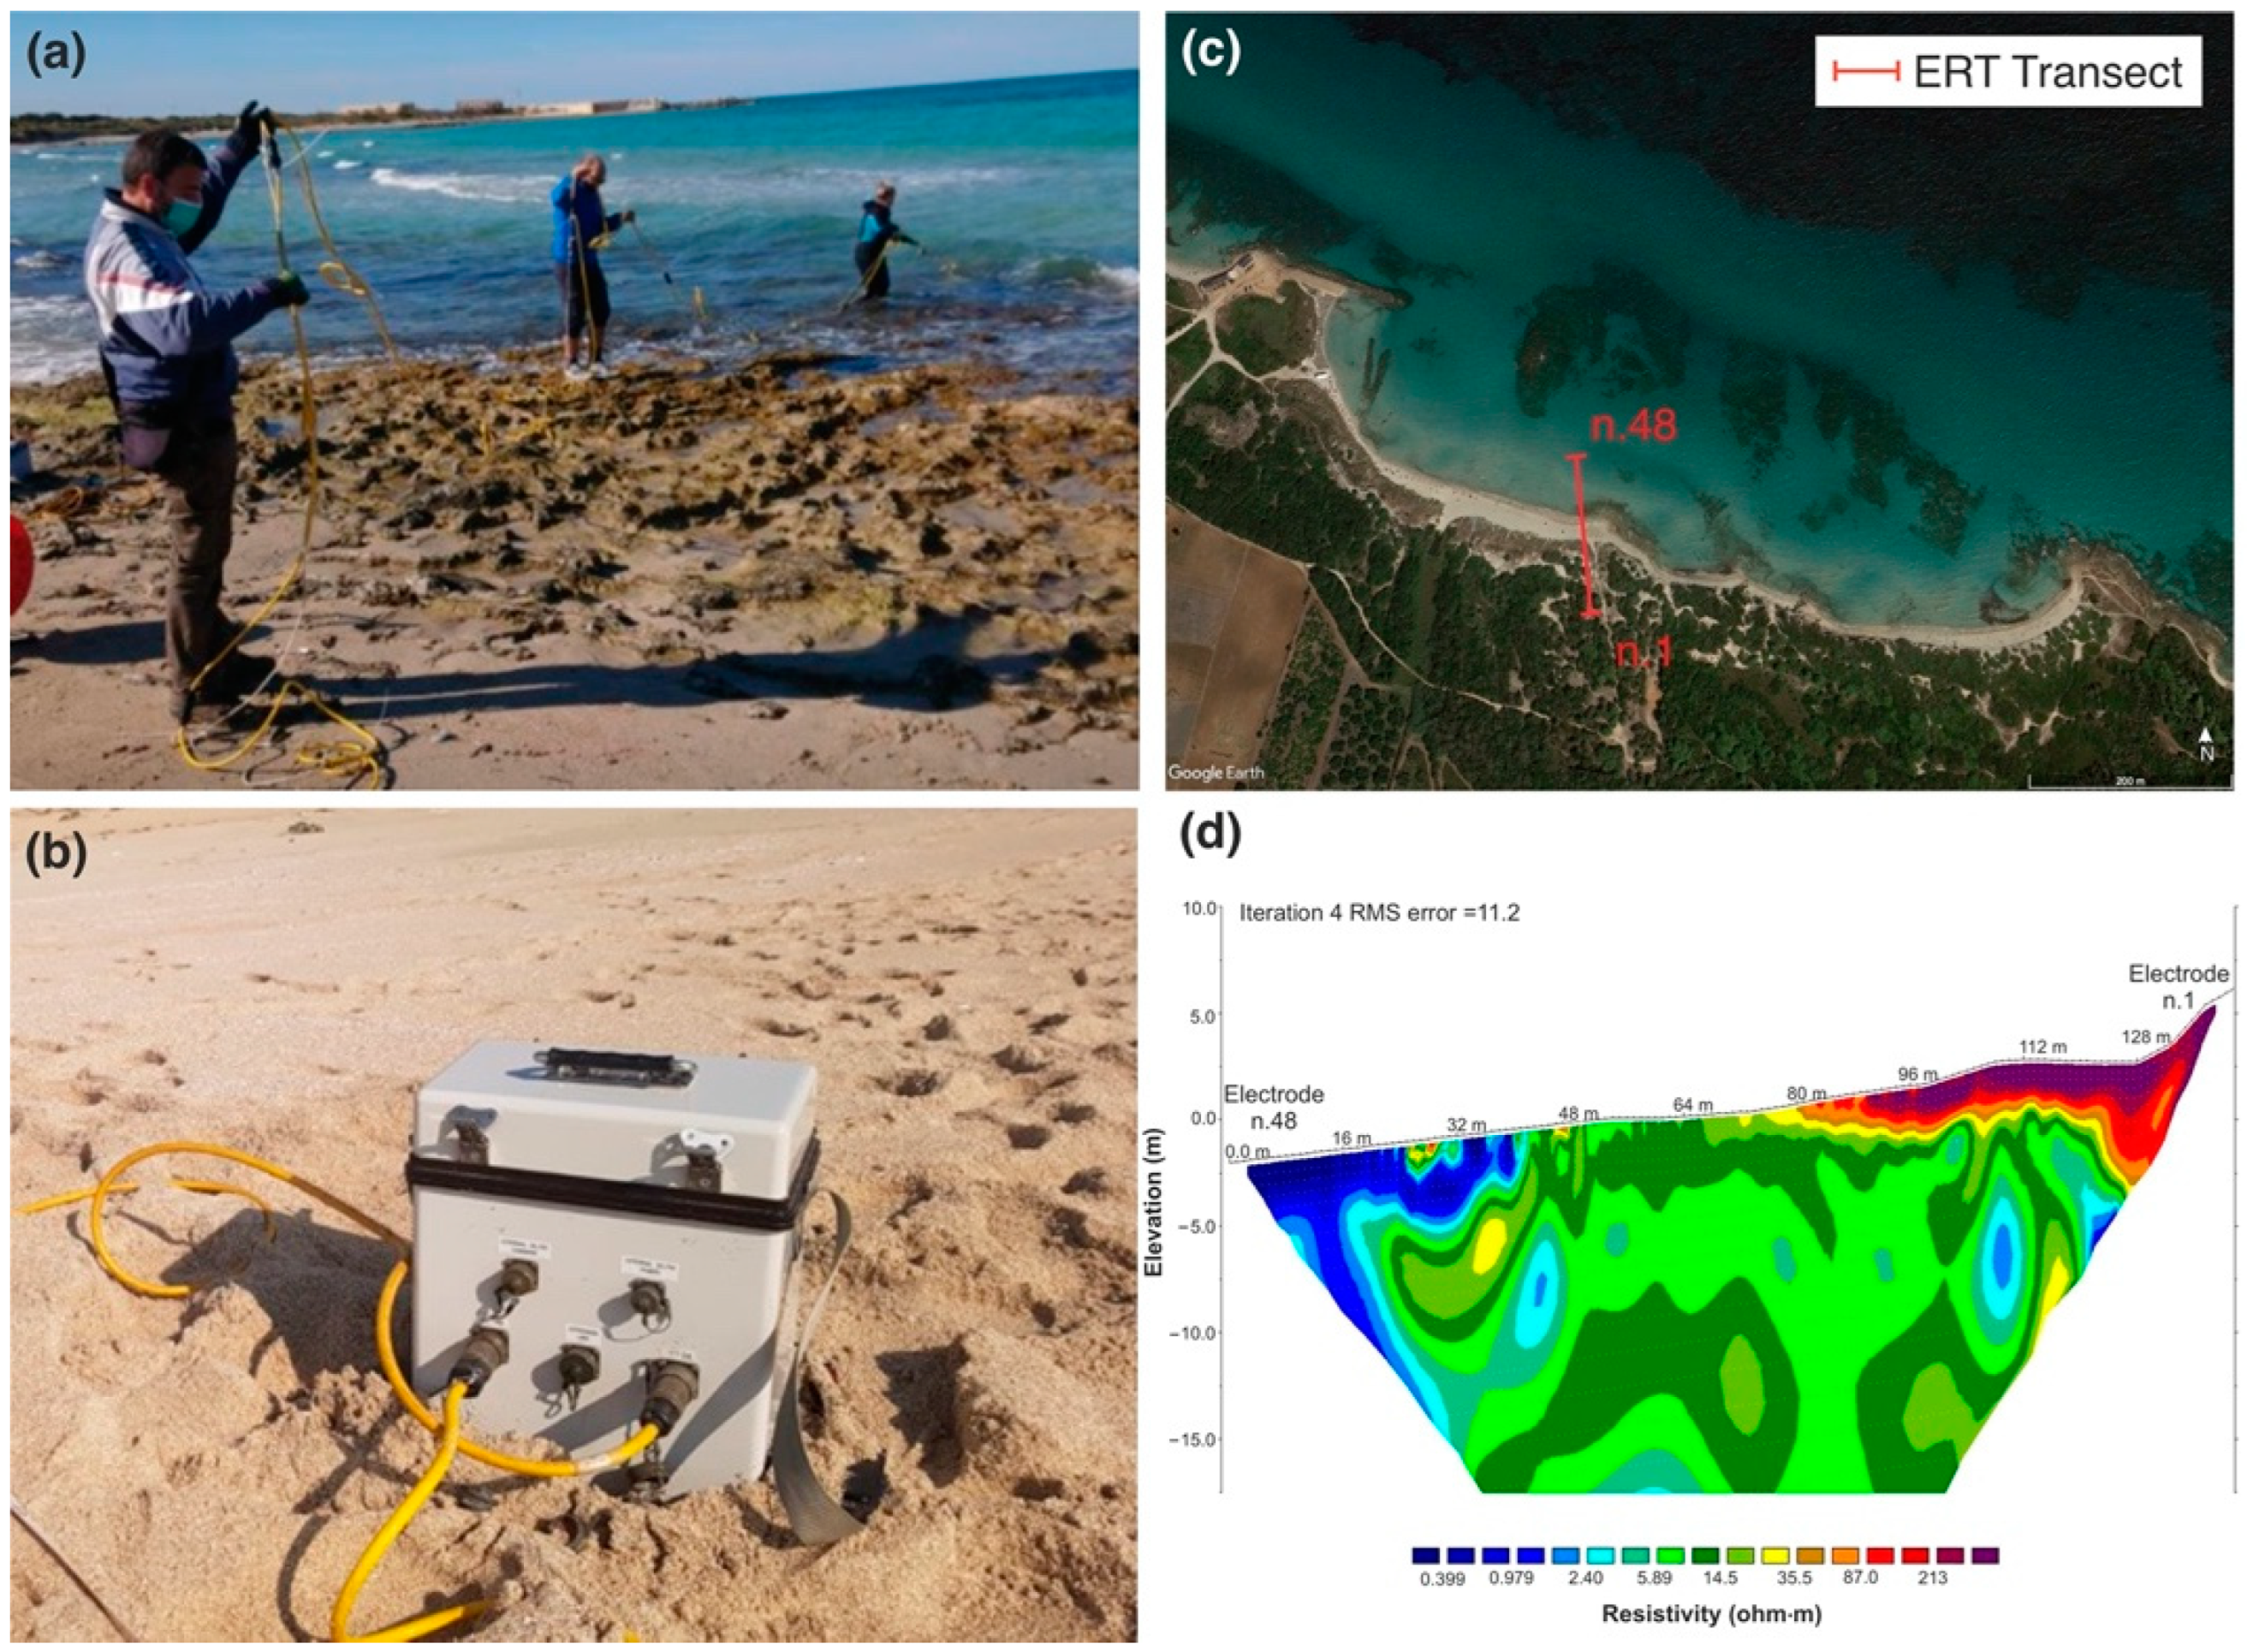
3.4.3. Geoelectric Investigation (ERT)

A geoelectric investigation was applied to analyze the entire beach profile and to gain data about the foreshore subenvironment. The application of a geoelectric investigation provides information relating to the subsoil electrical resistivity distribution.
As shown in Figure 12, the ERT was carried out across the same GPR cross-shore transect. The investigation profile was extended until 3 m depth in the shoreface to reach the SBP profile (Figure 12c). The measurements were carried out by adopting an IRIS Instruments Syscal Pro Georesistive Meter, two multi-electrode cables at 24-channels with 3 m interelectrode spacing for a total length of 141 m. Proceeding from NNE to SSW, the first cable (steel electrodes 1–24) was placed on the subsoil of the emerged beach sector, while the second cable (graphite electrodes 25–48) was placed on the seabed (Figure 12a). The data were acquired both in Wenner-Schlumberger and dipole-dipole configurations. The former provides high vertical resolution while the latter high lateral resolution–although it is characterized by a lower signal-to-noise ratio than other devices [100]. For this reason, reciprocal measures were also carried out to facilitate the data quality control necessary to obtain reliable and well-resolved images. After the quality control (carried out by setting a 10% threshold for repeatability errors, and standard deviation obtained from the stacks), the experimental data were inverted using the RES2DINV code (Geotomo Software, [101]). The resulting model (Figure 12d) was obtained by inverting the dataset relating to the measurements in dipole–dipole configuration, including the GPS-RTK data that were acquired along the same transept for topography correction.
Lastly, two excavations were also carried out using shovels along the GPR/ERT transects. This technique was fundamental to calibrate and verify with a direct measurement the exact location of the bedrock extrapolated by the radar stratigraphy sections and the resistivity models.

4. Results

4.1. Data Comparison

The first step in beach dynamics interpretation is comparing some of the results deriving from different methodologies applied in this research. Figure 13 represents an example of a combination of Delft3D models, DTM comparison, sand classification, and mean size distribution.
This type of comparison enables to highlight the processes concerning the sediment transport and the evolutionary tendency of the beach explained by the connection among the simulation of the wave motion, erosion and accretion phases, sand composition, and granulometric features. For instance, at Torre Guaceto beach, the analysis of the emerged beach underlines the presence of a southernmost sector more exposed to the wave motion than the northern sector during storm events. The northern beach sector is characterized by an erosional tendency, especially at the dune base as reported from the DTM investigation (Figure 13a). Moreover, a significant composition variability is detected along the foreshore samples. The sand of Torre Guaceto beach is classified as “Hybrid intrabasinal sand”, but the northern-central sector of the emerged beach is characterized by a higher content of bioclast than the southern sector, which instead is richer in siliciclastic content (Figure 13b). In addition, according to the mean size data, an increasing trend of the grain diameter is recorded from the samples collected close to the outermost promontories towards the central part of the beach (Figure 13c), suggesting a bioclast longshore transport in this direction. Indeed, looking at the main wave direction, the more porous and lighter bioclastic sediments are removed from the southern sector and transported to the central part of the beach. Indirectly, the transport of the bioclast component increases the percentages of the siliciclastic minerals in the southern sector, explaining the sudden longshore compositional variation of the emerged sector of Torre Guaceto beach. Comparing this result with the DTM, we found that the sector with the higher bioclast component (northern central sector) represents the more stable part of the beach in terms of evolutionary tendency, whereas the southernmost sector is eroding.

4.2. Beach Dynamics

Another example of data integration can be performed by using the results shown in Figure 14. The main sand characteristics (texture and petrography) coupled with the study of the meteorological events and the interpretation of the sediment transport allows to reconstruct the sedimentary balance and propose an overall sketch scheme of beach dynamics (Figure 14d). In the semi-closed coastal system of Le Dune beach, considering the southerly seas as the main wave direction, the scheme shows how the sediment inputs mainly derive from local sources and the sediment outputs involve small amounts of sediments. The gain sediment includes material coming from the erosion of the dunes, rocky shoreface, and lateral headlands as well as the bioclastic sediment transported from offshore. Therefore, the sedimentary dynamics are controlled by a predominant accretion of sand diffusion by aeolian processes especially in the westernmost part of the coast; a cross-shore sediment transport; a nearshore rip circulation characterized by a longshore sediment transport converging in the middle of the embayment; a weak lateral sediment interchange with adjacent littoral sectors and an offshore sand dispersion during storm events. The current morphological configuration of the sea bottom significantly influences the cross-shore sediment transport. The rocky headlands located in the shallow water and the rocky sea bottom make the beach an almost completely closed bay, which is also characterized by the absence of river basins and the presence of strong rip currents that carry large amounts of sediments towards the offshore during storm events.

4.3. Sediment Thickness and Beach Profile

One of the main applications deriving from the methodologies tested in this research is the combination of geophysics techniques. This operation is fundamental to reconstruct the entire beach profile from the dune environment to the offshore and to extrapolate the bedrock location. In particular, the merging of the radar section, resistivity model, and sub-bottom profile allows to quantify the sediment thickness within the entire beach environment and to record the location of the sub-environments. For instance, in the case of Torre Guaceto, the beach profile (Figure 15) extends for about 700 m. It represents the connection of the GPR, resistivity model, and SBP navigation transect. The bedrock location ranges between +1 m and −2 m within the emerged beach sector and from −2 m to −10 m in the submerged sector.
The most relevant reflector resolution (bedrock) occurs below the sediments characterizing the dune environment, the sandy upper shoreface, and beneath the sand bar located between the lower shoreface and the offshore. Moreover, the bedrock visibly emerges in the rocky lower shoreface.
Considering the geology of the study area, the bedrock is certainly associated with the Pleistocene biocalcarenite (packstone and grainstone texture).

5. Discussion

5.1. Main Findings

The main outcomes highlight and confirm the literature data about the sand composition variability and the morpho-sedimentary dynamics occurring along the Adriatic and Ionian littoral. The findings represent the features of the Mediterranean coastal types.
The results underline the need to improve methodologies for pocket beach investigation which are difficult to preserve due to their low geological records. They are affected by seasonal changes strictly correlated with the main sediment source. The sediment transport mainly occurs between the dune environment and the offshore characterized by the presence of Posidonia oceanica meadows. In this context, carbonate factory protection and dune restoration measures are crucial to preserve this geological environment where the anthropic pressure is increasingly growing, especially for tourist activities.
The analysis of Torre Guaceto beach provides a significant example of improvement studies in ancient research. Environments at the same depth could have different compositions due to the main sediment selection caused by the current beach dynamics system. Indeed, the qualitative and quantitative changes of the bioclast content along the cross-shore result in problematic stratigraphic correlations between adjacent logs in ancient successions located in similar settings. Moreover, this case study points out the presence of distinct dynamics due to the different exposure of the beach sector to wave motion providing information about eroding and prograding phases within the same environment.
The case study of Le Dune beach underlines the existence of many pocket beaches in the world that are only preserved thanks to the bioclast provenance source and the dune environment. In this case, the growth of urbanization, especially along the southern coastal sector, could significantly impact on the amount of sediment available. Although this beach is part of a marine protected area, the lack of collaboration between local decision-makers and the scientific community about the knowledge of pocket beach dynamics has led to the destruction of the dune environment with a consequent establishment of a building area. In this respect, higher restrictive measures should be considered for the protection of these types of environments.
Torre Guaceto and Le Dune represent two different pocket beaches in terms of length, sedimentology, composition, dynamics, and anthropic impact. For this reason, some considerations raised during the investigation. Geophysics provided more detailed results of the submerged sector at Torre Guaceto than at Le Dune beach. The rocky seabed in the latter affected the navigation along the shoreface transect requiring a major support from electrical tomography. The closed beach system, the morphology of the seabed, and the urbanization of the dune environment influenced the progress of the investigations. It would have been interesting to measure the sediment thicknesses along different cross-shore transects, but the southern sector was affected by a significant urbanization.
These results are strictly correlated with a two-year beach monitoring that is only able to evaluate sudden and small-scale beach variations. However, by seasonally applying the proposed methodologies over a longer period of time, it would be possible to recognize the real evolution of our beaches. The study of the evolutionary tendency could provide a significant impact on public decision-makers and current legislation on unnecessary protection and defense works.

5.2. Final Remarks

The procedure application highlights the need of comparing data from different sectors of the Earth Sciences to enrich the amount of missing information about complex and dynamic systems such as the beach environment. The multidisciplinary approach enables to collect a wide range of data that can be connected and interpreted with each other. The data combination provides a detailed outline of the beach dynamics in qualitative and quantitative terms.
From a sedimentological point of view, the research allows expanding the knowledge about large-scale sedimentary processes by quantifying the volumes involved in the erosion, transport, and deposition dynamics and the potential preservation of specific sub-environments during the sea-level rise or still-stand periods. Furthermore, this study shows how lateral variability in sand composition (not only in grain size) is a widespread feature in present-day beaches. The lateral composition is mainly influenced by very local processes and the sudden variations can be easily misinterpreted in the geological record.
Moreover, the study of sand composition and in particular the analysis of the bioclast component represents a rising technique in coastal erosion investigation. Indeed, measuring the bioclast percentage in the beach sand allows to hypothesize strategies for provenance marine environment safeguarding and monitoring by avoiding unnecessary or too-restrictive protection measures. Lastly, the beach sediment analysis provides significant progress for compatibility studies and nourishment interventions in terms of textural and compositional features. This research tries to respond to the increasingly pressing need to overcome the conflicts between naturalistic requirements and the use of beaches for social and economic purposes, which represent one of the main land use planning issues of coastal regions.

6. Conclusions

This research described the processes of erosion, transport, and sedimentation of two Apulian sandy beaches through a multidisciplinary approach. Table 2 shows the methodological proposal for sandy beach analysis deriving from the multidisciplinary approach tested in this research. This procedure includes topographic, geophysical, sedimentological, and compositional analyses for monitoring and safeguarding these transitional environments that can be useful for research studies or industrial applications.
As shown in Table 2, the procedure for investigating sandy beaches was based upon four main types of analyses: topographic surveys through TLS and OTS; a hydrodynamic model using Delft3D software; a series of geophysics techniques by the use of GPR, ERT and SBP; and a beach sand analysis through sedimentological and compositional applications. Each technique covered a specific beach subenvironment and provided distinct results. Therefore, the procedure could be invalid without the combination of the proposed techniques as the beach dynamics interpretation could be incomplete.
Regarding the geophysical investigation, it was essential to confirm the indirect measures with direct observations such as excavations. The resistivity studies were also correlated to the GPR and SBP surveys for a more detailed outline of the lithology and stratigraphy of the subsoil. Lastly, for the GPR application, the use of 400 and 200 Mhz antennas produced more satisfactory resolutions of the bedrock location than the 40 Mhz antenna.
It is important to emphasize that all the equipment, instrument frequencies, and resolutions were set on the aim of this research and the geological context.
Investigating sandy beaches is not undemanding due to the dynamism of this type of environment. For this reason, as shown in Table 2, the use of GPS supported most of the methodologies in order to respect the exact location of the seasonal investigation. Data comparison should be provided by taking into account the same season of the field measure in order to avoid interpretation issues.
Another suggestion that could improve this type of investigation is the use of the “Sediment transport module” in the application of Delft3D software. Indeed, the Delft3D-SED coupled with the others enables to analyze the effects of dredging on the environment, the sedimentation and resuspension of sediment, and the sand transport. Moreover, a primary phase of data collection on the marine climate of the study area is highly recommended to interpret the beach dynamics.

Author Contributions

Conceptualization, I.L., S.L., M.M.; data curation, I.L., S.L., F.D.G., D.M., L.C., G.R., F.S., G.M.; G.S.; writing—original draft preparation, I.L.; writing—review and editing, M.M., S.M.; supervision, M.M.; funding acquisition, M.M. All authors have read and agreed to the published version of the manuscript.

Funding

This research was carried out within the Ph.D. project of the “Programma Operativo Nazionale Ricerca e Innovazione 2014–2020 (CCI 2014IT16M2OP005)”, Fondo Sociale Europeo, Azione I.1 “Dottorati Innovativi con caratterizzazione industriale” Università degli Studi di Bari “Aldo Moro”.

Institutional Review Board Statement

Not applicable.

Informed Consent Statement

Not applicable.

Data Availability Statement

Not applicable.

Acknowledgments

This paper is the result of a collaboration among academic, research and industrial activities. We thank all collaborators for their logistic and technic support in every phase of this work. We are thankful to the reviewers for their revisions that allow us to improve the quality of the paper.

Conflicts of Interest

The authors declare no conflict of interest. The funders had no role in the design of the study; in the collection, analyses, or interpretation of data; in the writing of the manuscript; or in the decision to publish the results.

References

  1. Thornton, E.; Dalrymple, R.A.; Drake, T.G.; Elgar, S.; Gallagher, E.L.; Guza, R.T.; Hay, A.E.; Holman, R.A.; Kaihatu, J.M.; Lippmann, T.C.; et al. State of Nearshore Processes Research: II; Naval Postgraduate School: Monterey, CA, USA, 2000; Naval Postgraduate School Technical Report NPS-OC-00-001. [Google Scholar]
  2. Woodroffe, C.D. Coasts: Form, Process and Evolution; Cambridge University Press: Cambridge, UK, 2002. [Google Scholar]
  3. Crossland, C.J.; Baird, D.; Ducrotoy, J.-P.; Lindeboom, H.; Buddemeier, R.W.; Dennison, W.C.; Maxwell, B.A.; Smith, S.V.; Swaney, D.P. The Coastal Zone—A Domain of Global Interactions. In Coastal Fluxes in the Anthropocene; Springer: Berlin/Heidelberg, Germany, 2005; pp. 1–37. [Google Scholar] [CrossRef] [Green Version]
  4. Masselink, G.; Russell, P.E. Impacts of climate change on coastal erosion. MCCIP Sci. Rev. 2013, 2013, 71–86. Available online: http://mccip.cefastest.co.uk/media/1256/2013arc_sciencereview_09_ce_final.pdf (accessed on 12 November 2022).
  5. The BACC II Author Team. Second Assessment of Climate Change for the Baltic Sea Basin; Regional Climate Studies; Springer: Berlin/Heidelberg, Germany, 2015. [Google Scholar] [CrossRef] [Green Version]
  6. Bonaldo, D.; Antonioli, F.; Archetti, R.; Bezzi, A.; Correggiari, A.; Davolio, S.; De Falco, G.; Fantini, M.; Fontolan, G.; Furlani, S.; et al. Integrating multidisciplinary instruments for assessing coastal vulnerability to erosion and sea level rise: Lessons and challenges from the Adriatic Sea, Italy. J. Coast. Conserv. 2019, 23, 19–37. [Google Scholar] [CrossRef]
  7. De Serio, F.; Armenio, E.; Mossa, M.; Petrillo, A.F. How to Define Priorities in Coastal Vulnerability Assessment. Geosciences 2018, 8, 415. [Google Scholar] [CrossRef] [Green Version]
  8. Roig-Munar, F.X.; Martín-Prieto, J.Á.; Rodríguez-Perea, A.; Batista, Ó.O. Environmental Analysis and Classification of Coastal Sandy Systems of the Dominican Republic. In Beach Management Tools—Concepts, Methodologies and Case Studies; Botero, C., Cervantes, O., Finkl, C., Eds.; Coastal Research Library; Springer: Cham, Switzerland, 2018; p. 24. [Google Scholar] [CrossRef]
  9. Zhu, Z.-T.; Cai, F.; Chen, S.-L.; Gu, D.-Q.; Feng, A.-P.; Cao, C.; Qi, H.-S.; Lei, G. Coastal Vulnerability to Erosion Using a Multi-Criteria Index: A Case Study of the Xiamen Coast. Sustainability 2018, 11, 93. [Google Scholar] [CrossRef] [Green Version]
  10. De Andrade, T.S.; de Oliveira Sousab, P.H.G.; Sieglea, E. Vulnerability to beach erosion based on a coastal processes approach. Appl. Geogr. 2019, 102, 12–19. [Google Scholar] [CrossRef]
  11. National Research Council (NRC). Measuring and Understanding Coastal Processes; National Academies Press: Washington, DC, USA, 1989. Available online: http://www.nap.edu/catalog/1445.html (accessed on 10 November 2022).
  12. Gombos, M.; Ramsay, D.; Webb, A.; Marra, J.; Atkinson, S.; Gorong, B. Coastal Change in the Pacific Islands: A Guide to Support Community Understanding of Coastal Erosion and Flooding Issues. 2014, 1. Available online: http://www.reefresilience.org/wp-content/uploads/Gombos-et-al.-2014-Coastal-Change-in-the-Pacific-Islands.pdf (accessed on 11 November 2022).
  13. Harris, L.; Nel, R.; Holness, S.; Schoeman, D. Quantifying cumulative threats to sandy beach ecosystems: A tool to guide ecosystem-based management beyond coastal reserves. Ocean. Coast. Manag. 2015, 10, 12–24. [Google Scholar] [CrossRef]
  14. UNISDR. Coastal Erosion Hazard and Risk Assessment. In Words into Action Guidelines: National Disaster Risk Assessment Hazard Specific Risk Assessment; UNISDR: Geneva, Switzerland, 2017. [Google Scholar]
  15. UN Environment Programme. Coastal Zone Management. 2021. Available online: https://www.unep.org/explore-topics/oceans-seas/what-we-do/working-regional-seas/coastal-zone-management (accessed on 11 November 2022).
  16. European Commission. A Guide to Coastal Erosion Management Practices in Europe; Rijkswaterstaat/RIKZ: The Haque, The Netherlands, 2004. [Google Scholar]
  17. Moretti, M.; Tropeano, M.; van Loon, A.J.T.; Acquafredda, P.; Baldacconi, R.; Festa, V.; Lisco, S.; Mastronuzzi, G.; Moretti, V.; Scotti, R. Texture and composition of the Rosa Marina beach sands (Adriatic coast, southern Italy): A sedimentological/ecological approach. Geologos 2016, 22, 87–103. [Google Scholar] [CrossRef] [Green Version]
  18. Van Loon, A.J.; Moretti, M.; Tropeano, M.; Acquafredda, P.; Baldacconi, R.; Festa, V.; Lisco, S.; Mastronuzzi, G.; Moretti, V.; Scotti, R. Tracing the Source of the Bio/Siliciclastic Beach Sands at Rosa Marina (Apulian Coast, SE Italy). In Sediment Provenance; Mazumder, R., Ed.; Elsevier: Amsterdam, The Netherlands, 2017; pp. 25–47. [Google Scholar] [CrossRef]
  19. Pranzini, E. Dinamica e difesa dei litorali. Gestione integrata della fascia costiera. Studi Costieri 2019, 28, 3–12. [Google Scholar]
  20. Falese, F.G.; Chiocci, F.; Moretti, M.; Tropeano, M.; Mele, D.; Dellino, P.; Lisco, S.; Mastronuzzi, G.; Piscitelli, A.; Sabato, L. Rapporto di Fase 5; Autorità di Bacino della Puglia: Bari, Italy, 2016. [Google Scholar]
  21. Mastronuzzi, G.; Sansò, P. La costa senza passato è senza futuro. Il contributo della geomorfologia nella gestione sostenibile delle coste. Geol. E Territ. 2013, 1, 3–15. [Google Scholar]
  22. Milli, S.; Girasoli, D.E.; Tentori, D.; Tortora, P. Sedimentology and coastal dynamics of carbonate pocket beaches: The Ionian-Sea Apulia coast between Torre Colimena and Porto Cesareo (Southern Italy). J. Mediterr. Earth Sci. 2017, 9, 29–66. [Google Scholar]
  23. Mastronuzzi, G.; Palmentola, G.; Ricchetti, C. Aspetti della evoluzione olocenica della costa pugliese. Mem. Della Soc. Geol. Ital. 1989, 42, 287–300. [Google Scholar]
  24. Caldara, M.; Centenaro, E.; Mastronuzzi, G.; Sansò, P.; Sergio, A. Features and present evolution of Apulian Coast (Southern Italy). J. Costal Res. 1998, 26, 55–64. [Google Scholar]
  25. Mastronuzzi, G.; Palmentola, G.; Sansò, P. Evoluzione morfologica della fascia costiera di Torre Canne (Puglia adriatica). Studi Costieri 2001, 4, 19–31. [Google Scholar]
  26. Donato, P.; De Rosa, R.; Tenuta, M.; Iovine, R.S.; Totaro, F.; D’Antonio, M. Sr-Nd Isotopic Composition of Pyroxenes as a Provenance Indicator of a Double-Volcanic Source in Sands of the Ofanto River (Southern Italy). Minerals 2022, 12, 232. [Google Scholar] [CrossRef]
  27. Lisco, S.; Moretti, M.; Moretti, V.; Cardone, F.; Corriero, G.; Longo, G. Sedimentological features of Sabellaria spinulosa biocontructions. Mar. Pet. Geol. 2017, 87, 203–212. [Google Scholar] [CrossRef]
  28. Alfonso, C.; Auriemma, R.; Scarano, T.; Mastronuzzi, G.; Calcagnile, L.; Quarta, G.; Di Bartolo, M. The ancient coastal landscape of the Marine Protected Area of Porto Cesareo (Lecce-ITALY): Recent researches. Int. J. Soc. Underw. Technol. 2012, 30, 207–215. [Google Scholar] [CrossRef]
  29. Dal Cin, R.; Simeoni, U. Processi erosivi e trasporto dei sedimenti fra S. Maria di Leuca e Taranto (Mare Jonio). Possibili strategie di intervento. Boll. Soc. Geol. It. 1987, 106, 767–783. [Google Scholar]
  30. Gianfreda, F.; Sansò, P. AMEBA (A parametric Method for Erosion Beach Assessment): Applicazione alle spiagge del Salento leccese. Period. Soc. Ital. Di Geol. Ambient. 2007, 3, 2–8. [Google Scholar]
  31. Dal Cin, R.; Simeoni, U.; Zamariolo, A.; Mastronuzzi, G.; Sansò, P. Foglio 215 Otranto. In Atlante delle Spiagge Italiane; CNR—MURST, S.E.L.C.A.: Firenze, Italy, 1995. [Google Scholar]
  32. Pennetta, L. Ricerche sull’evoluzione recente del delta dell’Ofanto. Boll. Mus. St. Nat. Lunigiana 1988, 6–7, 41–45. [Google Scholar]
  33. Simeoni, U. I litorali tra Manfredonia e Barletta (basso Adriatico): Dissesti, sedimenti, problematiche ambientali. Boll. Soc. Geol. It 1992, 111, 367–398. [Google Scholar]
  34. Caldara, M. Aspetti di Geologia ambientale e di morfologia costiera in alcuni tratti del litorale nord-barese. In Atti del Convegno “Cave e coste nel territorio del nord-barese”. Geologi Suppl. 1996, 2, 39–61. [Google Scholar]
  35. Simeoni, U.; Bondesan, M. The role and responsibility of man in the evolution of Italian Adriatic coast. Bull. Inst. Oceanogr. Monaco 1997, 18, 11–132. [Google Scholar]
  36. Mastronuzzi, G.; Palmentola, G.; Sansò, P. Lineamenti e dinamica della costa pugliese. Studi Costieri 2002, 5, 9–22. [Google Scholar]
  37. Annese, R.; De Marco, A.; Gianfreda, F.; Mastronuzzi, G.; Sanso, P. Caratterizzazione morfo-sedimentologica dei fondali della baia fra Torre San Leonardo e Torre Canne (costa adriatica, Puglia). Studi Costieri 2003, 7, 3–19. [Google Scholar]
  38. Ingle, J. The movement of beach sand. An Analysis Using Fluorescent Grains. In Development in Sedimentology 5; Elsevier: Amsterdam, The Netherlands, 1966. [Google Scholar]
  39. Dal Cin, R. Distinzione tra spiagge in erosione ed in avanzamento mediane metodo granulometrico. Istituto di Geologia dell’Università di Ferrara con il contributo del C.N.R. Riv. Ital. Di Geotec. 1969, 4, 227–233. [Google Scholar]
  40. Dalrymple, R.A.; Thompson, W.W. Study of equilibrium beach profiles. Coast. Eng. Proceeding 1976, 15, 74. [Google Scholar] [CrossRef] [Green Version]
  41. Wright, L.D.; Chappell, J.; Thorn, B.G.; Bradshaw, M.P.; Cowell, P. Morpho-dynamics of reflective and dissipative beach and inshore systems: Southeastern Australia. Mar. Geol. 1979, 32, 105–140. [Google Scholar] [CrossRef]
  42. Wright, L.D.; Short, A. Morphodynamic variability of surf zones and beaches: A synthesis. Mar. Geol. 1984, 56, 93–118. [Google Scholar] [CrossRef]
  43. Masselink, G.; Short, A.D. The Effect of Tide Range on Beach Morphodynamics and Morphology: A Conceptual Beach Model. J. Coast. Res. 1993, 9, 785–800. [Google Scholar]
  44. Ciavola, P.; Gatti, M.; Armaroli, C.; Balouin, Y. Valutazione della variazione della linea di riva nell’area di Lido di Dante (RA) tramite GIS e monitoraggio DGPS cinematico. In Proceedings of the Atti di: Accademia Nazionale dei Lincei, XXI Giornata dell’Ambiente, Aree Costiere, Roma, Italy, 5 June 2003; pp. 113–121. [Google Scholar]
  45. Gracia, F.J.; Anfuso, G.; Benavente, J.; Del Rìo, L.; Dominguez, L.; Martinez, J.A. Monitoring coastal erosion at different temporal scales on sandy beaches: Application to the Spanish Gulf of Cadiz coast. J. Coast. Res. 2005, 49, 22–27. [Google Scholar]
  46. Costas, S.; Alejo, I.; Rial, F.; Lorenzo, H.; Nombela, M.A. Cyclical evolution of a modern transgressive sand barrier in Northwestern Spain elucidated GPR and aerial photos. J. Sediment. Res. 2006, 76, 1077–1092. [Google Scholar] [CrossRef]
  47. Pranzini, E. Remote sensing in beach erosion monitoring: From the origin, to optimal and further. In Beach Erosion Monitoring—Results from BEACHMED-e/OpTIMAL Project; Nuova Grafica Fiorentina: Firenze, Italy, 2008; pp. 49–50. [Google Scholar]
  48. Anfuso, G.; Pranzini, E.; Vitale, G. An integrated approach to coastal erosion problems in Northern Tuscany (Italy): Littoral Morphological Evolution and Cell Distribution. Geomorphology 2011, 129, 204–214. [Google Scholar] [CrossRef]
  49. Nordstrom, K.F.; Armaroli, C.; Jackson, N.L.; Ciavola, P. Opportunities and constraints for managed retreat on exposed sandy shores: Examples from Emilia-Romagna, Italy. Ocean. Coast. Manag. 2015, 104, 11–21. [Google Scholar] [CrossRef]
  50. Karkani, A.; Evelpidou, N.; Vacchi, M.; Morhange, C.; Tsukamoto, S.; Frechen, M.; Maroukian, H. Tracking Shoreline Evolution in Central Cyclades (Greece) Using Beachrocks. Mar. Geol. 2017, 388, 25–37. [Google Scholar] [CrossRef]
  51. Thom, B.G.; Hall, W. Behaviour of beach profiles during accretion and erosion dominated periods. Earth Surf. Process. Landf. 1991, 16, 113–127. [Google Scholar] [CrossRef]
  52. Almeida, L.P.; Ferreira, Ó.; Pacheco, A. Thresholds for morphological changes on an exposed sandy beach as a function of wave height. Earth Surf. Process Landf. 2010, 36, 523–532. [Google Scholar] [CrossRef]
  53. Riazi, A.; Tϋrker, U. Equilibrium beach profiles: Erosion and accretion balanced approach. Water Environ. J. 2017, 31, 317–323. [Google Scholar] [CrossRef]
  54. Gao, S.; Collins, M.B. Analysis of grain size trends, for defining sediment transport pathways in marine environments. J. Coast. Res. 1994, 10, 70–78. [Google Scholar]
  55. Guillén, J.; Palanques, A. Short- and medium-term grain size changes in deltaic beaches (Ebro Delta, NW Mediterranean). Sediment. Geol. 1996, 101, 55–67. [Google Scholar] [CrossRef]
  56. Dawe, I.N. Sediment Patterns on a Mixed Sand and Gravel Beach, Kaikoura, New Zealand. J. Coast. Res. 2001, 34, 267–277. [Google Scholar]
  57. Poizot, E.; Méar, Y.; Biscara, L. Sediment Trend Analysis through the variation of granulometric parameters: A review of theories and applications. Earth-Sci. Rev. 2008, 86, 15–41. [Google Scholar] [CrossRef]
  58. Folk, R.; Ward, W. Brazos river bar: A study in the significance of grain size parameters. J. Sediment. Petrol. 1957, 27, 3–26. [Google Scholar] [CrossRef]
  59. Visher, G.S. Fluvial processes as interpreted from ancient and recent fluvial deposits. In Primary Sedimentary Structures and Their Hydrodynamic Interpretation; Middleton, G.V., Ed.; Society of Economic Paleontologists and Mineralogists: Tulsa, OK, USA, 1965; Volume 12, pp. 116–132. [Google Scholar]
  60. Friedman, G. Dynamic processes and statistical parameters compared for size frequency distribution of beach and river sands. J. Sediment. Petrol. 1967, 37, 327–354. [Google Scholar]
  61. Edwards, A.C. Grain size and sorting in modern beach sands. J. Coast. Res. 2001, 17, 38–52. [Google Scholar]
  62. De Falco, G.; Baroli, M.; Simeone, S.; Piergallini, G. La rimozione della posidonia dalle spiagge: Conseguenze sulla stabilità dei litorali. In Risultati del Progetto—ARENA—ImpAtto della Rimozione dei BanchEtti di PosidoNia sulla Stabilità degli Arenili; Fondazione IMC: Oristano, Italy, 2002. [Google Scholar]
  63. De Falco, G.; Molinaroli, E.; Baroli, M.; Bellacicco, S. Grain size and compositional trends of sediments from Posidonia oceanica meadows to beach shore, Sardinia, western Mediterranean. Estuar. Coast. Shelf Sci. 2003, 58, 299–309. [Google Scholar] [CrossRef]
  64. Satta, A.; Ceccherelli, G.; Cappucci, S.; Carboni, S.; Cossu, A.; Costa, M.; De Luca, M.; Dessy, C.; Farris, E.; Gazale, V.; et al. Linee guida per la gestione integrata delle spiagge. In I Quaderni della Conservatoria delle Coste 1, Regione Autonoma della Sardegna; Tipografie Grafiche del Parteolla: Dolianova, Italy, 2013. [Google Scholar]
  65. De Falco, G.; Simeone, S.; Baroli, M. Management of beach-cast Posidonia oceanica seagrass on the island of Sardinia (Italy, Western Mediterranean). J. Coast. Res. 2008, 24, 69–75. [Google Scholar] [CrossRef]
  66. Short, F.; Carruthers, T.; Dennison, W.; Waycott, M. Global seagrass distribution and diversity: A bioregional model. J. Exp. Mar. Biol. Ecol. 2007, 350, 3–20. [Google Scholar] [CrossRef]
  67. Brandano, M.; Cuffaro, M.; Gaglianone, G.; Petricca, P.; Stagno, V.; Mateu-Vicens, G. Evaluating the role of seagrass in Cenozoic CO2 variations. Front. Environ. Sci. 2016, 4, 72. [Google Scholar] [CrossRef]
  68. Gaglianone, G.; Frezza, V.; Mateu-Vicens, G.; Brandano, M. Posidonia oceanica seagrass meadows facies from western Mediterranean Sea. Rend. Online Soc. Geol. It 2014, 31 (Suppl. 1), 187. [Google Scholar]
  69. Gaglianone, G.; Brandano, M.; Guillem, M.-V. The sedimentary facies of Posidonia oceanica seagrass meadows from the central Mediterranean Sea. Facies 2017, 63, 28. [Google Scholar] [CrossRef]
  70. Simeone, S.; Molinaroli, E.; Conforti, A.; De Falco, G. Impact of ocean acidification on the carbonate sediment budget of a temperate mixed beach. Clim. Change 2018, 150, 227–242. [Google Scholar] [CrossRef]
  71. Leatherman, S.P. Coastal geomorphological applications of ground-penetrating radar. J. Coast. Res. 1987, 3, 397–399, ISSN 0749-0208. [Google Scholar]
  72. Bristow, C.S.; Bailey, S.D.; Lancaster, N. The sedimentary structure of linear sand dunes. Nature 2000, 406, 56–59. [Google Scholar] [CrossRef] [PubMed]
  73. Neal, A.; Roberts, C.L. Applications of ground-penetrating radar (GPR) to sedimentological, geomorphological and geoarchaeological studies in coastal environments. Geol. Soc. Lond. Spéc. Publ. 2000, 175, 139–171. [Google Scholar] [CrossRef]
  74. Neal, A. Ground-penetrating radar and its use in sedimentology: Principles, problems and progress. Earth-Sci. Rev. 2004, 66, 261–330. [Google Scholar] [CrossRef]
  75. Hugenoltz, C.H.; Moorman, B.J.; Wolfe, S.A. Ground penetrating radar (GPR) imaging of the internal structure of an active parabolic sand dune. In Stratigraphic Analyses Using GPR: Geological Society of America Special Paper; Baker, G.S., Jol, H.M., Eds.; Geological Society of America: Boulder, CO, USA, 2007; Volume 432, pp. 35–45. [Google Scholar] [CrossRef]
  76. Guillemoteau, J.; Bano, M.; Dujardin, J.-R. Influence of grain size, shape and compaction on georadar waves: Example of an Aeolian dune. Geophys. J. Int. 2012, 190, 1455–1463. [Google Scholar] [CrossRef] [Green Version]
  77. Shukla, S.B.; Chowksey, V.M.; Prizomwala, S.P.; Ukey, V.M.; Bhatt, N.P.; Muraya, D.M. Internal Sedimentary Architecture and Coastal Dynamics as Revealed by Ground Penetrating Radar, Kachchh coast, Western India. Acta Geophys. 2013, 61, 1196–1210. [Google Scholar] [CrossRef]
  78. Bristow, C.S.; Jol, H.M. An introduction to ground penetrating radar (GPR) in sediments. Geol. Soc. Lond. Spéc. Publ. 2007, 211, 1–7. [Google Scholar] [CrossRef]
  79. Morang, A.; Larson, R.; Gorman, L. Monitoring the coastal environment; Part III: Geophysical and Research Methods. J. Coast. Res. 1997, 13, 1064–1085. [Google Scholar]
  80. Lubis, M.Z.; Anggraini, K.; Kausarian, H.; Pujiyati, S. Review: Marine Seismic and Side-Scan Sonar Investigations for Seabed Identification with Sonar System. J. Geosci. Eng. Environ. Technol. 2017, 2, 166–170. [Google Scholar] [CrossRef]
  81. De Giosa, F.; Scardino, G.; Vacchi, M.; Piscitelli, A.; Milella, M.; Ciccolella, A.; Mastronuzzi, G. Geomorphological Signature of Late Pleistocene Sea Level Oscillations in Torre Guaceto Marine Protected Area (Adriatic Sea, SE Italy). Water 2019, 11, 2409. [Google Scholar] [CrossRef] [Green Version]
  82. Kim, H.D.; Aoki, S.; Kim, K.H.; Kim, J.; Shin, B.; Lee, K. Bathymetric Survey for Seabed Topography using Multibeam Echo Sounder in Wando, Korea. J. Coast. Res. 2020, 95, 527–531. [Google Scholar] [CrossRef]
  83. Van der Salm, J.; Unal, O. Towards a common Mediterranean framework for beach nourishment projects. J. Coast. Conserv. 2003, 9, 35–42. [Google Scholar] [CrossRef]
  84. Nicoletti, L.; Paganelli, D.; Gabellini, M. Aspetti ambientali del dragaggio di sabbie relitte a fini di ripascimento: Proposta di un protocollo di monitoraggio (Environmental aspects of relict sand dredging for beach nourishment:proposal for a monitoring protocol). Quad. ICRAM 2006, 5, 150. [Google Scholar]
  85. APAT-ICRAM. Manuale di Movimentazione dei Sedimenti Marini 2007. (Handbook of Marine Sediment Transport: 77). Available online: http://www.isprambiente.gov.it/contentfiles/00006700/6770-manuale-apaticram-2007.pdf/view (accessed on 12 November 2022).
  86. Targusi, M.; La Porta, B.; Lattanzi, L.; La Valle, P.; Loia, M.; Paganelli, D.; Pazzini, A.; Proietti, R.L.; Nicoletti, L. Beach nourishment using sediments from relict sand deposit: Effects onsubtidal macrobenthic communities in the Central Adriatic Sea (EasternMediterranean Sea-Italy). Mar. Environ. Res. 2018, 144, 186–193. [Google Scholar] [CrossRef]
  87. Tortora, P. Failure of the nourishment intervention at Ladispoli Beach Central Latium coast, Italy, Part 1: An insignificant episode during the last 70 years of coastal evolution. J. Mediterr. Earth Sci. 2020, 12, 33–53. [Google Scholar]
  88. Tortora, P. Failure of the nourishment intervention at Ladispoli Beach (Central Latium coast, Italy, Part 2: The causes. J. Mediterr. Earth Sci. 2020, 12, 55–75. [Google Scholar]
  89. Gunn, D.A.; Pearson, S.G.; Chambers, J.E.; Nelder, L.M.; Lee, J.R.; Beamish, D.; Busby, J.P. An evaluation of combined geophysical and geotechnical methods to characterise beach thickness. Q. J. Eng. Geol. Hydrogeol. 2022, 39, 339. [Google Scholar] [CrossRef] [Green Version]
  90. De Falco, G.; Budillon, F.; Conforti, A.; De Muro, S.; Di Martino, G.; Innangi, S.; Perilli, A.; Tonielli, R.; Simeone, S. Sandy beaches characterization and management of coastal erosion on western Sardinia island (Mediterranean sea). J. Coast. Res. 2014, 70, 395–400. [Google Scholar] [CrossRef]
  91. De Muro, S.; Ibba, A.; Kalb, C. Morpho-sedimentology of a Mediterranean microtidal embayed wave dominated beach system and related inner shelf with Posidoniaoceanica meadows: The SE Sardinian coast. J. Maps 2016, 12, 558–572. [Google Scholar] [CrossRef] [Green Version]
  92. Buosi, C.; Tecchiato, S.; Pusceddu, N.; Frongia, P.; Ibba, A.; De Muro, S. Geomorphology and sedimentology of Porto Pino, SW Sardinia, western Mediterranean. J. Maps 2017, 13, 470–485. [Google Scholar] [CrossRef] [Green Version]
  93. Mastronuzzi, G.; Aringoli, D.; Aucelli, P.P.C.; Baldassarre, M.A.; Bellotti, P.; Bini, M.; Biolchi, S.; Bontempi, S.; Brandolini, P.; Chelli, A.; et al. Geomorphological map of the Italian coast: From a descriptive to a morphodynamic approach. Geogr. Fis. E Din. Quat. 2017, 40, 161–196. [Google Scholar]
  94. Lapietra, I.; Lisco, S.; Mastronuzzi, G.; Milli, S.; Pierri, C.; Sabatier, F.; Scardino, G.; Moretti, M. The morpho-sedimentary dynamics of Torre Guaceto beach (Southern Adriatic Sea, Italy). J. Earth Syst. Sci. 2022, 131, 64. [Google Scholar] [CrossRef]
  95. Pennetta, M. Caratteri granulometrici dei sedimenti del Golfo di Taranto (Alto Ionio). Ann. Ist. Univ. Nav. Di Napoli 1985, 54, 29–30. [Google Scholar]
  96. Petrillo, A.F.; Bruno, M.F.; Nobile, B. Supporto Scientifico per la Redazione del Piano Comunale delle Coste del Comune di Porto Cesareo (Le); Report; Politecnico di Bari: Bari, Italy, 2014. [Google Scholar]
  97. Poppe, L.J.; Eliason, A.H.; Fredericks, J.J.; Rendigs, R.R.; Blackwood, D.; Polloni, C.F. Grain-Size Analysis of Marine Sediments e Methodology and Data Processing; Geological Survey Open File Report 00e358; U.S. Geological Survey: Woods Hole, MA, USA, 2000. Available online: https://pubs.usgs.gov/of/2000/of00-358/text/chapter1.htm (accessed on 11 November 2022).
  98. Zuffa, G.G. Hybrid arenites: Their composition and classification. J. Sediment. Petrol. 1980, 50, 21–29. [Google Scholar]
  99. Zuffa, G.G. Optical analysis of arenites: Influence of methodology on compositional results. In Provenance of Arenites; Zuffa, G.G., Ed.; Reidel: Dordrecht, The Netherlands, 1985; pp. 165–189. [Google Scholar]
  100. Dahlin, T.; Zhou, B. A numerical comparison of 2D resistivity imaging with 10 electrode arrays. Geophys. Prospect. 2004, 52, 379–398. [Google Scholar] [CrossRef]
  101. Loke, M.H.; Barker, R.D. Rapid least squares inversion of apparent resistivity pseudosections by a quasi-Newton method. Geophys. Prospect. 1996, 44, 131–152. [Google Scholar] [CrossRef]
  102. Lapietra, I.; Lisco, S.N.; Milli, S.; Moretti, M. Sediment provenance of a bioclastic carbonate pocket beach—Le Dune (Ionian Sea, South Italy). J. Palaeogeogr. 2022, 11, 238–255. [Google Scholar] [CrossRef]
Figure 1. (a) Geographical location of a few sandy beaches (yellow circle) characterizing the Apulian littoral stretch. The white arrows indicate the general alongshore current influencing the sediment transport on the Adriatic and the Ionian Sea; (bd) Macroscopic features variability of the Apulian beach sands in terms of color and grain size (modified from [20]).
Jmse 10 01949 g001
Figure 2. Coastal features of Torre Guaceto and Le Dune beach. (a) Geographical location of the study areas (orange star); (b) satellite image of Torre Guaceto beach showing a landward well developed dune belt; (c) satellite image of Le Dune beach showing a large, urbanized area on the southernmost sector and a developed dune environment on the northwestern sector.
Jmse 10 01949 g002
Figure 3. (a) Map showing the sampling collecting points. D = shoreline sample label, BD = foredune base sample, TA-1 = Sample collected along transect A at 1 m depth; (b) Ideal submerged beach profile (not in scale) with the indication of the sampling depths; (c) collection of shoreface samples; (d) small net for marine samples; (e) whiteboard for sample marine marks.
Jmse 10 01949 g003
Figure 4. Example of a grain-size analysis using Gradistat© (v8).
Jmse 10 01949 g004
Figure 5. Example of hybrid sand composition analysis; (a) sand analysis at the microscope; (b) sample spread on a rigid base with the field locations; (c) field for counting method; (d) example of counting for sand classification, green: bioclasts, yellow: carbonate lithoclasts; red: quartz.
Jmse 10 01949 g005
Figure 6. Example of bioclast evaluation procedure; (a) sample bioclast separation with a set of tweezers; (b) isolated bioclasts in test tubes; (c) bioclast classification.
Jmse 10 01949 g006
Figure 7. Flow chart of the processing steps followed in the application of Delft3D software.
Jmse 10 01949 g007
Figure 8. Emerged beach topography investigation. (a) TLS Riegl VZ-400 instrument during a survey campaign; (b) Example of a point cloud during a scan registration with Riscan Pro software: the red point represents the instrument location during the measurement acquisition; (c) Digital elevation model (DEM) of the emerged sector in summer 2018 processed with ArcMap© 10.1.
Jmse 10 01949 g008
Figure 9. Example of OTS field surveys during winter 2018/19. (a) OTS instrument with the reflective system (prism) for bathymetric point measurement; (b) map showing the bathymetric transect location; (c) bathymetric profiles extrapolated from the measurement carried out in winter 2018/19.
Jmse 10 01949 g009
Figure 10. GPR procedure example. (a) 200 MHz antenna during a GPR field survey; (b) map showing the location of the measurement transect; (c) example of a radar stratigraphy section deriving from the measurement path A1–A2 by the use of 400 MHz antenna.
Jmse 10 01949 g010
Figure 11. SBP field survey and data processing. (a) SBP transducer during the data acquisition; (b) hardware system and laptops for data monitoring; (c) map showing the navigation path; (d) 2-dimensional stratigraphic cross sections data processing.
Jmse 10 01949 g011
Figure 12. Example of ERT field survey. (a) Graphite electrodes positioning; (b) instrument for sending current into the ground; (c) map showing the ERT transect location; (d) resistivity model.
Jmse 10 01949 g012
Figure 13. Example of emerged beach sector analysis. (a) Comparison between DTM investigation and Delft3D Model; (b) bioclast analysis and (c) mean size investigation for longshore sediment distribution.
Jmse 10 01949 g013
Figure 14. Gathering the main results for beach dynamics investigation. (a) Petrographical features; (b) sand texture of the bioclastic beach sand; (c) wave height distribution; (d) beach dynamics sketch scheme (modified from [102]).
Jmse 10 01949 g014
Figure 15. Example of beach profile with bedrock location deriving from the merging of GPR + ERT + SBP results. The orange dot line in the map depicts the investigation gap. Within the resistivity model and the GPR profile, the distance axis has been exaggerated for a higher result resolution. As ERT and GPR measurements were performed along the same transect of the emerged beach sector, the figures were overlapped to compare the same bedrock location extrapolated from both models. The yellow area between the ground surface/sea bottom and the bedrock represents the beach sand sediments.
Jmse 10 01949 g015
Table 1. Techniques for beach monitoring applied in the different sectors of the Earth Sciences. Each color represents a scientific sector with the relative authors. GPR: Ground Penetrating Radar, SSS: Side Scan Sonar; SBP: Sub Bottom Profiler. Geomorphology [44,45,46,47,48,49,50,51,52,53]; Sedimentology [54,55,56,57,58,59,60,61]; Sedimentology + Biology [17,27,62,63,64,65,66,67,68,69,70]; Geophysics [71,72,73,74,75,76,77,78,79,80,81,82].
Scientific SectorAuthorMethodology
GeomorphologyCiavola et al., 2003Shoreline variation
through aerial photos
Gracia et al., 2005
Costas et al., 2006
Pranzini, 2008
Anfuso et al., 2011
Nordstrom et al., 2015
Karkani et al., 2017
Thom and Hall, 1991
Almeida et al., 2010Beach profile variations through topographic surveys
Riazi and Tϋrcker, 2017
SedimentologyGao and Collins, 1993Grain size distribution and
sediment trend analysis
Guillen and Palanques, 1996
Dawe, 2001
Poizot et al., 2008
Falk and Ward, 1957
Visher, 1965
Friedman, 1967
Edwards, 2001
Sedimentology + BiologyDe Falco et al., 2002; 2003
Satta et al., 2013
Moretti et al., 2016
Lisco et al., 2017
De Falco et al., 2008
Ecological approach for coastal monitoring
Short et al., 2007
Brandano et al., 2016
Gaglianone et al., 2014;2017
Simeone et al., 2018
Posidonia oceanica monitoring and bioclast evaluation
GeophysicsLeatherman, 1987GPR procedure for emerged beach and dune environment exploration
Bristow et al., 2000
Neal and Roberts, 2000
Neal, 2004
Hugenoltz et al., 2007
Guillemoteau, 2012
Shukla et al., 2013
Bristow and Jol, 2020SSS and SBP for sea bottom and sediment thickness investigation
Morang et al., 1997
Lubis et al., 2017
De Giosa et al., 2019
Kim et al., 2020
Table 2. Methodological proposal for monitoring sandy beaches. Each color represents the methodological steps for beach monitoring.
Potential Procedure
Type of InvestigationMethodBeach SectorResultsInterpretation
Topographic surveysTLS + GPSEmerged beach3D elevation modelMorphological variation
DTM profilesShoreline changes
OTS + GPSShorefaceBathymetric profilesErosion/Accretion
Bathymetry mapBathymetric variation
Hydrodynamic modelDelft3DShoreface + offshoreWave motionSediment transport
Geophysics investigationGPR + GPSEmerged beachRadarstratigraphy sectionBeach profile reconstruction
ERT + GPSEntire beachResistivity modelGPR and SBP connection
SBP + GPSShoreface + offshoreLithostratigraphic sectionsBedrock depth and sediment thickness
Beach sand analysisSampling + GPSEntire beachSand texture Beach dynamics
Grain size analysisTexture lateral variationErosion/Accretion
Sand composition Sand classificationSand provenance
Bioclast evaluation Bioclast classificationBioclast provenance
Publisher’s Note: MDPI stays neutral with regard to jurisdictional claims in published maps and institutional affiliations.

