
Technological Potential Analysis and Vacant Technology Forecasting in Properties and Composition of Low-Sulfur Marine Fuel Oil (VLSFO and ULSFO) Bunkered in Key World Ports

 , ,
, ,
Abstract
:1. Introduction
- seven grades of distillate fuel–DMX, DMA, DMZ, DMB, DFA, DFZ, DFB;
- eleven grades of residual fuel–RMA 10, RMB 30, RMD 80, RME 180, RMG 180, RMG 380, RMG 500, RMG 700, RMK 380, RMK 500, RMK 700.
2. Marine Fuel Quality Indicator Analysis
2.1. Methodology
- -
- Asia: Singapore, Hong Kong;
- -
- Western Europe: Amsterdam, Antwerp, Rotterdam;
- -
- North America: Corpus Christi, Davant, Freeport, Gola, Pascagoula, Campeche;
- -
- Middle East: Abu Dhabi, Dubai, Fujairah, Jabal Ali, Khor Fakkan, Hamriya, Sharjah;
- -
- Russia: Kozmino, Murmansk, Nakhodka, Novorossiysk, Primorsk, St. Petersburg, Tuapse, Vanino, Vladivostok, Vostochny, Vysotsk, Port Bronka.
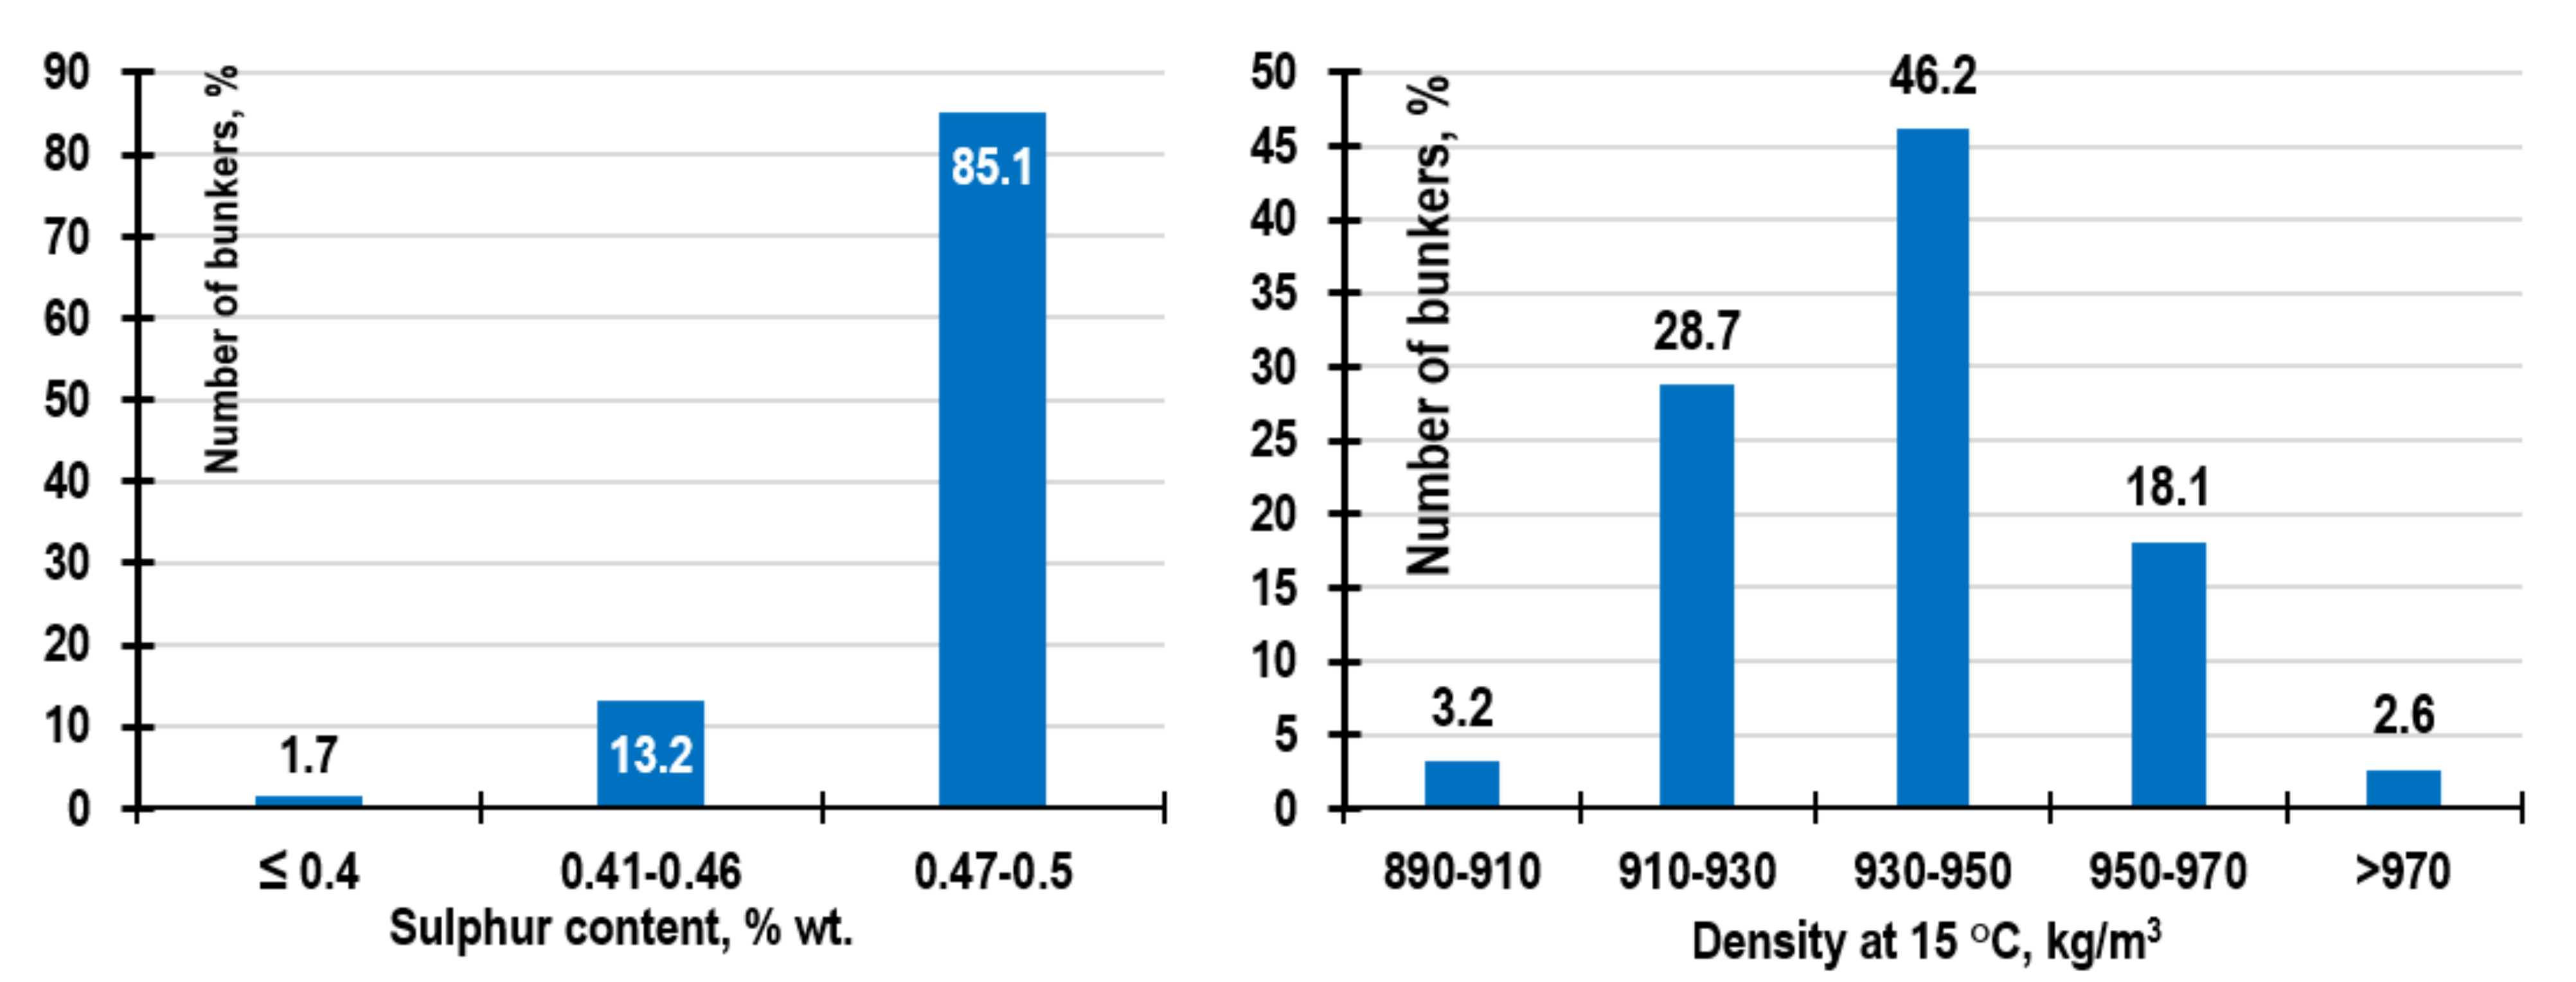
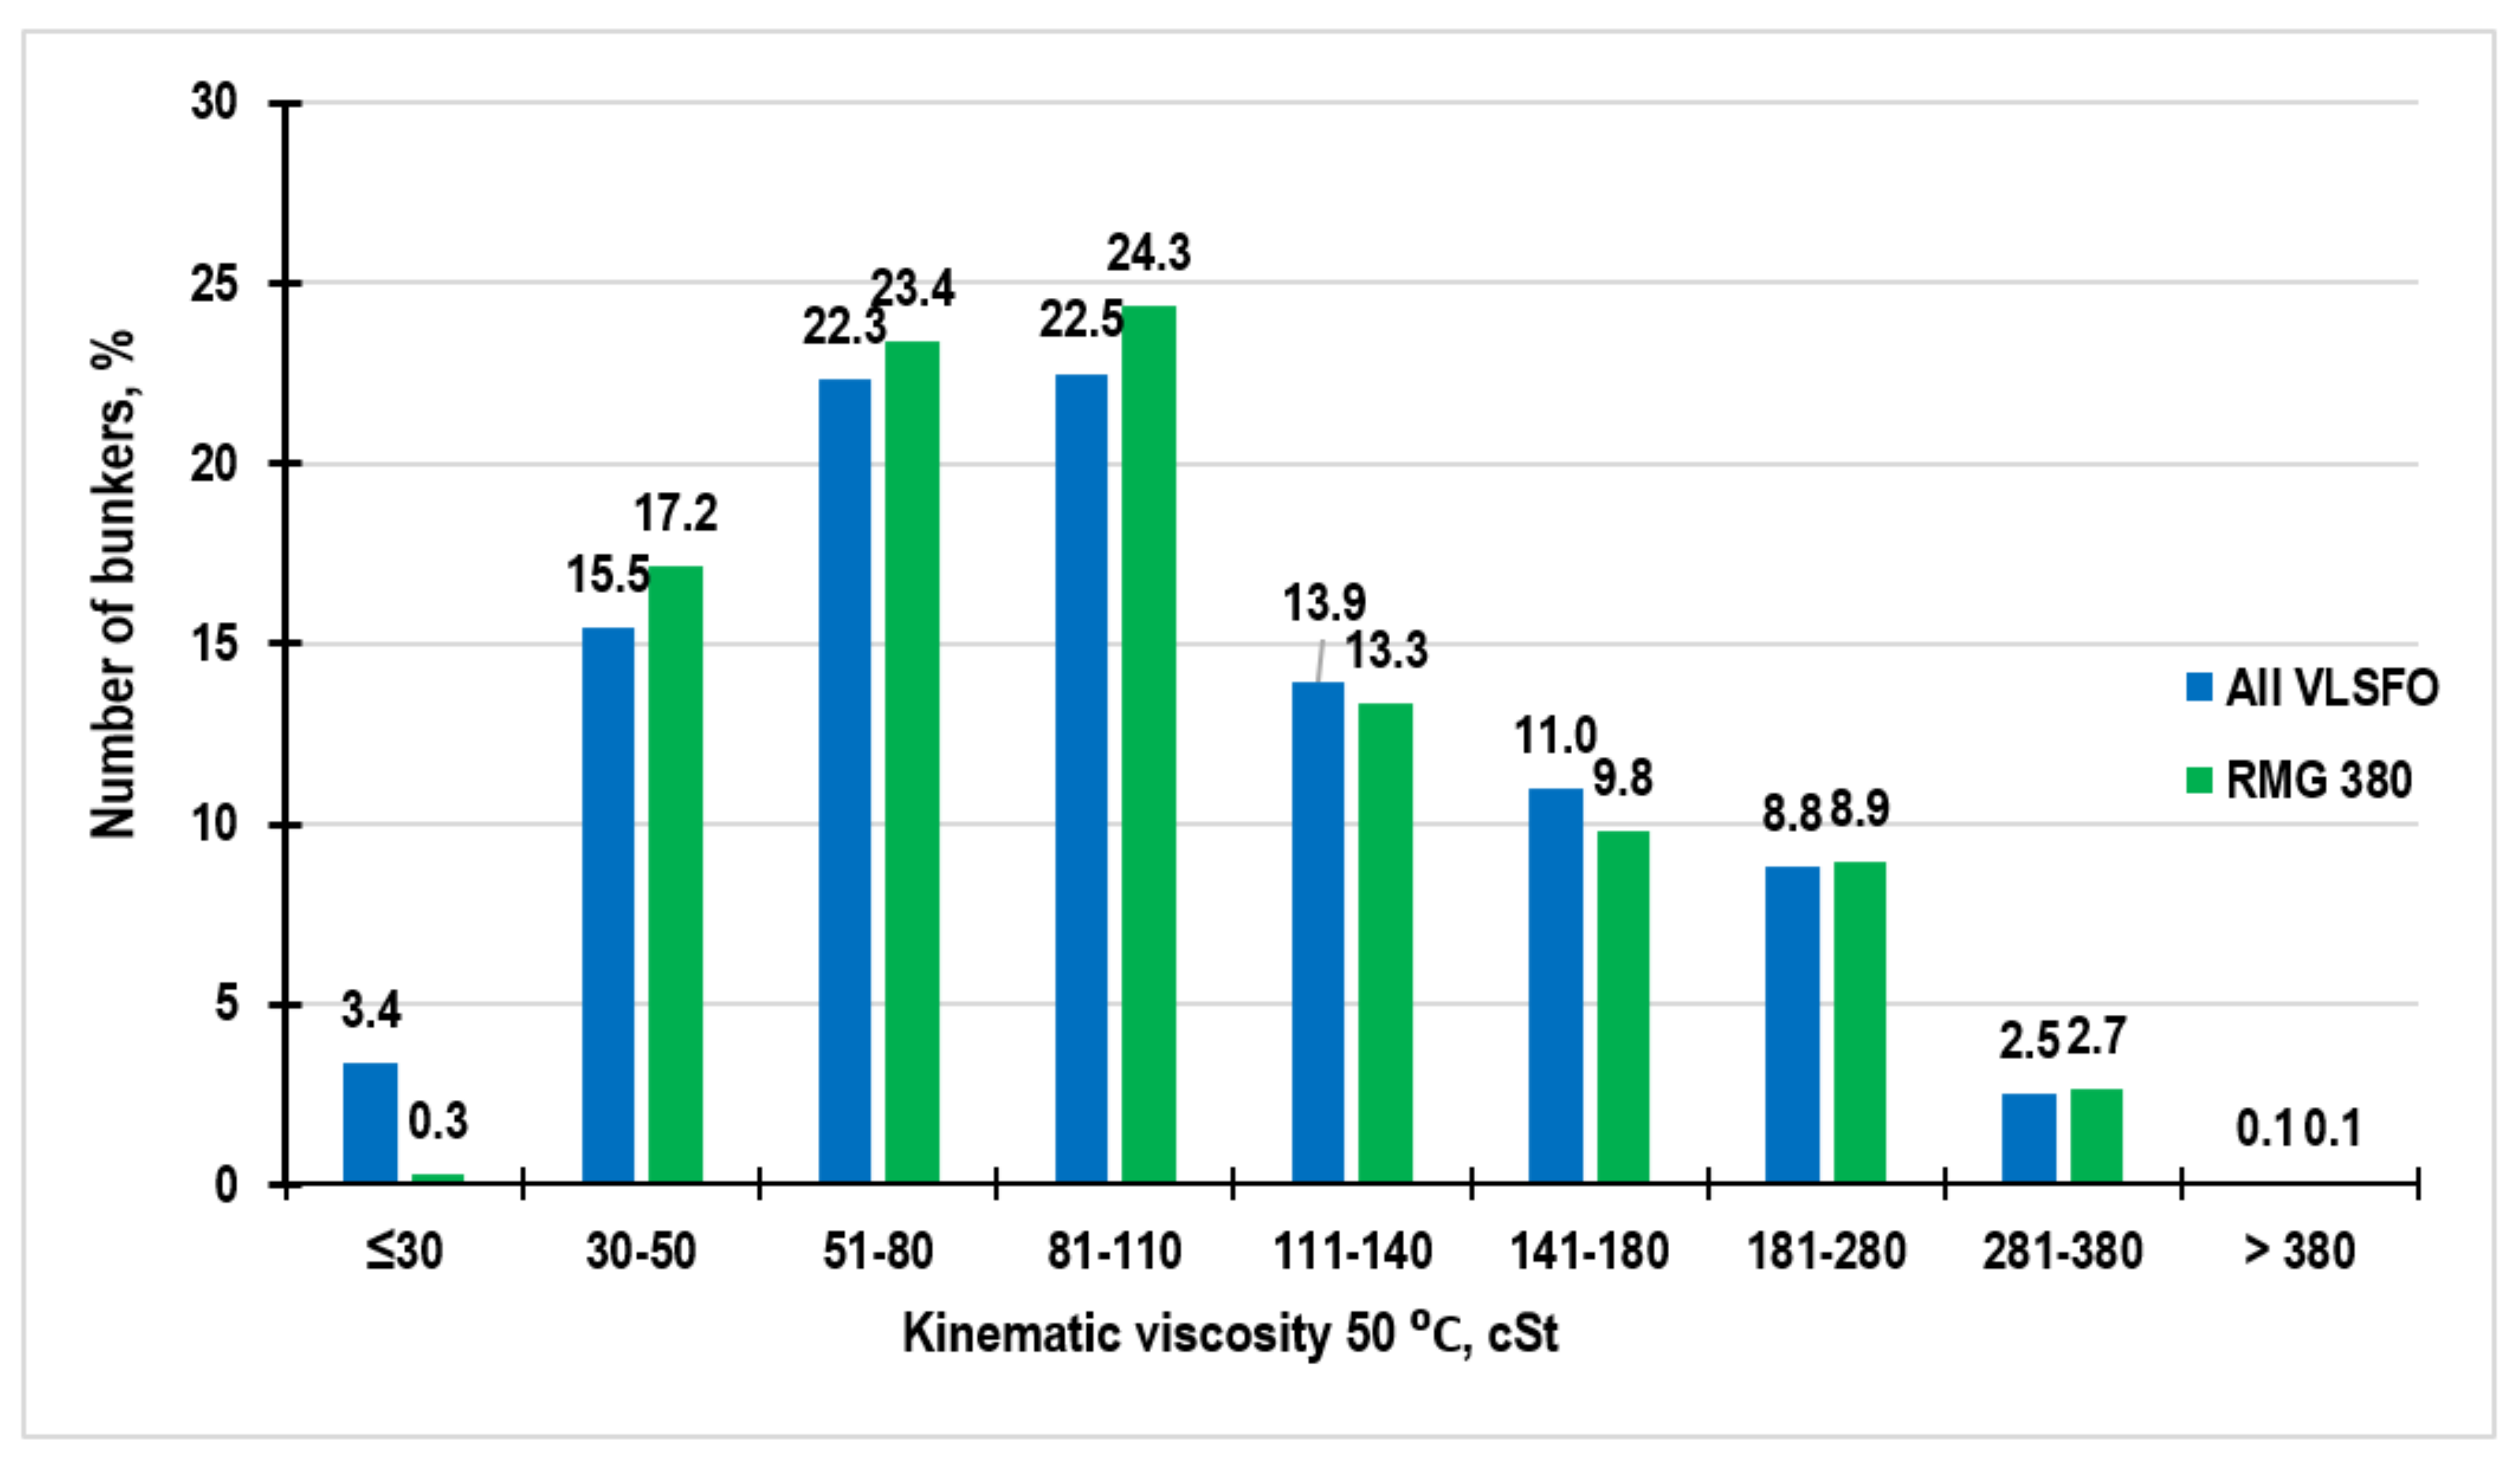
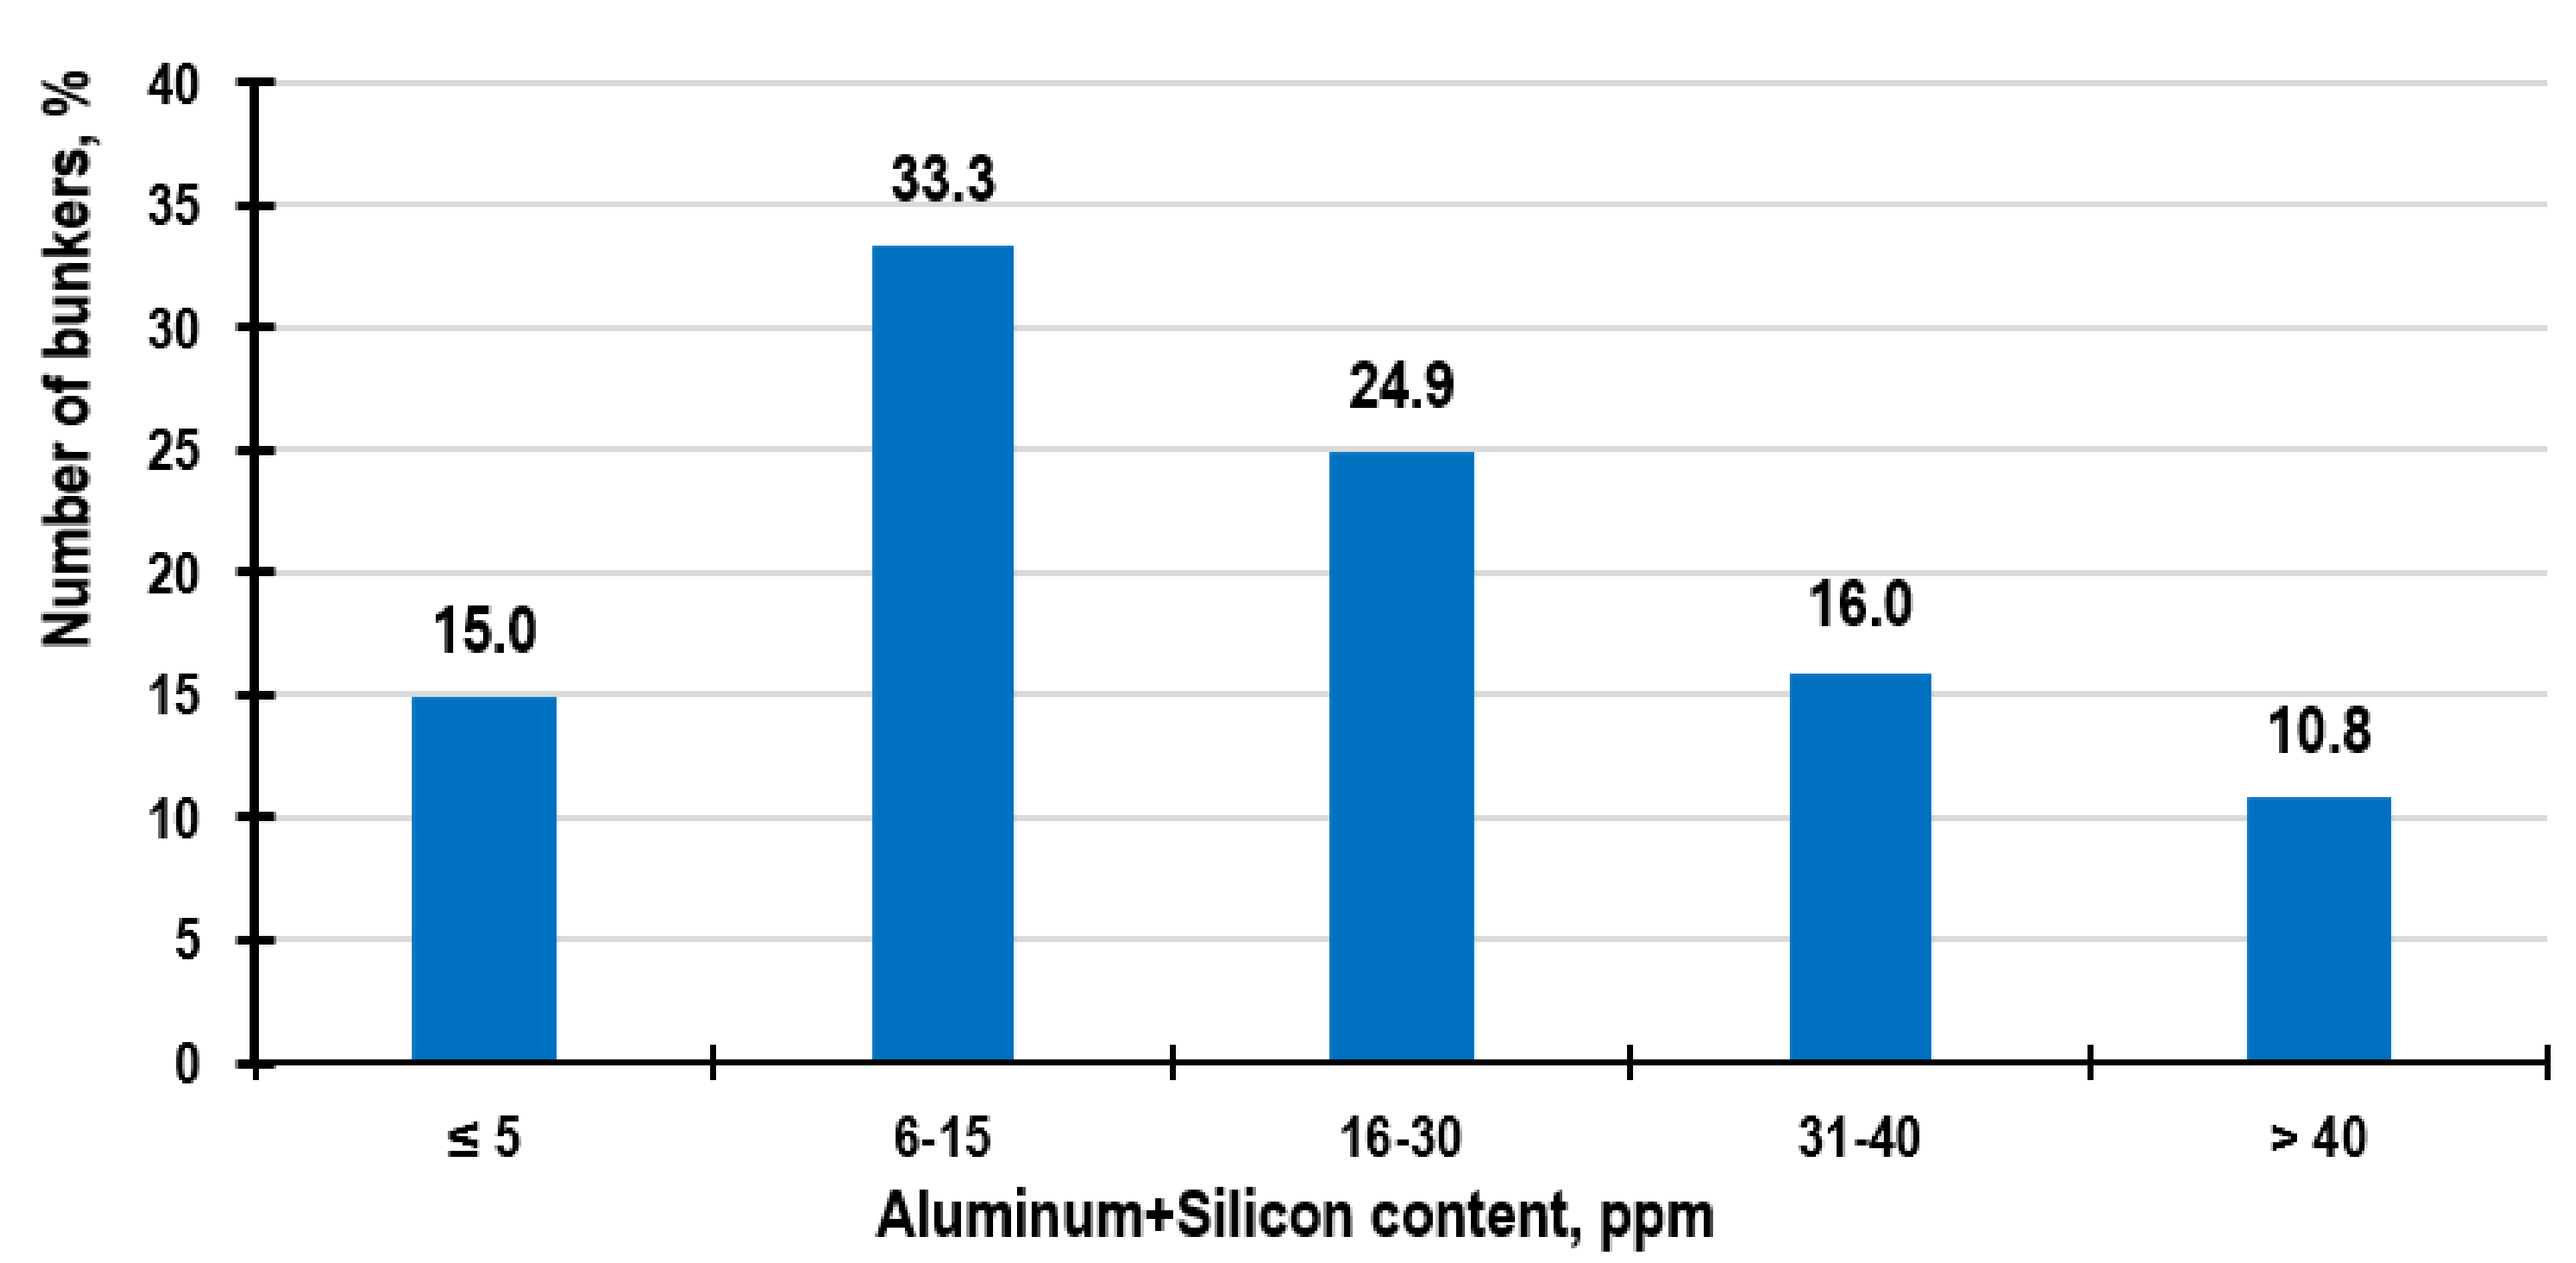
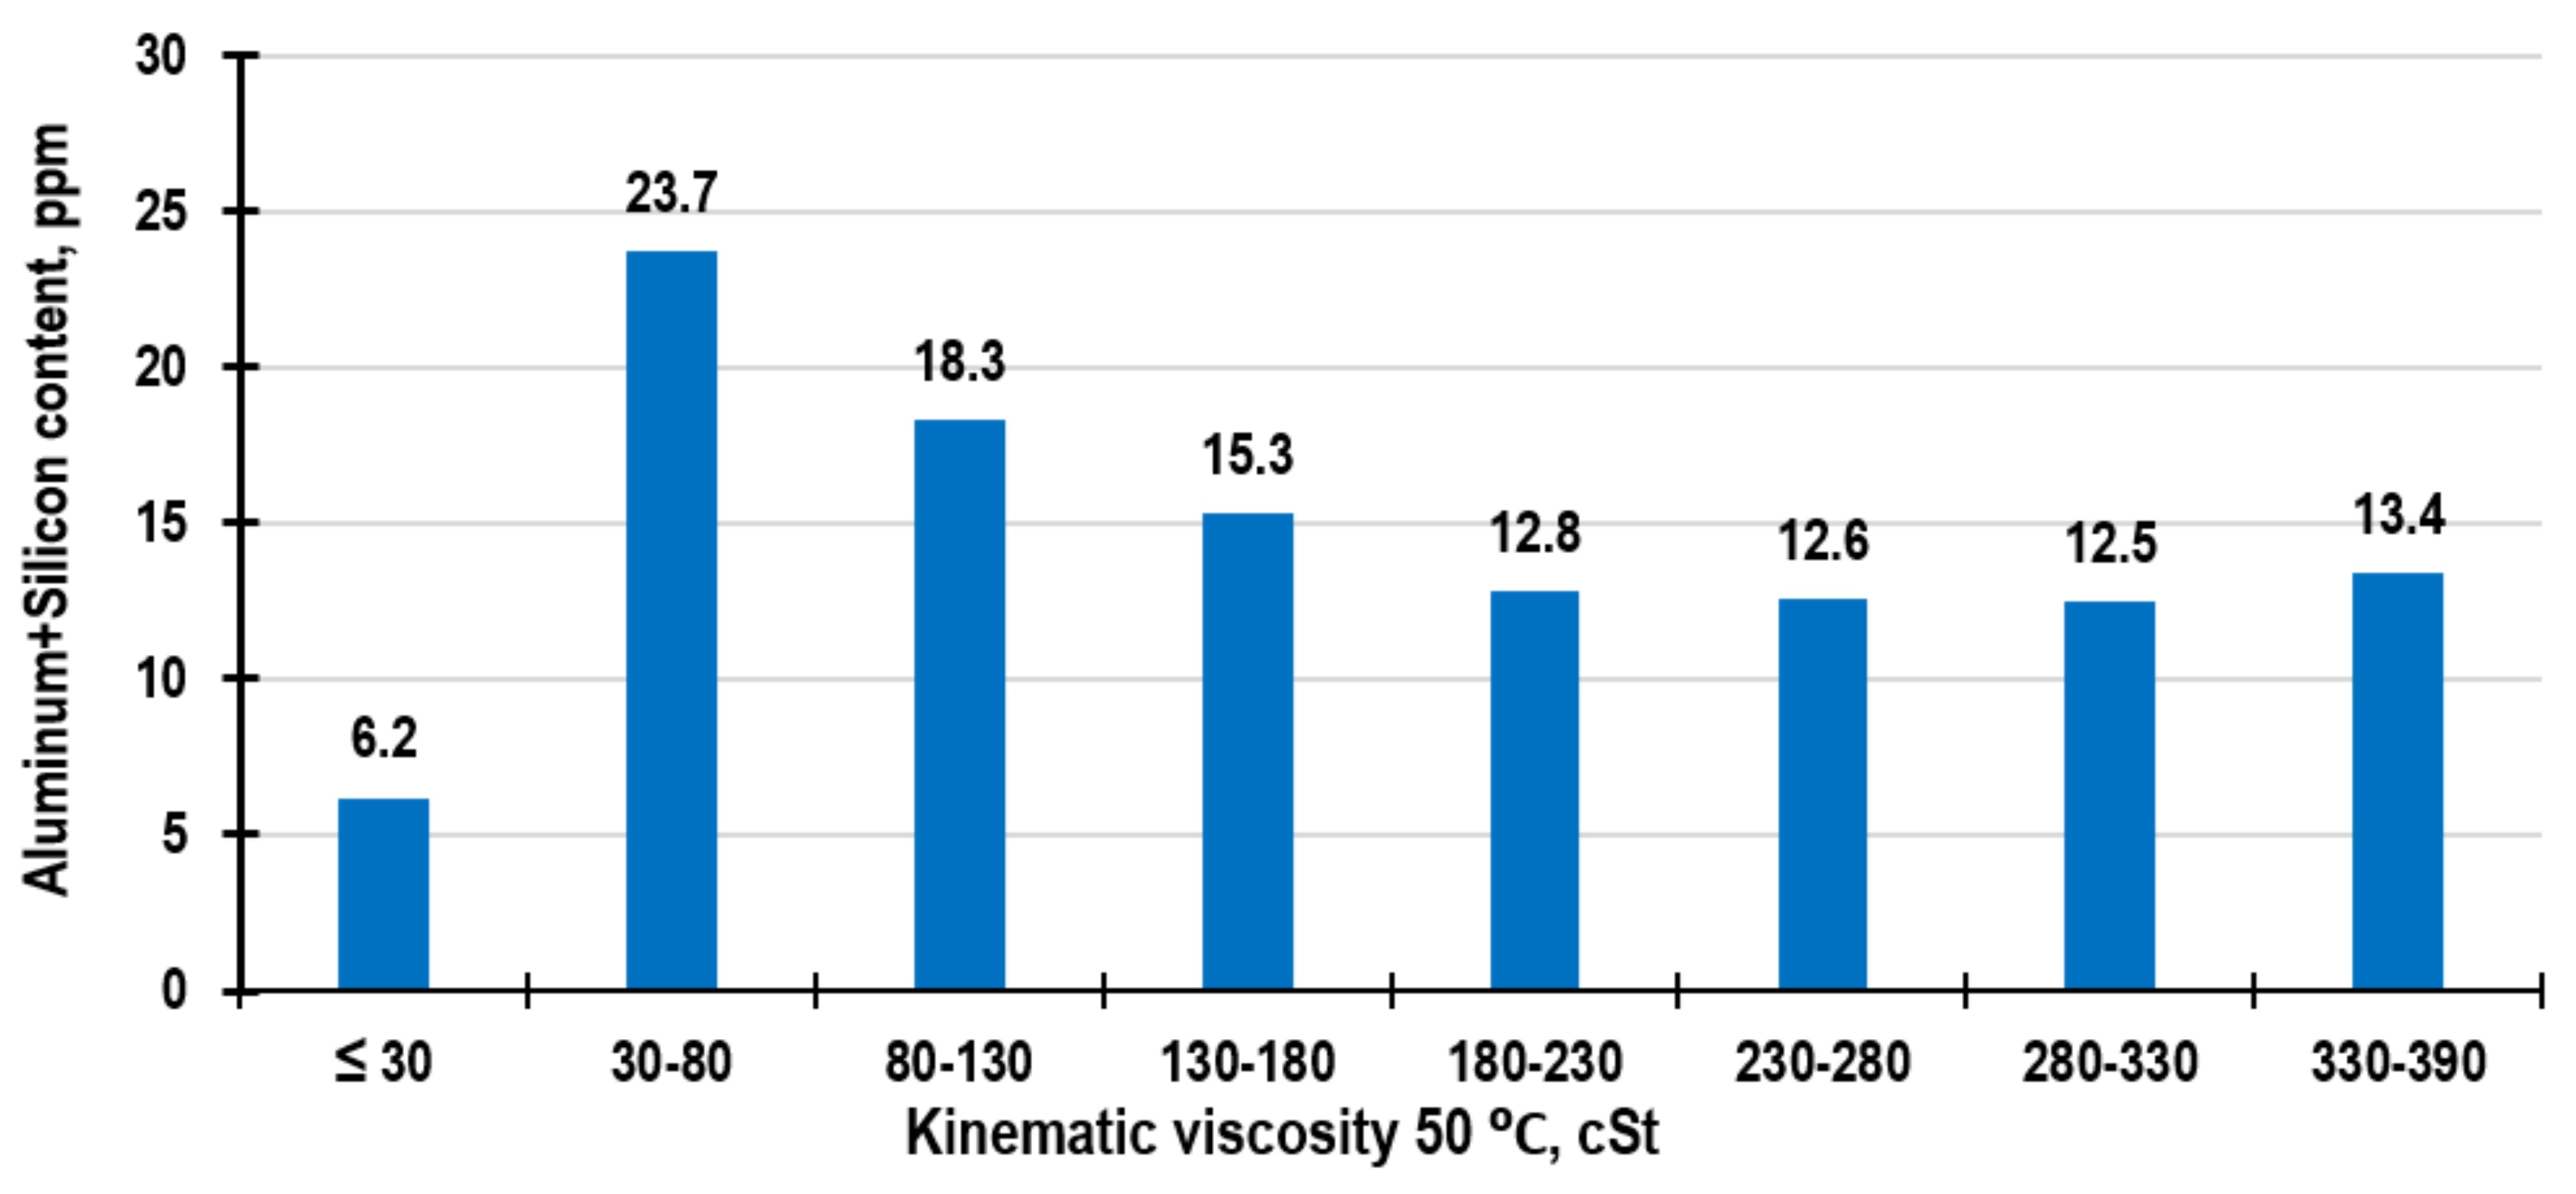
2.2. VLSFO Quality Analysis
2.3. Analysis of ULSFO Quality Indicators
3. Analysis of Actual Marine Fuel Compositions
- -
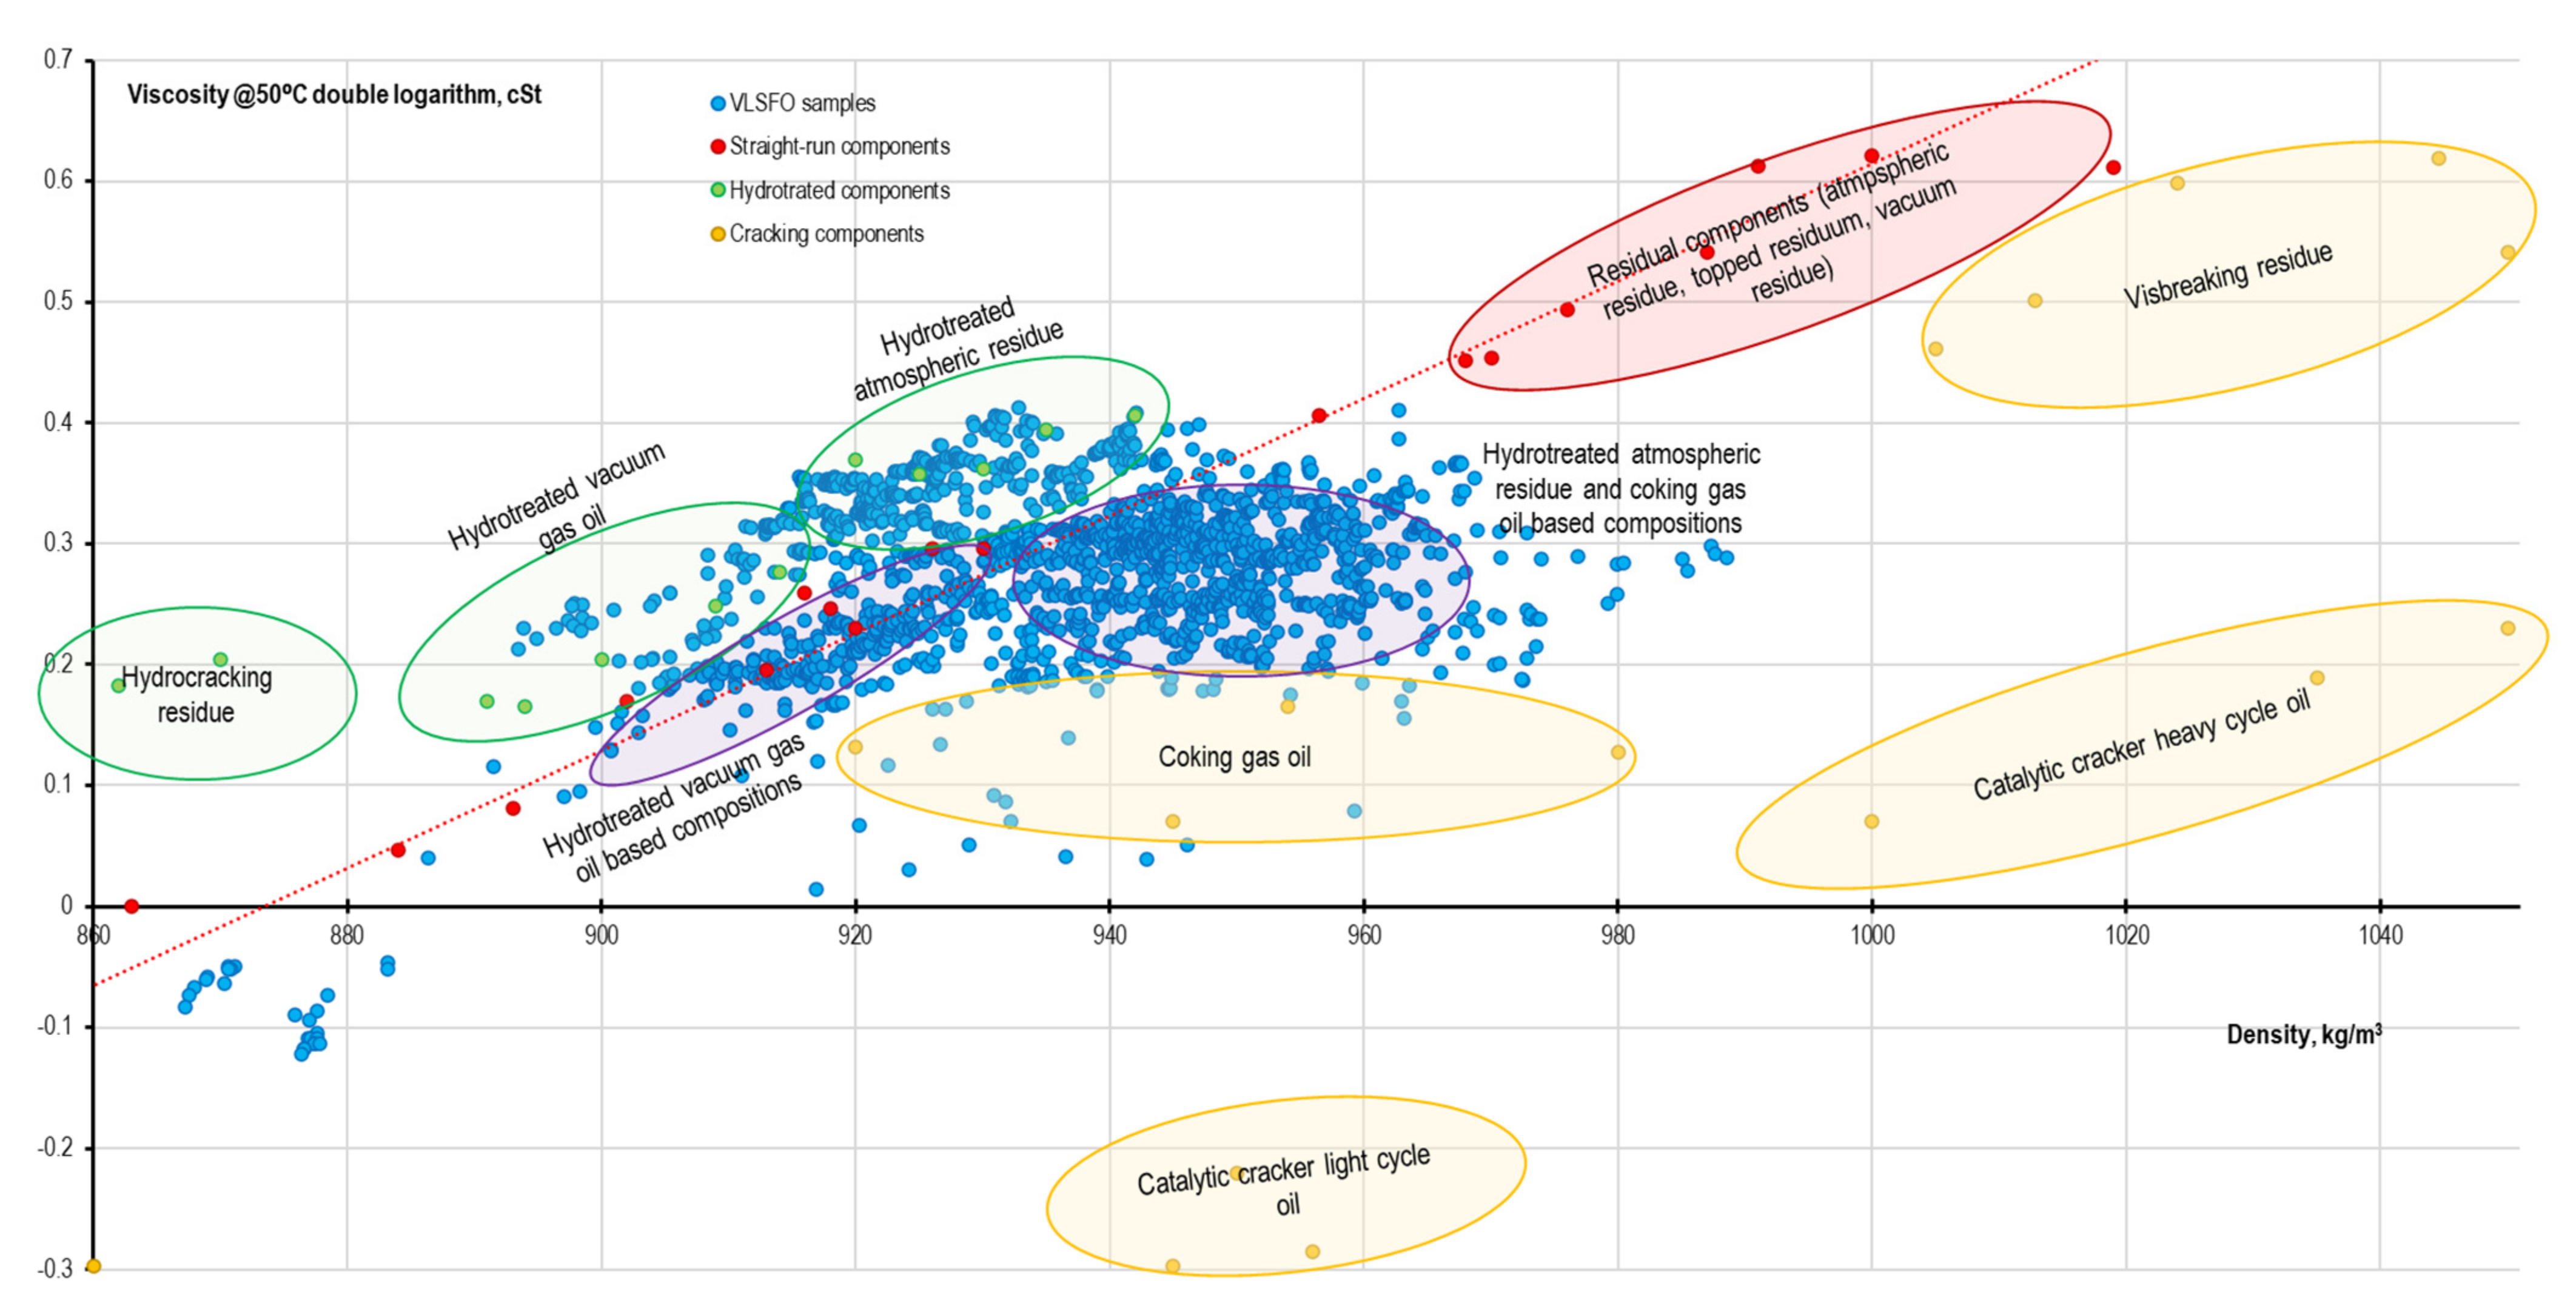
- density, viscosity, and sulfur content are the most important indicators of marine fuel, for which there are simple and fairly accurate calculation methods for the entire composition with known characteristics of individual parts and the values of which are well covered in the literature for key mixed components of marine fuels;
- -
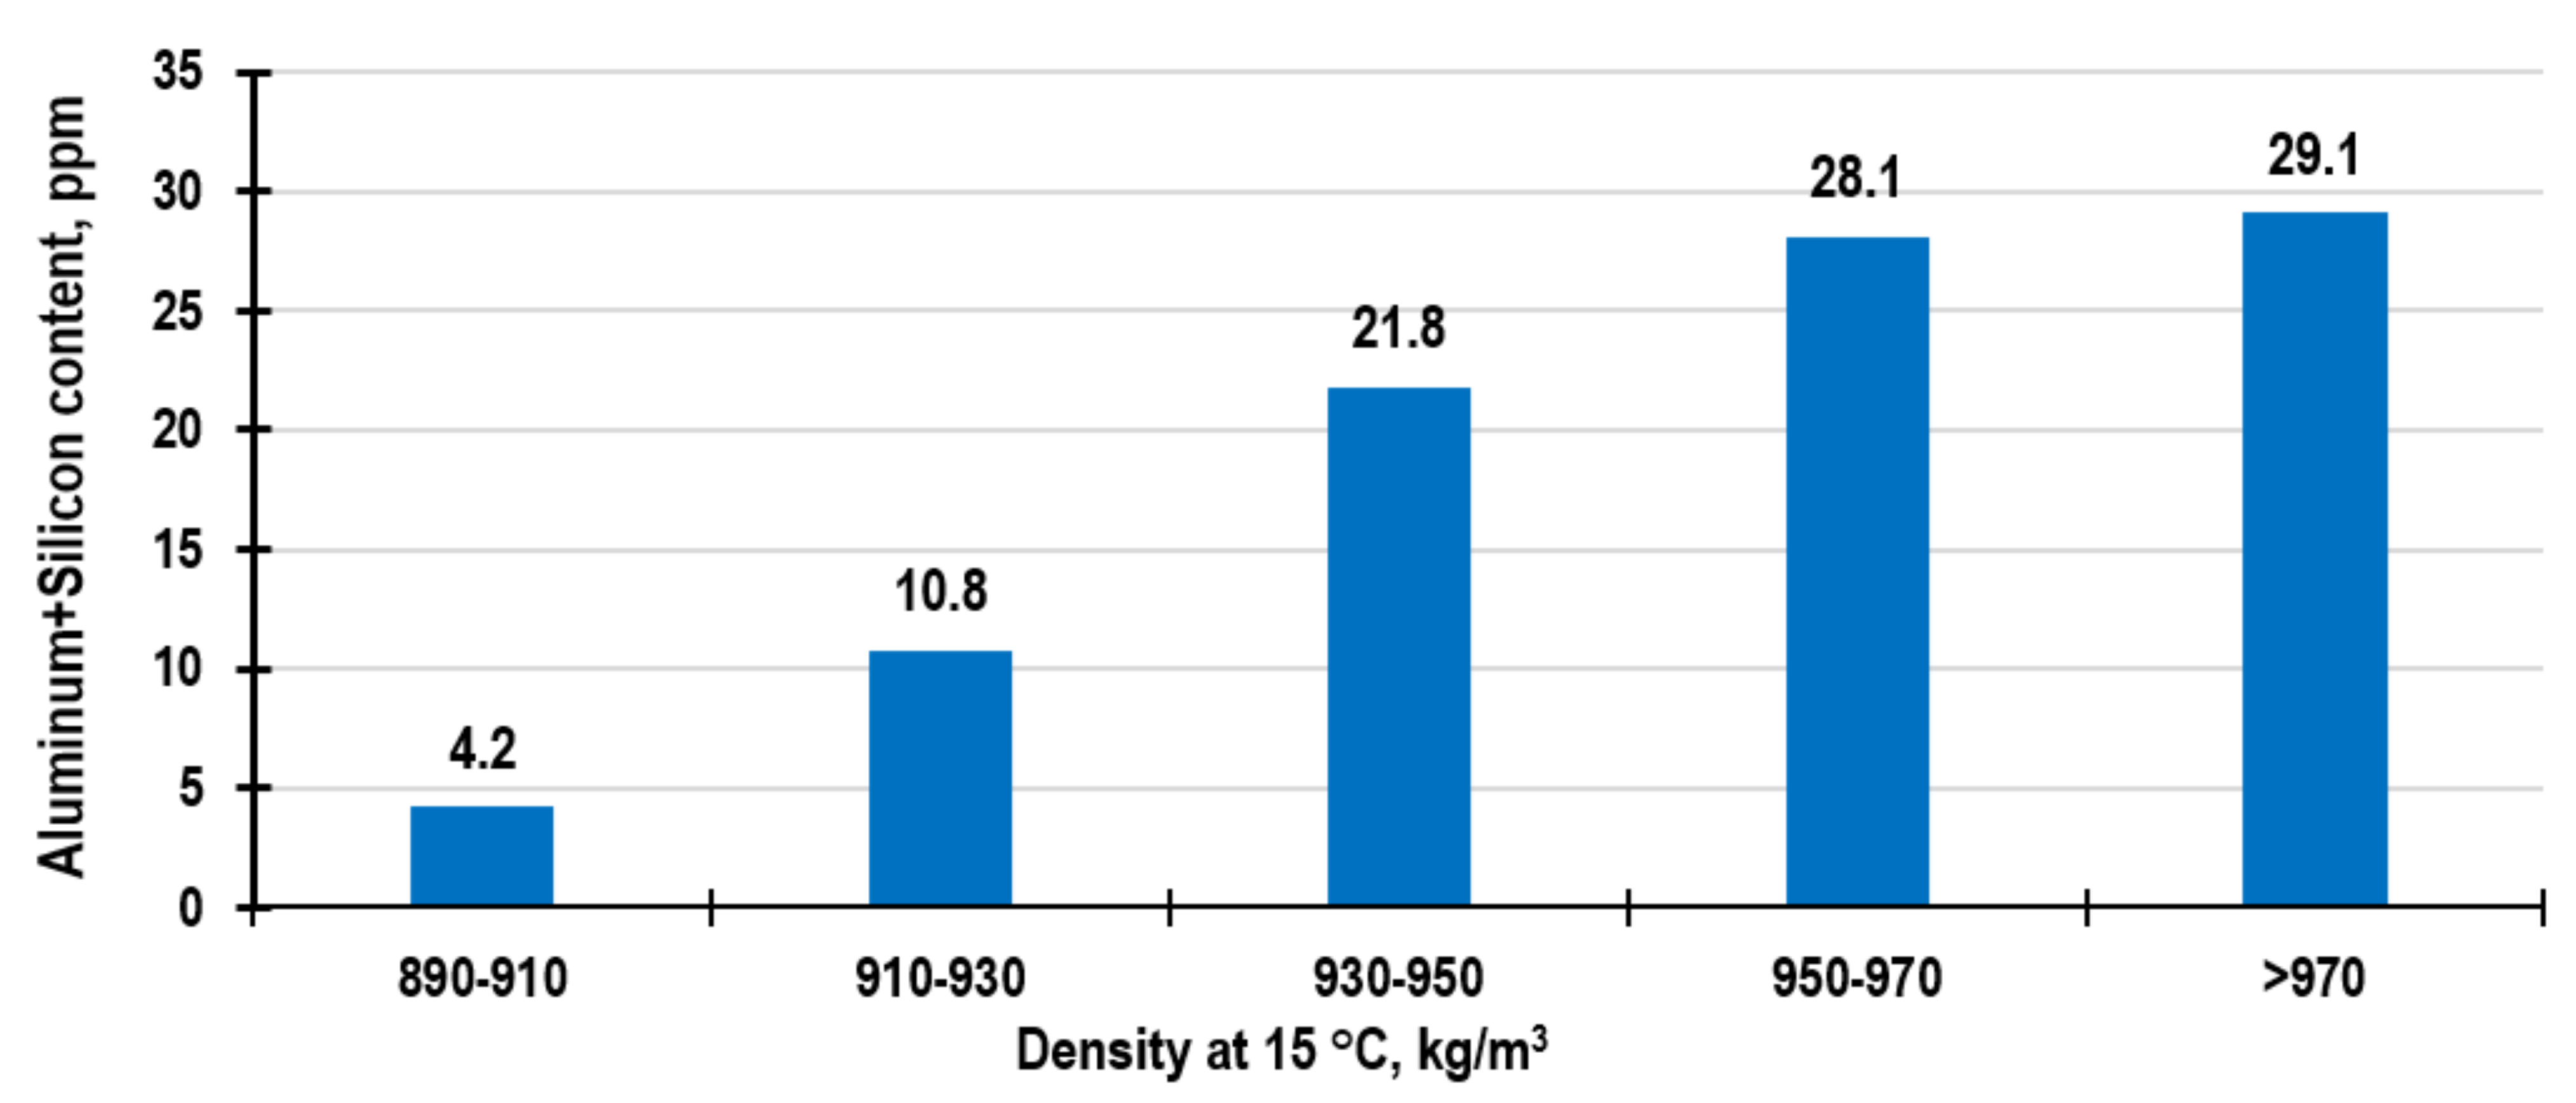
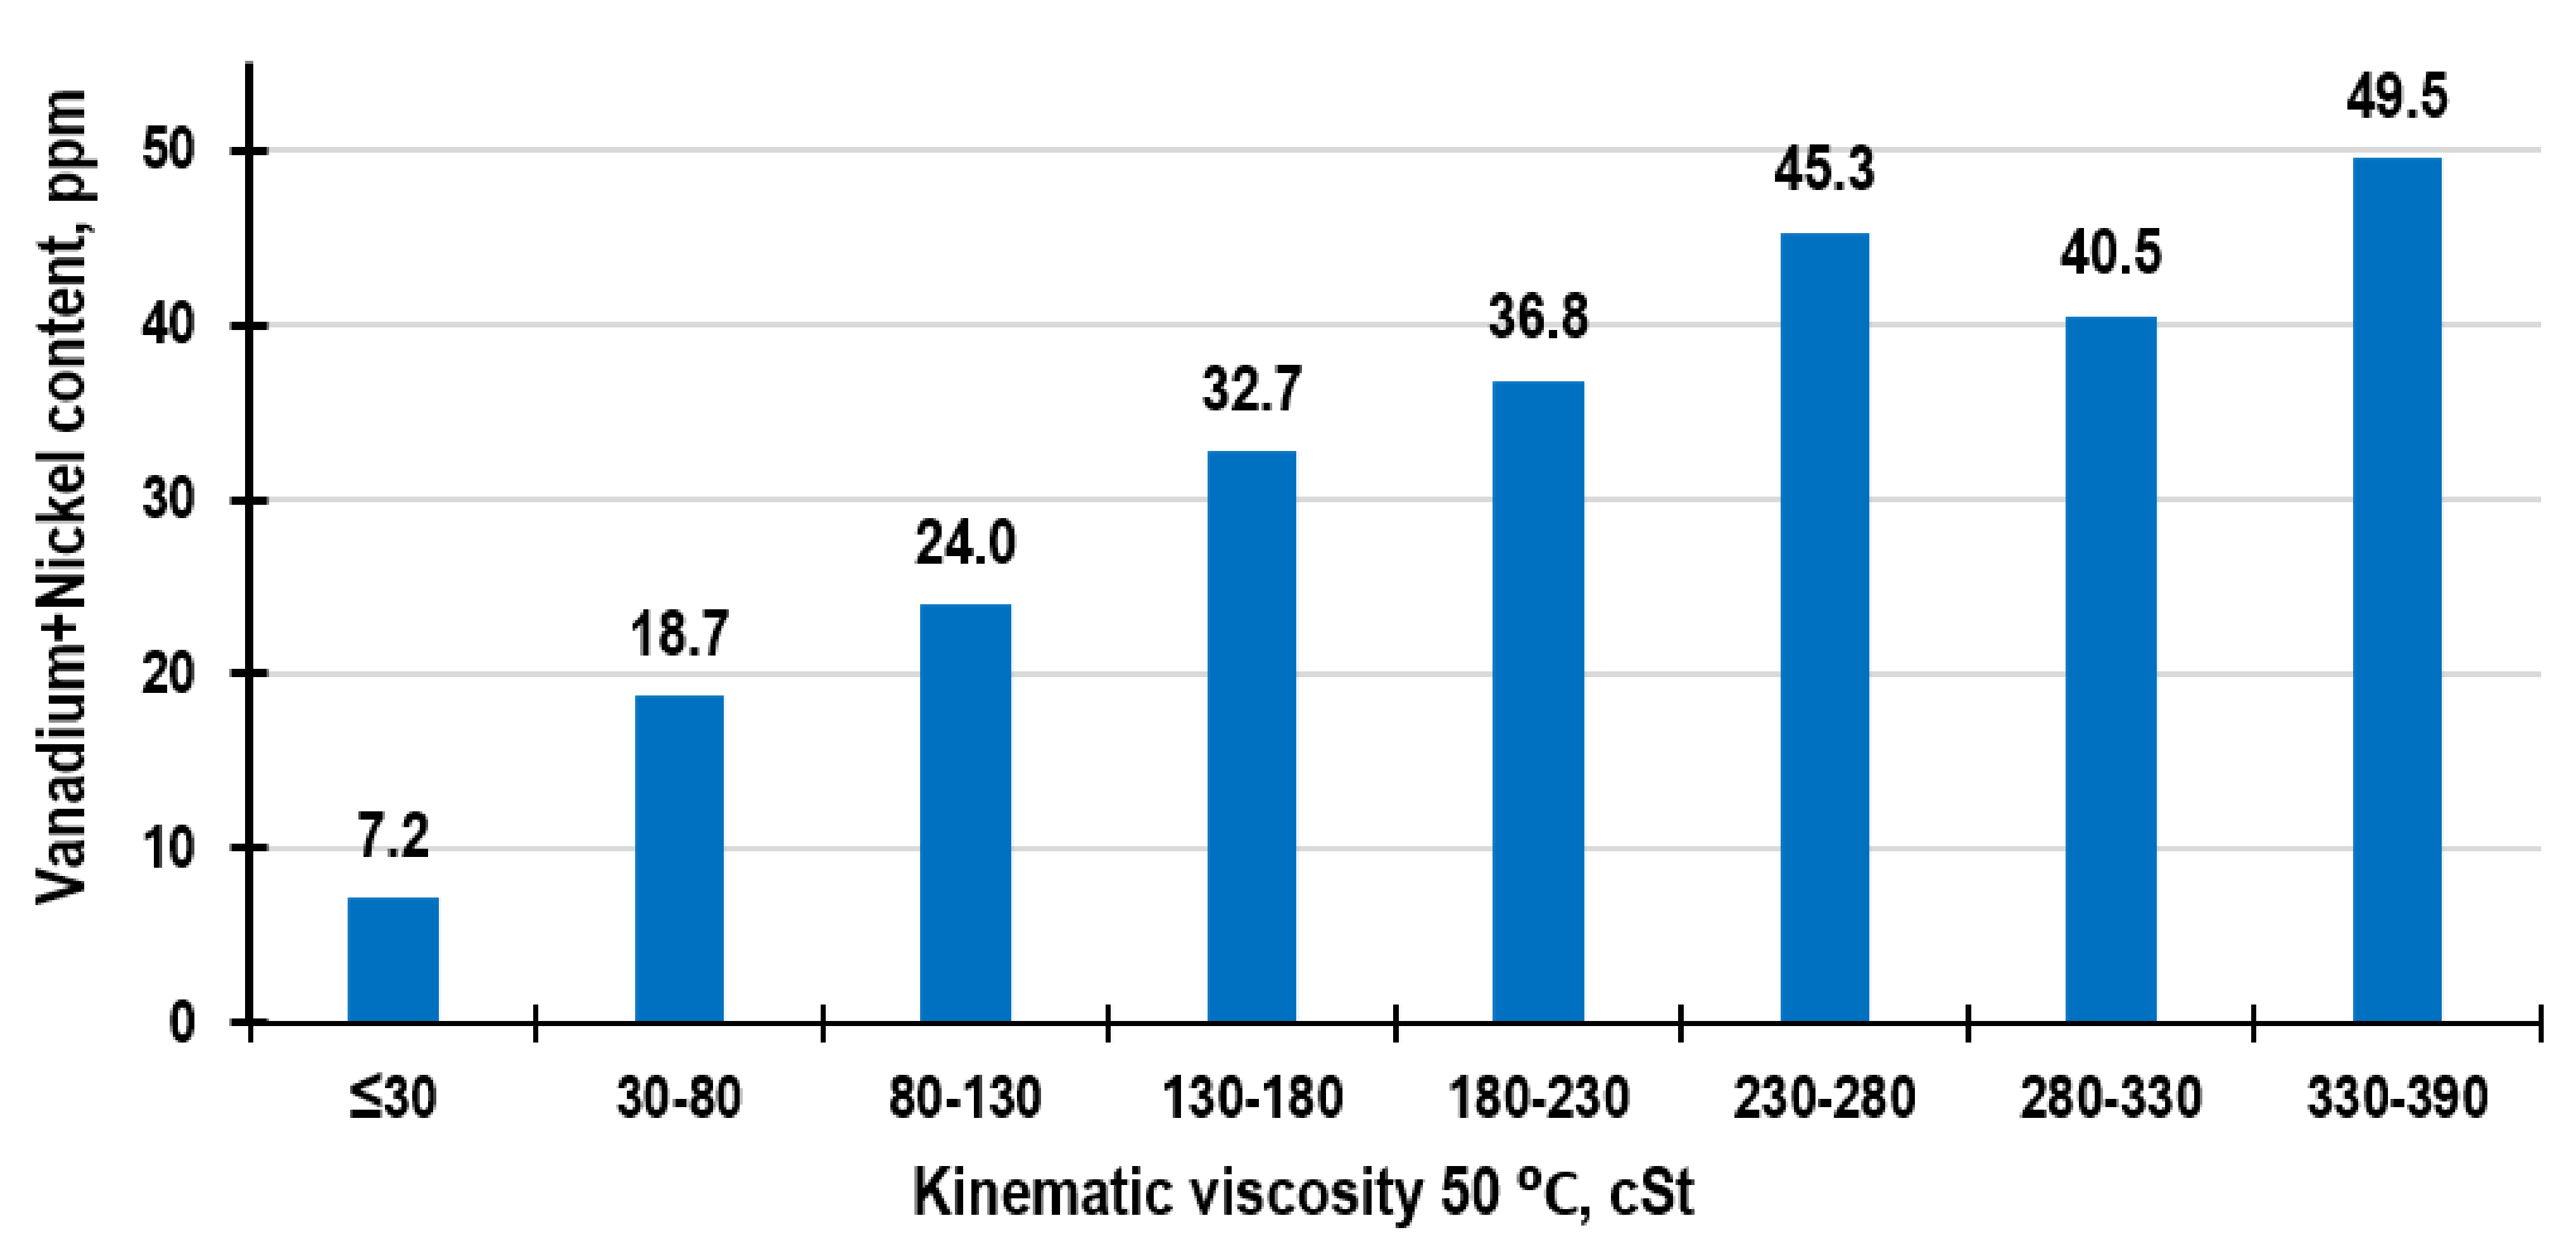
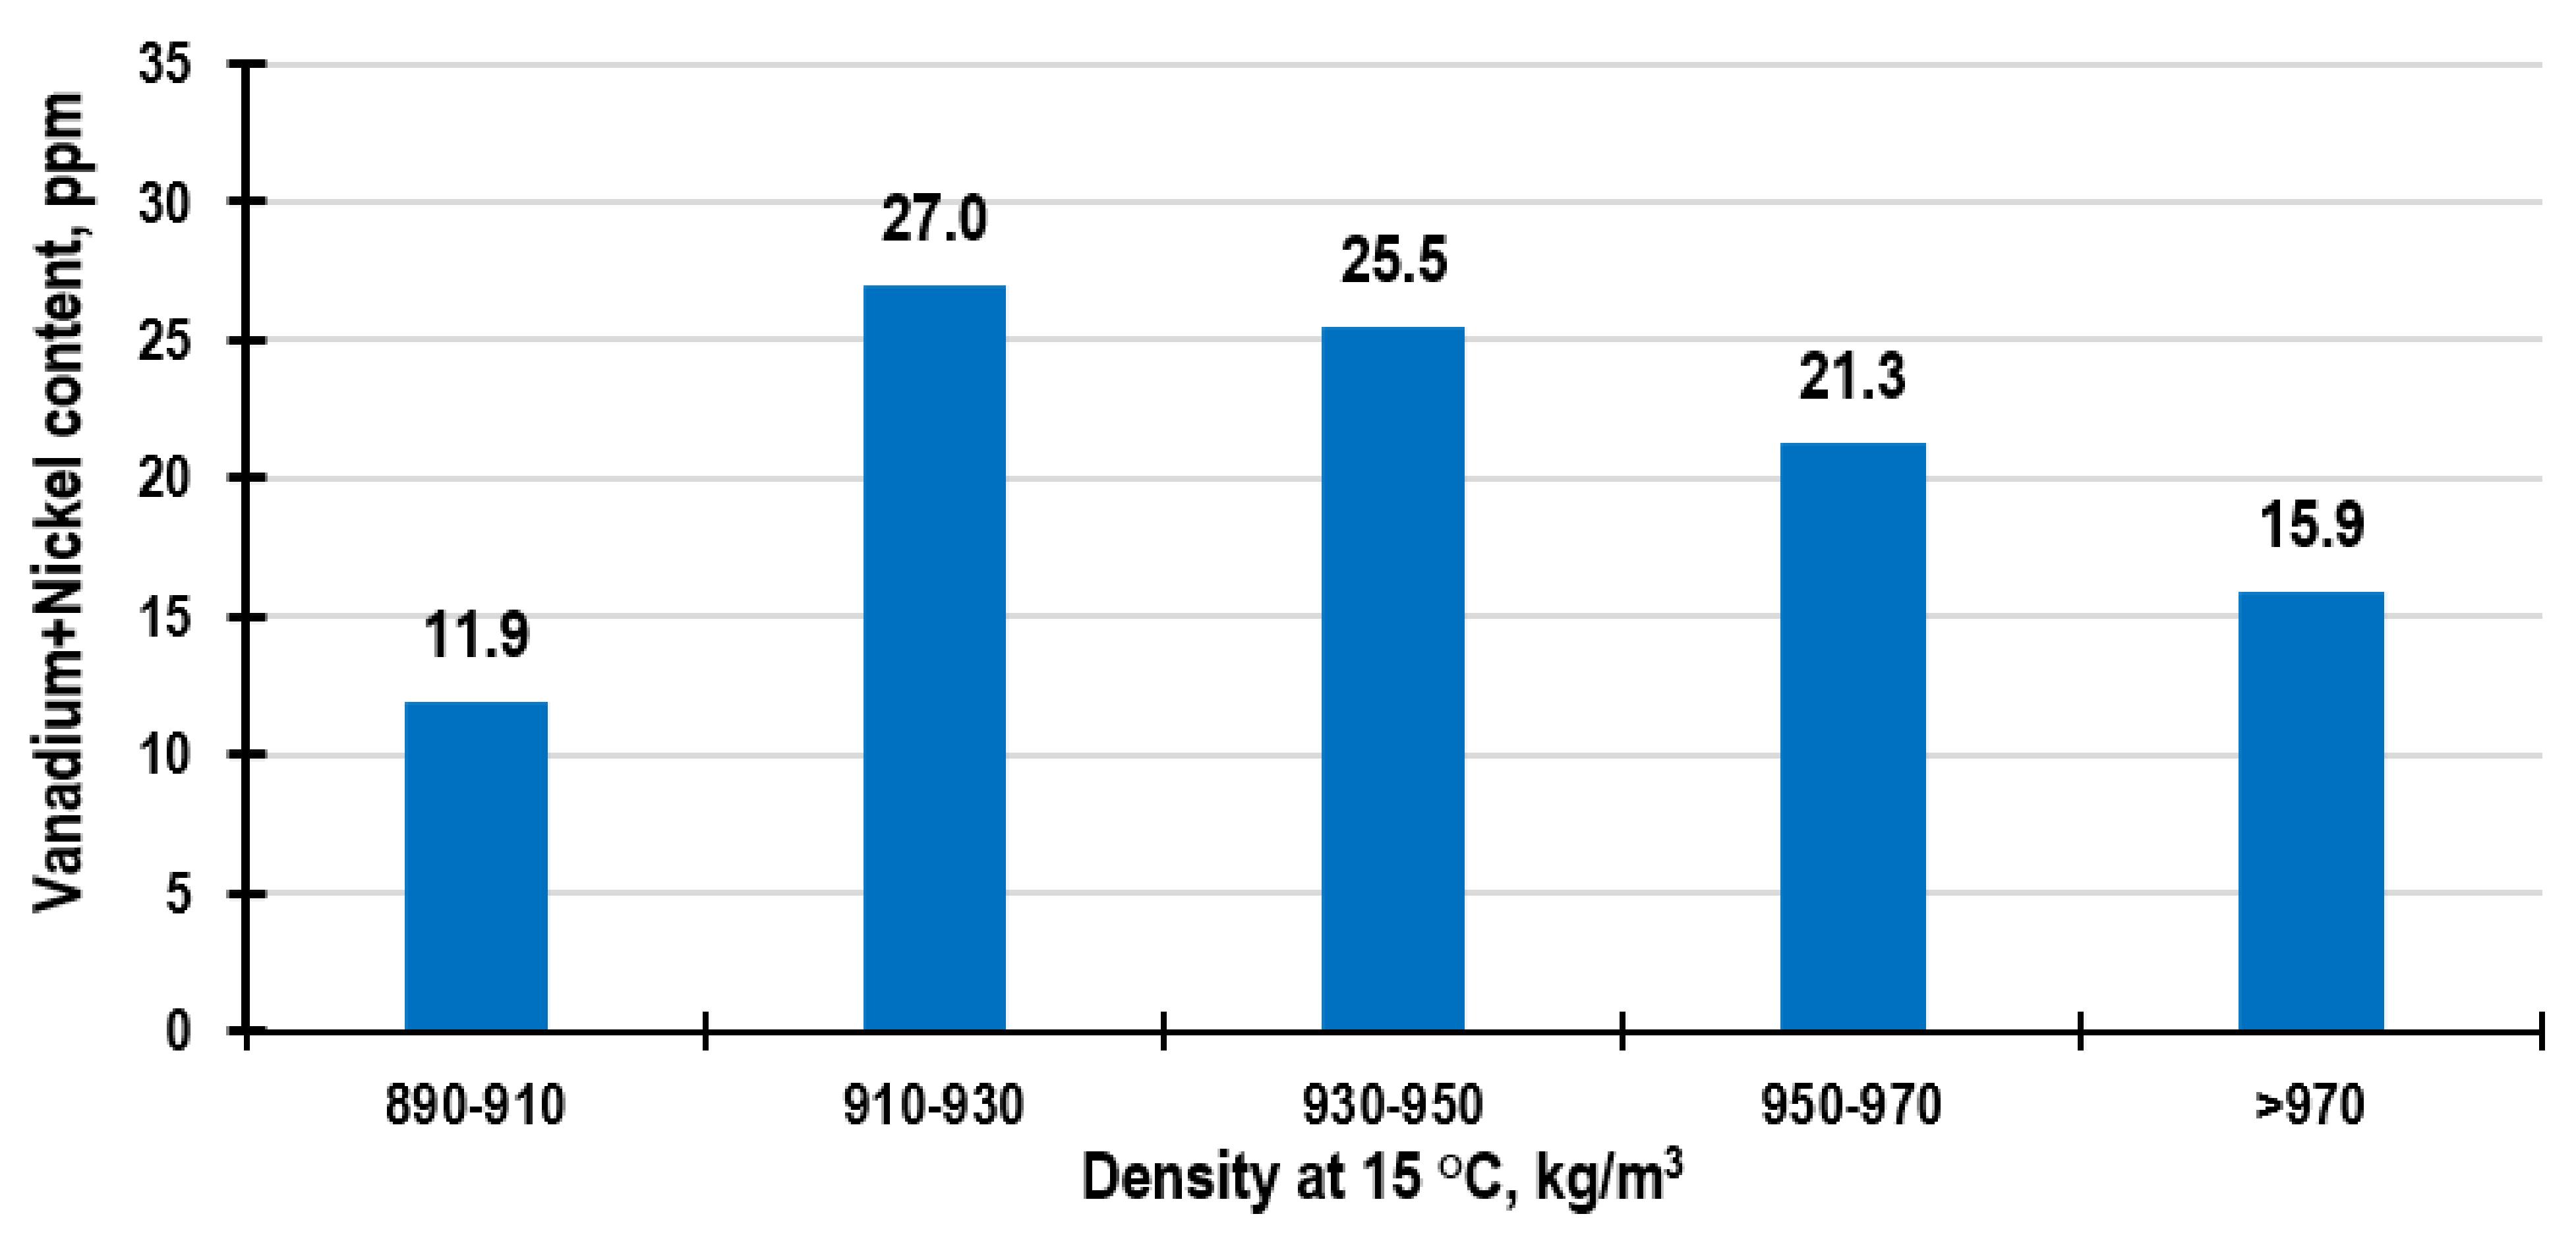
- the content of vanadium, nickel, aluminum, and silicon–these indicators cannot be used to accurately quantify the content of certain mixed components in fuels, but they serve as markers to determine the presence of individual fractions. Namely, the content of vanadium and nickel can be used to distinguish fuels that include residual components, while the sum of aluminum and silicon can help identify the presence of mixtures of HCO in the composition.
- Components with higher density relative to viscosity.
- Components with lower density relative to viscosity.

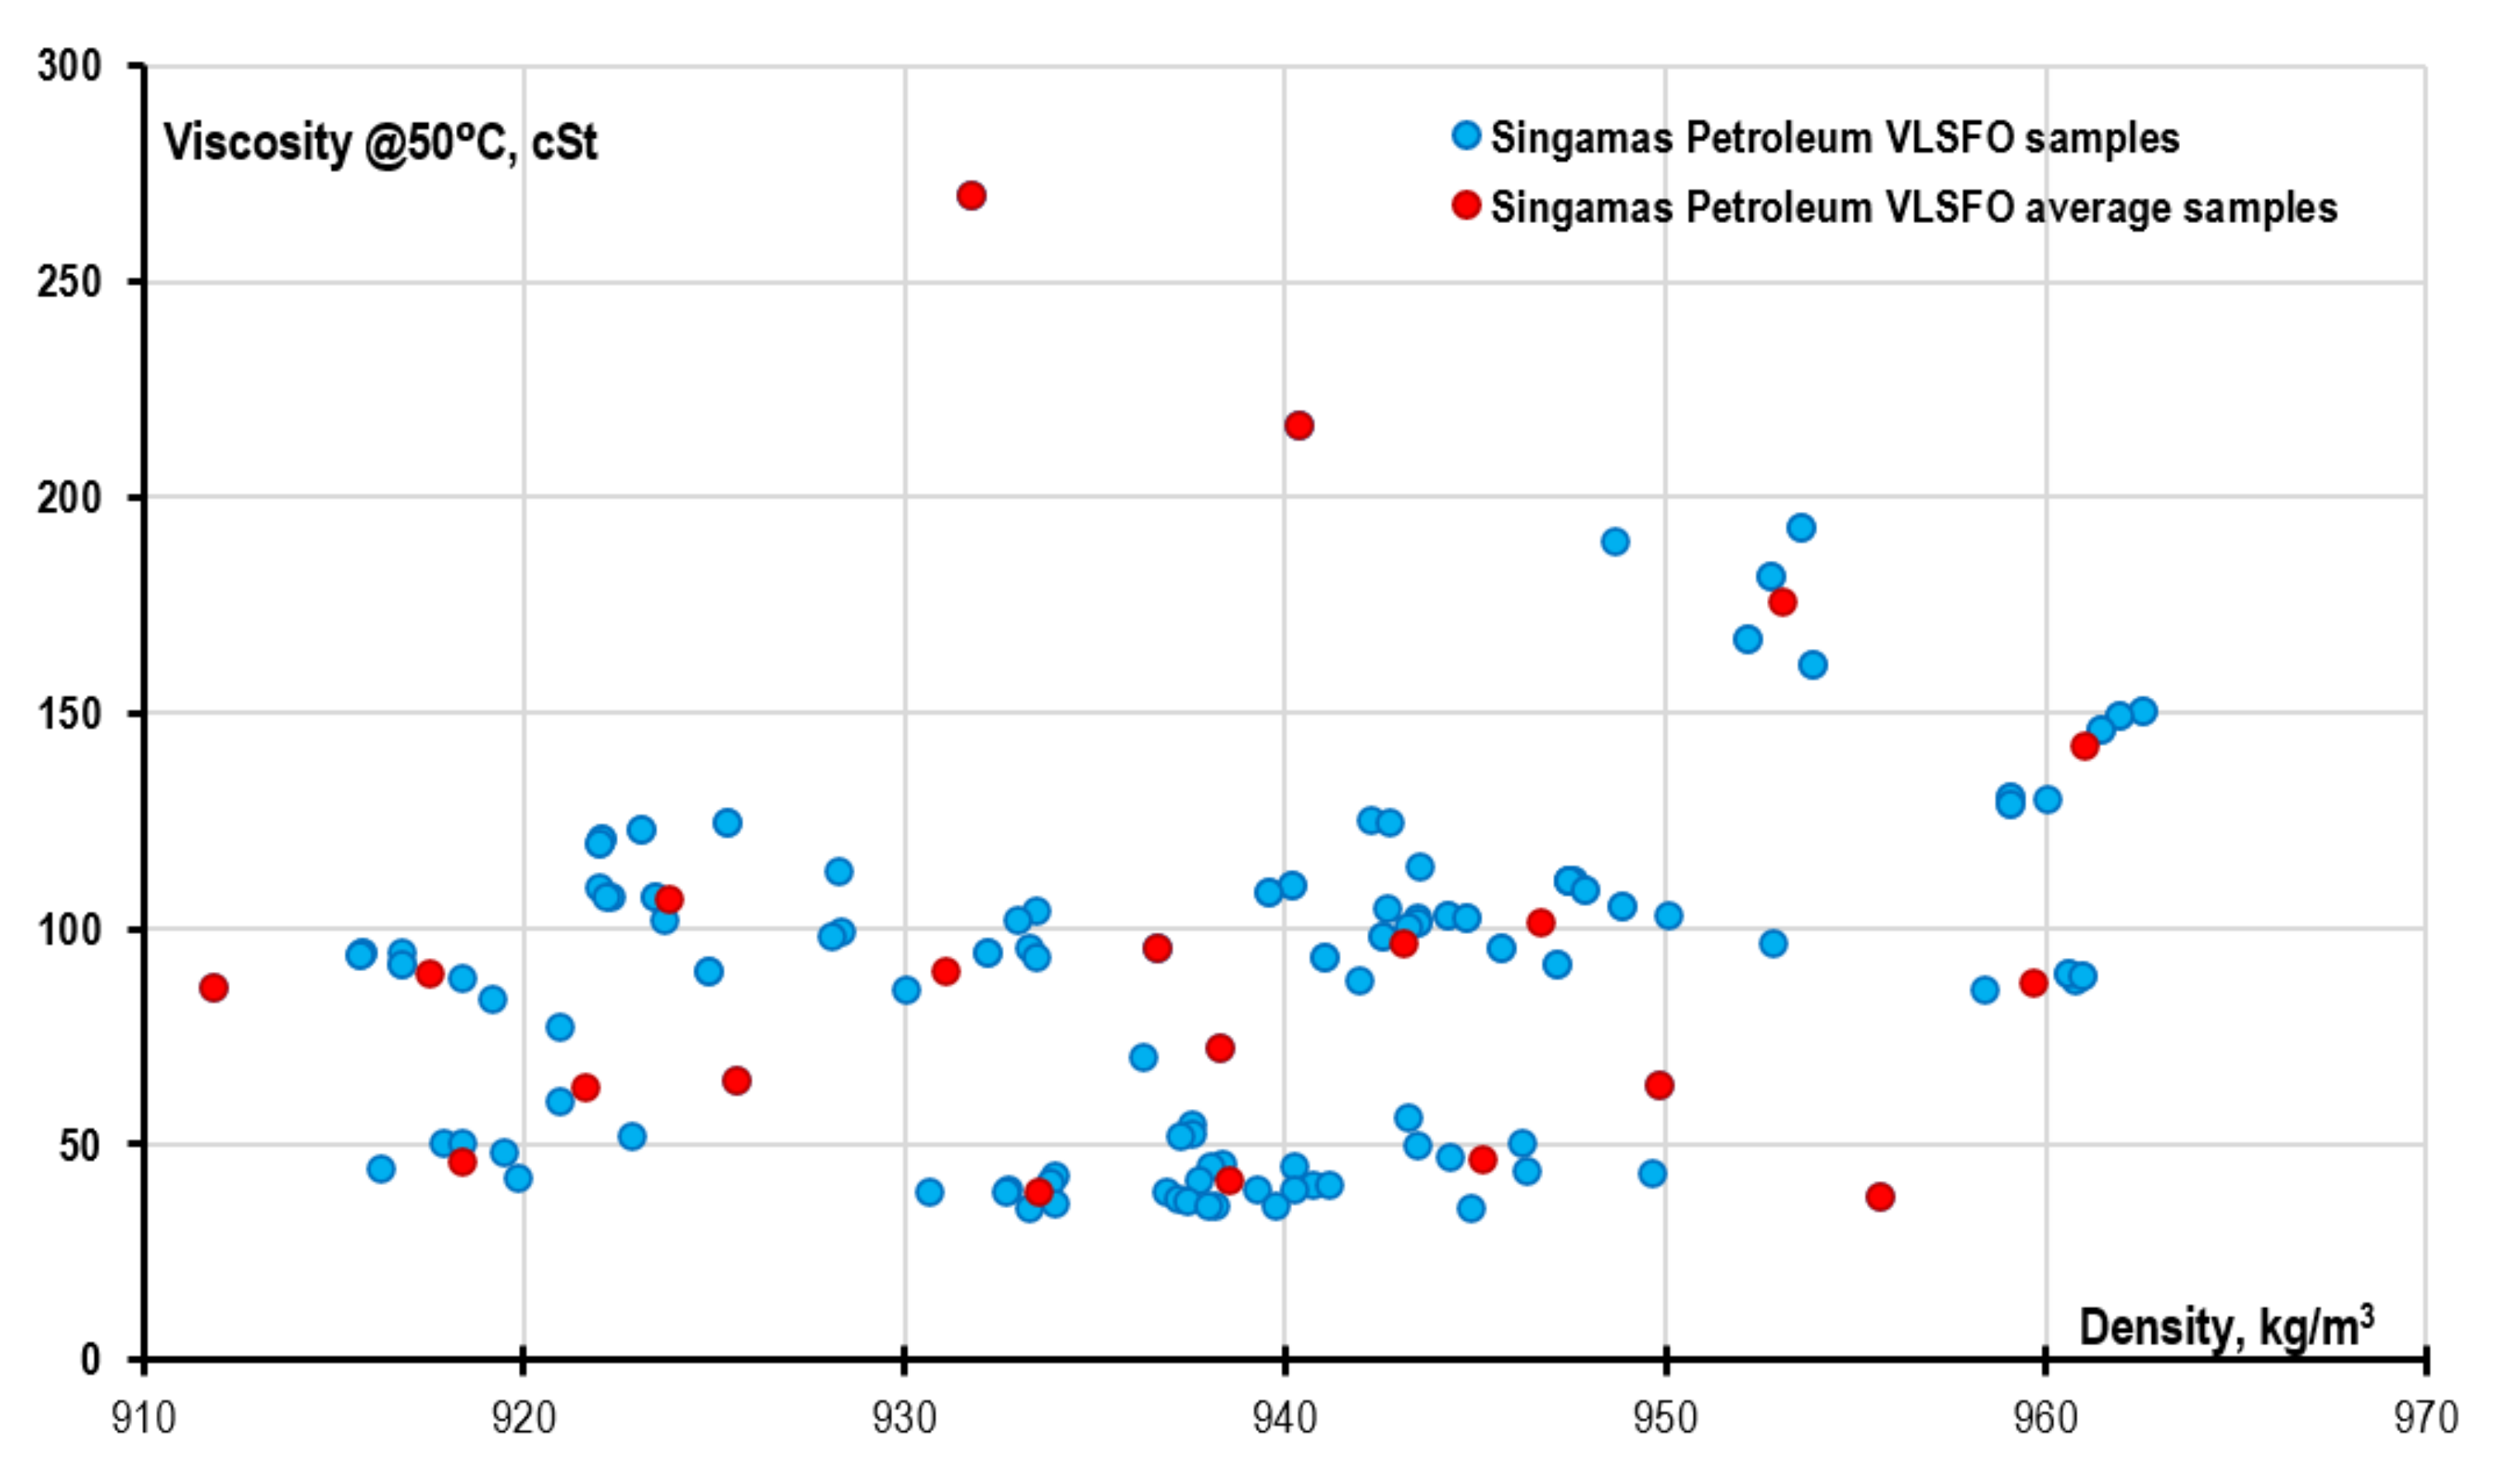
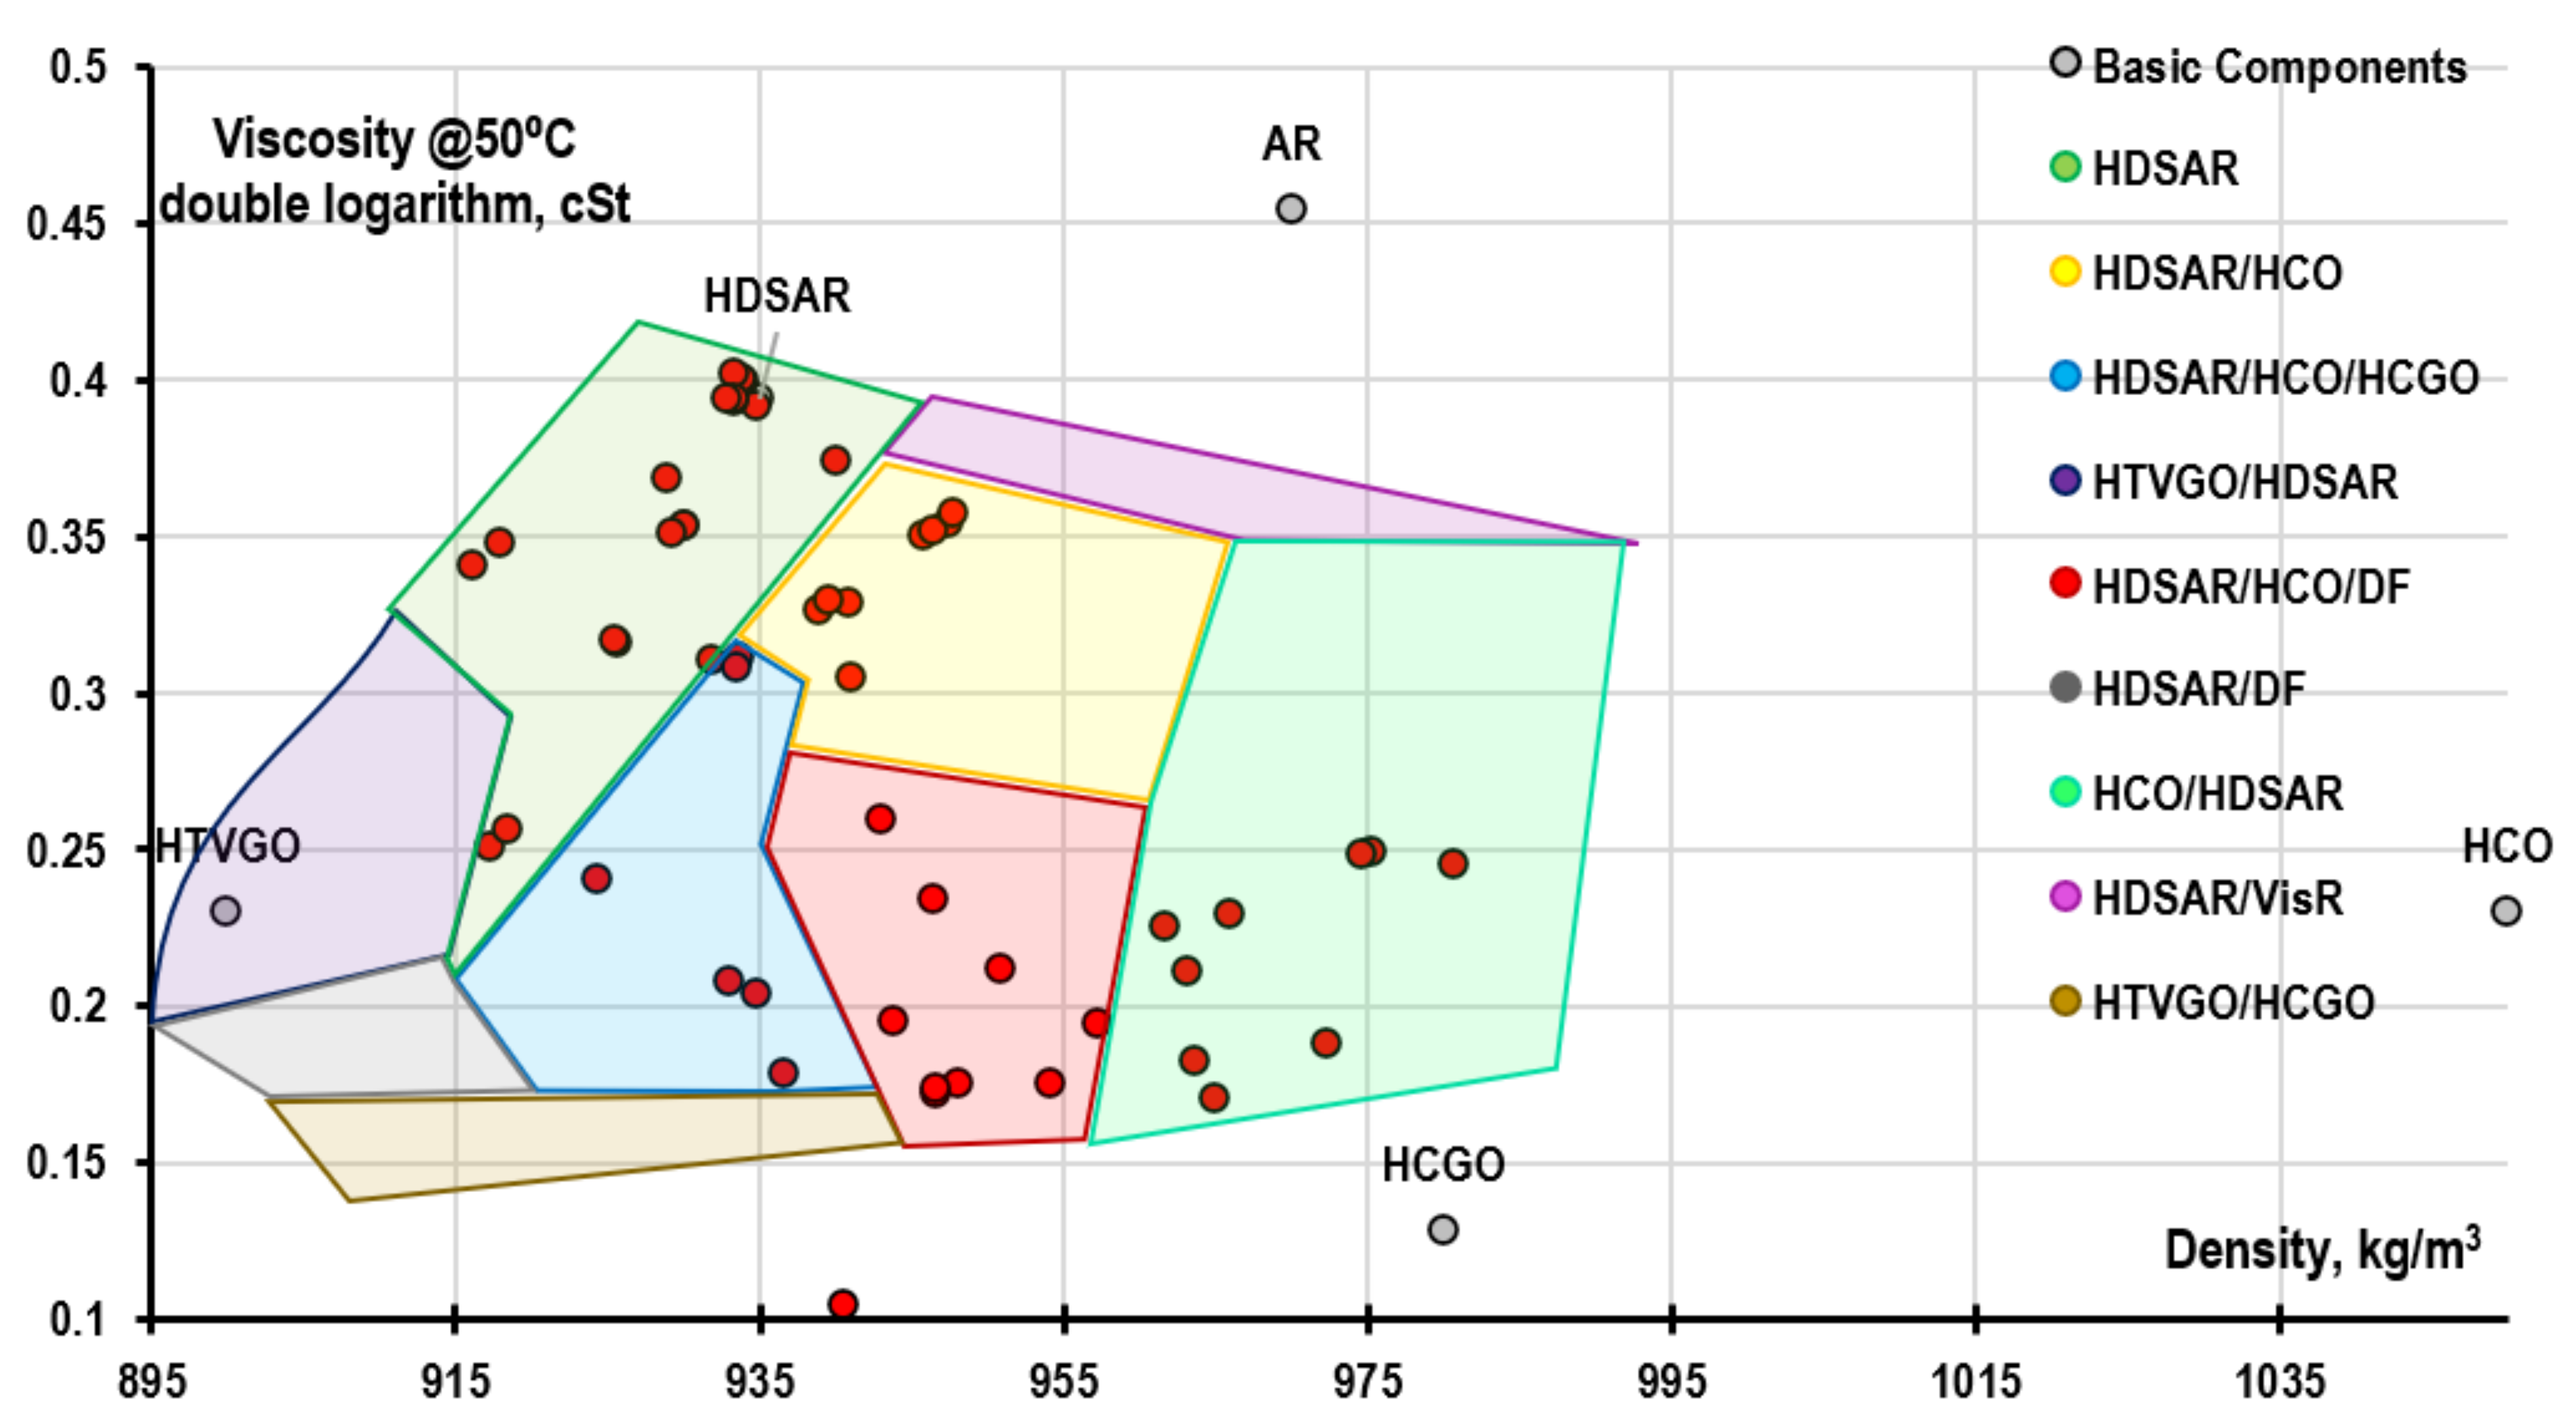
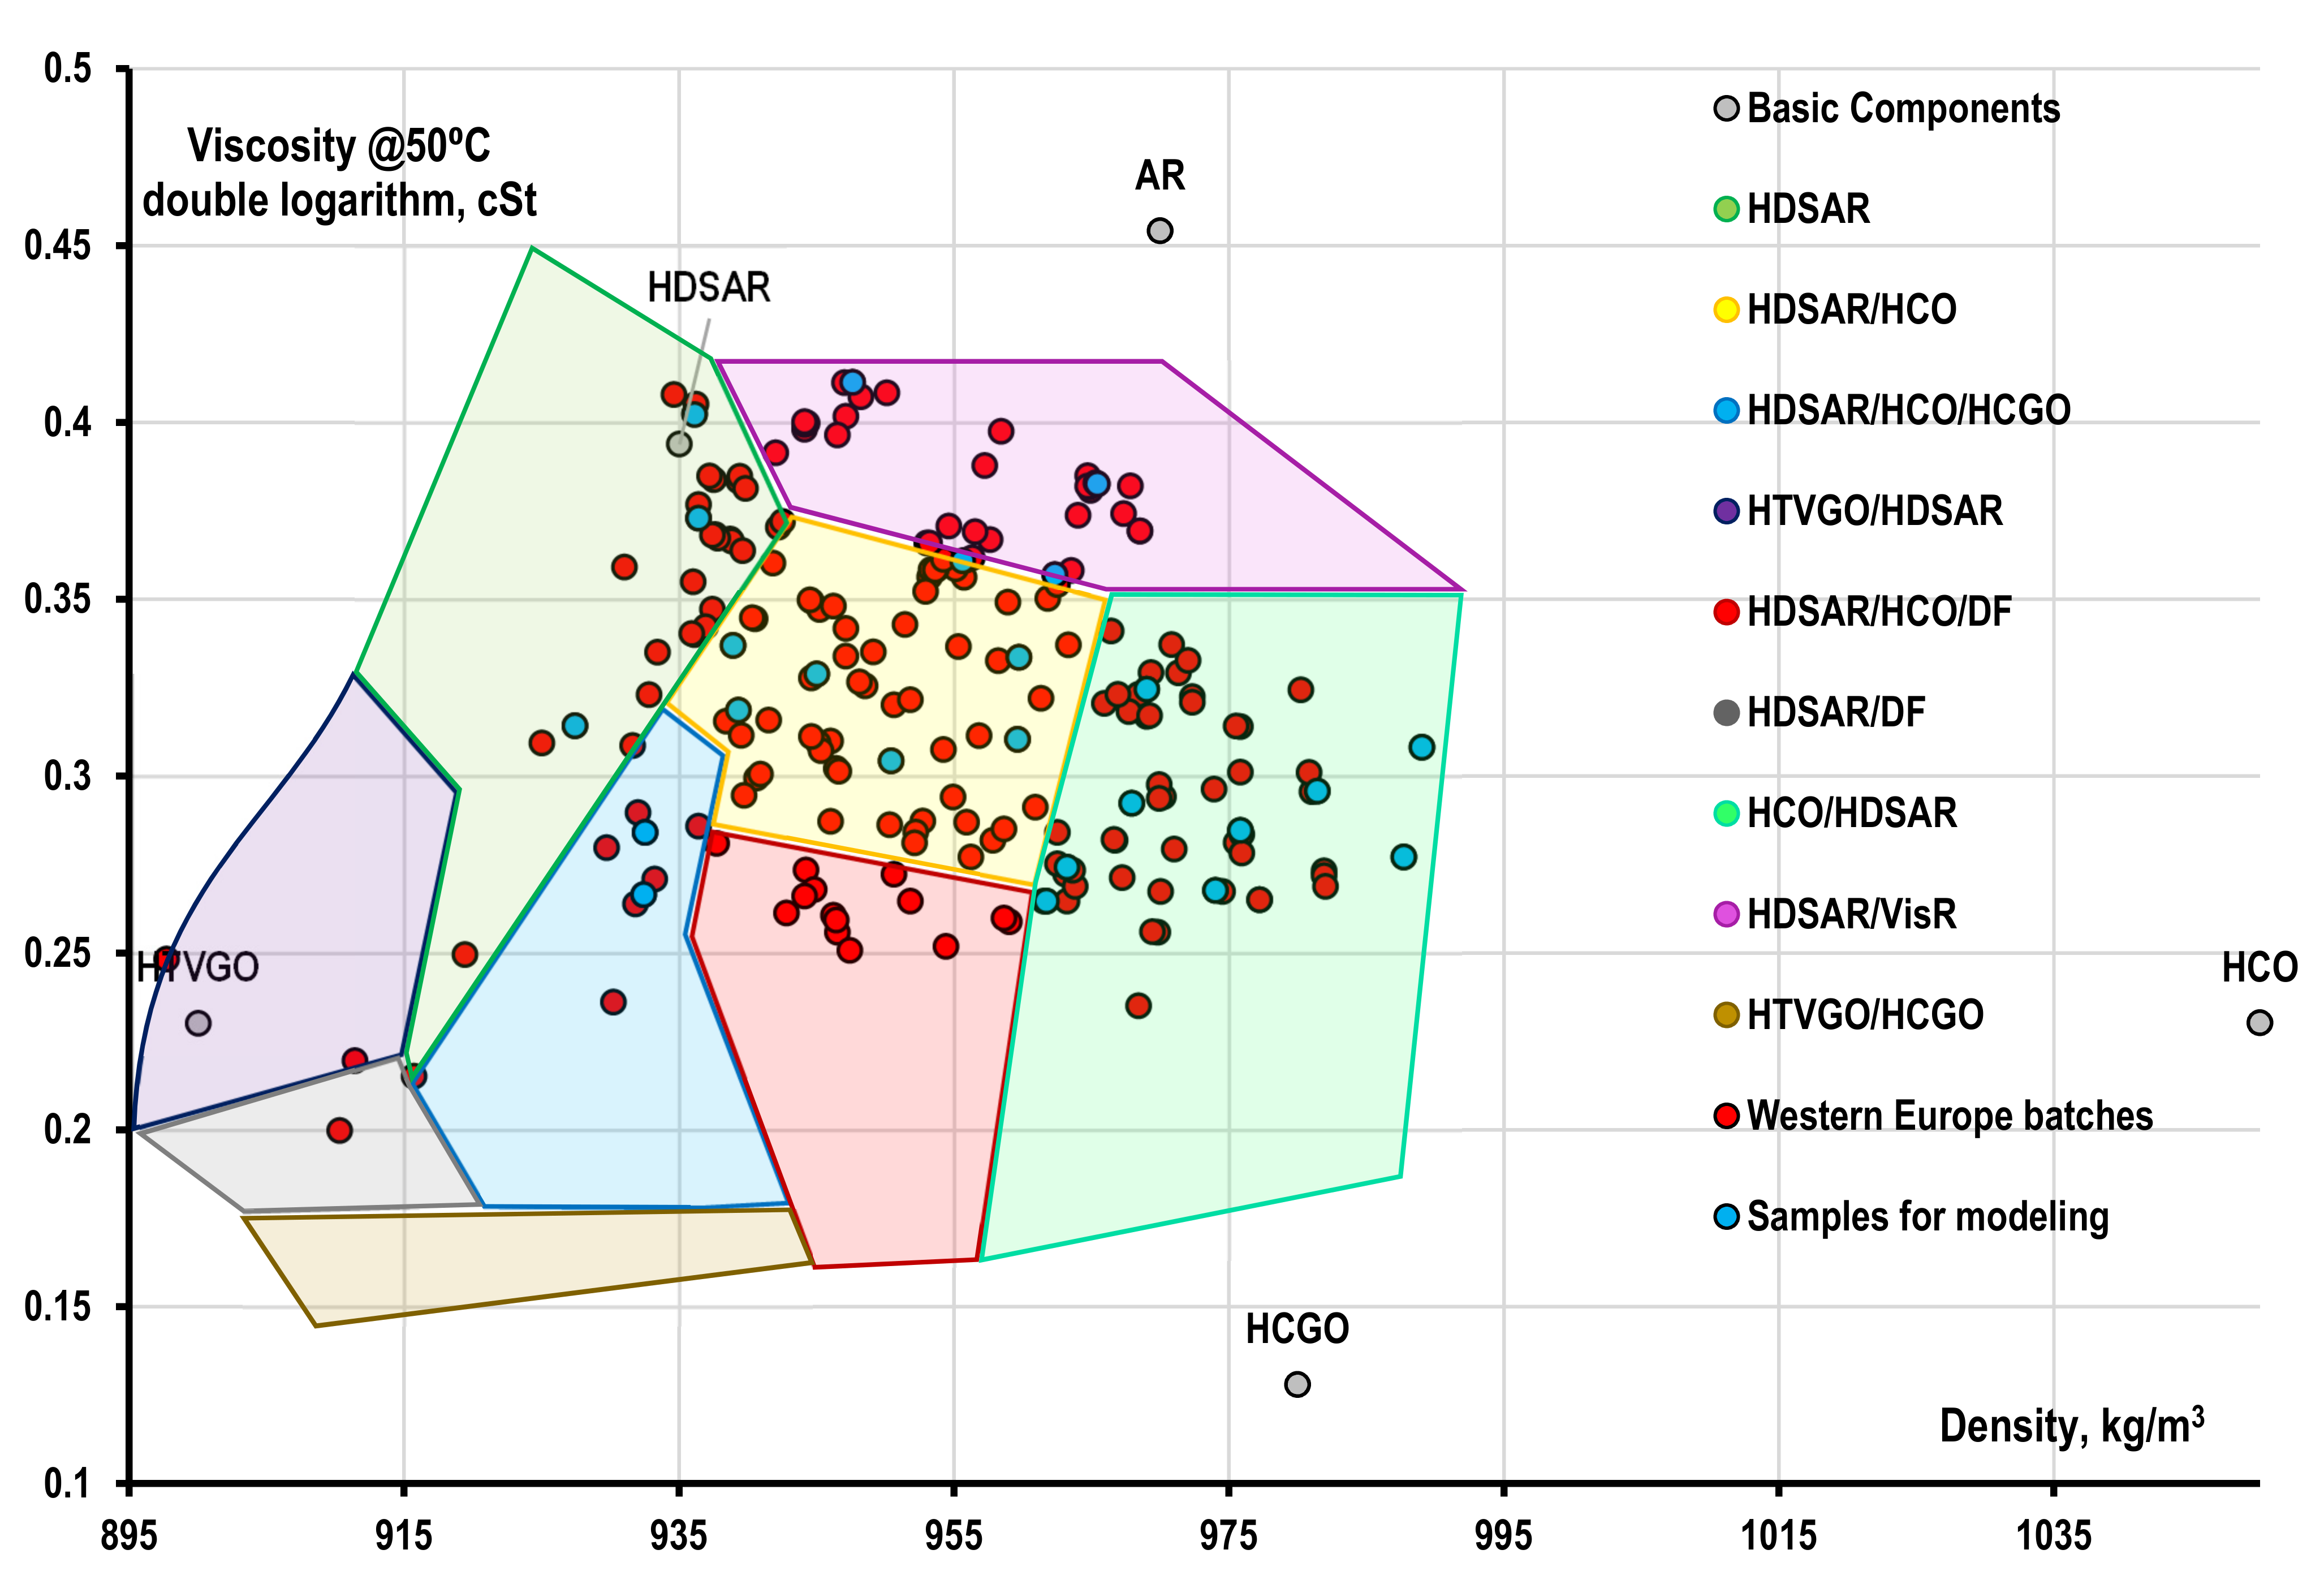
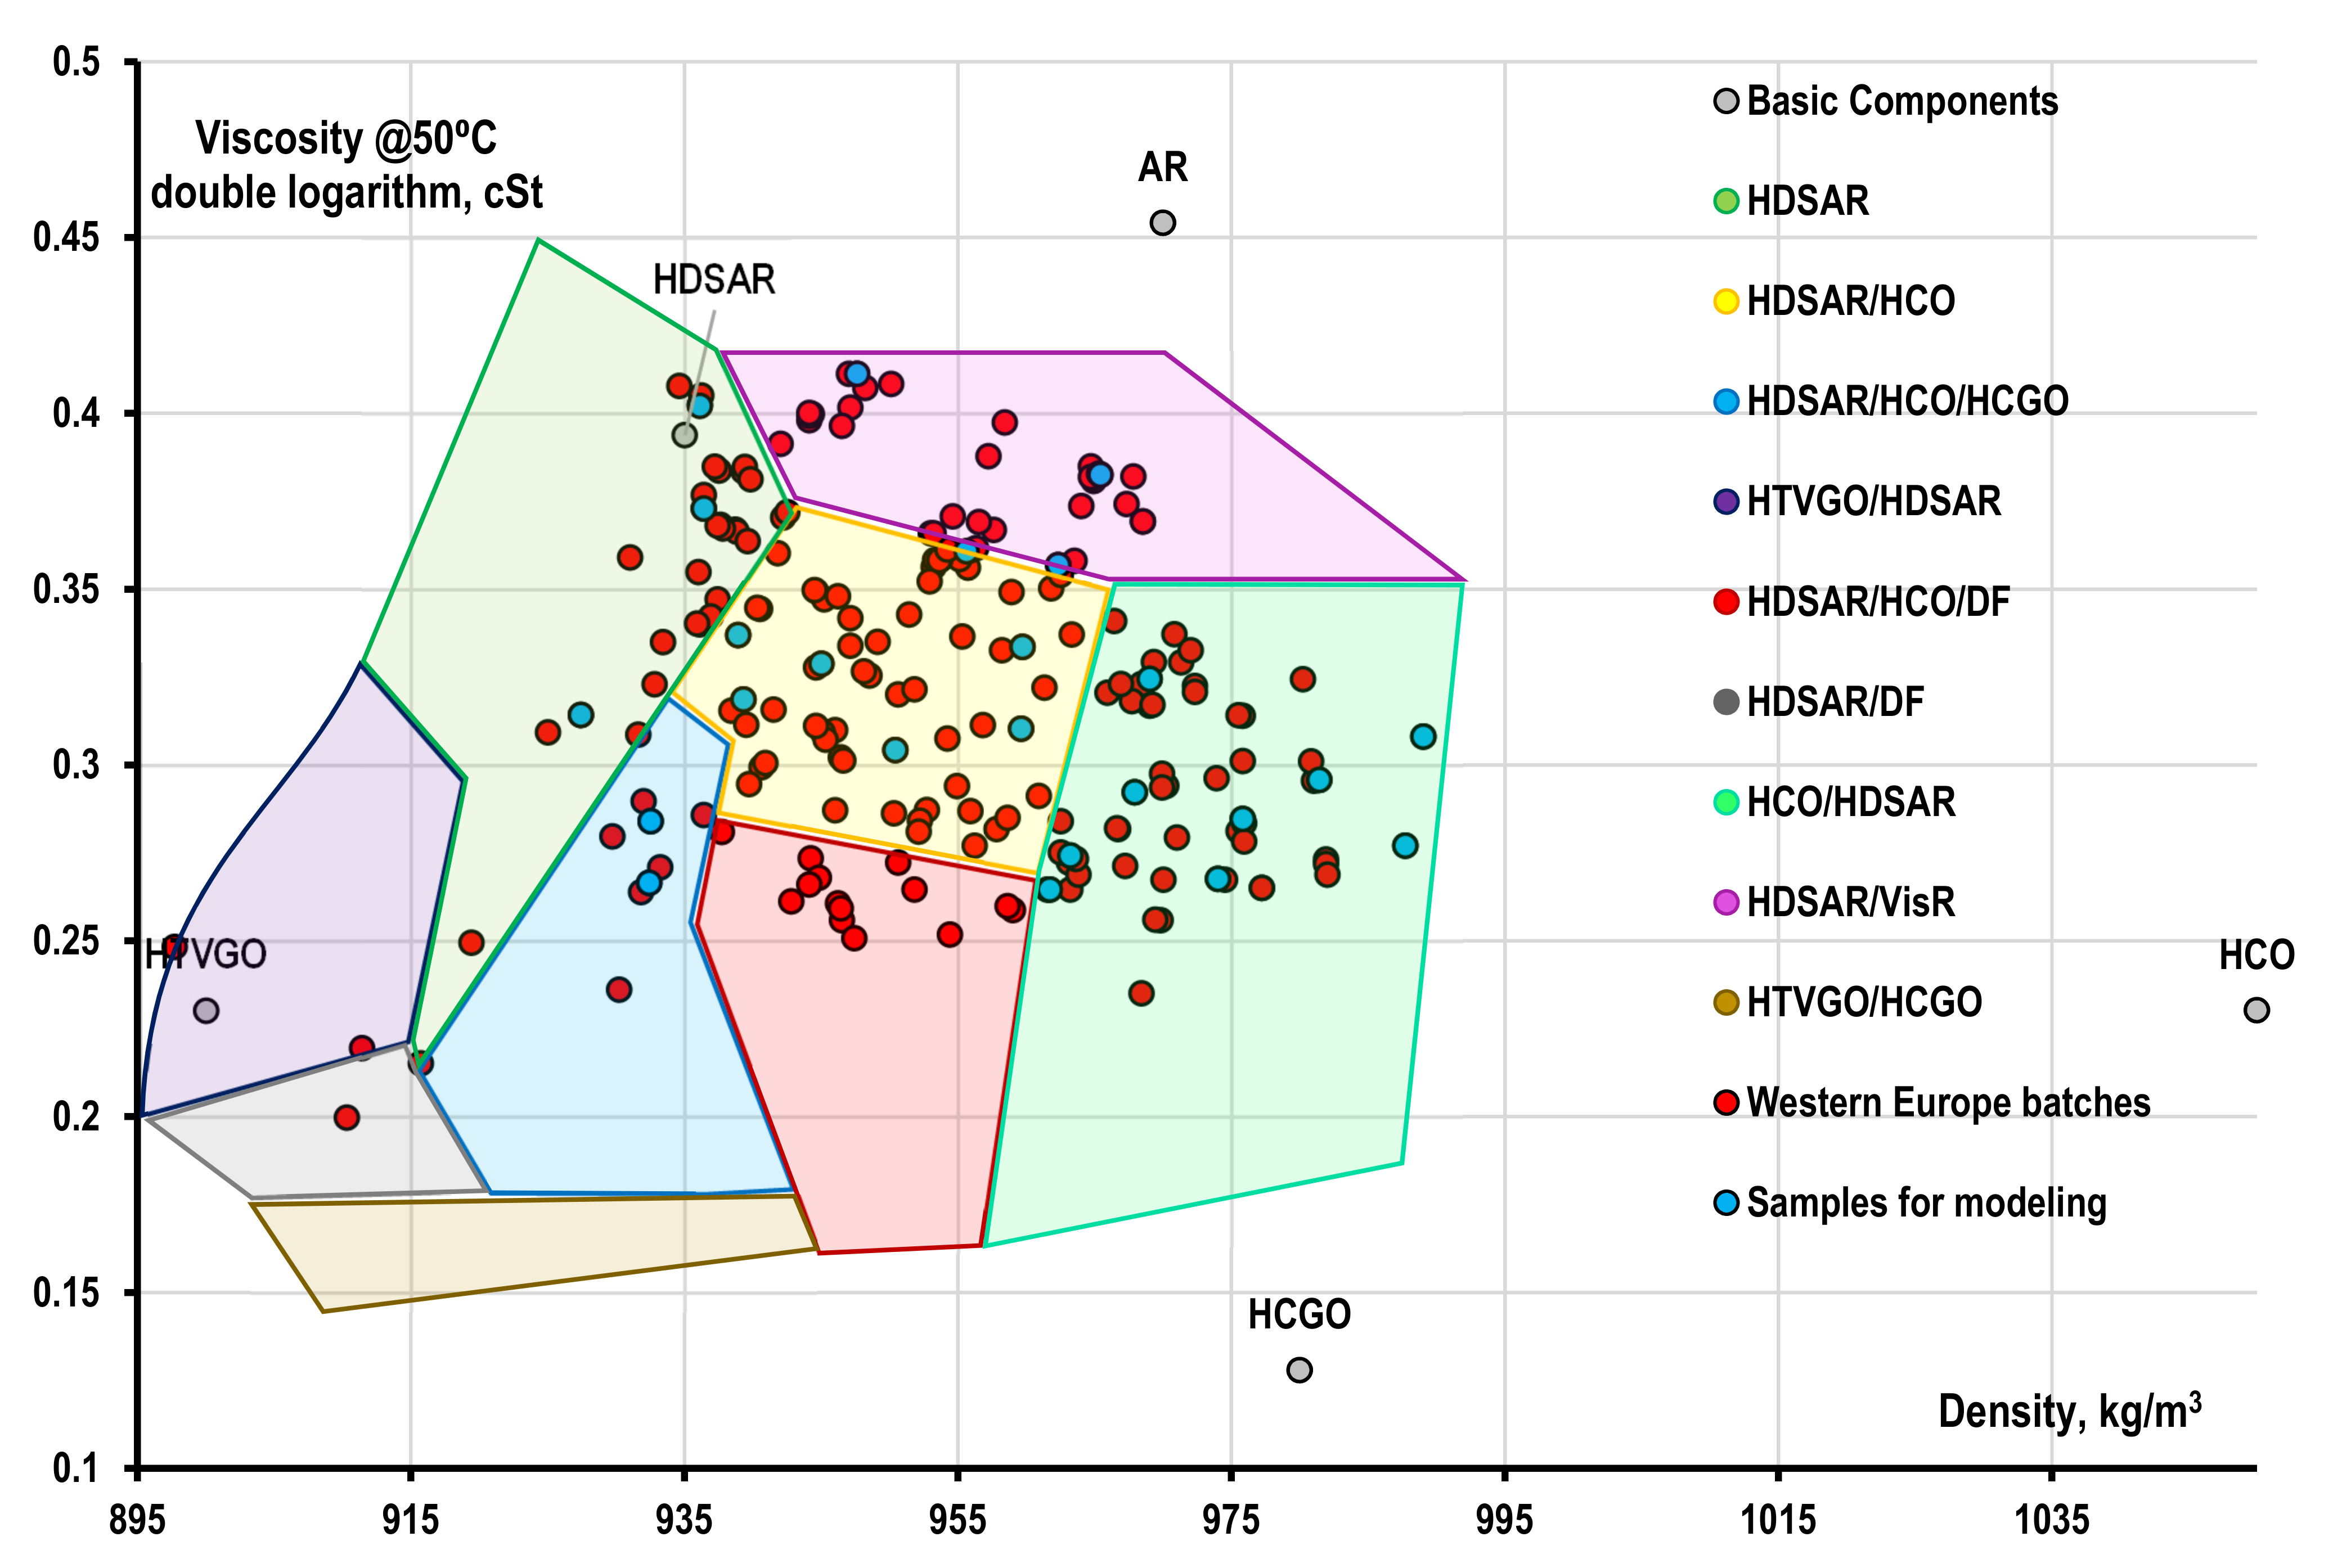
3.1. Analysis of VLSFO Fuel Compositions of RMG 380 Brand (Singapore)
- -
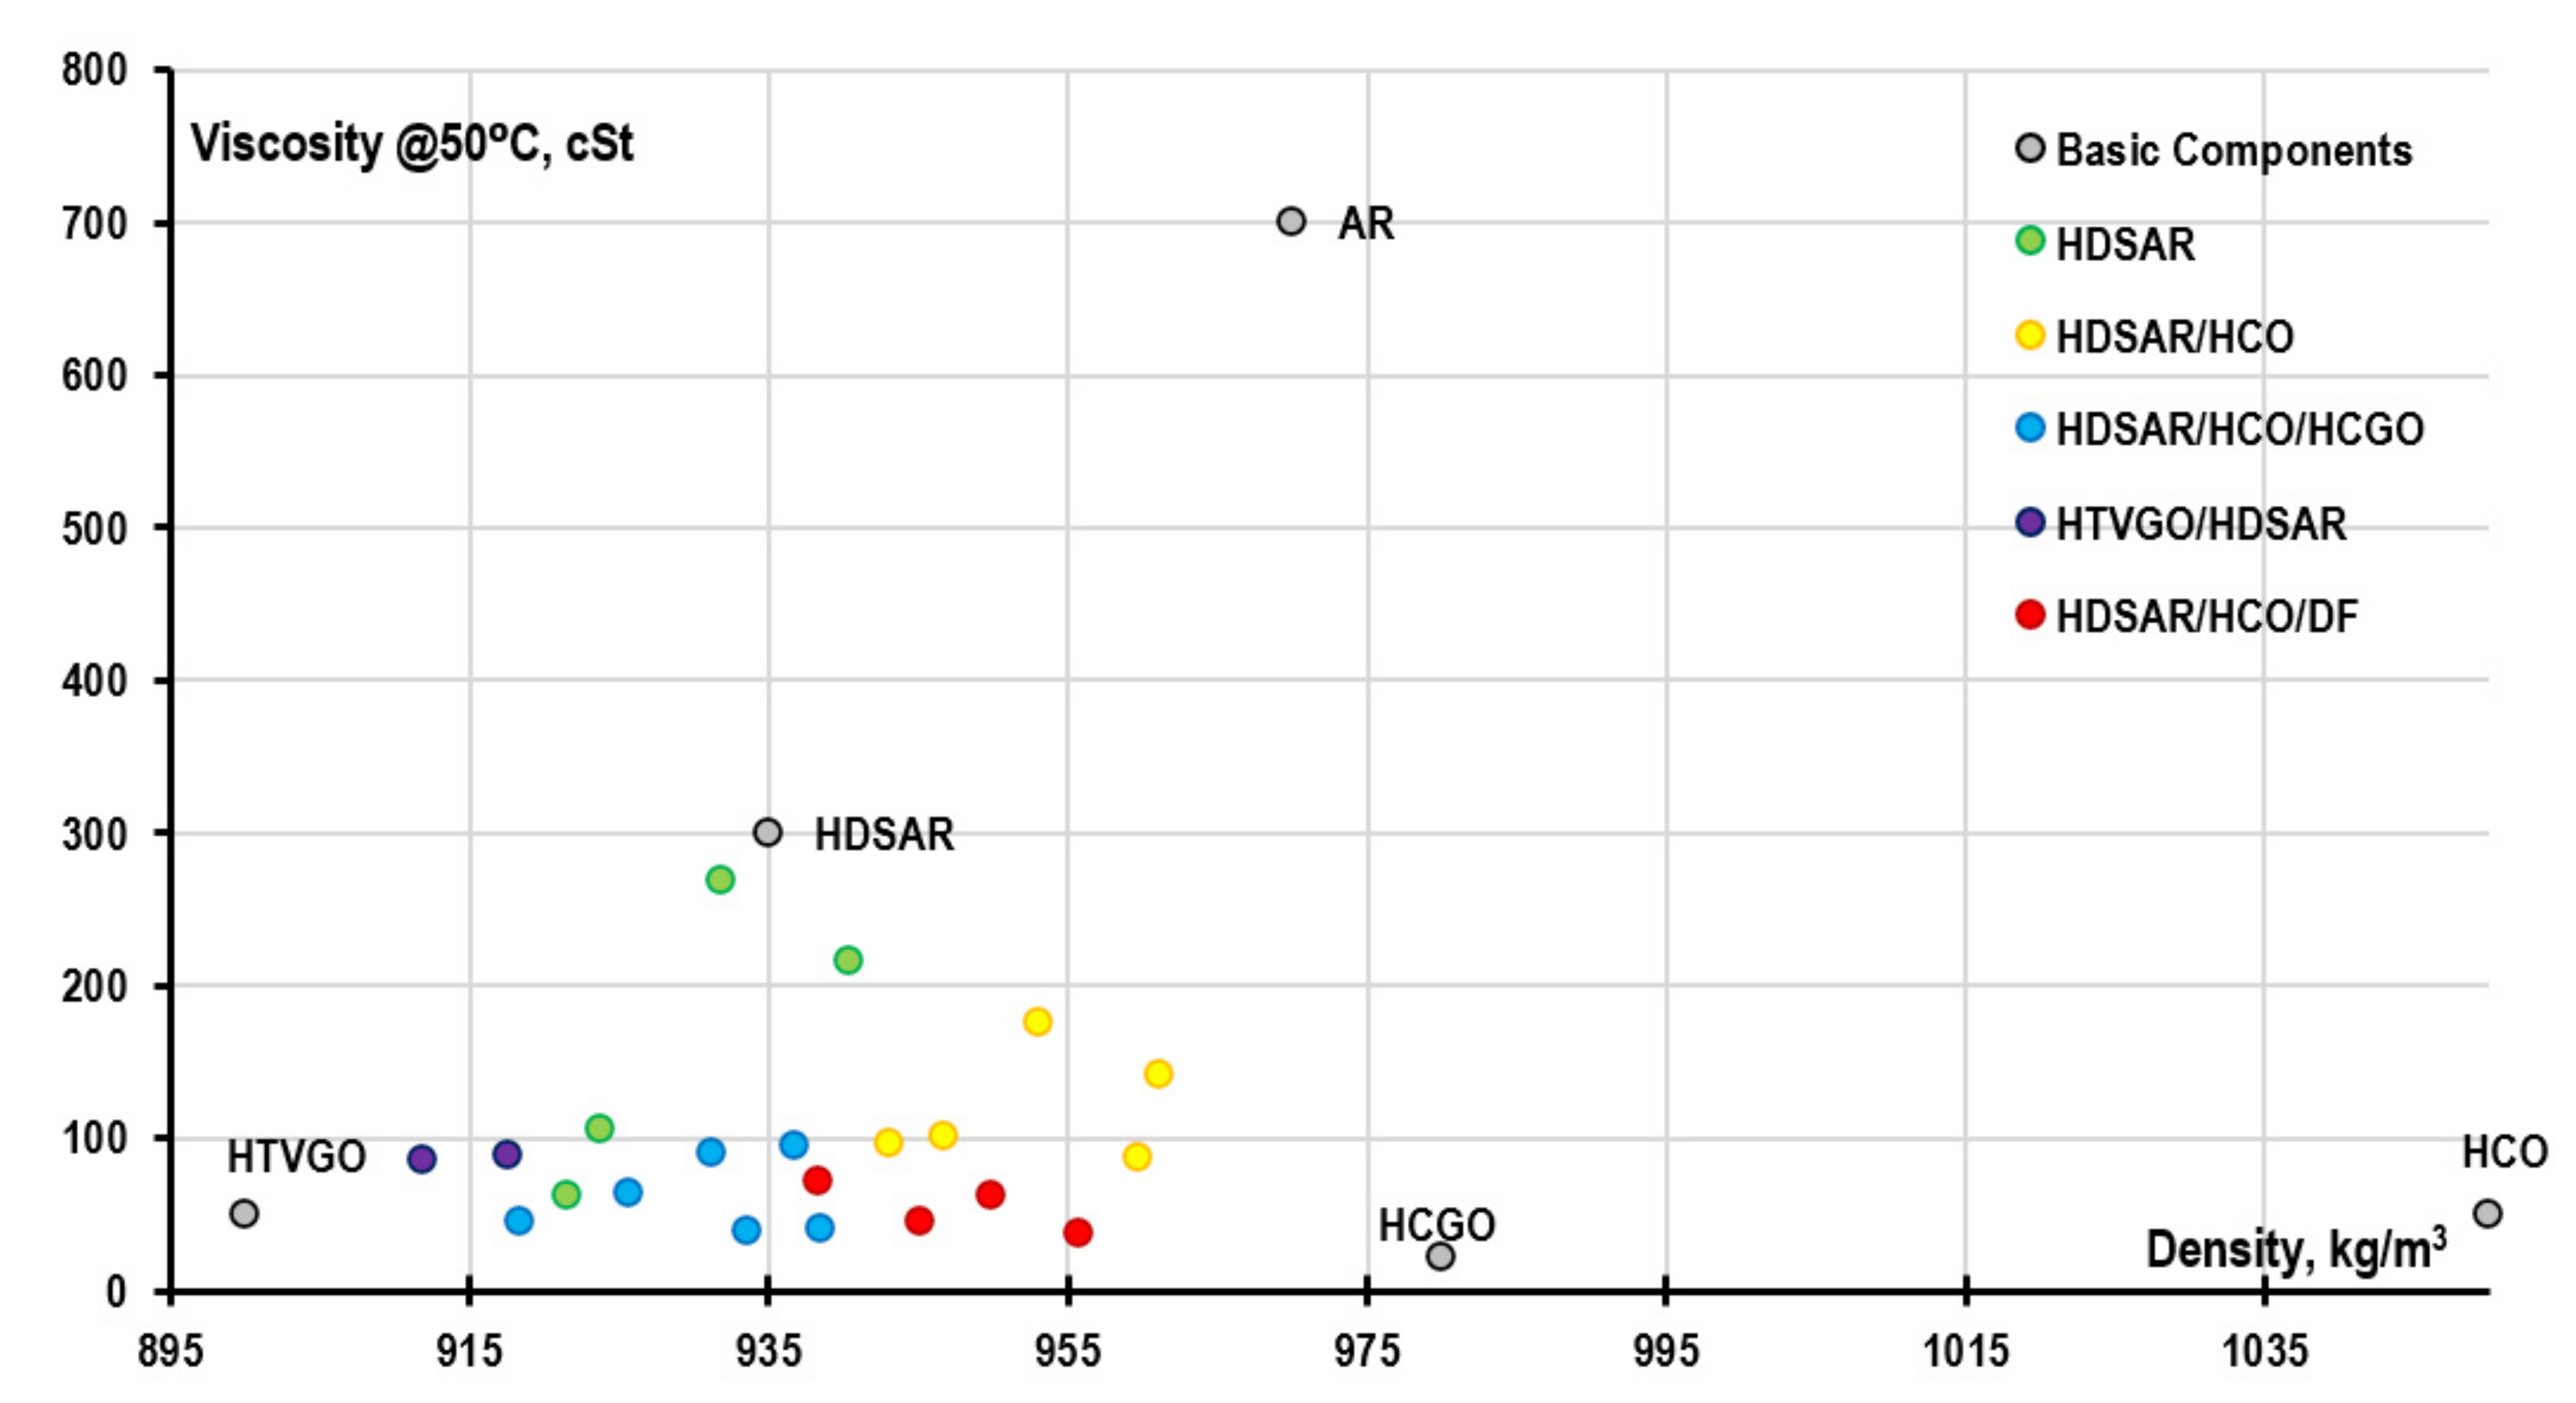
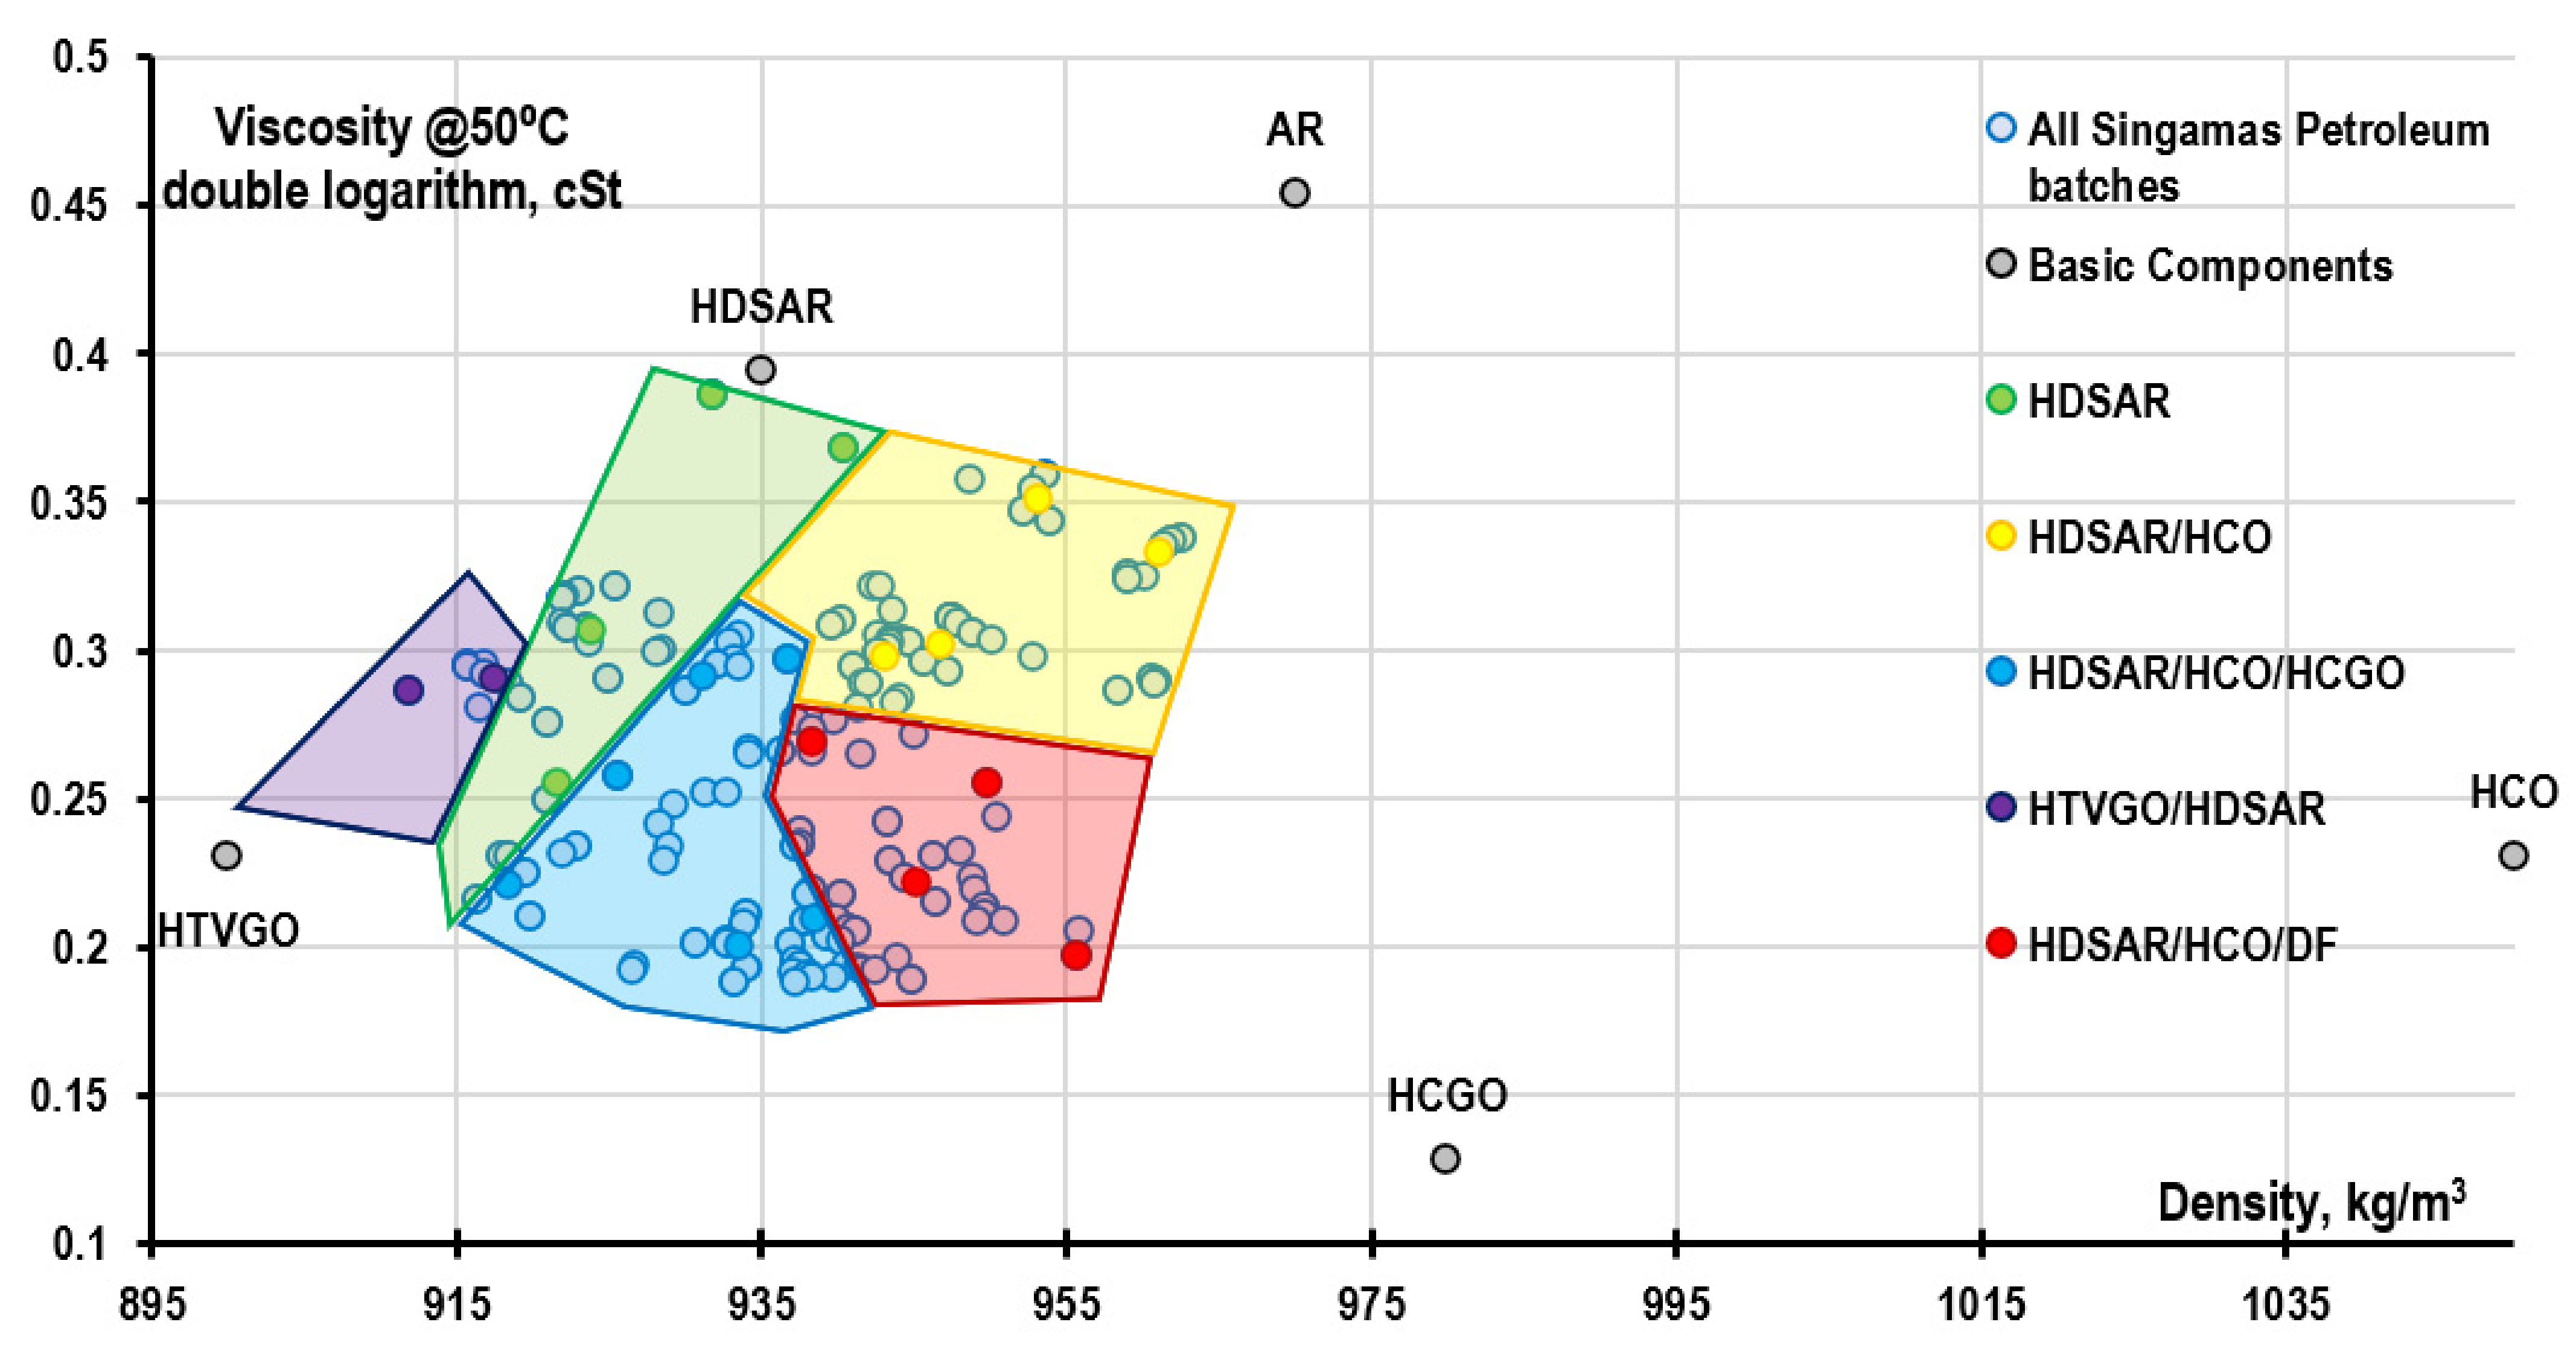
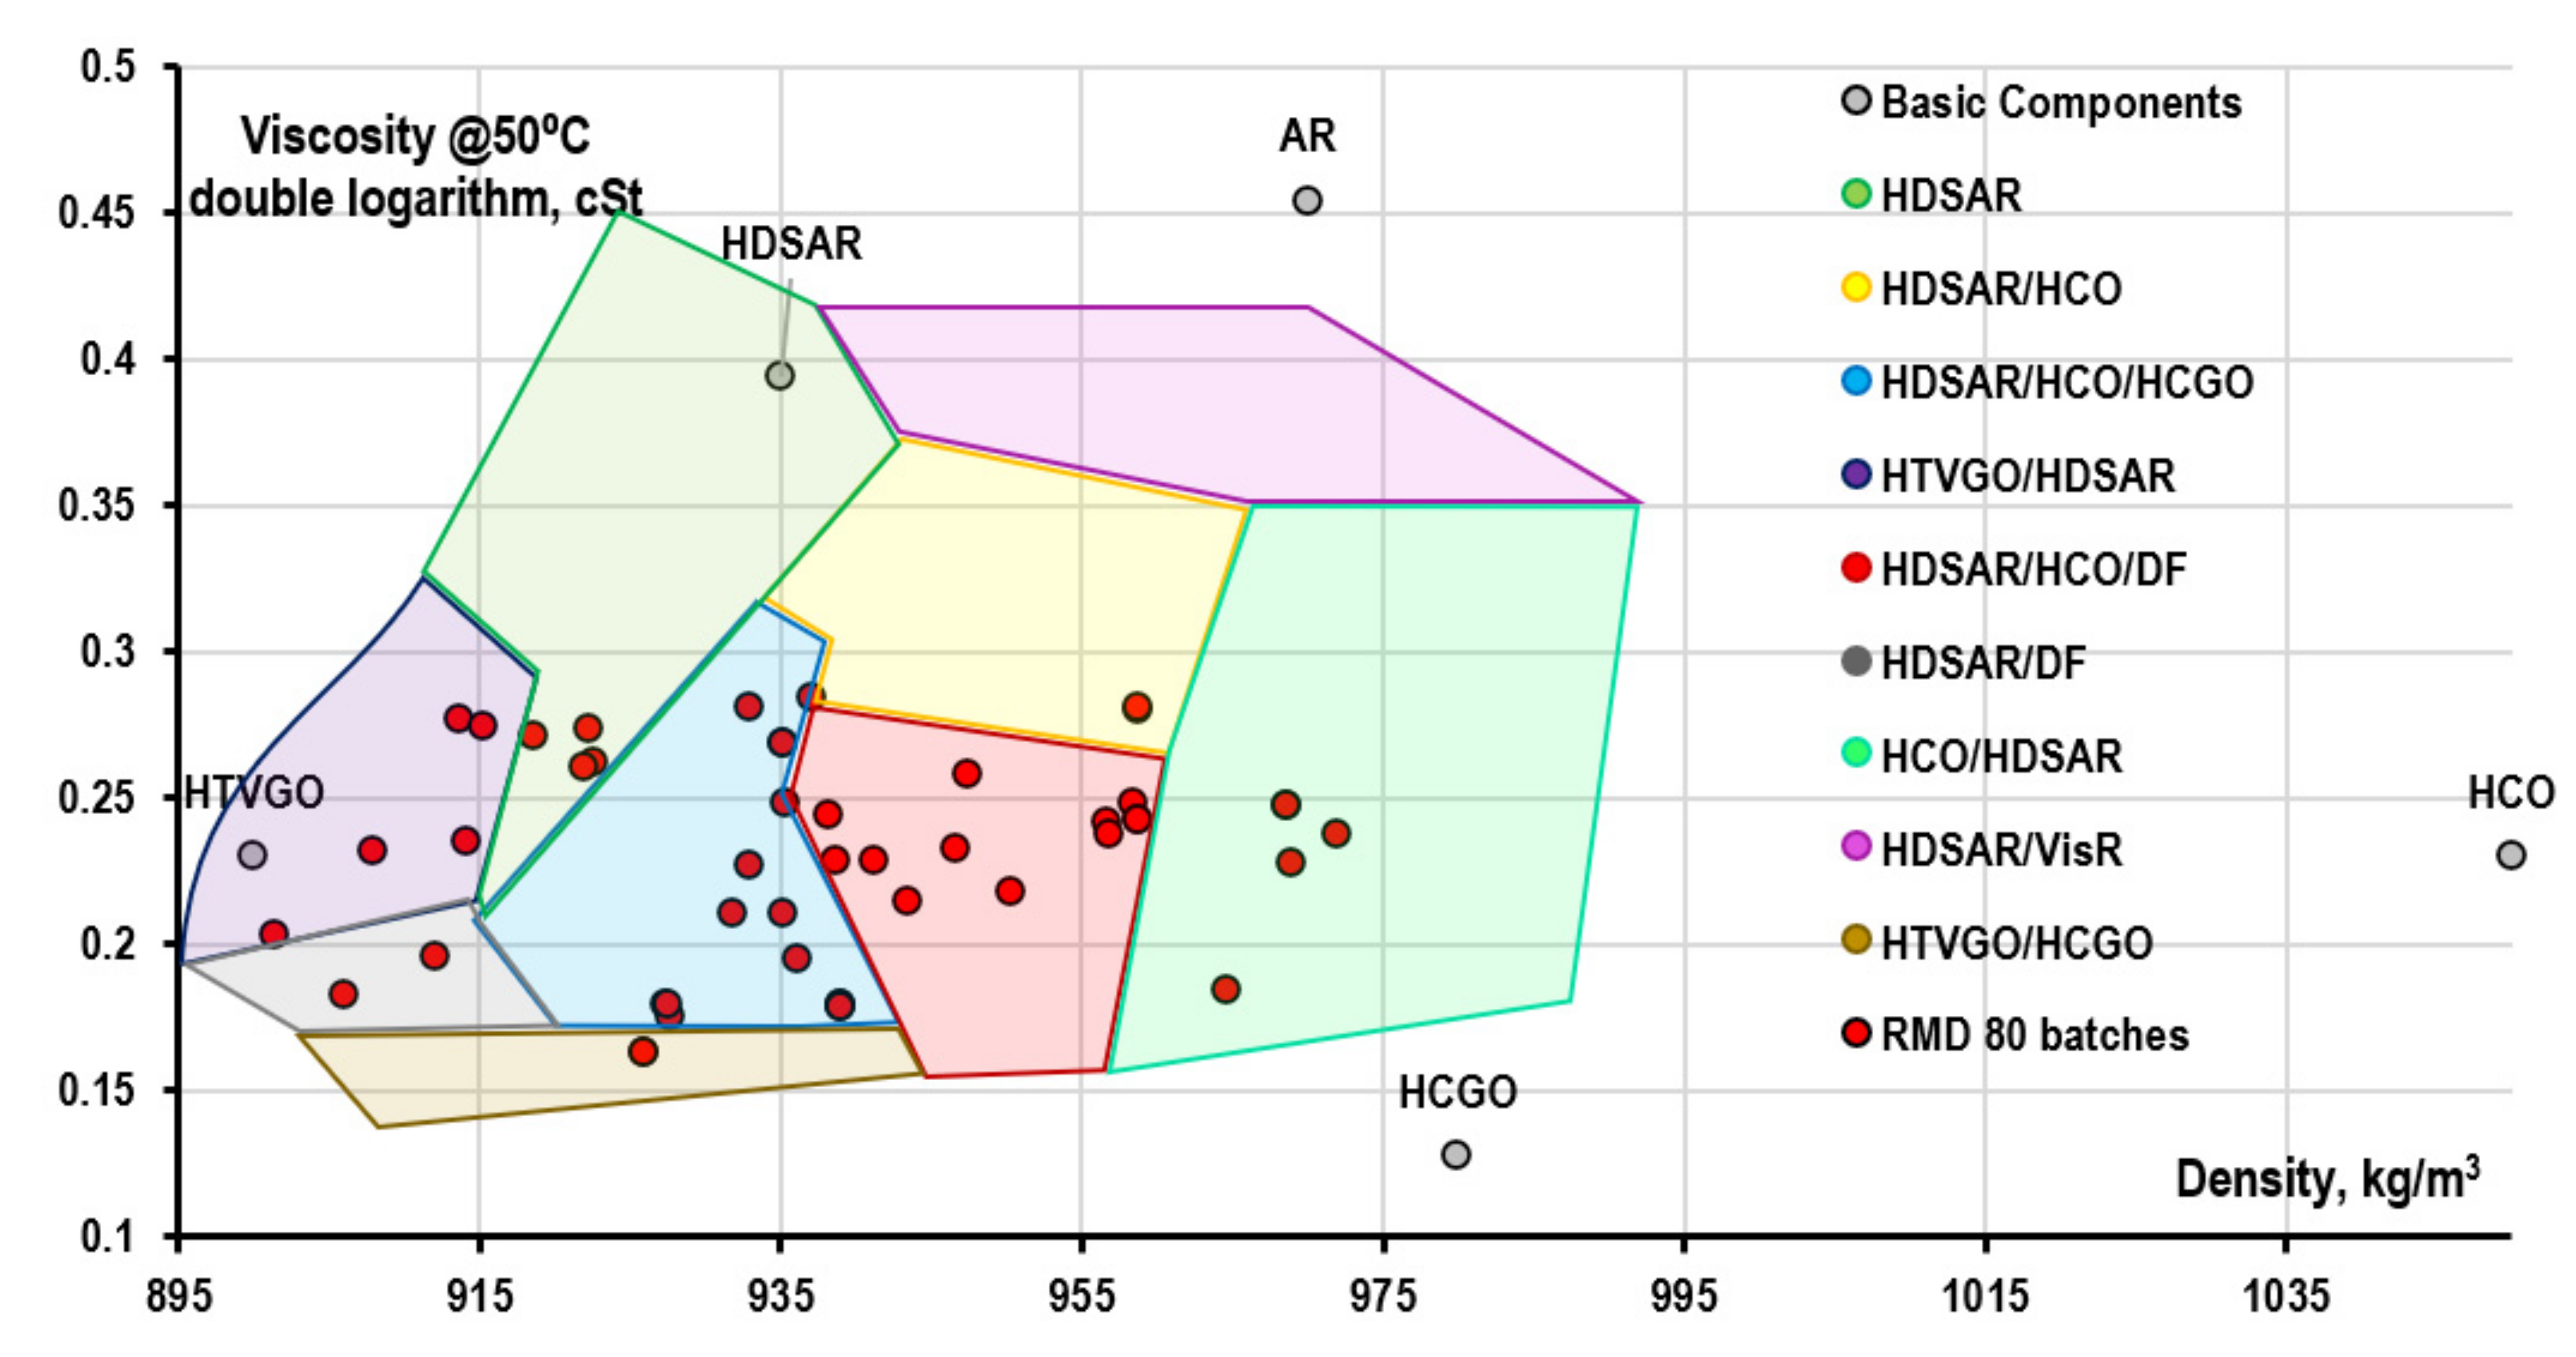
- the low-sulfur residual component is the target hydrogenate of fuel oil hydrotreating units (hereinafter referred to hydrotreated/hydrodesulfurized AR or HDSAR) with a sulfur content of 0.5%, a density of 935 kg/m3, and a viscosity at 50 °C of 300 cSt (for more details, see Section 3.2).
- -
- Straight-run atmospheric residue (AR) is low-sulfur AR with a sulfur content of 1.0%, a density of 970 kg/m3, and a viscosity of 700 cSt at 50 °C. With a higher sulfur content, the possibility of adding AR to low-sulfur fuel is severely limited, and this component is practically not involved in the modeling process.
- -
- Catalytic cracker heavy cycle oil (HCO)–depending on the presence/absence of hydrotreating of the cracking feedstocks, the sulfur content in the HCO can vary widely, in this study the value of 0.5% is assumed, which facilitates the modeling of very different density samples. Other characteristics also strongly depend on the operating mode of the unit and the fractional composition of the final HCO, in this study the approximate characteristics of the 420 °C FBP fraction is taken: density 1050 kg/m3 and viscosity at 50 °C 50 cSt.
- -
- Heavy coking gas oil (HCGO)—as in the case of HCO, the properties of HCGO strongly depend on the parameters of the process and the feedstock. In this study, a low-sulfur VR coking product with the following characteristics was taken as a mixing component: 1.0% sulfur content, density 980 kg/m3, viscosity 22 cSt at 50 °C.
- -
- Hydrotreated vacuum gas oil (HTVGO) is a standard product of a catalytic cracker feedstock preparation unit: 0.1% wt. sulfur content, density 900 kg/m3, viscosity 50 cSt at 50 °C.
- -
- Diesel fuel (DF)—depending on the sulfur content in marine fuel, anything from straight-run diesel fuel to ultra-low-sulfur diesel fuel can be used. The properties are within the following limits: sulfur content 0.001–1.0%, density 828–840 kg/m3, viscosity 2.0–2.4 cSt at 50 °C.
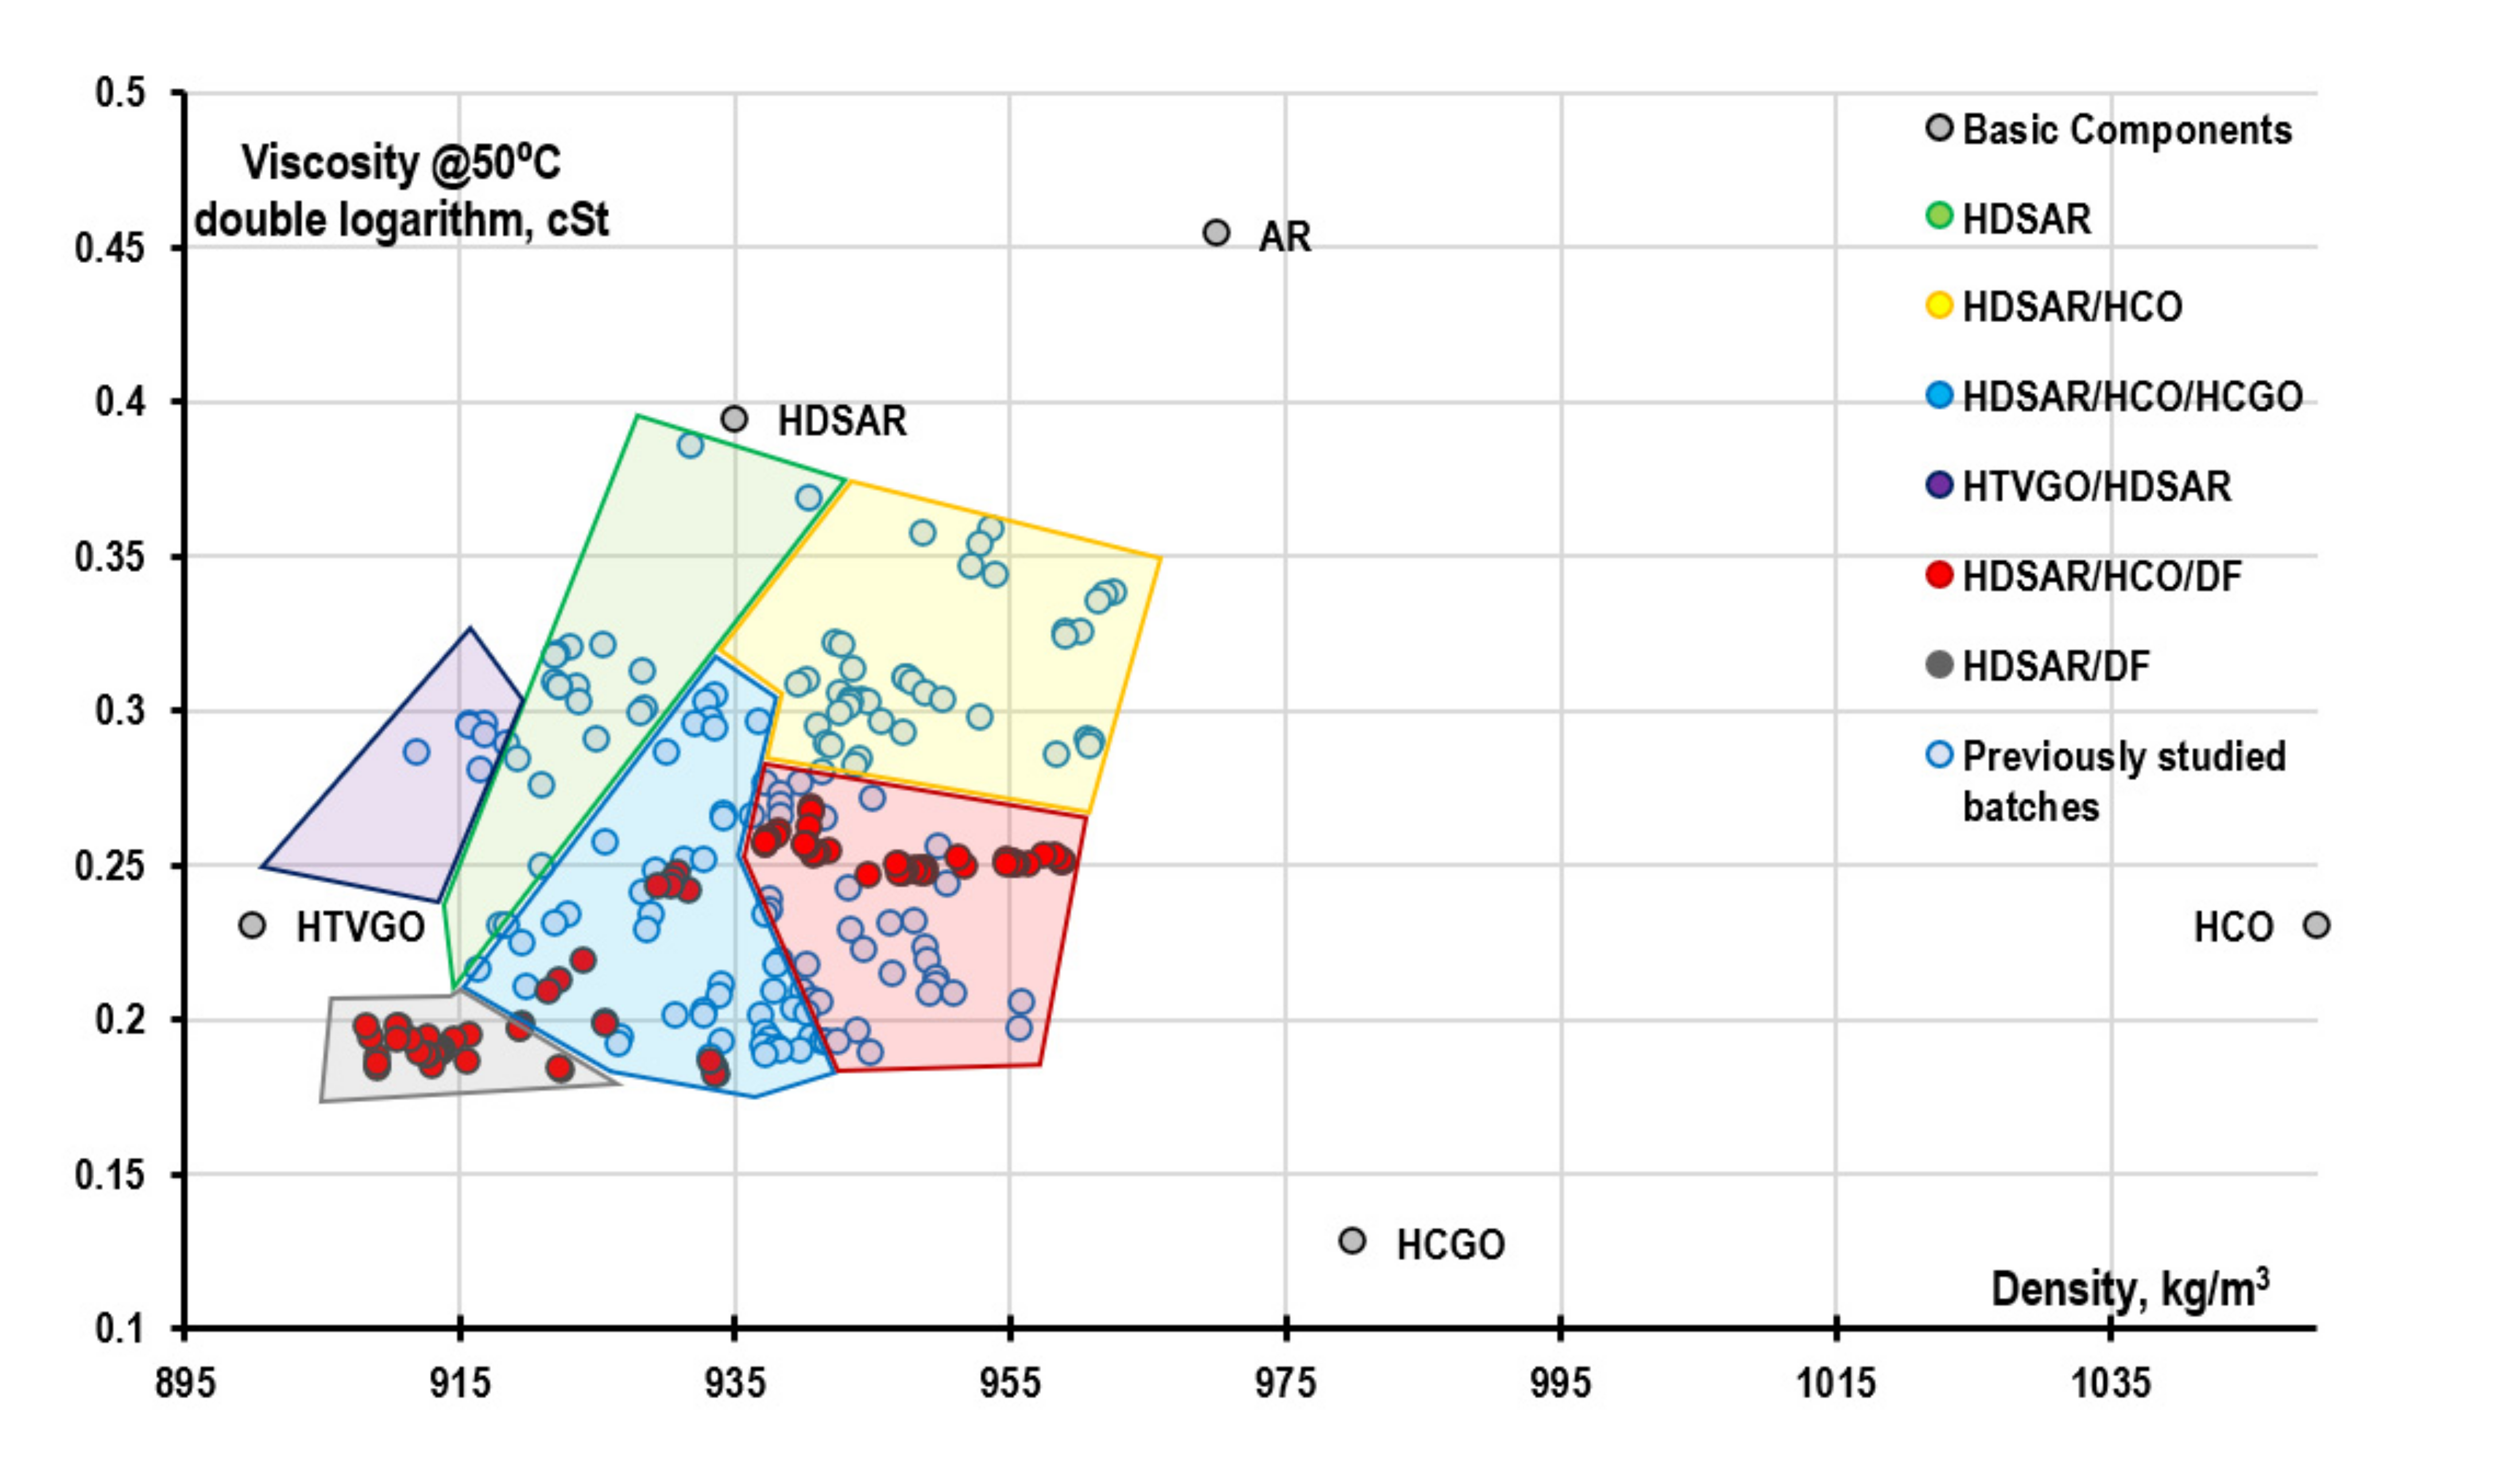
3.1.1. Singamas Petroleum
- -
- type 1—HTFO–samples with a high content of hydrotreated fuel oil (80–95%), a small proportion of heavy gas oils of secondary processes (up to 7%), and an amount of diluent (diesel fuel) up to 15%;
- -
- type 2—HTFO + HCO–samples based on hydrotreated fuel oil (60–75%) and heavy catalytic cracker cycle oil (15–35%) with a small fraction of diluent (up to 8%);
- -
- type 3—HTFO + HCO + HCGO–samples based on hydrotreated fuel oil (55–80%) with an increased proportion of heavy coking gas oil (6–13%) and a low content of heavy catalytic cracker cycle oil (0–15%);
- -
- type 4—HTVGO + HTFO–samples based on hydrotreated vacuum gas oil (45–60%) and fuel oil (30–50%) (a mixture of hydrotreated and straight-run);
- -
- type 5—HTFO + HCO + DF–samples based on hydrotreated fuel oil (40–70%) and heavy catalytic cracker cycle oil (13–35%) with a small amount of coking gas oil (7–12%) and a high proportion of diluent (10–15%).


3.1.2. British Petroleum
- -
- type 6—HTFO + DF–based on hydrotreated fuel oil (60–75%) with a low content of heavy gas oils of secondary processes (up to 10%) and an increased proportion of diesel fuel (15–30%).
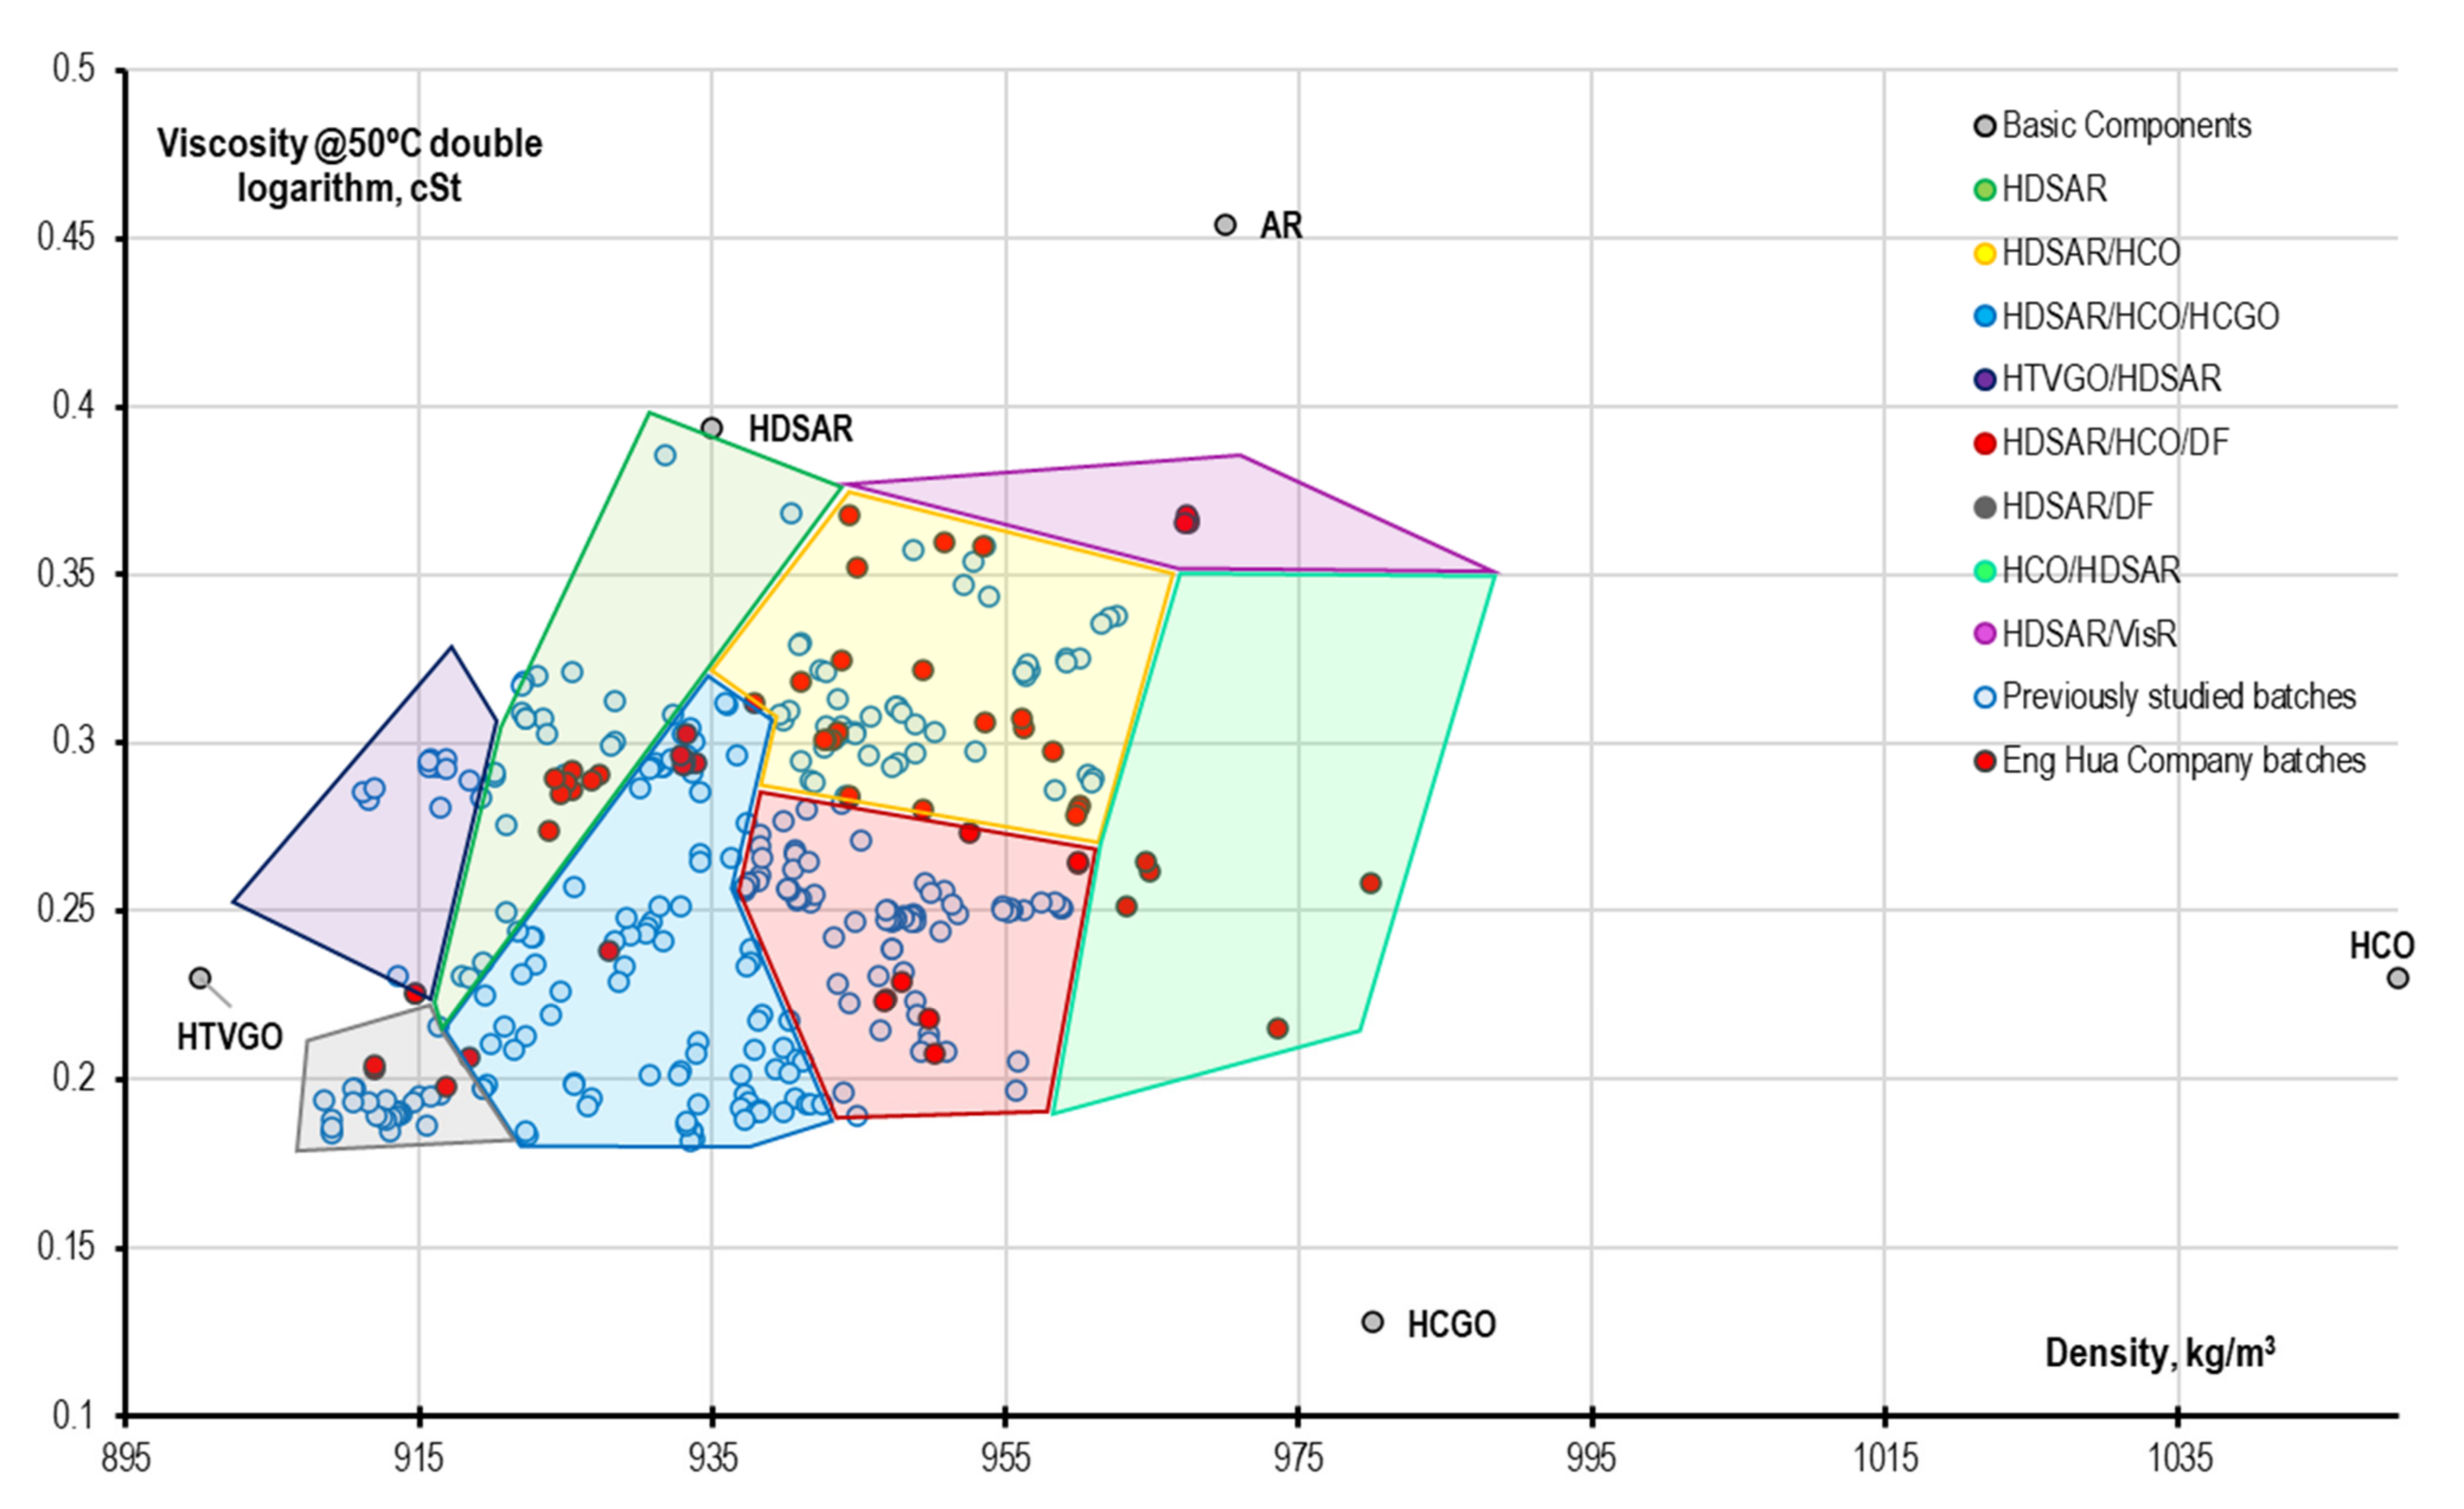
3.1.3. Eng Hua Company
- -
- type 7—HCO + HDSAR—samples 1–3 are similar in composition to type 2 “HDSAR +HCO”, but have a significantly increased content of HCO, since only with its help is it possible to obtain components with such a high density at a relatively low viscosity. These samples were placed in a separate type, the name of which reflects the dominant position of cracking products in the composition;
- -
- type 8—HDSAR + VR—sample 4 has similar density characteristics to samples 1–3, but significantly higher viscosity. Moreover, it is so high that in order to achieve it, there are not enough available components and it is necessary to introduce an additional high-density and high-viscosity fraction, for which the visbreaking residue (VisR) obtained from low-sulfur tar was chosen, with a density of 1050 kg/m3, a viscosity of 50 cSt, and a sulfur content of 1.5% wt.
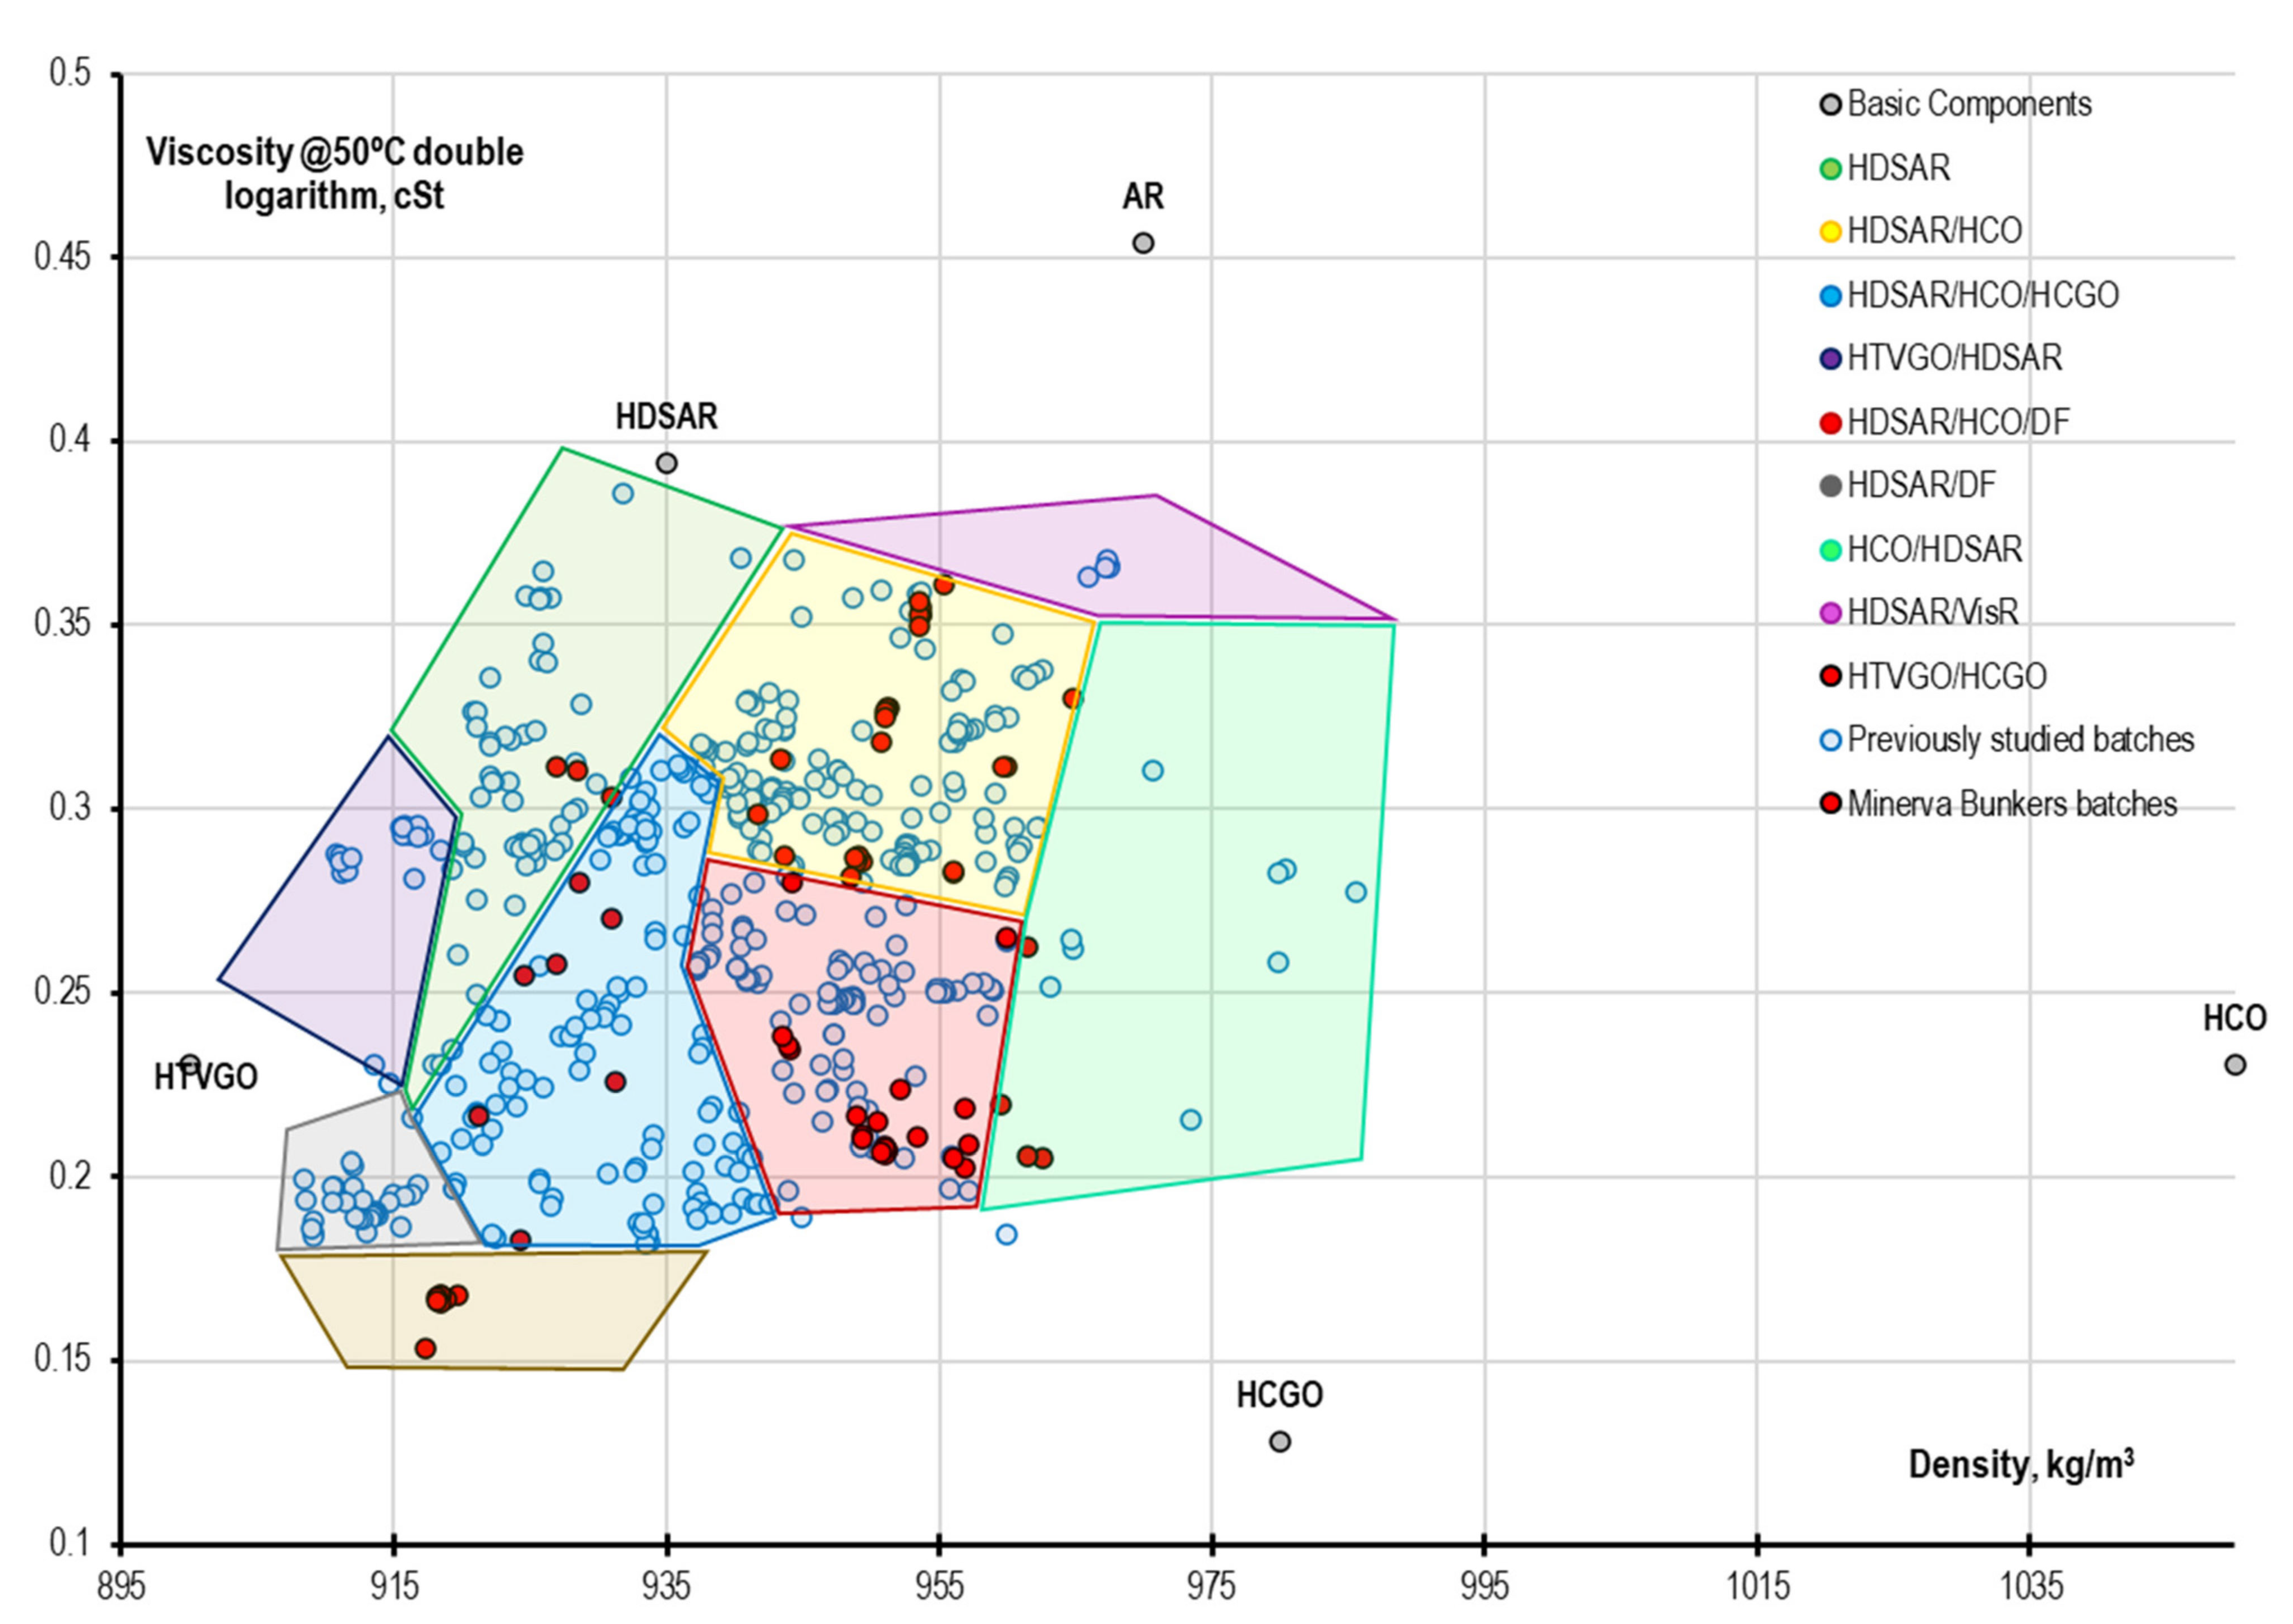
3.1.4. Minerva Bunkers
3.1.5. Other Manufacturers
3.2. Origin of the Low-Sulfur Residual Component
3.3. Analysis of VLSFO Fuel Compositions of RMG 380 Brand (Other Ports)
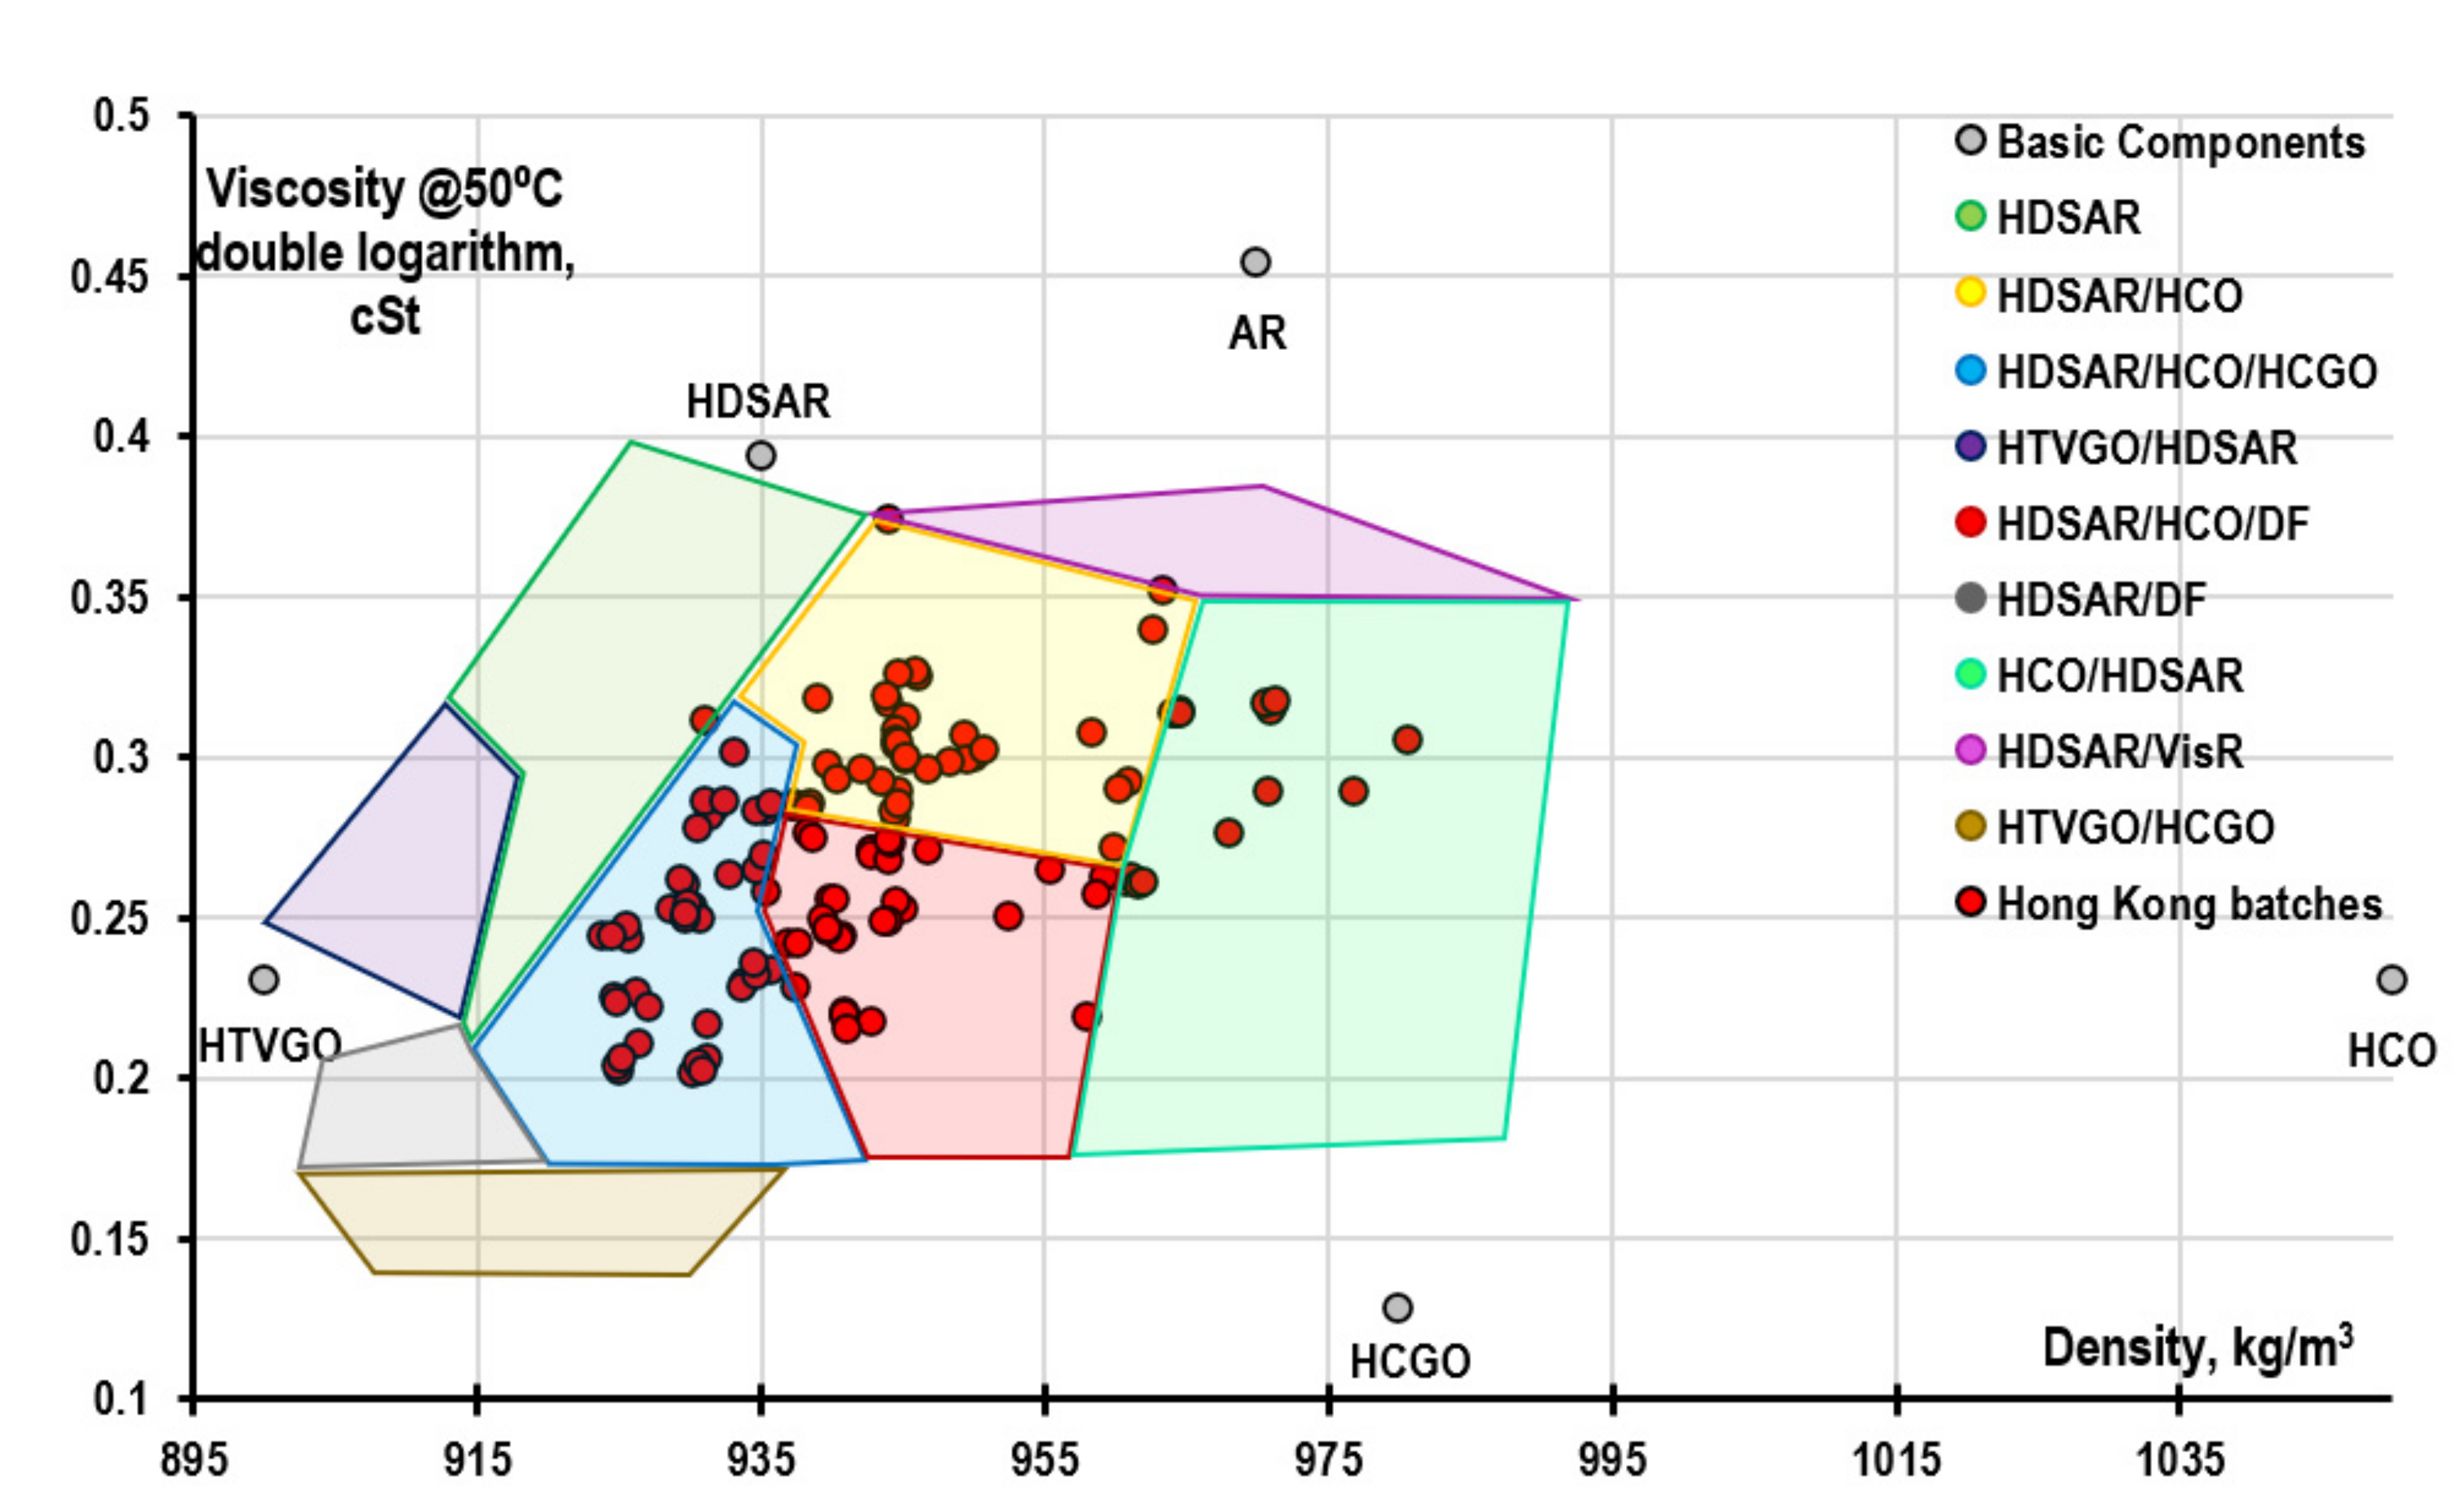
3.3.1. Hong Kong Port
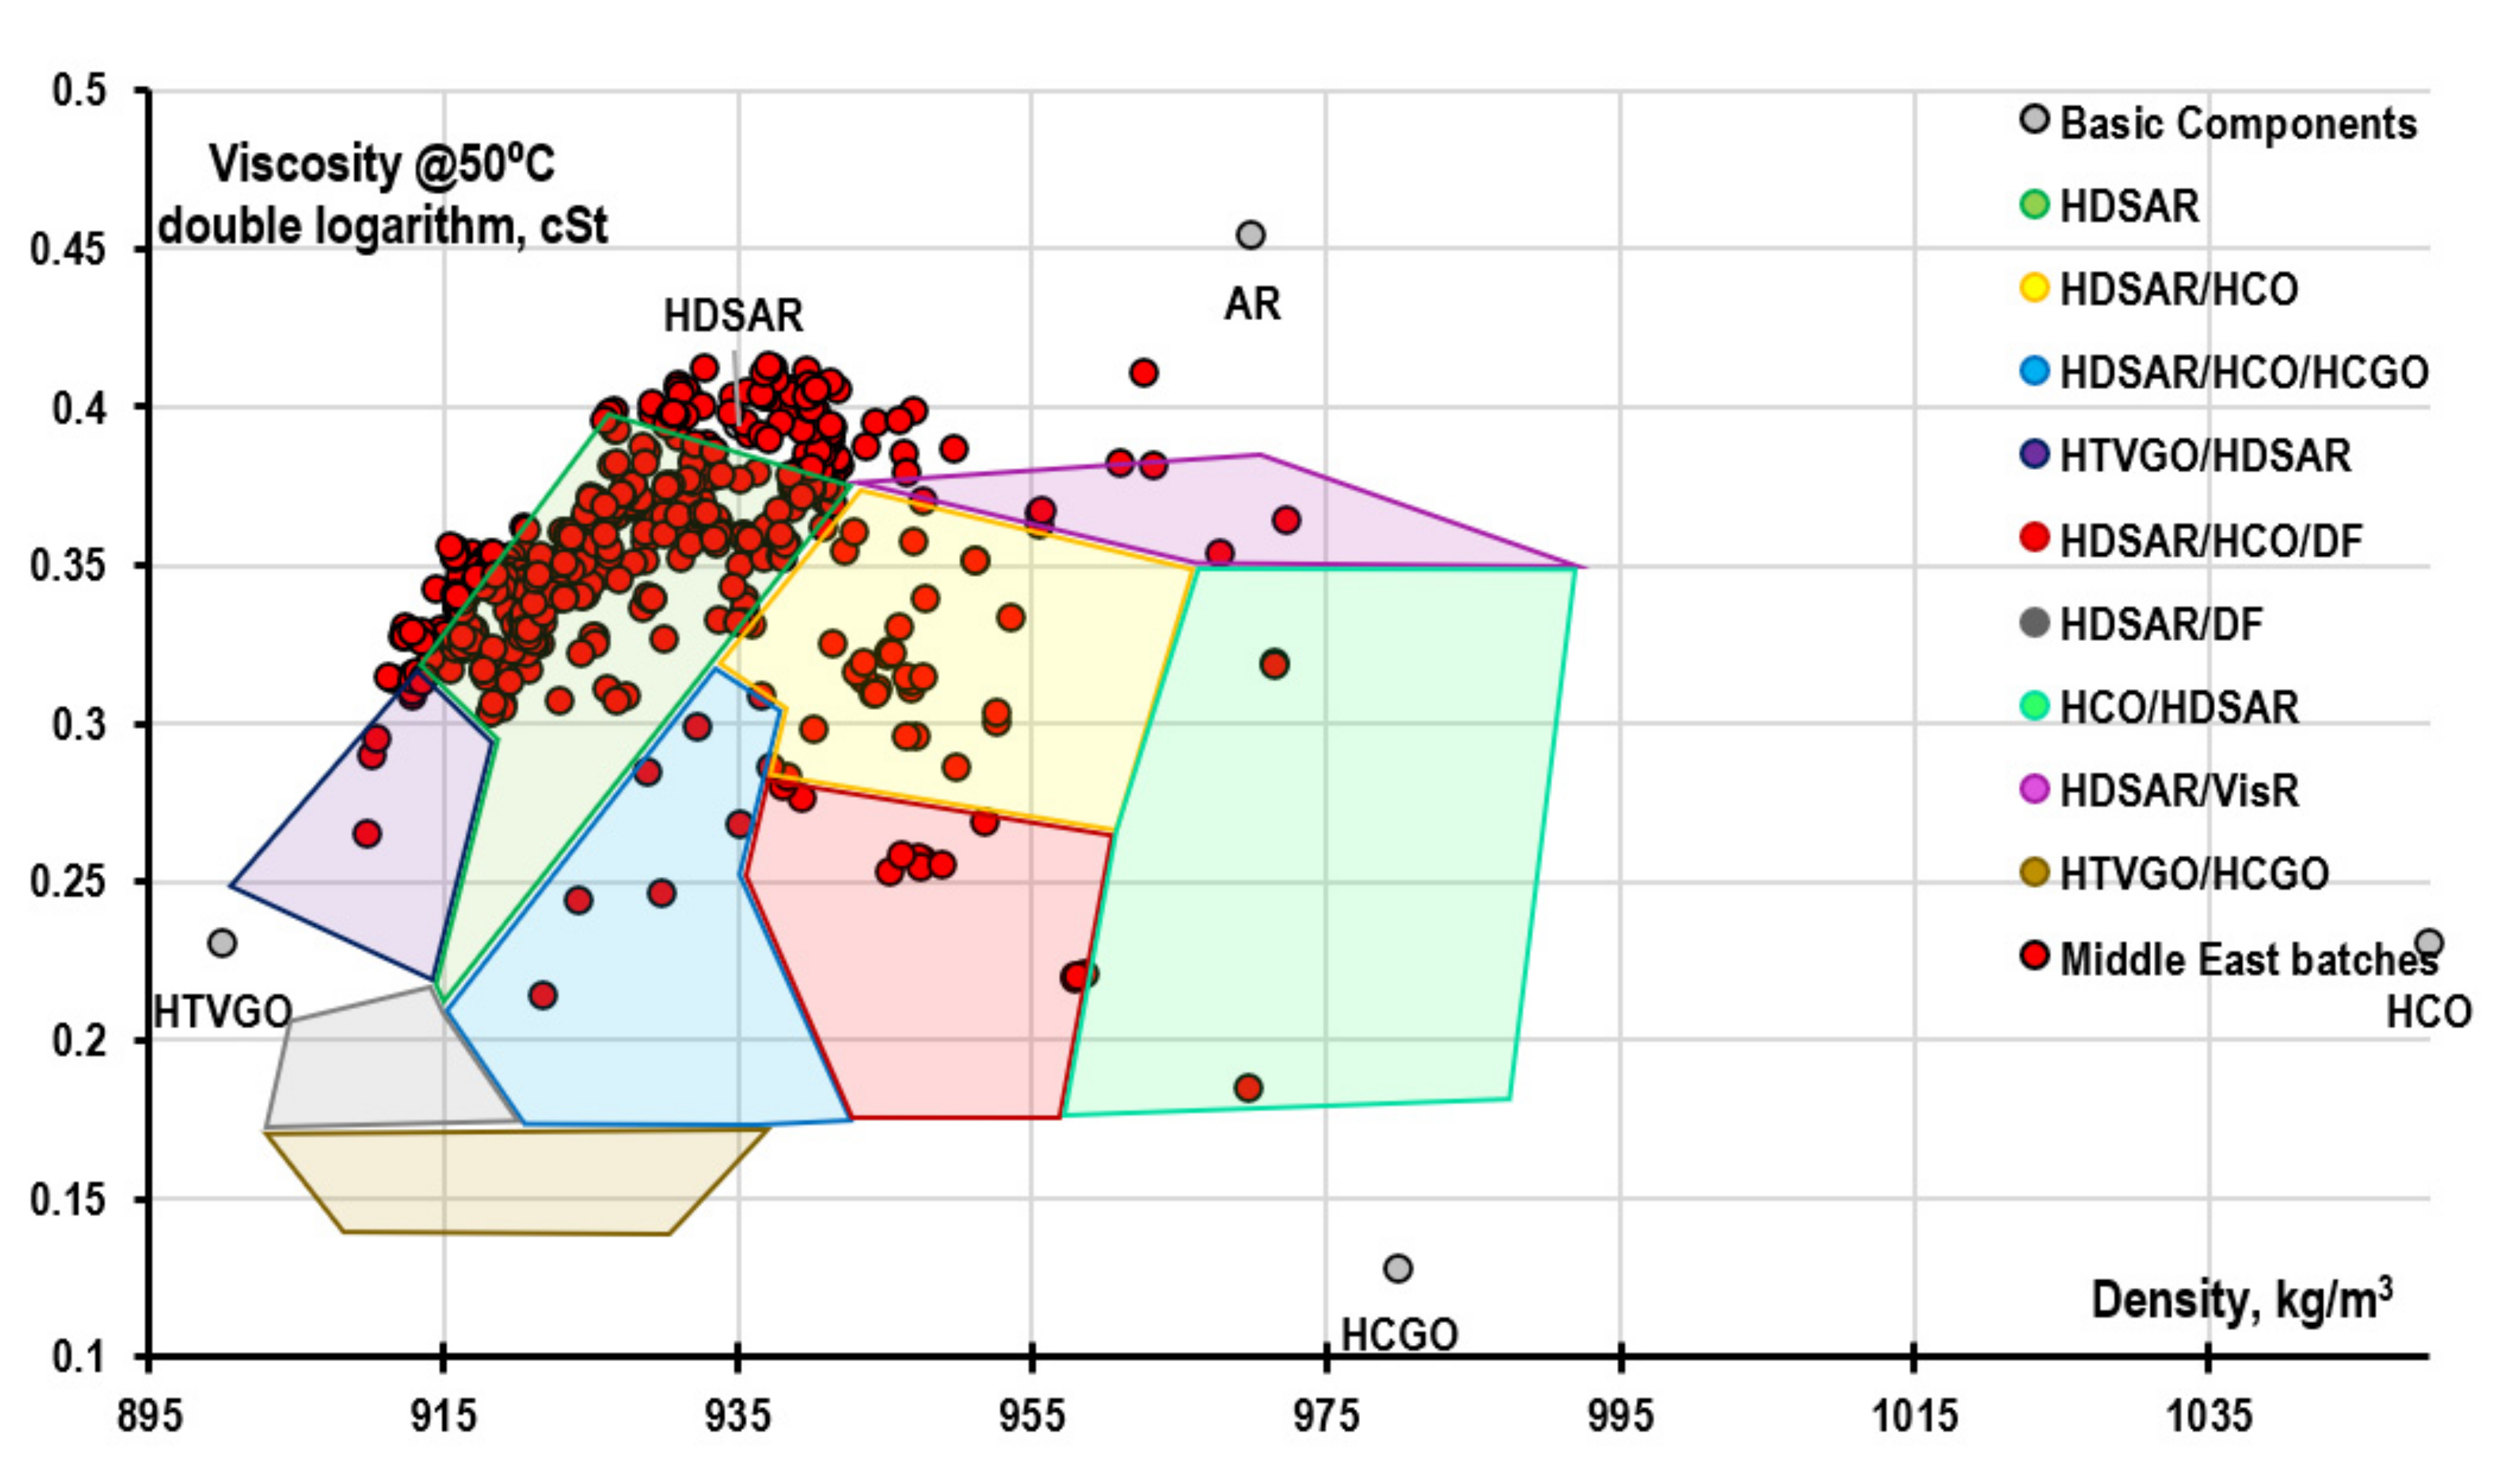
3.3.2. Ports of the Middle East
3.3.3. Ports of North America
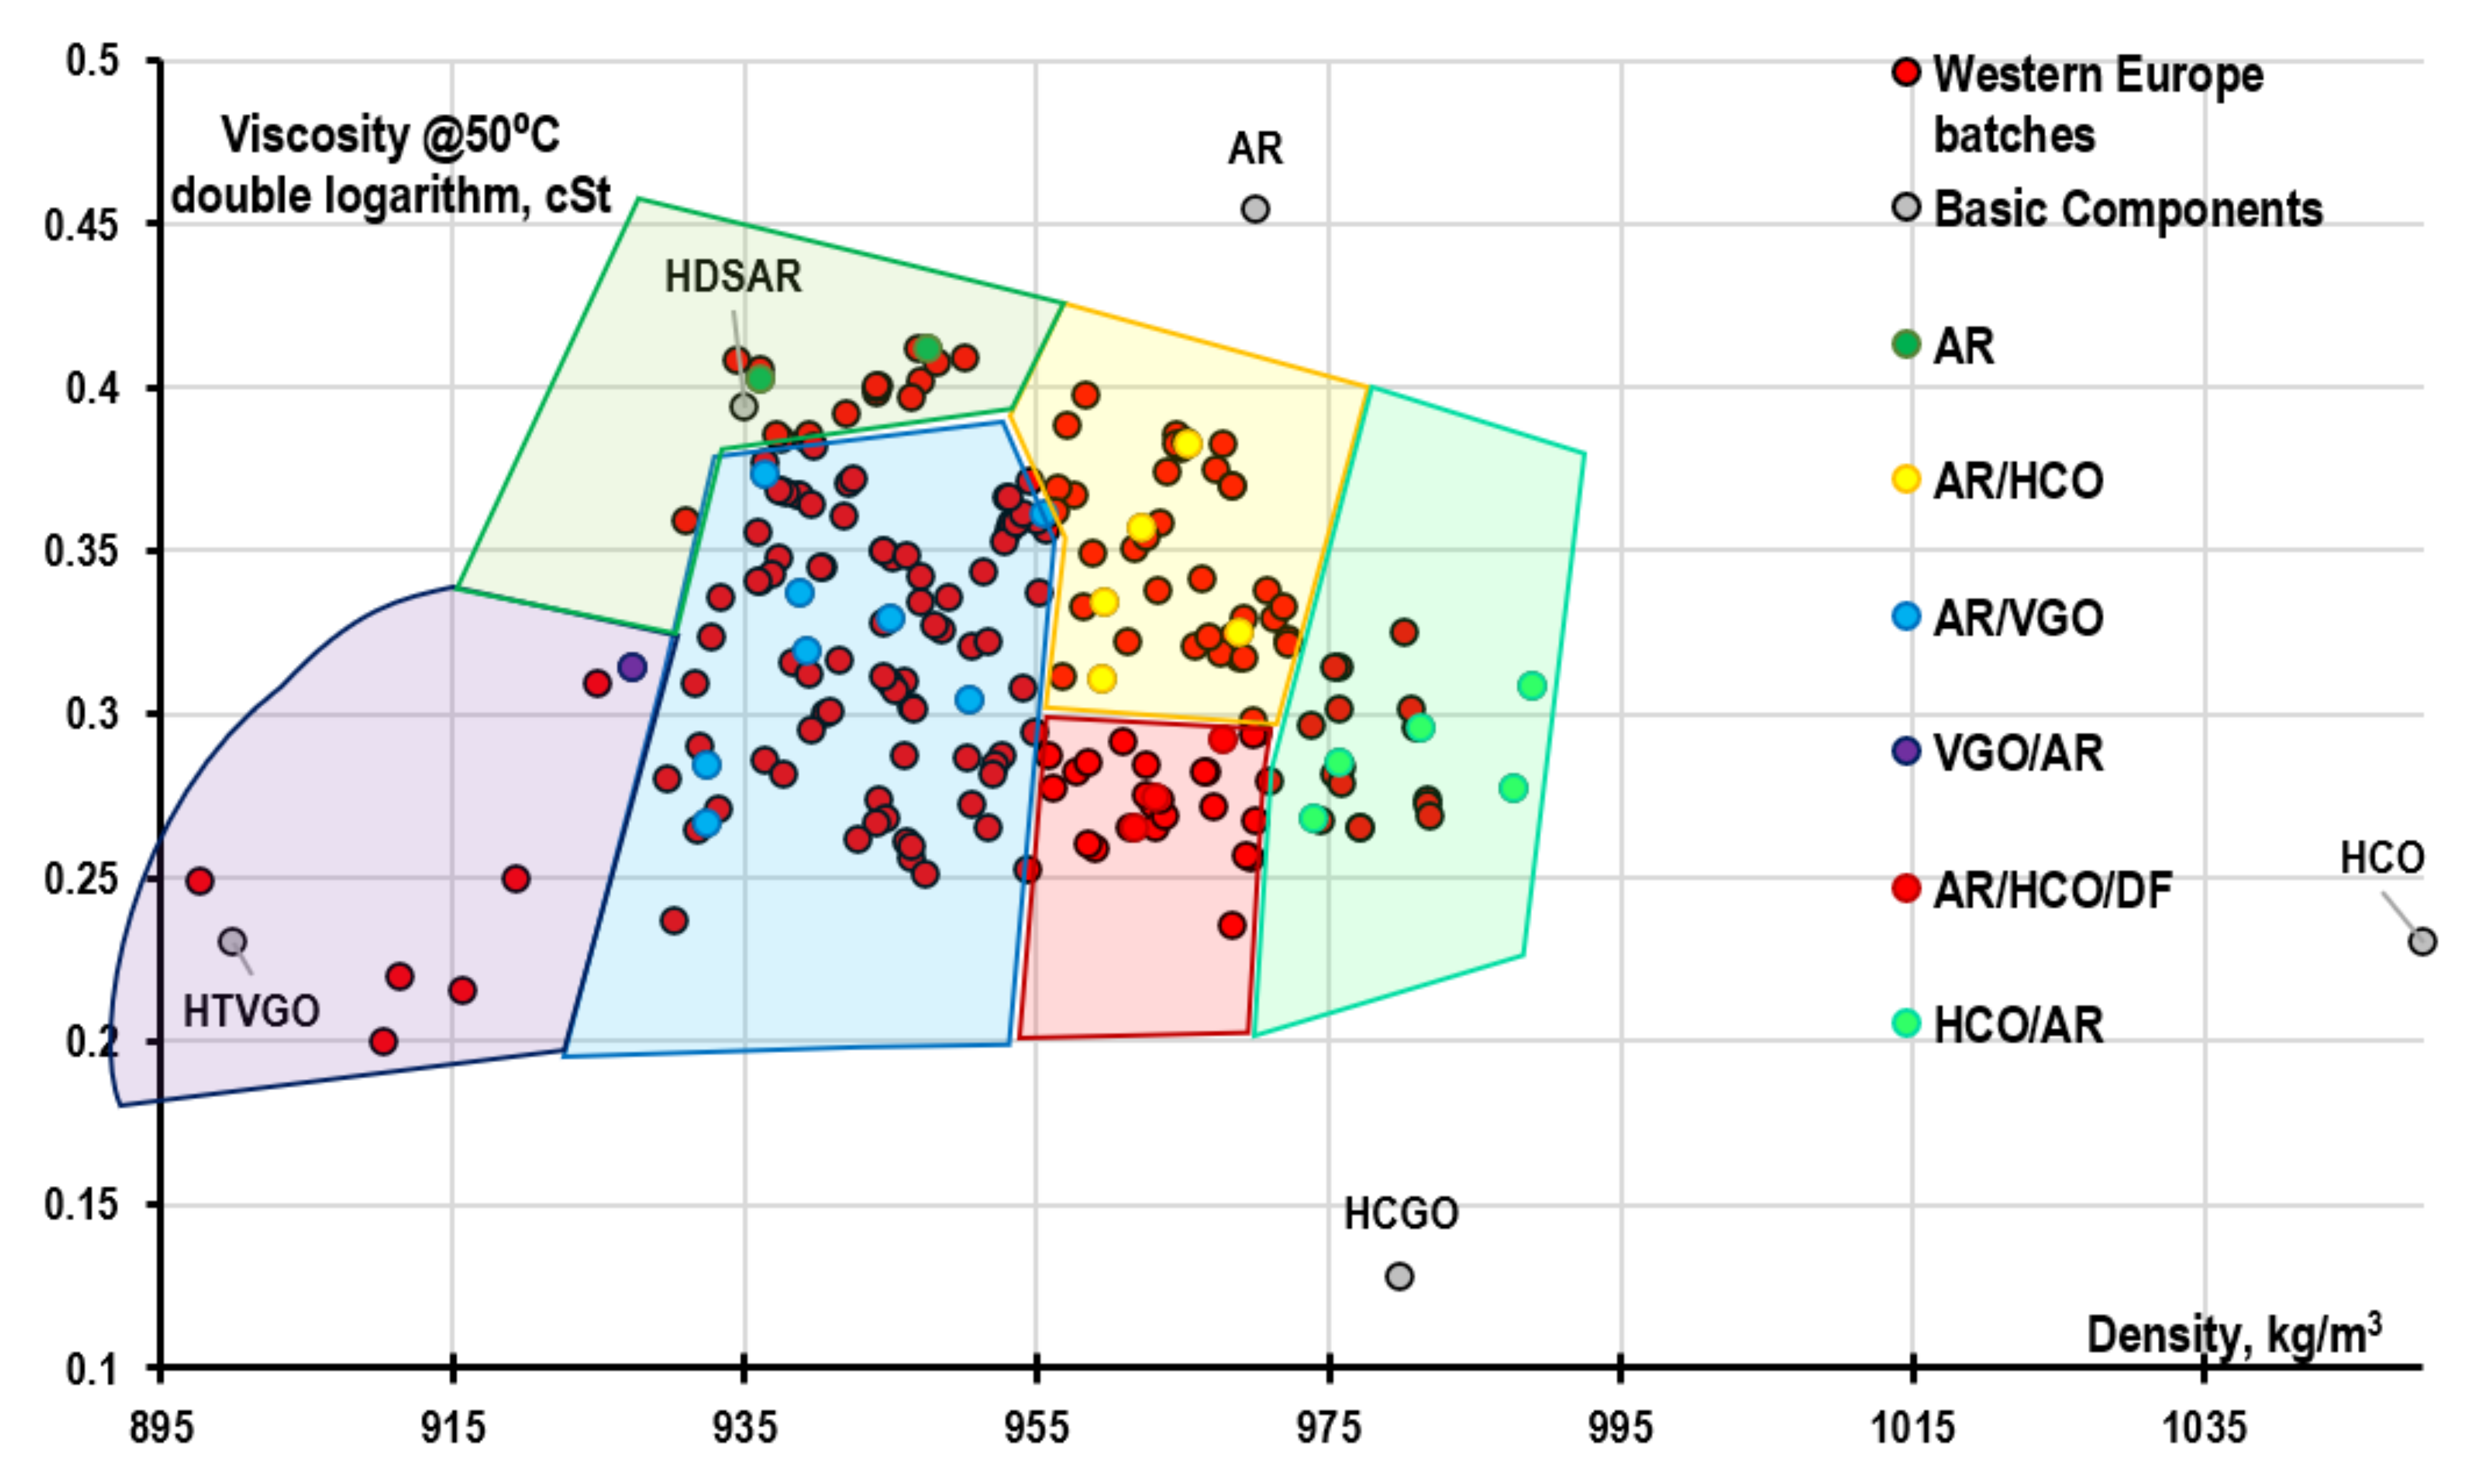
3.3.4. Ports of Western Europe
- -
- low-sulfur straight-run AR—the sulfur content of 0.8% was calculated earlier based on the properties of the extracted oils; density 970 kg/m3; viscosity at 50 °C 700 cSt.
- -
- Hydrotreated/hydrodesulfurized atmospheric residue (HDSAR) is a standard product of a hydrotreating plant: sulfur content 0.3%; density 930 kg/m3; viscosity at 50 °C 300 cSt.
- -
- Visbreaking residue (VisR) is obtained from low-sulfur tar and has a sulfur content of 1.2%; density of 1050 kg/m3; viscosity at 50 °C 3000 cSt.
- -
- Heavy catalytic cracker cycle oil (HCO) has properties similar to those previously adopted for ports in Asia, the Middle East, and America: sulfur content 0.5%, density 1050 kg/m3, and viscosity at 50 °C 50 cSt.
- -
- Hydrotreated vacuum gas oil (HTVGO) is a standard product of a catalytic cracking feedstock preparation unit: 0.1% sulfur content, density 900 kg/m3, viscosity at 50 °C 50 cSt.
- -
- Straight-run vacuum gas oil (VGO) is a low-sulfur vacuum gas oil obtained from Western European oils: sulfur content 0.6%, density 910 kg/m3, viscosity at 50 °C 70 cSt.
- -
- Diesel fuel (DF)—depending on the sulfur content in marine fuel, diesel fuel from straight-run to ultra-low-sulfur can be used. The properties are within the following limits: sulfur content 0.001–1.0%, density 828–840 kg/m3, viscosity at 50 °C 2.0–2.4 cSt.

| Type No. | Approximate Composition of the Composition, % wt. | Type Code Name | Number of Batches | |||
|---|---|---|---|---|---|---|
| AR | HTVGO + VGO | HCO | DF | |||
| 1 | 90–100 | 0–10 | <3 | <3 | AR | 19 |
| 2 | 45–90 | 0–25 | 15–35 | 0–5 | AR + HCO | 42 |
| 3 | 50–70 | 20–40 | 0–15 | 0–15 | AR + VGO | 98 |
| 4 | 30–45 | 50–70 | <3 | 0–15 | VGO + AR | 7 |
| 5 | 40–50 | 0–25 | 15–35 | 5–15 | AR + HCO + DF | 29 |
| 6 | 30–45 | 0–20 | 35–50 | 0–10 | HCO + AR | 21 |

3.4. Analysis of RME 180 VLSFO Fuel Compositions
3.5. Analysis of VLSFO Fuel Compositions of RMD 80 Brand
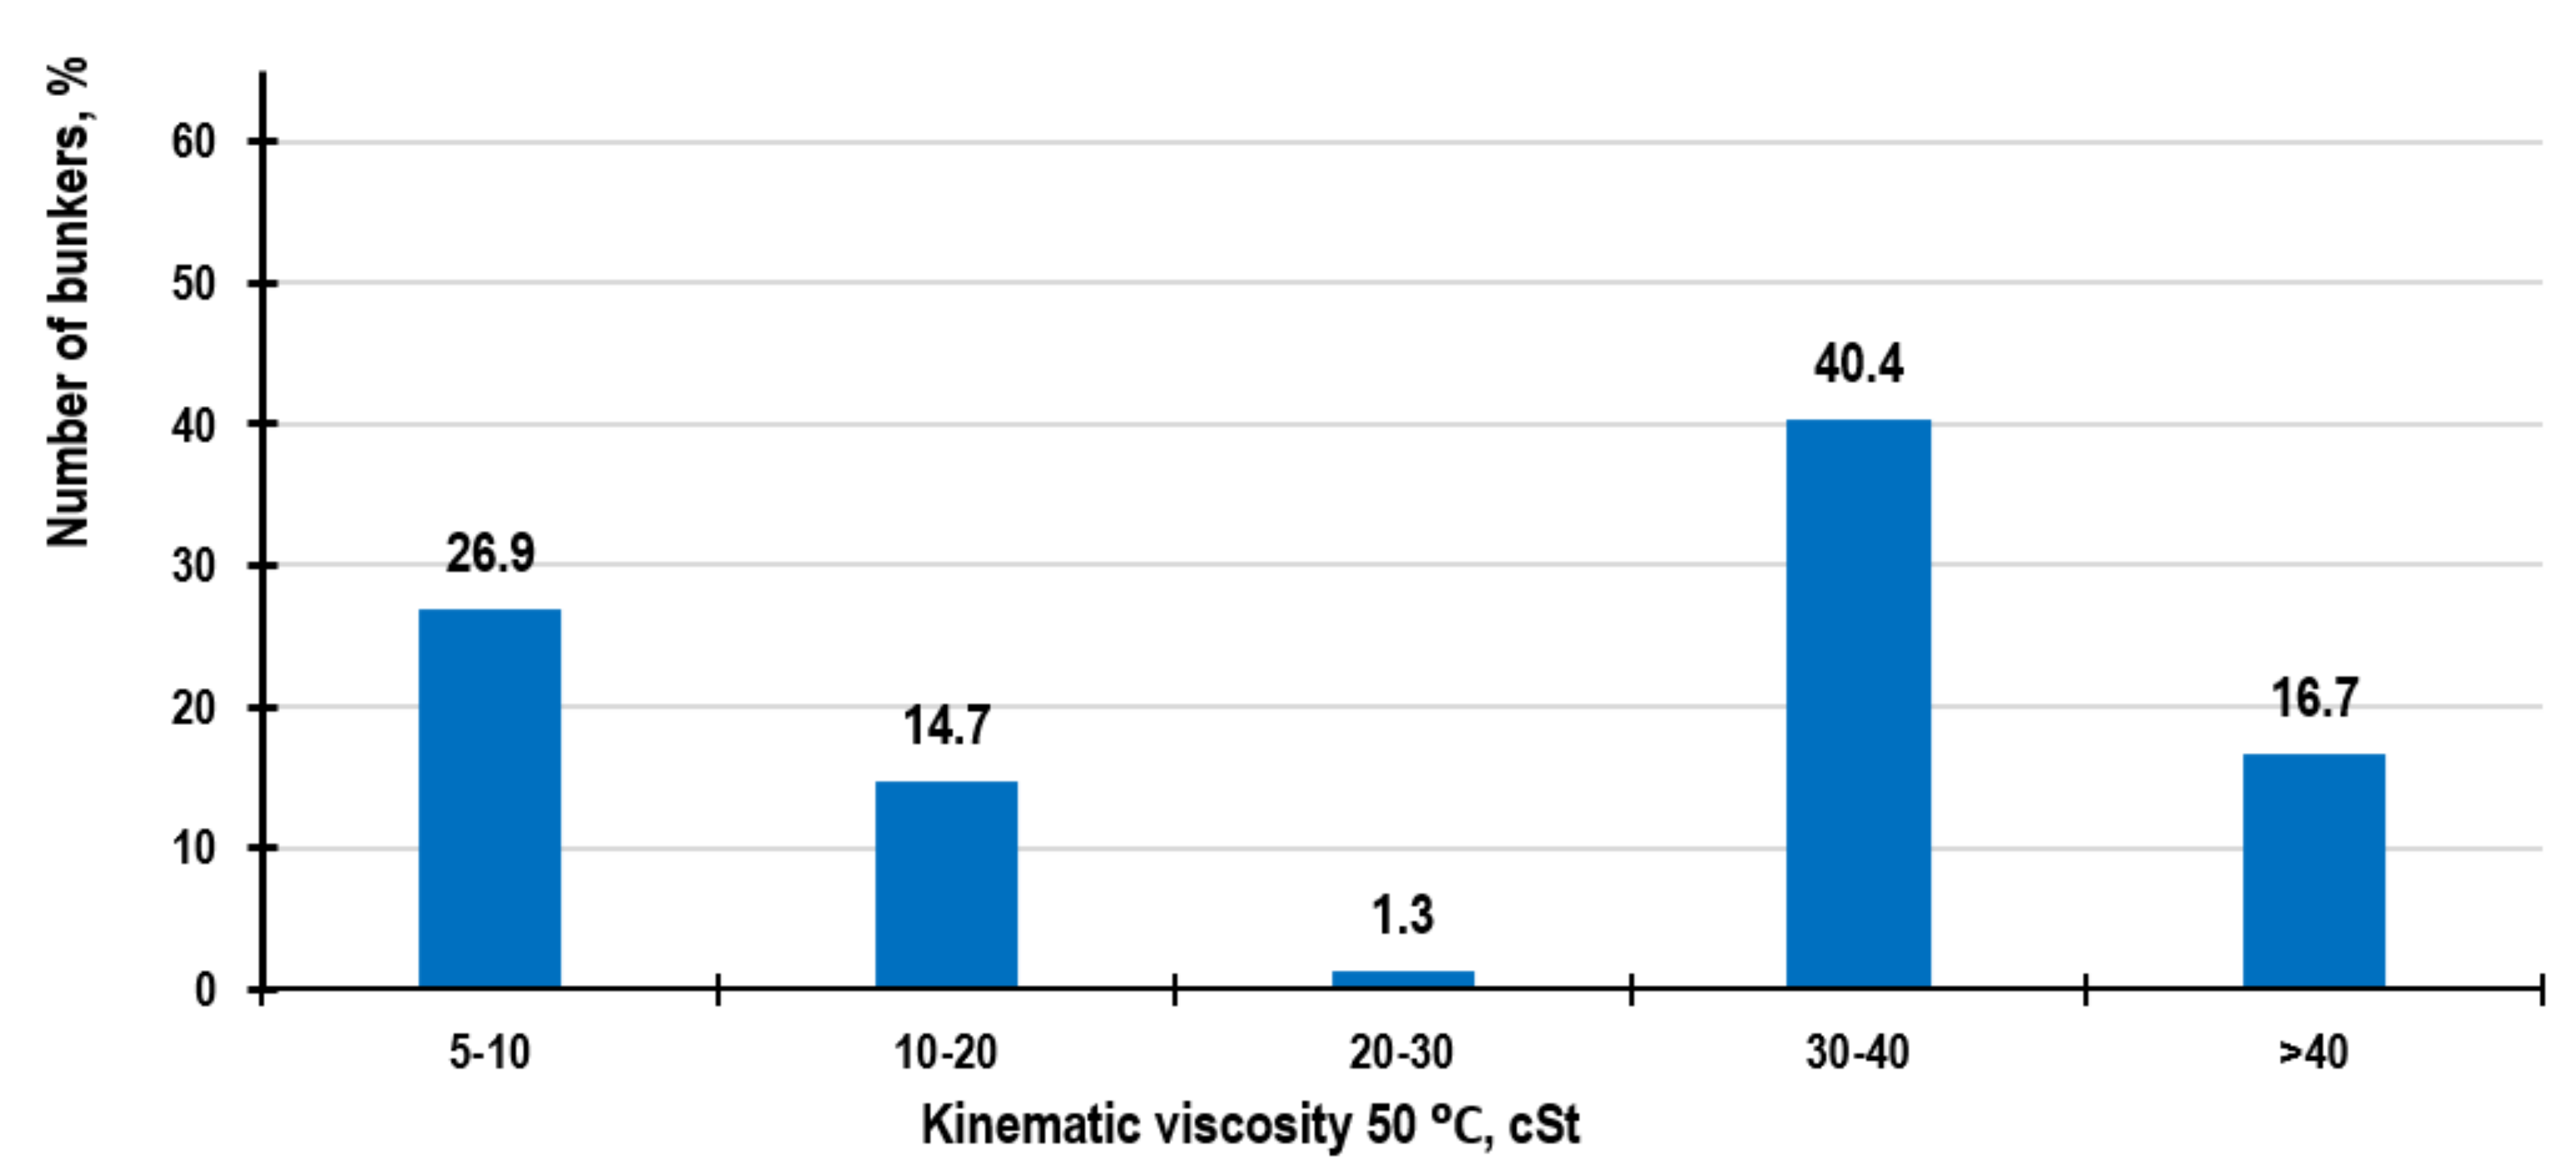
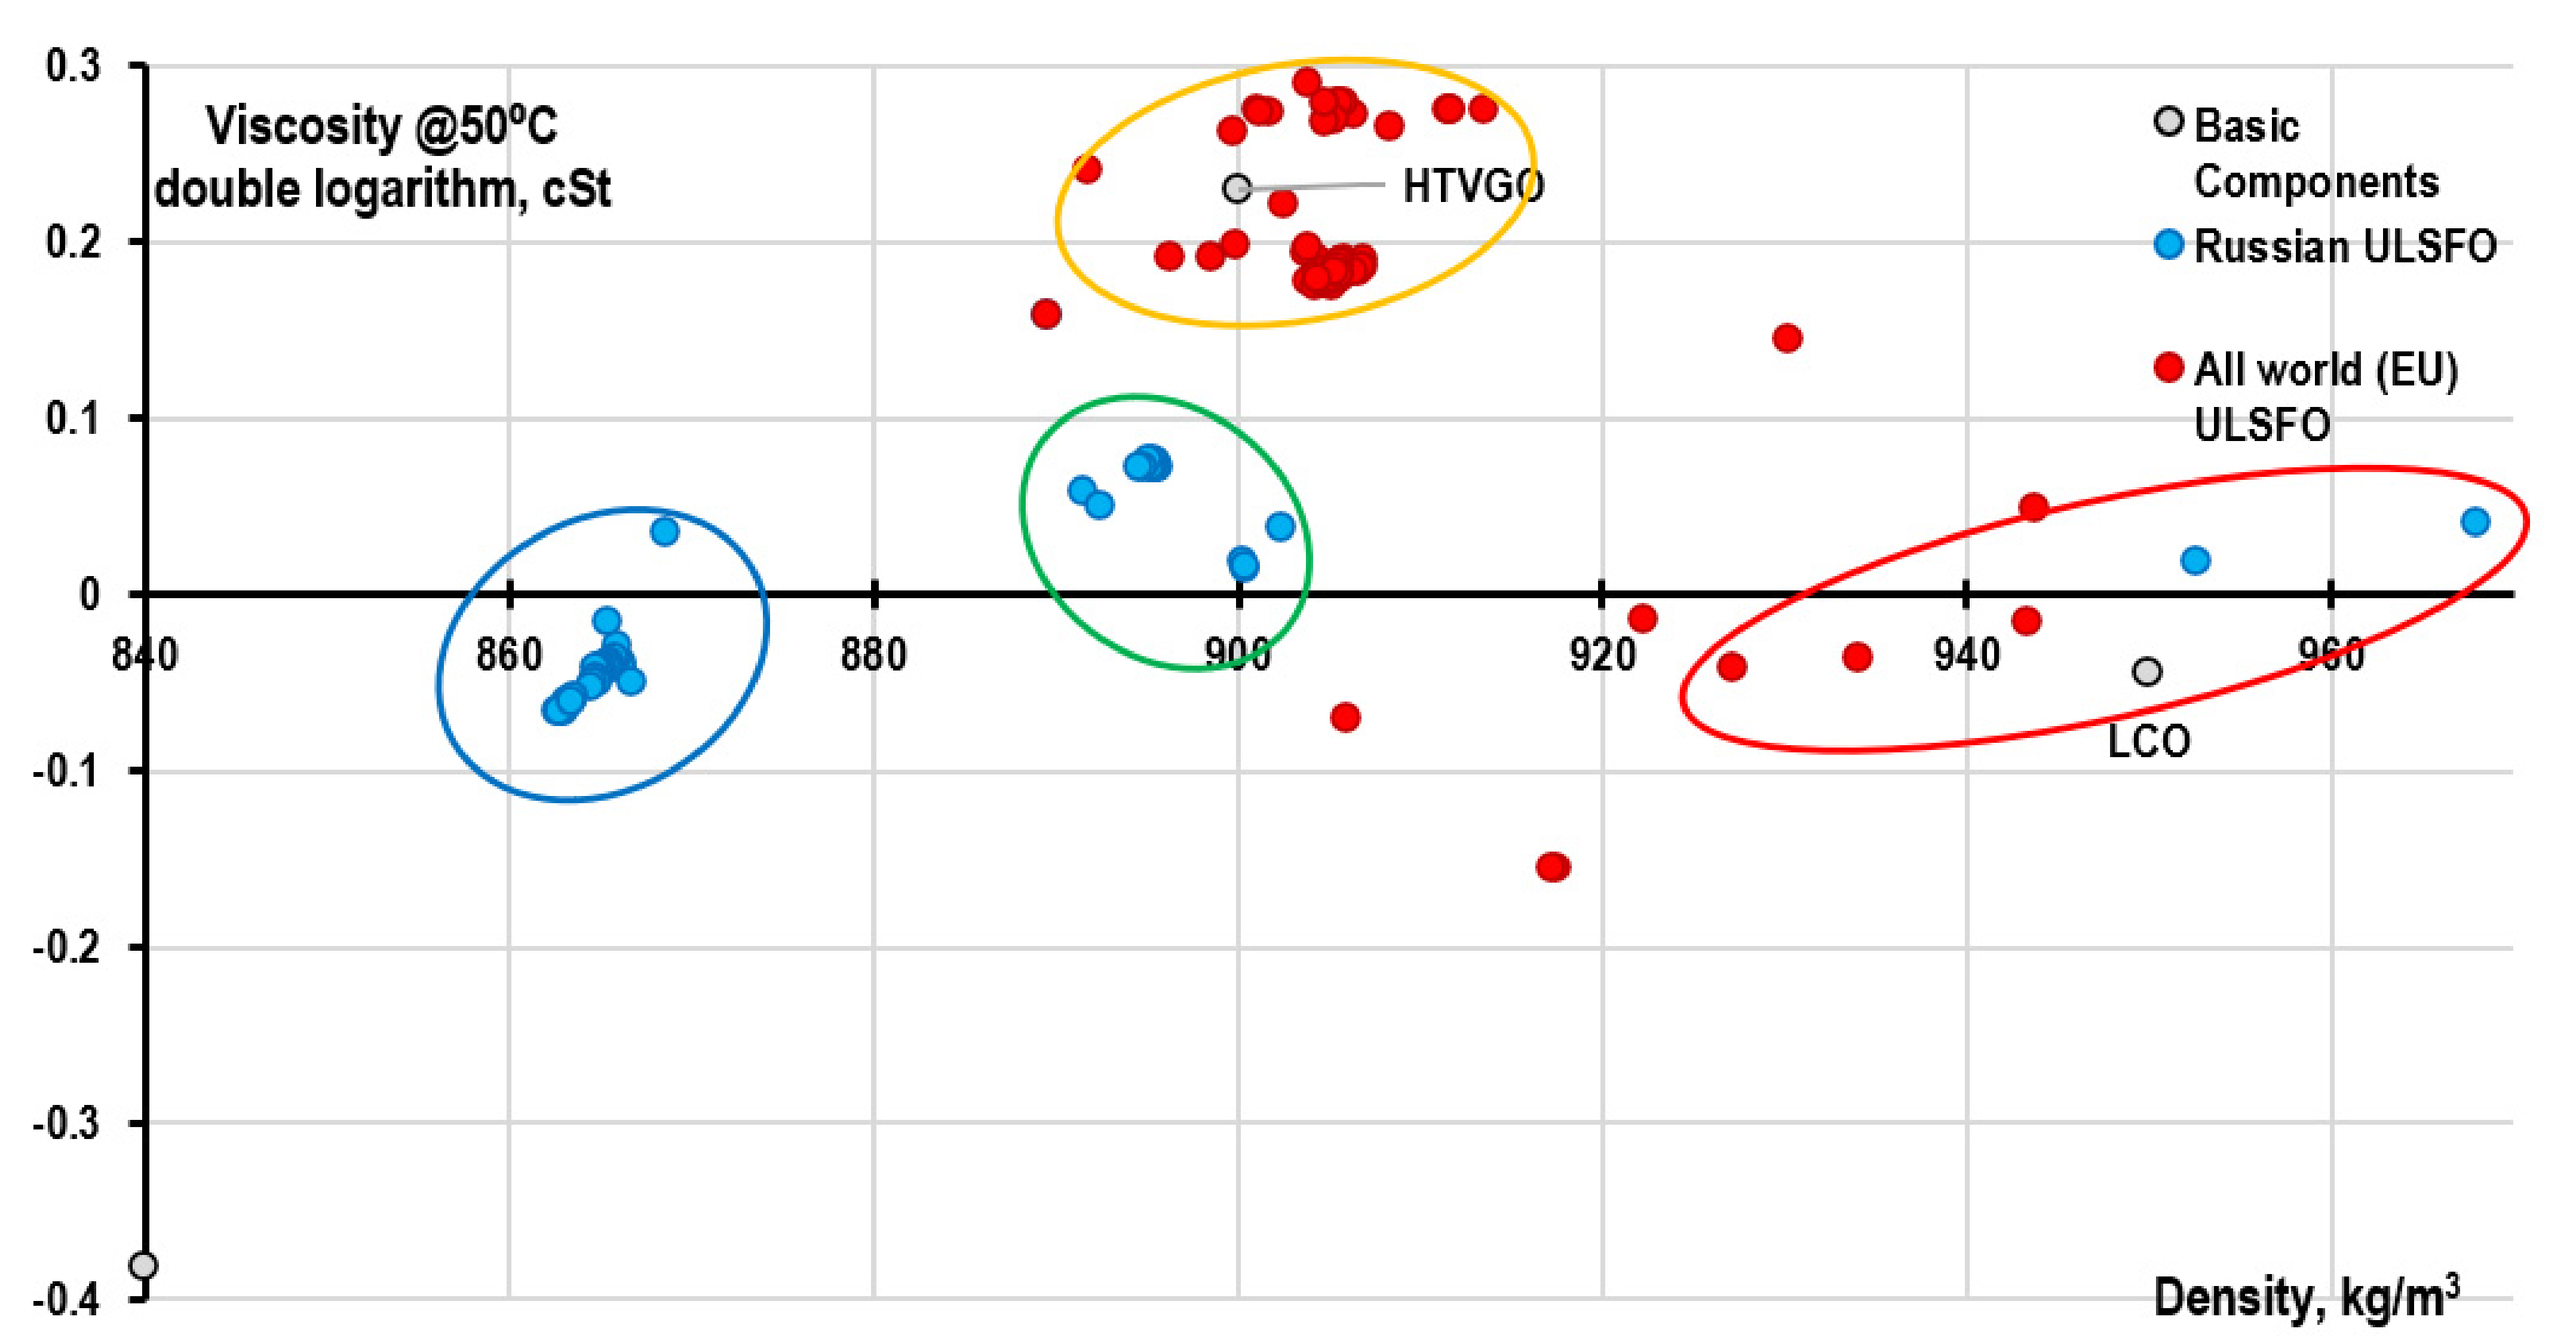
3.6. Analysis of ULSFO Fuel Compositions
4. Conclusions
Author Contributions
Funding
Data Availability Statement
Conflicts of Interest
Acronyms
| VLSFO | Very-Low-Sulfur Fuel Oil |
| ULSFO | Ultra-Low-Sulfur Fuel Oil |
| DF | Diesel Fuel |
| VGO | Vacuum Gas Oil |
| HTVGO | Hydrotreated Vacuum Gas Oil |
| LCO | Catalytic Cracker Light Cycle Oil |
| HCO | Catalytic Cracker Heavy Cycle Oil |
| LCGO | Light Coking Gas Oil |
| HCGO | Heavy Coking Gas Oil |
| AR | Atmospheric Residue |
| HDSAR | Hydrodesulfurized Atmospheric Residue |
| FO | Fuel Oil |
| AR | Atmospheric Residue |
| VR | Vacuum Residue |
| IMO | International Maritime Organization |
| SECA | Special Environmental Control Area |
| FAME | Fatty Acid Methyl Ester |
| MFO | Medium Fuel Oil |
| IFO | Intermediate Fuel Oil |
| MDO | Marine Diesel Oil |
| MGO | Marine Gas Oil |
References
- Abdellatief, T.M.M.; Ershov, M.A.; Kapustin, V.M.; Chernysheva, E.A.; Savelenko, V.D.; Salameh, T.; Abdelkareem, M.A.; Olabi, A.G. Uniqueness Technique for Introducing High Octane Environmental Gasoline Using Renewable Oxygenates and Its Formulation on Fuzzy Modeling. Sci. Total Environ. 2022, 802, 149863. [Google Scholar] [CrossRef]
- Abdellatief, T.M.M.; Ershov, M.A.; Kapustin, V.M.; Ali Abdelkareem, M.; Kamil, M.; Olabi, A.G. Recent Trends for Introducing Promising Fuel Components to Enhance the Anti-Knock Quality of Gasoline: A Systematic Review. Fuel 2021, 291, 120112. [Google Scholar] [CrossRef]
- Ershov, M.A.; Grigorieva, E.V.; Abdellatief, T.M.M.; Chernysheva, E.A.; Makhin, D.Y.; Kapustin, V.M. A New Approach for Producing Mid-Ethanol Fuels E30 Based on Low-Octane Hydrocarbon Surrogate Blends. Fuel Process. Technol. 2021, 213, 106688. [Google Scholar] [CrossRef]
- Ershov, M.A.; Grigorieva, E.V.; Abdellatief, T.M.M. Hybrid Low-Carbon High-Octane Oxygenated Environmental Gasoline Based on Low-Octane Hydrocarbon Fractions. Sci. Total Environ. 2021, 756, 142715. [Google Scholar] [CrossRef]
- Ershov, M.A.; Klimov, N.A.; Burov, N.O.; Abdellatief, T.M.M.; Kapustin, V.M. Creation a Novel Promising Technique for Producing an Unleaded Aviation Gasoline 100UL. Fuel 2021, 284, 118928. [Google Scholar] [CrossRef]
- Rekhletskaya, E.S.; Ershov, M.A.; Savelenko, V.D.; Makhmudova, A.E.; Kapustin, V.M.; Abdellatief, T.M.M.; Potanin, D.A.; Smirnov, V.A.; Geng, T.; Abdelkareem, M.A.; et al. Unraveling the Superior Role of Characterizing Methyl Ester of Isohexene as an Innovative High-Octane Gasoline Mixing Component. Energy Fuels 2022, 36, 11829–11838. [Google Scholar] [CrossRef]
- Ershov, M.; Potanin, D.; Tarazanov, S.; Abdellatief, T.; Kapustin, V. Blending Characteristics of Isooctene, MTBE, and TAME as Gasoline Components. Energy Fuels 2020, 34, 2816–2823. [Google Scholar] [CrossRef]
- Ershov, M.; Potanin, D.; Gueseva, A.; Abdellatief, T.M.M.; Kapustin, V. Novel Strategy to Develop the Technology of High-Octane Alternative Fuel Based on Low-Octane Gasoline Fischer-Tropsch Process. Fuel 2020, 261, 116330. [Google Scholar] [CrossRef]
- Abdellatief, T.M.M.; Ershov, M.A.; Kapustin, V.M.; Chernysheva, E.A.; Savelenko, V.D.; Salameh, T.; Abdelkareem, M.A.; Olabi, A.G. Novel Promising Octane Hyperboosting Using Isoolefinic Gasoline Additives and Its Application on Fuzzy Modeling. Int. J. Hydrogen Energy 2022, 47, 4932–4942. [Google Scholar] [CrossRef]
- Ershov, M.A.; Abdellatief, T.M.M.; Potanin, D.A.; Klimov, N.A.; Chernysheva, E.A.; Kapustin, V.M. Characteristics of Isohexene as a Novel Promising High-Octane Gasoline Booster. Energy Fuels 2020, 34, 8139–8149. [Google Scholar] [CrossRef]
- El-Bassiouny, A.A.; Aboul-Fotouh, T.M.; Abdellatief, T.M.M. Upgrading the Commercial Gasoline A80 by Using Ethanol and Refinery Products. Int. J. Sci. Eng. Res. 2015, 6, 405–417. [Google Scholar]
- Jiang, Y.; Wang, Z.; Ma, Y.; Ji, Y.; Cai, W.; Han, F. Supercritical CO2 Power Cycle and Ejector Refrigeration Cycle for Marine Dual Fuel Engine Efficiency Enhancement by Utilizing Exhaust Gas and Charge Air Heat. J. Mar. Sci. Eng. 2022, 10, 1404. [Google Scholar] [CrossRef]
- Gabdulkhakov, R.R.; Rudko, V.A.; Pyagay, I.N. Methods for Modifying Needle Coke Raw Materials by Introducing Additives of Various Origin (Review). Fuel 2022, 310, 122265. [Google Scholar] [CrossRef]
- Abdellatief, T.M.M.; El-Bassiouny, A.A.; Aboul-Fotouh, T.M. An Environmental Gasoline; Lap Lambert Academic Publishing: Saarbrücken, Germany, 2015; Volume 11, pp. 1–121. [Google Scholar]
- El-Bassiouny, A.A.; Aboul-Fotouh, T.M.; Abdellatief, T.M.M. Maximize the Production of Environmental, Clean and High Octane Number Gasoline-Ethanol Blends by Using Refinery Products. Int. J. Sci. Eng. Res. 2015, 6, 1792–1803. [Google Scholar]
- Vedachalam, S.; Baquerizo, N.; Dalai, A.K. Review on Impacts of Low Sulfur Regulations on Marine Fuels and Compliance Options. Fuel 2022, 310, 122243. [Google Scholar] [CrossRef]
- Zincir, B.; Deniz, C.; Tunér, M. Investigation of Environmental, Operational and Economic Performance of Methanol Partially Premixed Combustion at Slow Speed Operation of a Marine Engine. J. Clean. Prod. 2019, 235, 1006–1019. [Google Scholar] [CrossRef]
- Litvinenko, V.; Bowbrick, I.; Naumov, I.; Zaitseva, Z. Global Guidelines and Requirements for Professional Competencies of Natural Resource Extraction Engineers: Implications for ESG Principles and Sustainable Development Goals. J. Clean. Prod. 2022, 338, 130530. [Google Scholar] [CrossRef]
- Mardashov, D.; Duryagin, V.; Islamov, S. Technology for Improving the Efficiency of Fractured Reservoir Development Using Gel-Forming Compositions. Energies 2021, 14, 8254. [Google Scholar] [CrossRef]
- Stratiev, D.; Shishkova, I.; Tankov, I.; Pavlova, A. Challenges in Characterization of Residual Oils. A Review. J. Pet. Sci. Eng. 2019, 178, 227–250. [Google Scholar] [CrossRef]
- Chun, K.W.; Kim, M.; Hur, J.-J. Development of a Marine LPG-Fueled High-Speed Engine for Electric Propulsion Systems. J. Mar. Sci. Eng. 2022, 10, 1498. [Google Scholar] [CrossRef]
- Ershov, M.A.; Savelenko, V.D.; Makhova, U.A.; Makhmudova, A.E.; Zuikov, A.V.; Kapustin, V.M.; Abdellatief, T.M.M.; Burov, N.O.; Geng, T.; Abdelkareem, M.A.; et al. Current Challenge and Innovative Progress for Producing HVO and FAME Biodiesel Fuels and Their Applications. Waste Biomass Valorization 2022. [Google Scholar] [CrossRef]
- Ershov, M.A.; Savelenko, V.D.; Makhova, U.A.; Kapustin, V.M.; Potanin, D.A.; Habibullin, I.F.; Lazarev, V.E.; Abdellatief, T.M.M.; Abdelkareem, M.A.; Olabi, A.G. New Insights on Introducing Modern Multifunctional Additives into Motor Gasoline. Sci. Total Environ. 2022, 808, 152034. [Google Scholar] [CrossRef]
- Ershov, M.; Potanin, D.; Grigorieva, E.; Abdellatief, T.; Kapustin, V. Discovery of a High-Octane Environmental Gasoline Based on the Gasoline Fischer–Tropsch Process. Energy Fuels 2020, 34, 4221–4229. [Google Scholar] [CrossRef]
- Savelenko, V.D.; Ershov, M.A.; Kapustin, V.M.; Chernysheva, E.A.; Abdellatief, T.M.M.; Makhova, U.A.; Makhmudova, A.E.; Abdelkareem, M.A.; Olabi, A.G. Pathways Resilient Future for Developing a Sustainable E85 Fuel and Prospects towards Its Applications. Sci. Total Environ. 2022, 844, 157069. [Google Scholar] [CrossRef]
- Abdellatief, T.M.M.; Ershov, M.A.; Kapustin, V.M. New Recipes for Producing a High-Octane Gasoline Based on Naphtha from Natural Gas Condensate. Fuel 2020, 276, 118075. [Google Scholar] [CrossRef]
- Yang, J.; Wu, L.; Zheng, J. Multi-Objective Weather Routing Algorithm for Ships: The Perspective of Shipping Company’s Navigation Strategy. J. Mar. Sci. Eng. 2022, 10, 1212. [Google Scholar]
- Vráblík, A.; Schlehöfer, D.; Dlasková Jaklová, K.; Hidalgo Herrador, J.M.; Černý, R. Comparative Study of Light Cycle Oil and Naphthalene as an Adequate Additive to Improve the Stability of Marine Fuels. ACS Omega 2022, 7, 2127–2136. [Google Scholar] [CrossRef]
- Abdellatief, T.M.M. Enhancing the Properties of Egyption Gasoline through Modified Operations. Master’s Thesis, Minia University, El-Minia, Egypt, October 2015. [Google Scholar]
- Sagin, S.; Kuropyatnyk, O.; Sagin, A.; Tkachenko, I.; Fomin, O.; Píštěk, V.; Kučera, P. Ensuring the Environmental Friendliness of Drillships during Their Operation in Special Ecological Regions of Northern Europe. J. Mar. Sci. Eng. 2022, 10, 1331. [Google Scholar] [CrossRef]
- Liu, J.; Law, A.W.-K.; Duru, O. Reducing Emissions of Atmospheric Pollutants along Major Dry Bulk and Tanker Routes through Autonomous Shipping. J. Environ. Manage. 2022, 302, 114080. [Google Scholar] [CrossRef]
- Sultanbekov, R.; Islamov, S.; Mardashov, D.; Beloglazov, I.; Hemmingsen, T. Research of the Influence of Marine Residual Fuel Composition on Sedimentation Due to Incompatibility. J. Mar. Sci. Eng. 2021, 9, 1067. [Google Scholar] [CrossRef]
- ISO 8217:2017; Petroleum Products—Fuels (Class F)—Specifications of Marine Fuels. Available online: https://www.iso.org/standard/64247.html#:~:text=ISO%208217%3A2017%20specifies%20the,centrifuging%2C%20filtration)%20before%20use. (accessed on 1 October 2022).
- Kondrasheva, N.K.; Rudko, V.A.; Kondrashev, D.O.; Konoplin, R.R.; Smyshlyaeva, K.I.; Shakleina, V.S. Functional Influence of Depressor and Depressor-Dispersant Additives on Marine Fuels and Their Distillates Components. Pet. Sci. Technol. 2018, 36, 2099–2105. [Google Scholar] [CrossRef]
- ISO 8217:2012; Petroleum Products—Fuels (Class F)—Specifications of Marine Fuels. Available online: https://www.iso.org/standard/59479.html (accessed on 1 October 2022).
- Marine Fuel Oil Advisory. August 2021. ABS. 2021, p. 44. Available online: https://Ww2.Eagle.Org/Content/Dam/Eagle/Advisories-and-Debriefs/Marine-Fuel-Oil-Advisory-21141.Pdf (accessed on 8 October 2022).
- Marine Fuel Oil Advisory. ABS. 2018, p. 44. Available online: https://Www.Iims.Org.Uk/Wp-Content/Uploads/2018/06/Marine-Fuel-Oil-Advisory.Pdf (accessed on 1 October 2022).
- Povarov, V.G.; Efimov, I.; Smyshlyaeva, K.I.; Rudko, V.A. Application of the UNIFAC Model for the Low-Sulfur Residue Marine Fuel Asphaltenes Solubility Calculation. J. Mar. Sci. Eng. 2022, 10, 1017. [Google Scholar] [CrossRef]
- Chen, Q.; Lau, Y.; Ge, Y.-E.; Dulebenets, M.A.; Kawasaki, T.; Ng, A.K.Y. Interactions between Arctic Passenger Ship Activities and Emissions. Transp. Res. Part D Transp. Environ. 2021, 97, 102925. [Google Scholar] [CrossRef]
- Lloyd’s Register–Classification, Training and Advisory Services. Available online: https://Www.Lr.Org/ (accessed on 8 October 2022).
- Ju, H.; Jeon, S. Effect of Ultrasound Irradiation on the Properties and Sulfur Contents of Blended Very Low-Sulfur Fuel Oil (VLSFO). J. Mar. Sci. Eng. 2022, 10, 980. [Google Scholar] [CrossRef]
- Kass, M.; Kaul, B.; Armstrong, B.; Szybist, J.; Lobodin, V. Stability, Rheological and Combustion Properties of Biodiesel Blends with a Very-Low Sulfur Fuel Oil (VLSFO). Fuel 2022, 316, 123365. [Google Scholar] [CrossRef]
- Scarlett, A.G.; Nelson, R.K.; Gagnon, M.M.; Holman, A.I.; Reddy, C.M.; Sutton, P.A.; Grice, K. MV Wakashio Grounding Incident in Mauritius 2020: The World’s First Major Spillage of Very Low Sulfur Fuel Oil. Mar. Pollut. Bull. 2021, 171, 112917. [Google Scholar] [CrossRef]
- Ji, C.; El-Halwagi, M.M. A Data-Driven Study of IMO Compliant Fuel Emissions with Consideration of Black Carbon Aerosols. Ocean Eng. 2020, 218, 108241. [Google Scholar] [CrossRef]
- Bilgili, L. Life Cycle Comparison of Marine Fuels for IMO 2020 Sulphur Cap. Sci. Total Environ. 2021, 774, 145719. [Google Scholar] [CrossRef]
- Andra Luciana, T.; Gasparotti, C.; Rusu, E. Green Fuels—A New Challenge for Marine Industry. Energy Rep. 2021, 7, 127–132. [Google Scholar] [CrossRef]
- Čech, F.; Zítek, M. Marine Fuel Hedging under the Sulfur Cap Regulations. Energy Econ. 2022, 113, 106204. [Google Scholar] [CrossRef]
- Sultanbekov, R.; Beloglazov, I.; Islamov, S.; Ong, M.C. Exploring of the Incompatibility of Marine Residual Fuel: A Case Study Using Machine Learning Methods. Energies 2021, 14, 8422. [Google Scholar] [CrossRef]
- Ashrafi, M.; Lister, J.; Gillen, D. Toward a Harmonization of Sustainability Criteria for Alternative Marine Fuels. Marit. Transp. Res. 2022, 3, 100052. [Google Scholar] [CrossRef]
- Cheaitou, A.; Faury, O.; Cariou, P.; Hamdan, S.; Fabbri, G. Economic and Environmental Impacts of Arctic Shipping: A Probabilistic Approach. Transp. Res. Part D Transp. Environ. 2020, 89, 102606. [Google Scholar] [CrossRef]
- Smyshlyaeva, K.I.; Rudko, V.A.; Kuzmin, K.A.; Povarov, V.G. Asphaltene Genesis Influence on the Low-Sulfur Residual Marine Fuel Sedimentation Stability. Fuel 2022, 328, 125291. [Google Scholar] [CrossRef]
- Kyriklidis, C.; Kyriklidis, M.-E.; Loizou, E.; Stimoniaris, A.; Tsanaktsidis, C.G. Optimal Bio Marine Fuel Production Evolutionary Computation: Genetic Algorithm Approach for Raw Materials Mixtures. Fuel 2022, 323, 124232. [Google Scholar] [CrossRef]
- Tan, Z.; Zhang, M.; Shao, S.; Liang, J.; Sheng, D. Evasion Strategy for a Coastal Cargo Ship with Unpunctual Arrival Penalty under Sulfur Emission Regulation. Transp. Res. Part E Logist. Transp. Rev. 2022, 164, 102818. [Google Scholar] [CrossRef]
- Ershov, M.A.; Savelenko, V.D.; Shvedova, N.S.; Kapustin, V.M.; Abdellatief, T.M.M.; Karpov, N.V.; Dutlov, E.V.; Borisanov, D. V An Evolving Research Agenda of Merit Function Calculations for New Gasoline Compositions. Fuel 2022, 322, 124209. [Google Scholar] [CrossRef]
- Abdellatief, T.M.M.; Ershov, M.A.; Kapustin, V.M.; Chernysheva, E.A.; Savelenko, V.D.; Makhmudova, A.E.; Potanin, D.A.; Salameh, T.; Abdelkareem, M.A.; Olabi, A.G. Innovative Conceptional Approach to Quantify the Potential Benefits of Gasoline-Methanol Blends and Their Conceptualization on Fuzzy Modeling. Int. J. Hydrog. Energy 2022, 47, 35096–35111. [Google Scholar] [CrossRef]
- Dierickx, J.; Dejaegere, Q.; Peeters, J.; Sileghem, L.; Verhelst, S. Performance and Emissions of a High-Speed Marine Dual-Fuel Engine Operating with Methanol-Water Blends as a Fuel. Fuel 2023, 333, 126349. [Google Scholar] [CrossRef]
- Vedachalam, S.; Dalai, A.K. Hydrotreating and Oxidative Desulfurization of Heavy Fuel Oil into Low Sulfur Marine Fuel over Dual Function NiMo/γ–Al2O3 Catalyst. Catal. Today 2022, 407, 165–171. [Google Scholar] [CrossRef]
- Houda, S.; Lancelot, C.; Blanchard, P.; Poinel, L.; Lamonier, C. Ultrasound Assisted Oxidative Desulfurization of Marine Fuels on MoO3/Al2O3 Catalyst. Catal. Today 2021, 377, 221–228. [Google Scholar] [CrossRef]
- Yoo, B.-Y. Economic Assessment of Liquefied Natural Gas (LNG) as a Marine Fuel for CO2 Carriers Compared to Marine Gas Oil (MGO). Energy 2017, 121, 772–780. [Google Scholar] [CrossRef]
- Ershov, M.A.; Savelenko, V.D.; Makhova, U.A.; Kapustin, V.M.; Abdellatief, T.M.M.; Karpov, N.V.; Dutlov, E.V.; Borisanov, D. V Perspective towards a Gasoline-Property-First Approach Exhibiting Octane Hyperboosting Based on Isoolefinic Hydrocarbons. Fuel 2022, 321, 124016. [Google Scholar] [CrossRef]
- Ampah, J.D.; Yusuf, A.A.; Afrane, S.; Jin, C.; Liu, H. Reviewing Two Decades of Cleaner Alternative Marine Fuels: Towards IMO’s Decarbonization of the Maritime Transport Sector. J. Clean. Prod. 2021, 320, 128871. [Google Scholar] [CrossRef]
- Li, P.; Li, X.; Huang, J.; Qu, W.; Pan, X.; Chen, Q.; Klemeš, J.J.; Wang, B.; Wang, J.; Tao, H. Nitrogen-Doped Graphene Oxide with Enhanced Bioelectricity Generation from Microbial Fuel Cells for Marine Sewage Treatment. J. Clean. Prod. 2022, 376, 134071. [Google Scholar] [CrossRef]
- Tang, X.; Wang, P.; Zhang, Z.; Zhang, F.; Shi, L.; Deng, K. Effects of High-Pressure and Donor-Cylinder Exhaust Gas Recirculation on Fuel Economy and Emissions of Marine Diesel Engines. Fuel 2022, 309, 122226. [Google Scholar] [CrossRef]
- Tiang, Z.H.; Xiao, S. Long-Term Reactivity Control of Accident Tolerant Fuel Loaded Marine Small Modular Reactor Using Particle-Type Burnable Poisons. Ann. Nucl. Energy 2021, 156, 108177. [Google Scholar] [CrossRef]
- Ejder, E.; Arslanoğlu, Y. Evaluation of Ammonia Fueled Engine for a Bulk Carrier in Marine Decarbonization Pathways. J. Clean. Prod. 2022, 379, 134688. [Google Scholar] [CrossRef]
- Ampah, J.D.; Liu, X.; Sun, X.; Pan, X.; Xu, L.; Jin, C.; Sun, T.; Geng, Z.; Afrane, S.; Liu, H. Study on Characteristics of Marine Heavy Fuel Oil and Low Carbon Alcohol Blended Fuels at Different Temperatures. Fuel 2022, 310, 122307. [Google Scholar] [CrossRef]
- Zhang, Z.; Lv, J.; Li, W.; Long, J.; Wang, S.; Tan, D.; Yin, Z. Performance and Emission Evaluation of a Marine Diesel Engine Fueled with Natural Gas Ignited by Biodiesel-Diesel Blended Fuel. Energy 2022, 256, 124662. [Google Scholar] [CrossRef]
- Smyshlyaeva, K.I.; Rudko, V.A.; Povarov, V.G.; Shaidulina, A.A.; Efimov, I.; Gabdulkhakov, R.R.; Pyagay, I.N.; Speight, J.G. Influence of Asphaltenes on the Low-Sulphur Residual Marine Fuels’ Stability. J. Mar. Sci. Eng. 2021, 9, 1235. [Google Scholar] [CrossRef]
- Boldushevsky, R.A. Hydrodemetallization of Residual Oil Feedstock on the Meso-Macroporous Ni(Co)Mo-Sulfide Catalysts. Ph.D. Thesis, 2019; p. 129. [Google Scholar]
- O & Gr. World Oil Review 2018. Volume 1. 2018, p. 88. Available online: https://Www.Eni.Com/Assets/Documents/Documents-En/WORLD-OIL-REVIEW-2018-Volume-1.Pdf (accessed on 1 October 2022).
- Balz, R.; von Rotz, B.; Sedarsky, D. In-Nozzle Flow and Spray Characteristics of Large Two-Stroke Marine Diesel Fuel Injectors. Appl. Therm. Eng. 2020, 180, 115809. [Google Scholar] [CrossRef]
- Momenimovahed, A.; Gagné, S.; Gajdosechova, Z.; Corbin, J.C.; Smallwood, G.J.; Mester, Z.; Behrends, B.; Wichmann, V.; Thomson, K.A. Effective Density and Metals Content of Particle Emissions Generated by a Diesel Engine Operating under Different Marine Fuels. J. Aerosol Sci. 2021, 151, 105651. [Google Scholar] [CrossRef]
- Zhu, J.; Zhou, D.; Yang, W.; Qian, Y.; Mao, Y.; Lu, X. Investigation on the Potential of Using Carbon-Free Ammonia in Large Two-Stroke Marine Engines by Dual-Fuel Combustion Strategy. Energy 2023, 263, 125748. [Google Scholar] [CrossRef]
- Machaj, K.; Kupecki, J.; Malecha, Z.; Morawski, A.W.; Skrzypkiewicz, M.; Stanclik, M.; Chorowski, M. Ammonia as a Potential Marine Fuel: A Review. Energy Strateg. Rev. 2022, 44, 100926. [Google Scholar] [CrossRef]
- Paulauskiene, T.; Bucas, M.; Laukinaite, A. Alternative Fuels for Marine Applications: Biomethanol-Biodiesel-Diesel Blends. Fuel 2019, 248, 161–167. [Google Scholar] [CrossRef]
- Liu, L.; Tang, Y.; Liu, D. Investigation of Future Low-Carbon and Zero-Carbon Fuels for Marine Engines from the View of Thermal Efficiency. Energy Rep. 2022, 8, 6150–6160. [Google Scholar] [CrossRef]
- Tan, R.; Duru, O.; Thepsithar, P. Assessment of Relative Fuel Cost for Dual Fuel Marine Engines along Major Asian Container Shipping Routes. Transp. Res. Part E Logist. Transp. Rev. 2020, 140, 102004. [Google Scholar] [CrossRef]
- Hansson, J.; Månsson, S.; Brynolf, S.; Grahn, M. Alternative Marine Fuels: Prospects Based on Multi-Criteria Decision Analysis Involving Swedish Stakeholders. Biomass Bioenergy 2019, 126, 159–173. [Google Scholar] [CrossRef]
- Sürer, M.G.; Arat, H.T. Advancements and Current Technologies on Hydrogen Fuel Cell Applications for Marine Vehicles. Int. J. Hydrog. Energy 2022, 47, 19865–19875. [Google Scholar] [CrossRef]
- Figari, M.; Theotokatos, G.; Coraddu, A.; Stoumpos, S.; Mondella, T. Parametric Investigation and Optimal Selection of the Hybrid Turbocharger System for a Large Marine Four-Stroke Dual-Fuel Engine. Appl. Therm. Eng. 2022, 208, 117991. [Google Scholar] [CrossRef]
- Chalee, W.; Cheewaket, T.; Jaturapitakkul, C. Enhanced Durability of Concrete with Palm Oil Fuel Ash in a Marine Environment. J. Mater. Res. Technol. 2021, 13, 128–137. [Google Scholar] [CrossRef]
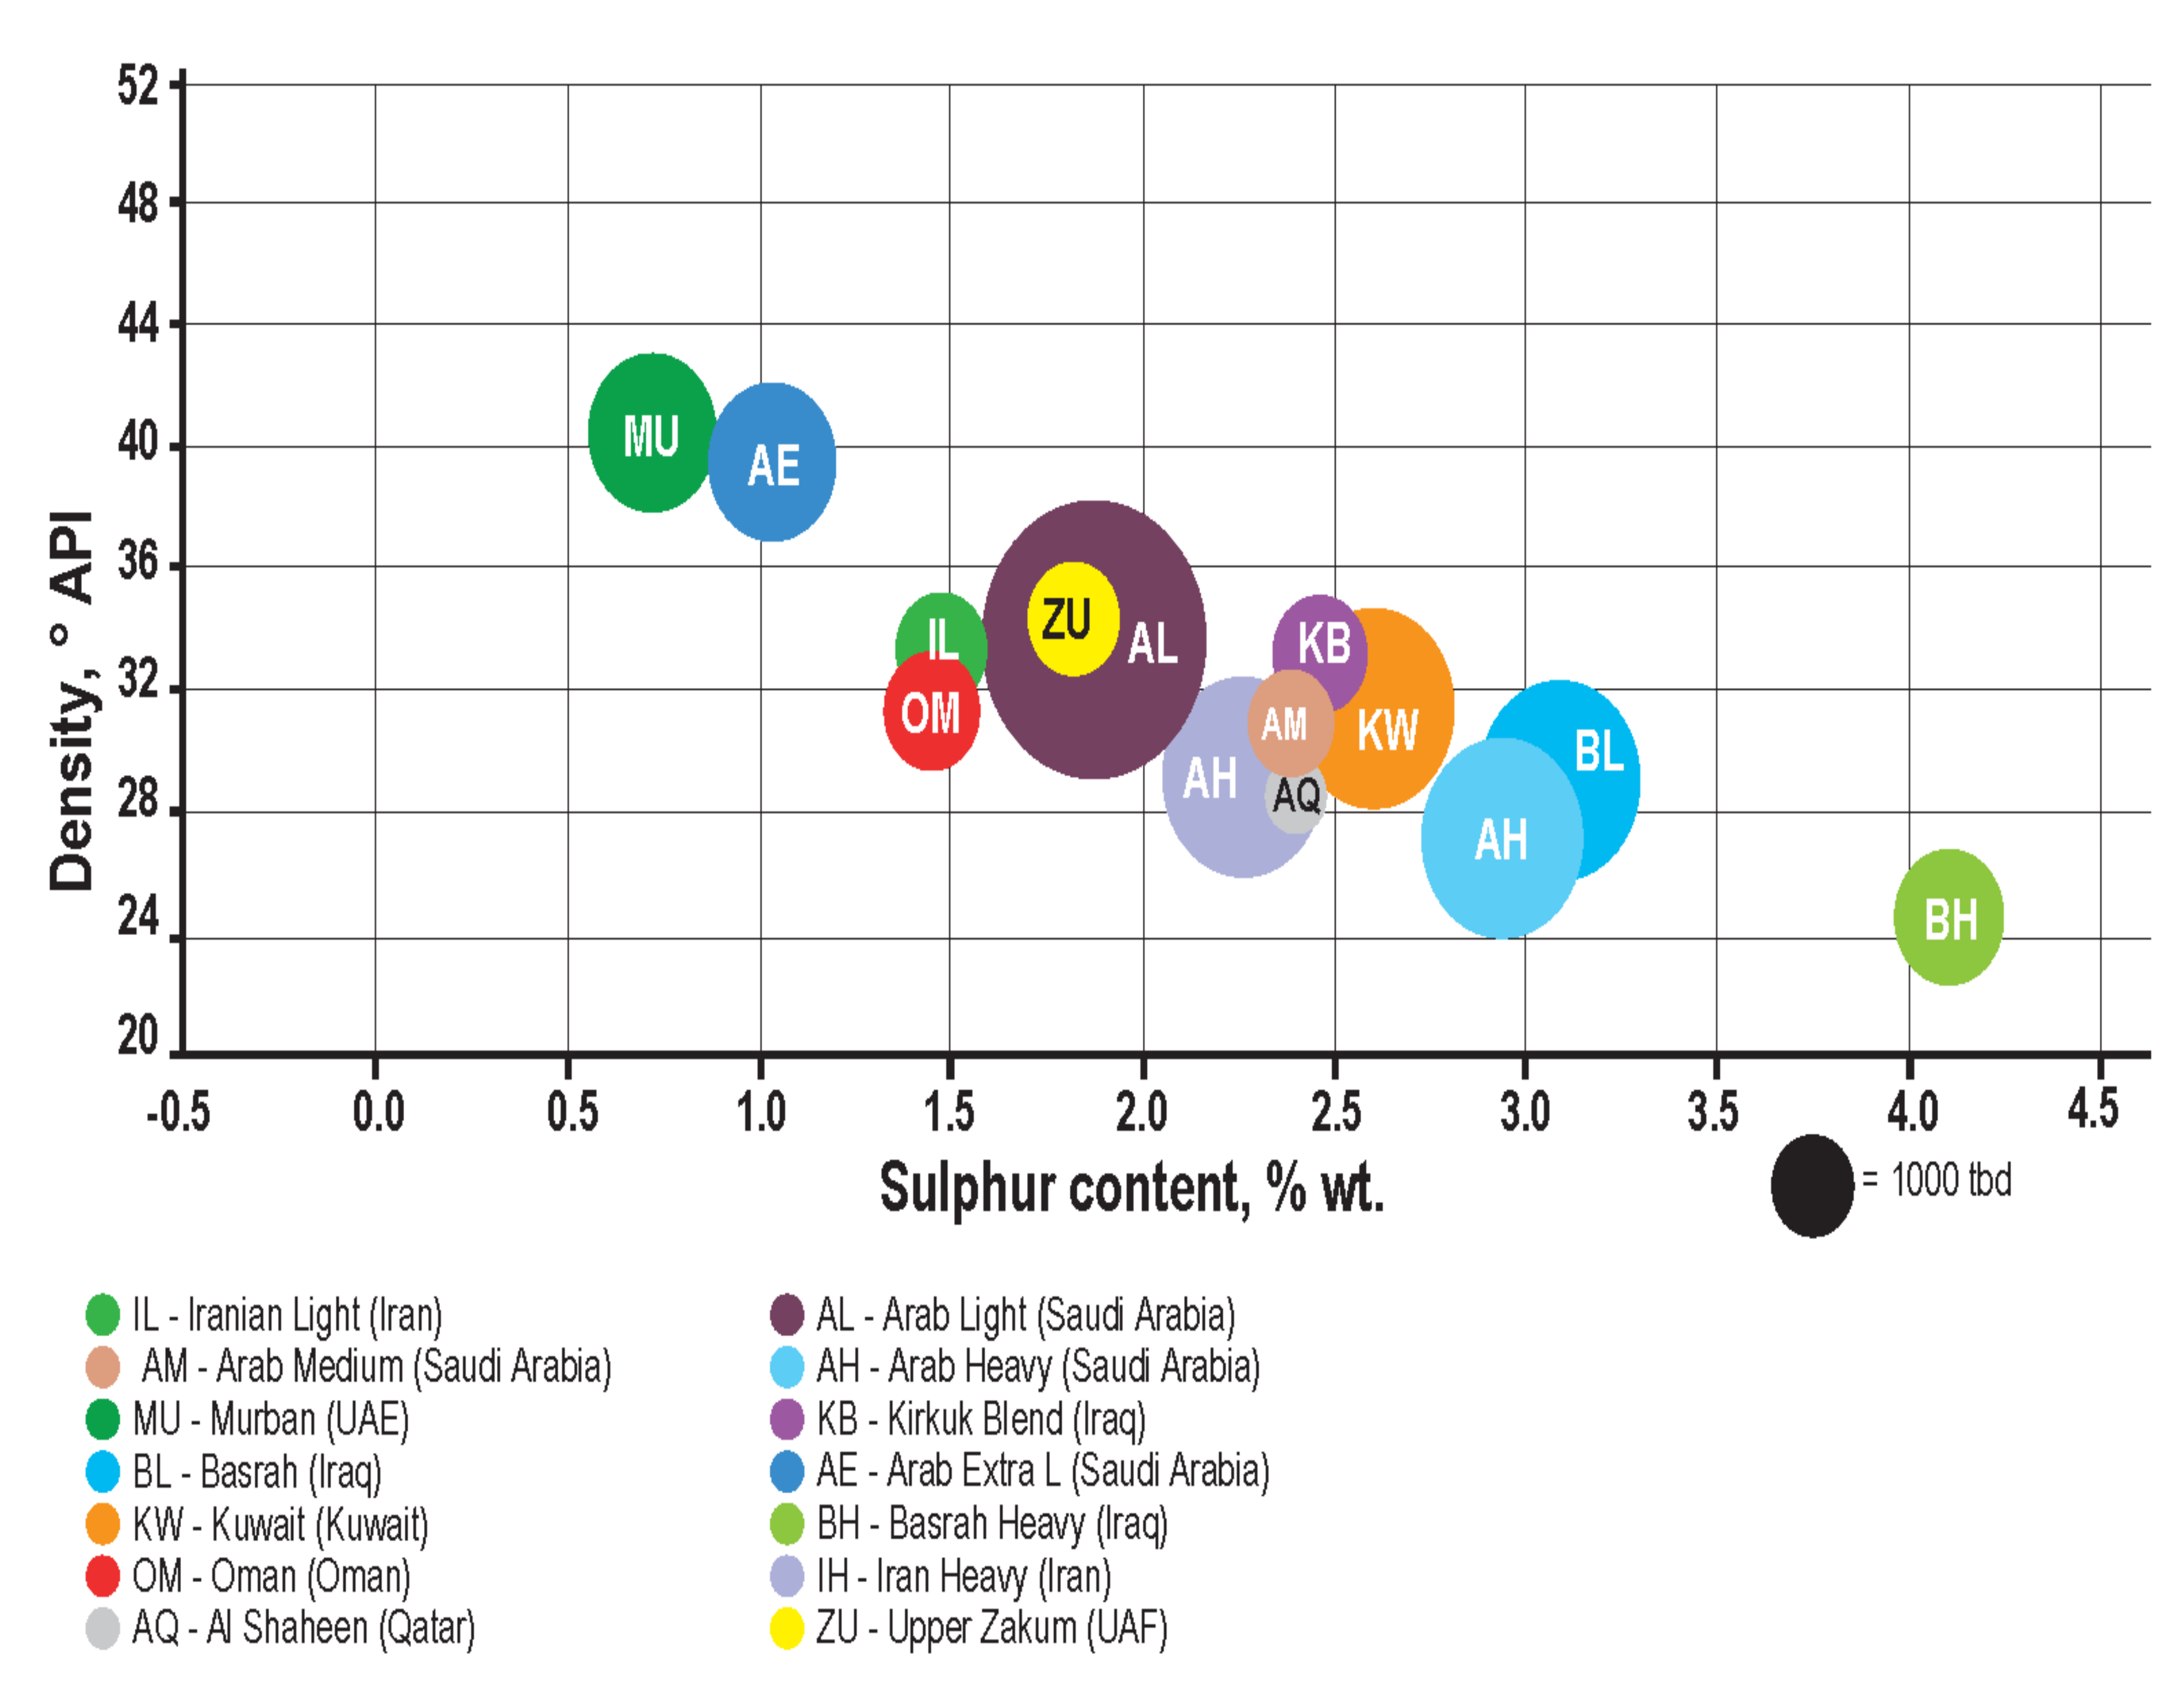
- Al-Majed, A. Kuwait Heavy Crude Residue Desulfurization//KNPC Tech Magazine; Kuwait National Petroleum Company: Safat, Kuwait, 2018; pp. 26–29. [Google Scholar]
- Wu, X.; Feng, Y.; Xu, G.; Zhu, Y.; Ming, P.; Dai, L. Numerical Investigations on Charge Motion and Combustion of Natural Gas-Enhanced Ammonia in Marine Pre-Chamber Lean-Burn Engine with Dual-Fuel Combustion System. Int. J. Hydrog. Energy 2022. In Press, Corrected Proof. [Google Scholar] [CrossRef]
- Wang, H.; Wang, T.; Feng, Y.; Lu, Z.; Sun, K. Synergistic Effect of Swirl Flow and Prechamber Jet on the Combustion of a Natural Gas-Diesel Dual-Fuel Marine Engine. Fuel 2022, 325, 124935. [Google Scholar] [CrossRef]
- Bilgili, L. Comparative Assessment of Alternative Marine Fuels in Life Cycle Perspective. Renew. Sustain. Energy Rev. 2021, 144, 110985. [Google Scholar] [CrossRef]
- Ouyang, T.; Su, Z.; Yang, R.; Wang, Z.; Mo, X.; Huang, H. Advanced Waste Heat Harvesting Strategy for Marine Dual-Fuel Engine Considering Gas-Liquid Two-Phase Flow of Turbine. Energy 2021, 224, 120150. [Google Scholar] [CrossRef]
- Wang, Y.; Zhou, X.; Liu, L. Feasibility Study of Hydrogen Jet Flame Ignition of Ammonia Fuel in Marine Low Speed Engine. Int. J. Hydrog. Energy 2022. [Google Scholar] [CrossRef]
- Theocharis, D.; Rodrigues, V.S.; Pettit, S.; Haider, J. Feasibility of the Northern Sea Route for Seasonal Transit Navigation: The Role of Ship Speed on Ice and Alternative Fuel Types for the Oil Product Tanker Market. Transp. Res. Part A Policy Pract. 2021, 151, 259–283. [Google Scholar] [CrossRef]
- Ju, H.; Jeon, S. Analysis of Characteristic Changes of Blended Very Low Sulfur Fuel Oil on Ultrasonic Frequency for Marine Fuel. J. Mar. Sci. Eng. 2022, 10, 1254. [Google Scholar] [CrossRef]
- Baccioli, A.; Liponi, A.; Milewski, J.; Szczęśniak, A.; Desideri, U. Hybridization of an Internal Combustion Engine with a Molten Carbonate Fuel Cell for Marine Applications. Appl. Energy 2021, 298, 117192. [Google Scholar] [CrossRef]
- Yang, L.; Su, Z. An Eco-Friendly and Efficient Trigeneration System for Dual-Fuel Marine Engine Considering Heat Storage and Energy Deployment. Energy 2022, 239, 121930. [Google Scholar] [CrossRef]
- Long, N.V.D.; Lee, D.Y.; Kwag, C.; Lee, Y.M.; Lee, S.W.; Hessel, V.; Lee, M. Improvement of Marine Carbon Capture Onboard Diesel Fueled Ships. Chem. Eng. Process. Process Intensif. 2021, 168, 108535. [Google Scholar] [CrossRef]
- TECO, AVL Partner for Marine Fuel Cells. Fuel Cells Bull. 2020, 2020, 8. [CrossRef]
- Peng, W.; Yang, J.; Corbin, J.; Trivanovic, U.; Lobo, P.; Kirchen, P.; Rogak, S.; Gagné, S.; Miller, J.W.; Cocker, D. Comprehensive Analysis of the Air Quality Impacts of Switching a Marine Vessel from Diesel Fuel to Natural Gas. Environ. Pollut. 2020, 266, 115404. [Google Scholar] [CrossRef]
- Jiang, Y.; Yang, J.; Gagné, S.; Chan, T.W.; Thomson, K.; Fofie, E.; Cary, R.A.; Rutherford, D.; Comer, B.; Swanson, J.; et al. Sources of Variance in BC Mass Measurements from a Small Marine Engine: Influence of the Instruments, Fuels and Loads. Atmos. Environ. 2018, 182, 128–137. [Google Scholar] [CrossRef] [Green Version]
- Ovaska, T.; Niemi, S.; Sirviö, K.; Nilsson, O.; Portin, K.; Asplund, T. Effects of Alternative Marine Diesel Fuels on the Exhaust Particle Size Distributions of an Off-Road Diesel Engine. Appl. Therm. Eng. 2019, 150, 1168–1176. [Google Scholar] [CrossRef]
- Lunde Hermansson, A.; Hassellöv, I.-M.; Moldanová, J.; Ytreberg, E. Comparing Emissions of Polyaromatic Hydrocarbons and Metals from Marine Fuels and Scrubbers. Transp. Res. Part D Transp. Environ. 2021, 97, 102912. [Google Scholar] [CrossRef]
- Ren, J.; Liang, H. Measuring the Sustainability of Marine Fuels: A Fuzzy Group Multi-Criteria Decision Making Approach. Transp. Res. Part D Transp. Environ. 2017, 54, 12–29. [Google Scholar] [CrossRef]


| International Trade Classification | ISO 8217 Compliance | Maximum Viscosity, cSt (at 50 °C for Residual Fuels and at 40 °C for Distillate Fuels) | Maximum Sulfur Content, % wt. |
|---|---|---|---|
| Heavy Fuel Oil (HFO) Heavy (residual) fuel, which either does not contain distillate fractions, or their proportion is minimal | RMG (RMK) 500/700 residual fuels | 500–700 | 3.5 |
| Medium Fuel Oil (MFO) Heavy (residual) fuel, which may contain a small proportion of distillate fractions | RMD, RME, RMG, RMK residual fuels | 80–500 | 3.5 |
| Intermediate Fuel Oil (IFO) Heavy (residual) fuel, which may contain a significant proportion of distillate fractions | RMD, RME, RMG, RMK residual fuels | 80–380 (500) | 3.5 |
| Marine Diesel Oil (MDO) Distillate fuel which may contain a small proportion of residual fractions | DMB distillate fuel and RMA, RMB residual fuels | ~11 (30) | 0.1–1.5 |
| Marine Gas Oil (MGO) Distillate fuel free of residual fractions | DMA and DMZ distillate fuels | 6 | 0.1–1.5 |
| HFO 0.1 or ECA Fuel (ULSFO) Residual, distillate, or mixed fuels with sulfur content of no more than 0.1% | Not standardized | - | 0.1 |
| HFO 0.5 (VLSFO) Residual, distillate, or mixed fuels with sulfur content of no more than 0.5% | Not standardized | - | 0.5 |
| Sample No. | Density 15 °C, kg/m3 | Kinematic Viscosity at 50 °C, cSt | Sulfur Content, % | Vanadium Content, ppm | Aluminum and Silicon Content, ppm | Nickel Content, ppm | Calculated Content of Various Components in Fuel Samples | |||||
|---|---|---|---|---|---|---|---|---|---|---|---|---|
| HDSAR | AR | HCO | HCGO | HTVGO | DF | |||||||
| 1 | 931.8 | 269.6 | 0.48 | 15.0 | 11.0 | 29.0 | 95 | 0 | 0 | 0 | 5 | 0 |
| 2 | 940.4 | 216.4 | 0.49 | 13.0 | 18.0 | 20.0 | 91 | 0 | 7 | 0 | 0 | 2 |
| 3 | 953.1 | 175.4 | 0.48 | 12.5 | 35.5 | 9.5 | 75 | 0 | 20 | 0 | 4 | 1 |
| 4 | 961.1 | 142.2 | 0.49 | 10.0 | 40.3 | 24.3 | 70 | 0 | 27 | 1 | 0 | 2 |
| 5 | 923.8 | 106.5 | 0.49 | 7.3 | 8.3 | 14.0 | 80 | 8 | 1 | 0 | 0 | 10 |
| 6 | 946.7 | 101.0 | 0.47 | 9.4 | 22.0 | 11.6 | 73 | 0 | 19 | 1 | 0 | 7 |
| 7 | 943.1 | 96.4 | 0.48 | 9.7 | 22.7 | 13.7 | 73 | 0 | 15 | 4 | 0 | 8 |
| 8 | 936.7 | 95.3 | 0.49 | 8.0 | 14.0 | 9.0 | 77 | 0 | 9 | 6 | 0 | 8 |
| 9 | 931.2 | 90.1 | 0.49 | 9.5 | 20.5 | 17.0 | 79 | 0 | 4 | 7 | 0 | 9 |
| 10 | 917.6 | 89.3 | 0.48 | 10.0 | 11.3 | 15.0 | 49 | 9 | 0 | 0 | 36 | 6 |
| 11 | 959.7 | 87.1 | 0.47 | 8.5 | 31.5 | 11.0 | 62 | 0 | 31 | 1 | 0 | 7 |
| 12 | 911.9 | 85.9 | 0.48 | 10.0 | 5.0 | 17.0 | 0 | 41 | 0 | 0 | 54 | 5 |
| 13 | 921.6 | 62.8 | 0.48 | 10.7 | 19.3 | 15.0 | 67 | 12 | 5 | 0 | 0 | 16 |
| 14 | 938.3 | 72.2 | 0.48 | 11.0 | 26.0 | 9.0 | 70 | 0 | 13 | 7 | 0 | 11 |
| 15 | 925.6 | 64.3 | 0.49 | 7.0 | 0.0 | 21.0 | 75 | 0 | 1 | 11 | 0 | 13 |
| 16 | 949.9 | 63.2 | 0.47 | 12.0 | 41.0 | 18.0 | 60 | 0 | 23 | 8 | 0 | 10 |
| 17 | 945.2 | 46.2 | 0.47 | 8.8 | 38.3 | 8.8 | 55 | 0 | 23 | 8 | 0 | 14 |
| 18 | 938.6 | 41.6 | 0.49 | 10.4 | 39.3 | 10.7 | 56 | 0 | 16 | 13 | 0 | 15 |
| 19 | 918.4 | 45.9 | 0.48 | 11.3 | 15.8 | 17.3 | 69 | 3 | 0 | 10 | 0 | 18 |
| 20 | 933.6 | 38.6 | 0.48 | 12.2 | 35.4 | 13.2 | 57 | 0 | 13 | 13 | 0 | 17 |
| 21 | 955.7 | 37.4 | 0.49 | 4.0 | 47.0 | 6.0 | 43 | 0 | 31 | 12 | 0 | 14 |
| Type No. | Approximate Composition of the Composition, % wt. | Type Code Name | Number of Batches | |||||
|---|---|---|---|---|---|---|---|---|
| HDSAR | AR | HCO | HCGO | HTVGO | HTDF | |||
| 1 | 80–95 | 0–10 | 0–7 | <3 1 | 0–5 | 0–15 | HTFO | 21 |
| 2 | 60–75 | <3 | 15–35 | 0–5 | 0–5 | 0–8 | HTFO + HCO | 41 |
| 3 | 55–80 | <3 | 0–15 | 6–15 | <3 | 5–20 | HTFO + HCO + HCGO | 50 |
| 4 | 30–60 | <3 | <3 | 35–60 | 5–15 | HTVGO + HTFO | 7 | |
| 5 | 40–70 | <3 | 10–35 | 5–12 | <3 | 10–15 | HTFO + HCO + DF | 31 |
| No. | Density 15 °C, kg/m3 | Kinematic Viscosity, cSt | Sulfur Content, % | V, ppm | Al + Si, ppm | Ni, ppm | Calculated Content of Components, % wt. | ||||
|---|---|---|---|---|---|---|---|---|---|---|---|
| HDSAR | HCO | HCGO | HTVGO | DF | |||||||
| 1 | 956.5 | 60.5 | 0.48 | 6.6 | 49.1 | 6.2 | 58 | 25 | 0 | 5 | 11 |
| 2 | 948.0 | 59.1 | 0.48 | 7.2 | 48.3 | 11.6 | 56 | 28 | 0 | 5 | 11 |
| 3 | 939.3 | 65.1 | 0.48 | 8.3 | 32.6 | 5.3 | 62 | 20 | 0 | 7 | 11 |
| 4 | 933.5 | 33.6 | 0.49 | 10.2 | 44.8 | 12.0 | 55 | 19 | 7 | 0 | 20 |
| 5 | 930.6 | 56.7 | 0.49 | 7.2 | 39.6 | 14.4 | 70 | 14 | 0 | 1 | 15 |
| 6 | 922.2 | 38.6 | 0.49 | 7.4 | 24.3 | 8.4 | 66 | 9 | 5 | 0 | 20 |
| 7 | 912.0 | 35.5 | 0.49 | 8.2 | 18.4 | 13.0 | 70 | 1 | 6 | 0 | 23 |
| No. | Density 15 °C, kg/m3 | Kinematic Viscosity, cSt | Sulfur Content, % | V, ppm | Al + Si, ppm | Ni, ppm | Calculated Content of Components, % wt. | |||||
|---|---|---|---|---|---|---|---|---|---|---|---|---|
| HDSAR | VGO | HCO | HCGO | HTVGO | DF | |||||||
| 1 | 979.9 | 65.1 | 0.46 | 8.0 | 29.0 | 7.0 | 37 | 0 | 50 | 0 | 7 | 5 |
| 2 | 973.5 | 43.8 | 0.50 | 3.0 | 44.0 | 2.0 | 38 | 0 | 50 | 0 | 0 | 12 |
| 3 | 964.2 | 65.7 | 0.48 | 6.0 | 22.3 | 8.7 | 53 | 0 | 38 | 0 | 1 | 9 |
| 4 | 967.4 | 211.3 | 0.49 | 9.3 | 9.0 | 13.8 | 69 | 6 | 24 | 0 | 0 | 0 |
| 5 | 948.4 | 194.8 | 0.48 | 17.0 | 32.5 | 17.5 | 78 | 0 | 15 | 0 | 7 | 0 |
| No. | Density 15 °C, kg/m3 | Kinematic Viscosity, cSt | Sulfur Content, % | V, ppm | Al + Si, ppm | Ni, ppm | Calculated Content of Components, % wt. | |||||
|---|---|---|---|---|---|---|---|---|---|---|---|---|
| HDSAR | AR | HCO | HCGO | HTVGO | DF | |||||||
| 1 | 918.1 | 29.1 | 0.49 | 7.6 | 5.3 | 15.9 | 0 | 4 | 0 | 29 | 60 | 7 |
| Composition Number (Type) | 1 | 2 | 3 | 4 | 5 | 6 | 7 | 8 | 9 | |
|---|---|---|---|---|---|---|---|---|---|---|
| Code Name | HDSAR | HDSAR + HCO | HDSAR + HCO + HCGO | HTVGO+ HDSAR | HDSAR + HCO + DF | HDSAR + DF | HCO + HDSAR | HDSAR + VR | HTVGO + HCGO | |
| Composition of the composition, % by wt. | HDSAR | 80–95 | 60–75 | 55–80 | 30–60 | 40–70 | 60–75 | 35–55 | 60–75 | 0–7 |
| AR/VR | 0–10 | <3 | <3 | <3 | <3 | <3 | 0–10 | |||
| HCO | 0–7 | 15–35 | 0–20 | <3 | 10–35 | 0–10 | 35–50 | 0–25 | <3 | |
| HCGO | <3 | 0–5 | 0–15 | 0–10 | 0–12 | 0–5 | <3 | 15–30 | ||
| HTVGO | 0–20 | 0–10 | <3 | 35–60 | 0–7 | <3 | 0–10 | 0–10 | 50–70 | |
| HTDF | 0–15 | 0–8 | 5–20 | 5–15 | 10–15 | 15–30 | 0–15 | <3 | 0–10 | |
| The number of batches assigned to certain types | ||||||||||
| BP | - | - | 29 | - | 87 | 57 | - | - | - | |
| Cathay Marine | 7 | 25 | 27 | 9 | 9 | 3 | - | - | - | |
| Eng Hua Company | 16 | 49 | 12 | 2 | 12 | 6 | 10 | 6 | - | |
| Equatorial Marine Fuel | 50 | 67 | 46 | 11 | 24 | 4 | 4 | 4 | - | |
| ExxonMobil | - | 93 | - | - | - | - | 5 | - | - | |
| Global Energy Trading | 11 | 50 | 2 | - | 15 | 4 | 2 | 6 | - | |
| Golden Island | 15 | 72 | - | - | - | - | - | - | - | |
| Hong Lam Marine | 12 | 38 | 60 | - | 52 | 12 | 2 | - | - | |
| Minerva Bunkers Pte Ltd. | 6 | 42 | 17 | - | 38 | - | 4 | - | 12 | |
| Petro China | - | 29 | 13 | - | 4 | - | 10 | - | - | |
| Sentek Marine | 6 | 34 | 36 | 6 | 11 | 13 | 4 | - | - | |
| Shell | 8 | 53 | 17 | - | 58 | - | 11 | - | - | |
| Singamas Petroleum | 21 | 41 | 50 | 7 | 31 | - | - | - | - | |
| SK Energy | 2 | 28 | 27 | - | 44 | - | 15 | - | - | |
| TFG Marine | 6 | 8 | 31 | - | 2 | 38 | - | - | - | |
| Vitol | 34 | 65 | 14 | - | 48 | - | 9 | - | - | |
| Total: | 194 | 694 | 352 | 35 | 348 | 80 | 76 | 16 | 12 | |
| % of the total | 10.7 | 38.4 | 19.5 | 1.9 | 19.3 | 4.4 | 4.2 | 0.9 | 0.7 | |
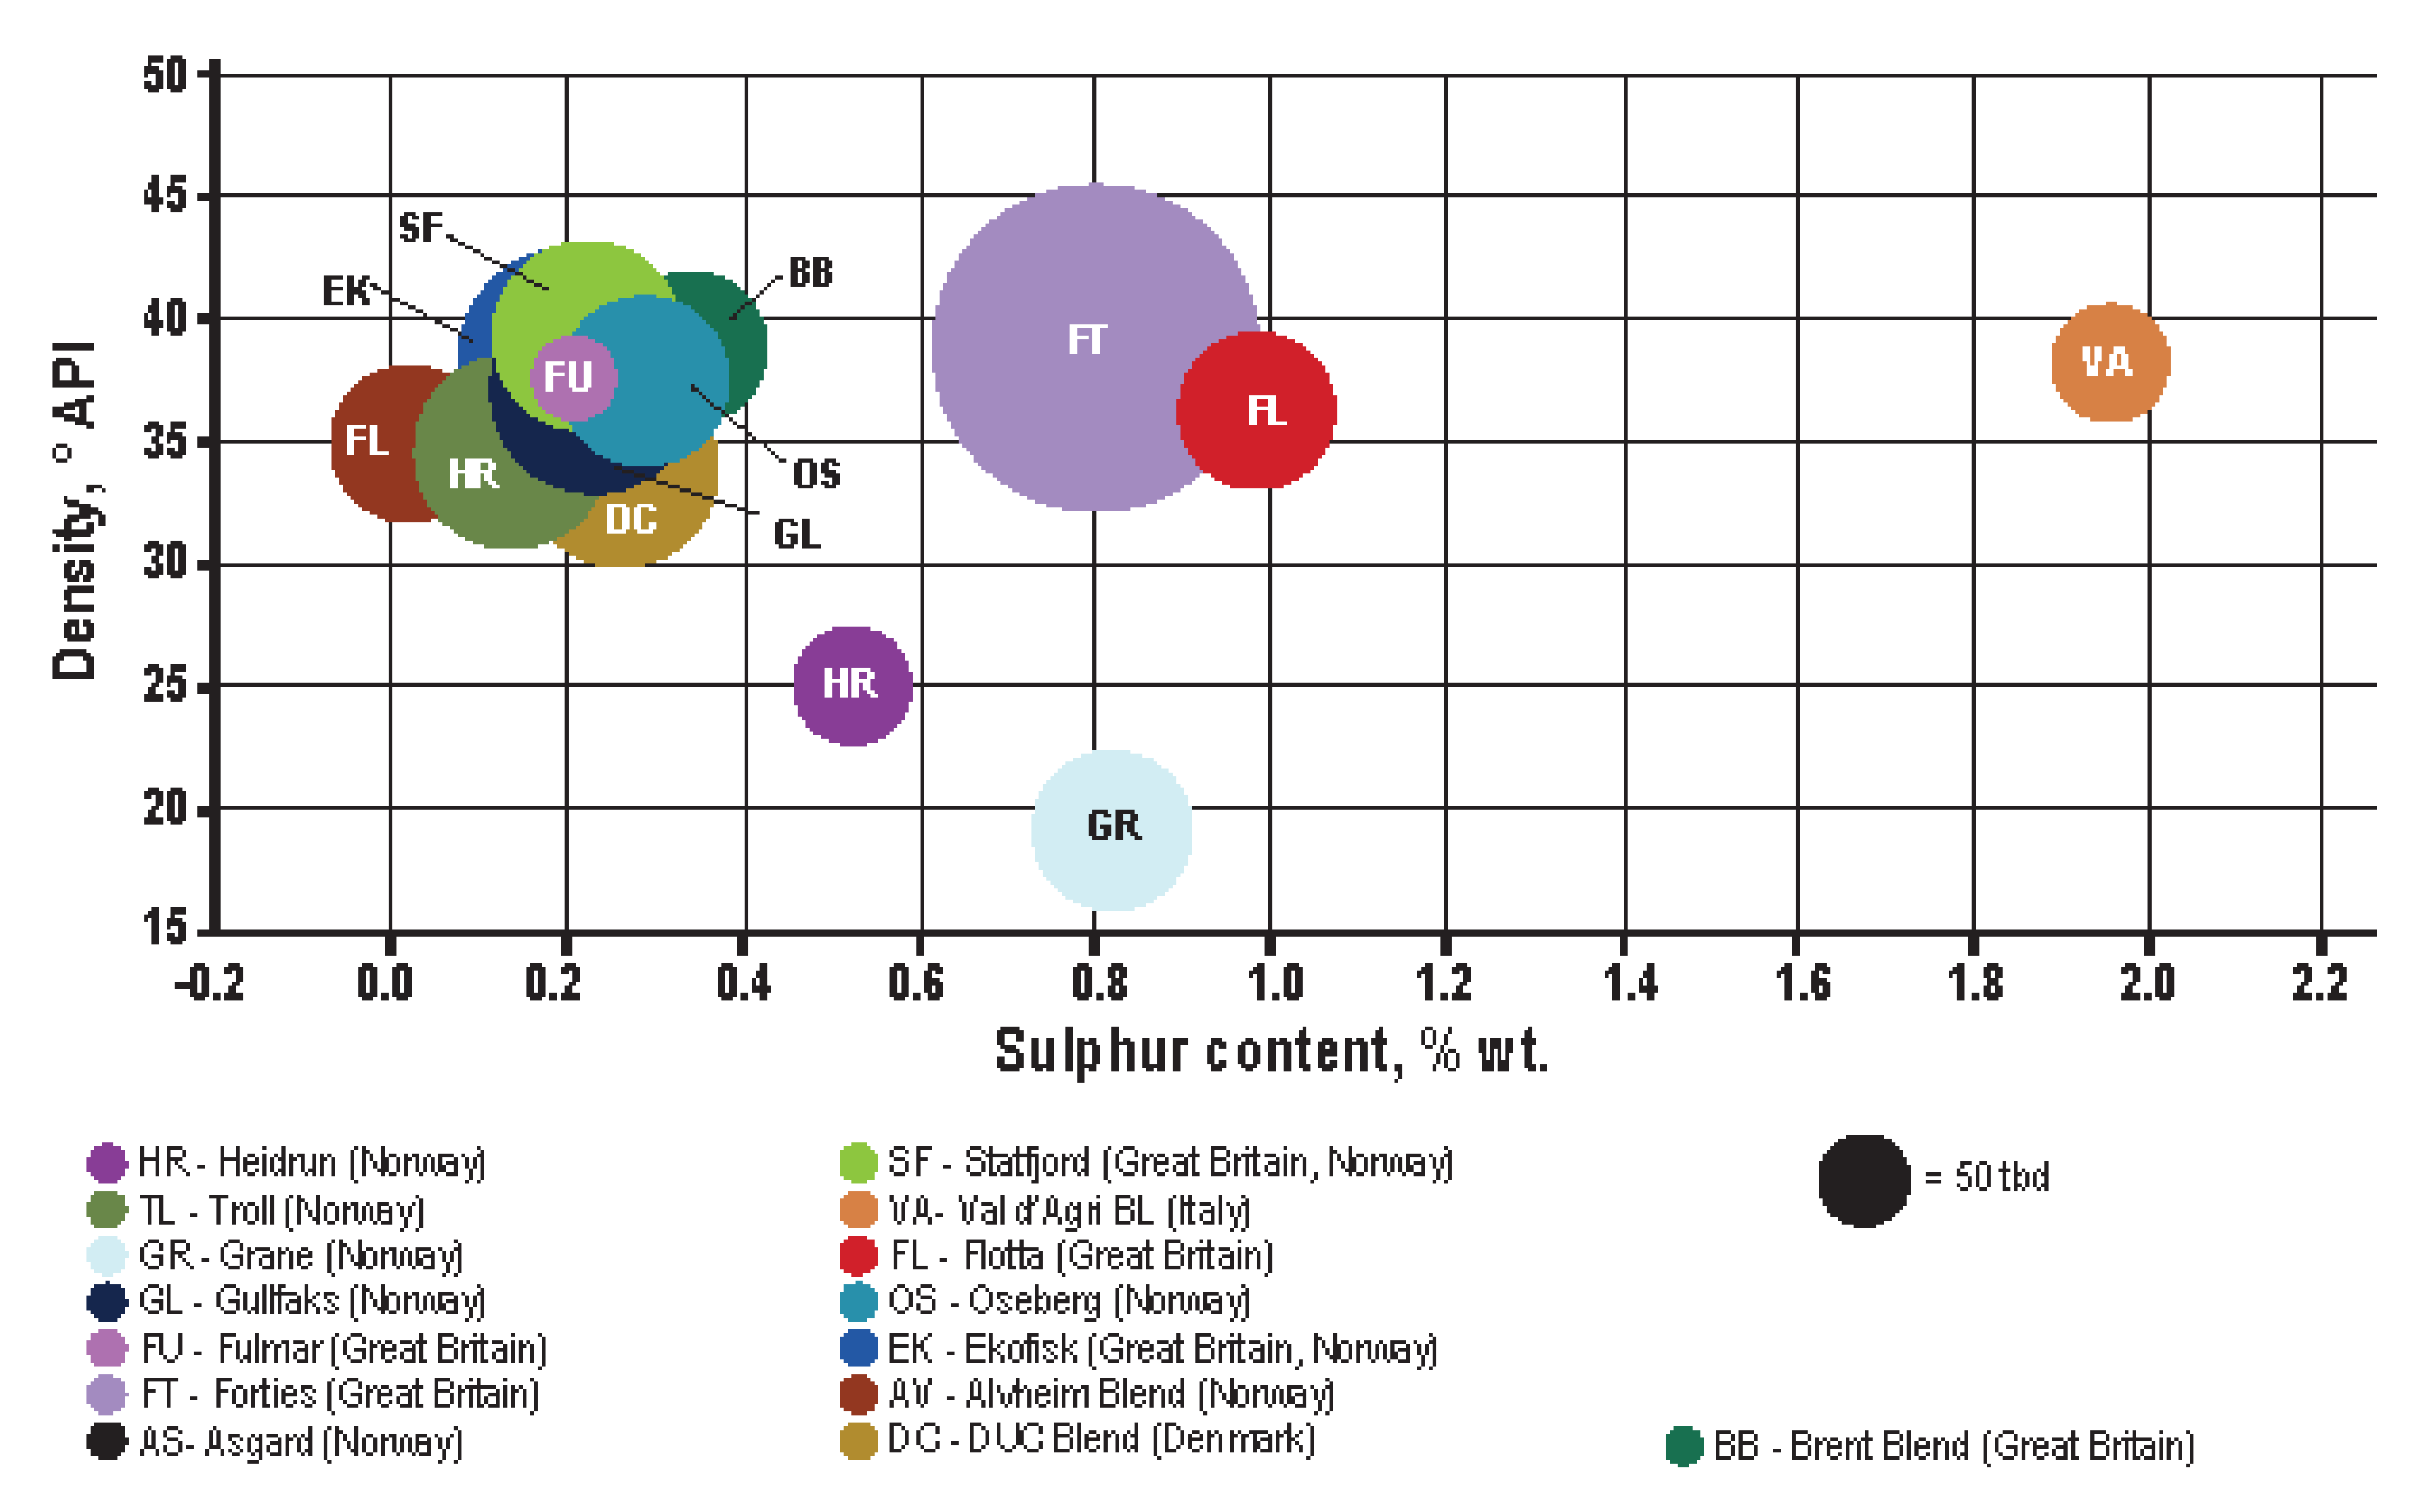
| Impurity | The Content of Metals and Sulfur in Grades of Commercial Oil, mg/kg and wt.% | ||||
|---|---|---|---|---|---|
| Arabian Heavy | Iranian Heavy | Iranian Light | Kuwait | Arabian Light | |
| Vanadium | 69.8 | 68.2 | 55.2 | 32.9 | 23.7 |
| Nickel | 22.3 | 21.4 | 17.0 | 9.6 | 4.6 |
| Total metals | 92.1 | 89.6 | 72.2 | 42.5 | 28.3 |
| Sulfur | 3.0 | 2.3 | 1.5 | 2.6 | 1.9 |
| Impurity | The Content of Metals and Sulfur in Grades of Commercial Oil, mg/kg and % wt. | ||||||||
|---|---|---|---|---|---|---|---|---|---|
| Forties | Troll | Brent | Aasgard | Ekofisk | Grane | Gullfaks | Oseberg | Statfjord | |
| Vanadium | 9.2 | 0.9 | 6.3 | 0.8 | 1.9 | 9.6 | 0.8 | 1.0 | 1.7 |
| Nickel | 3.3 | 0.8 | 1.2 | 0.1 | 3.0 | 3.1 | 0.7 | 1.0 | 1.1 |
| Total metals | 12.5 | 1.7 | 7.5 | 0.9 | 4.9 | 12.7 | 1.5 | 2.0 | 2.8 |
| Sulfur | 0.82 | 0.17 | 0.35 | 0.11 | 0.21 | 0.62 | 0.18 | 0.2 | 0.2 |
| Type No. | Approximate Composition of the Composition, % wt. | Type Code Name | Number of Batches | |||||
|---|---|---|---|---|---|---|---|---|
| HDSAR | AR /VR | HCO | HCGO | HTVGO | HTDF | |||
| 1 | 80–95 | 0–10 | 0–7 | <3 | 0–20 | 0–15 | HDSAR | 1 |
| 2 | 60–75 | <3 | 15–35 | 0–5 | 0–10 | 0–8 | HDSAR + HCO | 39 |
| 3 | 55–80 | <3 | 0–20 | 0–15 | <3 | 5–20 | HDSAR + HCO + HCGO | 52 |
| 4 | 30–60 | <3 | 0–10 | 35–60 | 5–15 | HTVGO + HDSAR | 0 | |
| 5 | 40–70 | <3 | 10–35 | 0–12 | 0–7 | 10–15 | HDSAR + HCO + DF | 33 |
| 6 | 60–75 | <3 | 0–10 | <3 | 15–30 | HDSAR + DF | 0 | |
| 7 | 35–55 | <3 | 35–50 | 0–5 | 0–10 | 0–15 | HCO + HDSAR | 12 |
| 8 | 60–75 | 0–10 | 0–25 | <3 | 0–10 | <3 | HDSAR + VR | 0 |
| 9 | 0–7 | <3 | 15–30 | 50–70 | 0–10 | HTVGO + HCGO | 0 | |
| Type No. | Approximate Composition of the Composition, % wt. | Type Code Name | Number of Batches | |||||
|---|---|---|---|---|---|---|---|---|
| HDSAR | AR /VR | HCO | HCGO | HTVGO | HTDF | |||
| 1 | 80–95 | 0–10 | 0–7 | <3 | 0–20 | 0–15 | HDSAR | 620 |
| 2 | 60–75 | <3 | 15–35 | 0–5 | 0–10 | 0–8 | HDSAR + HCO | 33 |
| 3 | 55–80 | <3 | 0–20 | 0–15 | <3 | 5–20 | HDSAR + HCO + HCGO | 8 |
| 4 | 30–60 | <3 | 0–10 | 35–60 | 5–15 | HTVGO + HDSAR | 3 | |
| 5 | 40–70 | <3 | 10–35 | 0–12 | 0–7 | 10–15 | HDSAR + HCO + DF | 11 |
| 6 | 60–75 | <3 | 0–10 | <3 | 15–30 | HDSAR + DF | 0 | |
| 7 | 35–55 | <3 | 35–50 | 0–5 | 0–10 | 0–15 | HCO + HDSAR | 5 |
| 8 | 60–75 | 0–10 | 0–25 | <3 | 0–10 | <3 | HDSAR + VR | 0 |
| 9 | 0–7 | <3 | 15–30 | 50–70 | 0–10 | HTVGO + HCGO | 0 | |
| Type No. | Approximate Composition of the Composition, wt. % | Type Code Name | Number of Batches | |||||
|---|---|---|---|---|---|---|---|---|
| HDSAR | AR /VR | HCO | HCGO | HTVGO | HTDF | |||
| 1 | 80–95 | 0–10 | 0–7 | <3 | 0–20 | 0–15 | HDSAR | 22 |
| 2 | 60–75 | <3 | 15–35 | 0–5 | 0–10 | 0–8 | HDSAR + HCO | 8 |
| 3 | 55–80 | <3 | 0–20 | 0–15 | <3 | 5–20 | HDSAR + HCO + HCGO | 6 |
| 4 | 30–60 | <3 | 0–10 | 35–60 | 5–15 | HTVGO + HDSAR | 0 | |
| 5 | 40–70 | <3 | 10–35 | 0–12 | 0–7 | 10–15 | HDSAR + HCO + DF | 9 |
| 6 | 60–75 | <3 | 0–10 | <3 | 15–30 | HDSAR + DF | 0 | |
| 7 | 35–55 | <3 | 35–50 | 0–5 | 0–10 | 0–15 | HCO + HDSAR | 9 |
| 8 | 60–75 | 0–10 | 0–25 | <3 | 0–10 | <3 | HDSAR + VR | 0 |
| Sample No. | Density 15 °C, kg/m3 | Kinematic Viscosity at 50 °C, cSt | Sulfur Content, % | Vanadium Content, ppm | Aluminum and Silicon Content, ppm | Nickel Content, ppm | Calculated Content of Various Components in Fuel Samples | |||||
|---|---|---|---|---|---|---|---|---|---|---|---|---|
| HDSAR | HTVGO | AR | VGO | HCO | DF | |||||||
| 1 | 947.6 | 378.8 | 0.50 | 19 | 12 | 15 | 55 | 2 | 41 | 0 | 2 | 0 |
| 2 | 936.1 | 335 | 0.50 | 7 | 4 | 10 | 56 | 0 | 35 | 9 | 0 | 0 |
| 3 | 965.4 | 259.2 | 0.49 | 7 | 10 | 15 | 44 | 1 | 35 | 0 | 20 | 0 |
| 4 | 936.4 | 229.4 | 0.49 | 13 | 9 | 13 | 16 | 31 | 53 | 0 | 0 | 0 |
| 5 | 955.6 | 197.5 | 0.50 | 12 | 26 | 22 | 12 | 25 | 50 | 0 | 13 | 0 |
| 6 | 962.3 | 188.4 | 0.48 | 4 | 29 | 12 | 21 | 18 | 41 | 0 | 20 | 0 |
| 7 | 938.9 | 148.9 | 0.50 | 9 | 19 | 12 | 0 | 36 | 60 | 0 | 1 | 4 |
| 8 | 959.7 | 143.3 | 0.50 | 8 | 25 | 12 | 0 | 28 | 51 | 0 | 19 | 2 |
| 9 | 945 | 135.7 | 0.48 | 8 | 10 | 4 | 0 | 35 | 54 | 0 | 8 | 3 |
| 10 | 969 | 129.3 | 0.49 | 11 | 18 | 13 | 0 | 23 | 45 | 0 | 29 | 3 |
| 11 | 939.3 | 121.1 | 0.49 | 7 | 14 | 10 | 0 | 34 | 57 | 0 | 4 | 5 |
| 12 | 927.4 | 115.4 | 0.49 | 4 | 18 | 3 | 0 | 33 | 38 | 28 | 0 | 1 |
| 13 | 959.6 | 110.6 | 0.49 | 8 | 11 | 12 | 0 | 25 | 49 | 0 | 21 | 4 |
| 14 | 989 | 108 | 0.48 | 0 | 45 | 6 | 0 | 18 | 36 | 0 | 45 | 1 |
| 15 | 950.4 | 103.6 | 0.48 | 8 | 9 | 11 | 0 | 29 | 51 | 0 | 15 | 6 |
| 16 | 981.4 | 94.7 | 0.50 | 9 | 26 | 8 | 0 | 14 | 42 | 0 | 40 | 4 |
| 17 | 967.9 | 91.3 | 0.47 | 14 | 31 | 15 | 0 | 23 | 42 | 0 | 31 | 5 |
| 18 | 975.8 | 84.4 | 0.49 | 6 | 24 | 1 | 0 | 16 | 42 | 0 | 37 | 6 |
| 19 | 932.5 | 83.9 | 0.49 | 6 | 7 | 9 | 0 | 29 | 60 | 0 | 1 | 11 |
| 20 | 987.7 | 78.2 | 0.50 | 4 | 42 | 8 | 0 | 9 | 39 | 0 | 46 | 6 |
| 21 | 963.2 | 76 | 0.48 | 14 | 17 | 11 | 0 | 19 | 45 | 0 | 28 | 8 |
| 22 | 974 | 71.2 | 0.50 | 1 | 24 | 2 | 0 | 11 | 44 | 0 | 37 | 9 |
| 23 | 932.4 | 70.4 | 0.50 | 3 | 47 | 8 | 0 | 24 | 60 | 0 | 3 | 14 |
| 24 | 961.7 | 69.1 | 0.50 | 15 | 24 | 10 | 0 | 14 | 48 | 0 | 27 | 11 |
| Type No. | Approximate Composition of the Composition, % wt. | Type Code Name | Number of Batches | |||||
|---|---|---|---|---|---|---|---|---|
| HDSAR | AR /VR | HCO | HCGO | HTVGO | HTDF | |||
| 1 | 80–95 | 0–10 | 0–7 | <3 | 0–20 | 0–15 | HDSAR | 151 |
| 2 | 60–75 | <3 | 15–35 | 0–5 | 0–10 | 0–8 | HDSAR + HCO | 15 |
| 3 | 55–80 | <3 | 0–20 | 0–15 | <3 | 5–20 | HDSAR + HCO + HCGO | 4 |
| 4 | 30–60 | <3 | 0–10 | 35–60 | 5–15 | HTVGO + HDSAR | 3 | |
| 5 | 40–70 | <3 | 10–35 | 0–12 | 0–7 | 10–15 | HDSAR + HCO + DF | 0 |
| 6 | 60–75 | <3 | 0–10 | <3 | 15–30 | HDSAR + DF | 0 | |
| 7 | 35–55 | <3 | 35–50 | 0–5 | 0–10 | 0–15 | HCO + HDSAR | 1 |
| 8 | 60–75 | 0–20 | 0–25 | <3 | 0–10 | <3 | HDSAR + BO | 0 |
| 9 | 0–7 | <3 | 15–30 | 50–70 | 0–10 | HTVGO + HDSAR | 0 | |
| Type No. | Approximate Composition of the Composition, % wt. | Type Code Name | Number of Batches | |||||
|---|---|---|---|---|---|---|---|---|
| HDSAR | AR /VR | HCO | HCGO | HTVGO | HTDF | |||
| 1 | 80–95 | 0–10 | 0–7 | <3 | 0–20 | 0–15 | HDSAR | 7 |
| 2 | 60–75 | <3 | 15–35 | 0–5 | 0–10 | 0–8 | HDSAR + HCO | 20 |
| 3 | 55–80 | <3 | 0–20 | 0–15 | <3 | 5–20 | HDSAR + HCO + HCGO | 7 |
| 4 | 30–60 | <3 | 0–10 | 35–60 | 5–15 | HTVGO+ HDSAR | 1 | |
| 5 | 40–70 | <3 | 10–35 | 0–12 | 0–7 | 10–15 | HDSAR + HCO + DF | 0 |
| 6 | 60–75 | <3 | 0–10 | <3 | 15–30 | HDSAR + DF | 0 | |
| 7 | 35–55 | <3 | 35–50 | 0–5 | 0–10 | 0–15 | HCO + HDSAR | 18 |
| 8 | 60–75 | 0–20 | 0–25 | <3 | 0–10 | <3 | HDSAR + VR | 0 |
| 9 | 0–7 | <3 | 15–30 | 50–70 | 0–10 | HTVGO + HDSAR | 0 | |
| Type No. | Approximate Composition of the Composition, % wt. | Type Code Name | Number of Batches | |||||
|---|---|---|---|---|---|---|---|---|
| HDSAR | AR /VR | HCO | HCGO | HTVGO | HTDF | |||
| 1 | 80–95 | 0–10 | 0–7 | <3 | 0–20 | 0–15 | HDSAR | 5 |
| 2 | 60–75 | <3 | 15–35 | 0–5 | 0–10 | 0–8 | HDSAR + HCO | 2 |
| 3 | 55–80 | <3 | 0–20 | 0–15 | <3 | 5–20 | HDSAR + HCO + HCGO | 15 |
| 4 | 30–60 | <3 | 0–10 | 35–60 | 5–15 | HTVGO + HDSAR | 5 | |
| 5 | 40–70 | <3 | 10–35 | 0–12 | 0–7 | 10–15 | HDSAR + HCO + DF | 13 |
| 6 | 60–75 | <3 | 0–10 | <3 | 15–30 | HDSAR + DF | 3 | |
| 7 | 35–55 | <3 | 35–50 | 0–5 | 0–10 | 0–15 | HCO + HDSAR | 5 |
| 8 | 60–75 | 0–20 | 0–25 | <3 | 0–10 | <3 | HDSAR + VR | 0 |
| 9 | 0–7 | <3 | 15–30 | 50–70 | 0–10 | HTVGO + HCGO | 1 | |
| Color of the Selected Area | Density at 15 °C, kg/m3 | Kinematic Viscosity at 50 °C, cSt | Calculated Content of Various Components in Fuel Samples | ||
|---|---|---|---|---|---|
| HTVGO | HTDF | LCO | |||
| Red | 950–970 | 10–15 | 0–10 | 0–10 | 85–100 |
| Orange | 890–920 | 30–90 | 90–100 | 0–5 | 0–5 |
| Green | 880–905 | 10–30 | 70–90 | 0–15 | 0–15 |
| Blue | 860–880 | 5–13 | 45–65 | 35–55 | 0 |
Publisher’s Note: MDPI stays neutral with regard to jurisdictional claims in published maps and institutional affiliations. |
© 2022 by the authors. Licensee MDPI, Basel, Switzerland. This article is an open access article distributed under the terms and conditions of the Creative Commons Attribution (CC BY) license (https://creativecommons.org/licenses/by/4.0/).
Share and Cite
Ershov, M.A.; Savelenko, V.D.; Makhmudova, A.E.; Rekhletskaya, E.S.; Makhova, U.A.; Kapustin, V.M.; Mukhina, D.Y.; Abdellatief, T.M.M. Technological Potential Analysis and Vacant Technology Forecasting in Properties and Composition of Low-Sulfur Marine Fuel Oil (VLSFO and ULSFO) Bunkered in Key World Ports. J. Mar. Sci. Eng. 2022, 10, 1828. https://doi.org/10.3390/jmse10121828
Ershov MA, Savelenko VD, Makhmudova AE, Rekhletskaya ES, Makhova UA, Kapustin VM, Mukhina DY, Abdellatief TMM. Technological Potential Analysis and Vacant Technology Forecasting in Properties and Composition of Low-Sulfur Marine Fuel Oil (VLSFO and ULSFO) Bunkered in Key World Ports. Journal of Marine Science and Engineering. 2022; 10(12):1828. https://doi.org/10.3390/jmse10121828
Chicago/Turabian StyleErshov, Mikhail A., Vsevolod D. Savelenko, Alisa E. Makhmudova, Ekaterina S. Rekhletskaya, Ulyana A. Makhova, Vladimir M. Kapustin, Daria Y. Mukhina, and Tamer M. M. Abdellatief. 2022. "Technological Potential Analysis and Vacant Technology Forecasting in Properties and Composition of Low-Sulfur Marine Fuel Oil (VLSFO and ULSFO) Bunkered in Key World Ports" Journal of Marine Science and Engineering 10, no. 12: 1828. https://doi.org/10.3390/jmse10121828