Article

Molecular, Morphological and Chemical Diversity of Two New Species of Antarctic Diatoms, Craspedostauros ineffabilis sp. nov. and Craspedostauros zucchellii sp. nov.

by
Riccardo Trentin
1,2,
Emanuela Moschin
1,
André Duarte Lopes
2,3,
Stefano Schiaparelli
4,5,
Luísa Custódio
2,* and
Isabella Moro
1,*
1
Department of Biology, University of Padova, 35131 Padova, Italy
2
Centre of Marine Sciences, Faculty of Sciences and Technology, University of Algarve, 8005-139 Faro, Portugal
3
Department of Chemistry and Pharmacy, Fundação para a Ciência e a Tecnologia, University of the Algarve, 8005-039 Faro, Portugal
4
Department of Earth, Environment and Life Sciences, University of Genoa, 16132 Genova, Italy
5
Italian National Antarctic Museum (MNA, Section of Genoa), University of Genoa, 16132 Genova, Italy
*
Authors to whom correspondence should be addressed.
J. Mar. Sci. Eng. 2022, 10(11), 1656; https://doi.org/10.3390/jmse10111656
Submission received: 30 September 2022 / Revised: 30 October 2022 / Accepted: 2 November 2022 / Published: 4 November 2022

Abstract

:
The current study focuses on the biological diversity of two strains of Antarctic diatoms (strains IMA082A and IMA088A) collected and isolated from the Ross Sea (Antarctica) during the XXXIV Italian Antarctic Expedition. Both species presented the typical morphological characters of the genus Craspedostauros: cribrate areolae, two “fore-and-aft” chloroplasts and a narrow “stauros”. This classification is congruent with the molecular phylogeny based on the concatenated 18S rDNA-rbcL-psbC alignment, which showed that these algae formed a monophyletic lineage including six taxonomically accepted species of Craspedostauros. Since the study of the evolution of this genus and of others raphe-bearing diatoms with a “stauros” is particularly challenging and their phylogeny is still debated, we tested alternative tree topologies to evaluate the relationships among these taxa. The metabolic fingerprinting approach was implemented for the assessment of the chemical diversity of IMA082A and IMA088A. In conclusion, combining (1) traditional morphological features used in diatoms identification, (2) phylogenetic analyses of the small subunit rDNA (18S rDNA), rbcL and psbC genes, and (3) metabolic fingerprint, we described the strains IMA082A and IMA088A as Craspedostauros ineffabilis sp. nov. and Craspedostauros zucchellii sp. nov. as new species, respectively.

1. Introduction

Traditionally, the taxonomic identification of diatoms mostly relied on the morphological features of the frustule [1] followed by other characters, such as ultrastructure, sexual reproduction and the development of auxospores [2]. Recently, the advent of molecular tools and “omics” sciences has provided more reliable methods for the study of the molecular and chemical diversity of microalgae and seaweeds [1,2,3]. The combination of morphological, molecular and chemical data, referred to as the polyphasic or integrative approach [4,5], does not only provide an insight into the evolutionary relations among diatom species, but could also deliver useful information on the functioning of diatoms [1]. This study aims to evaluate the different shades of photosynthetic biodiversity (morphological, ecological, molecular and chemical diversity) of two species of diatoms of the genus Craspedostauros E.J. Cox collected and isolated from the Ross Sea (Antarctica) during the XXXIV Italian Antarctic Expedition. Craspedostauros is a relatively small genus of raphid pennate diatoms, characterized by the “stauros”, which is an internal transverse rib of silica at the center of the valve [6,7]. This genus was distinguished by Cox, 1999 from Stauroneis Ehrenberg, according to the following morphological features: (1) cribrate areolae, (2) plate-like plastids with central pyrenoids, H-shaped in valve view, located “fore-and-aft” of the center of the cell, and (3) a central fascia (a transverse hyaline area of the valve) wider than the associated stauros [6,7]. The addition of novel molecular data to the traditional systematic tools has shed light on the evolution and the diversity of the genus Craspedostauros, with the description of novel species and the taxonomic revision of several genera [6,8]. However, while morphological data demonstrated the non-monophyletic nature of the stauros across raphid diatoms [7,9], in 2017, Ashworth et al. [6] highlighted several problems with the phylogenetic position of the genera Craspedostauros and Staurotropis T.B.B. Paddock by testing if the topology implied by a morphology-based tree was significantly different from that recovered from analysis of a DNA based tree. We followed this approach performing a phylogenetic analysis of the concatenated 18S rDNA, rbcL and psbC gene alignment based on the molecular dataset used by Ashworth et al. 2017 [6] expanded by including the sequences of Craspedostauros danayanus Majewska & Ashworth and Craspedostauros macewanii Majewska & Ashworth [8] and those generated in this study from the Antarctic diatoms strain IMA082A and IMA088A. Moreover, we assessed the robustness of trees constraining the monophyly of: (1) Mastogloiales: Craspedostauros, Achnanthes Bory, and Mastogloia Thwaites ex W.Smith (CAM); (2) quadrate rotae taxa: Craspedostauros, Staurotropis, Achnanthes and Mastogloia (CSAM) and the genera Craspedostauros and Achnanthes (CA), which were reported as sister taxa by Ashworth et al. 2017 [6].
In this study, the untargeted UPLC-HR-MS/MS metabolomic approach was applied for the detection of key biomarkers that allowed to distinguish two closely related species of Antarctic diatoms. Metabolome is currently used in a wide array of research fields and particularly, metabolic fingerprinting has been shown to be a promising method in the classification and taxonomy of filamentous fungi, yeast and microalgae [1,10,11,12]. Secondary metabolites profiling has a high differentiation at order, genus and species levels in fungi [11] seaweeds [3] and microalgae [13] and was proposed as a novel method to differentiate northern and southern strains of the cryptic diatom Chaetoceros socialis reinforcing morphological and molecular data [1]. In this sense, we applied metabolic fingerprinting in the taxonomic study of cryptic Craspedostauros species isolated from the Antarctica during the XXXIV Italian Antarctic Expedition (2018/2019). Strains IMA082A and IMA088A collected from two different sites in Antarctica characterized by the same environmental conditions, cultivated at the same conditions and harvested during the exponential growth phase. Algal extracts were subsequently analyzed by liquid chromatography-mass spectrometry (LC-MS) and the differences among the two strains were visualized by principal component analysis based on their metabolic profiles and variations in metabolite markers were visualized through hierarchical clustering heat maps.
Finally, we describe two novel species of Antarctic diatoms, namely Craspedostauros ineffabilis sp. nov. strain IMA082A and Craspedostauros zucchellii sp. nov. strain IMA088A through this integrative approach. Specifically, to support the establishment of this lineages, we provide (1) morphological data, acquired with light and scanning electron microscopy (SEM), (2) a phylogeny of the concatenated 18S rDNA, rbcL and psbC gene alignment and (3) metabolic fingerprinting.

2. Materials and Methods

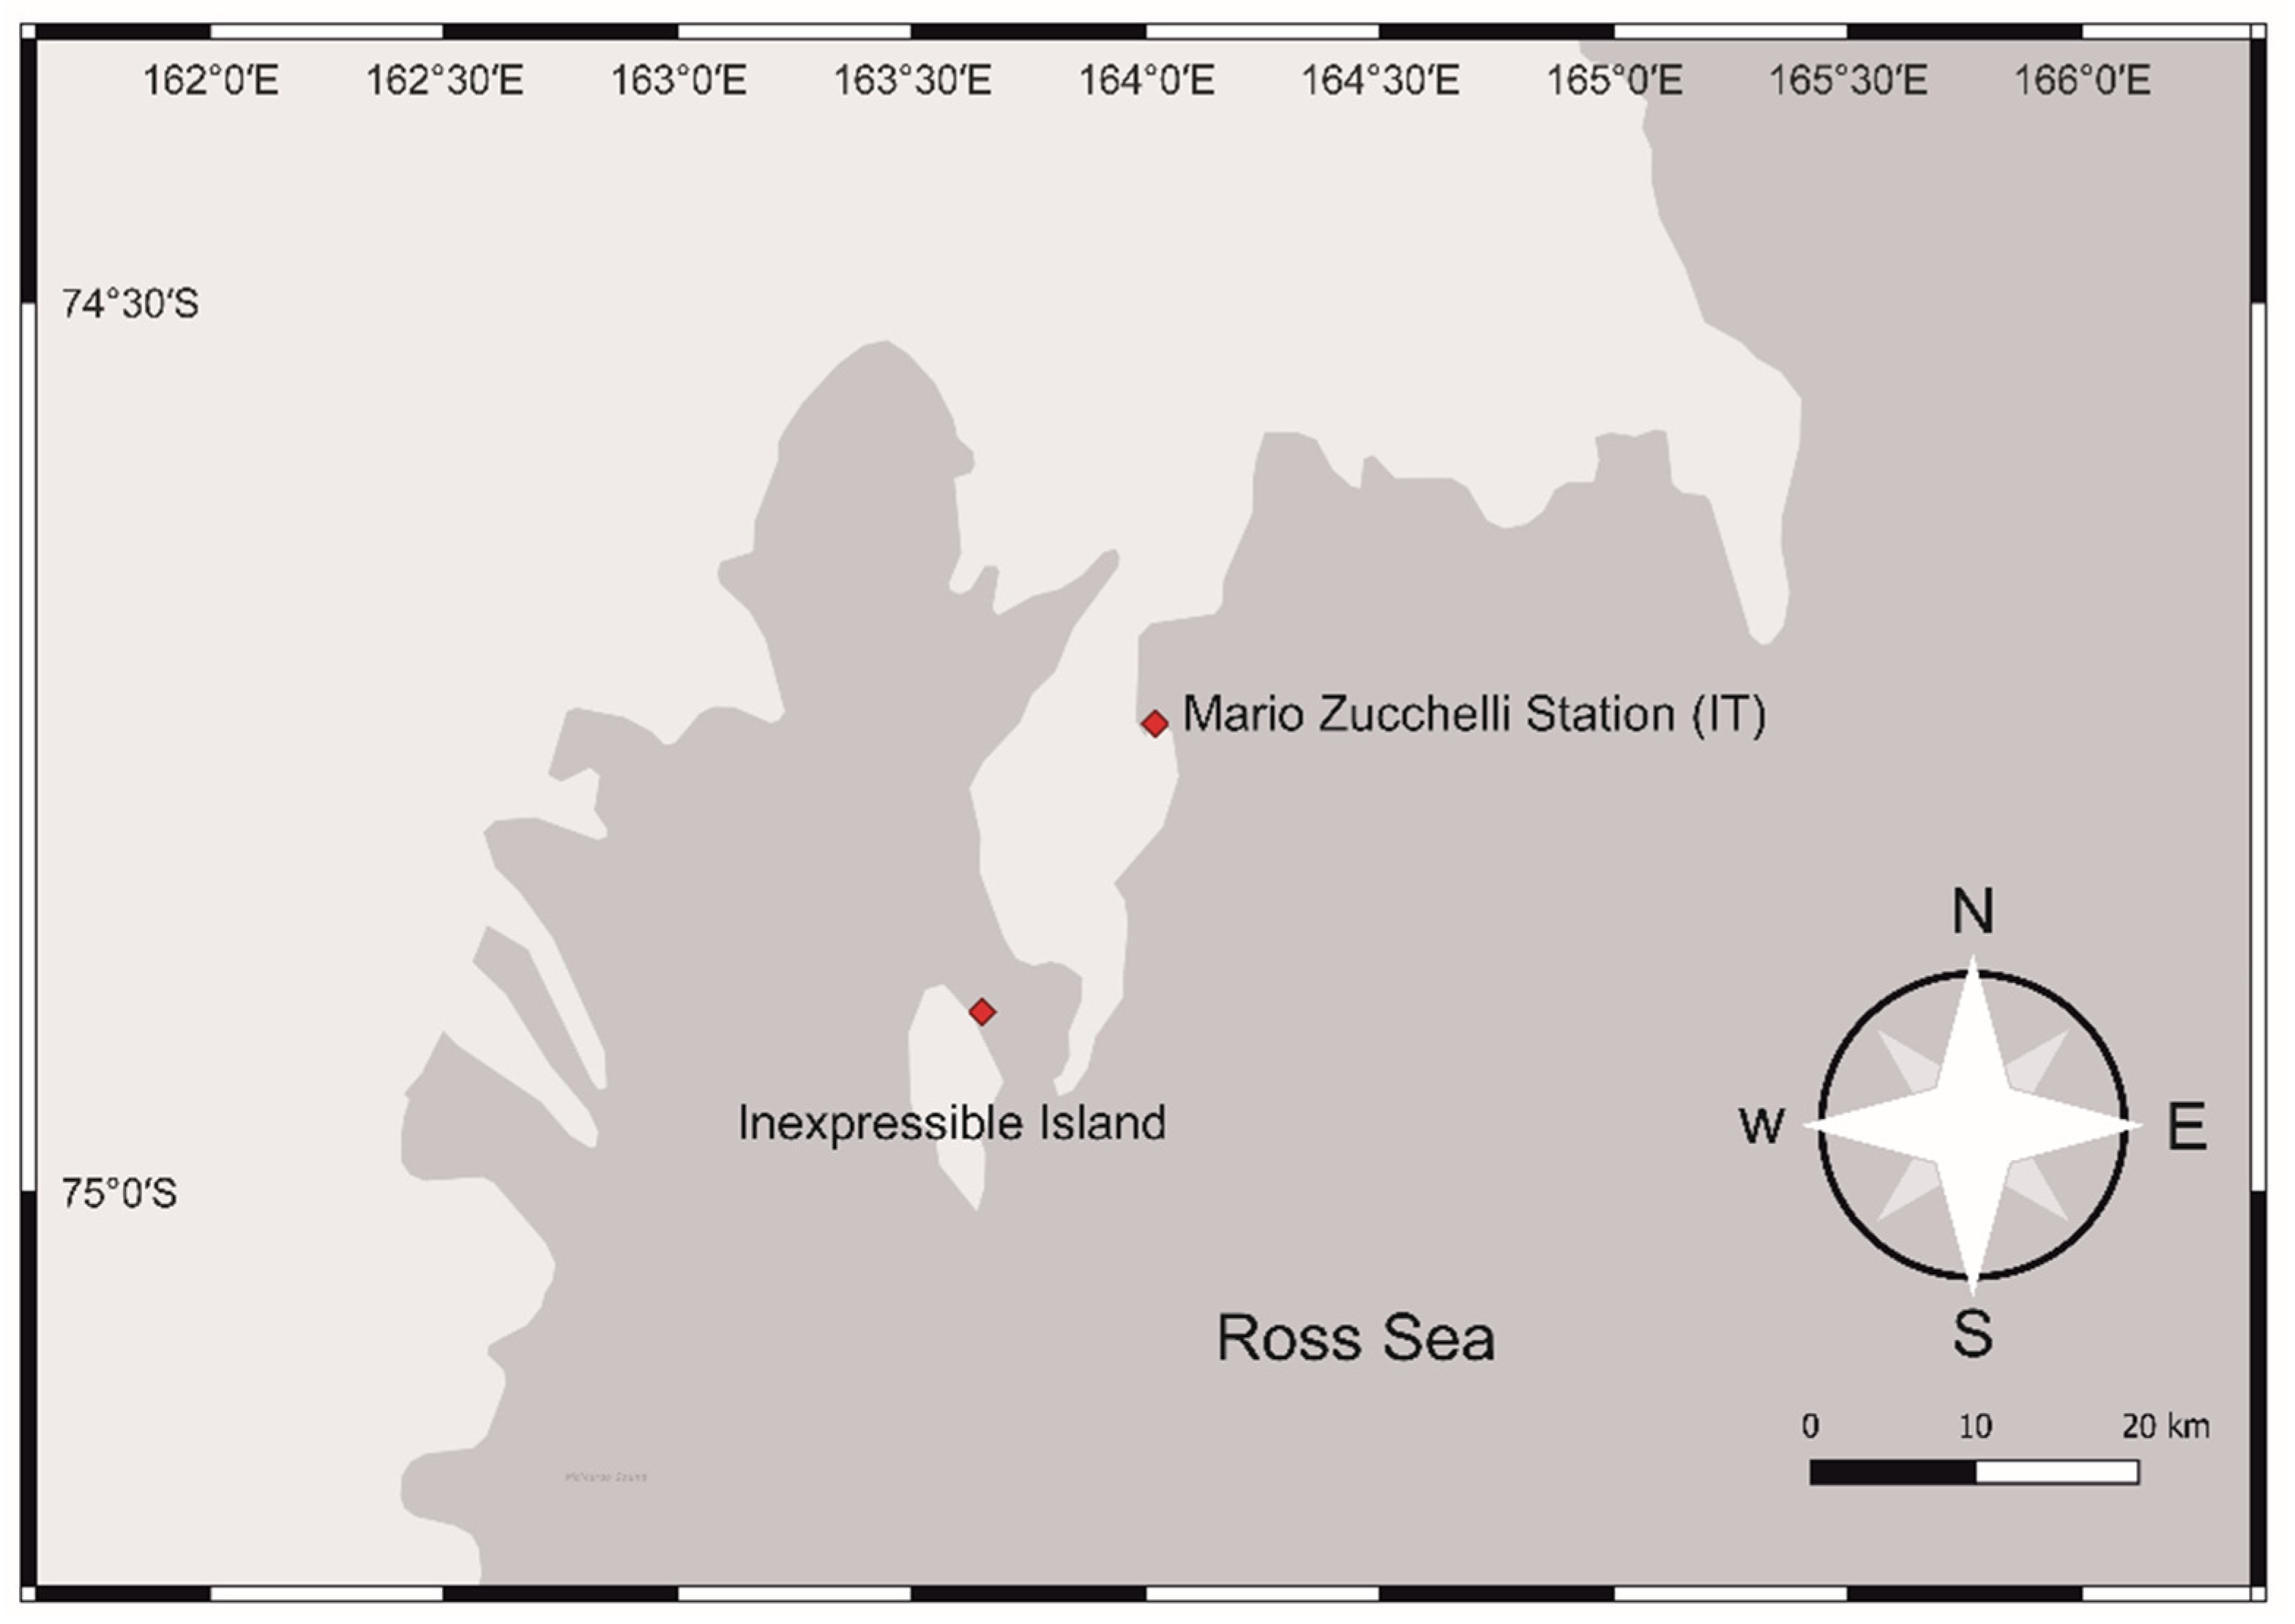
2.1. Isolation and Cultures

During the XXXIV Italian Antarctic Expedition (2018/2019), from samples collected in Terra Nova Bay, Ross Sea, Antarctica by Isabella Moro, two diatom strains were isolated: IMA082A from a seawater sample collected from Inexpressible Island with coordinates 74°54′ S 163°39′ E, and IMA088A obtained from a sampling of the desalination plant filters of the Italian research Mario Zucchelli Station, with coordinates 74°41′39.06″ S 164°07′18.18″ E (Figure 1). The diatoms strains IMA082A and IMA088A were grown both in F/2 [14] growth medium with a salinity of 35‰ in a growth chamber at 5 °C and a light intensity of 10 μmol photons m−2 × s−1.

2.2. Molecular Analysis

2.2.1. DNA Extraction and Amplification of Selected Molecular Markers

Culture aliquots of IMA082A and IMA088A isolates were harvested and centrifuged for 5 min at 13,000× g in a Sigma 1–15 microcentrifuge (Sigma Laborzentrifugen GmbH, Germany). Pelleted cells were ground in a mortar with a pestle using quartz sand. The homogenate was recovered and the DNA was extracted using the DNeasy Powersoil Pro Kit® (Qiagen, Hilden, Germany), following manufacturer’s indications. Genomic DNA was quantified with a DU 530 Beckman Coulter UV/vis spectrophotometer (Beckman Instruments Inc., Fullerton, CA, USA). Three molecular markers (18S rDNA, rbcL and psbC partial gene sequences) were amplified for phylogenetic analysis. The 18S rDNA region was amplified using the general eukaryotic primers Euk528F, EukA, EukB, Euk1209F and U1391R [15,16,17,18,19] and the amplification profiles used by Hugerth et al. 2014 [20]. Partial fragments of rbcL and psbC were amplified using the primer pairs rbcL1255+/rbcL66− and psbC+/psbC− [21] with the amplification profile described by Alverson et al. 2007 [21]. PCR products were verified by gel electrophoresis and purified with HT ExoSAP-IT High-Throughput PCR Product Cleanup reagent (ThermoFisher Scientific, Waltham, MA, USA) before sequencing. Sequencing was performed by the BMR Genomics Sequencing Service (University of Padua) using the same amplification primers used for 18S rDNA and rbcL, while the primer pair psbC221+/psbC857 [21] was used for the sequencing of psbC. The final consensus sequences, created using SeqMan II from Lasergene package (DNAStar, Madison, Wisconsin, USA), were compared with those available in online databases by using BLAST tool [22].
The obtained sequences for IMA082A (1432 for the 18S rDNA gene, 1055 bp for the rbcL gene, 714 bp for the psbC gene) and IMA088A (1630 bp for the 18S rDNA gene, 896 bp for the rbcL gene, 866 bp for the psbC gene,) were deposited in GenBank, with the following accession numbers: OP354221, OP354493 and OP354495 (18S rDNA, rbcL and psbC for IMA082A) and OP354222, OP354494 and OP354496 (18S rDNA, rbcL and psbC for IMA088A).

2.2.2. Phylogenetic Analyses

Separate alignments were created for 18S rDNA, rbcL and psbC using sequences obtained in this study and other sequences of diatoms included in the dataset used by Ashworth et al. 2017 were implemented with new sequences of Craspedostauros retrieved from the GenBank® database [23] (Table S1). 18S rDNA sequences were aligned using the program SSUalign [24], rbcL and psbC datasets were aligned with CLUSTALW [25] implemented in MEGA-X 10.2.4 [26]. The resulting alignments were concatenated in MEGA-X 10.2.4 and a concatenated phylogenetic tree was inferred by maximum likelihood criteria using IQTree 1.6.12 [27]. ModelFinder [28] was used to find the best evolutionary models for each of the three subsets (18S rDNA, rbcL and psbC). The best models were selected by the Akaikie Information Criterion. For the 18S rDNA partition, a TIM3+F+I+G model with empirical base frequencies (F), a proportion of invariable sites (I) and a gamma shape parameter (G) was adopted, while for both the rbcL and psbC partitions a GTR+F+I+G model with empirical base frequencies (F), proportion of invariable sites (I) and a gamma shape parameter (G) was chosen. The robustness of the topologies was assessed by approximate Likelihood Ratio Tests (aLRT) based on Shimodaira–Hasegawa (SH)-like procedures [29] in IQTree, by Bayesian inference (BI) in MrBayes v3.2.7 [30] and bootstrap (BT) re-samplings (1000 replicates) in IQTree. The BI analyses consisted of two separate concurrent Markov chain Monte Carlo (MCMC) runs, each composed of four chains (three heated and one cold), for 5 × 10⁶ generations, with trees sampling every 1000 generations. The posterior distribution at the end of each run was considered adequate if the average standard deviation of the split frequencies was ≤0.01. The first 12,500 trees were discarded as burn-in, as determined with Tracer version 1.7 [31], and the consensus topology and posterior probabilities (PP) were derived from the remaining trees. Different topologies of the concatenated tree were tested in IQTree using the RELL method [32], Kishino–Hasegawa test [33], Shimodaira–Hasegawa test [34], expected likelihood weights [35] and approximately unbiased (AU) test [36] with 10,000 resamplings.

2.3. Morphological Analysis

Samples of IMA082A and IMA088A were examined using a Leitz Dialux 22 light microscope (Leitz, Westlar, Germany) equipped with an Optika C-P8 digital camera (Optika, Bergamo, Italy). Scanning electron microscope (SEM) observations were carried out using a scanning electron microscope FEI Quanta 200 variable pressure-environmental/ESEM (FEI, Eindhoven, The Netherlands) at a working distance of 7.5–9.8 mm and at a 20 kV voltage. IMA082A and IMA088A cells were prepared for SEM microscopy by fixation in glutaraldehyde 2.5% in 0.1 M cacodylate buffer (pH 6.9) and post-fixation in 1% osmium tetroxide (OsO4), in the same buffer, for 2 h. Samples were dehydrated in a graded concentration increasing ethanol series with centrifugation (1500× g for 3 min) following every different concentration step. Subsequently, ethanol was removed by critical point drying and samples were gold-coated by sputtering for 4 min with a Sputter Coater (Edwards, Crawley, UK). Morpho-ecological data for strains IMA082A, IMA088A and other Craspedostauros species were summarized in a matrix and visualized using a principal component map calculated with the ‘PCAmixdata’ package implemented in R-Statistics® 3.5.3 version (The R Foundation, Vienna, Austria).

2.4. Metabolomics

2.4.1. Sample Preparation

Briefly, microalgal biomass was harvested at exponential growth and lyophilized. Subsequently, 50 mg of lyophilized biomass of IMA082A and IMA088A were extracted using acetone 80% (v/v) and cell disruption by bead-beating in an MM400 mixer mill (Retsch, Haan, Germany) at 30 Hz for 5 min. The extracts were centrifuged at 12,000× g for 10 min at 4 °C and the supernatants were collected. After the recovery of the supernatants, the remaining biomass was re-extracted until both the pellet and the supernatant became colorless. The extracts were incubated overnight at 4 °C and subsequently filtered (Whatman no. 4) and dried under reduced vacuum pressure at 40 °C. Dried extracts were weighed, dissolved in pure methanol at the concentration of 10 mg/mL, filtered (0.2 nm) and diluted at the concentration of 2 mg/mL for the determination of their chemical profiles.

2.4.2. UPLC-HR-MS/MS Profiling of Extracts

The chemical profiles of IMA082A and IMA088A extracts were analyzed by liquid chromatography-high resolution mass spectrometry (LC-HR-MS) following the procedure described by Silva et al. 2022 [13]. A Thermo Scientific™ UltiMate™ 3000 UHPLC, coupled with an Orbitrap Elite (Thermo Fisher Scientific, Waltham, MA, USA) mass spectrometer with a Heated Electro-Spray Ionization source (HESI-II; Thermo Scientific) was used to analyze the extracts. 5 µL of each extract (1:10 diluted in pure LC-MS grade methanol) were injected and separated using a Thermo Scientific Accucore RP-18 column (2.1 × 100 mm, 2.6 µm) running for 40 min. The mobile phase consisted of ultra-pure LC-MS grade water with 0.1% formic acid and LC-MS grade acetonitrile, containing 0.1% formic acid. Positive and negative polarity data were acquired in separate runs. Extracts were analyzed in data-dependent mode with the selection of the three most intense ions under dynamic exclusion and collision-induced dissociation (CID) activation. MS/MS fragmentation was achieved using 35 keV rising collision energy in an isolation window of 2. The minimum signal required for ddMS2 triggering was 1000. Xcalibur v4.1 Qual Browser (Thermo Scientific, Waltham, MA, USA) was used for LC-MS data acquisition and subsequent analyses. Three independent replicates per each extract were used.

2.4.3. Metabolomic Data Processing and Statistical Analysis

Raw data were processed using Compound Discoverer™ 3.2.0.421 (Thermo Fisher Scientific, Waltham, MA, USA). Untargeted metabolomics workflow (Untargeted Metabolomics with Statistics Detect Unknowns with ID Using Online Databases and mzLogic) was used to perform retention time alignment and unknown compound identification using publicly available databases. The “Detect Unknown Compounds” node parameters included default values with exception for mass tolerance (set to 10 [ppm]) and min. peak intensity (set to 1000). The “Search ChemSpider” node was used to search mass spectral databases for matching compounds within a specified mass tolerance range or with a certain elemental composition using Natural Products Atlas [37], Lipid Maps [38], KEGG [39], Drugbank [40], Carotenoids Database [41], Human Metabolome Database [42], Phenol Explorer [43] and BioCyc [44] online databases. Furthermore, the following mass lists included in the Compound Discoverer software were searched: Arita Lab 6549 flavonoid structure database, EFS HRAM compound database, Endogenous Metabolites database 4400 compounds, Lipid Maps Structure database, Natural Product Atlas. A blank was used for background subtraction and noise removal during the pre-processing step. The “cleaned-up” feature lists (see Tables S2 and S3) were used to perform multivariate analysis on the metabolomics profiles of IMA082A and IMA088A extracts.
Initially, principal component analysis (PCA) was carried out in Compound Discoverer to investigate clustering patterns in the dataset. Subsequently, ANOVA test on normalized signals of each identified metabolite was carried out in Compound Discoverer to evaluate the statistical differences (p-value < 0.005) among the metabolomes of IMA082A and IMA088A. A hierarchical clustering of the statistically significant metabolites was implemented in R-Statistics® 3.5.3 version.

3. Results

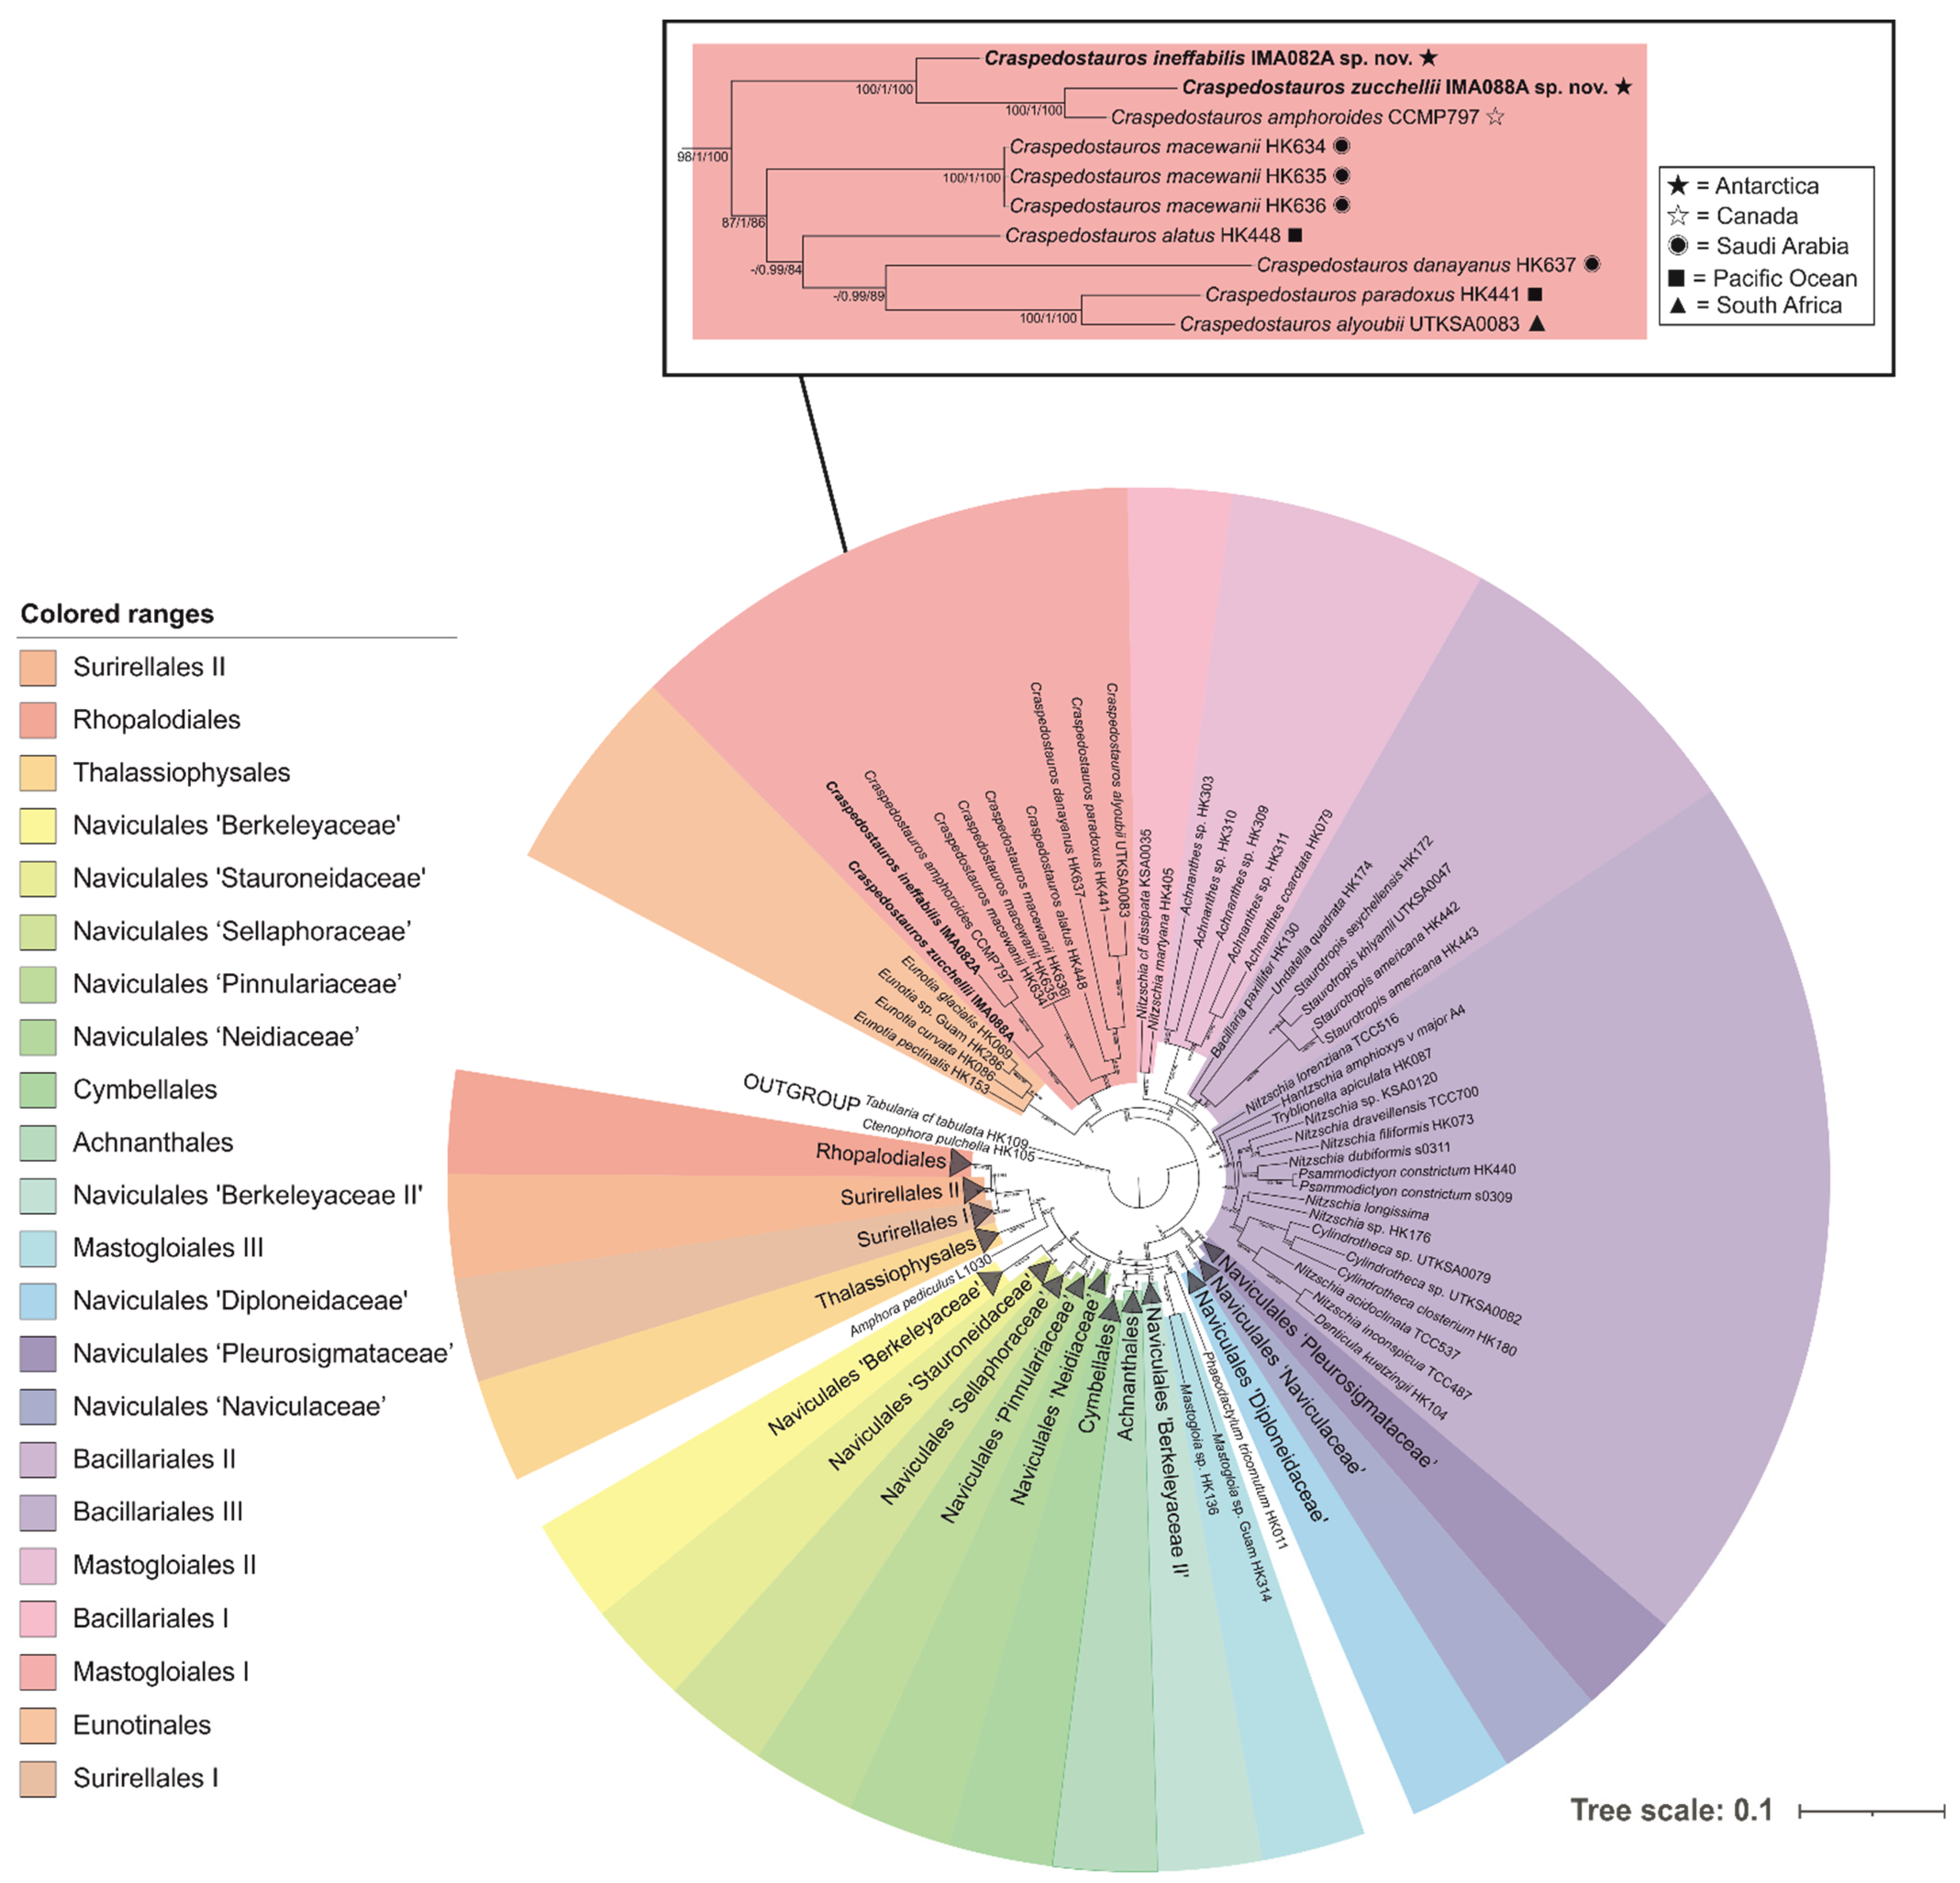
3.1. Phylogenetic Analysis and Hypothesis Testing

In the best unconstrained tree (Figure 2) recovered from the concatenated (18S rDNA-rbcL-psbC) alignment, the Antarctic strains IMA082A and IMA088A belonged to a well-supported clade (98/1/100) that also included sequences of 6 Craspedostauros species described as C. alatus Majewska & M.P. Ashworth, C. amphoroides (Grunow ex A.W.F. Schmidt) E.J.Cox, C. alyoubii J. Sabir & M.P. Ashworth, C. paradoxus M.P. Ashworth & Lobban, C. danayanus, C. macewanii [6,7,8,45]. Strain IMA082A recovered as the sister taxon to C. amphoroides with strong statistical support (100/1/100), while strain IMA088A was sister taxon to the clade formed by IMA082A and C. amphoroides with high statistical support (100/1/100). The results of the phylogenetic analyses were assessed to evaluate the robustness of different topologies. Trees constraining the monophyly of all Mastogloiales: Craspedostauros, Achnanthes, and Mastogloia (CAM) and quadrate rotae taxa: Craspedostauros, Staurotropis, Achnanthes and Mastogloia (CSAM), were significantly rejected, while the tree constraining to monophyly Craspedostauros and Achnanthes (CA) was not significantly excluded (Table 1). Our phylogram showed unequivocally that the polar strains IMA082A and IMA088A belong to separate species, which are closely related.

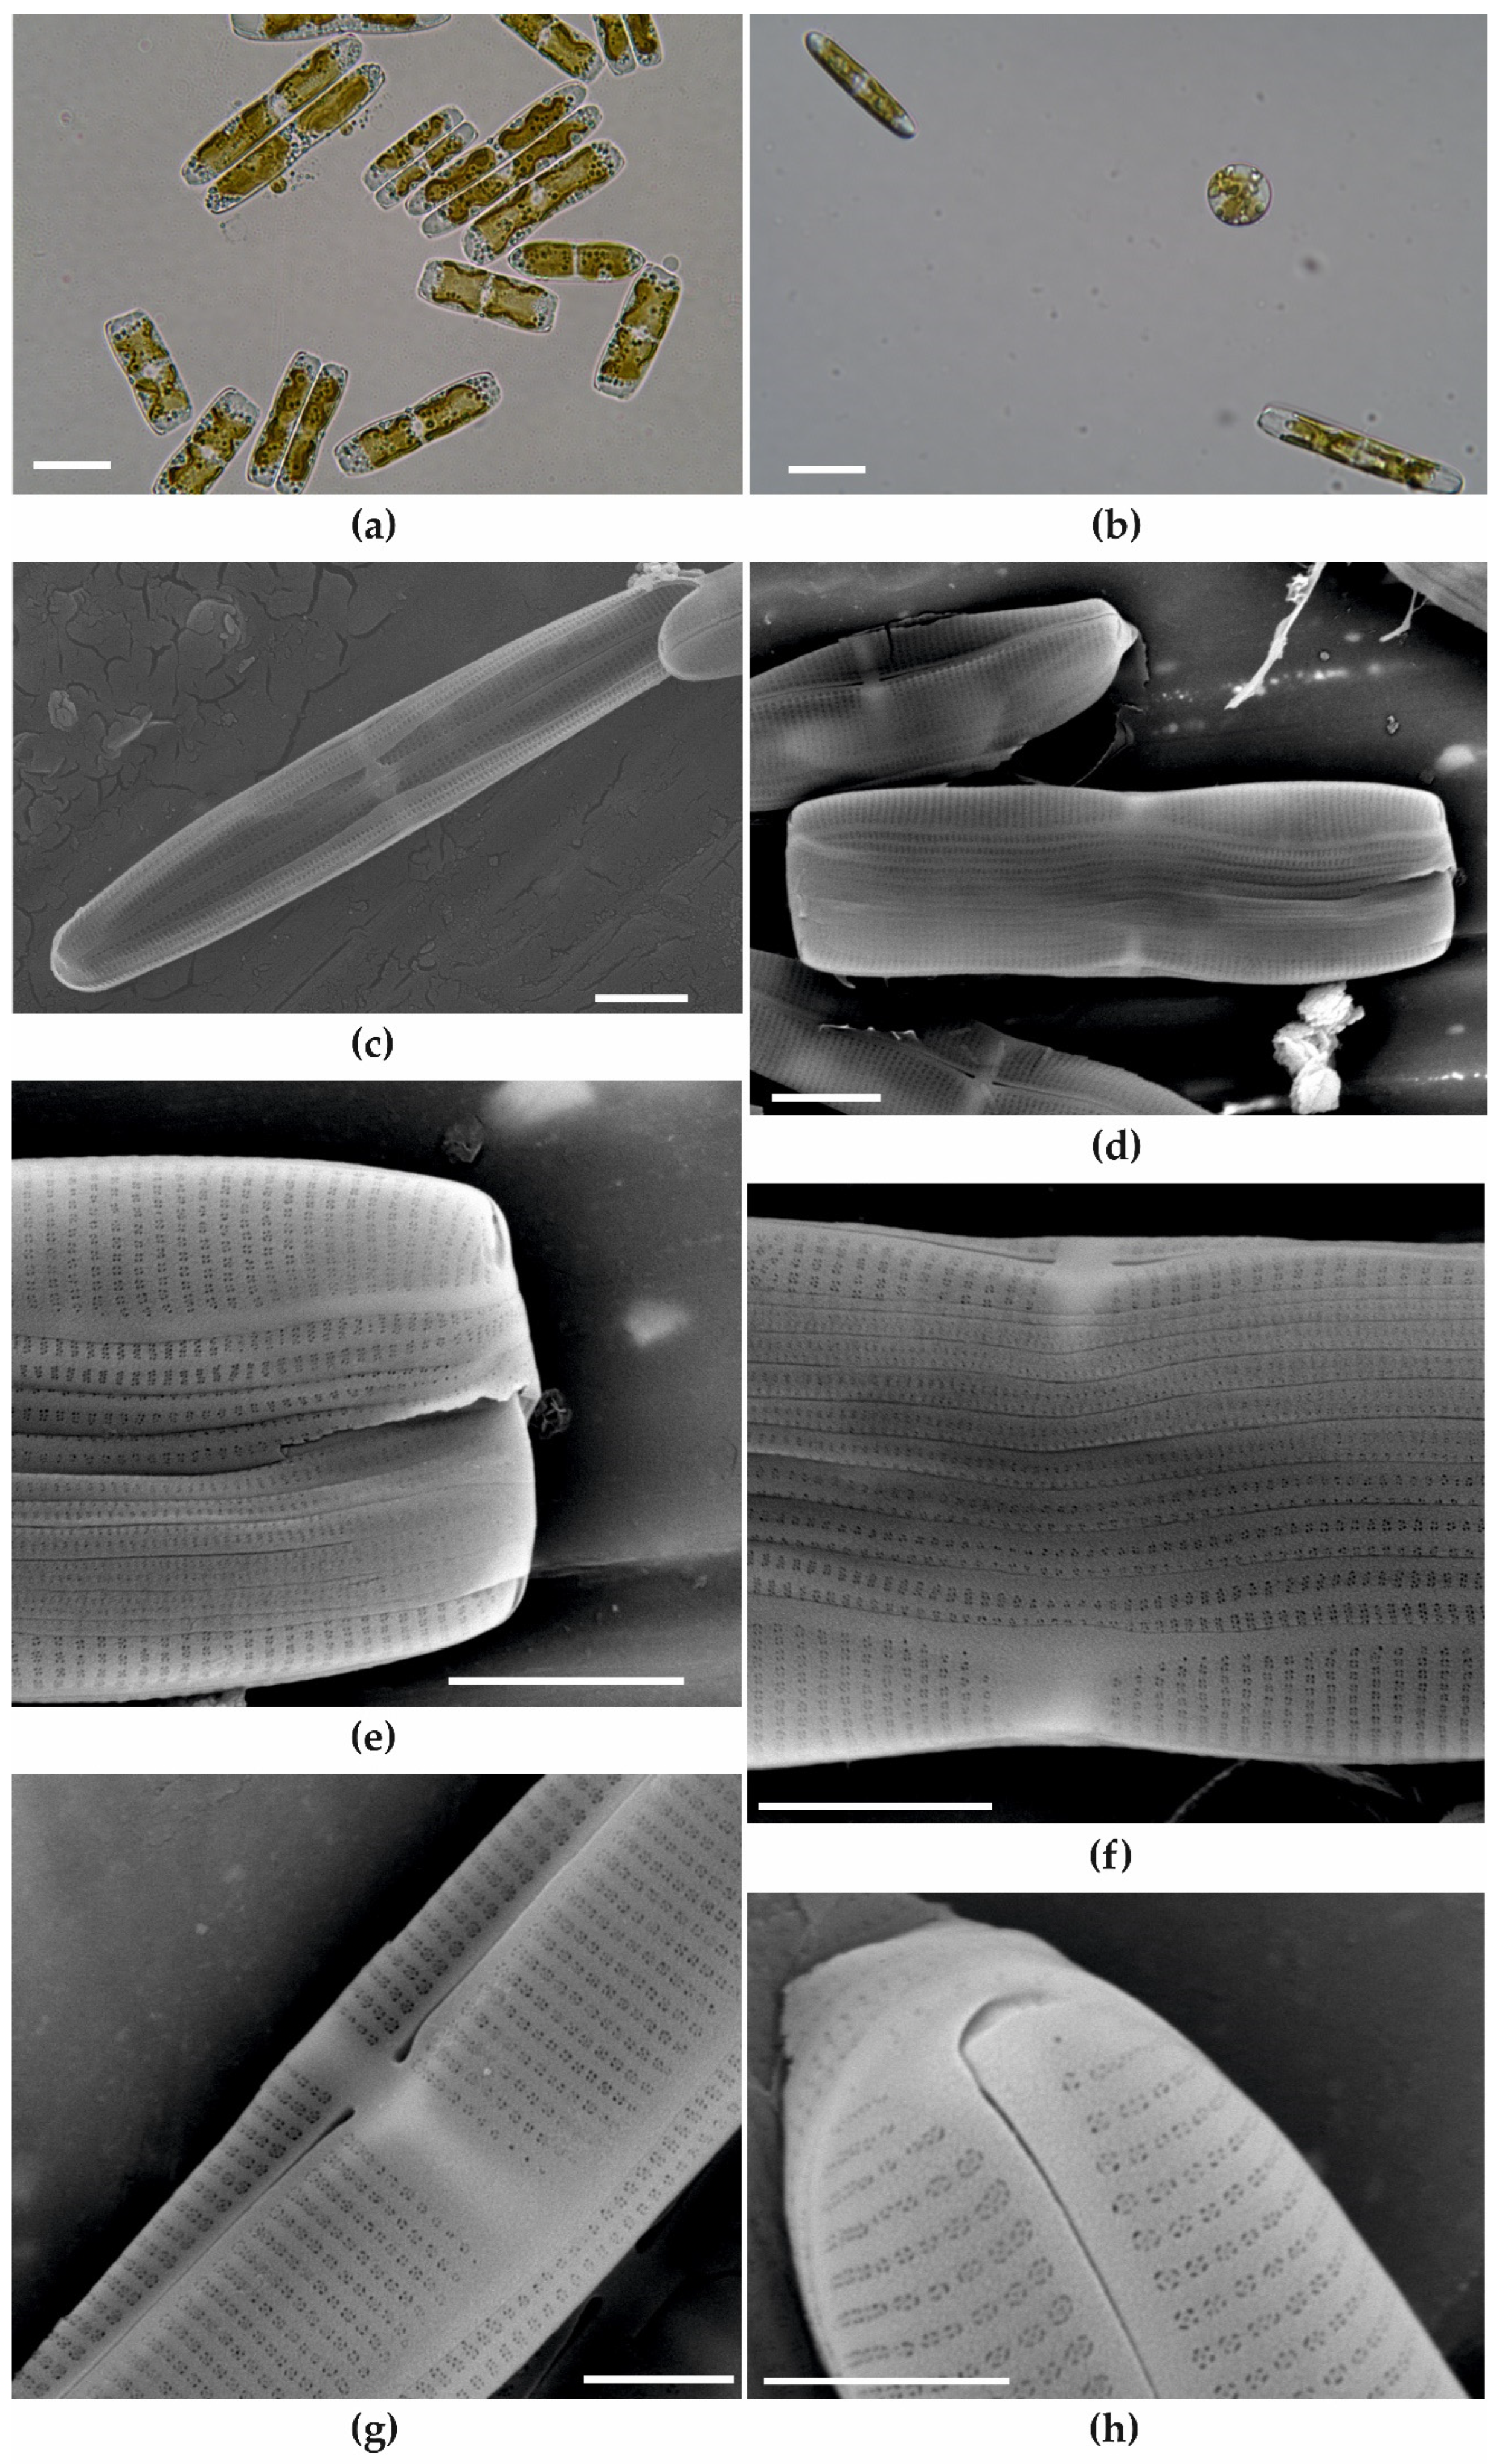
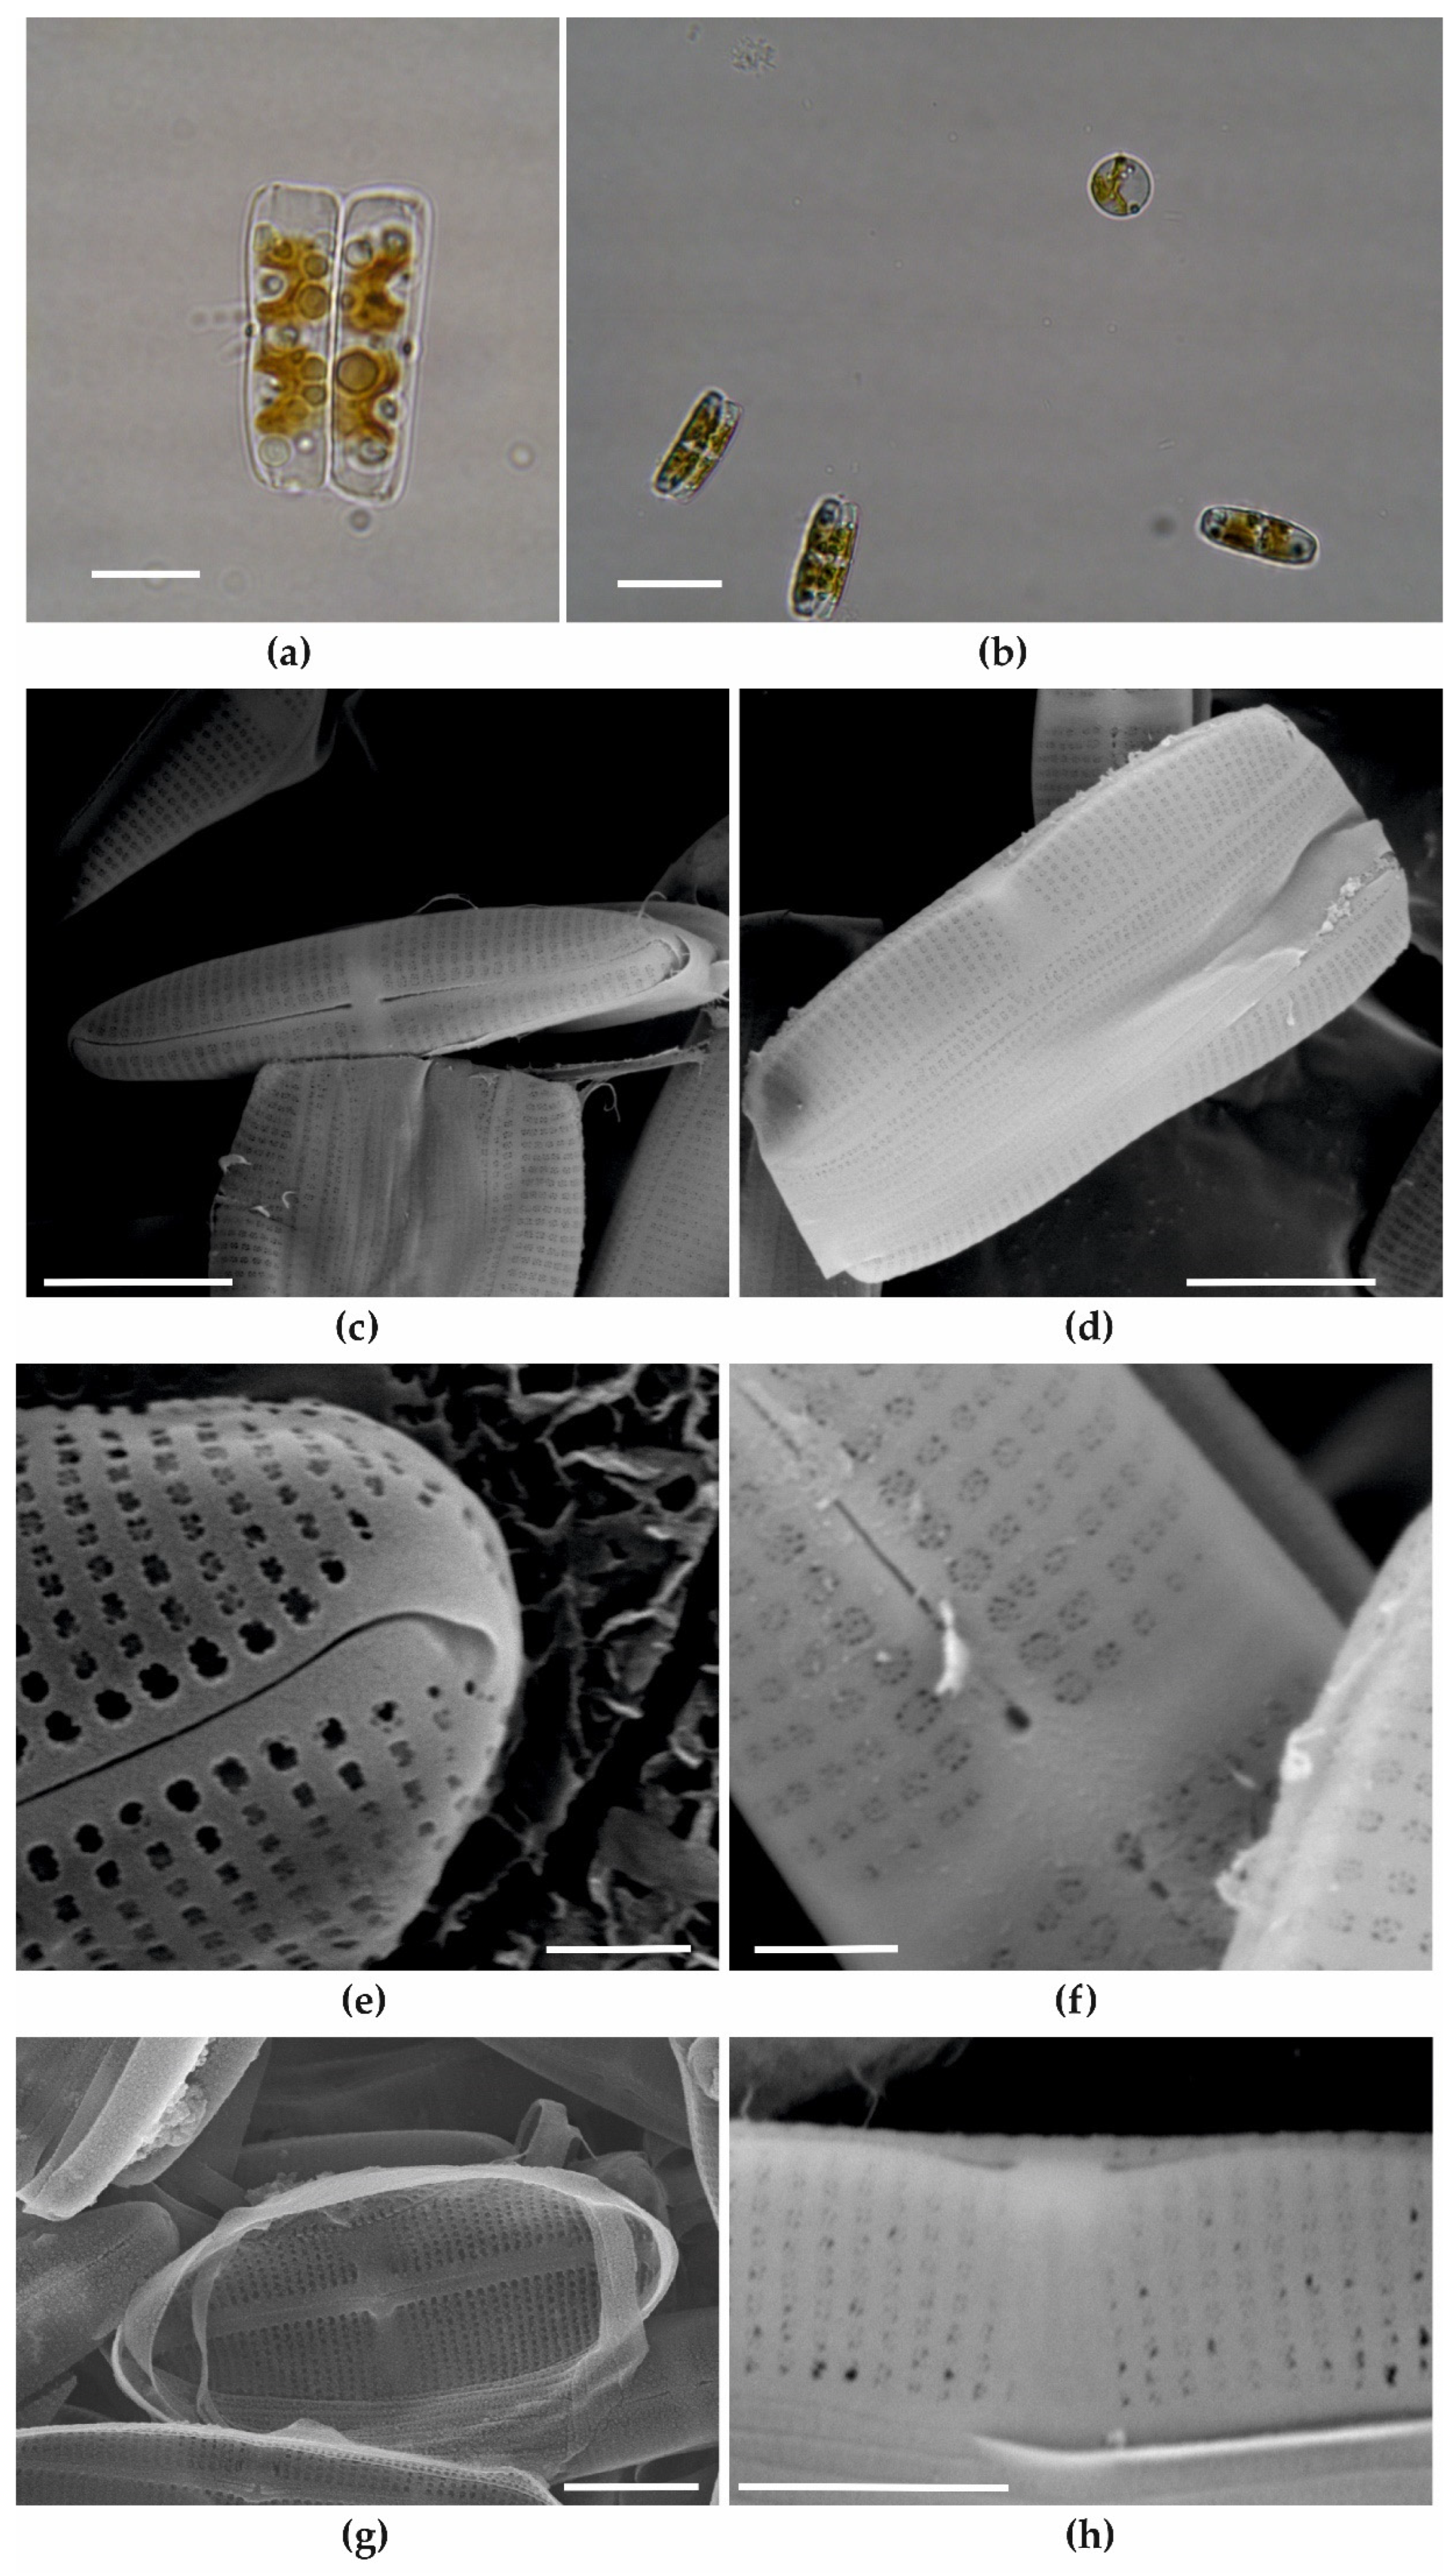
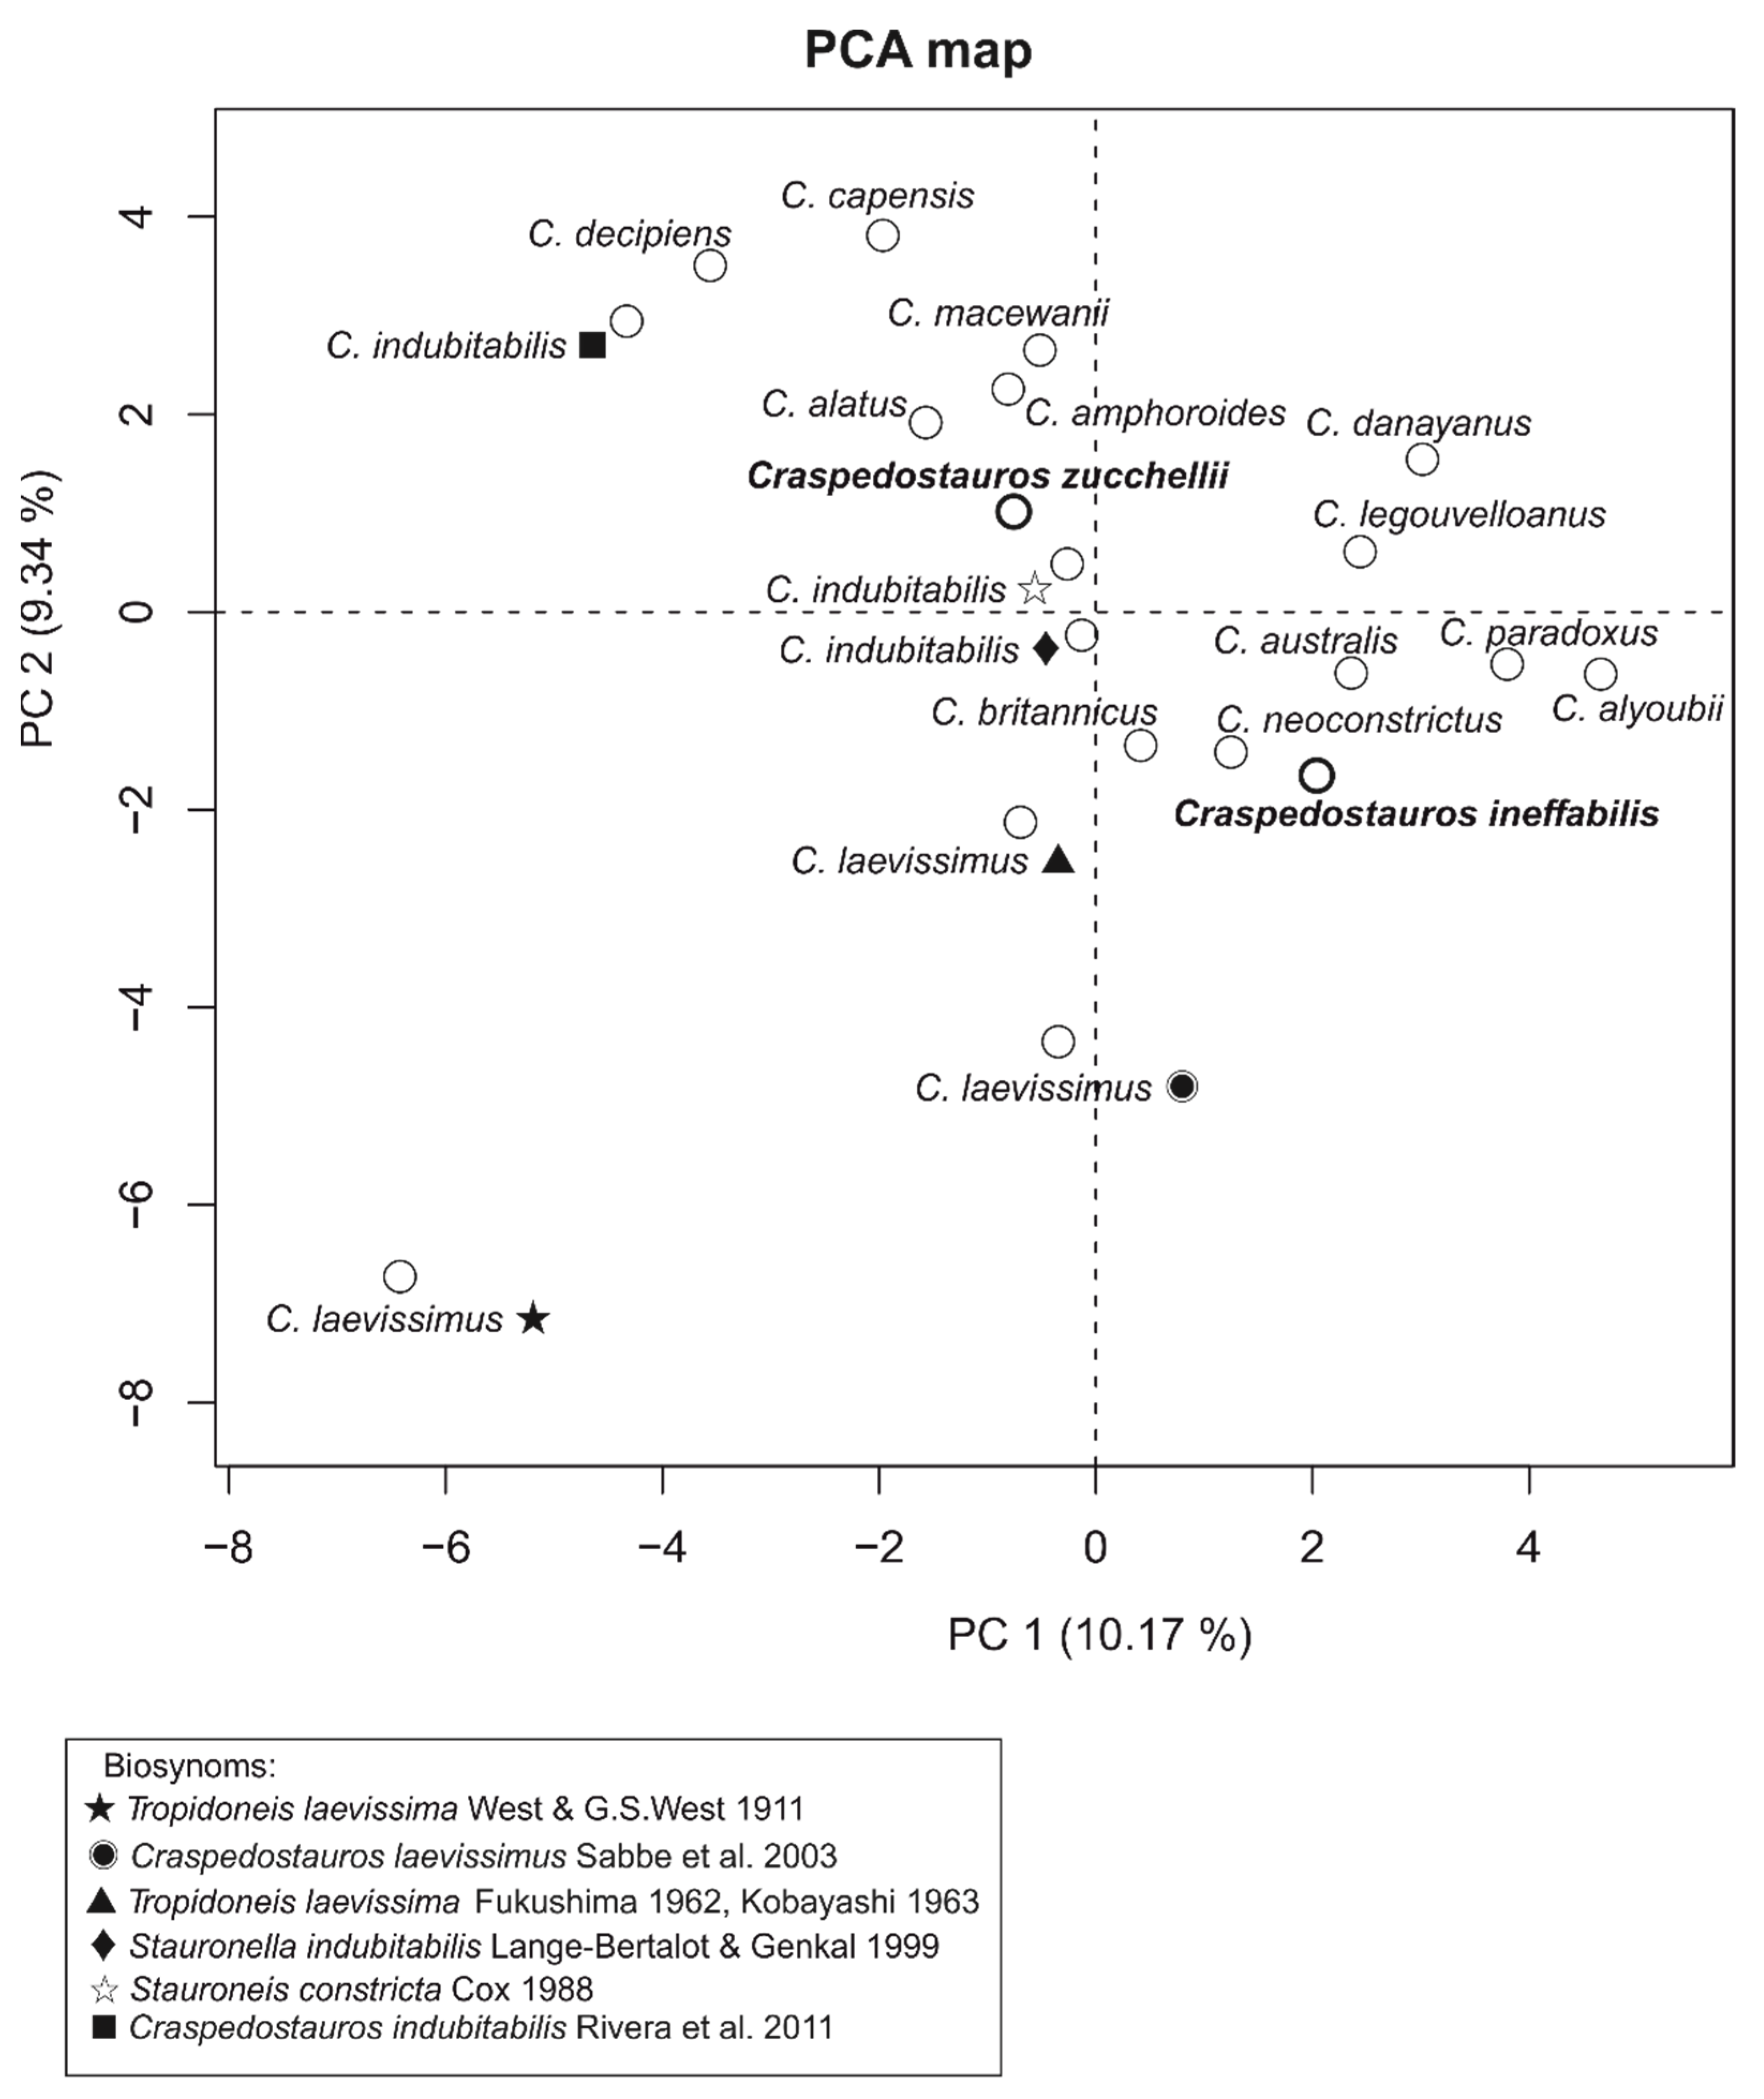
3.2. Morphological Observations and Taxonomic Descriptions

Through light and scanning electron microscope observations, strains IMA082A and IMA088A appeared as pennate raphid diatoms, as well as our results based on DNA data.
The valve of IMA082A is linear elongate with rounded apices and a central stauros (Figure 3a). Two lobed, H-shaped plastids are present; one each between the central area and valve apex (Figure 3a). The auxospore is spherical (Figure 3b). Internally, the central area of valve shows a very slightly raised stauros, narrow and broadens at the valve center (Figure 3c) and central raphe endings terminate onto helictoglossae (Figure 3c). At the poles the external raphe fissure deflects strongly to one side. Valves show indistinct valve face-mantle junction (Figure 3d–f). In girdle view the cells have a slightly central constriction so the valve margin is not markedly biarcuate and curve slightly at the poles (Figure 3a,d–f). The girdle view shows many pored bands (Figure 3d–f). Areolae are similar in size throughout the valve, squarish to rounded, and broadening abruptly close to the raphe (Figure 3g,h). Striae are uniseriate, 25–36 in 10 µm, parallel through all the valve length (Figure 3c–h). Areolae are externally occluded by cribra perforated by 4–7 pores (Figure 3g,h).
The valve of IMA088A is linear to lanceolate in shape, with rounded apices and a central stauros (Figure 4a–c). The raphe slit is straight, curving strongly and unilaterally at the poles. Two lobed, H-shaped plastids are present; one each between the central area and valve apex (Figure 4a). The auxospore is spherical (Figure 4b). In girdle view the valve margin is not markedly biarcuate with a slight constriction in the center and curving slightly at the ends (Figure 4a,d). Striae are uniseriate, 22–31 in 10 µm, parallel through all the valve length (Figure 4c,d). Valves with distinct valve face-mantle junction (Figure 4d). Mantle has many rows of pored girdle bands (Figure 4d). Rounded areolae increase in size close to the raphe (Figure 4e,f). Internally, the stauros is slightly raised (Figure 4g) and central raphe endings terminate onto helictoglossae (Figure 4g). Areolae are occluded by cribra perforated by four to more pores (Figure 4f,h). Morpho-ecological data of IMA082A, IMA088A and other species of the genus Craspedostauros (Table 2) were visualized in a principal component map (Figure 5). The first component accounted for 10.17% of the total variance among species, while the second component accounted for 9.34% of the variance.
Table 2. Morphological comparison of Craspedostauros species.
Valve
Outline
Valve Length (µm)Valve Width (µm)Stria
Density (in 10 µm)
Areola SizeInternal
Central Area
Valve
Face–Mantle Junction
Valve Margin at CentreAverage
Number of Areolae Pores
Central
Lip-Like Silica Flaps
Type LocalityHabitatReference
C. neoconstrictus±Linear, constricted40–1105–7∼25SimilarSlight helictoglossaeIndistinctExpanded6 (?)UnknownSussex, EnglandMarine[7]
C. decipiensLanceolate20–383–520–22VariableUnknownDistinctStraight10–12UnknownBosporusMarine[7]
C. capensisLanceolate, constricted25–354.5–5.519VariableRectelevatum + KnobIndistinctStraight5–13RudimentaryCape Columbine, South AfricaMarine (intertidal)[7]
C. britannicusLinear to narrow lanceolate14–605–6∼24SimilarHelictoglossaeIndistinctSlightly expanded5(+)RudimentarySeascale, Cumbria, UKMarine (driftwood)[7]
C. australisLinear35–784–635SimilarRectelevatum + KnobIndistinctStraight4RudimentaryPort Phillip Bay, AustraliaMarine[7]
C. amphoroidesLanceolate to slightly constricted28–453.5–730–32VariableSlight helictoglossaeDistinctStraightUnknownUnknownFrauenfeld’s marin AquariumMarine[7]
C. alyoubiiLinear, slightly-constricted83–1056–10∼40SimilarRectelevatum + KnobIndistinctStraight4–5ProminentDuba, Saudi ArabiaMarine[6]
C. danayanusLinear, very slightly constricted28–612–2.549–51SimilarRectelevatumIndistinctStraight6–8AbsentMabibi Beach, Elephant Coast, South AfricaMarine (carapace of a sea turtle)[8]
C. legouvelloanus aLinear to linear-lanceolate, slightly constricted18–34
(23–39)
3–5 (–6)46–49
(40–44)
SimilarRectelevatum + knob with central cavityIndistinctClearly expanded4Well developedKosi Bay, South AfricaMarine (carapace of a sea turtle)[8]
C. macewaniiLinear to linear-lanceolate, slightly constricted26–514.5–5.528–31SimilarRectelevatum + knobDistinctStraightHighly variableRudimentaryuShaka Sea World, Durban, South AfricaMarine (carapace of a sea turtle)[8]
C. paradoxusLinear, slightly-constricted80–856.5–936–40Similar; can be longer near valve edgeRectelevatum + KnobIndistinctStraight4–5ProminentGab Gab reef, Apra Harbor Guam, USAMarine[6]
C. alatus aLinear to linear-lanceolate, slightly constricted20–37
(16–38)
3–5
(5–7)
26–28
(22–25)
VariableRectelevatumDistinctVery slightly expandedHighly variableRudimentaryRiverhead, New York, USAMarine (carapace of a sea turtle)[45]
C. laevissimusLinear to linear-lanceolate, without consctiction37–665.5–7.824–27.5SimilarHelictoglossaeUnknownUnknown3–6UnknownLakes and pools in the Larsemann Hills, Rauer Islands and
Bølingen Islands, Antarctica
Brackish water[46]
C. laevissimus (Tropidoneis laevissima)Linear to linear-lanceolate, without consctiction27–795–920–28UnknownUnknownUnknownUnknownUnknownUnknownLakes and ponds in Kasumi Rock and on Shin-nan Rock, AntarcticaBrackish water[47,48]
C. laevissimusLinear to Eliptical49–988–9.5AbsentUnknownUnknownUnknownUnknownUnknownUnknownClear Lake, Green Lake, and lake on west side of McMurdo Sound, AntarcticaFresh and Brackish water[49]
C. indubitabilis (Stauronella indubitabilis)Linear to eliptical25–606–725–27UnknownUnknownUnknownUnknownUnknownUnknownArctic OceanMarine[50]
C. indubitabilis (Stauroneis constricta)Lanceolate, sometimes slightly constricted30523–27SimilarRectelevatum + KnobUnknownUnknown4–5Unknown[51]
C. indubitabilisLinear to eliptical, sometimes slightly constricted16–274.4–7.622–30VariableRectelevatum + KnobUnknownUnknown3–13RudimentaryBahía Salada, Caldera, ChileMarine costal water[52]
C. infeffabilisLinear31–584–7.525–36SimilarHelictoglossaeIndistinctStraight4–7AbsentInexpressible Island, Terra Nova Bay, AntarcticaMarine costal waterThis study
C. zucchelliiLinear to lanceolate14.5–243–622–31VariableHelictoglossaeDistinctStraight4(+)AbsentZucchelli Station, Terra Nova Bay, AntarcticaMarine costal waterThis study
a Values and descriptions given in brackets refer to the Adriatic populations.
Molecular phylogeny, together with morpho-ecological data supports the idea that the Antarctic strains IMA082A and IMA088A collected during the XXXIV Italian Antarctic Expedition belong to two new species of diatoms of the genus Craspedostauros. In addition to the molecular data, discussed in the section above, we provide morphological observations of both strains to formally describe these new taxa.
Craspedostauros ineffabilis Trentin, Moschin, Lopes, Custódio & Moro sp. nov.
DIAGNOSIS: Cells elongate without central constrictions and slightly tapering to the apices. Length 31–58 µm, width 4–7.5 µm; transapical striae 25–36 in 10 µm. Areolae are quadrate rota of similar size with 4–7 pores. Two H-shaped plastids, one on each side of the valve center. Silica flaps absent. Stauros present across the central area. Helictoglossae terminate the internal central raphe fissures. Rectelevatum internal central raphe ending.
HOLOTYPE: Strain IMA082A fixed culture and permanent slide deposited in the Italian National Antarctic Museum (MNA, Section of Genoa) with the voucher code MNA-15098 and MNA-15099, respectively.
TYPE LOCALITY: Inexpressible Island (Penguin Lagoon, Terra Nova Bay, Ross Sea, Antarctica), coordinates: 74°54′ S 163°39′ E.
ETYMOLOGY: The epithet ‘ineffabilis’ derives from the Latin, which refers to the name of the Island, where this new species was collected.
REFERENCE DNA SEQUENCES: GenBank accession numbers OP354221 (18S rDNA), OP354493 (rbcL) and OP354495 (psbC).
COMMENTS: Craspedostauros ineffabilis shows morphological resemblance to C. laevissimus (West & G.S. West) K. Sabbe but differs in salt tolerance. C. ineffabilis might be conspecific with C. laevissimus (West & G.S. West) from lakes and pools in the Larsemann Hills, Rauer Islands and Bølingen Islands. However, their different salt tolerance supports the idea that their belong to separate species, following the ecological definition of species. To overcome this issue, the sequencing of C. laevissimus is required.
Craspedostauros zucchellii Trentin, Moschin, Lopes, Custódio & Moro sp. nov.
DIAGNOSIS: Cells elongate without central constrictions and slightly tapering to the apices. Length 14.5–24 µm, width 3–6 µm; transapical striae 22–31 in 10 µm. Areolae are quadrate rota of variable size, larger near the raphe and with more pores more pores in the cribrum. Two H-shaped plastids, one on each side of the valve center. Silica flaps absent. Stauros present across the central area. Helictoglossae terminate the internal central raphe fissures. Rectelevatum internal central raphe ending.
HOLOTYPE: Strain IMA088A fixed culture and permanent slide deposited in the Italian National Antarctic Museum (MNA, Section of Genoa) with the voucher code MNA-15100 and MNA-15101, respectively.
TYPE LOCALITY: Italian Research Base Mario Zucchelli Station; coordinates 74°41′39.06″ S 164°07′18.18″ E.
ETYMOLOGY: The epithet name ‘zucchellii’ is dedicated to Mario Zucchelli, an Italian engineer and researcher, president of the ENEA Consortium for Antarctica, who devoted himself to development of the Italian Research in Antarctica.
REFERENCE DNA SEQUENCES: GenBank accession numbers OP354222 (18S rDNA), OP354494 (rbcL) and OP354496 (psbC).
COMMENTS: Craspedostauros zucchellii differs from C. ineffabilis for dimensions (length and width) and for areola size.

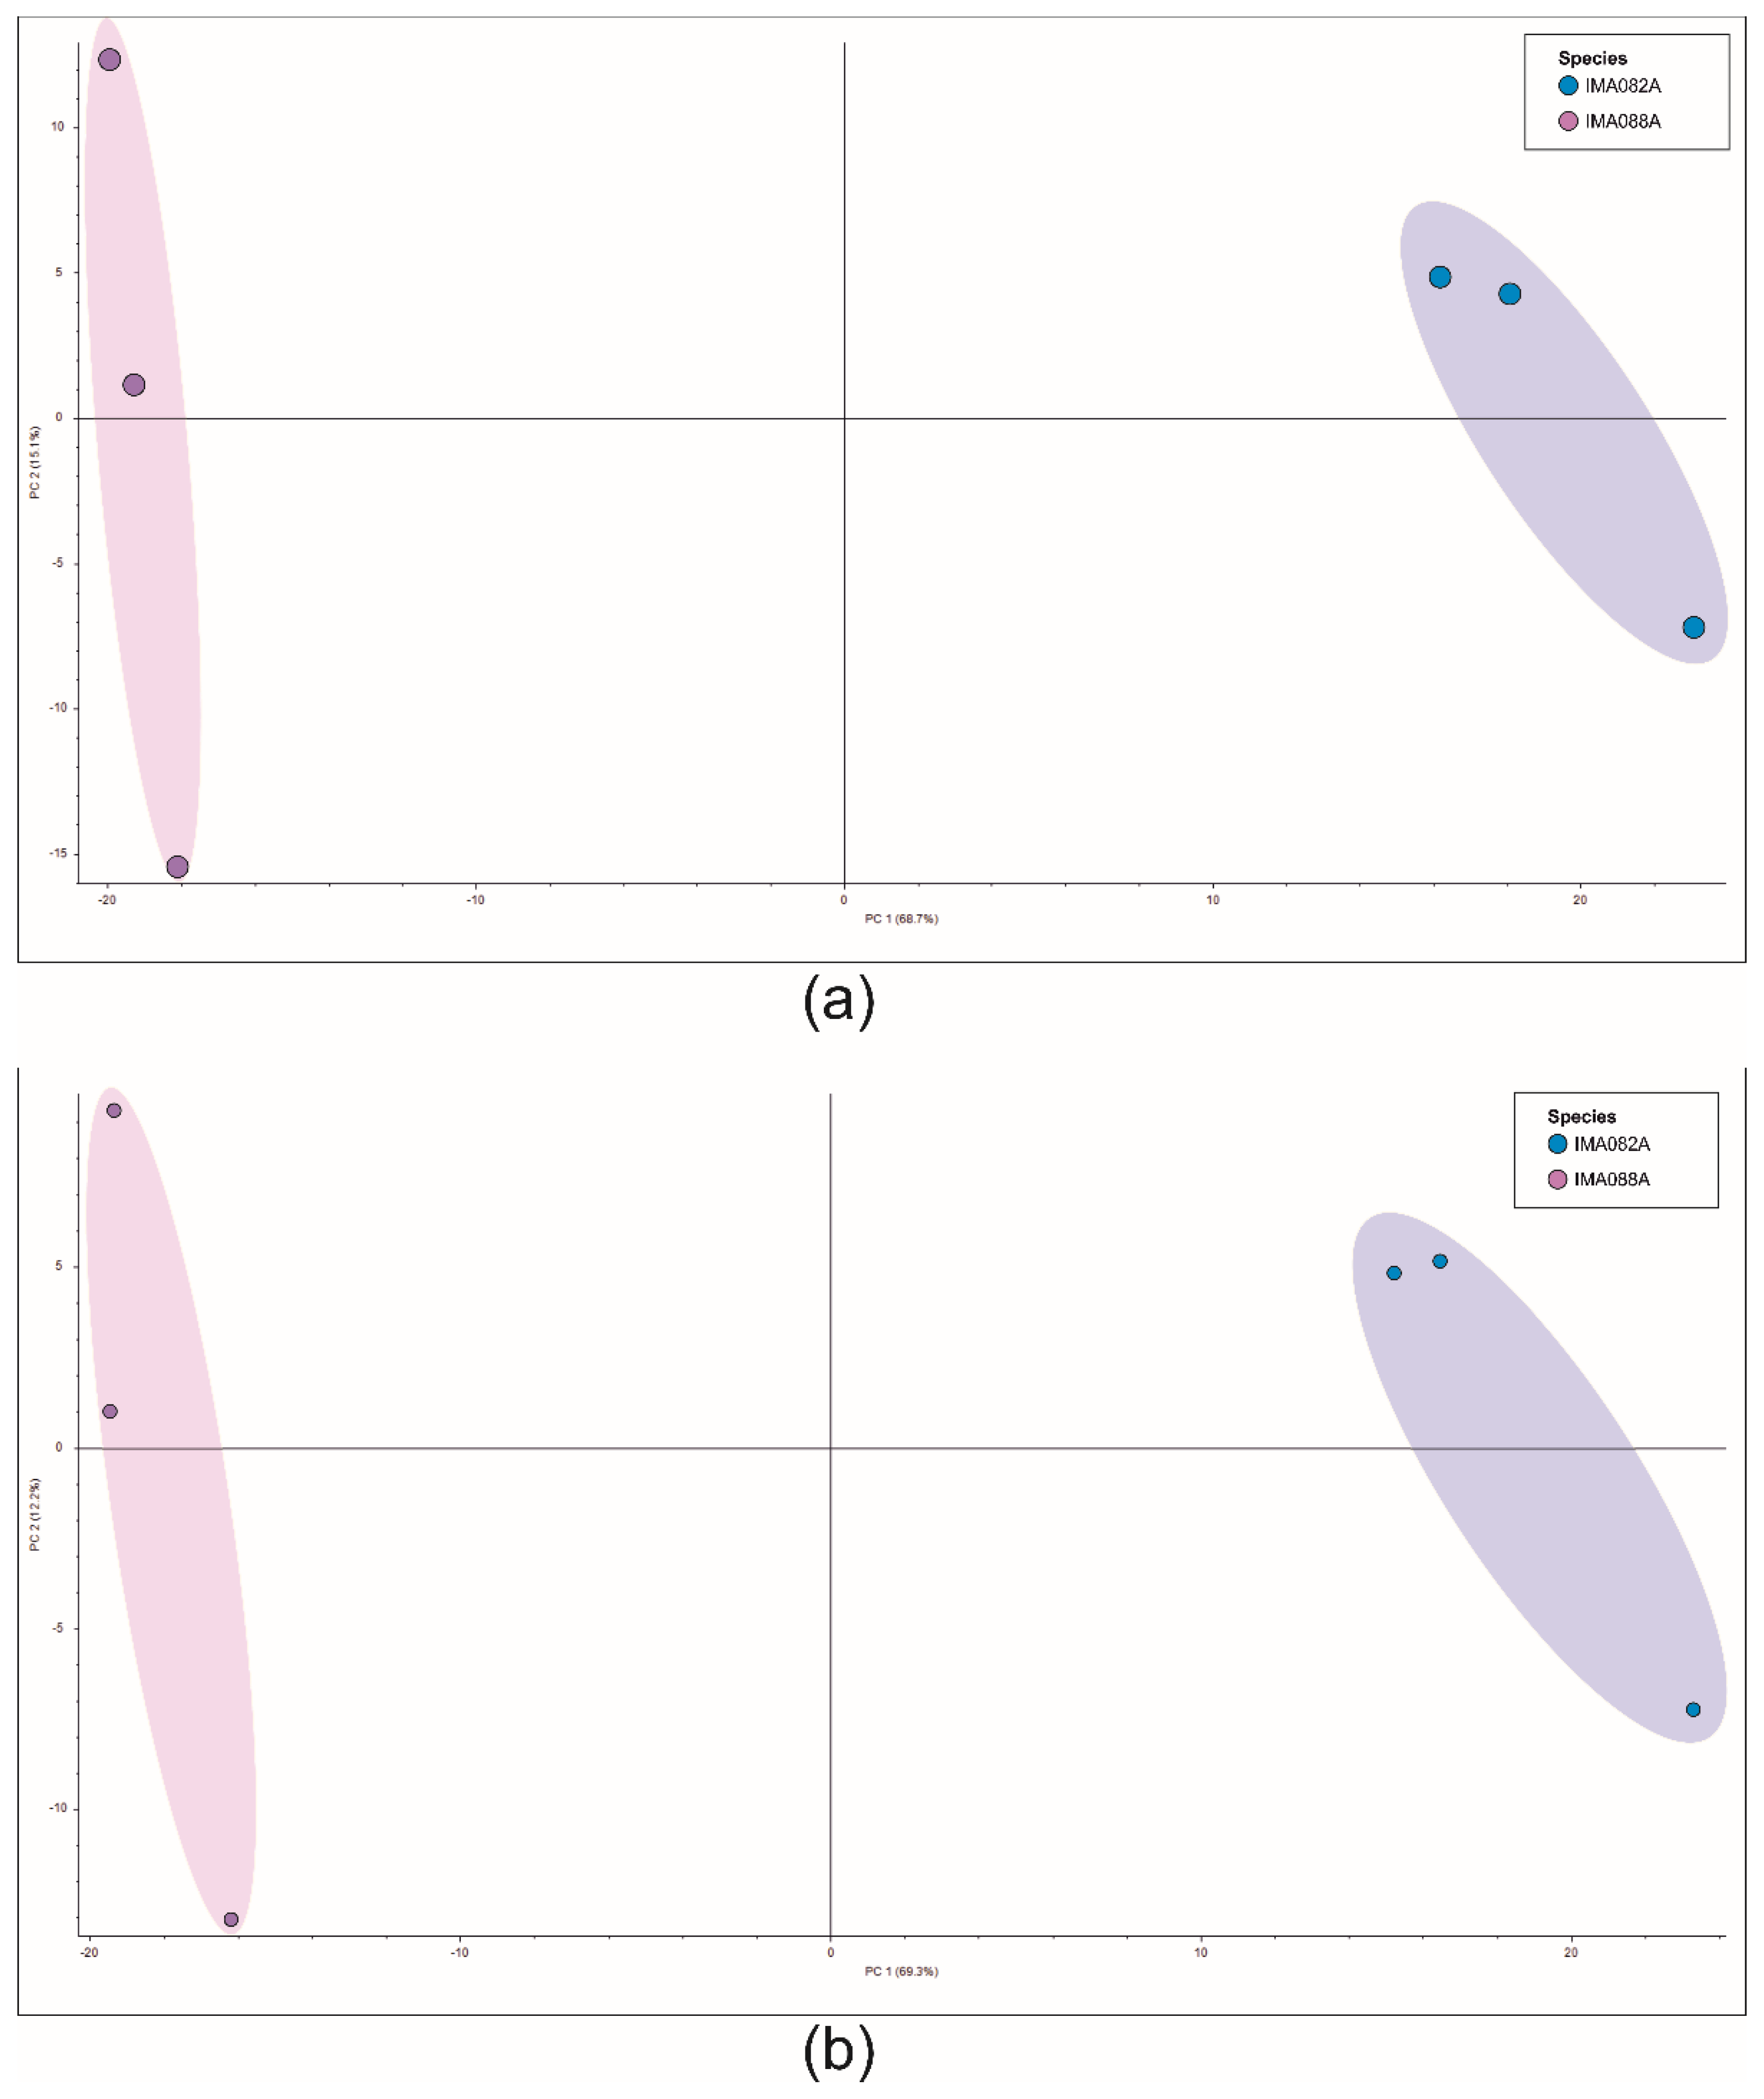
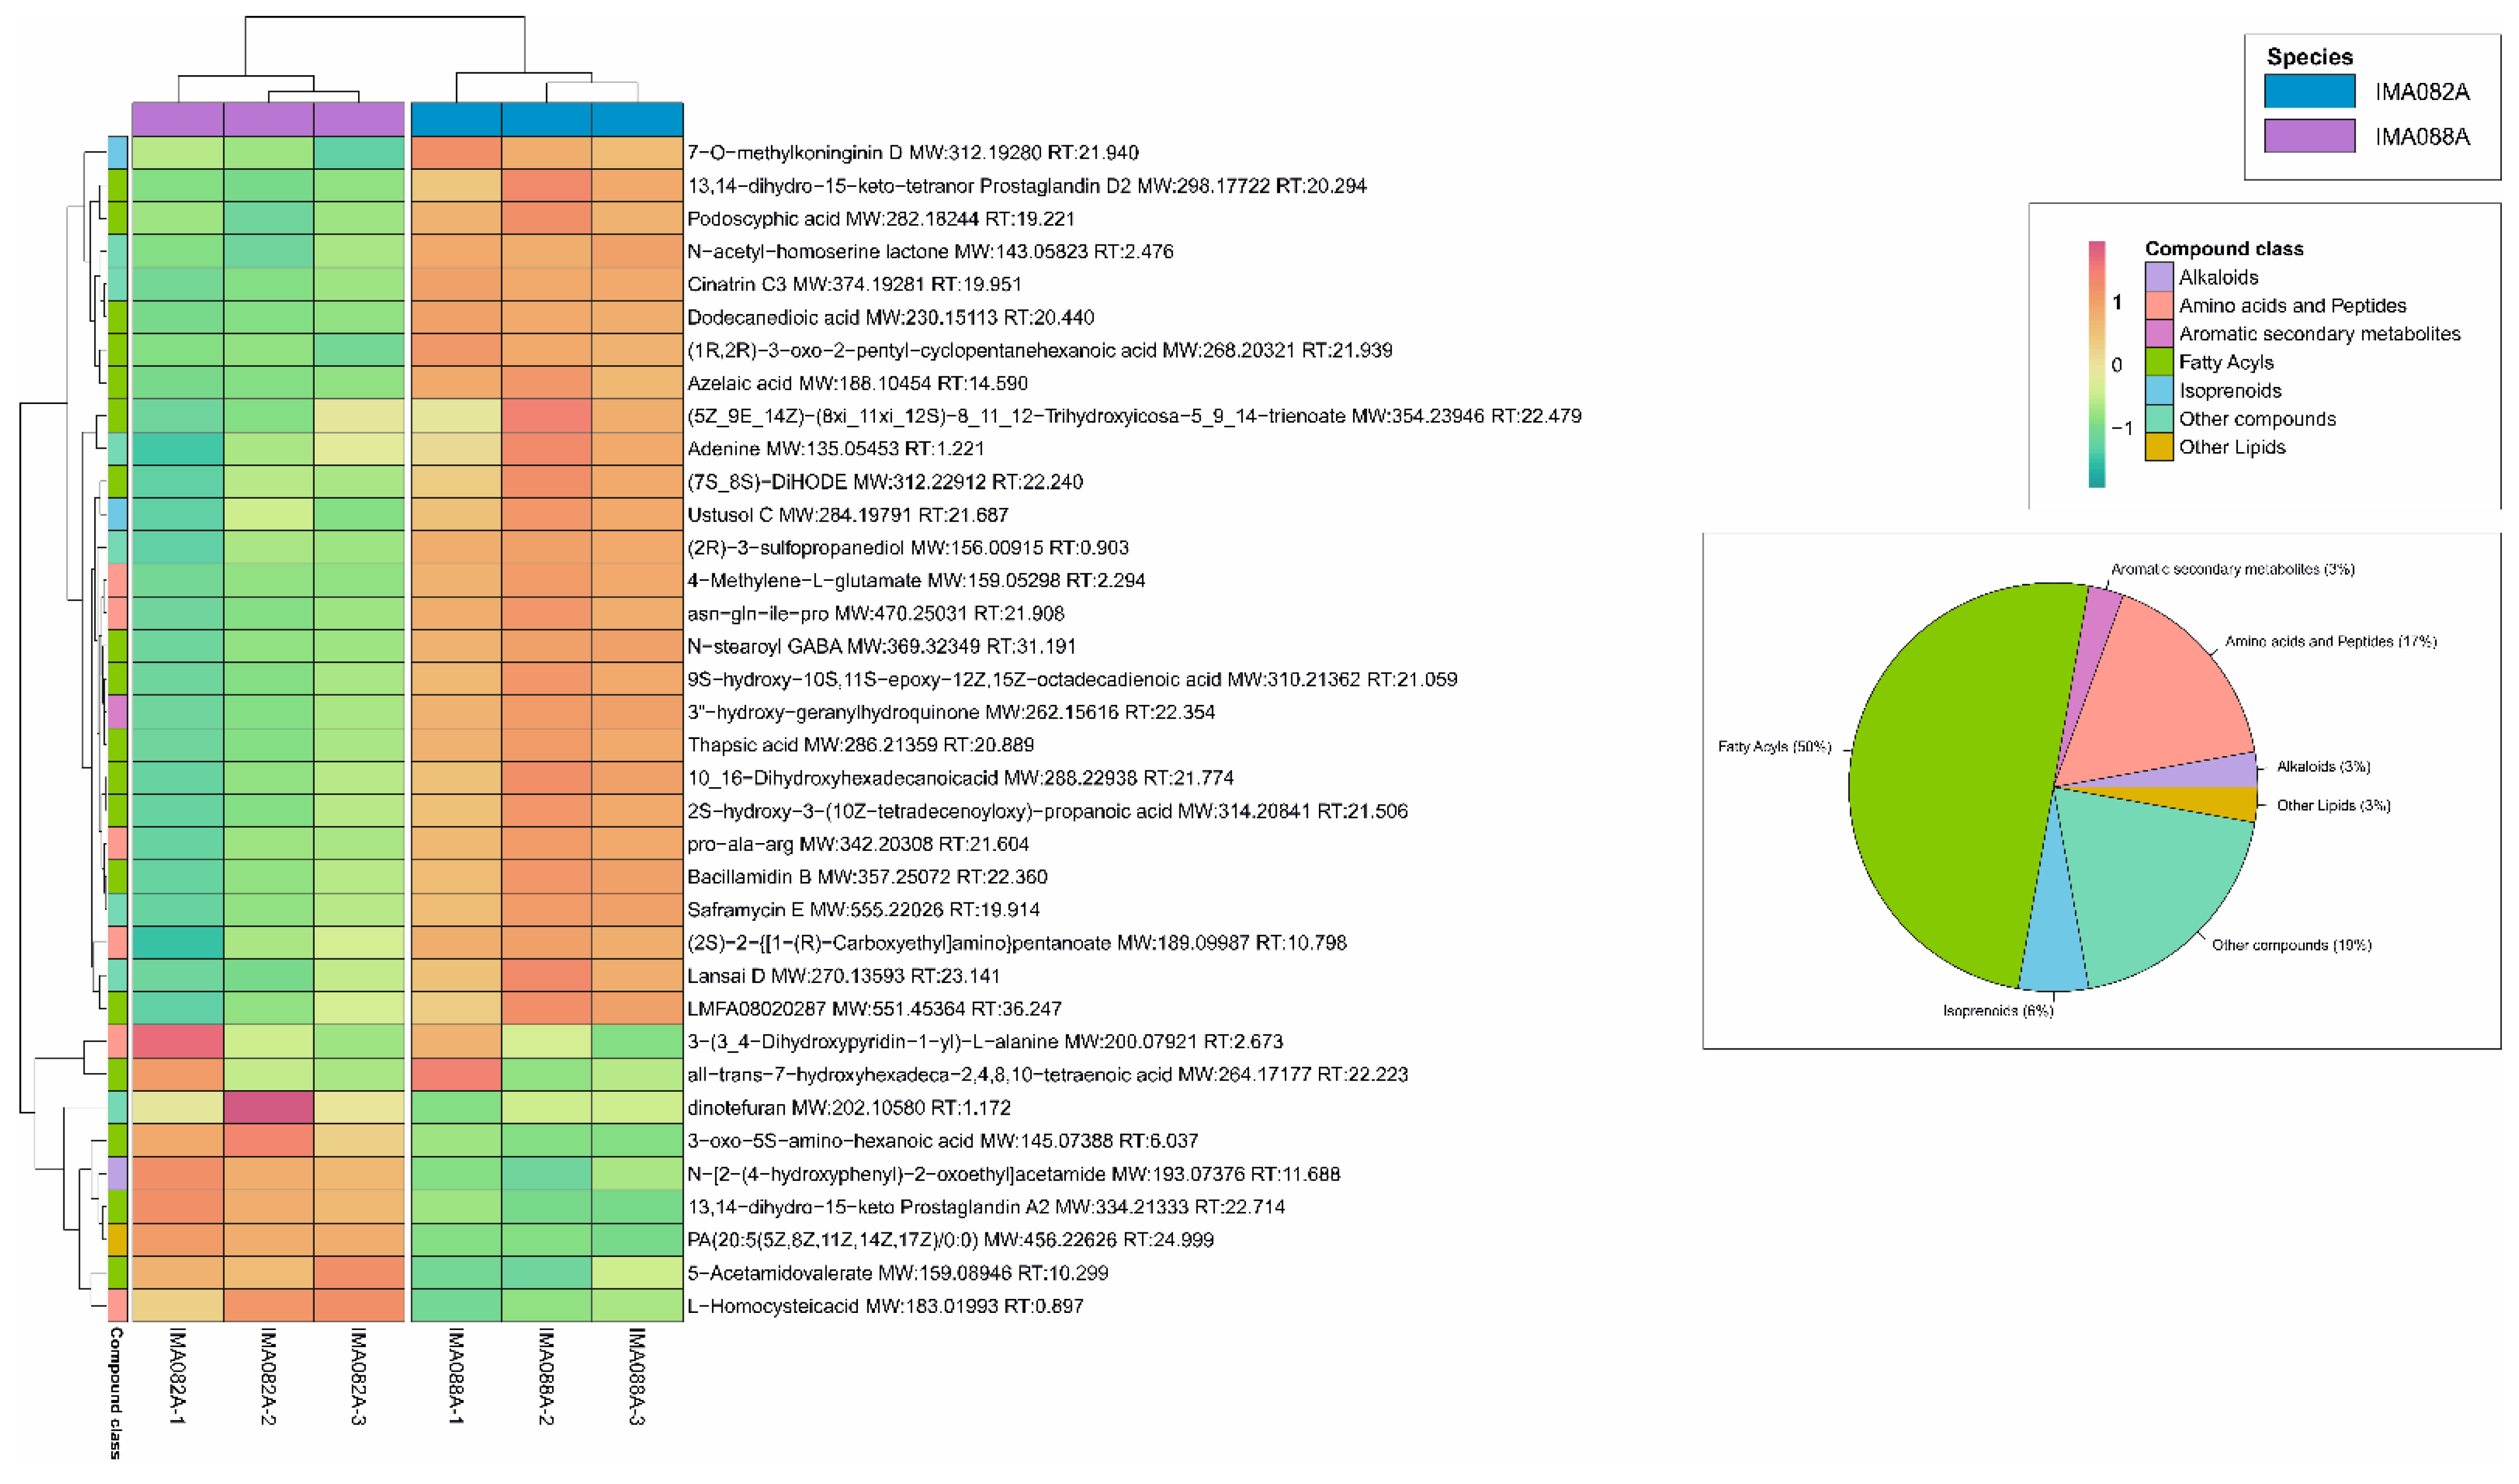
3.3. Liquid Chromatography-Mass Spectrometry (LC-MS)-Based Metabolomics Analysis

The untargeted UPLC-HR-MS/MS approach was used to explore the metabolite profiles of IMA082A and IMA088A extracts. Chromatograms from full scan measurements showed a high similarity between biological replicates, suggesting a high reproducibility and reduced biological variations between replicates (Figures S1 and S2). IMA082A and IMA088A extracts formed two distinct clusters, as shown in the principal components analysis (PCA) based on their metabolite profiles in both positive and negative ion modes (Figure 6a,b). The first component accounted for 68.7% and 69.3% of the variance among replicates, for positive and negative ion mode, respectively, while the second component accounted for 15.1% and 12.2% of the variance. This indicates a clear separation of metabolic signatures among the two strains of Antarctic diatoms. Among the 325 filtered features on the LC-HRMS metabolic fingerprints, 66 compounds in positive ion mode and 36 in negative ion mode presented a p-value lower than 0.005 among the two diatom species indicating significant differences of their metabolomic profiles (Figure 7 and Figure 8). The main group of biomarkers that distinguished IMA082A from IMA088A were fatty acyls (18% in positive and 50% in negative ion mode). Other biomarker families identified by the UPLC-HR-MS/MS approach were amino acids and peptides, aromatic secondary metabolites, isoprenoids, alkaloids and polyketides.

4. Discussion

4.1. Molecular Diversity

In the best concatenated 18S rDNA, rbcL and psbC gene phylogeny (Figure 2), the Craspedostauros clade consisted of eight separate taxa including: Craspedostauros alatus, C. alyoubii, C. amphoroides, C. danayanus, C. macewanii, C. paradoxus, C. ineffabilis and C. zucchellii. The members of the genus Craspedostauros, for which the molecular data were available, showed a widespread distribution and habitats. C. alatus, C. danayanus and C. macewanii were growing attached to numerous sea turtles and sea turtle-associated barnacles. C. alatus (HK448) was found on the carapaces of several loggerhead sea turtles sampled at the Marine Turtle Rescue Centre in Pula, Croatia, C. danayanus (HK637) was collected from the barnacle Platylepas coriacea growing on a leatherback sea turtle in Mabibi Beach, Elephant Coast, South Africa (27°21′30″ S, 32°44′20″ E), while three strains of C. macewanii (HK634, HK635, HK636) were isolated from the carapace of a captive juvenile loggerhead sea turtle in uShaka Sea World, Durban, South Africa (29°52′02.79″ S, 31°02′45.29″ E). C. amphoroides (HK447) was isolated from Herring Cove, Nova Scotia, Canada in the Atlantic Ocean, while C. alatus (HK448) and C. paradoxus (HK441) were isolated from the Pacific Ocean, respectively, in the Pacific Equatorial upwelling zone (−0.7475° N–−126.03° W) and in Gab Gab Beach, Guam, USA. C. alyoubii (UTKSA0083) was collected in Duba, Saudi Arabia, from the Red Sea. C. ineffabilis (IMA082A) and C. zucchellii (IMA088A) were the only Antarctic species for which DNA sequences were available on online databases. They were collected, respectively, from Inexpressible Island and near the Italian Research Mario Zucchelli Station (Terra Nova Bay).
No molecular data were available for the other Craspedostauros species from the southern hemisphere, such as C. laevissimus (West & G.S. West) K. Sabbe and as C. indubitabilis (Lange-Bertalot & S.I. Genkal) E.J. Cox, and for the other taxonomically accepted species, namely C. britannicus E.J. Cox, C. capensis E.J. Cox, C. decipiens (Hustedt) E.J. Cox, C. legouvelloanus Majewska & Bosak. Only transcriptomic data were available for C. australis E.J. Cox. For this reason, we did not include all the known Craspedostuaros species in the phylogenetic analysis.
Implementing the dataset of Ashworth et al. 2017 [6] with the 18S rDNA, rbcL and psbC sequences of C. alatus, C. danayanus, C. macewanii, C. ineffabilis IMA082A and C. zucchellii IMA088A, the molecular data strongly supported the monophyly for the genus Craspedostauros (98% SH-aLRT value, 1 posterior probability, 100% bootstrap). This agreed with the DNA-based phylogenies constructed by Ashworth et al. 2017 and Majewska et al. 2021 [6,8]. In our phylogenetic reconstruction, the Antarctic strains (IMA082A and IMA088A) grouped with C. amphoroides CCMP797 and formed a well-supported clade (100% SH-aLRT value, 1 posterior probability, 100% bootstrap); however, IMA082A and IMA088A formed two distinct branches, supporting the hypothesis that the Antarctic strains constituted two new species, here described as Craspedostauros ineffabilis sp. nov. and Craspedostauros zucchellii sp. nov.
Furthermore, we tested different tree topologies to evaluate alternative hypotheses of the evolution of the order Mastogloiales and quadrate rotae taxa. A tree constrained to monophyly Craspedostauros and Achnanthes species was not significantly different from our best unconstrained tree. However, the tree constraining all Mastogloiales (Craspedostauros, Achnanthes and Mastogloia) to monophyly was statistically significantly worse than the best tree, as was the tree constraining quadrate rotae taxa (Craspedostaurus, Achnanthes, Staurotropis and Mastogloia). These results were consistent with those reported by Ashworth et al. 2017 [6] suggesting that a revision of the order Mastogloiales based on a combination of molecular and morphological data is required.

4.2. Morphological Diversity

Strains IMA082A and IMA088A displayed all the distinguishing characteristics of the genus Craspedostauros, namely cribrate areolae, a central fascia wider than the associated stauros, numerous girdle bands and two H-shaped chloroplasts located “fore-and-aft” of the central area [6,7]. IMA082A resembled C. indubitabilis material from Arctic Ocean for the similar valve outline, the dimensions and the stria density [50] and to C. indubitabilis material described by Cox (1988) [51] for the similar valve outline, width, stria density, areola size and average number of areolae pores. However, as some details for morphological identification are missing in these studies, it is difficult to establish the true identity of C. indubitabilis [46]. IMA088A resembled to C. indubitabilis collected from Chile by Rivera et al. 2011 [53] for the similar valve outline, dimensions, stria density, areola size and average number of areolae pores. Sabbe et al. 2003 argued about the conspecificy of C. indubitabilis with C. laevissimus [46]. This Antarctic endemic diatom was originally described from the McMurdo Dry Valleys region by West & West 1911 [49] and subsequently reported from other localities in Antarctica [44,45,51,52]. However, C. laevissimus is the only truly brackish water Craspedostauros species (optimally salinity range of 10–15‰) and does not tolerate freshwater or marine conditions [46,54], in accordance with its occurrence in the Larsemann Hills (one single brackish lake) and Rauer Islands [55]. Watanuki 1979 [54] tested the salt tolerance of C. laevissimus isolated from two saline lakes in the Sôya coast (east Antarctica) and reported that C. laevissimus isolated from Akebi Lake grew very slowly at a salinity of 25‰, while the growth of C. laevissimus from Suribati Lake was inhibited at a salinity of 25‰. Thus, in accordance with this ecological aspect, we can exclude that C. ineffabilis IMA082A and C. zucchellii IMA088A are conspecific with C. laevissimus. Despite the common occurrence of Craspedostauros-like diatoms in Antarctic and sub-Antarctic regions, morphological details required to the identification at species level are scarce. Furthermore, materials described as C. laevissimus and as C. indubitabilis collected in different localities did not display remarkable morphological differences (Table 2). These variations in shapes and features within these two species could be due to phenotypic plasticity [56]. Principal component analysis results highlighted that Craspedostauros species have similar cell morphologies and ecological characteristics, indicating that morpho-ecological characters alone do not allow a clear separation among species within this genus. In this sense, limiting the identification of this group of diatoms to solely morphological observations could lead to the underestimation of the diversity of these photosynthetic organisms. For these reasons we mainly relied on the use of molecular data for the taxonomic identification of the Antarctic isolates IMA082A and IMA088A. In this study, C. laevissimus and C. ineffabilis were distinguished as different species according to their ecology. However, the future sequencing of C. laevissimus from Antarctic brackish lakes may highlight its conspecificity with C. ineffabilis. This possibility appears as very improbable according to the difference in their ecology, especially their salt tolerance. Alternatively, C. laevissimus might represent the transition state from fresh/brackish water to marine environment, or viceversa.

4.3. Chemical Diversity

In IM082A and IMA088A, fatty acyls constituted the main biomarker’s family, followed by amino acids and peptides, aromatic secondary metabolites, isoprenoids, alkaloids and polyketides. Particularly, fatty acids and isoprenoids are well-known chemotaxonomic markers commonly used to distinguish different algal classes [57,58], while little is known regarding the possible use of other metabolites as biomarkers at any taxonomic level. These results are consistent with the findings of Marcellin-Gros et al. 2020 [12], which reported polar lipids and pigments as the most abundant and diversified metabolites identified over 12 strains of microalgae. This might be a consequence of the increase in the number of studies concerning the analysis of algal lipidomes [12].
Although a large part of the metabolic fingerprints is almost identical between IMA082A and IMA088A, our results underlined the existence of chemical differences at species level (Figure 6, Figure 7 and Figure 8). These biomarkers might be used in the phylogenetic context, together with the traditional morphological observations and molecular data, for the identification organisms of undetermined taxonomy. In this sense, metabolomic analysis could be introduced in the future as a novel method to characterize photosynthetic organism as a further step in an integrated polyphasic approach.

5. Conclusions

The present work upholds the importance of an integrative approaches combining morphological, molecular and chemical data in the recognition of new species. This could overcome the weaknesses of traditional taxonomy based solely on morphological features, which is particularly critical in lineages including numerous cryptic taxa, providing accurate and comparable data. Our results on two Antarctic strains of Craspedostauros demonstrate that the integrative approach can be a valuable method to discriminate between species and classify samples within the same genus. Interspecific metabolic variability seems to be strongly determined by the genetic heritage characterizing each species [59]. In this sense, our results clearly showed that IMA082A and IMA088A represented two taxonomic taxa, based on both their metabolic fingerprints and phylogenetic analysis.
The emerging field of metabolomics appears to be an interesting tool to highlight differences between the similar species of microalgae. These data could provide new insights in the understanding of the evolutionary relationships among diatoms, and more especially among the genus Craspedostauros.

Supplementary Materials

The following supporting information can be downloaded at: https://www.mdpi.com/article/10.3390/jmse10111656/s1, Figure S1: LC-MS chromatograms of IMA082A (a) and IMA088A (b) extracts and replicates in positive ionization mode. Three independent, biological replicates were analyzed per strain. Figure S2: LC-MS chromatograms of IMA082A (a) and IMA088A (b) extracts and replicates in negative ionization mode. Three independent, biological replicates were analyzed per strain. Table S1: Voucher identity and GenBank accession numbers for the taxa used in DNA dataset. GenBank accession numbers listed in order: 18S rDNA, rbcL and psbC. Table S2: “Cleaned-up” feature lists of features of IMA082A and IMA088A extracts in positive ionization mode. Table S3: “Cleaned-up” feature lists of features of IMA082A and IMA088A extracts in negative ionization mode.

Author Contributions

Conceptualization, R.T., L.C. and I.M.; methodology, L.C., E.M. and A.D.L.; formal analysis, R.T. and L.C.; investigation, R.T. and E.M.; data curation, R.T.; writing—original draft preparation, R.T.; writing—review and editing, E.M., A.D.L., L.C., S.S. and I.M.; supervision, L.C. and I.M.; project administration, L.C., I.M. and S.S.; funding acquisition, L.C., I.M. and S.S. All authors have read and agreed to the published version of the manuscript.

Funding

This research was funded by the PNRA project PNRA 16 00120—TNB-code: ‘Terra Nova Bay barcoding and metabarcoding of Antarctic organisms from marine and limno-terrestrial environments’ (PI: S. Schiaparelli). Funding was also provided by Foundation for Science and Technology (FCT), and the Portuguese National Budget funding (UIDB/04326/2020). LC was sustained by FCT Scientific Employment Stimulus (CEECIND/00425/2017).

Institutional Review Board Statement

Not applicable.

Informed Consent Statement

Not applicable.

Data Availability Statement

The nucleotide sequences were deposited into the NCBI GenBank database under the accession numbers: OP354221, OP354493 and OP354495 (18S rDNA, rbcL and psbC) for IMA082A and OP354222, OP354494 and OP354496 (18S rDNA, rbcL and psbC) for IMA088A.

Acknowledgments

We wish to thank Federico Zorzi (CEASC, Center for Analyses and Certification Services, University of Padova) for his assistance with the SEM-EDS analysis and José Paulo da Silva (CCMAR, Centre of Marine Sciences, University of Algarve) for his assistance with the UPLC-HR-MS/MS metabolomics.

Conflicts of Interest

The authors declare no conflict of interest.

References

  1. Huseby, S.; Degerlund, M.; Zingone, A.; Hansen, E. Metabolic fingerprinting reveals differences between northern and southern strains of the cryptic diatom Chaetoceros socialis. Eur. J. Phycol. 2012, 47, 480–489. [Google Scholar] [CrossRef]
  2. Kooistra, W.H.C.F.; De Stefano, M.; Mann, D.G.; Medlin, K. The Phylogeny of the Diatoms. In Silicon Biomineralization; Springer: Berlin/Heidelberg, Germany, 2003; pp. 59–97. [Google Scholar] [CrossRef]
  3. Hughes, A.H.; Magot, F.; Tawfike, A.F.; Rad-Menéndez, C.; Thomas, N.; Young, L.C.; Stucchi, L.; Carettoni, D.; Stanley, M.S.; Edrada-Ebel, R.; et al. Exploring the Chemical Space of Macro- and Micro-Algae Using Comparative Metabolomics. Microorganisms 2021, 9, 311. [Google Scholar] [CrossRef] [PubMed]
  4. Sciuto, K.; Moschin, E.; Alongi, G.; Cecchetto, M.; Schiaparelli, S.; Caragnano, A.; Rindi, F.; Moro, I. Tethysphytum antarcticum gen. et sp. nov. (Hapalidiales, Rhodophyta), a new non-geniculate coralline alga from Terra Nova Bay (Ross Sea, Antarctica): Morpho-anatomical characterization and molecular phylogeny. Eur. J. Phycol. 2021, 56, 416–427. [Google Scholar] [CrossRef]
  5. Trentin, R.; Negrisolo, E.; Moschin, E.; Veronese, D.; Cecchetto, M.; Moro, I. Microglena antarctica sp. nov. a New Antarctic Green Alga from Inexpressible Island (Terra Nova Bay, Ross Sea) Revealed through an Integrative Approach. Diversity 2022, 14, 337. [Google Scholar] [CrossRef]
  6. Ashworth, M.P.; Theriot, E.C.; Jansen, R.K.; Lobban, C.S.; Witkowski, A.; Sabir, M.J.; Hajarah, N.H.; Sabir, J.S.; Jansen, R.K.; Baeshen, M.N.; et al. Molecular and Morphological Investigations of the Stauros-bearing, Raphid Pennate Diatoms (Bacillariophyceae): Craspedostauros E.J. Cox, and Staurotropis T.B.B. Paddock, and their Relationship to the Rest of the Mastogloiales. Protist 2017, 168, 48–70. [Google Scholar] [CrossRef]
  7. Cox, E.J. Craspedostauros gen. nov., a new diatom genus for some unusual marine raphid species previously placed in Stauroneis Ehrenberg and Stauronella Mereschkowsky. Eur. J. Phycol. 1999, 34, 131–147. [Google Scholar] [CrossRef]
  8. Majewska, R.; Ashworth, M.P.; Bosak, S.; Goosen, W.E.; Nolte, C.; Filek, K.; Van de Vijver, B.; Taylor, J.C.; Manning, S.R.; Nel, R. On Sea Turtle-associated Craspedostauros (Bacillariophyta), with Description of Three Novel Species. J. Phycol. 2021, 57, 199–218. [Google Scholar] [CrossRef]
  9. Cox, E.; Williams, D. Systematics of naviculoid diatoms: The interrelationships of some taxa with a stauros. Eur. J. Phycol. 2000, 35, 273–282. [Google Scholar] [CrossRef]
  10. Smedsgaard, J.; Nielsen, J. Metabolite profiling of fungi and yeast: From phenotype to metabolome by MS and informatics. J. Exp. Bot. 2005, 56, 273–286. [Google Scholar] [CrossRef]
  11. Frisvad, J.C.; Andersen, B.; Thrane, U. The use of secondary metabolite profiling in chemotaxonomy of filamentous fungi. Mycol. Res. 2008, 112, 231–240. [Google Scholar] [CrossRef]
  12. Marcellin-Gros, R.; Piganeau, G.; Stien, D. Metabolomic Insights into Marine Phytoplankton Diversity. Mar. Drugs 2020, 18, 78. [Google Scholar] [CrossRef] [PubMed] [Green Version]
  13. Silva, S.G.; Paula, P.; da Silva, J.P.; Mil-Homens, D.; Teixeira, M.C.; Fialho, A.M.; Costa, R.; Keller-Costa, T. Insights into the Antimicrobial Activities and Metabolomes of Aquimarina (Flavobacteriaceae, Bacteroidetes) Species from the Rare Marine Biosphere. Mar. Drugs 2022, 20, 423. [Google Scholar] [CrossRef] [PubMed]
  14. Guillard, R.R.L. Culture of Phytoplankton for Feeding Marine Invertebrates. In Culture of Marine Invertebrate Animals; Springer: Boston, MA, USA, 1975; pp. 29–60. [Google Scholar] [CrossRef]
  15. Dawson, S.C.; Pace, N.R. Novel kingdom-level eukaryotic diversity in anoxic environments. Proc. Natl. Acad. Sci. USA 2002, 99, 8324–8329. [Google Scholar] [CrossRef] [PubMed] [Green Version]
  16. Giovannoni, S.J.; DeLong, E.F.; Olsen, G.J.; Pace, N.R. Phylogenetic group-specific oligodeoxynucleotide probes for identification of single microbial cells. J. Bacteriol. 1988, 170, 720–726. [Google Scholar] [CrossRef] [PubMed] [Green Version]
  17. Edgcomb, V.P.; Kysela, D.T.; Teske, A.; de Vera Gomez, A.; Sogin, M.L. Benthic eukaryotic diversity in the Guaymas Basin hydrothermal vent environment. Proc. Natl. Acad. Sci. USA 2002, 99, 7658–7662. [Google Scholar] [CrossRef] [PubMed] [Green Version]
  18. Medlin, L.; Elwood, H.J.; Stickel, S.; Sogin, M.L. The characterization of enzymatically amplified eukaryotic 16S-like rRNA-coding regions. Gene 1988, 71, 491–499. [Google Scholar] [CrossRef] [Green Version]
  19. Stoeck, T.; Schwarz, M.V.J.; Boenigk, J.; Schweikert, M.; von der Heyden, S.; Behnke, A. Cellular identity of an 18S rRNA gene sequence clade within the class Kinetoplastea: The novel genus Actuariola gen. nov. (Neobodonida) with description of the type species Actuariola framvarensis sp. nov. Int. J. Syst. Evol. Microbiol. 2005, 55, 2623–2635. [Google Scholar] [CrossRef]
  20. Hugerth, L.W.; Muller, E.E.L.; Hu, Y.O.O.; Lebrun, L.A.M.; Roume, H.; Lundin, D.; Wilmes, P.; Andersson, A.F. Systematic Design of 18S rRNA Gene Primers for Determining Eukaryotic Diversity in Microbial Consortia. PLoS ONE 2014, 9, e95567. [Google Scholar] [CrossRef]
  21. Alverson, A.J.; Jansen, R.K.; Theriot, E.C. Bridging the Rubicon: Phylogenetic analysis reveals repeated colonizations of marine and fresh waters by thalassiosiroid diatoms. Mol. Phylogenet. Evol. 2007, 45, 193–210. [Google Scholar] [CrossRef]
  22. Altschul, S.F.; Gish, W.; Miller, W.; Myers, E.W.; Lipman, D.J. Basic local alignment search tool. J. Mol. Biol. 1990, 215, 403–410. [Google Scholar] [CrossRef]
  23. Benson, D.A.; Cavanaugh, M.; Clark, K.; Karsch-Mizrachi, I.; Lipman, D.J.; Ostell, J.; Sayers, E.W. GenBank. Nucleic Acids Res. 2013, 41, D67–D72. [Google Scholar] [CrossRef] [Green Version]
  24. Nawrocki, E.P.; Kolbe, D.L.; Eddy, S.R. Infernal 1.0: Inference of RNA alignments. Bioinformatics 2009, 25, 1335–1337. [Google Scholar] [CrossRef] [PubMed] [Green Version]
  25. Thompson, J.D.; Higgins, D.G.; Gibson, T.J. CLUSTAL W: Improving the sensitivity of progressive multiple sequence alignment through sequence weighting, position-specific gap penalties and weight matrix choice. Nucleic Acids Res. 1994, 22, 4673–4680. [Google Scholar] [CrossRef] [PubMed] [Green Version]
  26. Kumar, S.; Stecher, G.; Li, M.; Knyaz, C.; Tamura, K. MEGA-X: Molecular Evolutionary Genetics Analysis across Computing Platforms. Mol. Biol. Evol. 2018, 35, 1547. [Google Scholar] [CrossRef]
  27. Nguyen, L.-T.; Schmidt, H.A.; von Haeseler, A.; Minh, B.Q. IQ-TREE: A Fast and Effective Stochastic Algorithm for Estimating Maximum-Likelihood Phylogenies. Mol. Biol. Evol. 2015, 32, 268–274. [Google Scholar] [CrossRef]
  28. Kalyaanamoorthy, S.; Minh, B.Q.; Wong, T.K.F.; Von Haeseler, A.; Jermiin, L.S. ModelFinder: Fast model selection for accurate phylogenetic estimates. Nat. Methods 2017, 14, 587–589. [Google Scholar] [CrossRef] [Green Version]
  29. Anisimova, M.; Gascuel, O. Approximate Likelihood-Ratio Test for Branches: A Fast, Accurate, and Powerful Alternative. Syst. Biol. 2006, 55, 539–552. [Google Scholar] [CrossRef]
  30. Ronquist, F.; Huelsenbeck, J.P. MrBayes 3: Bayesian phylogenetic inference under mixed models. Bioinformatics 2003, 19, 1572–1574. [Google Scholar] [CrossRef]
  31. Drummond, A.J.; Suchard, M.A.; Xie, D.; Rambaut, A. Bayesian Phylogenetics with BEAUti and the BEAST 1.7. Mol. Biol. Evol. 2012, 29, 1969–1973. [Google Scholar] [CrossRef] [Green Version]
  32. Kishino, H.; Miyata, T.; Hasegawa, M. Maximum likelihood inference of protein phylogeny and the origin of chloroplasts. J. Mol. Evol. 1990, 31, 151–160. [Google Scholar] [CrossRef]
  33. Kishino, H.; Hasegawa, M. Evaluation of the maximum likelihood estimate of the evolutionary tree topologies from DNA sequence data, and the branching order in hominoidea. J. Mol. Evol. 1989, 29, 170–179. [Google Scholar] [CrossRef] [PubMed]
  34. Shimodaira, H.; Hasegawa, M. Multiple Comparisons of Log-Likelihoods with Applications to Phylogenetic Inference. Mol. Biol. Evol. 1999, 16, 1114–1116. [Google Scholar] [CrossRef] [Green Version]
  35. Strimmer, K.; Rambaut, A. Inferring confidence sets of possibly misspecified gene trees. Proc. R. Soc. Lond. Ser. B Biol. Sci. 2002, 269, 137–142. [Google Scholar] [CrossRef] [PubMed]
  36. Shimodaira, H. An Approximately Unbiased Test of Phylogenetic Tree Selection. Syst. Biol. 2002, 51, 492–508. [Google Scholar] [CrossRef] [PubMed] [Green Version]
  37. Van Santen, J.A.; Poynton, E.F.; Iskakova, D.; Mcmann, E.; Alsup, T.A.; Clark, T.N.; Fergusson, C.H.; Fewer, D.P.; Hughes, A.H.; Mccadden, C.A.; et al. The Natural Products Atlas 2.0: A database of microbially-derived natural products. Nucleic Acids Res. 2022, 50, D1317–D1323. [Google Scholar] [CrossRef]
  38. Sud, M.; Fahy, E.; Cotter, D.; Brown, A.; Dennis, E.A.; Glass, C.K.; Merrill, A.H.; Murphy, R.C.; Raetz, C.R.H.; Russell, D.W.; et al. LMSD: LIPID MAPS structure database. Nucleic Acids Res. 2007, 35, D527–D532. [Google Scholar] [CrossRef] [Green Version]
  39. Kanehisa, M.; Goto, S. KEGG: Kyoto Encyclopedia of Genes and Genomes. Nucleic Acids Res. 2000, 28, 27–30. [Google Scholar] [CrossRef]
  40. Wishart, D.S.; Feunang, Y.D.; Guo, A.C.; Lo, E.J.; Marcu, A.; Grant, J.R.; Sajed, T.; Johnson, D.; Li, C.; Sayeeda, Z.; et al. DrugBank 5.0: A major update to the DrugBank database for 2018. Nucleic Acids Res. 2018, 46, D1074–D1082. [Google Scholar] [CrossRef]
  41. Yabuzaki, J. Carotenoids Database: Structures, chemical fingerprints and distribution among organisms. Database 2017, 2017, bax004. [Google Scholar] [CrossRef] [Green Version]
  42. Wishart, D.S.; Jewison, T.; Guo, A.C.; Wilson, M.; Knox, C.; Liu, Y.; Djoumbou, Y.; Mandal, R.; Aziat, F.; Dong, E.; et al. HMDB 3.0—The Human Metabolome Database in 2013. Nucleic Acids Res. 2013, 41, D801–D807. [Google Scholar] [CrossRef]
  43. Neveu, V.; Perez-Jiménez, J.; Vos, F.; Crespy, V.; du Chaffaut, L.; Mennen, L.; Knox, C.; Eisner, R.; Cruz, J.; Wishart, D.; et al. Phenol-Explorer: An online comprehensive database on polyphenol contents in foods. Database 2010, 2010, bap024. [Google Scholar] [CrossRef] [PubMed]
  44. Caspi, R.; Altman, T.; Billington, R.; Dreher, K.; Foerster, H.; Fulcher, C.A.; Holland, T.A.; Keseler, I.M.; Kothari, A.; Kubo, A.; et al. The MetaCyc database of metabolic pathways and enzymes and the BioCyc collection of Pathway/Genome Databases. Nucleic Acids Res. 2014, 42, D459–D471. [Google Scholar] [CrossRef] [Green Version]
  45. Majewska, R.; Ashworth, M.P.; Lazo-Wasem, E.; Robinson, N.J.; Rojas, L.; Van de Vijver, B.; Pinou, T. Craspedostauros alatus sp. nov., a new diatom (Bacillariophyta) species found on museum sea turtle specimens. Diatom Res. 2018, 33, 229–240. [Google Scholar] [CrossRef]
  46. Sabbe, K.; Verleyen, E.; Hodgson, D.A.; Vanhoutte, K.; Vyverman, W. Benthic diatom flora of freshwater and saline lakes in the Larsemann Hills and Rauer Islands, East Antarctica. Antarct. Sci. 2003, 15, 227–248. [Google Scholar] [CrossRef] [Green Version]
  47. Fukushima, H. Diatoms from the Shin-Nan Rock Ice-Free Area, Prince Olav Coast, the Antarctic Continent. Antarct. Rec. 1962, 14, 80–91. [Google Scholar]
  48. Kobayashi, T. Variations on Some Pennate Diatoms from Antarctica. Japanese Antarctic Research Expedition 19561962. Sci. Rep. Ser. E Biol. 1963, 18, 20. [Google Scholar]
  49. West, W.; West, G.S. Freshwater Algae. In British Antarctic Expedition 1907-9, under the Command of Sir; Part VII; Shackleton, E.H., Ed.; Forgotten Books: London, UK, 1911; Volume 1, pp. 263–298. [Google Scholar]
  50. Lange-Bertalot, H. Diatomeen aus Sibirien I. Inseln im Arktischen Osean (Yugorsky-Shar Strait). Iconogr. Diatomol. 1999, 6, 1–271. [Google Scholar]
  51. Cox, E.J. Taxonomic studies on the diatom genus Navicula V. The establishment of Parlibellus ge. nov. for some members of Navicula sect. Microstigmaticae. Diatom Res. 1988, 3, 9–38. [Google Scholar] [CrossRef]
  52. Abou-Shanab, R.A.I.; Hwang, J.H.; Cho, Y.; Min, B.; Jeon, B.H. Characterization of microalgal species isolated from fresh water bodies as a potential source for biodiesel production. Appl. Energy 2011, 88, 3300–3306. [Google Scholar] [CrossRef]
  53. Rivera, P.; Cruces, F.; Ector, L. Comentarios y observaciones acerca de la diatomea Craspedostauros indubitabilis (Lange-Bertalot & Genkal) E.J. Cox encontrada por primera vez en aguas marinas costeras de Chile. Gayana. Botánica 2011, 68, 123–128. [Google Scholar] [CrossRef] [Green Version]
  54. Watanuki, T. Isolation and culture of Antarctic diatoms from the saline lakes in the Soya Coast, East Antarctica. Mem. Natl. Inst. Polar Res. 1979, 11, 35–41. [Google Scholar]
  55. Hodgson, D.A.; Noon, P.E.; Vyverman, W.; Bryant, C.L.; Gore, D.B.; Appleby, P.; Gilmour, M.; Verleyen, E.; Sabbe, K.; Jones, V.J.; et al. Were the Larsemann Hills ice-free through the Last Glacial Maximum? Antarct. Sci. 2001, 13, 440–454. [Google Scholar] [CrossRef]
  56. Prada, C.; Schizas, N.V.; Yoshioka, P.M. Phenotypic plasticity or speciation? A case from a clonal marine organism. BMC Evol. Biol. 2008, 8, 47. [Google Scholar] [CrossRef] [PubMed] [Green Version]
  57. Sahu, A.; Pancha, I.; Jain, D.; Paliwal, C.; Ghosh, T.; Patidar, S.; Bhattacharya, S.; Mishra, S. Fatty acids as biomarkers of microalgae. Phytochemistry 2013, 89, 53–58. [Google Scholar] [CrossRef]
  58. Goutte, A.; Cherel, Y.; Houssais, M.N.; Klein, V.; Ozouf-Costaz, C.; Raccurt, M.; Robineau, C.; Massé, G. Diatom-Specific Highly Branched Isoprenoids as Biomarkers in Antarctic Consumers. PLoS ONE 2013, 8, e56504. [Google Scholar] [CrossRef] [Green Version]
  59. Ivanišević, J.; Thomas, O.P.; Lejeusne, C.; Chevaldonné, P.; Pérez, T. Metabolic fingerprinting as an indicator of biodiversity: Towards understanding inter-specific relationships among Homoscleromorpha sponges. Metabolomics 2011, 7, 289–304. [Google Scholar] [CrossRef]
Figure 1. Map of the sampling sites, indicated by red diamonds.
Jmse 10 01656 g001
Figure 2. Maximum likelihood (ML) phylogeny of the concatenated 18S rDNA, rbcL and psbC regions alignment with members of the genus Craspedostauros. Approximate likelihood ratio tests based on Shimodaira–Hasegawa-like procedures (SH-aLRT) values (%), Bayesian posterior probabilities (PP) and ML bootstrap values (%) are shown above branches (SH-aLRT supports ≥ 80%, posterior probabilities ≥ 0.70 and bootstrap values ≥ 50%).
Jmse 10 01656 g002
Figure 3. Light (a,b) and scanning electron images (ch) of Craspedostauros ineffabilis IMA082A. Scale bars: (a,b) = 20 μm; (c,d) = 5 μm; (e,f) = 4 μm; (g,h) = 2 μm.
Jmse 10 01656 g003
Figure 4. Light (a,b) and scanning electron images (ch) of Craspedostauros zucchellii IMA088A. Scale bars: (a) = 10 μm; (b) = 20 μm; (c,d,g) = 5 μm; (e,f,h) = 1 μm.
Jmse 10 01656 g004
Figure 5. Principal component map showing morphological and ecological dissimilarities between Craspedostauros species [46,47,48,49,50,51,53].
Jmse 10 01656 g005
Figure 6. Principal components analysis (PCA) of metabolomic profiles of C. ineffabilis IMA082A and C. zucchellii IMA088A. The x- and y-axes represent principal components 1 and 2, respectively, while the percentages in brackets indicate how much of the overall variance in each dataset is explained by each principal component. Chemical profiles of three independent replicates were analyzed per Craspedostauros strain. (a) Positive ion mode; (b) Negative ion mode.
Jmse 10 01656 g006
Figure 7. Feature analyses for candidate biomarker selection (p-values < 0.005). Hierarchical clustering heat map of metabolites between groups in positive ion mode. Colors from red to green indicate the normalized relative abundance values of metabolites from low to high according to the scale bar. Samples of C. ineffabilis IMA082A (blue) and C. zucchellii IMA088A (violet) are disposed in columns; replicates are indicated with suffix numbers 1, 2 and 3. Compound classes are indicated in different colors and percentages of each class are reported on the right side of the figure.
Jmse 10 01656 g007
Figure 8. Feature analyses for candidate biomarker selection (p-values < 0.005). Hierarchical clustering heat map of metabolites between groups in negative ion mode. Colors from red to green indicate the normalized relative abundance values of metabolites from low to high according to the scale bar. Samples of C. ineffabilis IMA082A (blue) and C. zucchellii IMA088A (violet) are disposed in columns; replicates are indicated with suffix numbers 1, 2 and 3. Compound classes are indicated in different colors and percentages of each class are reported on the right side of the figure.
Jmse 10 01656 g008
Table 1. Results of topology test. Scores of constrained trees: (BT) = Best unconstrained tree, (CA) = Craspedostauros and Achnanthes, (CAM) = Craspedostauros, Achnanthes, and Mastogloia and (CSAM) = Craspedostauros, Staurotropis, Achnanthes and Mastogloia. Plus signs denote the 95% confidence sets. Minus signs denote significant exclusion. All tests performed 10,000 resamplings using the RELL method.
TreelogLdeltaL 1bp-RELL 2p-KH 3p-SH 4p-WKH 5p-WSH 6c-ELW 7p-AU 8
BT−51.86800.646+0.642+1+0.642+0.862+0.638+0.627+
CA−51.87020.354+0.358+0.712+0.358+0.646+0.362+0.373+
CAM−51.945770−0−0−0−0−4.04 × 10−121.94 × 10−07
CSAM−51.977108.990−0−0−0−0−1.05 × 10−183.04 × 10−47
1 deltaL: logL difference from the maximal logl in the set. 2 bp-RELL: bootstrap proportion using RELL method (Kishino et al. 1990). 3 p-KH: p-value of one-sided Kishino–Hasegawa test (1989). 4 p-SH: p-value of Shimodaira–Hasegawa test (2000). 5 p-WKH: p-value of weighted KH test. 6 p-WSH: p-value of weighted SH test. 7 c-ELW: Expected likelihood weight (Strimmer & Rambaut 2002). 8 p-AU: p-value of approximately unbiased (AU) test [36].
Publisher’s Note: MDPI stays neutral with regard to jurisdictional claims in published maps and institutional affiliations.

