Article

Molecular Evolution of Metallothioneins of Antarctic Fish: A Physiological Adaptation to Peculiar Seawater Chemical Characteristics

1
Department of Aquaculture and Fisheries, Agricultural University of Tirana, 1000 Tiranë, Albania
2
Department of Biology, University of Padova, 35122 Padova, Italy
3
Department of Cardiac, Thoracic and Vascular Science and Public Health, University of Padova, 35128 Padua, Italy
4
Department of Pediatrics, University of Missouri-Kansas City, Kansas City, MO 64108, USA
*
Author to whom correspondence should be addressed.
J. Mar. Sci. Eng. 2022, 10(11), 1592; https://doi.org/10.3390/jmse10111592
Submission received: 29 September 2022 / Revised: 18 October 2022 / Accepted: 24 October 2022 / Published: 28 October 2022

Abstract

:
Metallothioneins (MTs) are low-molecular weight sulfur-rich proteins, widely distributed in nature. They play a homeostatic role in the control and detoxification of metal ions. Previous studies indicated that MTs also have the capacity to scavenge reactive oxygen species. This study aimed to investigate the evolution of the protein in the notothenioid fish, evolved under the selective pressure of relatively high oxygen partial pressures, characteristics of cold Antarctic seawaters, and relatively high concentrations of metal ions, Cd and Cu in particular. The cDNA sequences of MT isoforms were characterized in members of the Nototheniidae, Bathydraconidae, Artedidraconidae, and Channichthyidae families. The phylogenetic relationships of MTs from these families and other teleosts were inferred by using Maximum Likelihood and Bayesian methods. The analysis of coding region and untranslated (UTR) sequences indicated the presence of two MT clades, each containing one of the two MT isoforms, MT-1 and MT-2. Our results indicated, for the first time for these proteins, that the evolution of MT genes has been characterized by strong purifying selection, whereas it did not observe any evidence of positive selection. In addition, phylogenetic analysis of the UTRs suggested that functional changes, in particular related to the MT-1 gene expression, had accompanied the duplication event.

1. Introduction

The recognition of the key role of polar habitats in global climate change has awakened great interest in the evolution of organisms living in those habitats. Such organisms have been exposed to strong environmental constraints, and therefore, they have been the focus of studies on their adaptation, but what represents an urgent concern is how they will be able to cope the future changes, such as the current global warming. Antarctic Notothenioidei is a suborder of fish species, which represents an example of adaptive radiation in an extreme environmental setting [1]. Together with the purely Antarctic Nototheniidae, Harpagiferidae, Bathydraconidae, Artedidraconidae, and Channichthyidae, the clade also includes three ancestral families, Bovichtidae, Pseudaphritidae, and Eleginopidae, represented by mainly non-Antarctic species. Notothenioids exhibit considerable morphological and ecological diversity and on high-latitude shelves they compose 77% of the fish diversity, 92% of abundance, and 91% of biomass [2].
Adaptations of these animals have been thoroughly investigated. Among those there are the biosynthesis of antifreeze proteins and the drastic reduction of the erythrocyte number and hemoglobin concentration [3].
In polar habitats, the extremely low temperature greatly increases dissolved oxygen concentration in water, as well as in animal tissues and cells. It is known that this condition can increase the rate of reactive oxygen species (ROS) formation [4], which are physiologically produced in a series of biochemical reactions in the cytoplasm and within cellular compartments, such as mitochondria and the endoplasmic reticulum. It has been suggested that Antarctic organisms, including fish, have evolved an efficient antioxidant defense system [5,6] to counteract the high rate of ROS formation, which may lead to irreversible cell damage and ultimately cell death.
Furthermore, the coastal Antarctic regions are characterized by relatively high Cd and Cu concentrations, due to the geochemical characteristics of the marine sediments [7]. This peculiar environmental condition could have influenced the molecular evolution of metalloproteins, such as metallothioneins, whose physiological role is the homeostasis and detoxification of metal ions.
Metallothioneins (MTs) are a group of ubiquitous low molecular weight metal-binding proteins (6–1.9 kDa), characterized by an unusually high cysteine content (30%) and generally by the lack of both aromatic amino acids and histidine [8]. MTs have numerous functions, e.g., the regulation of essential metal content, the detoxification of essential and non-essential metals, and the non-enzymatic scavenging of ROS [9], and may be induced by various stimuli, especially heavy metals or several stress conditions.
Thus far, MTs have been identified in animals, plants, bacteria, fungi, and protozoa [10,11,12]. Several studies have shown the presence of two MT isoforms in salmonids, some cyprinids (carp and gudgeon), and nototheniods, while other fish have only one isoform [13]. There are few studies on the functional characteristics of MT of Antarctic fish. For example, it is known that the MTs of Notothenia coriiceps can bind up to 7 atoms of Cd or Zn [14].
In the present work, we investigated the MTs in Antarctic teleosts, proteins evolved under the unique selective pressure represented by relatively high oxygen partial pressures, characteristics of cold Antarctic seawaters, and relatively high metal ion concentrations. In particular, the aim was to verify specific peculiarities that characterize the molecular evolution of these proteins. Our results strongly suggest that purifying selection has characterized the evolution of metallothionein proteins in the notothenioid fish, whereas no advantageous mutations could be ascribed to events of positive selection.

2. Materials and Methods

2.1. Ethical Procedures

The sample collection and animal research conducted in this study comply with the Italian Ministry of Education, University and Research regulations concerning activities and environmental protection in Antarctica and with the Protocol on Environmental Protection to the Antarctic Treaty, Annex II, Art. 3. All experiments have been performed in accordance with the U.K. Animals (Scientific Procedures) Act, 1986 and associated guidelines, EU Directive 2010/63/EU and Italian DL 2014/26 for animal experiments.

2.2. Animal Sampling

Adult specimens of Trematomus bernacchii, T. newnesi, T. hansoni, T. eulepidotus, T. lepidorhinus, T. pennellii, Gobionotothen gibberifrons, Pleuragramma antarcticum, Histiodraco velifer, Cygnodraco mawsoni, Gymnodraco acuticeps, and Chionodraco hamatus were collected in Terra Nova Bay, Antarctica (74°42′ S, 167°07′ E) during the 14th and 17th Italian Antarctic expeditions (1998–2002). Specimens were kept in running seawater at −2 to +1 °C until killed by cutting the spinal cord. Dissected tissues were immediately frozen in liquid nitrogen and stored at −80 °C. Total RNA was purified by Trizol reagents (ThermoFisher Scientific, Waltham, MA, USA) following the manufactured protocol. Total RNA was further purified with 8 M LiCl to remove glucidic contaminants [15,16]. Quantification was performed using an ND-1000 spectrophotometer (Nanodrop, Wilmington, DE, USA) and RNA integrity was assessed by capillary electrophoresis using an Agilent Bioanalyzer 2100, with the RNA 6000 Nano (Agilent Technologies, Palo Alto, CA, USA) and only samples with a A260/A280 ratio greater than 1.8 and a RIN of 8 were used for cDNA synthesis.

2.3. cDNA Synthesis and Amplification

First-strand cDNA was synthesized from 5 µg of total RNA. Briefly, RNA was denatured at 70 °C for 10 min, mixed with 10 pmol of dNTPs, 2.5 pmol Oligo(dT)-adapter primer (Table S1), and 200 U of SuperScript II reverse transcriptase (ThermoFisher Scientific), and incubated at 42 °C for 30 min. The reaction was stopped by heating at 70 °C for 15 min.
The reverse transcription mixture was used for PCR amplification with oligoprimers, specific for each MT isoform (Table S1). Primers were designed on the MT sequences already available in the GenBank database and the primer sequences were analyzed with the IDT Oligo Analyzer tool (https://eu.idtdna.com/pages/tools/oligoanalyzer (accessed on 24 July 2019)). Single-stranded cDNA was amplified with 2 U of BioTherm Taq DNA Polymerase (eENZYME, Gaithersburg, MD, USA), 50 pmol of each primer, 0.2 mM dNTPs and 2 mM MgCl2. Following a 2-min denaturation at 94 °C, the PCR steps consisted of 30 cycles of 1 min at 94 °C, 1 min at 55–58 °C, and 2 min at 74 °C, followed by a 4 °C hold.

2.4. Rapid Amplification of cDNA Ends (3′-RACE and 5’-RACE)

Primers for both the 3′- and 5′-RACE were manually designed or using Primer3, from the sequenced metallothionein coding region sequences. For 3′-RACE, we used as a reverse primer an Oligo (dT)-adapter primer, combined with a specific forward primer (Table S1).
The double-stranded DNA amplification was performed with the same PCR mixture previously described and the following thermal program: 2 min at 94 °C; 35 cycles of 30 s at 94 °C, 30 s at 55–59 °C and 1.5 min at 72 °C; followed by 5 min at 72 °C and a 4 °C hold. The 5′-RACE System for Rapid Amplification of cDNA Ends (v 2.0) kit (ThermoFisher Scientific) was used to obtain the 5′UTR regions. PCR conditions were set according to the kit protocol.

2.5. Cloning and Sequencing of PCR-Amplified cDNAs

All PCR products were gel-purified with NucleoSpin Gel and PCR Clean-up (Macherey-Nagel, Düren, Germany), ligated into the pGEM-T Easy Vector (Promega, Madison, WI, USA), and cloned in XL1-Blue E. coli cells. Positively screened clones were sequenced at the CRIBI Biotechnology Center (University of Padova) on an ABI PRISM 3700 DNA Analyzer (ThermoFisher Scientific).

2.6. Sequence Analysis and Phylogenetic Reconstruction

MT nucleotide sequences, both coding and UTRs, listed in Table S2, were aligned using MAFFT [17]. MAFFT is a multiple sequence alignment program, which uses progressive alignment followed by refinement, useful for hard-to-align sequences such as 5′-UTRs. As an outgroup, we chose to use the MT sequences of Perca fluviatilis, Lithognathus mormyrus, and Pagrus major, which are related to Antarctic fish, based on the trees built with cytochrome c data set [18] and morphological data [19].
Modeltest 3.7 [20] was used to determine the optimal model of nucleotide substitution for the phylogenetic analyses. Modeltest uses a set of hierarchical likelihood ratio tests (hLRTs) to discriminate among 88 progressively complex models of nucleotide evolution. Likelihood scores were calculated based on the hLRT, Akaike information criterion (AIC), corrected Akaike information criterion (AICc), and Bayes information criterion (BIC) model selection.
Phylogenetic trees were inferred with both ML and Bayesian optimality criteria. The ML analyses have been computed in GARLI 2.0 [21], which uses a stochastic genetic algorithm-like approach to simultaneously find the topology, branch lengths, and substitution model parameters that maximize the log-likelihood (lnL). Then, the bootstrap consensus tree was calculated using PAUP [22].
The Bayesian phylogenetic analyses were performed with Mr. Bayes [23] and BEAST [24]. Mr. Bayes was run with more than 1,000,000 generations to ensure the algorithm was run for an appropriate number of iterations, providing convergence in the estimations of the tree topology with the best posterior probability of node support, branch lengths, and the parameter values of the nucleotide substitution models. Four chains were run simultaneously in each analysis and the analysis was repeated four separate times. The effective sample size of the Markov chain was estimated using the computer program Tracer [25]. The burn-in period was obtained by using AWTY [26], which determines the point where generations and the probabilities of observed data values reach a plateau.
In the BEAST analyses, we used the Yule speciation model, which is the best model for species-level phylogenies [24]. After running BEAST in an uncorrelated relaxed clock model (implemented in Beast based on the Hasegawa-Kishino-Yano model (HKY) with a chain length of 10,000,000 steps sampling every 1000 steps, the distribution of the posterior probabilities and the continuous parameters were analyzed in Tracer. TreeAnnotator was used to find the best-supported tree and to annotate the mean ages of all nodes and the HPD ranges. The burn-in 1% of the 10,000 generated trees was specified.

2.7. Phylogeny-Based Tests of Selection

PAML [27] was used for detecting positive selection after MT gene duplication. Branches of the trees were divided a priori foreground and background lineages, allowing the comparison of a model that allows positive selection on the foreground lineages (alternative model) with a model that does not allow such positive selection (the null model). The branch-site model A + B was used in CODEML as a useful model to detect positive selection after gene duplication. With this model, one copy of the duplicate genes may have acquired a new function differentiating at an accelerated rate [27]. The branch-site model A + B, implemented by Yang and Nielsen [28], makes it possible that the non-synonymous to synonymous nucleotide substitution rate ratio (ω) vary both among sites and lineages. An LRT was used to compare the null model to the alternative one (Table 1) in all the possible tests.
To analyze positive selection after gene duplication, we considered three hypotheses. As the first hypothesis (Ha), the rate of evolution in MT-1 increased after the gene duplication event, which means that in this isoform an episodic change in selection pressure has occurred. This hypothesis was tested using the branch-site model A + B with test 1 in PAML. In the second hypothesis (Hb), we considered a burst of positive selection by functional divergence following the duplication event. This means that only in MT-1, a long-term shift in selection pressure could have occurred, resulting in a permanent change in selection pressure on MT-1. On MT-2, instead, the ancestral level of selection pressure should have persisted. Finally, the third hypothesis (Hc) does not consider positive selection, but a long-term shift in selection on both isoforms, different from each other and their ancestor. We used the branch-site model A + B with test 2 for testing hypothesis Hb and test 1 + 2 for testing hypothesis Hc. The PARRIS software [29], which considers recombination and ω ratio variation among lineages, was also used to confirm the results.
To evaluate selection at individual codons (not allowing variation among lineages), we ran a series of nested models implemented in PAML [27], in which the neutral models restrict to values 1, while selection models included a class of sites with dN/dS > 1. An LRT was used to compare nested models (Table 2). Two models of codon frequencies were used for all the positive selection analyses (F3 × 4 and F61). The F3 × 4 and F61 codon models differ in the way they estimate each codon equilibrium frequency. The F3 × 4 model derives codon equilibrium frequencies from the frequencies of the three nucleotides at the three codon positions, whereas the F61 model uses each codon as a free parameter and constrains the sum to one.
All the positive selection analyses were performed using the phylogenetic tree’s topology obtained from the Bayesian Inference.

2.8. Stringent Functionally Constrained Amino Acids Identification

The intensity of purifying selection is determined by the degree of intolerance that characterizes a site or a genomic region toward mutations [30]. This functional or selective constraint defines the range of alternative nucleotides that are acceptable at a site without negatively affecting the function or structure of a gene or its product. DNA regions (e.g., coding regions or regulatory sequences) in which a mutation is likely to affect function have a more stringent functional constraint than regions devoid of function [30]. The stronger the functional constraints on a macromolecule, the slower the rate of substitution will be. Several models have been proposed to quantify the functional constraints of protein-coding genes, independently of their rate of substitution [30]. One such measure is functional density [30]. The functional density of a gene (F) is defined as n/N, where n is the number of sites committed to specific functions and N is the total number of sites. Therefore, F is the proportion of amino acids that are subject to stringent functional constraints. In this case, for F estimation, we need to know n, defined as the number of known function sites + the number of unknown function sites which have gone under negative selection. Because it is known that MT function is linked to the cysteine motif in the protein primary sequence [9], we considered them as known functional sites. The unknown functional sites were determined using SLAC, REL, and FEL methods implemented in the DATAMONKEY web server [31]. Only the amino acids significant in all three methods were considered as negatively selected (Table 3).

3. Results

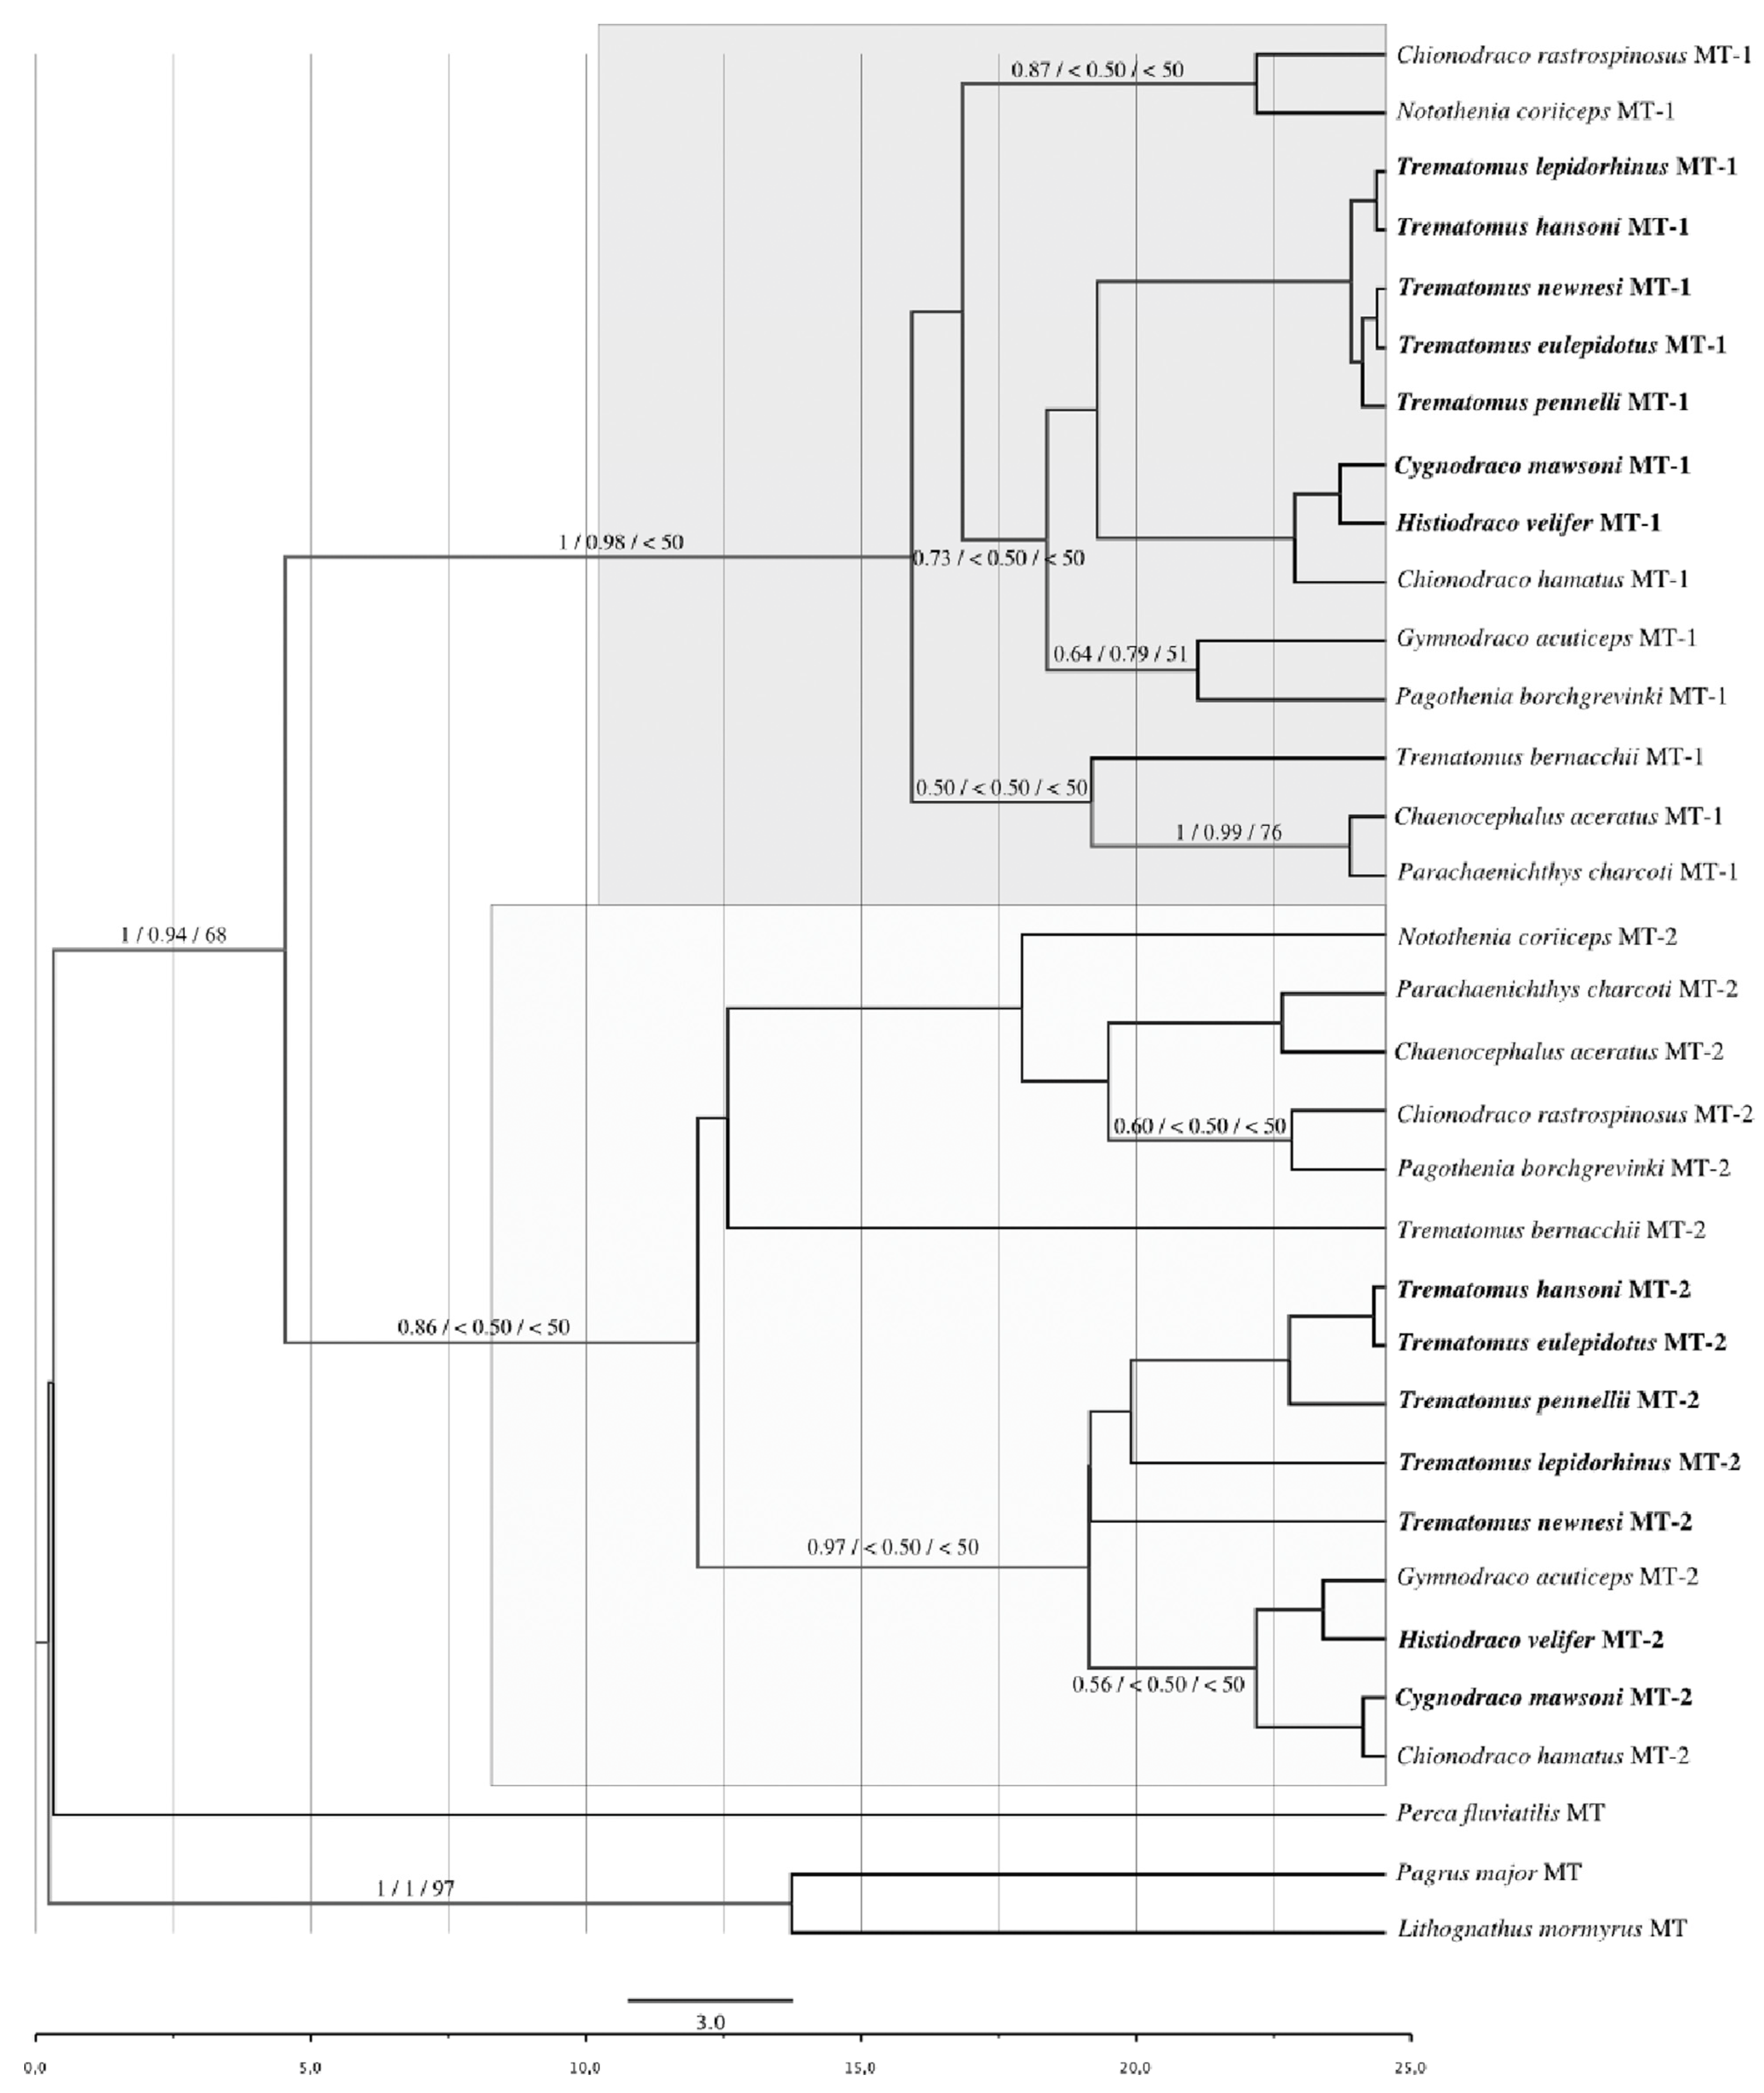
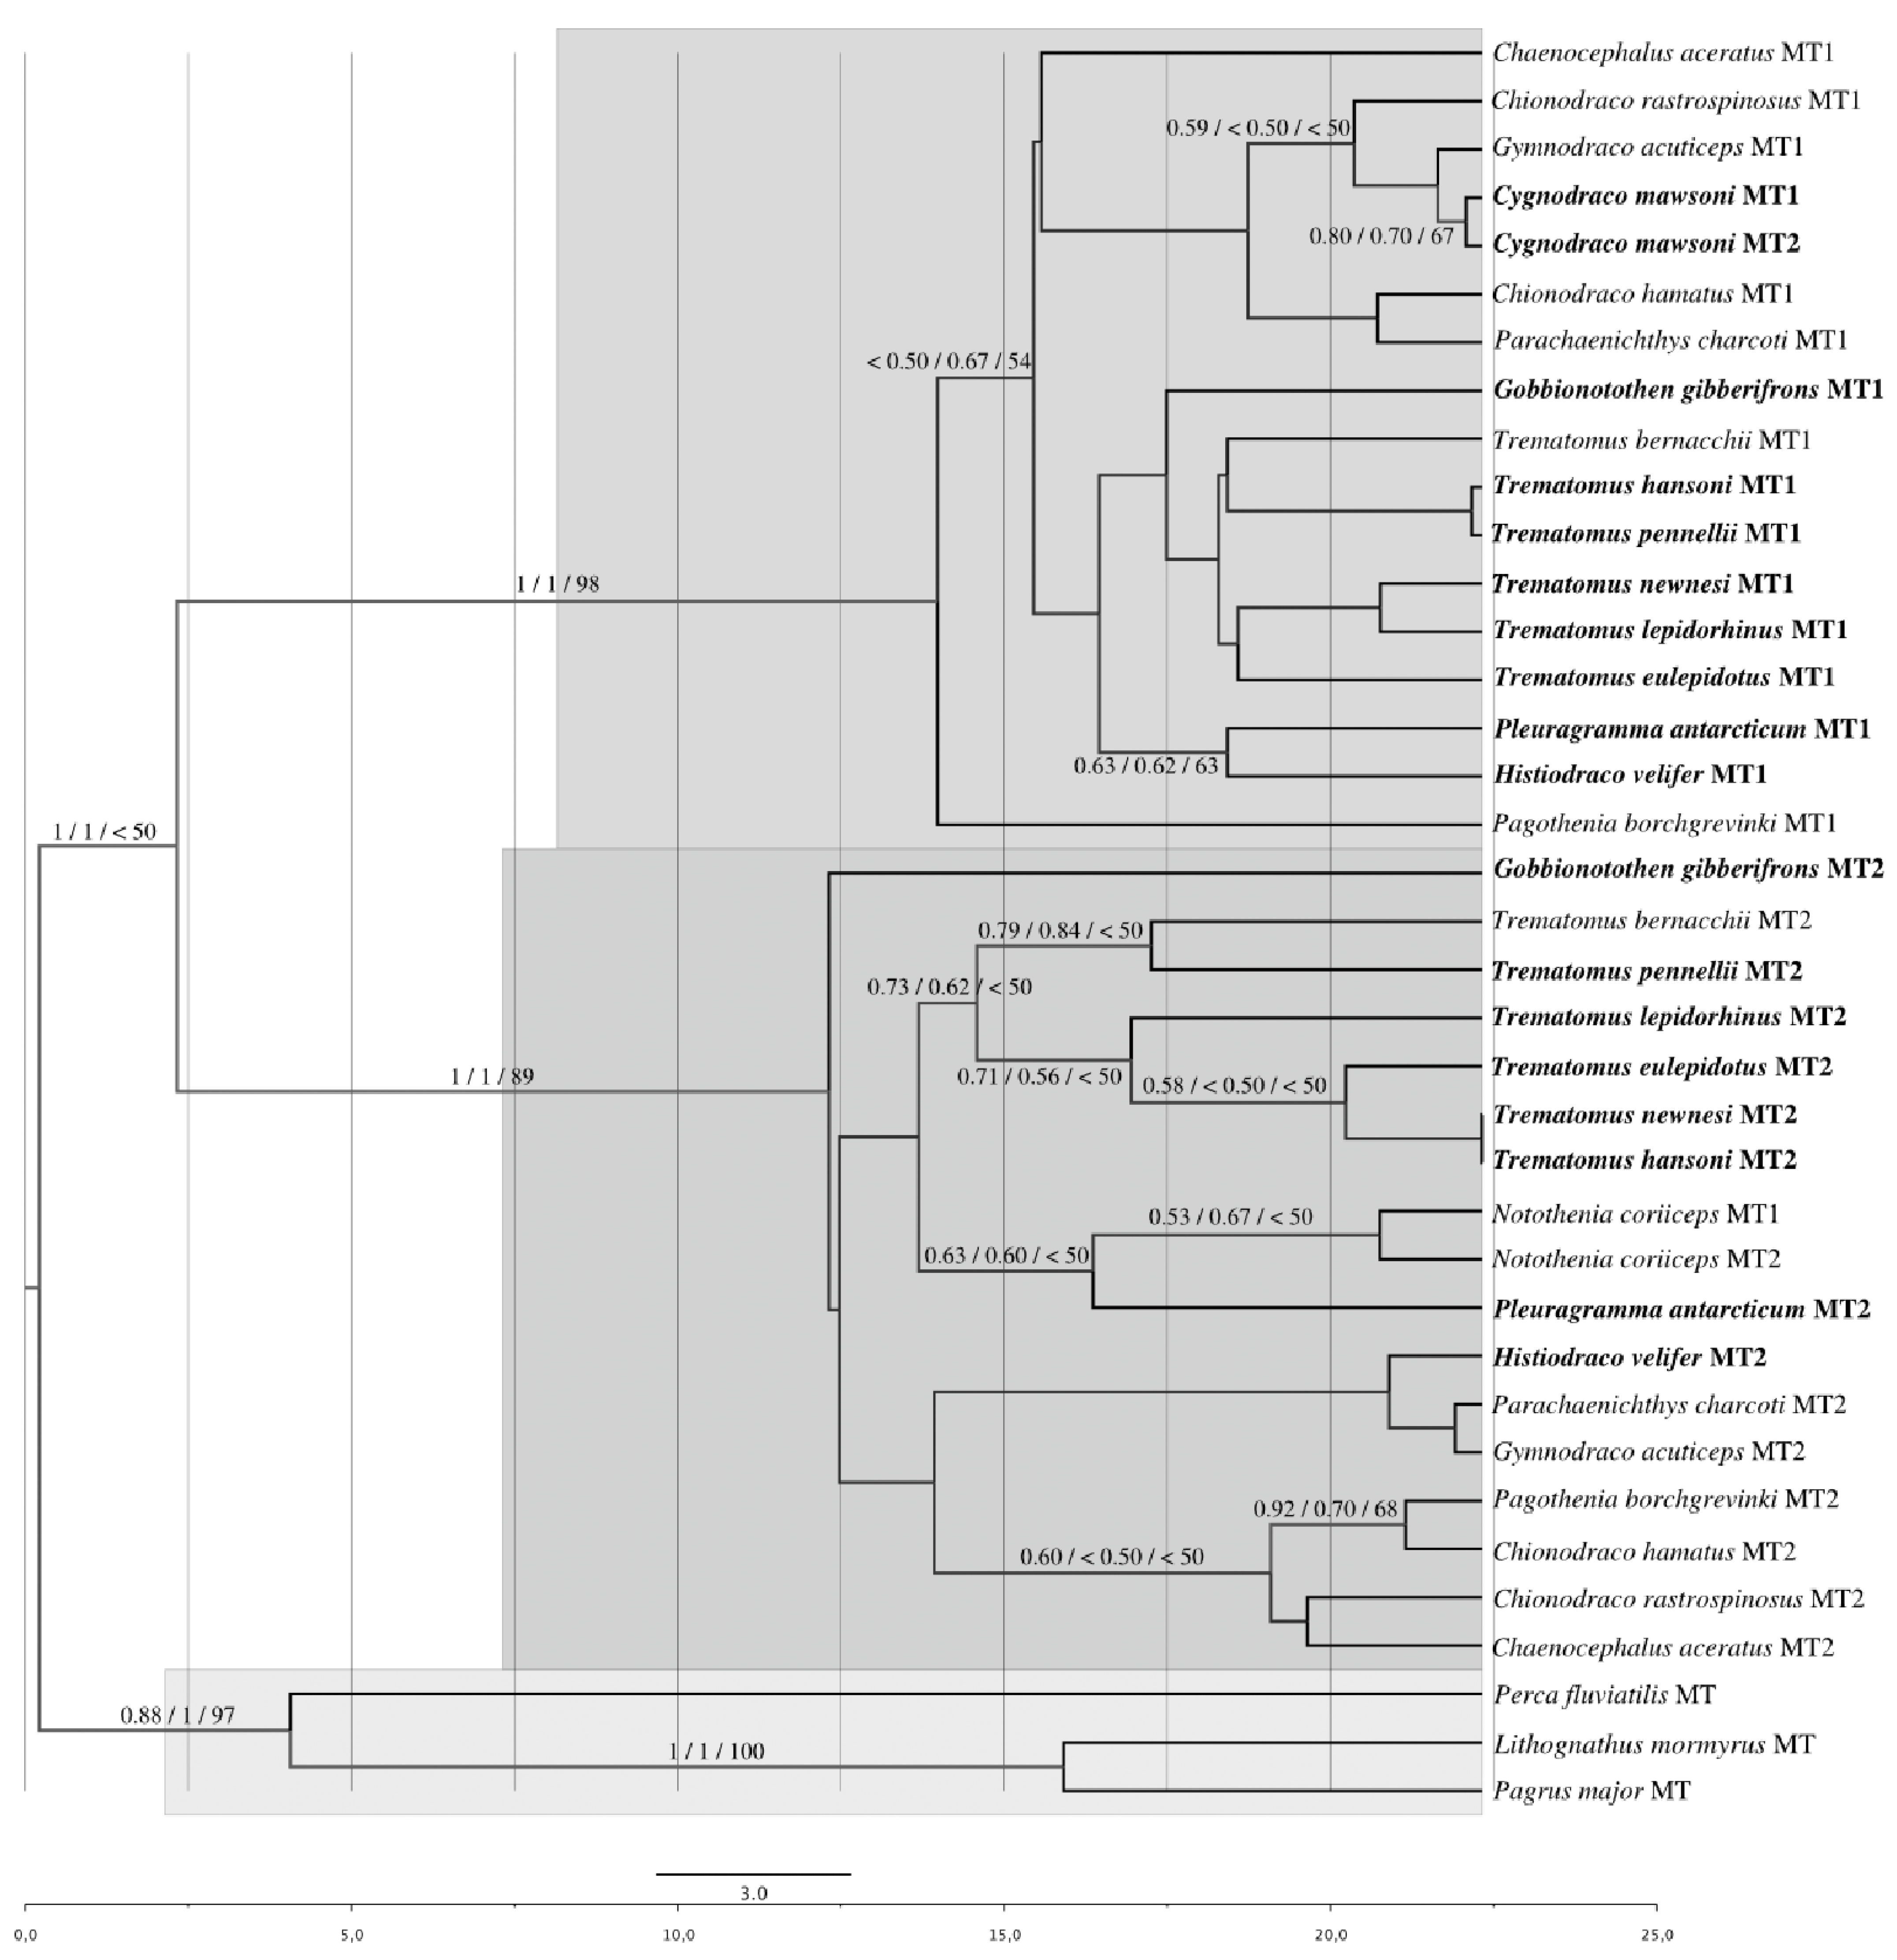
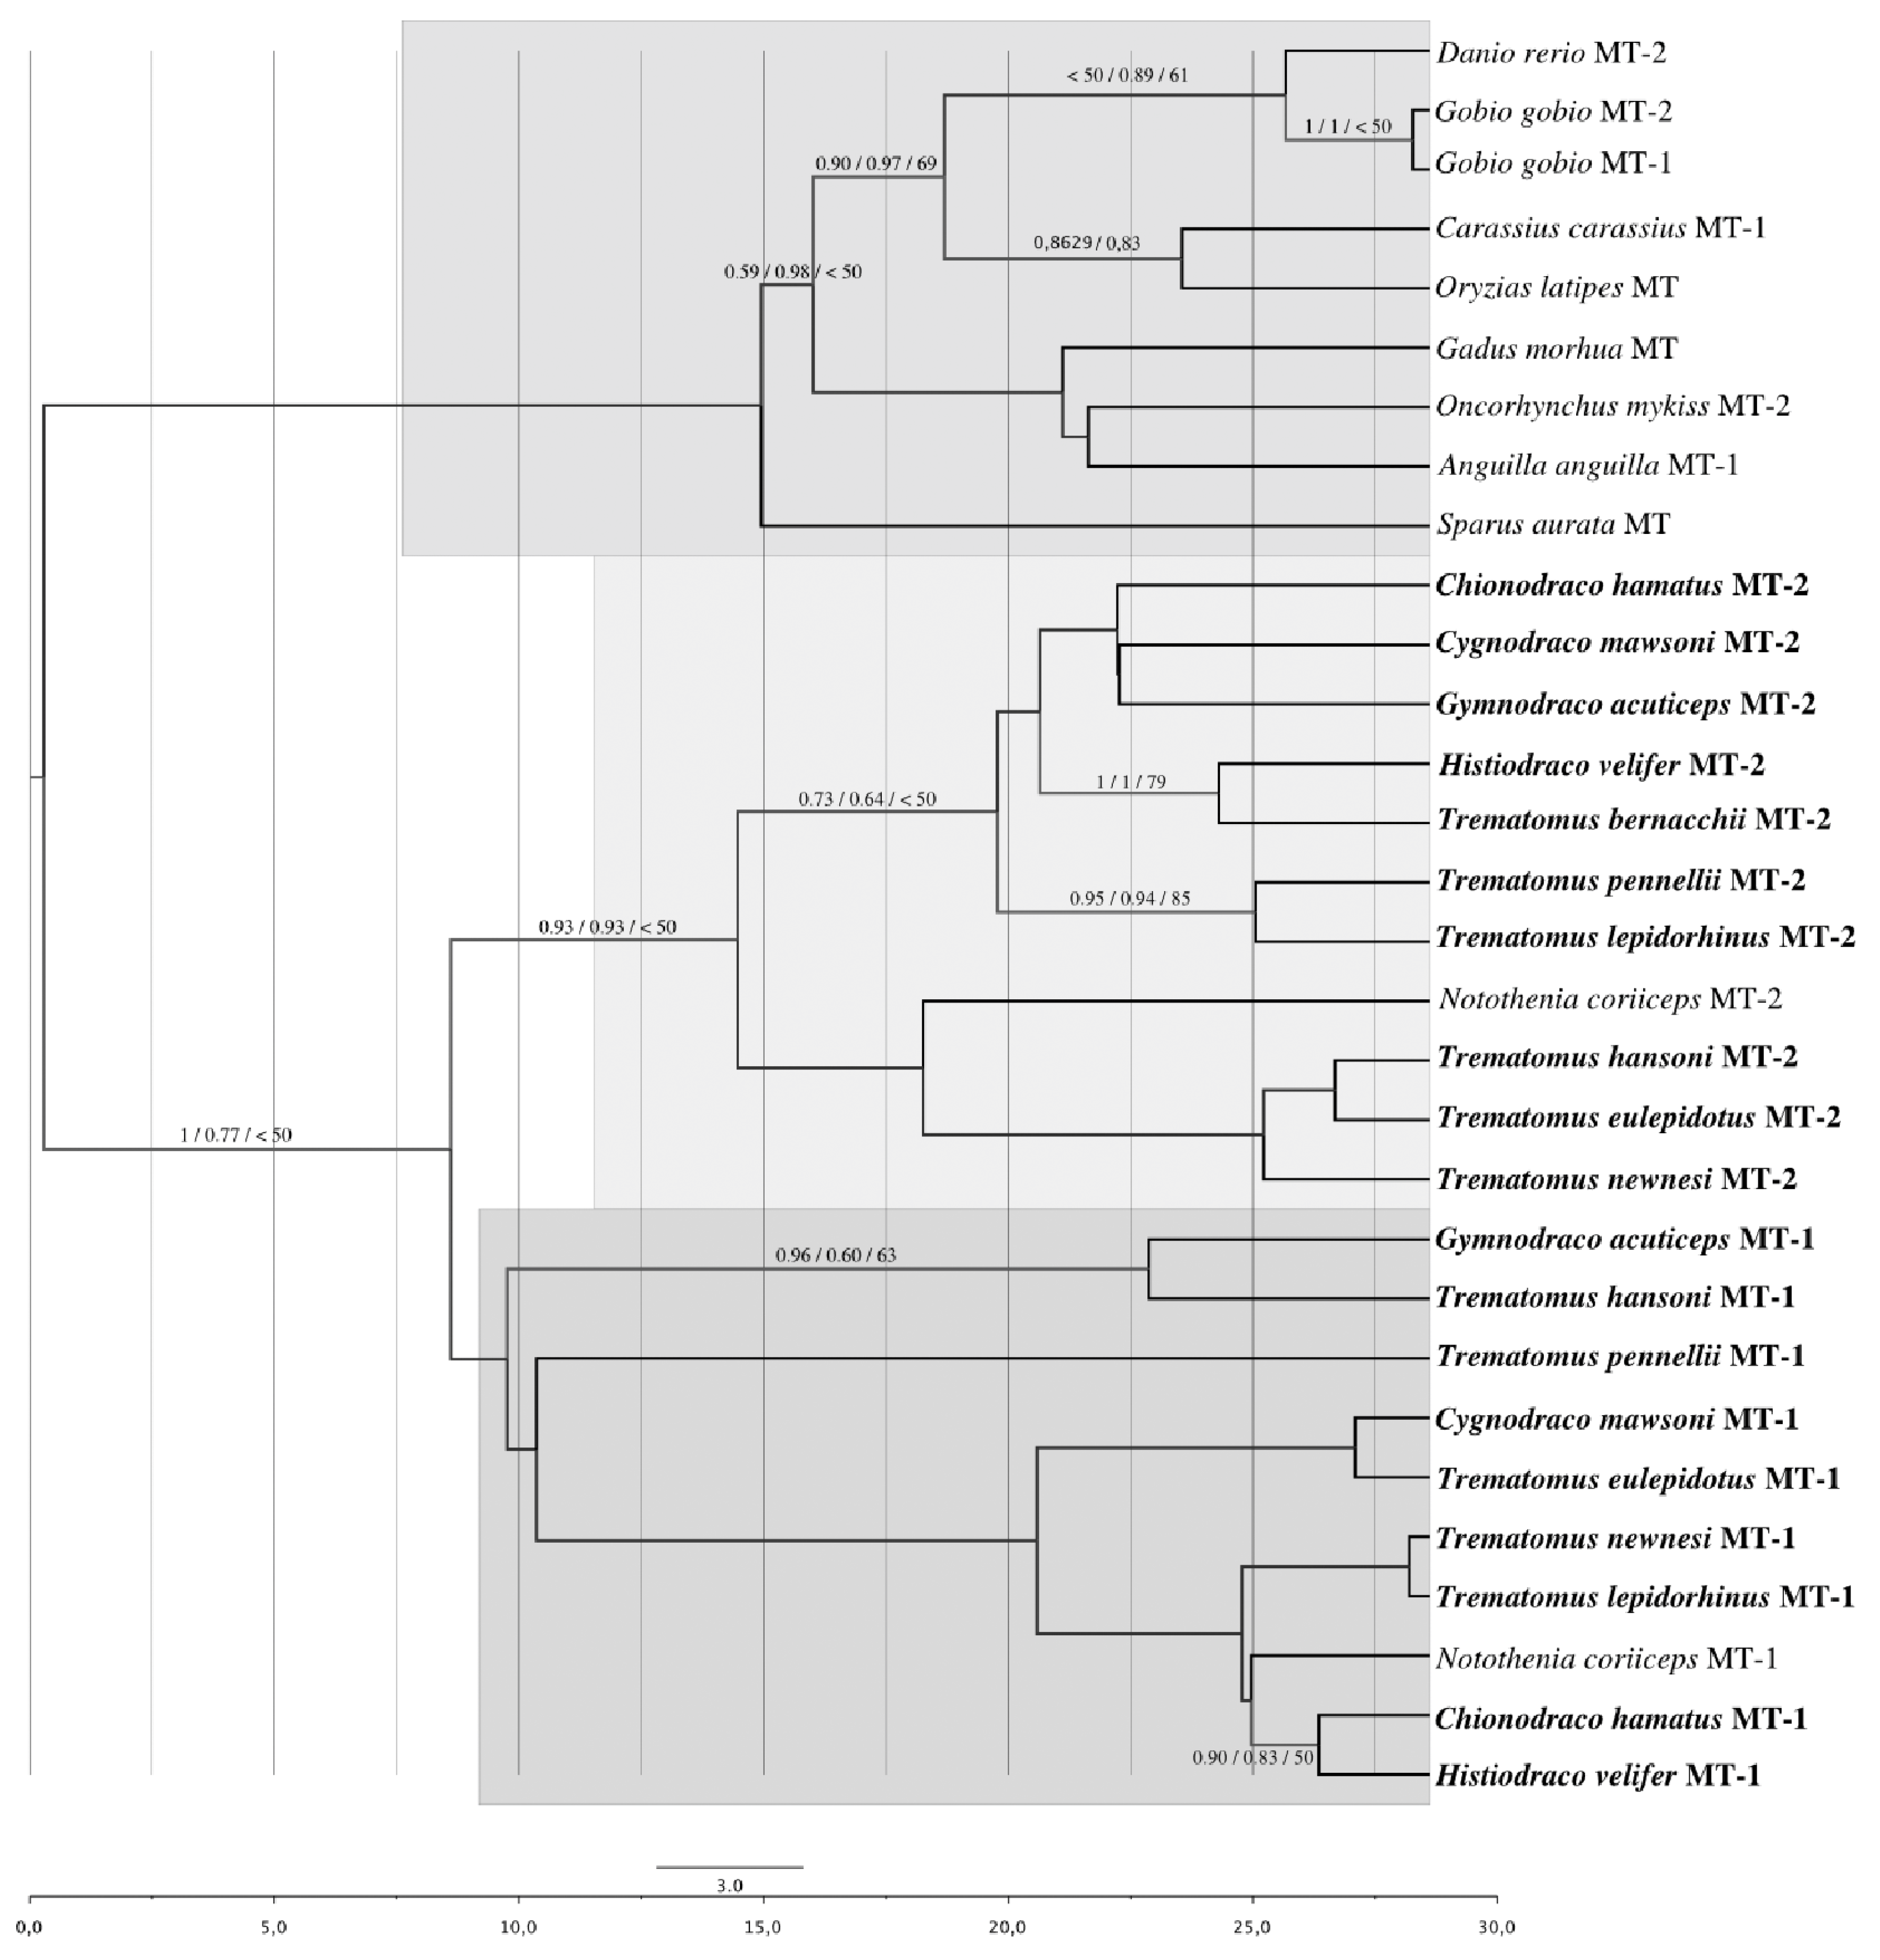
3.1. Phylogenetic Reconstruction Based on Coding Regions

MT gene trees inferred from the 12 notothenioid species and the other 16 species present in GenBank (Table S2), shows that each examined notothenioid species have two distinct MT isoforms, codified by different genes (Figure 1).
The tree topology obtained for the notothenioid MTs compared with the phylogenetic trees representing the phylogeny of the species, based on mitochondrial and nuclear genes [32] and RAD sequencing [33] show several discrepancies. Most notably, in both the MT-1 and MT-2 clades, the sequences of Trematomus and Chionodracus did not form monophyletic groups, with T. bernacchi emerging as closely related to Channichthyidae and Bathydraconidae families.

3.2. Positive Selection Analyses on MT Proteins

The two MT proteins displayed different substitution rates. The amino acidic substitution rate of MT-1 was 4.47 × 10⁻³ ± 0.03 aa/site/million years ago (MY), whereas the rate of MT-2 was 3.33 × 10⁻³ ± 0.02 aa/site/MY. At the nucleotide level, we observed a smaller difference between MT-1 and MT-2, with a substitution rate of 2.9 × 10⁻³ ± 0.02 nt/site/MY for MT-1 and 2.55 × 10⁻³ ± 0.03 nt/site/MY for MT-2.
As shown in Table 1, of the three hypotheses Ha, Hb, and Hc (see methods) tested to analyze positive selection after the MT duplication, only the third Hc could be accepted (for two models of codon frequencies), indicating the absence of positive selection in the evolution of Antarctic teleost MTs (p < 0.05). These results instead suggest a long-term shift in selection on both MT proteins, but also that different selection pressures acted on the two MT genes, as well as on the ancestor gene. This result was also confirmed with the use of the PARRIS software.

3.3. Strict Molecular Clock vs. Relaxed Molecular Clock Models

In absence of positive selection, the amino acid substitution rate should be lower than the nucleotide substitution rate in the MTs. From our analyses with a strict clock model, this was not true. Therefore, we compared the likelihood mean score of the strict molecular clock model with that of the relaxed molecular clock model. The null hypothesis considers that the rate of evolution is homogeneous among all branches in the phylogeny, whereas the alternative relaxed molecular model hypothesis assumes inheritance of rates of evolution, resulting in a correlation between ancestral lineages and their descendants. The estimated likelihood mean score value was lower for the relaxed molecular model hypothesis (356.367 vs. 360.541, p < 0.005), indicating that it explains the data better. Indeed, applying the relaxed molecular clock model, the estimated amino acid substitution mean rate was 1.8 × 10⁻³ ± 0.02, which, as expected, was lower than the nucleotide substitution rate (2.5 × 10⁻³ ± 0.02) of the coding region sequences (likelihood score value = 663.914).

3.4. Positive Selection at the Codon Level

To confirm the relaxed molecular clock model of evolution and the lack of positive selection we also investigated the MTs for positive selection at individual sites, without allowing variation among lineages. We applied a series of site models implemented in PAML. The results shown in Table 2 indicated that no selection models were accepted. These results further indicate that the MT genes of the Antarctic teleosts did not evolve under positive selection, and they did not acquire advantageous mutations in their diversification after the duplication event.

3.5. Stringent Functionally Constrained Amino Acids

The functional density (F) of Antarctic MTs was 41.7%. The functional density for the outgroup MTs was 40.0%. The lower F of the Antarctic MTs, compared to the outgroup, might signify that the evolution of notothenioid proteins is characterized by a lower rate of substitution. Generally, negatively selected amino acids tend to be impervious to replacement during evolution as a consequence of the conservation of bulkiness (volume) and hydrophobicity. Our results indicated that these amino acids are four: Lys8, Lys52, Pro3, and Asp2 (Table 3).

3.6. PhylogeneticAnalysis on UTR Sequences

In contrast to the coding region of MT genes, both the 5′- and 3′-UTRs are more phylogenetically informative. However, a large part of the detected nucleotide variations consists of insertions/deletions, particularly in the 5′-UTRs. We tried to minimize the problem of extended gaps in alignments using multiple progressive alignments (implemented in MAFFT), which decreases reliance on the initial guide tree, followed by refinement, as well as character and stochastic methods, such as maximum likelihood and Bayesian methods. These phylogenetic approaches were applied to the 5′-UTR and 3′-UTR sequence alignments, and then the best nucleotide substitution model has been chosen using ModelTest. Curiously, the ModelTest program selected HKY as the best-fitting model. BEAST has been used also to better resolve the phylogenetic trees for the 5′-UTR and 3′-UTR sequences (Figure 2 and Figure 3).
For the phylogenetic analyses based on 5′-UTRs, all the available non-Antarctic teleost sequences present in GenBank have been used as an outgroup.
The estimated nucleotide substitution rate in the 5′-UTRs was 2.26 × 10⁻² ± 0.14 nt/site/MY, higher than that in the 3′-UTRs (8.44 × 10⁻³ ± 0.01 nt/site/MY) and the coding regions (2.5 × 10⁻³ ± 0.02 nt/site/MY), whereas the average rates for the 5′- and 3′-UTRs are 1.96 × 10⁻⁹ ± 0.07 and 2.10 × 10⁻⁹ ± 0.04 substitutions per site per year, respectively. The higher nucleotide substitution rate for 5′-UTRs of MT genes, with respect to 3′-UTRs, is probably due to the outgroup 5′-UTR sequences available in the GenBank database, which belong to only phylogenetically distant organisms.
By comparison of the tree topologies obtained with the 3′ and 5′-UTRs (Figure 2 and Figure 3), several discrepancies were observed, and thus, it is possible that the 5′-UTRs evolved differently from the 3′-UTRs. C. mawsoni MT-2 3′-UTR is positioned inside the MT-1 cluster, while N. coriiceps MT-1 3′-UTR is inside the MT-2 cluster.

4. Discussion

4.1. Phylogenetic Analyses of the MT Coding Sequences

Two MT isoforms are expressed in each notothenioid species, suggesting that at least two paralogous groups of genes, MT-1 and MT-2, are present in the Antarctic fish, as shown by the clusters in Figure 1. The observed pattern can be explained by the occurrence of an ancient MT duplication, which took place after the separation of the notothenioid lineage from the other teleosts, and most likely before the diversification of the notothenioid species. However, no data on MT sequences of non-Antarctic nototheniods are available to confirm the hypothesis.
Nevertheless, several points argue for our hypothesis. Firstly, our results are similar to those of Bargelloni and colleagues [34], which also suggested that notothenioid MTs might have diverged from a single ancestral gene after the separation of the notothenioid from the other teleost taxa, and after the isolation and cooling of Antarctica. The Antarctic continent was subjected to a series of tectonic and oceanographic events that culminated with the formation of the Antarctic Circumpolar Current (ACC) about 22–25 million years ago (MYA) and is still present today [35]. This oceanic current has surrounded and isolated Antarctica creating a natural barrier, which has delimited a unique evolutionary site between the continent and the ACC. With the gradual isolation and cooling of Antarctica, new niches became available to groups of animals that diversified in situ as the notothenioids or that migrate from outside the ACC like liparids and zoarcids [36]. These last groups of fish, differently from the notothenioids, lack antifreeze glycoproteins (AFGP) genes in their genomes, indicating that they diverged before the tectonic isolation and the appearance of AFGPs [37]. Secondly, though we focused on the Antarctic notothenioids and did not include any of the Early-Diverged Non-Antarctic Notothenioidei (EDNAN) metallothioneins, we estimated that the MT gene duplication in Antarctic notothenioids occurred about 20 MYA, well after the establishment of the ACC, based on the analyzed sequences differences and using the algorithm of Grauer and Li [30].
The newly revisited taxonomies of Eastman and Eakin [38] and Near et al. [39] indicate that EDNAN, namely Pseudaphritidae, Eleginopsidae, and Bovichtidae, likely originated during the late Cretaceous-early Cenozoic about 90 MYA in the Weddellian Province, an area encompassing modern South America, Antarctica, Australia, and New Zealand [39]. Based on large genomic DNA sequence datasets, phylogenetic reconstructions suggested that Bovichtidae likely differentiated during the initial fragmentation of East Gondwana about 88.6 MYA. Pseudaphritidae diverged about 80 MYA after the separation of the Australiasian landmasses and the emergence of Eleginopsidae is congruent with the opening of the Drake Passage about 45.6 MYA [39]. All these species have never lived in the thermally stable cold temperatures of their close Antarctic nototheniods relatives, which rarely vary from the freezing point of seawater (near −1.9 °C). Instead, EDNAN experienced fluctuating thermal environments that seldom drop below 5 °C and may reach 20 °C or more (e.g., for Bovichtus diacanthus living in Tristan da Cunha).
Finally, the mismatches between the species tree and gene tree, as in the case between MTs gene sequences and the notothenioid species tree are quite common with closely related species [40].

4.2. Selection Pressures on MT Paralogs

It seems that MTs evolved faster than other proteins in the Antarctic notothenioids. For example, Cu, Zn SOD in the Antarctic notothenioids shows an amino acidic substitution rate of 2.597 × 10⁻³ aa/site/MY [32], which is lower than the mean rate of substitution of MTs (3.9 × 10⁻³ ± 0.065 aa/site/MY) in the same organisms. It was also interesting to note that the difference between the amino acid sequences was higher than that at the nucleotide level, which could be expected if a positive selection has operated on the evolution of Antarctic fish MTs after the duplication event. Instead, our analysis indicates that no positive selection operated on the molecular evolution of MTs in the Antarctic, but different selection pressures acted on MT-1 and MT-2 genes, as well as on their ancestor gene. For example, different selective pressure between paralogs within the myostatin gene family has also been shown in Salmo salar [41].
When compared with their orthologues from temperate organisms, cold-adapted proteins frequently contain minor amino acid changes. In notothenioids, none of the variable sites seems to be under positive selection and could be directly linked to cold adaptation. These amino acid changes affect the molecular flexibility of the protein. One of these substitutions in the MT-1 characterizes all Antarctic species: Thr26 is substituted by Lys. This replacement lowers the arginine-to-lysine ratio, a characteristic that increases the flexibility of the proteins of the cold-adapted species [42]. Results of Varriale and colleagues [43] showed that the Toll-like receptors 2 (TLR2) of the Antarctic notothenioids T. bernacchii and C. hamatus are more flexible than TLR2s of the temperate species Gasterosteus aculeatus, suggesting that the selective pressure of the Antarctic environment shaped TLR2 to increase its activity at extremely low temperatures. This peculiar condition of the Antarctic environment could have also been a crucial factor to determine the differentiation of the two MT genes. A similarly increased flexibility has also been shown in other Antarctic proteins, such as carbonic anhydrase, glutathione peroxidases (GPx), and peroxiredoxins (Prdx) [44,45,46,47]. Generally, after gene duplication, mutations cause the gene copies to diverge. A mutation is likely to have a negative effect on function, so the classical model of gene duplication predicts that after duplication one gene copy will probably lose its original function while the other will retain its function [48]. An advantageous mutation, instead, rarely may change the function of one of the duplicate gene copies, and therefore, both duplicated copies may be retained.
Differential tissue expression of duplicate genes can also contribute to functional refinement and diversification [31]. Ohno proposed that expression divergence is the first step in the functional divergence between duplicate genes, and thereby, increases the chance of retention of duplicate genes in a genome [48]. Stanley Kim and colleagues [49] analyzed the expression of duplicate genes associated with oxidative stress response arising from the most recent genome-wide duplication event (WGD) in Arabidopsis, which is estimated to have occurred 20–40 MYA. The majority of these duplicate genes diverged in expression, although they have retained a significant amount of coding sequence conservation.
In N. coriiceps, C. hamatus [31], and T. eulepidotus [50] MT-2 mRNA levels are six times higher than those of MT-1 in various tissues. These data suggest that the two genes diverged in expression in the Antarctic fish while retaining a high/great amount of conservation during the last 15–27 MYA. In fact, the mean ω ratio of the Antarctic MT sequences was estimated to be 0.132, suggesting that these genes have evolved under strong purifying selection within the fish lineage. Contrary to our results on MT genes, Cheng and Detrich [51] suggested a relaxed selection pressure for oxygen-binding proteins in the cold, oxygen-rich waters of the Southern Ocean.

4.3. Stringent Functionally Constrained Amino Acids

In Homo sapiens, MTs (MT-1A, MT-2A, MT-3, and MT-4) lysine and cysteine are the most conserved amino acids. Lys8 and Lys52 are probably conserved because they form the cross-linking structure between the two domains, characteristic of all MTs. Cysteines are involved in MT dimer formation [52]. In vertebrates, Pro3 is conserved in the primary structure of each MT isoform, probably for its contribution to the contorted bending of these proteins, as is known for proteins in general [30]. The distribution of charged amino acids (such as Asp2) is important in protein evolution [30] and it could have played an essential role in the evolution of MTs. Nevertheless, the role of the site under purifying selection remains to be elucidated by further studies based on biophysical approaches.
Although our analyses demonstrated that MTs in Antarctic fish evolved through negative selection, many parallel and convergent nucleotide substitutions occurred in the examined sequences (Table 3). Generally, parallel and convergent nucleotide substitutions indicate the presence of positive selection, but this is not always true, as has been previously demonstrated by Kornegay and colleagues [53].
From our results, it seems that heterogeneous purifying selection among the negatively selected codons of MT isoforms occurred in the Antarctic fish. For example, the purifying selection has operated contemporaneously in MT primary structures of the outgroup species and in one of the two isoforms of some Antarctic species regarding the Pro3 codon (only in MT-1 and in all the outgroup MTs) and Lys52 codon (only in MT-2 and in all the outgroup MTs). Thus, even if all the negatively selected codons in a specific amino acidic position codify for a specific negatively selected amino acid, which is the same in all MT sequences, the nucleotide synonymous rates vary among them.

4.4. UTR Regions

Efficient regulation of the cell antioxidant defense system is necessary for marine Antarctic organisms living in an environment characterized by constant low seawater temperature (−1.8 °C) that increases O2 solubility, both in the environment [54] and in animal body fluids. This condition can increase the formation rate of ROS, consequently increasing the risk of oxidative stress [55]. Although the relative abundance of oxygen in the Antarctic marine waters is a stable condition, the production of ROS may undergo variations related to metabolic variations (and thus, oxygen consumption), such as those that occur during swimming activity, feeding, or ventilation of the respiratory surfaces, requiring the activation of the cell antioxidant defense system. This defense system may be obtained with an efficient regulation of the enzymatic and non-enzymatic components, including MTs [56,57,58,59]. Specifically for Antarctic fish, a recent study on T. hansoni has shown that MTs can play a scavenger role against ROS both in the gills and in the liver [60]. It has also been shown that the antioxidant action of MTs integrates with that of antioxidant enzymes such as SOD, GPx, and Prdx, which are induced in Antarctic fish in environmental conditions that favor the risk of oxidative stress [4,32,45,46,47].
Generally, in eukaryotic organisms, untranslated regions contain regulatory sequences involved in the processing of pre-mRNA and/or regulating the translation process [30]. One such sequence is the polyadenylation signal (AATAAA), which is usually located about 20 bp upstream of the transcription termination site. Indeed, the polyadenylation signal was found 20 bp upstream of the transcription termination site in 3′UTR of notothenioid MTs, except for H. velifer and T. newnesi MT-1, and G. gibberifrons MT-2.
Another motif (ATTTA) in 3′-UTR should be involved in the turnover rate of mRNA, since it signals the rapid degradation in certain mammalian mRNAs [61]. This motif is frequently present in genes codifying MTs and other stress proteins in which the regulation of transcription is based on a negative feedback mechanism [62,63,64]. This element is present only in MT-1 sequences of notothenioids and it is located approximately 10 bp upstream of the transcription termination site. It is possible that this element can be responsible for the MT-1 and MT-2 expression levels difference found in Antarctic teleosts [31]. Furthermore, based on the previously cited evidence that MT-2 mRNA levels are higher than those of MT-1 in various tissues of several Antarctic fish species, the hypothesis is that MT-2 could be constitutively expressed at relatively high levels as the first line of defense, with its mRNA accumulated in stress granules. MT-1, instead, would be induced only in strong stress conditions. The presence of a rapid degradation element in the MT-1 mRNA could favor the negative feedback regulation of this protein expression.
The tree topology obtained with 5′-UTR (Figure 3) is in accordance with the phylogeny reported by Buchmann and Pedersen [65]. The discrepancies that emerged from the comparison with the species trees [39] may be representative of a case of reticulate evolution, a process of convergence, which involves only a part of a gene sequence [66]. Coral reef fish represent a perfect example where two clades, Plectropomus and Acanthurus, exemplify the outcomes of introgressive hybridization and introgressive hybridization/hybrid speciation, respectively [67,68]. In particular, member lineages of these unrelated genera possess mosaic genomes and/or phenotypes reflecting contributions from multiple species. Furthermore, some of these hybrid lineages have been recognized as species.
According to the comparable substitution rates of 5′ and 3′-UTRs in notothenioids, a convergent evolution appears to have involved the entire 3′-UTR of N. coriiceps MT-1 and C. mawsoni MT-2. In both species, the 3′-UTRs sequences of MT-1 and MT-2 are identical, and therefore, they are positioned as sister sequences in the 3′-UTR phylogenetic tree.

5. Conclusions

Our data seem to indicate that the main feature of metallothionein evolution in Antarctic notothenioids is its duplication that occurred about 19.84 MYA, after the ACC formation and before the radiation of the Antarctic fish. After the duplication event, the two MT genes may have been subject to a strong purifying selection at different specific amino acid sites, but the selective pressure acted differently on MT-1, MT-2, and their ancestral gene. In addition, the characterization of the non-coding sequences suggested that functional changes, in particular related to the MT-1 gene expression, had accompanied the duplication event.
If the two isoforms have been conserved over the past 15–27 million years, we can safely assume that both are physiologically necessary. More complicated is to verify the actual physiological role played by each of them. What we have recently seen, studying the expression of MT-1 and MT-2 in T. hansoni and T. eulepidotus, experimentally induced with treatments with Cu and Cd, is that surely the genes of the two isoforms show a differential activation, also variable from organ to organ [50,60]. MT-2 appears to play a more important role as a metal-chelating molecule, and this agrees well with the fact that in Antarctic fish it is constitutively expressed at relatively high levels. MT-1 instead would be induced only in strong stress conditions and seems to play a role more related to the defense against oxidative stress.
The characterization of the non-Antarctic notothenioid MT sequences and future biomolecular, biochemical, and biophysics analyses would contribute to the clarification of molecular and functional evolution of notothenioid fish MTs.
In any case, the new information presented in this work represents an important contribution to the forecast studies that are being carried out in relation to the global changes that are taking place on our planet. These studies aim to evaluate the resilience of fragile ecosystems such as the Antarctic, and some of these use the expression of metallothioneins of Antarctic fish as a biomarker of stress [69].

Supplementary Materials

The following supporting information can be downloaded at: https://www.mdpi.com/article/10.3390/jmse10111592/s1, Table S1: Primer sequences used for the characterization of the MTs mRNA sequences. Table S2: GenBank accession number list of species in which MT sequences were examined.

Author Contributions

Conceptualization, R.B., G.S. and P.I.; methodology, R.B. and A.G.; validation, R.B. and A.G.; formal analysis, R.B., S.P., S.S. and E.P.; investigation, R.B., F.B., A.M.T., D.F. and G.S.; resources, G.S. and P.I.; data curation, R.B. and G.S.; writing—original draft preparation, R.B. and G.S.; writing—review and editing, F.B., S.S., E.P., S.P., A.M.T., D.F., A.G. and P.I.; visualization, G.S.; supervision, G.S. and P.I.; project administration, G.S. and P.I.; funding acquisition, G.S. and P.I. All authors have read and agreed to the published version of the manuscript.

Funding

This research was supported by the Italian National Program for Antarctic Research (PNRA). Project identification code: PNRA16_00099.

Institutional Review Board Statement

All the activities on animals performed during the Italian Antarctic Expedition are under the control of a PNRA Ethics Referent, which acts on behalf of the Italian Ministry of Foreign Affairs. In particular, the required data are the following. Project identification code: PNRA16_00099. Name of the ethics committee or institutional review board: Italian Ministry of Foreign Affairs. Name of PNRA Ethics Referent: Carla Ubaldi, ENEA Antarctica, Technical Unit (UTA). Date of approval: 12 July 2017.

Informed Consent Statement

Not applicable.

Data Availability Statement

The data are contained within the article and Supplementary Materials.

Conflicts of Interest

The authors declare no conflict of interest.

References

  1. Lau, Y.-T.; Parker, S.K.; Near, T.J.; Detrich, H.W., 3rd. Evolution and function of the globin intergenic regulatory regions of the antarctic dragonfishes (Notothenioidei: Bathydraconidae). Mol. Biol. Evol. 2012, 29, 1071–1080. [Google Scholar] [CrossRef] [PubMed] [Green Version]
  2. Eastman, J.T. The nature of the diversity of Antarctic fishes. Polar Biol. 2005, 28, 93–107. [Google Scholar] [CrossRef]
  3. Daane, J.M.; Detrich, H.W., 3rd. Adaptations and Diversity of Antarctic Fishes: A Genomic Perspective. Annu. Rev. Anim. Biosci. 2022, 10, 39–62. [Google Scholar] [CrossRef] [PubMed]
  4. Santovito, G.; Piccinni, E.; Boldrin, F.; Irato, P. Comparative study on metal homeostasis and detoxification in two Antarctic teleosts. Comp. Biochem. Physiol. C 2012, 155, 580–586. [Google Scholar] [CrossRef]
  5. Welker, A.F.; Moreira, D.C.; Campos, É.G.; Hermes-Lima, M. Role of redox metabolism for adaptation of aquatic animals to drastic changes in oxygen availability. Comp. Biochem. Physiol. A 2013, 165, 384–404. [Google Scholar] [CrossRef]
  6. Ricci, F.; Lauro, F.M.; Grzymski, J.J.; Read, R.; Bakiu, R.; Santovito, G.; Luporini, P.; Vallesi, A. The Anti-Oxidant Defense System of the Marine Polar Ciliate Euplotes nobilii: Characterization of the MsrB Gene Family. Biology 2017, 6, 4. [Google Scholar] [CrossRef] [Green Version]
  7. Bargagli, R.; Nelli, L.; Ancora, S.; Focardi, S. Elevated cadmium accumulation in marine organisms from Terra Nova Bay (Antarctica). Polar Biol. 1996, 16, 513–520. [Google Scholar] [CrossRef]
  8. Santovito, G.; Piccinni, E.; Irato, P. An Improved Method for Rapid Determination of the Reduced and Oxidized States of Metallothioneins in Biological Samples; Nova Science Publishers Inc.: New York, NY, USA, 2008; pp. 101–124. [Google Scholar]
  9. Kägi, J.H. Overview of metallothionein. Methods Enzymol. 1991, 205, 613–626. [Google Scholar] [CrossRef]
  10. You, C.; Mackay, E.A.; Gehrig, P.M.; Hunziker, P.E.; Kägi, J.H. Purification and characterization of recombinant Caenorhabditis elegans metallothionein. Arch. Biochem. Biophys. 1999, 372, 44–52. [Google Scholar] [CrossRef]
  11. Formigari, A.; Boldrin, F.; Santovito, G.; Cassidy-Hanley, D.; Clark, T.G.; Piccinni, E. Functional characterization of the 5′-upstream region of MTT5 metallothionein gene from Tetrahymena thermophila. Protist 2010, 161, 71–77. [Google Scholar] [CrossRef]
  12. Santovito, G.; Trentin, E.; Gobbi, I.; Bisaccia, P.; Tallandini, L.; Irato, P. Non-enzymatic antioxidant responses of Mytilus galloprovincialis: Insights into the physiological role against metal-induced oxidative stress. Comp. Biochem. Physiol. C 2021, 240, 108909. [Google Scholar] [CrossRef] [PubMed]
  13. Knapen, D.; Redeker, E.S.; Inacio, I.; De Coen, W.; Verheyen, E.; Blust, R. New metallothionein mRNAs in Gobio gobio reveal at least three gene duplication events in cyprinid metallothionein evolution. Comp. Biochem. Physiol. Part C Toxicol. Pharmacol. 2005, 140, 347–355. [Google Scholar] [CrossRef] [PubMed]
  14. Capasso, C.; Carginale, V.; Crescenzi, O.; Di Maro, D.; Parisi, E.; Spadaccini, R.; Temussi, P.A. Solution structure of MT_nc, a novel metallothionein from the Antarctic fish Notothenia coriiceps. Structure 2003, 11, 435–443. [Google Scholar] [CrossRef] [Green Version]
  15. Ferro, D.; Bakiu, R.; De Pittà, C.; Boldrin, F.; Cattalini, F.; Pucciarelli, S.; Miceli, C.; Santovito, G. Cu, Zn superoxide dismutases from Tetrahymena thermophila: Molecular evolution and gene expression of the first line of antioxidant defenses. Protist 2015, 166, 131–145. [Google Scholar] [CrossRef] [PubMed]
  16. Piva, E.; Schumann, S.; Dotteschini, S.; Brocca, G.; Radaelli, G.; Marion, A.; Irato, P.; Bertotto, D.; Santovito, G. Antioxidant Responses Induced by PFAS Exposure in Freshwater Fish in the Veneto Region. Antioxidants 2022, 11, 1115. [Google Scholar] [CrossRef]
  17. Rozewicki, J.; Li, S.; Amada, K.M.; Standley, D.M.; Katoh, K. MAFFT-DASH: Integrated protein sequence and structural alignment. Nucleic Acids Res. 2019, 47, W5–W10. [Google Scholar] [CrossRef] [PubMed]
  18. Zeng, L.; Wang, J.; Sheng, J.; Gu, Q.; Hong, Y. Molecular characteristics of mitochondrial DNA and phylogenetic analysis of the loach (Misgurnus anguillicaudatus) from the Poyang Lake. Mitochondrial DNA 2012, 23, 187–200. [Google Scholar] [CrossRef]
  19. Balushkin, A.V. Morphology, classification, and evolution of notothenioid fishes of the Southern Ocean (Notothenioidei, Perciformes). J. Ichthyol. 2000, 40, 74–109. [Google Scholar]
  20. Darriba, D.; Posada, D.; Kozlov, A.M.; Stamatakis, A.; Morel, B.; Flouri, T. ModelTest-NG: A New and Scalable Tool for the Selection of DNA and Protein Evolutionary Models. Mol. Biol. Evol. 2020, 37, 291–294. [Google Scholar] [CrossRef] [Green Version]
  21. Bazinet, A.L.; Zwickl, D.J.; Cummings, M.P. A Gateway for phylogenetic analysis powered by grid computing featuring GARLI 2.0. Syst. Biol. 2014, 63, 812–818. [Google Scholar] [CrossRef] [Green Version]
  22. Rédei, G.P. PAUP (phylogenetic analysis using parsimony). In Encyclopedia of Genetics, Genomics, Proteomics and Informatics; Springer: Dordrecht, The Netherlands, 2008; pp. 23–77. [Google Scholar] [CrossRef]
  23. Ronquist, F.; Teslenko, M.; Van der Mark, P.; Ayres, D.L.; Darling, A.; Höhna, S.; Larget, B.; Liu, L.; Suchard, M.A.; Huelsenbeck, J.P. MrBayes 3.2: Efficient Bayesian phylogenetic inference and model choice across a large model space. Syst. Biol. 2012, 61, 539–542. [Google Scholar] [CrossRef] [Green Version]
  24. Bouckaert, R.; Heled, J.; Kühnert, D.; Vaughan, T.; Wu, C.-H.; Xie, D.; Suchard, M.A.; Rambaut, A.; Drummond, A.J. BEAST 2: A software platform for Bayesian evolutionary analyses. PLoS Comput. Biol. 2014, 10, e1003537. [Google Scholar] [CrossRef] [PubMed] [Green Version]
  25. Drummond, A.J.; Rambaut, A. BEAST: Bayesian evolutionary analysis by sampling trees. BMC Evol. Biol. 2007, 7, 214. [Google Scholar] [CrossRef] [PubMed] [Green Version]
  26. Nylander, J.A.; Wilgenbusch, J.C.; Warren, D.L.; Swofford, D.L. AWTY (are we there yet?): A system for graphical exploration of MCMC convergence in Bayesian phylogenetics. Bioinformatics 2008, 24, 581–583. [Google Scholar] [CrossRef] [Green Version]
  27. Yang, Z. PAML 4: Phylogenetic analysis by maximum likelihood. Mol. Biol. Evol. 2007, 24, 1586–1591. [Google Scholar] [CrossRef] [PubMed] [Green Version]
  28. Yang, Z.; Nielsen, R. Codon-substitution models for detecting molecular adaptation at individual sites along specific lineages. Mol. Biol. Evol. 2002, 19, 908–917. [Google Scholar] [CrossRef] [Green Version]
  29. Scheffler, K.; Martin, D.P.; Seoighe, C. Robust inference of positive selection from recombining coding sequences. Bioinformatics 2006, 22, 2493–2499. [Google Scholar] [CrossRef] [PubMed] [Green Version]
  30. Graur, D.; Li, W. Fundamentals of Molecular Evolution, 2nd ed.; Sinauer Ass. Inc.: Sunderland, UK, 2000. [Google Scholar]
  31. Pond, S.L.; Frost, S.D. Datamonkey: Rapid detection of selective pressure on individual sites of codon alignments. Bioinformatics 2005, 21, 2531–2533. [Google Scholar] [CrossRef] [Green Version]
  32. Dettai, A.; Berkani, M.; Lautredou, A.C.; Couloux, A.; Lecointre, G.; Ozouf-Costaz, C.; Gallut, C. Tracking the elusive monophyly of nototheniid fishes (Teleostei) with multiple mitochondrial and nuclear markers. Mar. Genom. 2012, 8, 49–58. [Google Scholar] [CrossRef]
  33. Near, T.J.; MacGuigan, D.J.; Parker, E.; Struthers, C.D.; Jones, C.D.; Dornburg, A. Phylogenetic analysis of Antarctic notothenioids illuminates the utility of RADseq for resolving Cenozoic adaptive radiations. Mol. Phylogenet. Evol. 2018, 129, 268–279. [Google Scholar] [CrossRef]
  34. Bargelloni, L.; Scudiero, R.; Parisi, E.; Carginale, V.; Capasso, C.; Patarnello, T. Metallothioneins in antarctic fish: Evidence for independent duplication and gene conversion. Mol. Biol. Evol. 1999, 16, 885–897. [Google Scholar] [CrossRef] [PubMed] [Green Version]
  35. Chatzidimitriou, E.; Bisaccia, P.; Corrà, F.; Bonato, M.; Irato, P.; Manuto, L.; Toppo, S.; Bakiu, R.; Santovito, G. Copper/zinc superoxide dismutase from the crocodile icefish Chionodraco hamatus: Antioxidant defense at constant sub-zero temperature. Antioxidants 2020, 9, 325. [Google Scholar] [CrossRef] [PubMed] [Green Version]
  36. Anderson, J.B.; Shipp, S.S.; Lowe, A.L.; Wellner, J.S.; Mosola, A.B. The Antarctic ice sheet during the last glacial maximum and its subsequent retreat history: A review. Quat. Sci. Rev. 2002, 21, 49–70. [Google Scholar] [CrossRef]
  37. Cheng, C.H.; Chen, L.; Near, T.J.; Jin, Y. Functional antifreeze glycoprotein genes in temperate-water New Zealand nototheniid fish infer an Antarctic evolutionary origin. Mol. Biol. Evol. 2003, 20, 1897–1908. [Google Scholar] [CrossRef] [Green Version]
  38. Eastman, J.; Eakin, R. Checklist of the species of notothenioid fishes. Antarct. Sci. 2021, 33, 273–280. [Google Scholar] [CrossRef]
  39. Near, T.; Dornburg, A.; Harrington, R.; Oliveira, C.; Pietsch, T.; Thacker, C.; Satoh, T.; Katayama, E.; Wainwright, P.; Eastman, J.T.; et al. Identification of the notothenioid sister lineage illuminates the biogeographic history of an Antarctic adaptive radiation. BMC Evol. Biol. 2015, 15, 109. [Google Scholar] [CrossRef] [Green Version]
  40. Pollard, D.A.; Iyer, V.N.; Moses, A.M.; Eisen, M.B. Widespread discordance of gene trees with species tree in Drosophila: Evidence for incomplete lineage sorting. PLoS Genet. 2006, 2, e173. [Google Scholar] [CrossRef] [Green Version]
  41. Østbye, T.-K.K.; Wetten, O.F.; Tooming-Klunderud, A.; Jakobsen, K.S.; Yafe, A.; Etzioni, S.; Moen, T.; Andersen, Ø. Myostatin (MSTN) gene duplications in Atlantic salmon (Salmo salar): Evidence for different selective pressure on teleost MSTN-1 and -2. Gene 2007, 403, 159–169. [Google Scholar] [CrossRef]
  42. Römisch, K.; Matheson, T. Cell biology in the Antarctic: Studying life in the freezer. Nat. Cell Biol. 2003, 5, 3–6. [Google Scholar] [CrossRef]
  43. Varriale, S.; Ferraresso, S.; Giacomelli, S.; Coscia, M.R.; Bargelloni, L.; Oreste, U. Evolutionary analysis of Antarctic teleost Toll-like receptor 2. Fish Shellfish Immunol. 2012, 33, 1076–1085. [Google Scholar] [CrossRef]
  44. Santovito, G.; Marino, S.; Sattin, G.; Cappellini, R.; Bubacco, L.; Beltramini, M. Cloning and characterization of cytoplasmic carbonic anhydrase from gills of four Antarctic fish: Insights into the evolution of fish carbonic anhydrase and cold adaptation. Polar Biol. 2012, 35, 1587–1600. [Google Scholar] [CrossRef]
  45. Sattin, G.; Bakiu, R.; Tolomeo, A.M.; Carraro, A.; Coppola, D.; Ferro, D.; Patarnello, T.; Santovito, G. Characterization and expression of a new cytoplasmic glutathione peroxidase 1 gene in the Antarctic fish Trematomus bernacchii. Hydrobiologia 2015, 761, 363–372. [Google Scholar] [CrossRef]
  46. Tolomeo, A.M.; Carraro, A.; Bakiu, R.; Toppo, S.; Place, S.P.; Ferro, D.; Santovito, G. Peroxiredoxin 6 from the Antarctic emerald rockcod: Molecular characterization of its response to warming. J. Comp. Physiol. B 2016, 186, 59–71. [Google Scholar] [CrossRef]
  47. Tolomeo, A.M.; Carraro, A.; Bakiu, R.; Toppo, S.; Garofalo, F.; Pellegrino, D.; Gerdol, M.; Ferro, D.; Place, S.P.; Santovito, G. Molecular Characterization of Novel Mitochondrial Peroxiredoxins from the Antarctic Emerald Rockcod and Their Gene Expression in Response to Environmental Warming. Comp. Biochem. Physiol. Part C Toxicol. Pharmacol. 2019, 225, 108580. [Google Scholar] [CrossRef] [PubMed]
  48. Ohno, S. Gene duplication and the uniqueness of vertebrate genomes circa 1970–1999. Semin. Cell Dev. Biol. 1999, 10, 517–522. [Google Scholar] [CrossRef]
  49. Stanley Kim, H.; Yu, Y.; Snesrud, E.C.; Moy, L.P.; Linford, L.D.; Haas, B.J.; Nierman, W.C.; Quackenbush, J. Transcriptional divergence of the duplicated oxidative stress-responsive genes in the Arabidopsis genome. Plant J. 2005, 41, 212–220. [Google Scholar] [CrossRef]
  50. Carnera, M.; Schumann, S.; Irato, P.; Santovito, G. Metallothionein gene expression in Trematomus eulepidotus as a response to environmental variation of metal ion con-centrations. ISJ–Invertebr. Surviv. J. 2021, 19, 81. [Google Scholar]
  51. Cheng, C.H.; Detrich, H.W., 3rd. Molecular ecophysiology of Antarctic notothenioid fishes. Philos. Trans. R Soc. Lond. B Biol. Sci. 2007, 362, 2215–2232. [Google Scholar] [CrossRef] [Green Version]
  52. Bell, S.G.; Vallee, B.L. The metallothionein/thionein system: An oxidoreductive metabolic zinc link. ChemBioChem 2009, 10, 55–62. [Google Scholar] [CrossRef]
  53. Kornegay, J.R.; Schilling, J.W.; Wilson, A.C. Molecular adaptation of a leaf-eating bird: Stomach lysozyme of the hoatzin. Mol. Biol. Evol. 1994, 11, 921–928. [Google Scholar] [CrossRef] [Green Version]
  54. Sidell, B.D. Life at body temperatures below 0 degrees C: The physiology and biochemistry of Antarctic fishes. Gravit. Space Biol. Bull. 2000, 13, 25–34. [Google Scholar] [PubMed]
  55. Ferro, D.; Franchi, N.; Bakiu, R.; Ballarin, L.; Santovito, G. Molecular characterization and metal induced gene expression of the novel glutathione peroxidase 7 from the chordate invertebrate Ciona robusta. Comp. Biochem. Physiol. Part C Toxicol. Pharmacol. 2018, 205, 1–7. [Google Scholar] [CrossRef] [PubMed]
  56. Irato, P.; Piccinni, E.; Cassini, A.; Santovito, G. Antioxidant responses to variations in dissolved oxygen of Scapharca inaequivalvis and Tapes philippinarum, two bivalve species from the lagoon of Venice. Mar. Pollut. Bull. 2007, 54, 1020–1030. [Google Scholar] [CrossRef] [PubMed]
  57. Ferro, D.; Franchi, N.; Mangano, V.; Bakiu, R.; Cammarata, M.; Parrinello, N.; Santovito, G.; Ballarin, L. Characterization and metal-induced gene transcription of two new copper zinc superoxide dismutases in the solitary ascidian Ciona intestinalis. Aquat. Toxicol. 2013, 140–141, 369–379. [Google Scholar] [CrossRef]
  58. Franchi, N.; Piccinni, E.; Ferro, D.; Basso, G.; Spolaore, B.; Santovito, G.; Ballarin, L. Characterization and transcription studies of a phytochelatin synthase gene from the solitary tunicate Ciona intestinalis exposed to cadmium. Aquat. Toxicol. 2014, 152, 47–56. [Google Scholar] [CrossRef] [PubMed]
  59. Ferro, K.; Ferro, D.; Corrà, F.; Bakiu, R.; Santovito, G.; Kurtz, J. Cu, Zn Superoxide Dismutase Genes in Tribolium castaneum: Evolution, Molecular Characterisation, and Gene Expression during Immune Priming. Front. Immunol. 2017, 8, 1811. [Google Scholar] [CrossRef] [PubMed] [Green Version]
  60. Bakiu, R.; Pacchini, S.; Piva, E.; Schumann, S.; Tolomeo, A.M.; Ferro, D.; Irato, P.; Santovito, G. Metallothionein expression as a physiological response against metal toxicity in the striped rockcod Trematomus hansoni. Int. J. Mol. Sci. 2022, 23, 12799. [Google Scholar] [CrossRef]
  61. Barreau, C.; Paillard, L.; Osborne, H.B. AU-rich elements and associated factors: Are there unifying principles? Nucleic Acids Res. 2006, 33, 7138–7150. [Google Scholar] [CrossRef] [Green Version]
  62. Boldrin, F.; Santovito, G.; Formigari, A.; Bisharyan, Y.; Cassidy-Hanley, D.; Clark, T.G.; Piccinni, E. MTT2, a copper inducible metallothionein gene from Tetrahymena thermophila. Comp. Biochem. Physiol. C 2008, 147, 232–240. [Google Scholar] [CrossRef]
  63. Franchi, N.; Ferro, D.; Ballarin, L.; Santovito, G. Transcription of genes involved in glutathione biosynthesis in the solitary tunicate Ciona intestinalis exposed to metals. Aquat. Toxicol. 2012, 114–115, 14–22. [Google Scholar] [CrossRef]
  64. Santovito, G.; Boldrin, F.; Irato, P. Metal and metallothionein distribution in different tissues of the Mediterranean clam Venerupis philippinarum during copper treatment and detoxification. Comp. Biochem. Physiol. Part C Toxicol. Pharmacol. 2015, 174–175, 46–53. [Google Scholar] [CrossRef] [PubMed]
  65. Buchmann, K.; Pedersen, K. A study on teleost phylogeny using specific antisera. J. Fish Biol. 1994, 45, 901–903. [Google Scholar] [CrossRef]
  66. Arnold, M.L.; Fogarty, N.D. Reticulate Evolution and Marine Organisms: The Final Frontier? Int. J. Mol. Sci. 2009, 10, 3836–3860. [Google Scholar] [CrossRef] [PubMed]
  67. van Herwerden, L.; Choat, J.H.; Dudgeon, C.L.; Carlos, G.; Newman, S.J.; Frisch, A.; van Oppen, M. Contrasting patterns of genetic structure in two species of the coral trout Plectropomus (Serranidae) from east and west Australia: Introgressive hybridisation or ancestral polymorphisms. Mol. Phylogenet. Evol. 2006, 41, 420–435. [Google Scholar] [CrossRef] [PubMed]
  68. Marie, A.D.; Van Herwerden, L.; Choat, J.H.; Hobbs, J.P. Hybridization of Reef Fishes at the Indo-Pacific Biogeographic Barrier: A Case Study. Coral Reefs 2007, 26, 841–850. [Google Scholar] [CrossRef]
  69. Marrone, A.; La Russa, D.; Brunelli, E.; Santovito, G.; La Russa, M.F.; Barca, D.; Pellegrino, D. Antarctic Fish as a Global Pollution Sensor: Metals Biomonitoring in a Twelve-Year Period. Front. Mol. Biosci. 2021, 8, 794946. [Google Scholar] [CrossRef]
Figure 1. The summarized phylogenetic tree resulting from maximum likelihood and Bayesian analyses of the MT coding sequences dataset. The final maximum-likelihood score in GARLI 2.0 was −602.9773. Parameters of the general time-reversible model (GTR) in GARLI 2.0 were R (a) AC = 0.529, R (b) AG = 1.079, R (c) AT = 0.654, R (d) CG = 0.410, R (e) CT = 2.102, R (f) GT = 1.000 with frequency of nucleotides A = 0.2517, C = 0.2839, G = 0.3052, and T = 0.1592, proportion of invariant sites = 0.3870, and the alfa shape parameter = 0.7061. In Mr. Bayes the total arithmetic mean of likelihood score was −736.27 and in BEAST it was −663.9142. The Hasegawa-Kishino-Yano model was used in all the Bayesian analyses (Mr. Bayes and Beast, respectively). Numbers on branches indicate Bayesian posterior probability values of BEAST (left) and Mr. Bayes (middle) phylogenetic trees, and bootstrap values of GARLI (right) tree. Species for which MTs sequences were characterized in this study are indicated in bold. The time scale (MYA) was shown below the tree.
Jmse 10 01592 g001
Figure 2. The summarized phylogenetic tree resulted from the analyses of the 3′-UTR sequence dataset. The final maximum-likelihood score in GARLI 2.0 was −1217.6322. Parameters of the GTR model were R (a) AC = 1.816, R (b) AG = 2.592, R (c) AT = 0.765, R (d) CG = 2.267, R (e) CT = 2.089, R (f) GT = 1.000 with frequency of nucleotides A = 0.2491, C = 0.1613, G = 0.1911, T = 0.3985, proportion of invariant sites = 0, and the alfa shape parameter = 17.8219. The mean likelihood score was −1422.26 in Mr. Bayes and BEAST it was −1421.8701. Numbers on branches indicate the Bayesian posterior probability values of BEAST (left) and Mr. Bayes (middle) phylogenetic trees, and bootstrap values of GARLI (right) tree. Species for which MTs sequences were characterized in this study are indicated in bold. The time scale (MYA) is shown below the tree.
Jmse 10 01592 g002
Figure 3. The phylogenetic tree resulting from maximum likelihood and Bayesian analyses of the 5′-UTR sequence dataset. The final maximum-likelihood score in GARLI 2.0 was −782.4569. Parameters of the GTR model were R (a) AC = 8.617, R (b) AG = 60.968, R (c) AT = 9.878, R (d) CG = 31.228, R (e) CT = 50.333, R (f) GT = 1.000 with frequency of nucleotides A = 0.3865, C = 0.2830, G = 0.1729, T = 0.1577, proportion of invariant sites = 0, and the alfa shape parameter = 19.2560. In Mr. Bayes the total arithmetic mean of the likelihood score was −864.40 and in BEAST the mean of the likelihood score was −861.0788. Numbers on branches indicate Bayesian posterior probability values of BEAST (left) and Mr. Bayes (middle) phylogenetic trees, and bootstrap values of GARLI (right) tree. Species for which MTs sequences were characterized in this study are indicated in bold. The time scale (MYA) is shown below the tree.
Jmse 10 01592 g003
Table 1. Parameter estimated under models of variable ω ratio (ω = dN/dS) among lineages and sites for each model of codon frequencies (F3 × 4 and F61). LRTs of the model fit the MT-1 and MT-2 genes and their corresponding probability value (P) are also shown for the relative degree of freedom (d.f.) value. The tree length (L) is the expected number of substitutions per site along all branches in the phylogeny, calculated as the sum of the branch lengths.
ModelsCodon Frequency Models d.f.
F3 × 4F61
ω1ω2ω3ω4LLRTPω1ω2ω3ω4LLRTP
H0: ω1 = ω2 = ω3 = ω40.09720.09720.09720.09721.45810.16700.16700.16700.16701.6008
H1: ω1 = ω2 = ω3 ≠ ω40.10440.10440.10440.00011.46150.28430.59390.18110.18110.18110.00011.58484.29760.03821
H2: ω1 = ω2 ≠ ω3 = ω40.09530.09530.10170.10171.45980.01510.90220.15960.15960.18600.18601.60581.31370.25171
H3: ω1 ≠ ω2 ≠ ω3 = ω40.04460.12130.12740.12741.44292.90850.08810.07240.21500.21860.21861.58894.30210.03811
Table 2. LRT of comparison of site models (neutral versus selection) and their corresponding probability value (P) for the relative degree of freedom (d.f) values.
Models ComparedCodon Frequency Modelsd.f.
F3 × 4F61
LRTPLRTP
M0 vs. M328.1828<0.0000117.87920.00134
M1 vs. M23.63760.16220.24210.88602
M7 vs. M82.53570.28141.38290.36792
Table 3. MT amino acidic sites under negative selection were identified by different methods. The normalized score value (E[dN-dS]) was estimated for each of the negatively selected amino acidic sites by the different ML methods. The statistical significance is given by the probability value (P) and in the REL method by the Bayesian posterior probability. Clades indicate the clusters with negative selection operating on the negatively selected amino acidic sites; O = outgroup species metallothioneins, A = both Antarctic species metallothioneins, A1 = Antarctic species MT-1 and A2 = Antarctic species MT-2.
Amino AcidCodonCodon ChangeNumber of Parallel ChangesNumber of Convergent ChangesMaximum Likelihood MethodClade
SLACFELREL
Normalized E[dN-dS]PNormalized E[dN-dS]PNormalized E[dN-dS]Posterior ProbabilityBayes Factor
Asp2GAT—GAC31−16.15400.0010−4.15100.0030−2.35120.9989221.0540O, A
Pro3CCC(G)—CCT41−11.91600.0040−7.0040<0.0001−2.7068111,742.7000O, A1
Lys8AAA—AAG02−14.15700.0060−26.0830<0.0001−4.58430.99981359.5700A1
Cys47TGC—TGT50−20.1930<0.0001−19.9510<0.0001−4.9403126,838.5000O, A
Lys52AAG—AAA20−9.40700.0330−10.45400.0020−3.08280.996874.4374O, A2
Publisher’s Note: MDPI stays neutral with regard to jurisdictional claims in published maps and institutional affiliations.

