Article

All-In-One: Microbial Response to Natural and Anthropogenic Forcings in a Coastal Mediterranean Ecosystem, the Syracuse Bay (Ionian Sea, Italy)

1
National Research Council (CNR), Institute of Polar Sciences (ISP), Spianata S. Raineri, 86, 98122 Messina, Italy
2
National Research Council (CNR), Institute of Biological Resources and Marine Biotechnologies (IRBIM), Spianata S. Raineri, 86, 98122 Messina, Italy
3
National Research Council (CNR), Institute of Polar Sciences (ISP), Via P. Gobetti, 101, 40129 Bologna, Italy
4
Chinese Academy of Sciences (CAS), Institute of Hydrobiology, Donghu South Road, 7, Wuchang District, Wuhan 430072, China
*
Author to whom correspondence should be addressed.
J. Mar. Sci. Eng. 2022, 10(1), 19; https://doi.org/10.3390/jmse10010019
Submission received: 30 November 2021 / Revised: 20 December 2021 / Accepted: 23 December 2021 / Published: 26 December 2021

Abstract

:
Bacterial and phytoplankton communities are known to be in close relationships, but how natural and anthropogenic stressors can affect their dynamics is not fully understood. To study the response of microbial communities to environmental and human-induced perturbations, phytoplankton and bacterial communities were seasonally monitored in a Mediterranean coastal ecosystem, Syracuse Bay, where multiple conflicts co-exist. Quali-quantitative, seasonal surveys of the phytoplankton communities (diatoms, dinoflagellates and other taxa), the potential microbial enzymatic activity rates (leucine aminopeptidase, beta-glucosidase and alkaline phosphatase) and heterotrophic culturable bacterial abundance, together with the thermohaline structure and trophic status in terms of nutrient concentrations, phytoplankton biomass (as Chlorophyll-a), and total suspended and particulate organic matter, were carried out. The aim was to integrate microbial community dynamics in the context of the environmental characterization and disentangle microbial patterns related to natural changes from those driven by the anthropic impact on this ecosystem. In spite of the complex relationships between the habitat characteristics, microbial community abundance and metabolic potential, in Syracuse Bay, the availability of organic substrates differently originated by the local conditions appeared to drive the distribution and activity of microbial assemblage. A seasonal pattern of microbial abundances was observed, with the highest concentrations of phytoplankton in spring and low values in winter, whereas heterotrophic bacteria were more abundant during the autumn period. The autumn peaks of the rates of enzymatic activities suggested that not only phytoplankton-derived but also allochthonous organic polymers strongly stimulated microbial metabolism. Increased microbial response in terms of abundance and metabolic activities was detected especially at the sites directly affected by organic matter inputs related to agriculture or aquaculture activities. Nitrogen salts such as nitrate, rather than orthophosphate, were primary drivers of phytoplankton growth. This study also provides insights on the different seasonal scenarios of water quality in Syracuse Bay, which could be helpful for management plans of this Mediterranean coastal environment.

1. Introduction

Coastal aquatic environments are extremely vulnerable areas due to the presence of multiple interacting forcings, both natural and anthropogenic, that occur in these environments and that may affect the dynamics of marine biota [1,2]. Among human activities, maritime transport, tourism, as well as aquaculture and fishery may coexist both spatially and temporally in these areas and cause severe impacts such as pollution, biodiversity loss and habitat destruction. This justifies the need for coastal monitoring as a key tool to acquire updated information on the environmental status, also in relation with the new European environmental challenges mainly focused on the achievement of the Good Environmental Status (GES) [3].
Focusing our attention on the microbial communities, their responsiveness to forcings acting over the environment suggests their potential as bioindicators and sentinels of environmental changes, as underlined in several studies [4,5,6]. Indeed, microbial communities are capable of modifying their distribution and metabolism in response to the environmental perturbations they undergo and the information they can provide may find a practical application in environmental health preservation. Although the responsiveness of microbial communities to natural and anthropic-induced changes is well-known, only rarely abundance and metabolic potential of both phytoplankton and bacterial communities were considered to investigate the interactions among these two components also in relation to environmental variables. Phytoplankton is known to play a key role within the microbial loop, a trophic pathway of the marine food web responsible for the microbial assimilation of dissolved organic matter (DOM); phytoplankton-derived dissolved carbon represents an important trophic resource for heterotrophic bacteria that convert it into microbial biomass and further transfer towards higher trophic levels (zooplankton) through predation [7]. In nature, many complex interactions occur at different cellular levels among representatives belonging to different microbial species; this results in difficulties in estimating metabolic interactions among microorganisms, also in consideration that a large fraction of microbial diversity remains largely undiscovered in terms of metabolic needs and biosynthetic capabilities [8]. Different relationships such as mutualism and competition connect phytoplankton to bacterial species. Indeed, DOM released by diatoms represents the main trophic source for heterotrophic bacteria; on the other hand, diatoms and bacteria compete for several inorganic ions, such as inorganic phosphate [9,10]. Additionally, the physical attachment of bacteria to phytoplankton cells was shown to play a role in biogeochemical cycling in the ocean, favoring the sinking of organic matter and the overall increase in the flux of organic carbon from the surface to deep waters [11,12]. It has therefore become clear that phytoplankton–bacteria interactions occurring at the microscale can have ecosystem-level implications, affecting several processes involved in ecosystem functioning such as nutrient provision and regeneration, primary production, toxin biosynthesis and biogeochemical cycles [7,9,12].
The Syracuse Bay, located in the Ionian Sea along the SE coast of Sicily, provides a suitable example of a coastal Mediterranean ecosystem where multiple conflicts occur. This bay has a limited water exchange, a high nutrient supply from organic and inorganic sources and is characterized by evident eutrophic conditions with wide water discoloration events especially in the spring–summer period; a part of this bay is also used for productive activities such as shellfish farming. Moreover, particular interest was also directed to this area due to its frequent blooms of toxic algae (Harmful Algal Blooms, HABs) giving rise to recurrent dystrophic crises. Studies performed for more than a decade [13,14,15] have documented the occurrence of red tides phenomena, related to the massive proliferation of Alexandrium species, above all of A. minutum and other dinoflagellates. Depending on the specific hydrographic and topographic characteristics, the dynamics of these blooms may vary from site to site. The species success, timing and recurrence of blooms are also related to the interactions between life histories and the physical, chemical and biological environment. The bloom season of Alexandrium minutum generally falls between March and May [15], with maximum densities reaching a magnitude order of 106 cells L−1. During blooms, salinity may range from 30 to 35, temperature from 17 and 23 °C. Salinity variations are due to the influx of freshwater rich in nutrients.
A seasonal monitoring program was started in September 2018 in Syracuse Bay in the framework of the international project “Mechanisms of red tides and hypoxia as ecological marine disasters and technologies for its early warning along the “Belt and Road” Countries”, funded by the Ministry of Science and Technology (grant no. 2016YFE0202100). The main objectives of this research were: (i) to study the dynamics and mechanisms underlying HABs events in relation to environmental drivers, in order to propose strategies for early warning of their occurrence and environmental management; (ii) to disentangle the response of microbial communities to environmental and human-induced perturbations in a Mediterranean coastal area where multiple conflicts co-exist; (iii) to monitor phytoplankton blooms associated with water discoloration events and eventual hypoxic or anoxic conditions. Based on the past knowledge gained on the phytoplankton communities in this site, our working hypothesis was that the microbial community (phytoplankton and bacteria) could exhibit different dynamics over a medium-term (seasonal) timescale in response to natural versus anthropogenic forcings. In this scenario, the specific questions addressed in this survey were: (a) how the prokaryotic community abundance and metabolism do respond to anthropic or natural changes? (b) which are the main physical–chemical drivers of the microbial community in this highly dynamic ecosystem? (c) what are the biogeochemical implications of prokaryotic community dynamics in this ecosystem? To this end, the phytoplankton community was monitored with particular attention to toxic dinoflagellates such as Alexandrium species or high biomass producers (Prorocentrum, Lingulodinium, Gymnodinium spp.); contextually, the main environmental (temperature, salinity, dissolved oxygen, nutrients concentration, chlorophyll-a and particulate organic matter) and microbiological parameters (extracellular enzymatic activity rates: leucine aminopeptidase, beta-glucosidase, alkaline phosphatase, culturable heterotrophic bacteria) were determined.

2. Materials and Methods

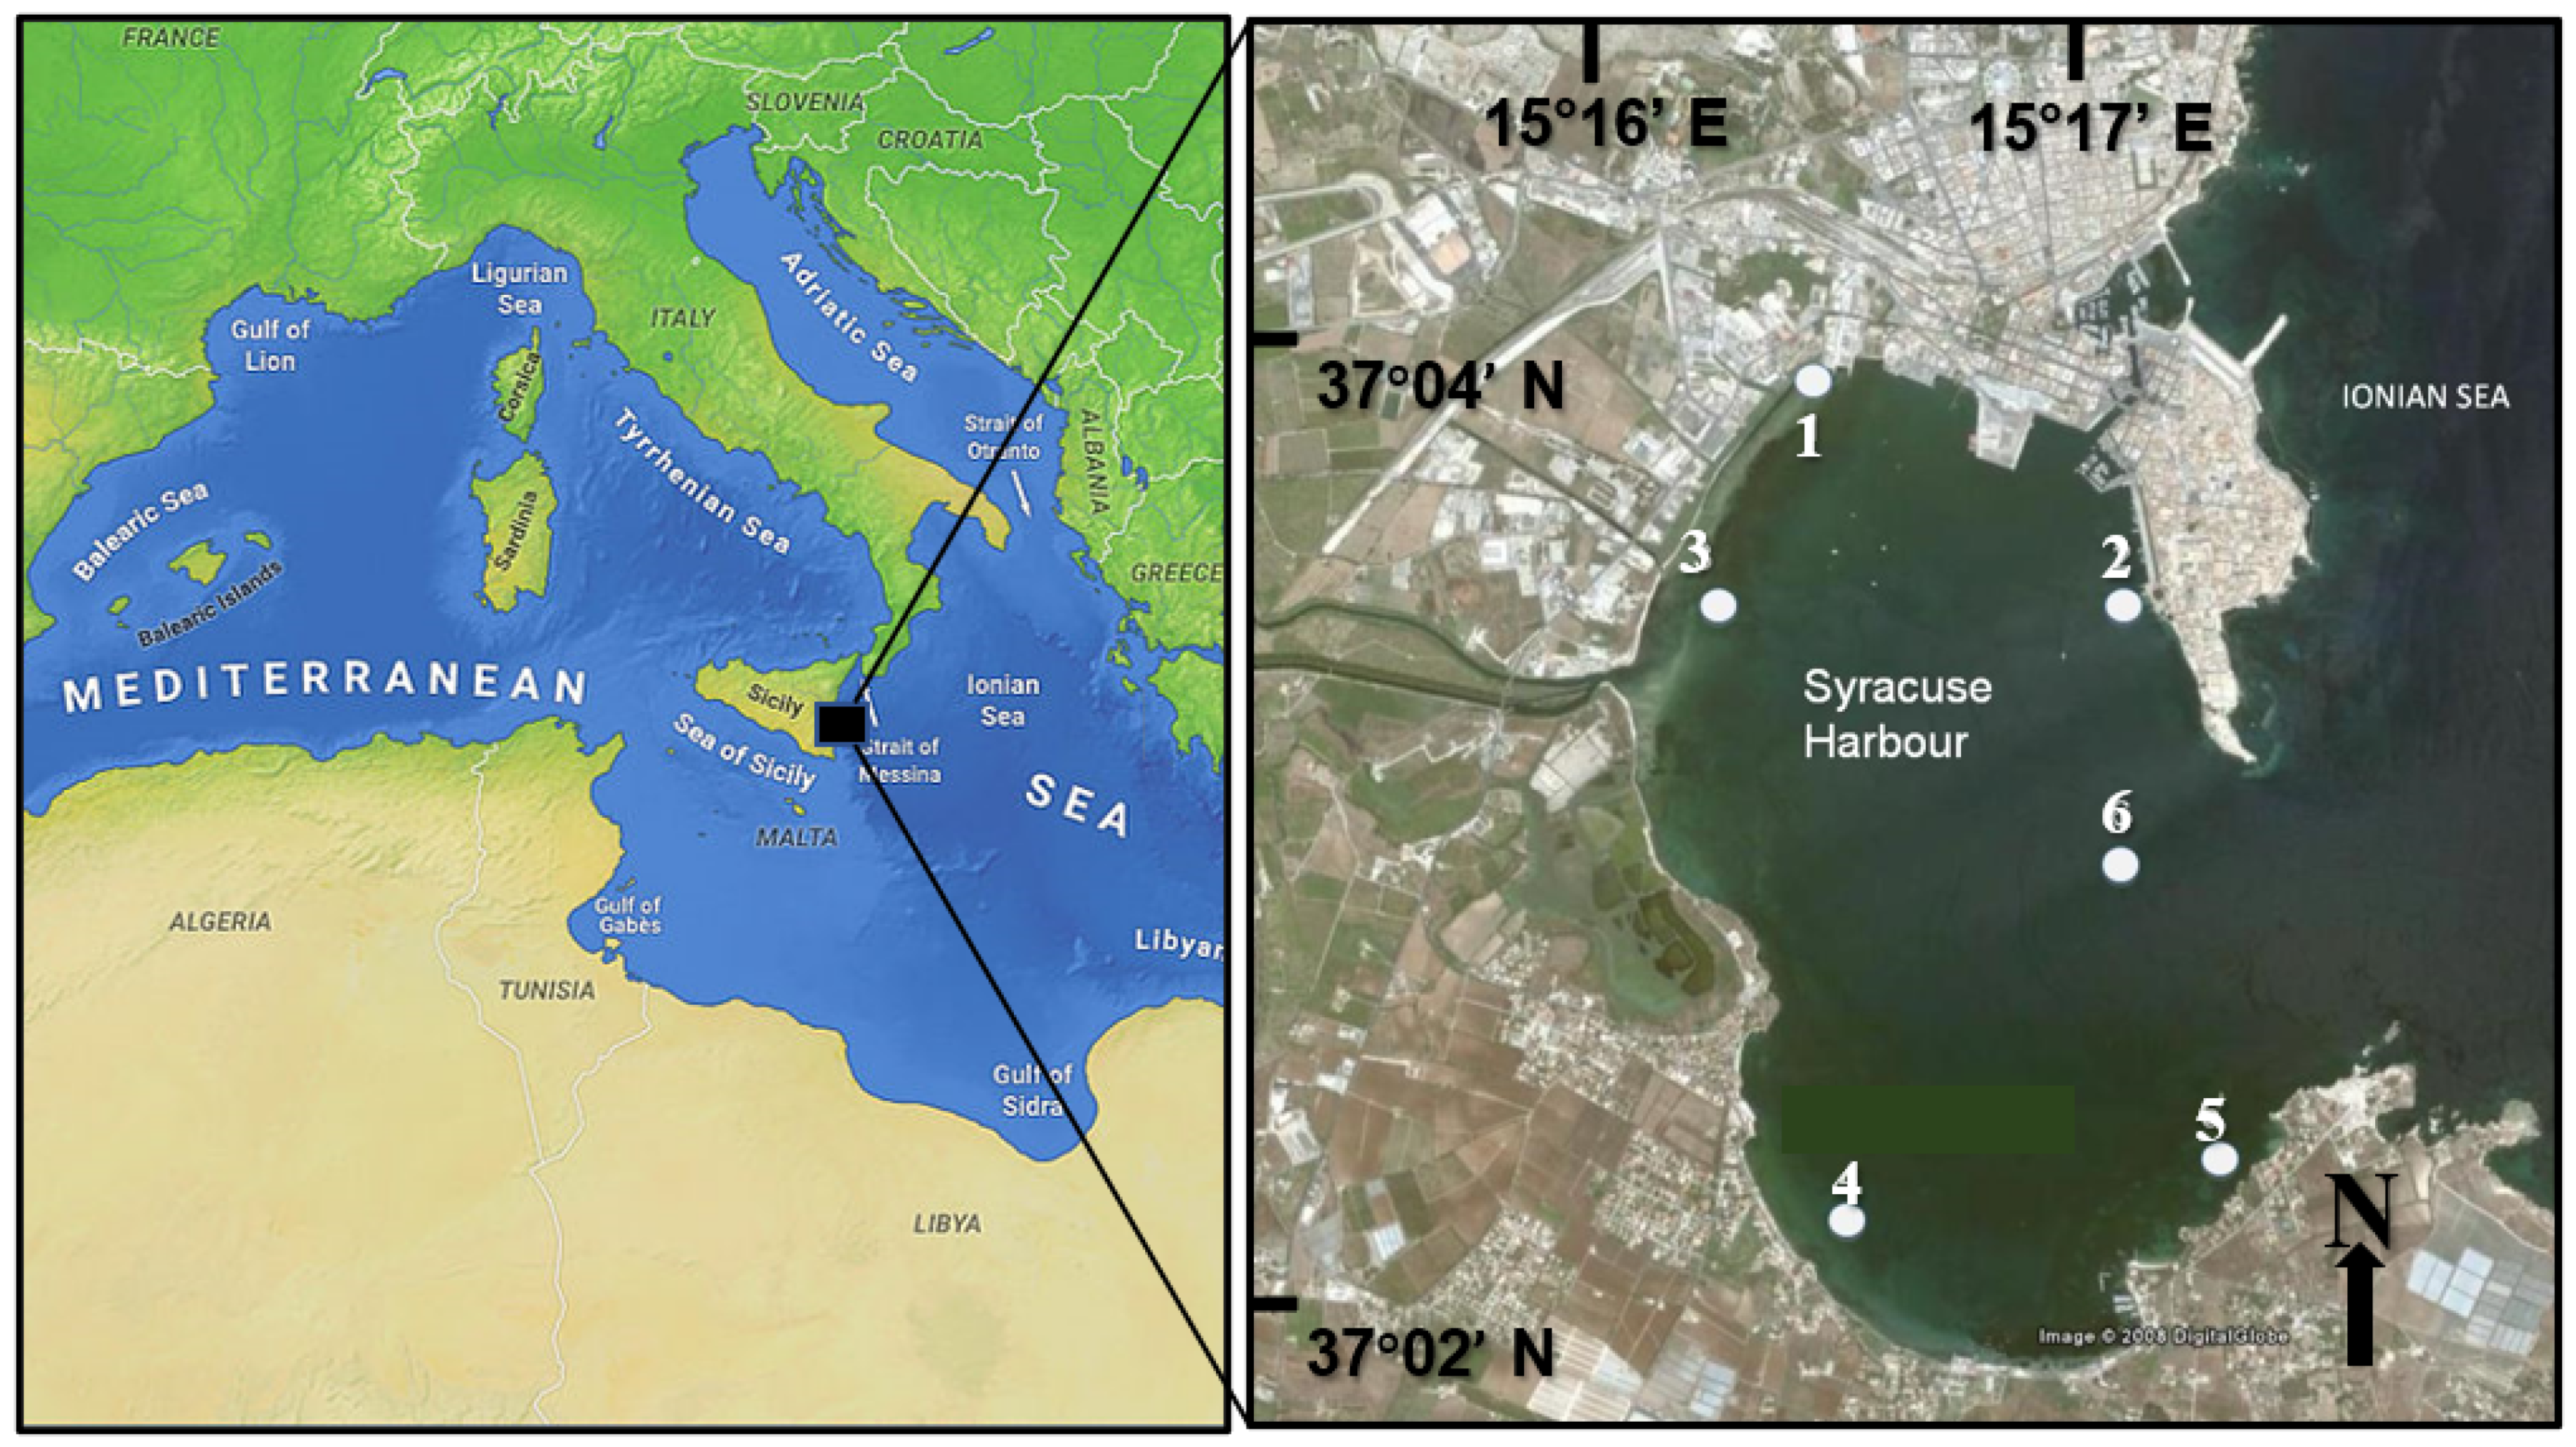
2.1. Site Description

Syracuse bay is a wide coastal area bounded on the north by the Ortigia island and on the south by the Maddalena peninsula (Figure 1). The bay measures ≈3.5 km along the NS axis, and ≈2.0 km along the EW axis (total extension ≈700 ha). Its average depth is 0.5–8 m at the sampling area and 25–30 m at the bay entrance. The bay (Porto Grande) is located close to the inner city and is subject to freshwater inputs (riverine and spring waters). Moreover, for about 20 years, the area receives urban discharge from the Syracuse town, amounting to 9 × 10⁶ m3 year−1 of purified sewage through the Grimaldi-Pantanelli canal [13].

2.2. Sample Collection

During the 2018–2021 period, eight seasonal samplings of surface waters (September 2018, May 2019, August 2019, November 2019, July 2020, October 2020, March 2021 and May 2021) were performed within Syracuse Bay in correspondence with six stations differently affected by natural or anthropic disturbances. The geographical coordinates and the main characteristics of the sampling stations are reported in Table 1.
Stations 1 and 4, located in correspondence of a shipyard and of a shellfish farming respectively, as well as Station 3, which is affected by the Anapo-Ciane river mouth draining the wastes of agriculture farming (i.e., residuals of fertilizers) were chosen as representative of exposure to anthropic impacts. Station 2 was also included in this study in relation to the natural forcings (i.e., freshwater inputs from the Aretusa springwater) which is exposed to. In addition, two stations (5 and 6), located in the part of the bay exchanging with the open sea were taken as control sites.
At Stations 1 and 4, additional samples were also taken at middle and bottom layers of the water column (2 and 4 m for Station 1, and 2 and 5 m for Station 4) (Figure 1).

2.3. Physical and Chemical Parameters

Temperature (T), salinity (S) and dissolved oxygen (DO) measurements were taken using an oceanographic multiparametric sensor (SBE 19 Plus). pH measurements were performed using a portable, waterproof pH-meter (Hanna Instruments LCD) for field measures, whereas water transparency was recorded through a Secchi disk.
Samples for ammonium (NH4), nitrite (NO2), nitrate (NO3) and orthophosphate (PO4) determinations were filtered using GF/F glass-fibre filters and kept frozen −20 °C. Analytical determinations were performed according to Strickland and Parsons [16], excepting NH4 that was measured according to Aminot and Chaussepied’s method [17].
Total nitrogen (TN) and total phosphorus (TP) samples were analyzed following persulfate digestion as described in Valderrama [18] and Koroleff [19,20]. Water samples for the dissolved total nitrogen (DTN) and phosphorus (DTP) were filtered and measured by the same methods as TN and TP. Dissolved inorganic nitrogen (DIN) was calculated from the sum NH4 + NO2 + NO3. Dissolved organic phosphorus (DOP) was calculated as the difference between DTP and PO4. Dissolved organic nitrogen (DON) was calculated as the difference between DTN and DIN. All nutrient concentrations were determined using a Varian Mod. Cary 50 spectrophotometer.
To assess any possible nutrient limitation of phytoplankton community, the Redfield ratio (N/P) as the DIN: PO4 ratio was also calculated.
Chlorophyll a (Chl a), particulate organic carbon and total particulate nitrogen (POC and TPN) were measured according to conventional methods in use at the CNR-ISP laboratory. Particularly water samples (0.5–1 L) for Chl a analysis were filtered through Whatman GF/F glass-fibre filters. After filtration, the obtained filters were immediately stored at −20 °C. The photosynthetic pigment was extracted in 90% acetone and read before and after acidification. Determinations were carried out with a Varian mod. Eclipse spectrofluorometer. The maximum excitation and emission (431 nm and 667 nm, respectively) were selected on a prescan with a solution of chlorophyll a from Anacystis nidulans (by Sigma Co., Saint Louis, MO, USA) and the concentrations of Chl a were calculated according to Lorenzen [21].
For the estimation of particulate organic carbon and total particulate nitrogen (POC and TPN), 500-mL water samples were concentrated on pre-combusted Whatman GF⁄F glass-fibre filters and processed at 980 °C in a Perkin–Elmer CHN-Autoanalyzer 2400, using acetanilide as standard [22]. Moreover, total suspended matter (TSM) was gravimetrically determined [16].

2.4. Trophic State Index (TSI) Calculation as an Index of Water Quality

As an additional parameter, the water quality of the entire Syracuse bay was classified in relation to its trophic status according to the Trophic State Index (TSI) value. This Index was calculated as the average TSI from the TSI (Chl a), TSI (TN) and TSI (TP) computed using the following equations for estuaries [23]:
TSI (Chl a) = 16.8 + 14.4 × LN (Chl a)
TSI (TN) = 56 + [19.8 × LN(TN)]
TSI (TP) = 18.6 × LN (TP × 1000) − 18.4
According to the average TSI, the water quality is classified to be “good” for values comprised from 0 to 49, “fair” for values from 50 to 59 and “poor” for values from 60 to 100.

2.5. Microbial Parameters

2.5.1. Extracellular Enzymatic Activities (Leucine Aminopeptidase, LAP, Beta-Glucosidase, Beta-GLU and Alkaline Phosphatase, AP)

Microbial ectoenzymatic activity measurements were performed to estimate the potential activity rates of leucine aminopeptidase (LAP), b-glucosidase (b-GLU) and alkaline phosphatase (AP), enzymes involved in the decomposition mediated by the microbial community of proteins, polysaccharides and organic phosphates respectively. The enzymatic assay relies on the hydrolysis of specific fluorogenic substrates, L-leucine-7 amido-4-methyl coumarin hydrochloride (Leu-MCA), 4-methylumbelliferyl-b-d-glucoside and methylumbelliferyl phosphate, respectively, that are derivatives of methylcoumarin (MCA) and of methylumbelliferone (MUF), following the method reported in Monticelli et al. [24]. Increasing amounts (from 20 to 400 μmol) of substrates were added to 10-mL subvolumes of water and spectrofluorometer measurements were performed at the initial time and after incubation at in situ temperature for 2 h. Through calibration with the standard curves obtained with known amounts of MCA for LAP and MUF for b-GLU and AP, the enzymatic values were expressed in terms of maximum velocity of hydrolysis (Vmax, in nmol of substrate hydrolyzed per liter and per h, nmol/L/h).

2.5.2. Culturable Heterotrophic Bacteria

To get better insights on the bacterial community actively interacting with the organic matter pool, in this study we estimated the abundance of heterotrophic culturable bacteria, that represent the most active fraction in the processing of organic polymers. This was determined on Marine agar plates seeded with appropriate volumes of seawater (0.1 mL and decimal dilutions in physiological saline). After incubation at 22 °C for 7 days [25], the number of growing colonies was counted and reported as Colony Forming Units per mL (CFU/mL).

2.5.3. Phytoplankton Samples

To evaluate phytoplankton abundance and species composition, 250 mL of surface seawater (according to Bužančić et al. [26]) were taken at each station by a Niskin bottle and fixed in dark, glass bottles with Lugol’s iodine solution (1% final v/v) to determine the abundance of the different phytoplankton taxa. At Stations 1 and 4, water samples collected from the middle and bottom layers of the water column were also analyzed. Additional samples from 20 μm-meshed, vertical net hauls were used for qualitative analyses that were conducted by using a Zeiss Axiovert 200 microscope equipped with phase contrast and epifluorescence, as well as AxioCam for photographs and measurements of cells.
Seawater samples collected for phytoplankton analysis were stored in the dark at 4 °C until analysis. Quantitative analyses were performed following the Utermöhl method [27], by settling 50 mL of sample or less, according to the cell concentrations, except in bloom occasions with exceptionally high abundances, when cell counts were made in a 1 mL-Sedgewick Rafter chamber. With the term “larger phytoplankton”, we considered the so-called “Utermöhl phytoplankton”, which includes mostly all micro-phytoplankton (size 20–200 μm) taxa recognizable in light microscopy (200×–400× magnification) and nano-phytoplankton (size 2–20 μm), analyzed at a magnification of 630×. All phytoplankton was counted over random fields (30–60); in addition, half of the Utermöhl chamber was also examined at a magnification of 200×, to obtain a more correct evaluation of less abundant taxa.

2.6. Statistical Analysis

During this study, a total of 80 data (n = 10 sampling points × 8 samplings) per each parameter were collected, which were all used to calculate the arithmetic mean and standard deviation as well as for Pearson correlation and multiple regression analyses. Conversely, all the other statistical tests were performed on the surface data only (n = 48) to better compare among the stations. Analysis of variance (ANOVA) test was used to identify possible significant differences due to the sampling stations and the time periods; a difference was considered significant at a p < 0.05 probability level. Prior to ANOVA, all variables were logarithmically transformed to comply with the assumption of normal distribution of the data. The one-way analysis of variance on ranks (Kruskall–Wallis analysis) was applied to variables that were not normally distributed. The relative importance of each group was investigated by a pairwise multiple comparison procedure (Dunn’s method). All these analyses were performed with the Sigma Stat software version 3.1 (SYSTAT Software, Inc., San Jose, CA, USA).
Pearson correlation coefficients were also calculated to measure the associations between pairs of parameters. To assess the relative strength of each abiotic parameter in controlling microbial abundance and metabolism, a multiple regression analysis was performed by plotting all the biological parameters (as dependent variables, n = 13 in total) versus the physical–chemical ones (as independent variables). The regression analysis was performed using the PAST3 software [28].
Hierarchical clustering of variable data (Cluster analysis) was also carried out; clusters were obtained by calculation of the Bray–Curtis similarity coefficients and the group average linkage method between similarities. The similarity matrix was used to perform the Multi-Dimensional Scaling (MDS) analysis of the dataset, on which the factors “station” and “season” were superimposed.
Analysis of similarities (ANOSIM) was carried out to assess if there were statistical differences between groups within the multivariate dataset. ANOSIM is a nonparametric permutation procedure that analyses whether differences in dissimilarity between groups exceed differences within groups [29]. ANOSIM outputs produce a sample statistic, R, which represents the degree of separation between test groups: an R-value close to 1 indicates that all replicates within a group are reciprocally more similar than any replicates of different groups, while an R-value close to 0 indicates that there are no differences. As a post-hoc test, pairwise ANOSIMs between all pairs of groups were also computed and comparisons at p < 0.05 were considered statistically significant. To identify the percentage contribution of each parameter to the observed differences between groups of samples, the SIMPER (Similarity Percentage) analysis was performed, which sorted in the output table the relative contribution of each parameter to any difference detected between groups. The contribution of each parameter to the dissimilarity between groups, as well as to the similarity within each group, was assessed using the Similarity Percentages (SIMPER) analysis [30].
All physico–chemical and biological parameters were elaborated through the principal component analysis (PCA), which was performed on the normalized dataset. This multivariate analysis generates new variables, named principal components (PC) which explain the highest dispersion of the samples. Samples were clustered according to the Euclidean distances, and the obtained information was superimposed onto the PCA plots. PCA is useful to group variables that are correlated and make predictions on processes causing these association patterns among parameters through the calculation of PC loadings, which are the correlations between each response variable and the PCs. PC loadings reveal how closely a variable and a PC are related, and the patterns of associations among variables that load on the same and/or different PCs [31].
MDS, Cluster analysis, ANOSIM, SIMPER, and PCA were carried out using the Primer 6 software, version 6β R6 (PRIMER-E Ltd., Plymouth, UK) [32].

3. Results and Discussion

The ANOSIM analysis, performed as a Two-Way Nested analysis, confirmed that the differences between the three station groups chosen for this study (human-impacted stations (HIS), Stations 1, 3 and 4; freshwater-affected (FAS), Station 2; control stations (control), Stations 5–6) were statistically significant (Global R = 0.293, p < 0.1%). The SIMPER analysis, whose results are summarized in Table 2, pointed out the reciprocal separation of the station groups according to their distinctive abiotic and biotic parameters. Stations 1, 3 and 4 were characterized by similar values of nutrients (TN and N salts); at Station 2 the contribution percentages of S and TSM were observed, while the drivers that showed the highest contribution at both Stations 5 and 6 were TN, pH, DO.
The mean values and the standard deviation of the measured environmental and microbiological parameters are reported in Table 3 and Table 4 respectively, at the HIS, FAS and control stations, separately.
The outputs of MDS analysis (Figure 2) highlighted a clear separation among HIS, FAS and control stations (C) according to their physical–chemical properties (T, S, DO, transparency and pH) as well as the occurrence of seasonal dynamics, with samplings separated each to other according to T and S data. Particularly, summer T and S values were significantly different from winter ones; a widespread variability was also observed in spring, compared to the other seasons.

3.1. Human-Impacted Stations (HIS)

3.1.1. Environmental Parameters

HIS showed mean T values (22.43 ± 4.34 °C) similar to those recorded at the control stations and a range of variation of 15.69 to 29.80 °C; ANOVA results (Table S1) confirmed that spatial T variations were not significant. Vertical profiles (not shown in Figure) depicted decreasing T values from the surface towards the bottom during the water stratification periods (summer and spring). Salinity values, with a mean of 38.29 ± 0.64 and ranging from 36.63 to 39.11, were statistically comparable to control stations, with no significant spatial variations (Table S1). Warmer and saltier waters were detected in summer periods compared to winter ones, as confirmed by significant (p < 0.001) F values calculated among seasons for T and S (Table S1, Figure 3). DO values were comprised between 4.70 and 9.51 mg/L with a mean concentration of 6.95 ± 1.00 mg/L; no anoxic conditions were detected and maximum values were reached during winter–spring periods. pH varied from 7.90 to 9.12, with a mean value of 8.23 ± 0.30 and significant (p < 0.001) temporal variations (Table S1).
Nutrient concentrations pointed out the predominance of NO3 (min–max range: 0.21–21.66 µM) as the main component within the DIN pool, and lower percentages of NH4 and NO2 (0.01–4.22 µM and 0.05–3.28 µM, respectively). High TN, NH4 and NO3 values were measured in spring and autumn. Within the TP pool, ranging from 0.53 to 8.80 µM with peaks in May 2019 and October 2020, the inorganic fraction (0.01–3.00 µM) was available at moderate concentrations. Temporal variations were not statistically significant (Table S1).
Other trophic parameters such as TSM, POC and PN showed concentrations of suspended and particulate matter of 6.67–675.33 mg/L and 0.067–15.76 mgC/L, respectively, that were comparatively higher than FAS, and PN concentrations of 16.12–2733.60 µgN/L. This yielded to mean C/N ratios around 6.0, a value referable to the presence of active phytoplankton biomass within the organic matter pool, particularly frequent in summer periods; except for a peak of 9.24, referable to detritus, observed in August 2019, C/N ratios lower than 6, ascribable to bacteria, were found during the remaining time periods. For all of these parameters no significant variations in relation to space or time were observed by ANOVA (Table S1).

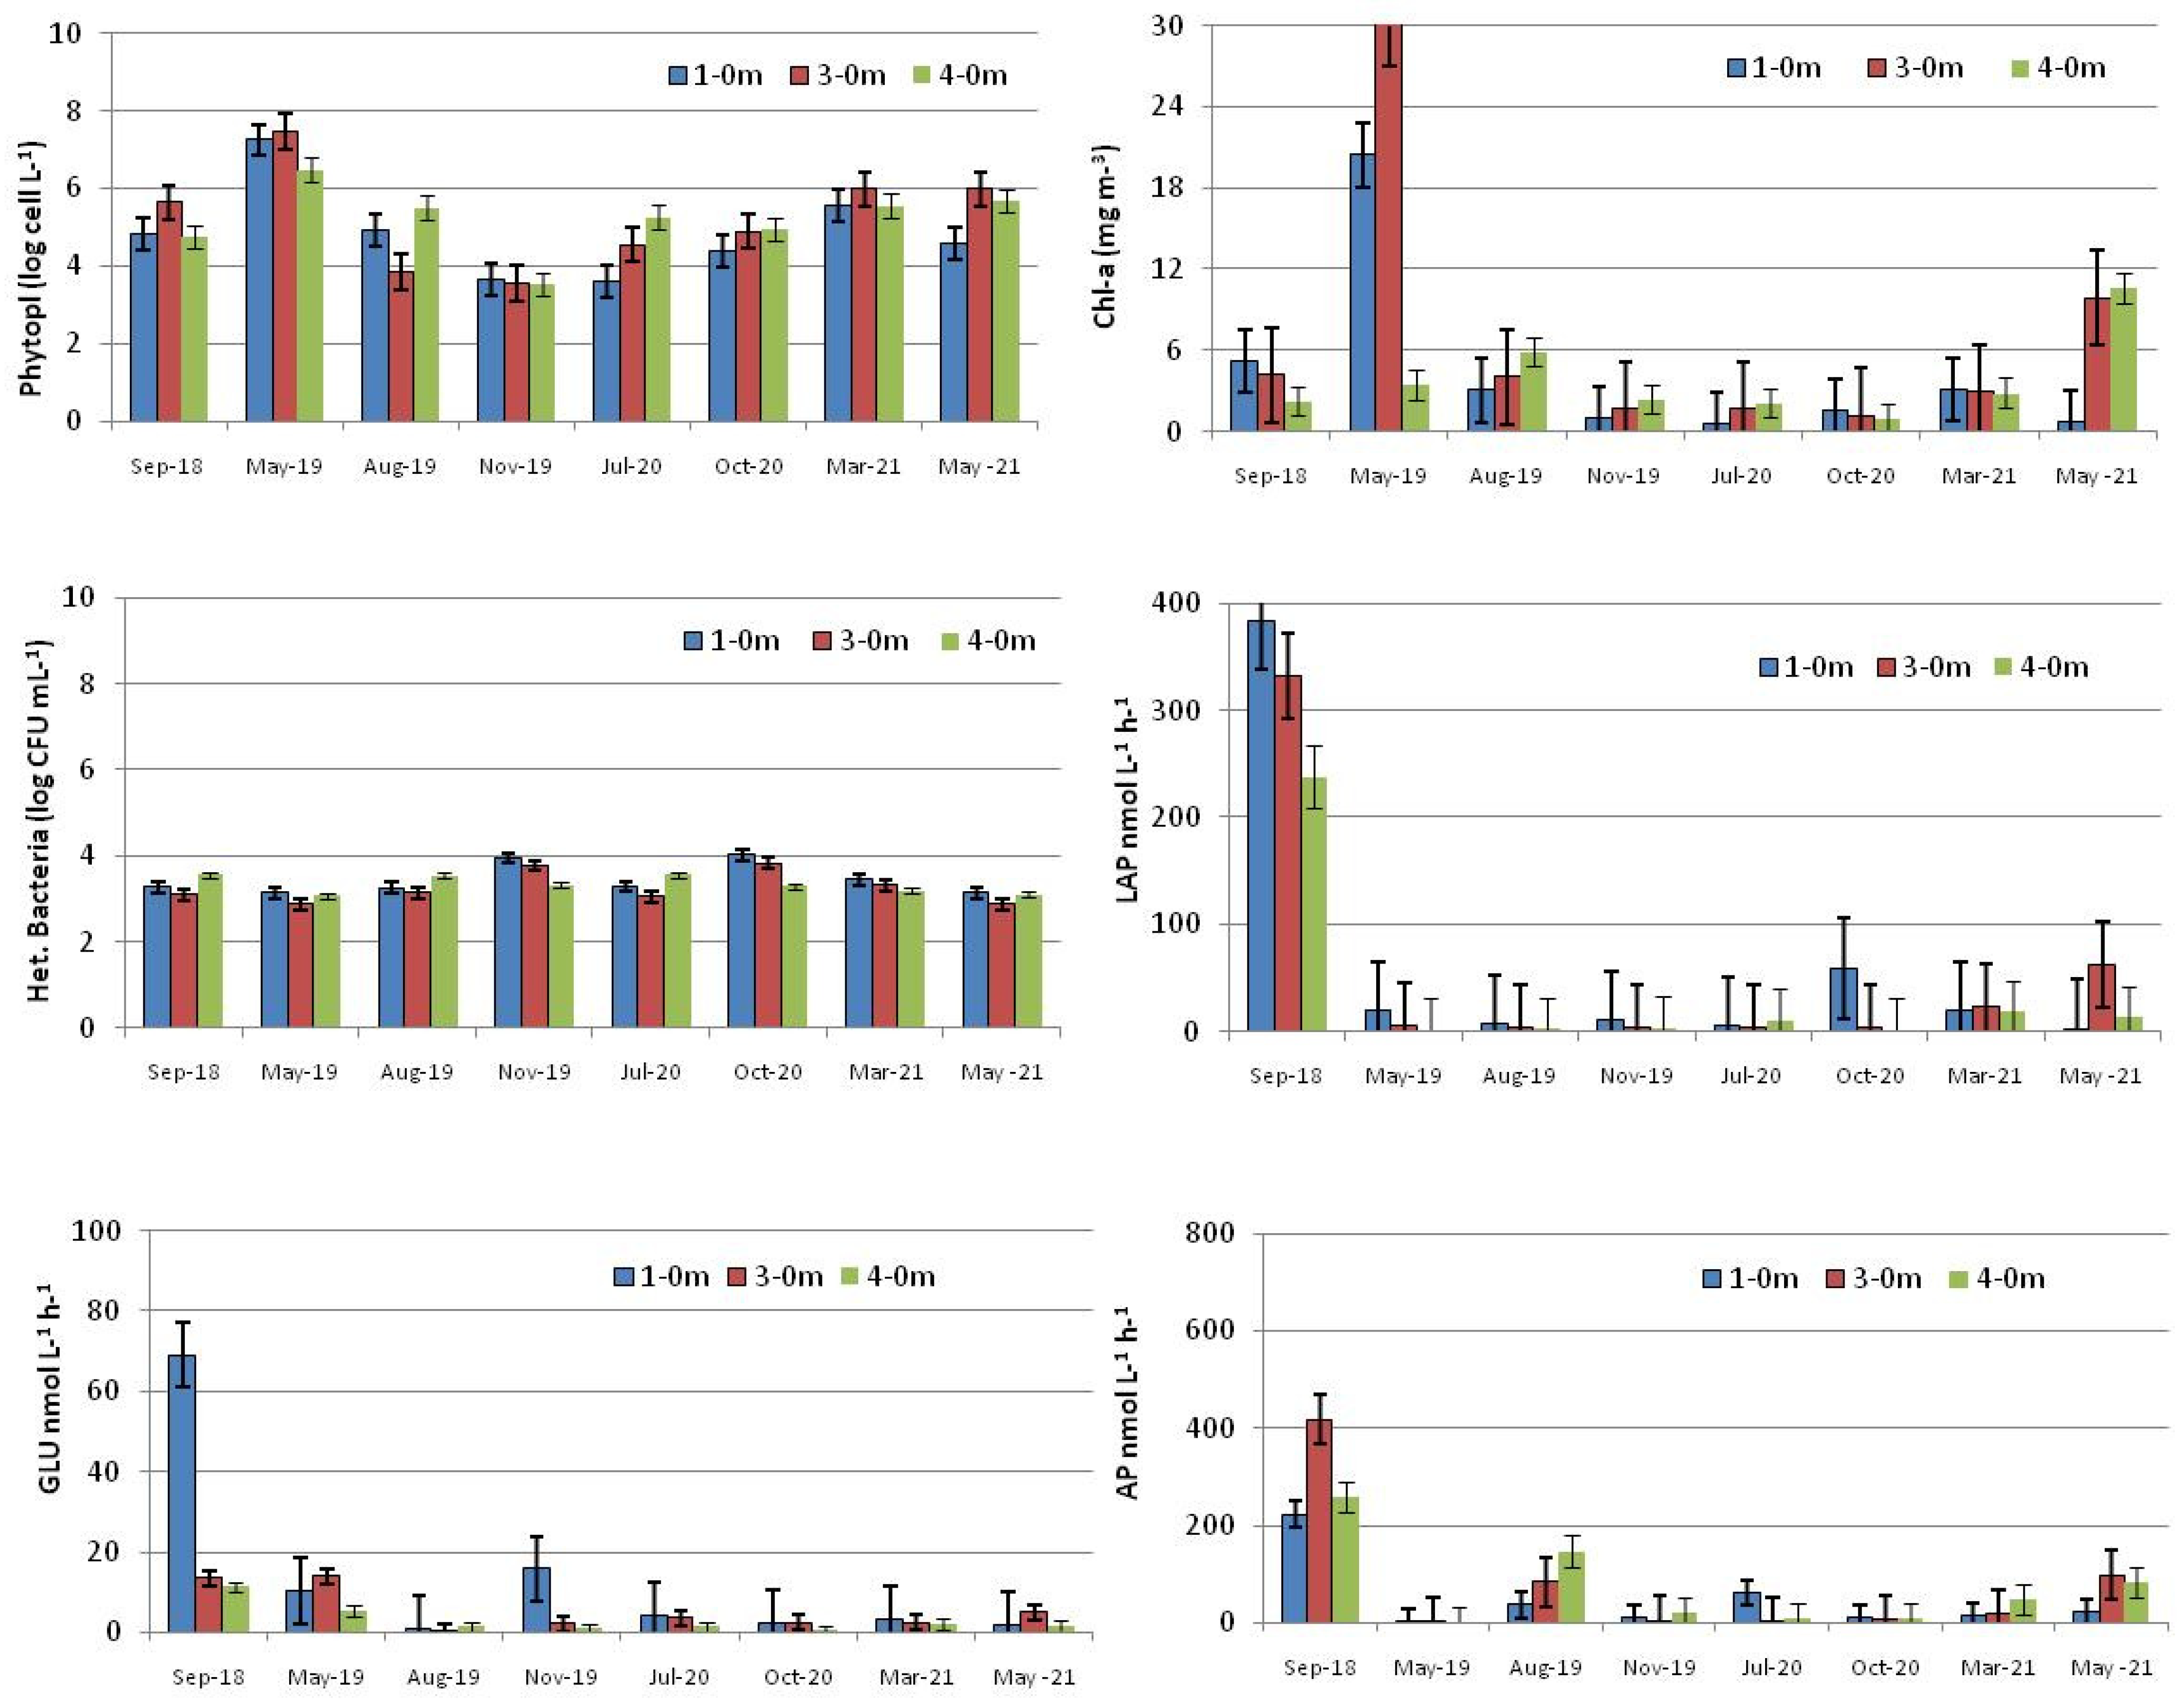
3.1.2. Microbial Parameters

The temporal trends of microbial abundance and activity recorded at HIS are shown in Figure 3. The mean abundance of phytoplankton was in the order of 106 cells/L, varying between 5.64 × 10² and 2.95 × 10⁷ cells/L. This last value, exceptionally high, was recorded at Station 3 in May 2019, when a dinoflagellate bloom occurred. Decreasing trends of microbial abundance and activity along the water column were generally observed. High concentrations were observed in spring–summer months, while minima were reached in November 2019; ANOVA, however, did not show statistically significant seasonal variations (Table S1).
Dinoflagellates were often the predominant component of the phytoplankton community, as shown by their mean densities in Table 3, with two distinct blooms recorded in May 2019 and March 2021 (Figure 3). Diatoms often represented the second component, with a few exceptions in September 2018 and a bloom in August 2019.
Phytoplankton biomass as Chl a had a mean concentration of 3.56 ± 4.89 mg/m3, with a wide variation range (0.49–30.58 mg/m3) and significant variations over time (Table S1); peak values were recorded in spring.
Heterotrophic bacteria showed abundances in the range of 103 CFU/mL, on average 1.5 times higher than control stations; they ranged from 3.60 × 10² to 1.04 × 10⁴ CFU/mL and reached high densities during autumn. In warm periods, particularly in autumn at Station 3, surface layers generally hosted higher numbers of bacteria (5.90–6.56 × 10³ CFU/mL); temporal variations of bacterial abundances were highly (p < 0.001) significant (Table S1).
Microbial activity rates were in the order AP > LAP > GLU, with mean values of 77.19, 41.35 and 5.17 nmol/L/h and variation ranges of 0.92–783.33 nmol/L/h, 0.14–384.67 nmol/L/h and 0.03–69.03 nmol/L/h respectively. Proteolytic and phosphatasic activities peaked during summer and spring periods, decreasing during colder months; their variability over time, however, was not statistically significant (Table S1). No clear seasonal trends were observed for the glycolytic activity.
At Stations 1 and 4, both microbial abundances and activity rates generally showed vertically decreasing values from the surface towards the deep (data not shown).

3.2. Freshwater-Affected Station (FAS)

3.2.1. Environmental Parameters

At FAS mean T was lower than HIS and control stations, showing a mean value of 22.08 ± 4.57 °C, and varying within a range of 15.68–27.50 °C. Moreover, S was the main environmental variable that distinguished these stations, with its low mean value (37.55± 1.55) and a wide variation range (from 34.84 to 39.02) related to the inputs of freshwater, particularly in September 2018 and spring–summer 2019. ANOVA confirmed the occurrence of seasonal T variations (p < 0.001). Space or time variations in water transparency values were not significant (Table 3, Table S1).
DO values were close to those recorded at HIS but lower than control stations, with a mean value of 6.87 ± 1.35 mg/L and a range of variation of 4.10–8.53 mg/L. Additionally, pH, with a mean of 8.17 ± 0.33 and a variation range from 7.90 to 8.71, was lower than at HIS and control stations.
Nutrient concentrations showed TN ranging from 3.56 to 19.95 µM, with a mean value of 8.15 ± 6.17 µM. Within the inorganic N ions, NO3 was generally predominant, with concentrations lower than 14.05 μM and a high mean value of 5.01 ± 5.45 µM; although not significantly different, NH4 and NO2 concentrations were higher than those measured at the HIS, varying between 0.08–5.26 µM/L and 0.06–0.95 µM and with a mean value of 1.65 ± 1.63 and 0.20 ± 0.31 µM, respectively. P compounds were available with mean PO4 concentrations about a third of the values measured at Station 3 (0.24 ± 0.12 µM) and small variations (0.11–0.39 µM); also TP was lower than at the HIS, with a mean value of 1.59 ± 0.98 µM and a variation range of 0.61 to 3.40 µM. Peaks of N nutrients were observed in September 2018 and October 2020, while peaks of PO4, found during autumn, were temporally delayed with respect to those of TP, recorded in May 2019 and July 2020. For all the nutrients, no statistically significant differences were detected (Table S1).
TSM showed concentrations about three times those measured at the HIS; conversely, POC and PN were, respectively, about 1/3 and 1/4 of the ones recorded at those stations. However, seasonal trends were not significantly different for both TSM and PN (Table S1). C/N ratios ranged from 4.75 to 12.32, with a mean value of 7.17 ± 2.45 typical of active phytoplankton biomass; ratios referable to bacterial biomass were detected in autumn and spring, while a peak of 12.32 was recorded in August 2019.

3.2.2. Microbial Parameters

Total phytoplankton had a mean concentration of 3.39 × 10⁵ cells/L, lower than the values at the HIS and control stations (3.16 × 10⁶ cells/L); similarly, phytoplankton biomass as Chl a showed significantly lower mean values (1.23 ± 1.16 mg/m3), with values comprised between 0.30 and 3.90 mg/m3. Temporal patterns of phytoplankton abundance and biomass followed seasonal cycles, with peaks during spring periods (2019 and 2021, Figure 4). Temporal Chl a and dinoflagellates variations were significant (p < 0.01 and 0.001, respectively) (Table S1).
Heterotrophic bacteria abundances ranged in the order of 103 CFU/mL with values slightly lower compared to the marine stations, which reflected the influence of freshwater inputs at this station. In winter, significantly (p < 0.01) low abundances were recorded.
Microbial activity was characterized by levels of AP and GLU similar to those found at control stations, while LAP activity rates were ¼ compared to those recorded at the HIS and control stations. High levels of microbial activities were observed in summer and autumn, while in winter the turnover of organic matter was sensibly reduced; the spring season was characterized by a further increase in microbial activity after the winter decline.

3.3. Control Stations

3.3.1. Environmental Parameters

Control stations unaffected by freshwater inputs or anthropic impacts were characterized by mean T values (22.43 ± 4.64 °C) such as those recorded in the other stations (HIS and FAS). Their variations over time (15.37–28.30 °C) were statistically significant (p < 0.001, Table S1). S values were comprised between 36.83 and 38.91, with a mean value of 38.04 ± 0.58, close to values measured at HIS. Compared to the other sites, Control stations were characterized by higher mean pH and DO values (8.33 ± 0.39 and 7.41 ± 1.01 mg/L, respectively); their variation ranges were 7.94–9.37 and 5.20–8.97 mg/L, respectively and were significant over time for DO (p < 0.01) (Table S1).
Very low concentrations of both TN and NO3 were observed (7.36 ± 6.11 µM and 2.60 ± 1.87 µM, respectively), with wide variability (2.65–22.75 and 0.55–6.66 µM, respectively). The levels of NH4 and NO2 were comparable to those measured at the HIS (1.10 ± 0.49 µM and 0.18 ± 0.08 µM, respectively); they ranged between 0.20–2.19 and 0.08–0.33 µM, respectively. P compounds were also measured at low levels; mean PO4 and TP concentrations were 0.25 ± 0.17 µM and 1.39 ± 0.49 µM, with variation ranges of 0.02–0.58 µM and 0.54–2.58 µM, respectively. TSM and POC showed intermediate concentrations compared to other stations; their mean values were 83.20 ± 139.43 mg/L and 497.77 ± 541.59 µgC/L respectively, while min–max ranges were 15.29–568.33 mg/L for TSM and 39.68–1956.67 µgC/L for POC. Conversely, PN was at minimum values, varying from 8.80 to 355.00 µgN/L and with a mean value of 86.17 ± 93.12 µgN/L. Mean C/N ratios (5.86 ± 0.65) suggested the predominance of the bacterial biomass within the organic matter, with some values >6 referable to the phytoplankton biomass during spring and summer. No significant variations over time were found for these trophic parameters (Table S1).

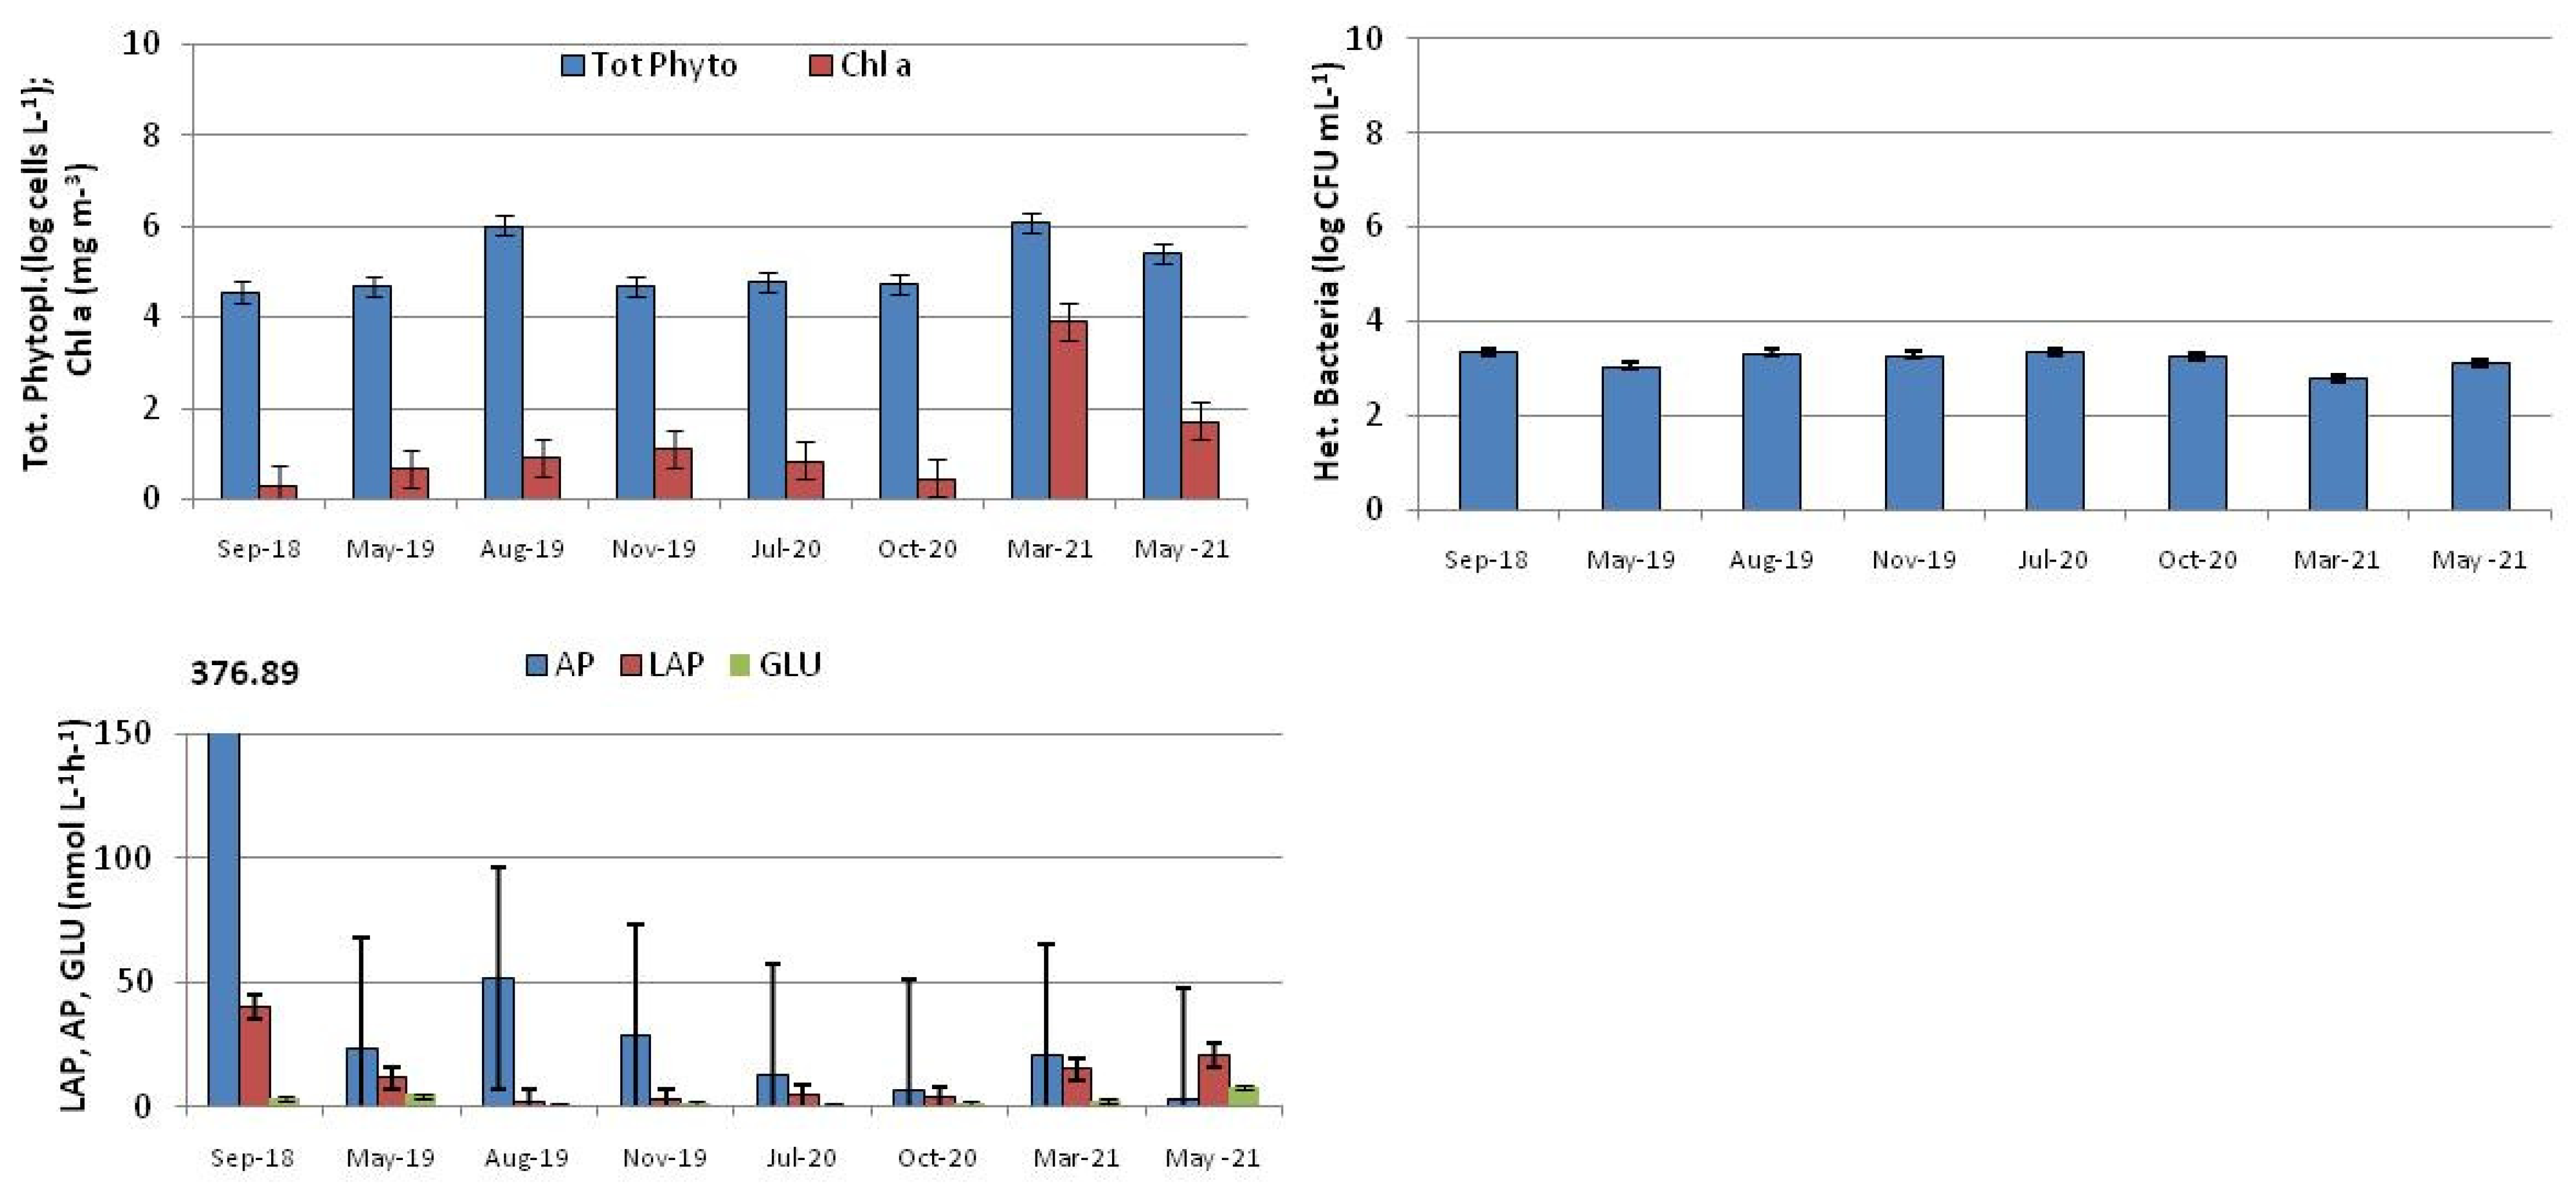
3.3.2. Microbial Parameters

Intermediate phytoplankton abundance and biomass were detected; their mean values were, respectively, 3.16 × 10⁶ cells/L and 3.44 mg/m3, respectively. Seasonal variations in phytoplankton biomass as Chl a were observed at a p < 0.05 (Table S1).
Within the phytoplankton community, diatoms and other taxa were the main representatives (mean concentration values: 2.99 × 10⁶ and 5.00 × 10⁴ cells/L, respectively) while dinoflagellates showed the lowest concentrations (1.26 × 10⁵ cells/L). Seasonal peaks in phytoplankton abundance were recorded in spring 2019 and winter 2021 (Figure 5).
Heterotrophic bacteria varied from 6.60 × 10² CFU/mL to 3.60 × 10³ CFU/mL, with mean values of 1.78 × 10³ CFU/mL; these microorganisms were more abundant during warm seasons, although their variations were not significant (Table S1).
The microbial community exhibited rates of proteolytic activity similar for magnitude order to the HIS (mean 41.99 nM/L/h; range: 0.59–260.38 nM/L/h), while glycolytic activity was similar to the FAS (3.42 nM/L/h; 0.21–14.35 nM/L/ h). AP showed low activity rates, comprised between 0.22–330.59 nM/L/h, with a mean value of 67.28 nM/L/h. Evident peaks of activity were observed for AP in August 2019 and March 2021, while for LAP in September 2018 and March 2021.

3.4. Water Quality Status Assessment of the Entire Syracuse Bay from the TSI Value

Except for the spring 2019 sampling, where an average TSI value of 53.94 ± 18.79 was calculated, the Syracuse bay was characterized by a “good” water quality status, with an average TSI value around 30. The TSI (Chl a), TSI (TN) and TSI (TP) calculated separately at each sampling station often gave not reciprocally comparable results in terms of water quality classification; indeed, the TSI (TP) and TSI (Chl a) played a major role, accounting for 59 and 41% of the average TSI value respectively (data not shown).

3.5. Qualitative Analysis of the Phytoplankton Community

The phytoplankton community was characterized by the predominance of diatoms in summer and dinoflagellates in winter–spring. Compared to the control stations, increased percentages of other species were found at HIS and FAS in summer and a lower incidence of diatoms at FAS in autumn. In spring most evident changes were observed, with the appearance of other species at both HIS and FAS, vs. a decrease in the dinoflagellate contribution (Figure S1).
The species of dinoflagellates most widely spread over the sampling stations were Alexandrium minutum, A. pacificum and Alexandrium sp., microorganisms known as responsible for PSP (Paralysing Shellfish Poisoning). These species bloomed in spring, often in association with Prorocentrum micans and P. triestinum, giving water discoloration events. Lingulodinium polyedra was also often found in spring and Gymnodinium spp. in summer and later on. Protoperidinium occurred in all the sampling months. The diatom taxon was mostly present in autumn, e.g., with the species Chaetoceros decipiens, but sometimes it occurred in summer with other Chaetoceros spp. and in late summer with Skeletonema spp. (see other diatom species in Supplementary materials (Table S2). Other taxa were scarcely represented, mostly with silicoflagellates, such as Dictyocha fibula and Parapedinella reticulata, and euglenophyceans.

3.6. Statistical Analysis of the Dataset

ANOVA test (Table S1) revealed significant (p < 0.001) spatial differences for water transparency only. Conversely, significant variations over time were observed for T (p < 0.001) at all the stations, for DO at control stations (p < 0.01) and pH at HIS (p < 0.001). Among the biological parameters, phytoplankton biomass as Chl a was everywhere significantly (p < 0.001) different over time; significant differences were also found for the abundances of dinoflagellates and heterotrophic bacteria respectively at FAS and at HIS and FAS.
Pearson correlation coefficients (Table S3) pointed out in the Syracuse bay several direct relationships between the autotrophic component (Chl a), microbial activities and nutrients, especially for Nitrogen compounds. At both HIS and control stations, microbial metabolism was stimulated by the trophic conditions, as indicated by the significant relationships observed between enzymatic activities, POC and NO3.
At HIS the growth of total phytoplankton and dinoflagellates was associated with the availability of nutrients and organic matter (POC, PN), while water transparency had negative effects on the autotrophic component. The abundance of heterotrophic bacteria was stimulated by PO4, while their metabolism (in terms of enzymatic activities) was negatively affected by the allochthonous inputs derived from anthropic activities (i.e., diluted waters related to aquaculture or agriculture wastes).
At FAS (Station 2), T affected negatively the dinoflagellates abundance, while water transparency had a negative influence on the heterotrophic metabolic activity.
At the control marine stations, the growth of heterotrophic bacteria was stimulated by TSM; conversely S and water transparency affected negatively the heterotrophic decomposition process.
Results similar to Pearson correlation were provided by the multiple regression analysis performed among microbial parameters (abundance and activity) and physical–chemical ones (Table S4). Significant (at least at a p level <0.05) associations were observed at HIS only. Particularly, the abundances of total phytoplankton were associated with PO4 (negatively) suggesting that this nutrient was consumed to sustain phytoplankton development. With respect to microbial metabolism, several positive associations were observed between proteolytic activity, T and DO, while negative associations were found with N salts (NH4 and NO3). AP was positively associated with T and DO, and negatively with NO3. All enzymatic activities were positively associated with TN.
The results of SIMPER analysis performed with respect to the “season” factor (Table S5) indicated that the highest squared distances within seasonal campaigns occurred during spring and summer. The most important parameters responsible for this variability within the summer group were the microbial activities and the diatoms taxon; during autumn, the variables that explained better the distances among the sampling campaigns were TSM and heterotrophic bacteria, while in winter the nutrient concentrations. During the spring season, the role of the autotrophic component (dinoflagellates and phytoplankton biomass as Chl a) and organic polymers (POC, PN), becomes predominant. Comparing season groups, summer and autumn were separated by TSM and heterotrophic bacteria, while autumn and winter by nutrients, heterotrophic bacteria and TSM. The spring season was separated by the other seasons (especially summer, with a squared distance of 60.77) by dinoflagellates and trophic conditions (PN).
The influence of environmental abiotic parameters on microbial communities was further investigated by means of PCA; the Eigen coefficients showing the weight of each parameter on PCs are reported in Table 5.
PC1 explained 27.50% and PC2 20.10% of total variability at HIS, while at FAS they accounted for 29.60% and 23.80% of total variability, respectively, and for 32.20% and 17.70% of total variability at control stations (data not shown).
At HIS, positive correlations were found between total phytoplankton, dinoflagellates, POC, PN, Chl a, TN, NO3, which contributed significantly to PC1 and were inversely related to transp, DO, S and heterotrophic bacteria. PC2 was dominated by pH, T, NH4, TN, which correlated positively with microbial activities (AP, LAP, GLU); all these were positively affected by T, but negatively by S.
At FAS, PC1 was dominated by dinoflagellates, Chl a, DO, S that correlated positively with each other and inversely to T, pH, Transp and heterotrophic bacteria. PC2 was dominated by PO4, total phytoplankton and diatoms; close direct relationships were observed between LAP and N salts, GLU and AP.
At control stations, PC1 was dominated by S and Transp. Positive relationships were detected among GLU, AP, N salts (TN, NH4 and NO3), POC, PN and Chl a, that were related negatively with Transp. T, pH, PO4 dominated PC2 and correlated positively with total phytoplankton and diatoms, but negatively with DO, LAP and GLU. AP was negatively related to PO4.
The low values of Eigen coefficients obtained for the heterotrophic bacteria suggested that the Syracuse bay was mostly an autotrophic ecosystem; Eigen coefficient values highlighted that NO3, within TN, as well as POC and PN, played a key role in supporting the phytoplankton community.

3.7. General Considerations

This study aimed at integrating different features of the microbial community, such as heterotrophic bacterial abundance, quali-quantitative composition of phytoplankton community and microbial decomposition activity, as an approach to assess the variability of microbial communities and their response to cumulative effects of co-occurring natural and anthropogenic forcings in a Mediterranean coastal aquatic ecosystem. Multiple forcings such as pollutants, nutrients, HABs and hypoxia, turbidity, suspended sediments, and altered habitat and hydrologic regimes are all factors that can impact marine ecosystems through single, cumulative, or synergistic processes [33]. Moreover, taking into consideration that marine ecosystems are extremely diversified in their hydrodynamic regimes, T, organic matter and nutrient concentrations, the local variability in abiotic factors can result, in turn, in significant spatial and temporal variability of microbial metabolism [34]. Within Syracuse Bay, the coexistence of different forcings such as the impact of freshwater sources or riverine inputs, the water enrichment by aquaculture farming wastes and potential release of contaminants from the shipyard and maritime activities makes this area an ideal natural laboratory for studying the biological and biogeochemical effects on microbial community abundance and activities, respectively.
In synthesis, this survey showed that the Syracuse bay is an autotrophic system, dominated by the phytoplankton component with concentrations in the order of 106 cells/L. Both microbial abundances and activity rates were enhanced at HIS, in response to the water enrichment with organic matter and nutrient inputs; microbial dynamics were characterized by a marked seasonality, with phytoplankton peaking in spring and heterotrophic bacteria in autumn. Within the phytoplankton community, dinoflagellates predominate throughout the year, with a shift towards diatoms that become prevalent during summer and mostly at the marine stations.
Salinity was the most relevant physical–chemical driver of the microbial assemblage, particularly at FAS and control marine stations, as confirmed by the Eigen coefficients (Table 5). Similar to our findings, in a temperate Mediterranean coastal area affected by freshwater inputs marine microbial dynamics depended on a combination of T, S and Chl a [35].

3.8. Microbial Response to Anthropic Activities

The metabolic activity data provided by the enzyme activity measurements (LAP, GLU and AP) have allowed for obtaining a picture of the functional diversity and metabolic potential of the whole microbial community against different organic substrates such as proteins, polysaccharides and organic phosphates, respectively. Compared to control marine sites, HIS were characterized by low concentrations (about ½) of total phytoplankton and high (about 1.5 times) of heterotrophic bacteria; peaks of GLU and AP were also detected. Microbial abundances and metabolic activities varied in ranges comparable with the control stations, as shown by the lack of significant spatial variations (see Table S1). Nevertheless, peaks of total phytoplankton (mainly dinoflagellates), total biomass (Chl a), and heterotrophic bacteria characterized Station 3; these high abundances were consistent with high enzyme activity rates and high POC and PN contents. At HIS, trophic conditions and metabolic activity rates were similar to those of other coastal Mediterranean areas under mesotrophy [36,37,38,39]. Culturable heterotrophic bacteria are the most active microbial component involved in organic matter decomposition and nutrient regeneration, therefore culture methods cannot be excluded from studies focused on biogeochemical processes occurring in marine environments; indeed, although molecular methods such as 16S rRNA gene sequencing ad metagenomics were widely used in microbial ecology, DNA sequence data can rarely infer on the bacterial physiology [40]. In Syracuse Bay, the mean heterotrophic bacterial abundances were in a range higher than that reported from a Mediterranean coastal lagoon (Ganzirri lake, 103 CFU/mL), although similar seasonal variations, with higher summer–autumn concentrations, were reported. This result confirmed that T was a major driver of microbial community structure and function, similar to what was observed in other coastal environments [34]. All microbial activities were reciprocally related, indicating a synergy towards the decomposition process. Anthropic activities related to fishing, shipping or tourism may release pollutants causing water quality deterioration, habitats destruction as well as losses in biodiversity, with severe consequences for coastal ecosystems [41]. Microbes are very sensitive to the environment they inhabit, and the impact of anthropogenic activities on natural aquatic ecosystems may be reflected in changes in their community [6,42,43]. Marine microbial communities are able to respond to anthropogenic stress by activating a range of adaptation strategies, among which the formation of dormant stages, or using contaminants as carbon or energy sources, or their transformation into less toxic or volatile forms or transport outside the cell, or adopting repair mechanisms. Microbial biomarkers of exposure to contaminants may be useful to assess the health of microbial communities and provide useful information to indirectly evaluate the effects of anthropogenic perturbations on aquatic ecosystem health [43,44]. On the other hand, within the Syracuse bay, nitrate was the predominant N salt compared to nitrite; phosphate was readily regenerated via AP activity. The bacterioplankton and phytoplankton responses to high nutrients and suspended particles, such as those driven by riverine inputs, were widely studied [44,45,46,47] and it was found that microbial structure and function are strongly affected by changes in the trophic conditions, especially those regarding the magnitude and nature of such inputs [46]. In Syracuse Bay, all the autotrophic variables were inversely related to water transparency and S; significant, negative relationships with S and TP were detected with heterotrophic metabolism in terms of enzyme activities. S was an important environmental forcing for microbial metabolism along the Po delta, where high rates of microbial activities were detected [48,49]. Freshwater from rivers was found to be a critical determinant in shaping microbial communities; in surface waters along the Pearl River Estuary Li et al. [50] detected high numbers (>106 cells mL−1) of heterotrophic bacteria during the wet season, with different bacterioplankton structure between fresh-and saltwater sites as well as between wet and dry season. Additionally in the Delta Po River, the structure of the benthic microbial (autotrophic and heterotrophic) community was affected by both natural and anthropogenic disturbances [51].

3.9. Microbial Response to Freshwater Inputs

The presence of coastal aquifers, made of carbonate and volcanic rocks, is a typical feature of southeastern Sicily. Station 2 is influenced by natural freshwater inputs and organic sources drained by the Aretusa spring; indeed, since ancient times this site was well known for a groundwater flux through the faults directly to the sea forming visible submarine springs, locally called “bugli”. The material released by submarine groundwater discharges might cause seawater quality deterioration; moreover, groundwater spring can be important for the geochemical cycles of elements [52]. In spite of high TSM values, the low microbial abundance and enzymatic rates recorded at Station 2 were consistent with the low amounts of POC and PN, suggesting that the suspended material was scarcely bioavailable and that a typically marine cultivable bacterial flora accounted for only a small fraction of the whole microbial community. Moreover, the inverse relationships observed between enzyme activities and water transparency, between pH, TN, nitrate and S, as well as between phytoplankton and heterotrophic bacteria (Table S3) suggested that at this station microbial dynamics were affected by both abiotic (i.e., suspended matter, S) and biotic factors.
Regarding the phytoplankton community, at Station 2 dinoflagellate abundance was on average 1.5 times higher than at control stations, while low concentrations of diatoms were found, confirming that several environmental factors—in addition to T and nutrient availability—may influence the diatom–dinoflagellate patterns and succession. The prevalence of diatoms independently on T and N:P supply ratios and a switchback towards the dinoflagellates’ dominance at high T and nutrient concentrations have recently been observed [53].

3.10. Bacteria–Phytoplankton Interactions

This two-year study allowed us to monitor over a seasonal scale the interactions between phytoplankton and bacterioplankton as two components of the microbial assemblage. In Syracuse Bay, similar to other coastal Mediterranean waters, phytoplankton blooms—especially of harmful Alexandrium species—are recurrent events [13,15]; in our survey, we observed uncoupled distribution patterns of bacterial and phytoplankton, with phytoplankton peaking in spring and declining in summer and high abundances of heterotrophic bacteria in autumn. More evident was the production of phytoplankton biomass—as shown by Chl a values—at HIS in spring, when bacterial abundance was low (Figure S4).
Phytoplankton blooms and their effect on the bacterial community have previously been studied in several field surveys [54,55]. Phytoplankton-derived organic matter represents the main trophic source for bacteria [56,57]. Extracellular dissolved organic carbon (DOC), such as polysaccharides, monosaccharides, and free amino acids, released by phytoplankton species supported the growth of some bacterial genera during the decline of phytoplankton bloom [57]. In mesocosm experiments, bacterioplankton and phytoplankton dynamics were similar during a Microcystis bloom [58]. Bacterioplankton succession was found to be related to that of Thalassiosira nordenskioeldii during the bloom phase [54], while bacterial diversity was reported to decrease during a phytoplankton bloom in natural conditions [59]. On the other hand, phytoplankton development depends on favorable T and nutrient availability, which are both conditions promoting also bacterial growth [60]; this makes sometimes difficult to disentangle the relative importance of abiotic and biotic factors in driving microbial distribution patterns and their seasonal dynamics.
Thanks to their widespread occurrence in different aquatic ecosystems, short generation times and rapid response to environmental stress, marine microalgae and particularly diatoms were proposed as indicators of environmental quality, such as in response to aquaculture activities [61,62]. Benthic diatoms were found to respond to nutrient concentrations from river inflows or sewage discharges [63]. Within marine food webs, the phytoplankton community was also recognized to have a critical role in biogeochemical processing and climate modulation [64]. Biogeochemical activities are typically played also by heterotrophic microorganisms, that are responsible for organic nitrogen and phosphorous decomposition [65]; Mediterranean ecosystems such as coastal urbanized areas enriched in nutrients host high numbers of such components [66,67] and are characterized by high levels of proteolytic and phosphatasic activities [68].

3.11. Biogeochemical Implications of Microbial Activities and Related Stoichiometric Ratios

Excessive nutrient discharges from agriculture, aquaculture, industry effluents are recognized as the main responsible for the eutrophication process, an issue characterized by massive algal proliferation and consequent anoxia that is particularly relevant in coastal areas with restricted water circulation [69,70]. Eutrophication is one of the main water quality concerns in Europe that has stimulated increasing efforts devoted at reducing anthropogenically-related pollution (i.e., Marine Strategy Framework Directive [71]). Chl a concentration is the most used proxy for phytoplankton biomass and an indicator for ecological status assessment [72].
As the abundance and metabolism of all microbial components are closely dependent on the availability of nutrients, and microbial metabolism plays a critical role in the organic matter turnover and biogeochemical cycles [34], in this study we estimated the N/P and C/N ratios, as well as the percentage of organic matter potentially mobilized by the microbial assemblage, that all together shed light on the biogeochemical implications of microbial activities and on the overall stoichiometry of the study area.
Insights on the role of the microbial community in organic matter transformation by production and decomposition processes are of crucial importance especially in marine ecosystems affected by eutrophication episodes similar to Syracuse Bay. The quantification of nutrient pools and elemental ratios of suspended particles, together with the study of phytoplankton nutrient limitation patterns or interactions among C, N and P cycles contribute to our comprehension of the biogeochemical processes taking place at sea [73]. The N/P ratio—which is a keystone in marine biogeochemistry—provides insights on nutrient limitation in phytoplankton biomass; ratios lower than 16 indicate an N-limitation for phytoplankton, whereas values higher than 16 indicate P-limitation [74]. Mean ratios calculated in the Syracuse bay were 14.11 ± 18.61, 28.58 ± 29.81 and 15.74 ± 18.19 at HIS, FAS and Control, respectively, confirming that DIN was largely available in the entire area. Oscillations in the Redfield ratio were observed on a seasonal scale: while no nutrient limitation was observed during productive periods (summer and spring), in autumn–winter periods, N limitation was observed, with a minimum value of 3.37 recorded at FAS in winter (Figure S3). In other aquatic ecosystems, deviations with slightly higher (22:1) ratios than the canonical Redfield’s estimates (16:1 N:P ratio) were observed at different spatial and temporal scales [74]. Nutrient pools at sea come from runoff and internal cycling and are inversely related to oxygen content [75]; indeed, N balance is the result of several processes, including nitrification, denitrification in the hypoxic layer, anammox (where there are newly anoxic conditions) and dissimilatory nitrate reduction to ammonia (in anoxic conditions) [76], while P and NH4 can be released from the sediments when the water becomes anoxic [77], further stimulating phytoplankton bloom. Therefore, changes in nutrient ratios are relevant in driving the eutrophication process [78]. Phytoplankton communities are known to influence water turbidity and the dissolved oxygen content, and, because of their responsiveness to nutrient or S changes in terms of their structure and distribution, they are regarded as sensitive proxies for several ecosystem processes [79,80]. Through symbiosis or resource competition, phytoplankton communities also interact with other planktonic components; the associations/interactions between microbial community members allow us to understand the effect of changing environmental conditions on ecosystem functioning [53,81]. Within the phytoplanktonic community inhabiting the Syracuse bay, dinoflagellates prevailed throughout the study period and, occasionally, diatoms in summer at marine stations; moreover, the negative association found between these two taxa could be explained by the high optimal N/P ratio of dinoflagellates in contrast to the low optimal N/P ratio that favors the growth of diatoms, by the different mechanisms of nutrient uptake [81]. Diatoms are amongst the most widespread phytoplankton groups, adapting or surviving to sub-optimal conditions and restarting their growth as soon as nutrient concentrations allow it [82]. Moreover, the detection of some bloom-forming and potentially toxic species belonging to Dinophyceae and Bacillariophyceae in the Syracuse Bay requires further attention because of their recurrent and massive development during the study period.
Regarding C/N ratios calculated from POC/PN measurements, the mean values obtained in the Syracuse bay at HIS and FAS were higher than those obtained at the control stations. Generally, C/N ratios were comprised between 6 and 8 during summer–autumn, suggesting that in this period the organic matter was mostly derived from the photosynthetic production; conversely, in spring mean C/N ratios lower than 6 at all the stations provided evidence of the predominance of heterotrophic biomass within the particulate matter. Particularly interesting was the maximum value of 9.70 recorded at FAS in summer, suggesting that the detrital fraction was predominant within the organic matter pool. C/N ratios lower than 5 were observed in a Mediterranean coastal area (Cape Peloro) [39]. Low C/N ratios (from 2.39 to 5.98) indicated the recent origin and the predominance of new bacterial biomass within the particulate matter [83]. Additionally for natural marine bacterial biomass, Lee and Fuhrman [84] reported a C/N mean value of 3.7 ± 0.2. Because of its high nitrogen content, fresh organic matter represents an available food source for heterotrophic bacteria.
To estimate the biogeochemical role played by the microbial community in Syracuse Bay, the percentage of organic matter potentially decomposed by microbial enzyme activity rates was calculated. To this end, LAP and GLU rates were previously converted from nmoles L−1 h−1 into nanograms of mobilized Carbon assuming that 72 nanograms of C were released per 1 nanomole of hydrolyzed substrate [85]. We estimated that, on average, the amount of Carbon mobilized by LAP + GLU was 80.29 and 22.70 mgC L−1 per day, at HIS and FAS respectively, compared to 60.93 mgC L−1 per day at the control stations. Moreover, microbial activities together were able to hydrolyze, per day, as much as the 18.39 and 14.23% of POC, at HIS and FAS respectively, compared to the 21.43% of the control stations.
The seasonal patterns of microbial activities were reflected in seasonal variability in the process of organic matter decomposition (Figure S4). Compared to control stations, lower percentages were mobilized at both HIS and FAS, with similar seasonal trends, except for the spring season at FAS. In summer and winter, the percentage of organic matter potentially mobilized was generally higher than in autumn and spring. In this latter period, the microbial community was able to mobilize a high percentage of organic matter at FAS, probably due to the low amount of POC that was decomposed at high efficiency.
In response to both human and natural impacts, the levels of microbial metabolism were found to decrease compared to those measured at control stations. However, the microbial activity was able to decompose a substantial percentage of organic matter even during winter, due to the low amount of POC available and the presence of a still enhanced hydrolytic activity, similar to what is observed in Mediterranean brackish areas [37,85]. On the other hand, the responsiveness of microbial communities to organic matter inputs is affected by changes in the community composition or in its physiological adaptation to the nature of organic matter [25,39,47,51,86,87].

4. Conclusions

The integrated study of the bacterial and phytoplankton abundance, phytoplankton composition and microbial metabolism allowed us to depict the microbial community dynamics in Syracuse Bay in response to different environmental drivers.
The organic matter and nutrient inputs that characterized the HIS were reflected in significant increases of Chl a, total phytoplankton and heterotrophic bacterial abundances and metabolic activities (LAP, GLU, AP). Microbial abundances and activities were particularly stimulated at the sites—such as Station 3 (Anapo-Cyane river)—directly affected by land inputs (i.e., from agriculture activities). The quick remineralization of the organic matter pool—mediated by microbial metabolism—avoided anoxic conditions or substantial decreases in water quality which could develop in the bay, in spite of the recurrent blooms observed in the entire study area. Similar to other temperate aquatic ecosystems, the significant correlations observed with T suggested that seasonality was the major driver of trophic inputs and consequently of microbial dynamics. At FAS, also significant, negative correlations of microbial abundances and activities with S indicated that the microbial community was affected by organic sources driven by freshwater inputs. This led us to conclude that in Syracuse Bay, multiple environmental factors such as T, S, DO, pH, nutrients and POC contributed to the spatial and seasonal variability in microbial distribution and metabolic activities. The autumn peaks recorded in the enzymatic activity rates and heterotrophic bacterial abundance suggested that not only phytoplankton-derived but also allochthonous organic polymers strongly stimulated microbial metabolism. The different seasonal trophic and microbial scenarios observed in Syracuse Bay highlighted that both microbial activities and abundances can be suitable indicators to monitor the environmental status and manage this Mediterranean coastal environment.

Supplementary Materials

The following are available online at https://www.mdpi.com/article/10.3390/jmse10010019/s1, Figure S1: Seasonal percentage contribution of the main phytoplankton taxa: dinoflagellates (red), diatoms (blue), and other species (yellow) observed at human-impacted stations (HIS), freshwater-affected station (FAS) and marine control stations (Control); Figure S2: Seasonal patterns of total phytoplankton abundance and biomass (as Chlorophyll a) and of heterotrophic bacteria at human-impacted stations (HIS), freshwater-affected station (FAS) and control stations; Figure S3: Seasonal patterns of N/P (above) and C/N ratios (below) obtained at human-impacted stations (HIS), freshwater-affected station (FAS) and control stations; Figure S4: Percentage of organic matter mobilized by LAP+ GLU activities calculated on a seasonal scale at human-impacted stations (HIS, Stations 1, 3, 4), freshwater affected station (FAS, Station 2) and control stations (Stations 5 and 6). Table S1: Results of Analysis of Variance (ANOVA) performed on the environmental and microbiological dataset referred to surface waters (n = 80); Table S2: List of main phytoplankton taxa and species identified over time at the different stations sampled in the Syracuse bay; Table S3: Pearson correlation coefficients calculated among biotic and abiotic parameters. The highly significant relationships (p < 0.01) are reported in bold; Table S4: Multiple regression analysis among dependent (biological variables) and independent parameters (environmental variables) at human-impacted stations (HIS). Only the significant relationships (p < 0.05) are shown; Table S5: Results of similarity percentage (SIMPER) analysis within and between “Season” groups.

Author Contributions

Conceptualization, G.C., X.C., Y.Z.; methodology, all the authors.; software, G.C.; validation, G.C., F.A., F.D., M.G.G., M.L., S.M., C.S.; formal analysis, M.G.G.; investigation, G.C., F.A., F.D.; resources, Y.Z.; data curation, all the authors.; writing—original draft preparation, all the authors; writing—review and editing, G.C., M.G.G., F.D., X.C.; supervision, G.C., M.G.G., F.A., F.D., X.C.; project administration, G.C., X.C., Y.Z., M.G.G.; funding acquisition, G.C., Y.Z. All authors have read and agreed to the published version of the manuscript.

Funding

This research was funded by the NATIONAL KEY RESEARCH & DEVELOPMENT PROGRAM OF CHINA, grant number 2016YFE0202100. The APC was funded by G. Caruso.

Institutional Review Board Statement

Not applicable.

Informed Consent Statement

Not applicable.

Data Availability Statement

Original datasets are available from the authors upon request.

Conflicts of Interest

The authors declare no conflict of interest. The funders had no role in the design of the study; in the collection, analyses, or interpretation of data; in the writing of the manuscript, or in the decision to publish the results.

References

  1. Coleman, J.M.; Huh, O.K.; DeWitt, B. Wetland loss in world deltas. J. Coast. Res. 2008, 24, 1–14. [Google Scholar] [CrossRef]
  2. Halpern, B.S.; Walbridge, S.; Selkoe, K.A.; Kappel, C.V.; Micheli, F.; D’Agrosa, C.; Bruno, J.F.; Casey, K.S.; Ebert, C.; Fox, H.E.; et al. A global map of human impact on marine ecosystems. Science 2008, 319, 948–952. [Google Scholar] [CrossRef] [Green Version]
  3. Bonamano, S.; Piermattei, V.; Madonia, A.; Paladini de Mendoza, F.; Pierattini, A.; Martellucci, R.; Stefanì, C.; Zappalà, G.; Caruso, G.; Marcelli, M. The Civitavecchia Coastal Environment Monitoring System (C-CEMS): A new tool to analyze the conflicts between coastal pressures and sensitivity areas. Ocean Sci. 2016, 12, 87–100. [Google Scholar] [CrossRef] [Green Version]
  4. Elliot, M.; Quintino, V. The estuarine quality paradox, environmental homeostasis and the difficulty of detecting anthropogenic stress in naturally stressed areas. Mar. Pollut. Bull. 2007, 54, 640–645. [Google Scholar] [CrossRef] [PubMed]
  5. Paerl, H.W. Mitigating Harmful Cyanobacterial Blooms in a Human- and Climatically-Impacted World. Life 2014, 4, 988–1012. [Google Scholar] [CrossRef] [PubMed] [Green Version]
  6. Nogales, B.; Lanfranconi, M.P.; Piña-Villalonga, J.M.; Bosch, R. Anthropogenic perturbations in marine microbial communities. FEMS Microbiol. Rev. 2011, 35, 275–298. [Google Scholar] [CrossRef] [Green Version]
  7. Buchan, A.; LeCleir, G.; Gulvik, C.; Gonzalez, J.M. Master recyclers: Features and functions of bacteria associated with phytoplankton blooms. Nat. Rev. Microbiol. 2014, 12, 686–698. [Google Scholar] [CrossRef] [PubMed]
  8. Ponomarova, O.; Patil, K.R. Metabolic interactions in microbial communities: Untangling the Gordian knot. Curr. Opin. Microbiol. 2015, 27, 37–44. [Google Scholar] [CrossRef] [Green Version]
  9. Amin, S.A.; Parker, M.S.; Armbrust, E.V. Interactions between diatoms and bacteria. Microbiol. Mol. Biol. Rev. 2012, 76, 667–684. [Google Scholar] [CrossRef] [Green Version]
  10. Bratbak, G.; Thingstad, T.F. Phytoplankton-bacteria interactions: An apparent paradox? Analysis of a model system with both competition and commensalism. Mar. Ecol. Progr. Ser. 1985, 25, 23–30. [Google Scholar] [CrossRef]
  11. Grossart, H.P.; Ploug, H. Microbial degradation of organic carbon and nitrogen on diatom aggregates. Limnol. Oceanogr. 2001, 46, 267–277. [Google Scholar] [CrossRef]
  12. Grossart, H.-P.; Czub, G.; Simon, M. Algae-bacteria interactions and their effects on aggregation and organic matter flux in the sea. Environ. Microbiol. 2006, 8, 1074–1084. [Google Scholar] [CrossRef] [PubMed]
  13. Rubino, F.; Belmonte, M.; Caroppo, C.; Giacobbe, M.G. Dinoflagellate resting stages from surface sediments of Syracuse Bay (Western Ionian Sea, Mediterranean). Deep. Sea Res. II 2010, 57, 243–247. [Google Scholar] [CrossRef]
  14. Dell’Aversano, C.; Tartaglione, L.; Polito, G.; Dean, K.; Giacobbe, M.G.; Casabianca, S.; Capellacci, S.; Penna, A.; Turner, D. First detection of tetrodotoxin and high levels of paralytic shellfish poisoning toxins in shellfish from Sicily (Italy) by three different analytical methods. Chemosphere 2019, 215, 881–892. [Google Scholar] [CrossRef]
  15. Vila, M.; Giacobbe, M.G.; Masó, M.; Gangemi, E.; Penna, A.; Sampedro, N.; Azzaro, F.; Camp, J.; Galluzzi, L. A comparative study on recurrent blooms of Alexandrium minutum in two Mediterranean harbours. Harmful Algae 2005, 4, 673–695. [Google Scholar] [CrossRef]
  16. Strickland, J.D.H.; Parsons, T.R. A practical handbook of seawater analysis. second ed. Fish. Res. Bd. Can. 1972, 167, 1–311. [Google Scholar]
  17. Aminot, A.; Chaussepied, M. Manuel des Analyses Chimiques en Milieu Marin; Centre National pour l’Exploration des Oceans: Brest, France, 1983; pp. 1–395. [Google Scholar]
  18. Valderrama, J.C. The simultaneous analysis of total nitrogen and total phosphorus in natural waters. Mar. Chem. 1981, 10, 109–122. [Google Scholar] [CrossRef]
  19. Koroleff, F. Determination of Phosphorus. In Methods of Seawater Analysis; Grasshoff, K., Ehrhardt, M., Kremling, K., Eds.; Verlag Chemie GmbH: Weinheim, Germany, 1983; pp. 125–139. [Google Scholar]
  20. Koroleff, F. Total and Organic Nitrogen. In Methods of Seawater Analysis; Grasshoff, K., Ehrhardt, M., Kremling, K., Eds.; Verlag Chemie GmbH: Weinheim, Germany, 1983; pp. 162–173. [Google Scholar]
  21. Lorenzen, C.J. Determination of chlorophyll and pheo-pigments: Spectrophotometric equations. Limnol. Oceanogr. 1967, 12, 343–346. [Google Scholar] [CrossRef]
  22. Iseki, K.; MacDonald, R.W.; Carmack, E. Distribution of particulate matter in the Southeastern Beaufort Sea in late summer. Proc. NIPR Symp. Polar Biol. 1987, 1, 35–46. [Google Scholar]
  23. University of Southern Florida Water Institute (TSI Trophic State Index). Available online: http://www.lake.wateratlas.usf.edu/library/learn-more/learnmore.aspx?toolsection=lm_tsi (accessed on 24 June 2021).
  24. Monticelli, L.S.; Caruso, G.; Decembrini, F.; Caroppo, C.; Fiesoletti, F. Role of prokaryotic biomasses and activities in Carbon and Phosphorus cycles at a coastal, thermohaline front and in offshore waters (Gulf of Manfredonia, Southern Adriatic Sea). Microb. Ecol. 2014, 67, 501–519. [Google Scholar] [CrossRef]
  25. Zaccone, R.; Caruso, G.; Calì, C. Heterotrophic bacteria in the northern Adriatic Sea: Seasonal changes and ectoenzyme profile. Mar. Environ. Res. 2002, 54, 1–19. [Google Scholar] [CrossRef]
  26. Bužančić, M.; Ninčević Gladan, Z.; Marasović, I.; Kušpilić, G.; Grbec, B. Eutrophication influence on phytoplankton community composition in three bays on the eastern Adriatic coast. Oceanologia 2016, 58, 302–316. [Google Scholar] [CrossRef] [Green Version]
  27. Edler, L.; Elbrächter, M. The Utermöhl method for quantitative phytoplankton analysis. In Microscopic and Molecular Methods for Quantitative Phytoplankton Analysis; IOC Manuals and Guides n. 55; Karlson, B., Cusack, C., Bresnan, E., Eds.; UNESCO: Paris, France, 2010; pp. 13–20. [Google Scholar]
  28. Hammer, Ø.; Harper, D.A.T.; Ryan, P.D. PAST: Paleontological Statistics Software package for education and data analysis. Paleontol. Electronica 2001, 4, 1–9. [Google Scholar]
  29. Clarke, K.R.; Warwick, R.M. Change in Marine Communities: An Approach to Statistical Analysis and Interpretation; Primer-E Ltd.: Plymouth, UK, 2001. [Google Scholar]
  30. Clarke, K.R.; Warwick, R.M. Similarity-based testing for community pattern: The 2-way layout with no replication. Mar. Biol. 1994, 118, 167–176. [Google Scholar] [CrossRef]
  31. Caruso, G.; Azzaro, M.; Monticelli, L.S.; Leonardi, M.; Cao, X.Y.; Zhou, Y.Y.; Song, C.L. Seasonal variations in microbial parameters and trophic states in a large Chinese shallow lake (Lake Taihu). Fresenius Environ. Bull. 2017, 26, 785–796. [Google Scholar]
  32. Clarke, K.R.; Gorley, R.N. PRIMER v6: User Manual/Tutorial (Plymouth Routines in Multivariate Ecological Research); Primer-E Ltd.: Plymouth, UK, 2006. [Google Scholar]
  33. Adams, S.M. Assessing cause and effect of multiple stressors on marine systems. Mar. Pollut. Bull. 2005, 51, 649–657. [Google Scholar] [CrossRef] [PubMed]
  34. Zaccone, R.; Caruso, G. Microbial enzymes in the Mediterranean Sea: Relationship with climate changes. AIMS Microbiol. 2019, 5, 251–271. [Google Scholar] [CrossRef] [PubMed]
  35. Celussi, M.; Zoccarato, L.; Bernardi Aubry, F.; Bastianini, M.; Casotti, R.; Balestra, C.; Giani, M.; Del Negro, P. Links between microbial processing of organic matter and the thermohaline and productivity features of a temperate river-influenced Mediterranean coastal area. Estuar. Coast. Shelf Sci. 2019, 228, 106378. [Google Scholar] [CrossRef]
  36. Zaccone, R.; Caroppo, C.; La Ferla, R.; Zampino, D.; Caruso, G.; Leonardi, M.; Maimone, G.; Azzaro, M.; Sitran, R. Deep-chlorophyll maximum time series in the Augusta Gulf (Ionian Sea): Microbial community structures and functions. Chem. Ecol. 2004, 20 (Suppl. 1), 267–284. [Google Scholar] [CrossRef]
  37. Caruso, G.; Azzaro, F.; Azzaro, M.; Decembrini, F.; La Ferla, R.; Maimone, G.; De Pasquale, F.; Monticelli, L.S.; Zaccone, R.; Zappalà, G.; et al. Environmental variability in a transitional Mediterranean system (Oliveri-Tindari, Italy): Focusing on the response of microbial activities and prokaryotic abundance. Estuar. Coastal Shelf Sci. 2013, 135, 158–170. [Google Scholar] [CrossRef]
  38. Decembrini, F.; Caroppo, C.; Caruso, G.; Bergamasco, A. Linking Microbial Functioning and Trophic Pathways to Ecological Status in a Coastal Mediterranean Ecosystem. Water 2021, 13, 1325. [Google Scholar] [CrossRef]
  39. Zaccone, R.; Azzaro, M.; Azzaro, F.; Bergamasco, A.; Caruso, G.; Leonardi, M.; La Ferla, R.; Maimone, G.; Mancuso, M.; Monticelli, L.S.; et al. Seasonal Dynamics of Prokaryotic Abundance and Activities in Relation to Environmental Parameters in a Transitional Aquatic Ecosystem (Cape Peloro, Italy). Microb. Ecol. 2014, 67, 45–56. [Google Scholar] [CrossRef]
  40. Li, Z.; Xing, M.; Wang, W.; Wang, D.; Zhu, J.; Sun, M. Phylogenetic diversity of culturable bacteria in surface seawater from the Drake Passage, Antarctica. Chin. J. Oceanol. Limnol. 2016, 34, 952–963. [Google Scholar] [CrossRef]
  41. Islam, M.S.; Tanaka, M. Impacts of pollution on coastal and marine ecosystems including coastal and marine fisheries and approach for management: A review and synthesis. Mar. Pollut. Bull. 2004, 48, 624–649. [Google Scholar] [CrossRef] [PubMed]
  42. Ibekwe, A.M.; Ma, J.; Murinda, S.E. Bacterial community composition and structure in an Urban River impacted by different pollutant sources. Sci. Total. Environ. 2016, 566–567, 1176–1185. [Google Scholar] [CrossRef] [Green Version]
  43. Liao, K.; Bai, Y.; Huo, Y.; Jian, Z.; Hu, W.; Zhao, C.; Qu, J. Integrating microbial biomass, composition and function to discern the level of anthropogenic activity in a river ecosystem. Environ. Int. 2018, 116, 147–155. [Google Scholar] [CrossRef] [PubMed]
  44. Edgcumbe Ford, T. Response of marine microbial communities to anthropogenic stress. J. Aquat. Ecosyst. Stress Recovery 2000, 7, 75–89. [Google Scholar] [CrossRef]
  45. Teira, E.; Hernando-Morales, V.; Martínez-García, S.; Figueiras, F.G.; Arbones, B.; Álvarez-Salgado, X.A. Response of bacterial community structure and function to experimental rainwater additions in a coastal eutrophic embayment. Estuar. Coast. Shelf Sci. 2013, 119, 44–53. [Google Scholar] [CrossRef]
  46. Teira, E.; Hernández-Ruiz, M.; Barber-Lluch, E.; Sobrino, C.; Teixeira, I.G.; Álvarez-Salgado, X.A.; Nieto-Cid, M.; Martínez-García, S.; Figueiras, F.G.; Fernández, E. Bacterioplankton responses to riverine and atmospheric inputs in a coastal upwelling system (Ría de Vigo, NW Spain). Mar. Ecol. Prog. Ser. 2016, 542, 39–50. [Google Scholar] [CrossRef]
  47. Gutiérrez-Barral, A.; Teira, E.; Hernández-Ruiz, M.; Fernández, E. Response of prokaryotic community composition to riverine and atmospheric nutrients in a coastal embayment: Role of organic matter on Vibrionales. Estuar. Coast. Shelf Sci. 2021, 251, 107196. [Google Scholar] [CrossRef]
  48. Catalano, G.; Azzaro, M.; Bastianini, M.; Bellucci, L.G.; Bernardi Aubry, F.; Bianchi, F.; Burca, M.; Cantoni, C.; Caruso, G.; Casotti, R.; et al. The Carbon budget in the northern Adriatic Sea, a winter case study. J. Geophys. Res. Biogeosci. 2014, 119, 1399–1417. [Google Scholar] [CrossRef] [Green Version]
  49. Caruso, G.; Zaccone, R. Estimates of leucine aminopeptidase activity in different marine and brackish environments. J. Appl. Microbiol. 2000, 89, 951–959. [Google Scholar] [CrossRef] [PubMed] [Green Version]
  50. Li, J.; Jiang, X.; Jing, Z.; Li, G.; Chen, Z.; Zhou, L.; Zhao, C.; Liu, J.; Tan, Y. Spatial and seasonal distributions of bacterioplankton in the Pearl River Estuary: The combined effects of riverine inputs, temperature, and phytoplankton. Mar. Pollut. Bull. 2017, 125, 199–207. [Google Scholar] [CrossRef] [PubMed]
  51. Cibic, T.; Fazi, S.; Nasi, F.; Pin, L.; Alvisi, F.; Berto, D.; Vigano, L.; Zoppini, A.; Del Negro, P. Natural and anthropogenic disturbances shape benthic phototrophic and heterotrophic microbial communities in the Po River Delta system. Estuar. Coast. Shelf Sci. 2019, 222, 168–182. [Google Scholar] [CrossRef]
  52. Povinec, P.P.; Aggarwal, P.K.; Aureli, A.; Burnett, W.C.; Kontar, E.A.; Kulkarni, K.M.; Moore, W.S.; Rajar, R.; Taniguchi, M.; Comanducci, J.-F.; et al. Characterisation of submarine groundwater discharge offshore south-eastern Sicily. J. Environ. Radioactivity 2006, 89, 81–101. [Google Scholar] [CrossRef]
  53. Bi, R.; Cao, Z.; Ismar-Rebitz, S.M.H.; Sommer, U.; Zhang, H.; Ding, Y.; Zhao, M. Responses of marine Diatom-Dinoflagellate competition to multiple environmental drivers: Abundance, elemental, and biochemical aspects. Front. Microbiol. 2021, 12, 731786. [Google Scholar] [CrossRef]
  54. Teeling, H.; Fuchs, B.M.; Becher, D.; Klockow, C.; Gardebrecht, A.; Bennke, C.M.; Kassabgy, M.; Huang, S.; Mann, A.J.; Waldmann, J.; et al. Substrate-controlled succession of marine bacterioplankton populations induced by a phytoplankton bloom. Science 2012, 336, 608–611. [Google Scholar] [CrossRef] [PubMed]
  55. Gomes, A.; Gasol, J.M.; Estrada, M.; Franco-Vidal, L.; Díaz-Pérez, L.; Ferrera, I.; Morán, X.A.G. Heterotrophic bacterial responses to the winter–spring phytoplankton bloom in open waters of the NW Mediterranean. Deep Sea Res. Part I 2015, 96, 59–68. [Google Scholar] [CrossRef]
  56. Sarmento, H.; Gasol, J.M. Use of phytoplankton-derived dissolved organic carbon by different types of bacterioplankton. Environ. Microbiol. 2012, 14, 2348–2360. [Google Scholar] [CrossRef]
  57. Biddanda, B.; Benner, R. Carbon, nitrogen, and carbohydrate fluxes during the production of particulate and dissolved organic matter by marine phytoplankton. Limnol. Oceanogr. 1997, 42, 506–518. [Google Scholar] [CrossRef] [Green Version]
  58. Li, H.; Xing, P.; Wu, Q.L. The high resilience of the bacterioplankton community in the face of a catastrophic disturbance by a heavy Microcystis bloom. FEMS Microbiol. Ecol. 2012, 82, 192–201. [Google Scholar] [CrossRef] [PubMed] [Green Version]
  59. Chen, H.; Zhang, H.; Xiong, J.; Wang, K.; Zhu, J.; Zhu, X.; Zhou, X.; Zhang, D. Successional trajectories of bacterioplankton community over the complete cycle of a sudden phytoplankton bloom in the Xiangshan Bay, East China Sea. Environ. Poll. 2016, 219, 750–759. [Google Scholar] [CrossRef] [PubMed]
  60. Sintes, E.; Witte, H.; Stodderegger, K.; Steiner, P.; Herndl, G.J. Temporal dynamics in the free-living bacterial community composition in the coastal North Sea. FEMS Microbiol. Ecol. 2013, 83, 413–424. [Google Scholar] [CrossRef] [Green Version]
  61. Franzo, A.; Cibic, T.; Del Negro, P.; Solidoro, C. Microphytobenthic response to mussel farm biodeposition in coastal sediments of the northern Adriatic Sea. Mar. Pollut. Bull. 2014, 79, 379–388. [Google Scholar] [CrossRef]
  62. Valenzuela-Sanchez, C.G.; Pasten-Miranda, N.M.A.; Enriquez-Ocaña, L.F.; Barraza-Guardado, R.H.; Valdez Holguin, J.E.; Martinez-Cordova, L.R. Phytoplankton composition and abundance as indicators of aquaculture effluents impact in coastal environments of mid Gulf of California. Heliyon 2021, 7, e06203. [Google Scholar] [CrossRef] [PubMed]
  63. Cibic, T.; Comici, C.; Bussani, A.; Del Negro, P. Benthic diatom response to changing environmental conditions. Estuar. Coast. Shelf Sci. 2012, 115, 158–169. [Google Scholar] [CrossRef]
  64. Falkowski, P.G. The Role of Phytoplankton Photosynthesis in Global Biogeochemical Cycles. Photosynthesis Res. 1994, 39, 235–258. [Google Scholar] [CrossRef] [Green Version]
  65. Cunha, A.; Almeida, A.; Coelho, F.J.R.C.; Gomes, N.C.M.; Oliveira, V.; Santos, A.L. Bacterial Extracellular Enzymatic Activity in Globally Changing Aquatic Ecosystems. In Current Research, Technology and Education. Topics in Applied Microbiology and Microbial Technology; Méndez-Vilas, A., Ed.; Formatex: Badajoz, Spain, 2010; pp. 124–135. [Google Scholar]
  66. Rekik, A.; Denis, M.; Dugenne, M.; Barani, A.; Maalej, S.; Ayadi, H. Seasonal distribution of ultraphytoplankton and heterotrophic prokaryotes in relation to abiotic variables on the north coast of Sfax after restoration. Mar. Pollut. Bull. 2014, 84, 280–305. [Google Scholar] [CrossRef]
  67. Richa, K.; Balestra, C.; Piredda, R.; Benes, V.; Borra, M.; Passarelli, A.; Margiotta, F.; Saggiomo, M.; Biffali, E.; Sanges, R.; et al. Distribution, Community composition, and potential metabolic activityof bacterioplankton in an urbanized Mediterranean Sea coastal zone. Appl. Environ. Microbiol. 2017, 83, e00494-17. [Google Scholar] [CrossRef] [Green Version]
  68. Misic, C.; Castellano, M.; Covazzi Harriague, A. Organic matter features, degradation and remineralisation at two coastal sites he Ligurian Sea (NW Mediterranean) differently influenced by anthropogenic forcing. Mar. Environ. Res. 2011, 72, 67–74. [Google Scholar] [CrossRef] [Green Version]
  69. Smith, V.H. Eutrophication of freshwater and coastal marine ecosystems a global problem. Environ. Sci. Poll. Res. 2003, 10, 126–139. [Google Scholar] [CrossRef] [PubMed]
  70. Malone, T.C.; Newton, A. The globalization of cultural eutrophication in the coastal ocean: Causes and consequences. Front. Mar. Sci. 2020, 7, 670. [Google Scholar] [CrossRef]
  71. European Commission. Directive 2008/56/EC of the European Parliament and of the Council of 17 June 2008 Establishing a Framework for Community Action in the Field of Marine environmental Policy. Available online: https://eur-lex.europa.eu/legal-content/EL/TXT/PDF/?uri=CELEX:32008L0056&from=EN (accessed on 24 March 2020).
  72. Ferreira, J.G.; Andersen, J.H.; Borja, A.; Bricker, S.B.; Camp, J.; Cardoso da Silva, M.; Garcés, E.; Heiskanen, A.-S.; Humborg, C.; Ignatiades, L.; et al. Overview of eutrophication indicators to assess environmental status within the European Marine Strategy Framework Directive. Estuar. Coast. Shelf Sci. 2011, 93, 117–131. [Google Scholar] [CrossRef] [Green Version]
  73. Martiny, A.C.; Vrugt, J.A.; Lomas, M.W. Concentrations and ratios of particulate organic carbon, nitrogen, and phosphorus in the global ocean. Sci. Data 2014, 1, 140048. [Google Scholar] [CrossRef] [PubMed] [Green Version]
  74. Redfield, A.C. The biological control of chemical factors in the environment. Sci. Prog. 1960, 11, 150–170. [Google Scholar]
  75. Friedrich, J.; Janssen, F.; Aleynik, D.; Bange, H.W.; Boltacheva, N.; Çagatay, M.N.; Dale, A.W.; Etiope, G.; Erdem, Z.; Geraga, M.; et al. Investigating hypoxia in aquatic environments: Diverse approaches to addressing a complex phenomenon. Biogeoscience 2014, 11, 1215–1259. [Google Scholar] [CrossRef] [Green Version]
  76. Gruber, N.; Galloway, J.N. An Earth-system perspective of the global nitrogen cycle. Nature 2008, 14, 293–296. [Google Scholar] [CrossRef]
  77. Song, C.; Cao, X.; Zhou, Y.; Azzaro, M.; Monticelli, L.S.; Leonardi, M.; La Ferla, R.; Caruso, G. Different pathways of nitrogen and phosphorus regeneration mediated by extracellular enzymes in temperate lakes under various trophic state. Environ. Sci. Pollut. Res. 2018, 25, 31603–31615. [Google Scholar] [CrossRef]
  78. Granéli, E.; Wallström, K.; Larsson, U.; Granéli, W.; Elmgren, R. Nutrient limitation of primary production in the Baltic Sea area. Ambio 1990, 19, 142–151. [Google Scholar]
  79. Garmendia, M.; Borja, Á.; Franco, J.; Revilla, M. Phytoplankton composition indicators for the assessment of eutrophication in marine waters: Present state and challenges within the European directives. Mar. Pollut. Bull. 2013, 66, 7–16. [Google Scholar] [CrossRef]
  80. Marić, D.; Kraus, R.; Godrijan, J.; Supić, N.; Djakovac, T.; Precali, R. Phytoplankton response to climatic and anthropogenic influences in the north-eastern Adriatic during the last four decades. Estuar. Coast. Shelf Sci. 2012, 115, 98–112. [Google Scholar] [CrossRef]
  81. Tarafdar, L.; Kim, J.Y.; Srichandan, S.; Mohapatra, M.; Muduli, P.R.; Kumar, A.; Mishra, D.R.; Rastogi, G. Responses of phytoplankton community structure and association to variability in environmental drivers in a tropical coastal lagoon. Sci. Tot. Environ. 2021, 783, 146873. [Google Scholar] [CrossRef]
  82. Cruz de Carvalho, M.H.; Sun, H.X.; Bowler, C.; Chua, N.H. Noncoding and coding transcriptome responses of a marine diatom to phosphate fluctuations. New Phytol. 2016, 210, 497–510. [Google Scholar] [CrossRef] [PubMed] [Green Version]
  83. Chrzanowski, T.H.; Kyle, M.; Elser, J.J.; Sterner, R.W. Element ratios and growth dynamics of bacteria in an oligotrophic shield. Lake. Aquat. Microb. Ecol. 1996, 11, 119–125. [Google Scholar] [CrossRef]
  84. Lee, S.; Fuhrman, J.A. Relationships between biovolume and biomass of naturally derived marine bacterioplankton. Appl. Environ. Microbiol. 1987, 53, 1298–1303. [Google Scholar] [CrossRef] [PubMed] [Green Version]
  85. Leonardi, M.; Azzaro, F.; Azzaro, M.; Caruso, G.; Mancuso, M.; Monticelli, L.S.; Maimone, G.; La Ferla, R.; Raffa, F.; Zaccone, R. A multidisciplinary study of the Cape Peloro brackish area (Messina, Italy): Characterisation of trophic conditions, microbial abundances and activities. Mar. Ecol. 2009, 30, 33–42. [Google Scholar] [CrossRef]
  86. Perliński, P.; Mudryk, Z.J.; Antonowicz, J. Enzymatic activity in the surface microlayer and subsurface water in the harbour channel. Estuar. Coast. Shelf Sci. 2017, 196, 150–158. [Google Scholar] [CrossRef]
  87. Ivančić, I.; Kraus, R.; Najdek, M.; Cozzi, S. Ecological importance of Alkaline Phosphatase Activity in Changing Marine Environmental Conditions. Water 2021, 13, 2750. [Google Scholar] [CrossRef]
Figure 1. Syracuse Bay. Location of the sampling stations.
Jmse 10 00019 g001
Figure 2. Multi-Dimensional Scaling (MDS) analysis computed on physical–chemical parameters (above) and on T and S data (below).
Jmse 10 00019 g002
Figure 3. Seasonal trends of autotrophic abundance and biomass (as Chl a content) and heterotrophic bacterial abundance, together with microbial activity rates, observed at human-impacted stations (HIS, Stations 1, 3, 4).
Jmse 10 00019 g003
Figure 4. Seasonal trends of autotrophic abundance and biomass (as Chl a content) and heterotrophic bacterial abundance, together with microbial activity rates, observed at the freshwater-affected station (FAS, Station 2).
Jmse 10 00019 g004
Figure 5. Seasonal trends of autotrophic abundance and biomass (as Chl a content) and heterotrophic bacterial abundance, together with microbial activity rates, observed at the control stations.
Jmse 10 00019 g005
Table 1. Geographical coordinates of the sampling stations within Syracuse Bay.
StationMain CharacteristicsLatitude NLongitude E
1Shipyard station, harbor37.06415.279
2Aretusa springwater37.05615.292
3Anapo-Ciane river mouth37.05615.272
4Shellfish farm37.03515.281
5Control marine station37.03915.296
6Control marine station37.04815.291
Table 2. Outputs of SIMPER analysis showing, in a decreasing order, the percentage contribution of each parameter to the within-groups similarity. The parameters shared as highly contributing drivers are reported in bold.
StationMain CharacteristicsSquared DistanceHighly Contributing Parameters
1Human-impacted29.64NO3, TN
3Human-impacted34.37NH4, TN, PO4, S
4Human-impacted14.74DO, TP, TN, NO3
2Freshwater-affected26.36S, TSM, NH4, NO3, DO
5Control16.18TN, pH, DO
6Control29.20pH, TSM, TN, S, DO
Table 3. Mean values ± standard deviation of the environmental parameters measured in the Syracuse bay, separately per human-impacted stations (HIS), Stations 1, 3 and 4; freshwater-affected (FAS), Station 2; control stations (control), Stations 5–6.
Stations
HISFASControl
Parameters134256
Temperature (°C)22.77 ± 4.1822.73 ± 5.0522.01 ± 4.4122.08 ± 4.5722.72 ± 4.7122.18 ± 4.88
Salinity38.56 ± 0.3538.06 ± 0.9938.10 ± 0.6437.55 ± 1.5537.98 ± 0.2938.10 ± 0.77
Diss.Oxygen (mg/L)6.72 ± 0.967.22 ± 0.977.08 ± 1.046.87 ± 1.357.14 ± 1.107.65 ± 0.94
pH8.22 ± 0.288.34 ± 0.488.24 ± 0.288.17 ± 0.338.31 ± 0.378.37 ± 0.49
NH4(µM)1.06 ± 0.441.68± 1.171.13 ± 0.331.65 ± 1.651.15 ± 0.501.06 ± 0.51
NO2 (µM)0.23 ± 0.290.61 ± 1.090.15 ± 0.090.20 ± 0.310.19 ± 0.090.18 ± 0.08
NO3 (µM)3.90 ± 4.303.81 ± 2.523.91 ± 4.145.01 ± 5.452.07 ± 1.203.07 ± 2.29
TN (µM)7.78 ± 5.009.75 ± 7.818.75 ± 6.838.15 ± 6.177.31 ± 6.907.39 ± 5.82
PO4 (µM)0.33 ± 0.260.91 ± 1.230.26 ± 0.190.24 ± 0.120.25 ± 0.210.25 ± 0.13
TP (µM)1.81 ± 0.772.56 ± 1.532.18 ± 2.101.59 ± 0.981.40 ± 0.541.38 ± 0.47
N/P15.51 ± 14.116.74 ± 13.7120.08 ± 23.1228.58 ± 29.8113.64 ± 18.1617.24 ± 18.20
TSM (mg/L)82.91 ± 136.8375.41 ± 54.4343.46 ± 42.47172.92 ± 348.6640.24 ± 22.41120.80 ± 187.06
POC µgC/L)818.23 ± 1497.822496.55 ± 5375.91504.21 ± 409.47333.01 ± 264.87433.66 ± 425.30553.87 ± 651.08
PN (µgN/L)159.53 ± 332.92430.50 ± 933.1182.62 ± 61.3645.04 ± 22.9473.59 ± 63.7597.17 ± 116.46
C/N6.04 ± 0.926.02 ± 0.596.11 ± 1.217.17 ± 2.455.85 ± 0.845.86 ± 0.49
Table 4. Mean values ± standard deviation of the microbiological parameters measured in the Syracuse bay, separately per human-impacted stations (HIS), Stations 1, 3 and 4; freshwater-affected (FAS), Station 2; control stations (control), Stations 5–6.
Stations
HISFASControl
Parameters134256
Tot.Phytopl.
(cells/L)
8.70 × 10⁵ ± 3.66 × 1063.99 × 106 ± 1.03 × 1074.65 × 105 ± 8.79 × 1053.39 × 105 ± 4.78 × 1051.80 × 105 ± 1.88 × 1055.77 × 106 ± 1.57 × 10⁷
Diatoms (cells/L)1.04 × 104 ± 1.90 × 1046.09 × 104 ± 1.58 × 1055.73 × 104 ± 1.64 × 1051.31 × 105 ± 3.57 × 1053.71 × 104 ± 9.15 × 1045.57 × 106 ± 1.57 × 10⁷
Dinofl. (cells/L)8.92 × 105 ± 3.74 × 1063.93 × 106 ± 1.03 × 1073.57 × 105 ± 8.97 × 1051.80 × 105 ± 4.04 × 1068.19 × 104 ± 1.69 × 1051.65 × 105 ± 2.36 × 10⁵
Others (cells/L)6.44 × 103 ± 9.67 × 1031.13 × 104 ± 1.46 × 1045.11 × 104 ± 9.54 × 1042.76 × 104 ± 2.07 × 1046.14 × 104 ± 1.05 × 1054.01 × 104 ± 9.63 × 10⁴
Chl a (mg/m3)2.95 ± 4.047.02 ± 9.923.00 ± 2.391.23 ± 1.163.21 ± 2.163.63 ± 2.21
Het. Bacteria
(CFU/mL)
2.88 × 10³ ± 2.81 × 1032.46 × 103 ± 2.37 × 1032.39 × 103 ± 1.40 × 1031.64 × 103 ± 5.84 × 1021.21 × 103 ± 3.97 × 1022.28 × 103 ± 9.24 × 10²
LAP (nmol/L/h)41.75 ± 81.4554.58 ± 113.9136.56 ± 70.5512.31 ± 13.1148.35 ± 94.4036.43 ± 82.29
GLU (nmol/L/h)6.91 ± 14.125.39 ± 5.363.42 ± 4.212.50 ± 2.512.69 ± 5.164.06 ± 4.81
AP (nmol/L/h)61.77 ± 80.5079.36 ± 142.3391.25 ± 164.6365.27 ± 126.8382.56 ± 124.1253.90 ± 105.16
Table 5. Eigenvectors values showing the relative contribution of each parameter to Principal Components at human-impacted stations (HIS), freshwater-affected stations (FAS) and control stations (Controls).
VariableHISFASControls
PC1PC2PC1PC2PC1PC2
T0.0720.258−0.3260.061−0.1680.219
S0.208−0.2220.2490.1970.311−0.003
DO0.0270.1360.257−0.1830.072−0.353
Transp0.1940.111−0.2870.0130.2450.088
pH−0.0110.296−0.280−0.041−0.2520.252
TP−0.122−0.2370.103−0.1120.1450.101
PO40.018−0.133−0.1530.234−0.0900.283
TN−0.2610.256−0.107−0.365−0.285−0.237
NH4−0.0380.2360.043−0.285−0.227−0.081
NO2−0.042−0.1470.059−0.218−0.085−0.163
NO3−0.2870.094−0.133−0.344−0.304−0.017
-TSM−0.145−0.1780.0150.0820.1230.030
POC−0.364−0.044−0.1820.164−0.2920.077
PN−0.371−0.047−0.0530.018−0.2980.018
Tot Phytopl.−0.367−0.0760.0670.276−0.1200.262
Diatoms0.0100.310−0.2280.228−0.1230.263
Dinoflagellates−0.367−0.0800.2830.1220.128−0.102
Others0.096−0.115−0.0250.0800.163−0.050
Chl a−0.349−0.0360.2820.175−0.2480.199
Phaeo−0.1400.1030.2900.1320.0340.285
Het.bacteria0.085−0.081−0.3210.0090.0490.117
LAP−0.0220.3760.021−0.282−0.195−0.249
GLU−0.0890.2330.176−0.207−0.257−0.297
AP0.0110.410−0.161−0.234−0.233−0.126
Publisher’s Note: MDPI stays neutral with regard to jurisdictional claims in published maps and institutional affiliations.

