Article

Study on the Drying Process and the Influencing Factors of Desiccation Cracking of Cohesive Soda Saline-Alkali Soil in the Songnen Plain, China

1
Heilongjiang Province Key Laboratory of Geographical Environment Monitoring and Spatial Information Service in Cold Regions, Harbin Normal University, Harbin 150025, China
2
Northeast Institute of Geography and Agroecology, Chinese Academy of Sciences, Changchun 130102, China
*
Author to whom correspondence should be addressed.
Agriculture 2023, 13(6), 1153; https://doi.org/10.3390/agriculture13061153
Submission received: 28 April 2023 / Revised: 27 May 2023 / Accepted: 28 May 2023 / Published: 30 May 2023
(This article belongs to the Special Issue Soil Degradation and Remediation)

Abstract

:
The surface of cohesive soda saline-alkali soil in the Songnen Plain of China exhibits obvious desiccation cracking phenomenon during water evaporation. Quantitative research on the process and influencing factors of desiccation cracking are significant for determining the mechanical properties of salt-affected soil, improving the salinization status and the local ecological environment. This study aims to conduct laboratory-controlled cracking experiments on soda saline-alkali soils, and to regularly measure the soil moisture and the cracking status of 40 soil samples. After processing the crack images uniformly, crack characteristics including crack length, crack area, contrast texture feature, and box-counting fractal dimension are extracted. The results indicate that the decrease in soil moisture can be divided into three stages such as fast evaporation stage, slow evaporation stage and stable evaporation stage, and that the evaporation rate shows a linear negative correlation with soil salinity. The measurements also indicate that crack length rapidly increases and reaches stability with a decrease in water content compared with the crack area. The high correlation between different crack characteristics and the soil total salinity (correlation coefficient from 0.44 to 0.95) shows that salt content is the dominant factor affecting the desiccation cracking of soda saline-alkali soil. A multiple linear regression prediction model was finally established based on crack characteristics for different salinity parameters with high prediction accuracy for Na+, EC and total salinity (R2 > 0.91 and RPD > 2.5) and also certain prediction accuracy for Cl and CO32− (R2 > 0.66 and RPD > 1.5).

1. Introduction

Shrinkage and cracking on the surface of cohesive soil are becoming more and more serious in the context of global warming, increasing the duration and frequency of drought in several areas in the world [1]. In agricultural production, desiccation crack on the soil surface increases the evaporation of soil moisture, the size and shape of desiccation crack can also affect the transfer of water, nutrients, and microorganisms in the soil [2,3,4,5,6]. Soil salinization is considered a typical type of land degradation, which severely affects the physical and chemical properties of the soil, inhibits the growth of vegetation and also poses significant harm to the local ecological environment [7,8,9]. In nature, shrinkage and cracking of cohesive saline-alkali soil during water evaporation is a very common phenomenon. Therefore, exploring the process of shrinkage and cracking on the surface of cohesive saline alkali soil is of great significance for measuring the salinity levels, obtaining the spatial distribution of salt content, determining the mechanical and engineering properties of salt-affected soil, and achieving soil saline alkali improvement.
Desiccation cracking of clayey soil is closely related to the physical and chemical properties of soil, and is also influenced by other natural and laboratory conditions such as soil temperature, humidity, dry wet cycle, and sample preparation. Specifically, Zhao et al. [10] studied the effect of clay content on shrinkage cracking of cohesive soil, their results indicate that clay considerably mitigates the plastic settlement while significantly aggravates the plastic shrinkage and generates more severe cracking. After measuring the contents of illite, kaolinite and montmorillonite for five different types of expansive clayey soils, Puppala et al. [11] turned out clay minerals can affect swell-shrinkage cracking desiccation cracking due to their different plasticity indexes. Sridharan and Jayadeva [12] showed that clay types significantly affect the distance between parallel clay platelets and void ratio. After conducting desiccation cracking tests with two types of clayey soils, Tang et al. [13] concluded that the desiccation cracking ratio and the crack width of soils increased with the plasticity index. Vail et al. [14] found that desiccation cracks in bentonite soils could be severe compared with other clay types since the presence of smectite with a high swell-shrink capacity. Tang et al. [15] studied the influence of temperature on the occurrence and development of cracks in cohesive soil through controlled experiments, and the results showed that the number of nodes, cracks, total crack length, crack rate, and block number of surface cracks decreased with increasing temperature, yet the average length, average width, average block area, and block area of cracks changed conversely with the temperature. Xie et al. [16] studied the shrinkage cracking and strength deterioration of red clay under different drying and wetting cycles, they found that the cohesion and internal friction angle of red clay strength can be quantified using the crack rate, which lays the basis for judging soil strength based on crack rate, and solving actual engineering problems with the red clay. Tian et al. [17] investigated the effects of compaction state and wetting-drying cycles on desiccation cracking behaviour of a clayey soil, they found that high water content can promote the development of desiccation and decrease the crack ratio, total crack length and average crack width of clayey soil. Meng et al. [18] studied the effect of sample thickness on the hydration cracking of compacted bentonite, they found that thickening the sample inhibited the development of hydration cracks and simplified the crack network notably, indicated by a decreasing trend of crack amount, length and area. DeCarlo et al. [19] studied the effect of sample size on soil cracking process through density correlation function, their results showed that the duration of cracking and crack density decreased with the increase of sample size, while the crack length and crack width showed a completely opposite trend.
Crack characteristics can be obtained through traditional manual measurement methods and digital image processing methods. Regarding early manual measurements of desiccation cracks, Inoue [20] estimated the length of cracks in soil samples by calculating the number of intersections between a cross-section and cracks. Dasog et al. [21] proposed a standard to measure the total crack length within a region of 1 m2 by using thin lines. After comparing previous research, Ringrose-Voase et al. [22] have developed a new method for measuring crack length by connecting six semi-circular rings with a diameter of 1 m together as a measuring tool. Novak [23] measured the approximate depth of crack region using an elastic plastic thin rod with a scale, and then calculated the crack volume by combining the depth and width of soil crack. Samouelian et al. [24] used electrical resistance imaging method to measure the surface area and volume of cracked regions. With the development of computer technology and image processing technology, more and more research have been focused on extracting the crack characteristics based on morphology. Specifically, Liu et al. [25] developed a software (CIAS) to quantify crack patterns automatically by extracting various geometric parameters of crack network such as crack number, node number, crack area, crack width, crack length. Wang et al. [26] recorded crack patterns with a digital camera, and employed digital image processing and morphological algorithms to depict crack patterns using a series of geometric indexes such as crack ratio, length, mean width. After capturing images of soil surface by a high-resolution camera at certain time intervals to track the spatiotemporal evolution of crack morphology, Liu et al. [27] computed crack area ratio, average crack length, and total crack length of soil samples and analyzed the effect of bottom ash on crack characteristics to explore the possibility of recycled usage of bottom ash for soil improvement. Tang et al. [28] used a digital camera to record the dynamic process of soil desiccation cracks in real-time, they also pointed out that digital image processing technique can effectively obtain the soil deformation without disturbing the soil sample, which offers an available way for understanding the intrinsic dynamic mechanisms of soil desiccation cracking. Taheri and El-Zein [29] also tracked surface cracking with a digital camera in real-time, their captured photos were then analyzed by image processing to quantify crack ratio and surface area of soil clods. In addition, 3D images especially for those extracted from X-ray computed tomography were also processed for representative geometrical parameters including soil mass area, shrinkage strain, crack ratio, average crack width, total crack length, and crack segment number to quantify the morphological evolution of desiccation crack patterns [30,31,32,33]. Although there are many studies on the characterization of desiccation crack, most of them mainly only focused on extracting the geometric features and topological relationships of crack networks and rarely mentioned the spatial distribution and self-similarity of desiccation cracks.
As the main soil type in arid and semi-arid regions, the cohesive saline-alkali soils were easy to develop desiccation cracking on their surface. The moist saline-alkali soils are composed of four different substances including solid, liquid, gas and salt, indicating that both salt content and salt mineral type can pose a great effect on the process of desiccation cracking of salt-affected soil. Although much of the existing research have focused on the correlation analysis between crack characteristics and salt content in completely dried saline soil, very few of them have involved the process, the development law and the impact mechanism of desiccating cracking of saline-alkali soil [34,35,36,37,38]. The description of crack characteristics in existing research mainly depends on the geometric features. However, texture features and fractal dimension are rarely used to quantify the degree of drying cracks, even though they can effectively quantify the statistical characteristics, spatial distribution and self-correlation of the crack patterns. In this study, a typical cohesive soda saline-alkali soil in the Songnen Plain of China was selected as the research object, a laboratory-controlled cracking test was then conducted using 40 soil samples with different salinity levels. Different types of crack characteristics including crack length, crack area, contrast texture feature and box-counting dimension were then calculated to study the dynamic process, the influencing factors and the scale effects of desiccation cracking of soda saline-alkali soil. In addition, this study also attempts to develop predictive models for different salt parameters based on the correlation analysis carried out between the physiochemical properties and the crack characteristics mentioned above, which thus can provide theoretical and decision-making support for online estimation method of salinity levels, improvement of soil properties and engineering geological survey of soda salt-affected soil.

2. Materials and Methods

2.1. Study Area and Soil Sampling

The saline-alkali soil in the Songnen Plain is widely distributed with the main salt minerals composed of sodium carbonate (Na2CO3) and sodium bicarbonate (NaHCO
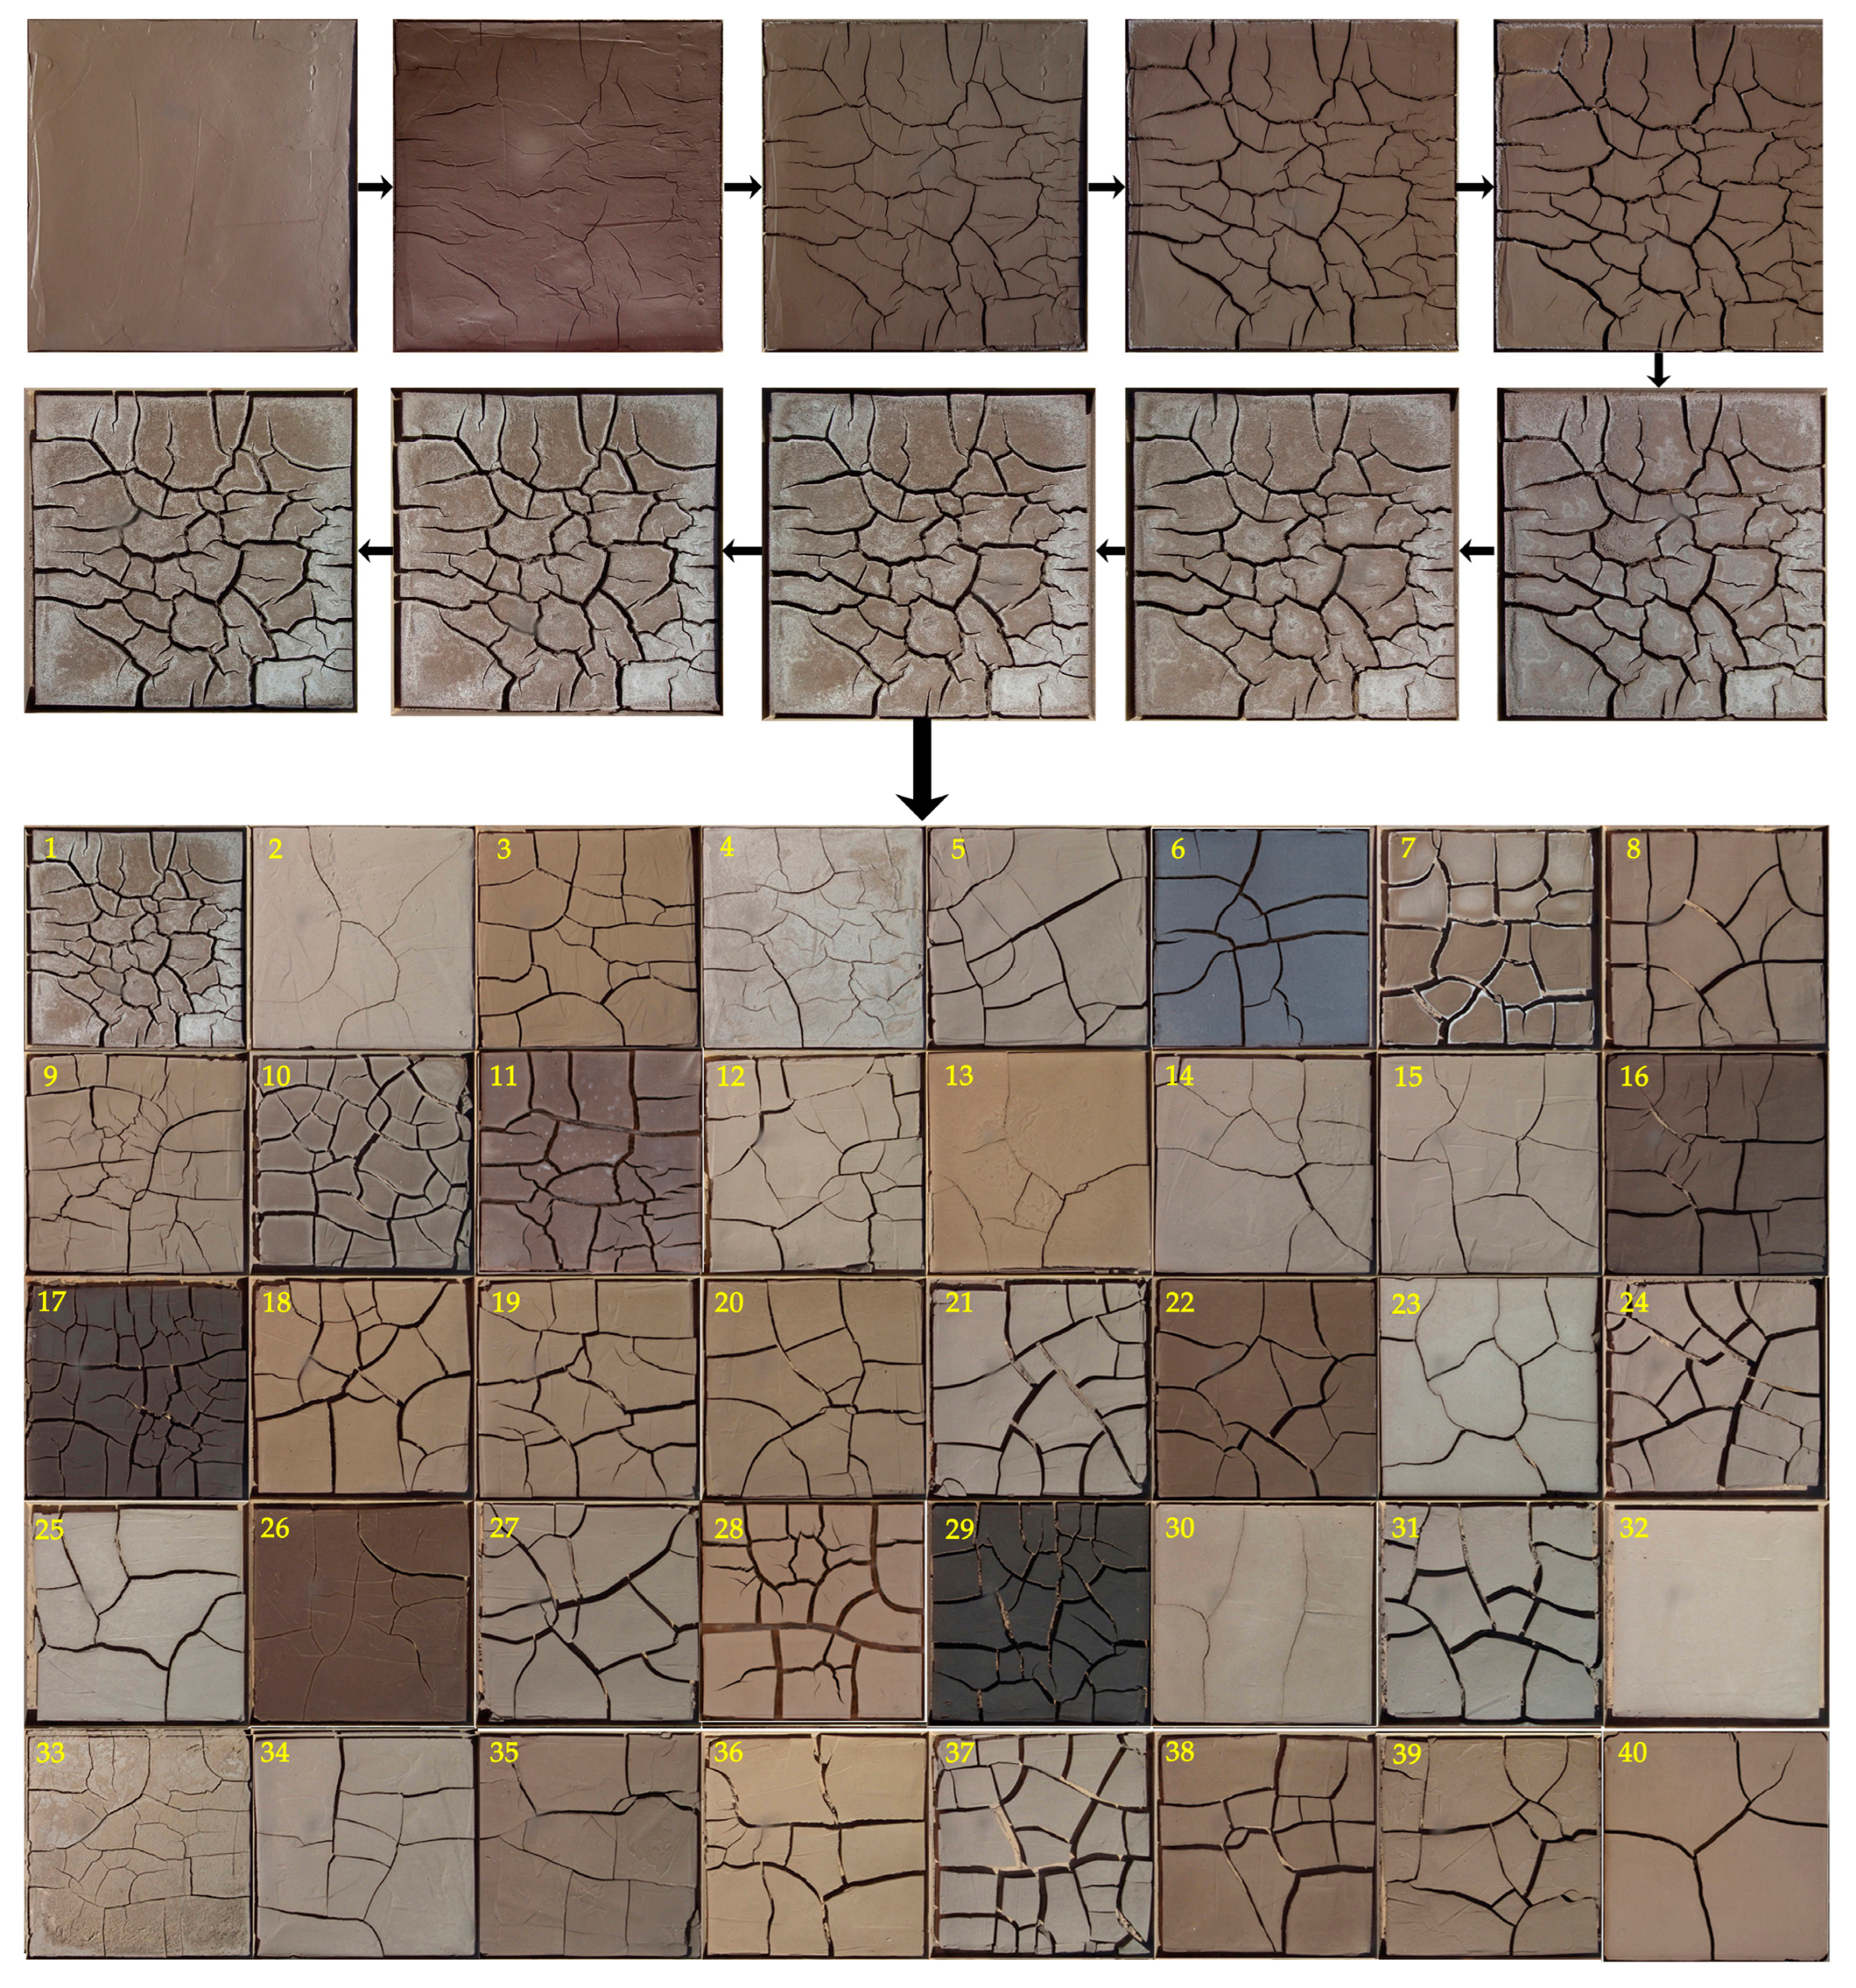
3), which is commonly considered as one of the three distributed areas of soda saline-alkali soil in the world. Da’an City in the western part of the Jilin Province is selected as the study area in this study, which locates in the western part of Songnen Plain and belongs to a typical climate of temperate continental monsoon. The annual average temperature in Da’an City refers to 4.5 °C with the annual minimum and maximum values of −35 °C and 36.9 °C, respectively. In addition, the rainfall in this area is concentrated in July and August, with annual average evaporation of up to 1900 mm; however, the annual average amount of precipitation is only maintained at approximately 400 mm. This severe unbalanced evaporation-precipitation ratio, coupled with the poor hydrogeological conditions, the impact of local special terrain, and unreasonable anthropogenic activities including flood irrigation by rivers, excessive deforestation, overgrazing and over-cultivation have made the study area one of the most severely salinized regions in the Songnen Plain. In addition, the clay content in this study area is relatively high, indicating that desiccation cracking is commonly generated on the soil surface during water evaporation. Therefore, After fully considering the heterogeneity of soil salinity levels and crack conditions, 40 soil samples with different salinity levels (123°42′34″ E to 124°6′1″ E and 42°23′57″ N to 45°39′57″ N) were obtained from the top 20 cm in this study (shown in Figure 1) since this kind of salt-affected soil with bad infiltration capacity can largely prevent salt moving downward, indicating that the soil properties are thus stable from the top soil layer. Specifically, 20 kg soil was excavated with a shovel and loaded in a sack for each sampling point, and then transported back to the laboratory by truck. All soil samples were completely dried in the oven in order to remove the residual water, and then ground and passed through a 2 mm sieve. After that, they were further divided into two sub-samples for independent analysis. The first part of the sub-samples were used for soil properties measurements, and the second part of the sub-samples were selected to conduct laboratory-controlled desiccation cracking tests.

2.2. Soil Property Measurements

In this study, the physical and chemical properties of all soil samples were measured in the laboratory, which mainly composed of the content of eight ions of salt-affected soils, pH, electrical conductivity (EC), exchangeable sodium saturation percentage (ESP) and particle size distributions. Note that all ion contents were measured using a soil extract with a soil/water mass ratio of 1:5. Especially, K+ and Na+ contents were measured by flame photometer method; Mg2+ and Ca2+ contents were determined based on EDTA complexometric titration method; Cl content was measured using AgNO3 solution titration method; CO32− and HCO3 contents were obtained through double indicator neutralization method; the measurement of SO42− content was ignored since it is almost absent within the Songnen Plain. Note that the soil total salinity refers to the sum of ion content in the soil solutions. The pH and EC values of soil samples were measured using soil suspensions with a soil/water mass ratio of 1:5 by the potentiometric method and the conductometric method, respectively. In addition, a Mllvern MS-200 laser particle size analyzer was also selected to determine the particle size distributions of all the soil samples [39].

2.3. Crack Scale Computation

In order to determine the crack scale of cohesive soda saline-alkali soil, a typical cracked soil sampling point was selected in this study under natural conditions, a square wooden frame with a side length of 1 m was placed on the ground and vertically photographed at 1 m, Figure 2 represents the photography of cracked soil surface in nature and the corresponding image. After geometric correction and clipping of the crack image, the color image is converted into a grayscale pattern by calculating the average value of the red, green, and blue color components. A random seed point was then set in the image and used as the center to calculate the average gray level within a square mask with increasing side lengths. After that, the stable scale of 40 cm was finally determined through the function curve between the mean values and the side length, which is the same as the extracted crack scale on the surface of soda saline-alkali soil in Songnen Plain extracted by Ren et al. [40] using the Markov chain theory.

2.4. Desiccation Cracking Test

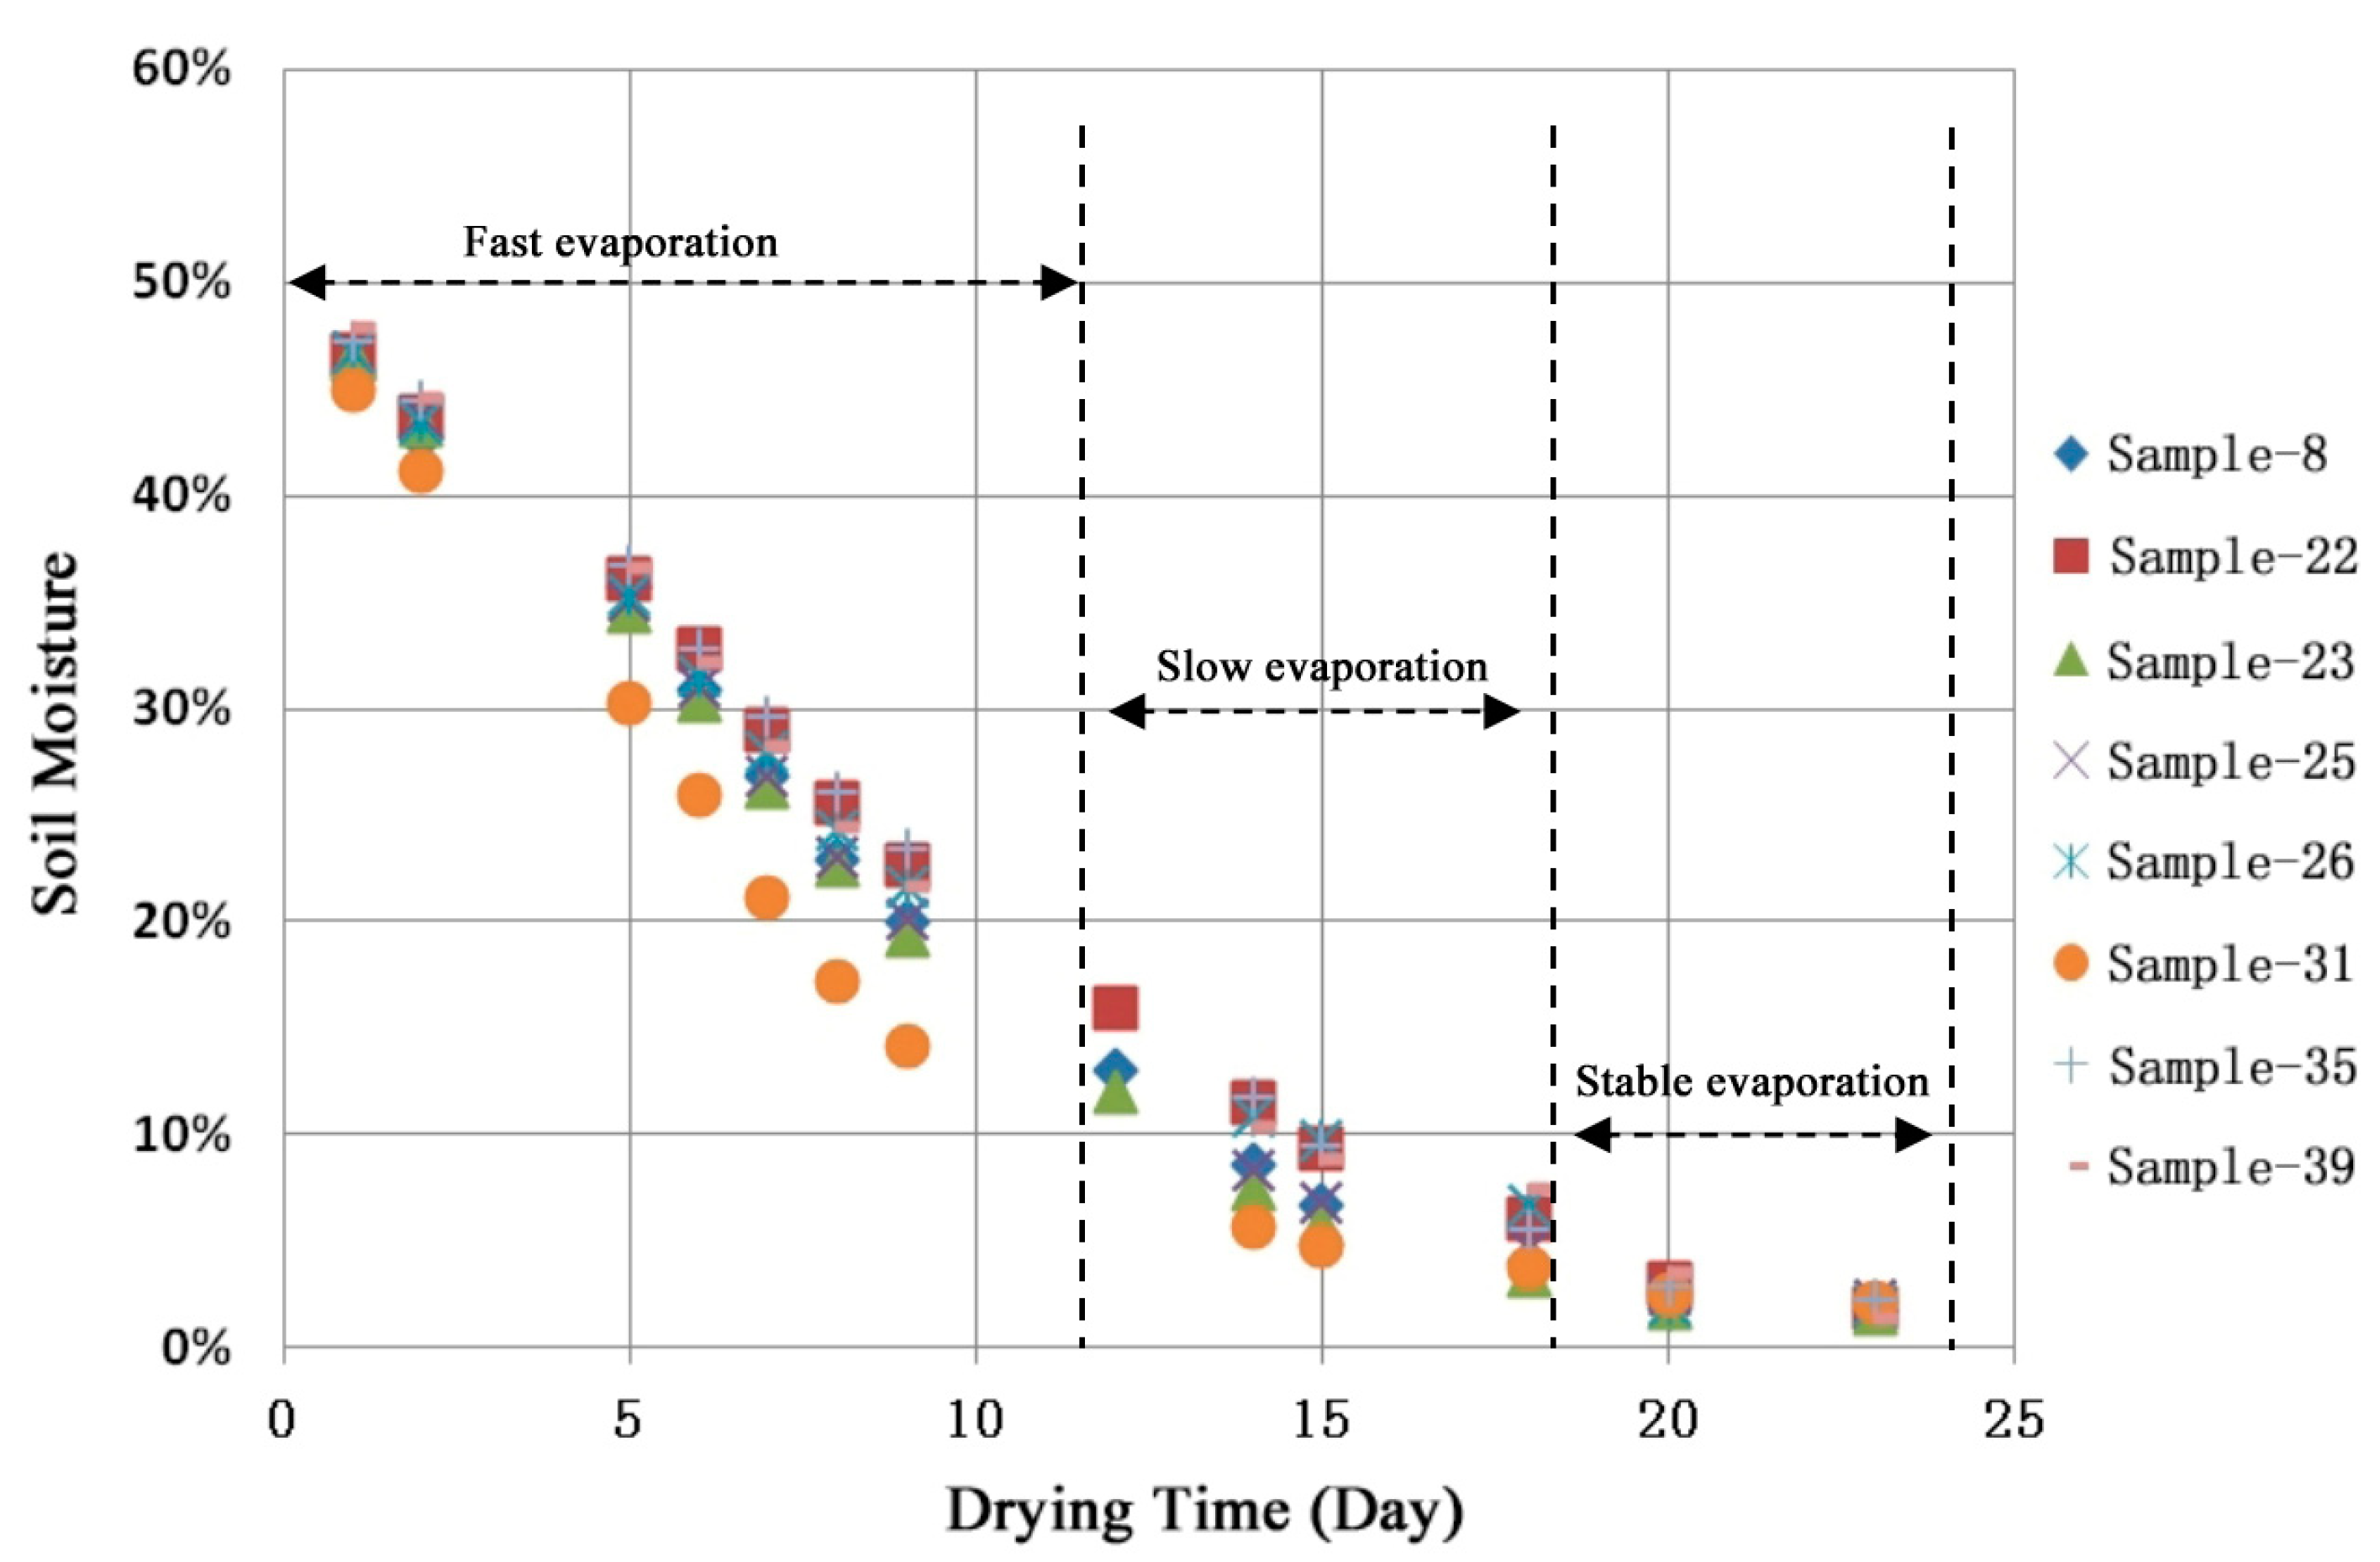
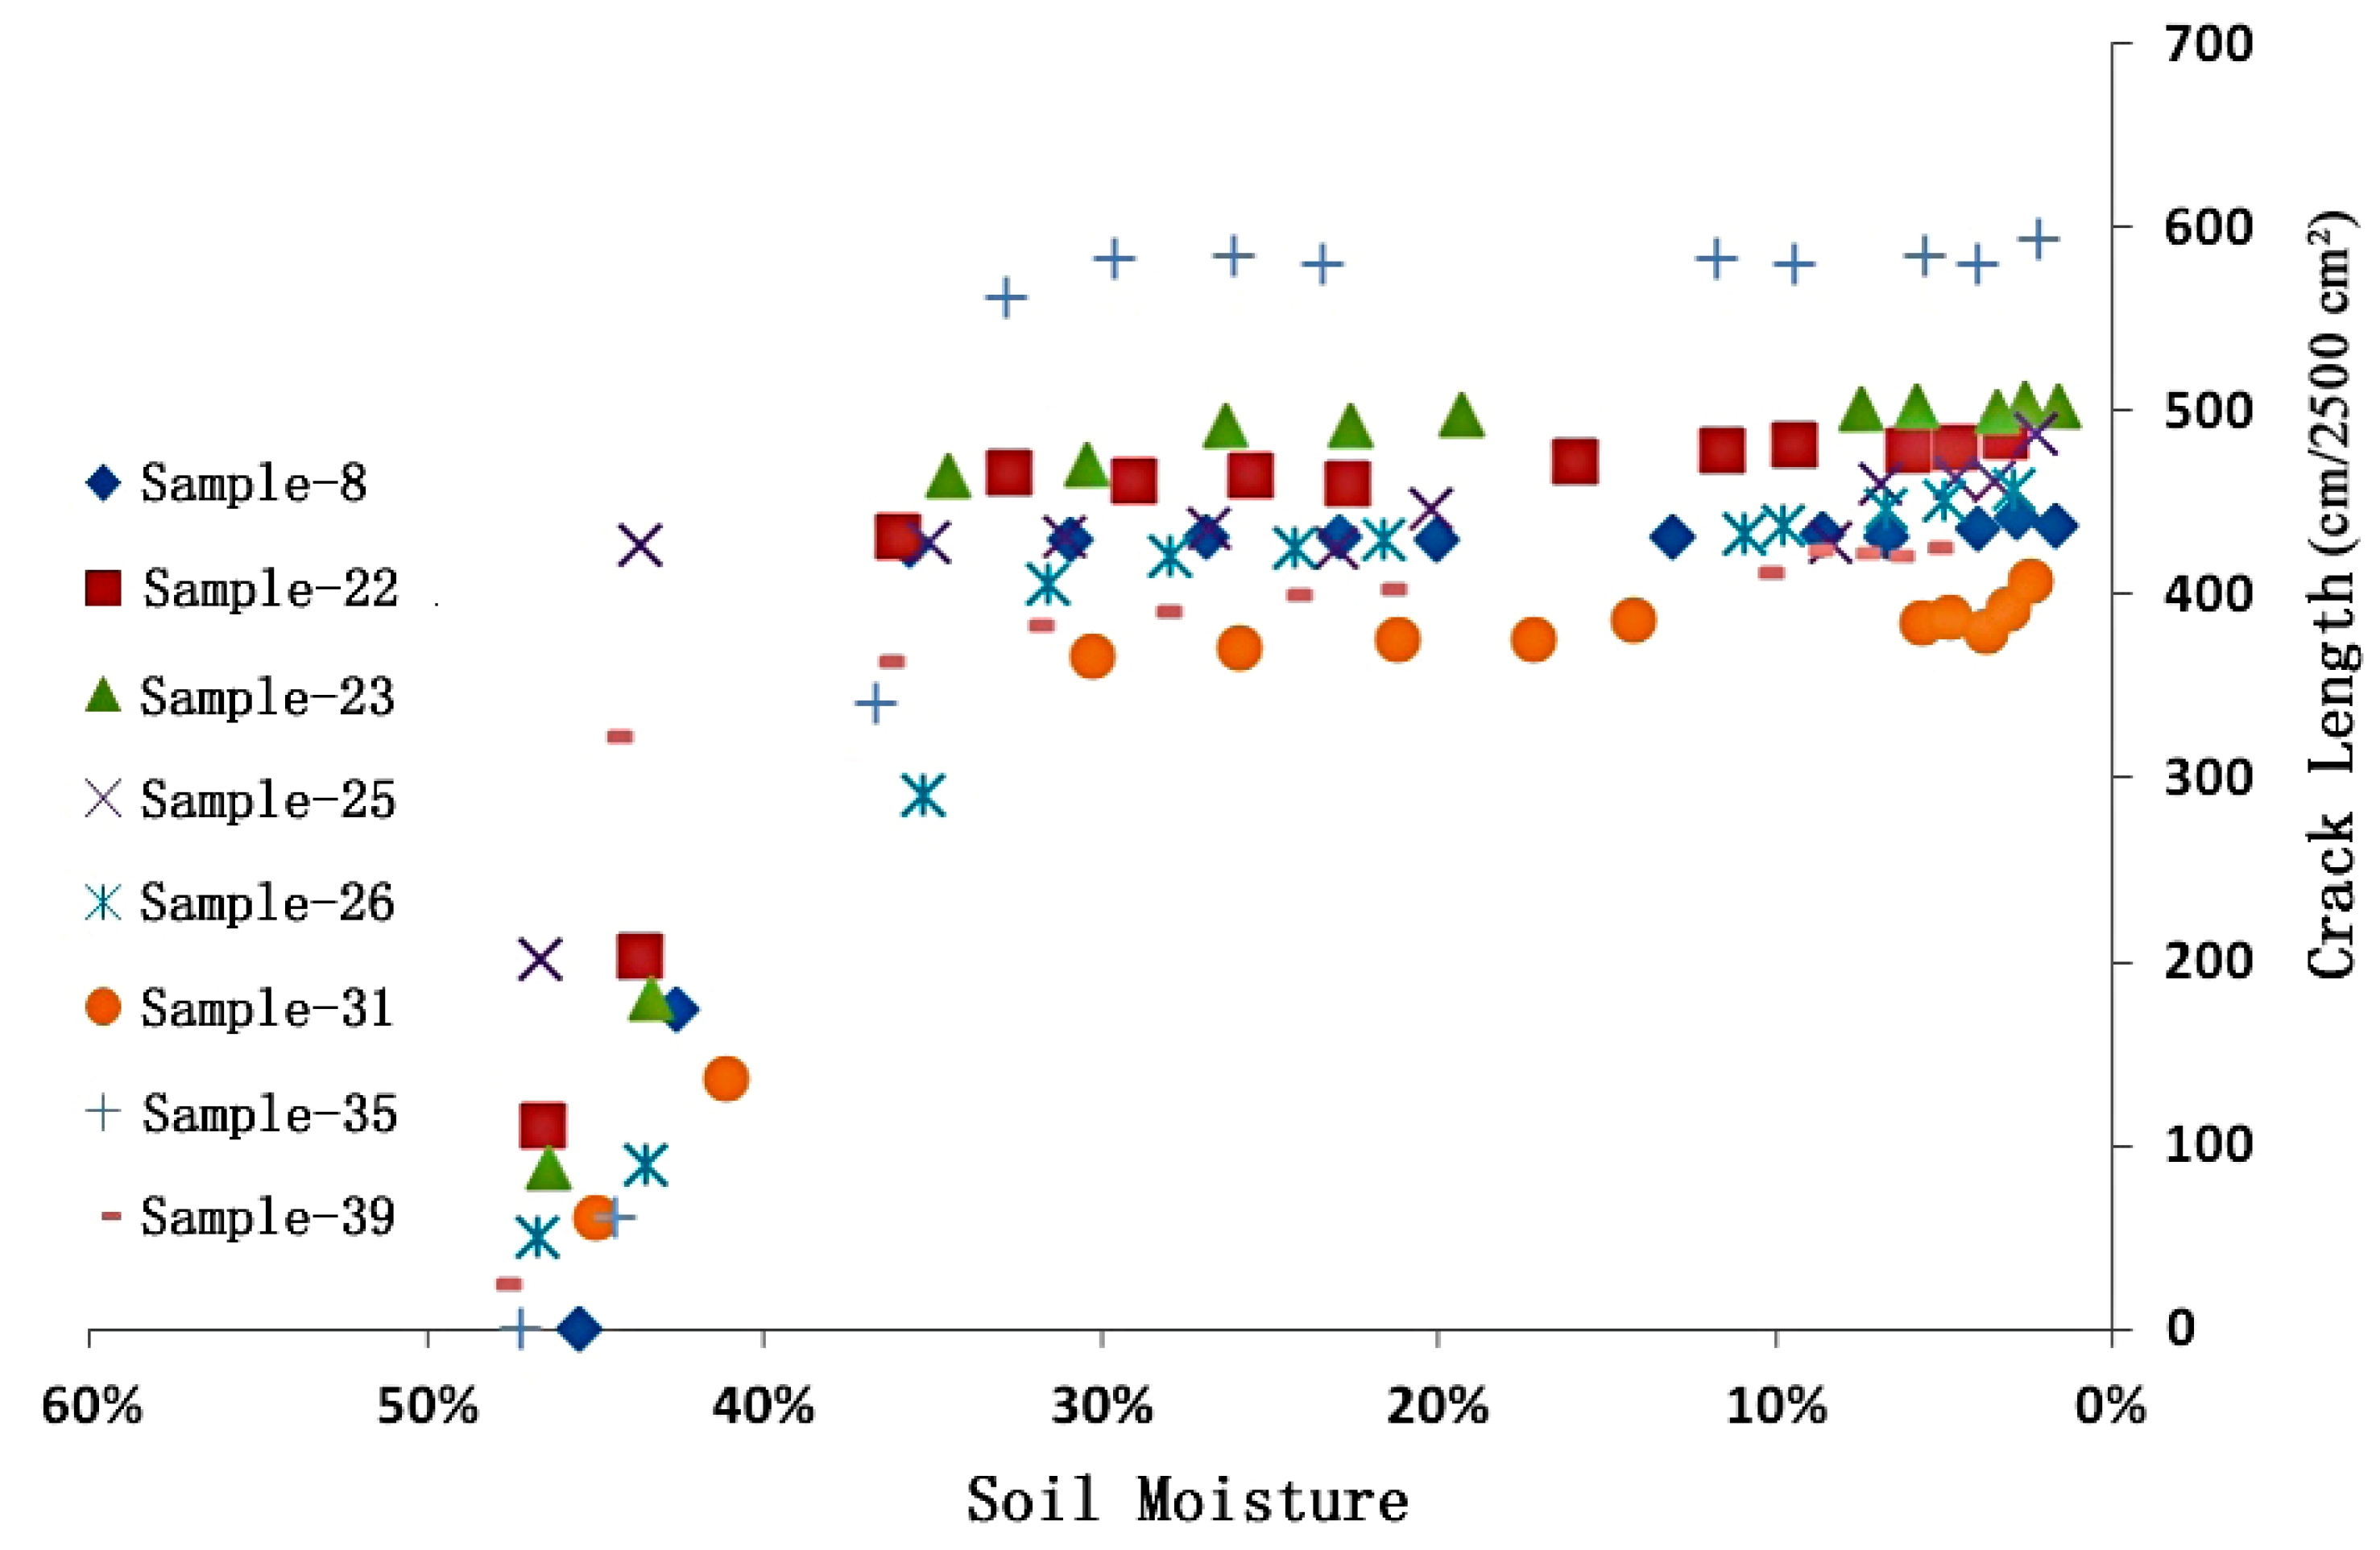
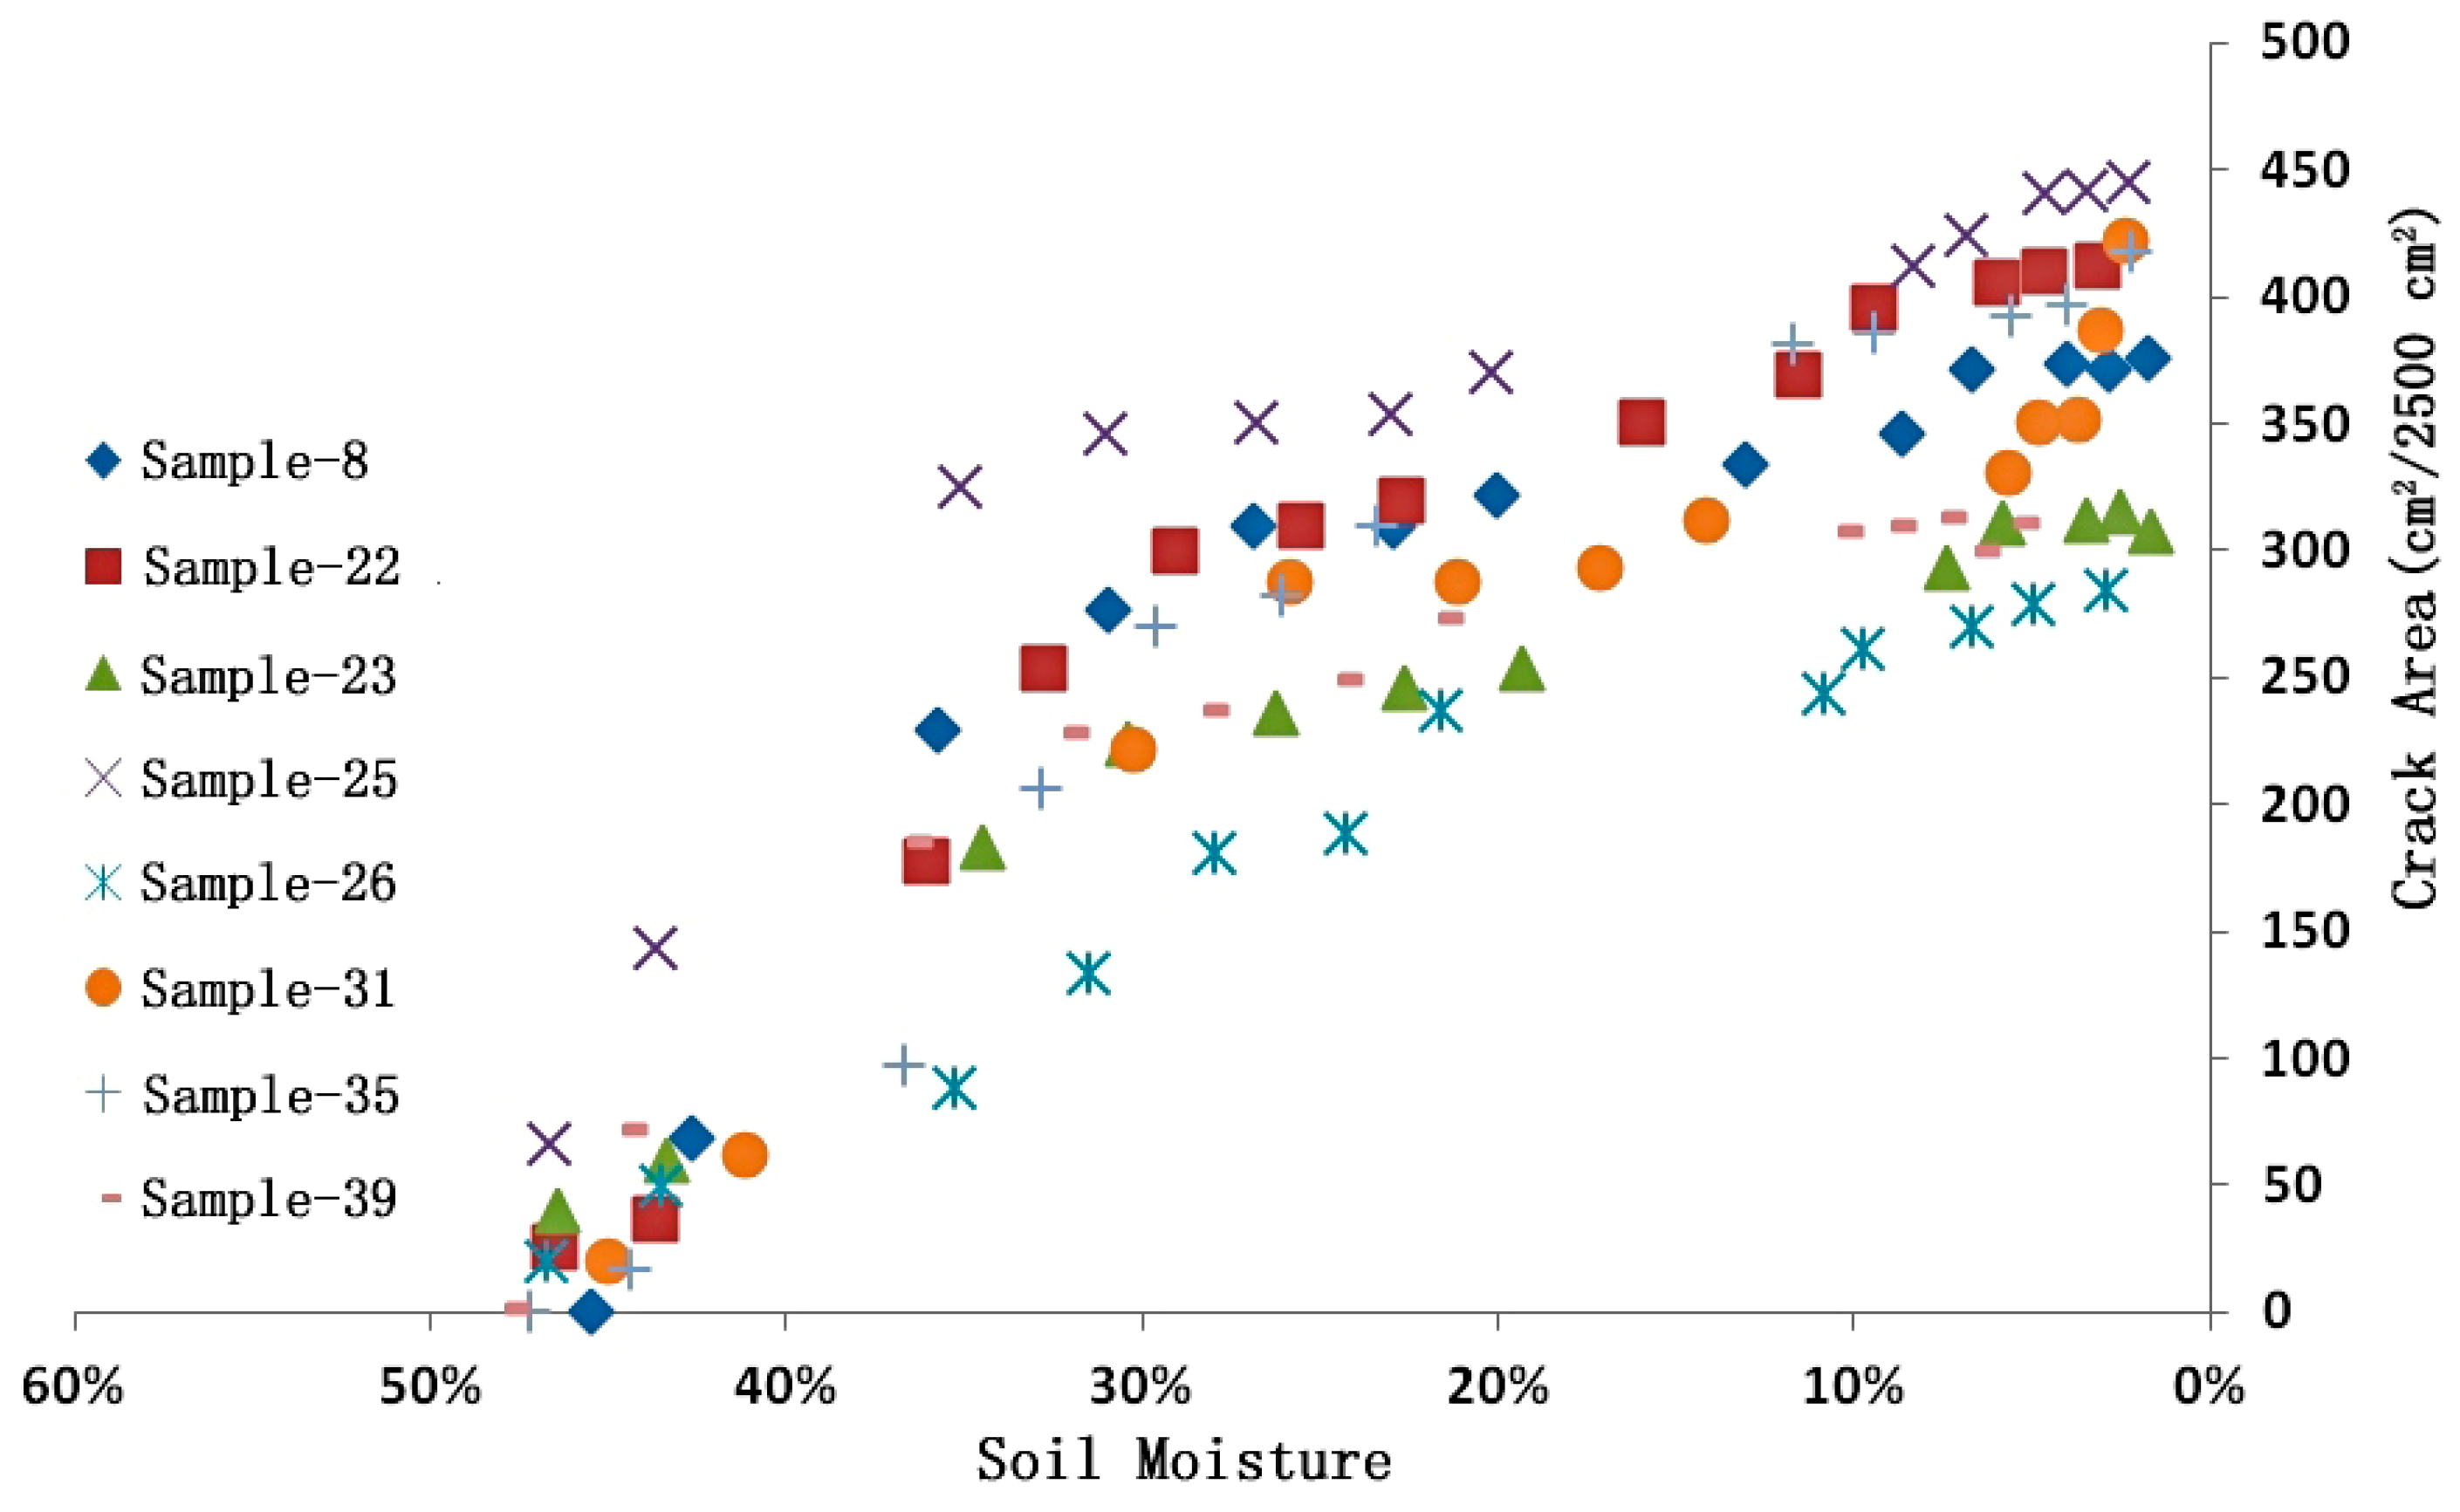
To study the cracking process of soil under controllable laboratory conditions, impurities such as grass debris were removed from the treated soil samples. Subsequently, saturated slurries with the same initial mass water content of 50% were prepared using grounded and sieved soil samples. After considering the friction and permeability at the bottom of the sample box, rectangle wooden sample boxes with uniform sizes of 50 cm × 50 cm × 3 cm were prepared according to the crack scale computed above. The prepared saturated slurries of all soil samples were then put into the wooden sample boxes with surface smoothed. Afterwards, each soil sample was weighed and put all the soil samples processed in the laboratory for a desiccation cracking test with the same experimental conditions (temperature of 25 °C, humidity of 35%, atmospheric pressure of 101 kPa). In order to study the effect of soil salinity on the process of water evaporation and the formation of cracks, and to quantify the relationship between crack parameters and soil moisture, 8 samples with uniformly distributed salinity were selected in this study (Sample 8, Sample 22, Sample 23, Sample 25, Sample 26, Sample 31, Sample 35, and Sample 39) for the dynamic changes. The 8 soil samples were selected in steps of 3 mg/g based on the sorted total soil salinity of all 40 samples, which can be used to well recognize the difference in crack characteristics with water content. Each selected soil sample was put on a fixed electronic scale and weighed 13 measuring times within 26 days during the drying process. Specifically, every saturated slurry was first weighed for the initial mass in order to compute the initial mass of both water and soil. The loss in water content was then determined based on the difference between the initial and the measured mass of the soil sample, and soil moisture content was further computed at each measuring time accordingly. After weighing the selected samples each time, standard procedures were used to take photos of the surface cracking status of the 8 selected soil samples. Especially, a digital camera (sensor: SONY IMX178 COMS, maximum resolution: 3072 × 2048 pixels, focal length: 30 mm, lens aperture: F8) was horizontally fixed on a metal bracket with a height of the camera lens kept 1 m vertically above the ground. Second, the projection center of the digital camera was marked on the ground and considered the diagonal center of a rectangular region with a side length of 50 cm. Third, a standard color palette was used to perform white balance on the camera before taking a photograph of the soil sample put on the rectangular region. Finally, a square black and white grid calibration plate with the same side length of 50 cm was also put on the rectangular region and photographed for geometric correction of all cracked soil samples. In addition, when the drying process was completed, all 40 soil samples were weighed for final soil moisture and also photographed for crack images using the same procedures mentioned above.

2.5. Crack Characteristics Extraction

2.5.1. Preprocessing of Crack Images

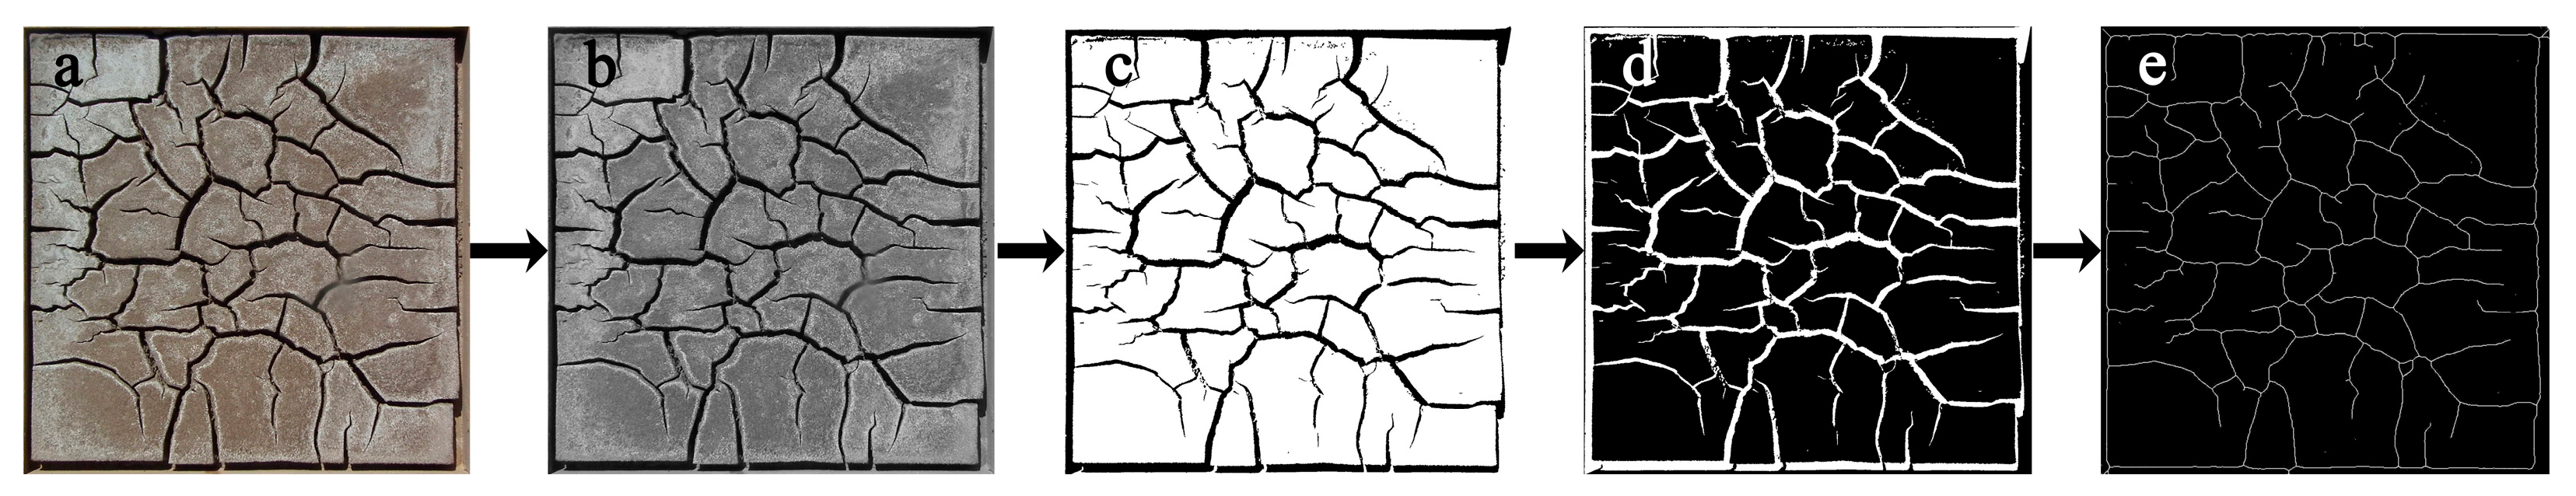
A unified procedure was also adopted to preprocess the crack images of all soil samples in this study. In particular, geometric distortion correction was first carried out with all parameters of correction models recorded. Next, the polynomial correction models were used for the geometric correction of all cracked images. After that, all corrected images were further clipped for standard size corresponding to a rectangle image corresponding to a real side length of 50 cm × 50 cm (Figure 3a). After the standard crack images were then converted into grayscale image according to the method mentioned above (Figure 3b), a threshold determined by the statistical histogram of each grayscale images was then used to perform binarization (Figure 3c) and inversion (Figure 3d). Finally, skeletonization is performed on the binary image till each crack reaching the width of one single pixel (Figure 3e).

2.5.2. Geometric Parameter Extraction

In order to extract the geometric feature parameters of soil cracks, the binary images of all cracked soil samples were loaded in MATLAB software, the number of pixels with a gray value of 0 was extracted as n, and the total number of the image was also extracted as N. The crack ratio of R was then calculated using the formula R = n/N. After that, the crack area (CA) was then computed using R and the real area of each crack sample (refers to 2500 cm2) using the equation of CA = 2500 × R cm2. In addition, the skeletonization images of all soil samples were also loaded in the MATLAB software, the number of pixels with a gray value of 0 was also obtained as m, and the real size of each pixel was also calculated as L using the pixel number of side length in the image and its corresponding real length of 50 cm. After that, the crack length (CL) of each crack image was then computed using the formula CL = m × L cm.

2.5.3. Texture Feature Extraction

The crack binary image is represented by f(x,y), where x and y represent the pixel position in the image. To quantitatively extract the texture features of cracks, the gray-level co-occurrence matrix (GLCM) of the binary image is calculated. Especially, the second-order combined conditional probability density of p(i,j) in directions of 0°, 45°, 90° and 135° was calculated using the following Equation (1) which composes the element of the grayscale co-occurrence matrix GLCM. Note that i and j refer to the values of the crack grayscale image f(x,y) at coordinate positions (x1,y1) and at coordinate positions (x2,y2), respectively. In order to intuitively utilize GLCM to describe the texture feature of the image, Formula (2) is used to process each element of p(i,j) in GLCM for the contrast (CON) texture features of the image, which represents the clarity of the image, reflects the contrast of adjacent pixels, and describes the strength of the texture, and is thus selected as the representative texture feature for the cracked soil sample in this study.
p i , j = g x 1 , y 1 , x 2 , y 2 m × n f x 1 , y 1 = i , f x 2 , y 2 = j
n N g 1 n 2 i = 1 N g j = 1 N g p ( i , j ) , i j = n

2.5.4. Fractal Dimension Extraction

This section refers to the extraction of fractal dimensions from all soil samples. In this study, box-counting dimension (D) was selected as the representative fractal dimension feature, which can be determined by calculating the number of square boxes covering the crack regions within the image by using the following equation:
D = lim n 0 ln   N ( δ ) ln   ( 1 / δ )
where δ represents the length of the square box covering the image, N(δ) describes the corresponding number of non-empty boxes, which refers to the number computed in Equation (2) in this study. It should be noted that since δ cannot be considered infinitely, the box-counting is usually determined by the slope of the linear equation in the double logarithmic coordinate system between δ and N(δ).

2.6. Statistical Analysis

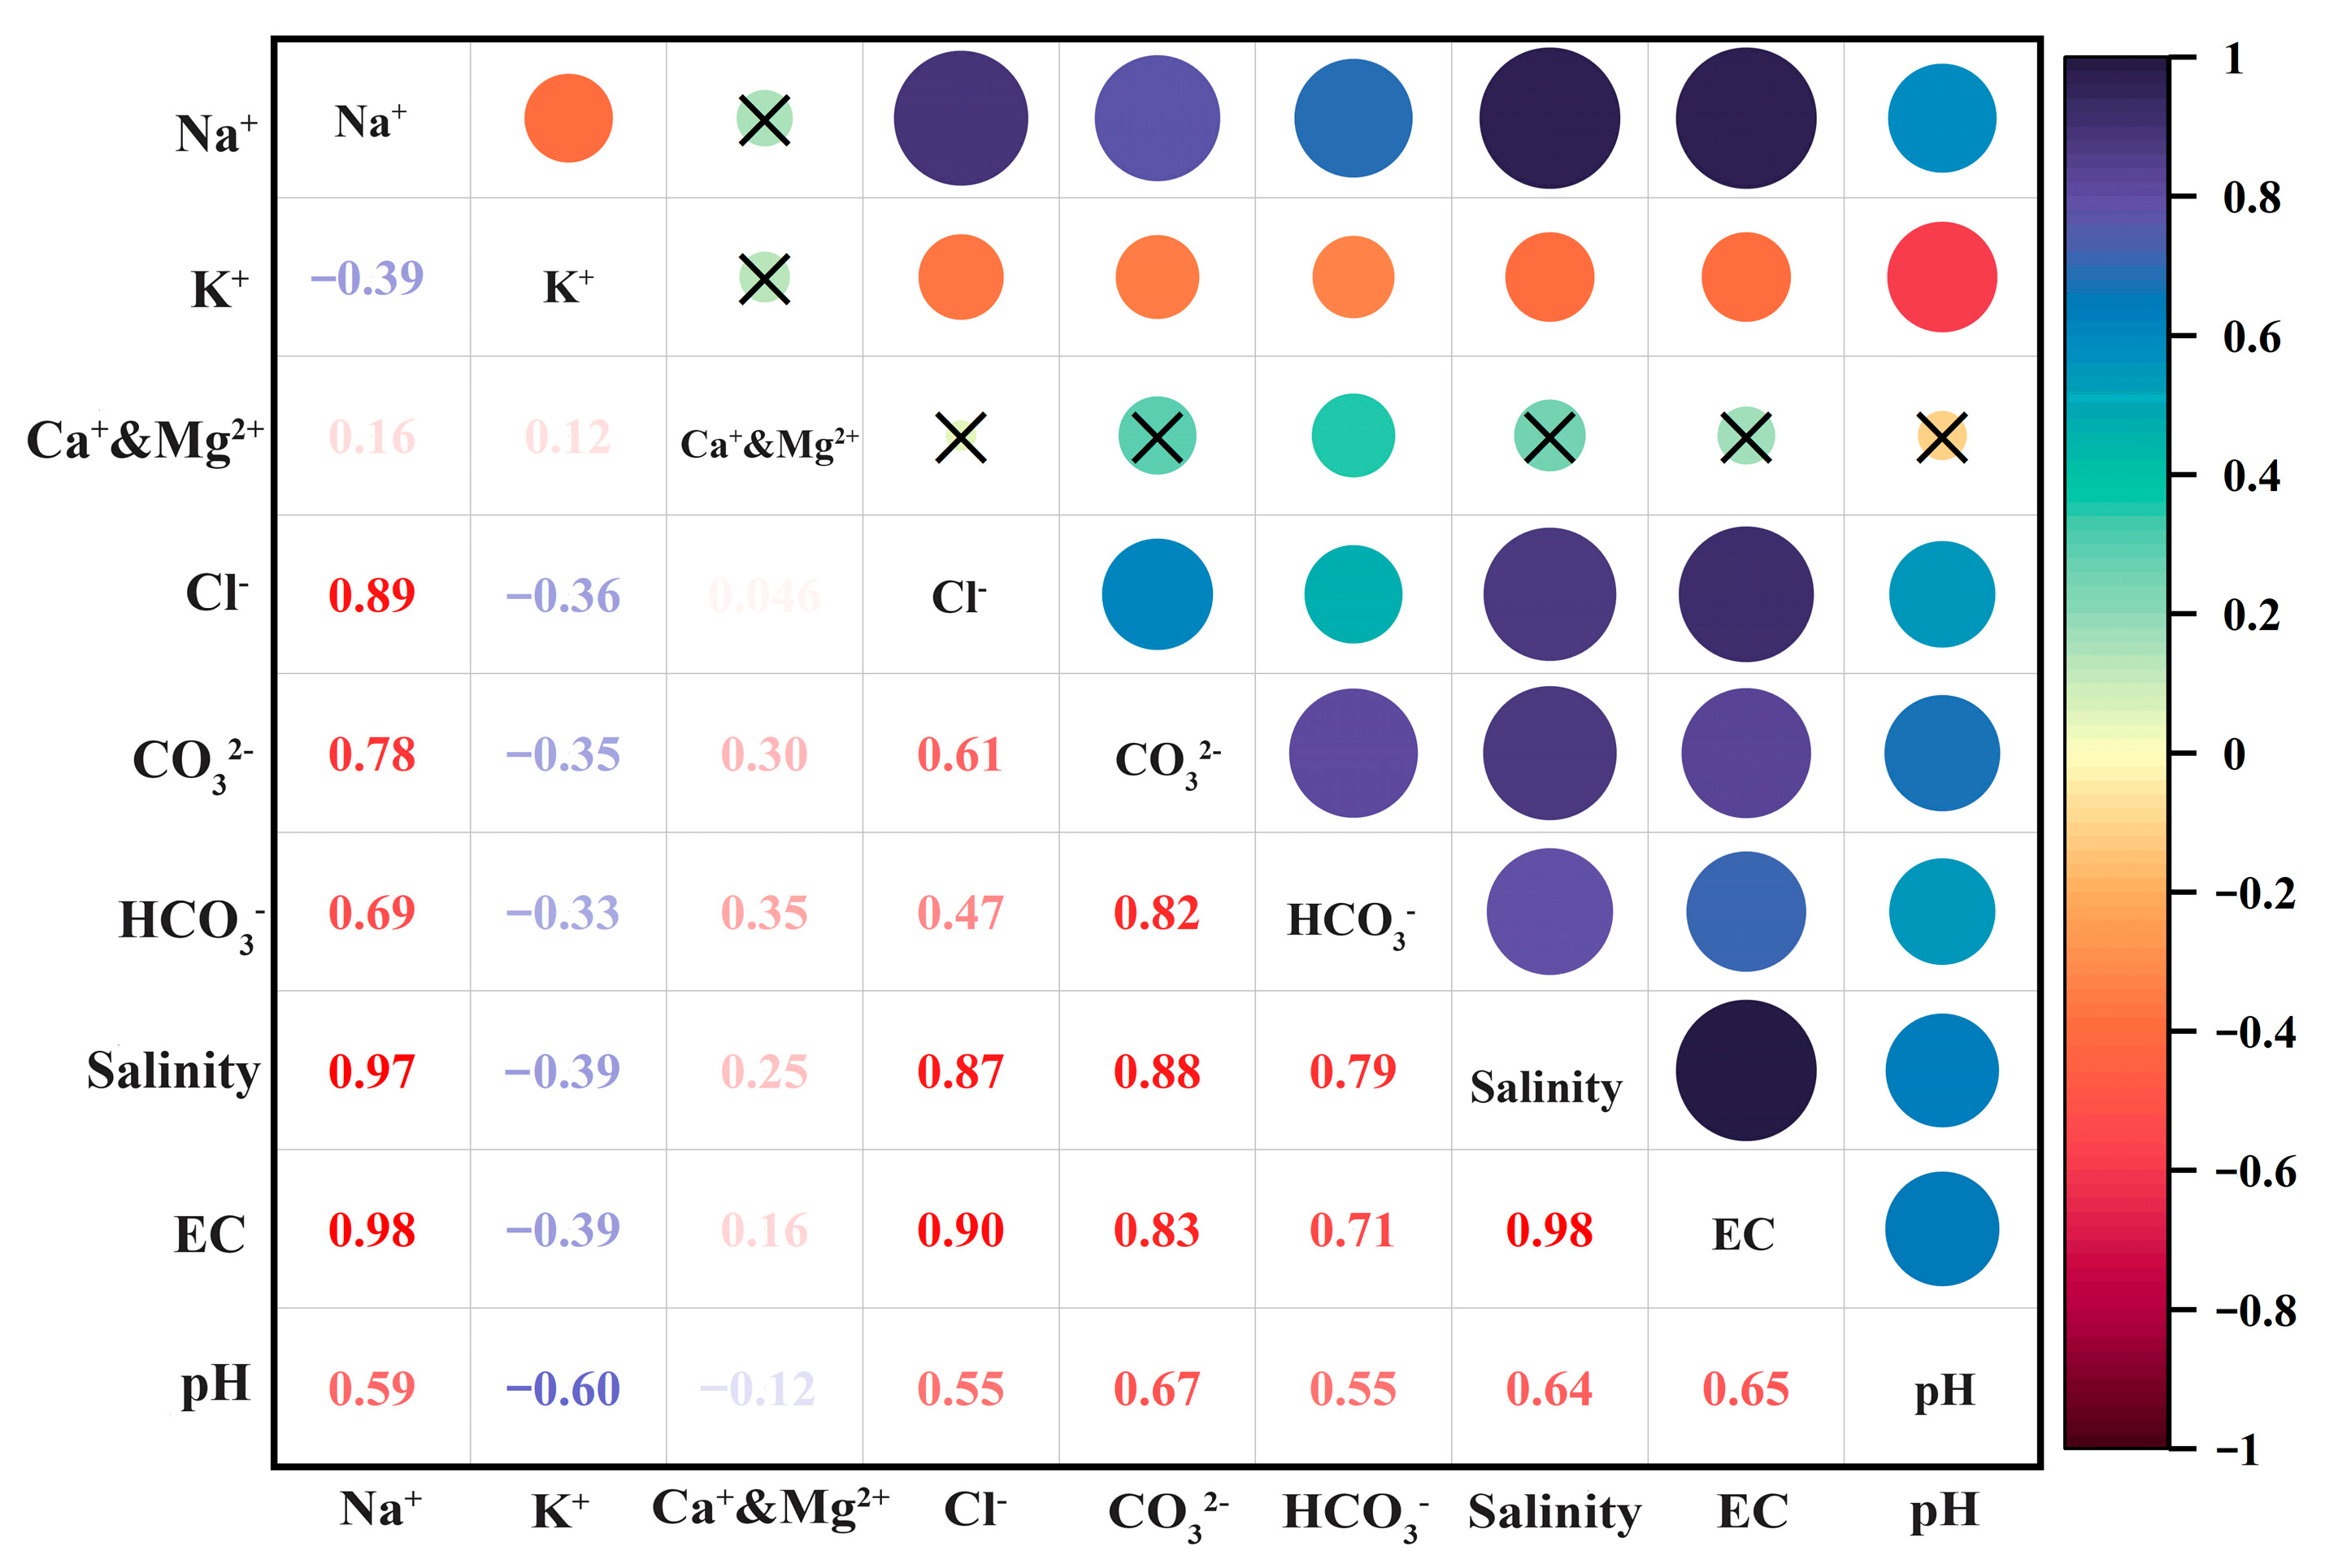
In order to quantify the ability of crack parameters characterizing different physicochemical properties of salt-affected soils in the Songnen Plain, Pearson correlation analysis was carried out using MATLAB software between different soil properties measured and four types of crack parameters with correlation coefficients calculated using the following equation:
R = i = 1 n x i x ¯ × y i y ¯ i = 1 n x i x ¯ × i = 1 n y i y ¯
where xi refers to the measured soil property, and yi represents the fitted soil property based on the linear regression model, and n stands for the number of soil samples. In addition, cross correlation analysis was also carried out between different salt parameters (including Na+, K+, Ca2+ & Mg2+, Cl, CO32−, HCO3, total salinity, EC and pH) in order to determine the relationship between salt parameters.
As a traditional method, multiple linear regression (MLR) can offer fast prediction speed with a simple structure, which is commonly used to analyze the influence of different crack parameters. Moreover, MLR can also remove multicollinearity and autocorrelation between other variables. In order to explore the possibility of predicting physicochemical parameters of soda saline-alkali soil in the Songnen Plain, MATLAB software was also used to further perform multiple linear regression analysis based on the crack characteristic parameters including CL, CA, CON and box-counting dimension.

3. Results

3.1. Soil Properties

Figure 4 presents the dynamic measurements of the cracking process on the surface of a typical soil sample during water evaporation, as well as the cracking status of all 40 soil samples with different salinity levels after the complete drying process. From the figure, it can be seen that when the crack length first reached stability, the crack area further shrank, accompanied by the precipitation of certain salt minerals on the soil surface. Meanwhile, Figure 4 also indicates that there were significant differences in the cracking status of soil samples with different salt contents.
Table 1 provides statistical description information for the measurement results of physical and chemical parameters of all soil samples. From the table, it can be seen that Na+ was the main type of cation in the study area with a much higher content than K+, Ca2+ and Mg2+, that the difference in the content of the three anions was not obvious as that of the cations, but still mainly concentrated in CO32− and HCO3, indicating that the salt mineral types of the soil were mainly Na2CO3 and NaHCO3, accompanied by a certain amount of NaCl, which is consistent with the mineralogy analysis of salt-affected soils in Songnen Plain conducted from Yang et al. [41] and Bai et al. [42]. Table 1 also indicates that the total salinity of all samples ranged from 1.06 to 29.73 mg/g with a coefficient of variation as high as 75.12%, indicating that the salt distribution range of different samples was large and thus effectively characterized the distribution of salinity levels in the study area. In addition, the pH ranged from 8.01–10.77 and the ESP ranged from 1.14–47.3% in this study also indicated that most soil samples exhibited significant alkaline characteristics according to the soil criterion proposed by USSLS [43]. From the measurements results of soil particle size distribution, it can be seen that the soil texture of all samples was basically the same, especially for the clay content of <0.002 mm ranging from 25.39% to 32.04% with the standard deviation and coefficient of variation of only 6.1% and 1.71, respectively, indicating that all soil samples belong to a typical soil texture of clay loam according to USDA, and that the clay content of different soil samples covered a concentrated distribution.

3.2. Dynamic Change of Soil Moisture

Figure 5 indicates the dynamic changes in soil moisture of all eight selected soil samples during the drying process. From the figure, it can be seen that the trend of moisture change over time was basically the same for different samples during the whole drying process. Especially, the water evaporation process of soil samples could be divided into the following three stages: fast evaporation stage, during which water rapidly loses and the evaporation rate remained basically unchanged, and there was a good linear relationship between water content and drying time; slow evaporation stage, during this stage the evaporation rate significantly slowed down, while a line also could be used to describe the relationship between the drying time and the water content; the last stage referred to the stable stage, during which the water content did not change with time, indicating that the water loss process was basically completed. Figure 5 also shows that the final soil moisture of all samples was basically kept the same, indicating that the impact of soil salinity on it was thus ignored.
Although the initial water contents of these 8 samples were the same at 50%, the evaporation rates of different samples were not the same due to their different soil salinity, especially during the fast evaporation stage where there were significant differences in the evaporation rates (slopes of different fitting lines) of different samples. Figure 6 shows the relationship between the evaporation rate and soil salinity of 8 samples with the same initial water content during the uniform evaporation stage. It can be seen that when the initial water content was kept the same, the evaporation rate of the samples showed a significant linear negative correlation with the salt content of the soil samples.

3.3. Dynamic Changes of Soil Cracks

Figure 7 shows the variation of crack length with water content in the eight soil samples mentioned above. From the figure, it can be seen that under the same initial water content, the crack length of different soil samples rapidly increased and reached stability with the decreasing water content at the initial during period, and that the water content was basically kept the same when the crack length of the sample was stable. However, due to the different physical and chemical parameters of soil samples, the difference in crack length was very significant, indicating that crack length was an effective parameter characterizing soil cracking status, and could also well describe the differences in soil properties.
Figure 8 shows the variation of the crack area with water content in 8 soil samples. From this figure, it can be seen that the crack area of soil samples gradually increased with the decrease in water content as the growth rate kept quite slow, and that a clear quadratic relationship was identified between water content and crack area. Figure 8 also indicates that the water contents of all the samples were all lower than 5% when the crack area reached stable, indicating that the soil surface no longer generated new cracks when the crack length reached a certain level. However, the stable water content in Figure 8 was much lower than that in Figure 7, this is because when the number of block areas caused by soil cracking reached a stable level, the length of the cracks no longer increased. However, the spacing between soil particles further narrowed and the volume of block areas caused by cracks also further shrank as water evaporated.
Table 2 presents the quadratic fitting results of water content and crack area during the cracking process of 8 selected samples. From the table, it can be seen that all R2 of fitting equations was greater than 0.9 with relative RMSE all less than 8.95%, indicating that even though there were differences in the physical and chemical parameters of various soil samples, the crack area and soil moisture content still showed a significant quadratic relationship as water evaporates.

3.4. Crack Characteristics

Table 3 presents the statistical results of the final water content of all samples at the end of the drying process in this study. It can be seen that the final soil moisture of all soil samples was basically kept the same with a variance of only 0.05% and an average value of only 1.49%, indicating that the soil moisture in the soil samples was fully evaporated at this time, and that the shrinkage and cracking process on the surface of the soil samples could be considered as completed.
Table 4 presents the extraction results of different types of crack parameters for all dried samples at the completion of desiccation cracking. From this table, it can be seen that the distribution ranges of both crack length and crack area were relatively large with crack length ranging from 200 cm to 800 cm and crack area distributed between 36.78 cm2 and 547 cm2. In addition, the coefficient of variation of crack length and crack area both exceeded 25% also indicating that they both had significant differences among soil samples and thus well characterized the cracking status of soda saline-alkali soils in Songnen Plain of China. Although CON covered the smallest range from only 0.01 to 0.34, a coefficient of variation of 65.45% still showed strong discreteness between different soil samples. The distribution of box-counting dimensions in Table 5 also showed a concentration ranging from 1.14 to 1.60 with a variation coefficient of only 8.60%, which was much lower than those computed based on the other three types of crack parameters, indicating that the differences in fractal dimensions among different samples were relatively small with poor heterogeneity.

3.5. Correlation Analysis Results

Table 5 presents the Pearson correlation analysis results between the physicochemical properties and four types of crack parameters of soil samples. From the table, it can be seen that all soil properties showed a positive correlation with different types of crack characteristics except for K+. Especially, the correlation coefficients between crack length and contrast with soil properties were significantly higher than those between crack area and box dimension, indicating that the ability of crack area and fractal features to evaluate soil physicochemical properties (especially for those parameters related to salt content) was weaker than that of crack length and CON texture feature. The overall characterization ability of crack characteristics on soil properties covered a tendency of CON > CL > Fractal > CA. In addition, the correlation between Na+ and crack characteristics was much higher than that of the other three cations, and the difference in correlation between the three anions and different crack characteristic parameters was smaller than that of cations. Table 5 also describes that soil salinity and EC values had the highest correlations with soil crack characteristics compared to other soil parameters, indicating that EC effectively characterized the salt content of soil, and also indicates that the salt content greatly affected the shrinkage and cracking status of soda saline-alkali soils in Songnen Plain of China. Moreover, the overall low correlation also indicated that the soil cracking status was less affected by the mechanical composition of the soil, especially for the low correlation between clay content and different crack characteristics with correlation coefficients only from 0.13 to 0.24.
In order to further analyze the impact of clay content on soil surface cracking, scatter diagrams of soil clay content and different crack characteristics were also plotted in this study (Figure 9). From the figure, it can be seen that there was no regularity in the scatter distribution between soil clay content and different crack characteristics, indicating that the clay content of the soil in this study area was not the dominant factor affecting soil surface shrinkage and cracking. This also confirmed the low correlation coefficients between soil clay content and crack characteristics extracted in Table 5.
Figure 10 shows the cross-correlation coefficient diagram of different salt parameters of all soil samples in this study. It can be seen from the figure that Na+ was highly correlated with total soil salinity and EC value, and also had certain correlations with HCO3, CO32− and Cl, but with very poor relationships with K+, Ca2+ and Mg2+. In addition, Figure 10 also indicates that all anions including Cl, CO32− and HCO3 did not have a very good relationship with each other and that no clear relationship was found between K+, Ca2+ and Mg2+ and other salt parameters.

3.6. Multiple Linear Regression Models

The multiple linear regression models for different salt parameters including ion contents, soil salinity, pH and EC were shown in Table 6. From the table, it can be seen that the comprehensive utilization of different crack characteristics achieved the prediction of different salt parameters in cohesive soda saline-alkali soil. According to the criteria proposed by Farifth et al. [44], the multiple linear regression model had high prediction accuracy for Na+, EC and total soil salinity in this study with R2 above 0.91 and a ratio of performance to deviation (RPD) above 2.5; for Cl and CO32−, the multiple linear regression model also had certain prediction accuracy (R2 > 0.66 and RPD > 1.5); in addition, the multiple linear regression model had poor prediction accuracy for NaHCO3 and pH since the R2 and RPD were below 0.5 and 1.5, respectively; however, However, K+, Ca2+ and Mg2+ were not well predicted using multivariate linear models based on crack characteristics due to their very poor R2 and RPD.

4. Discussion

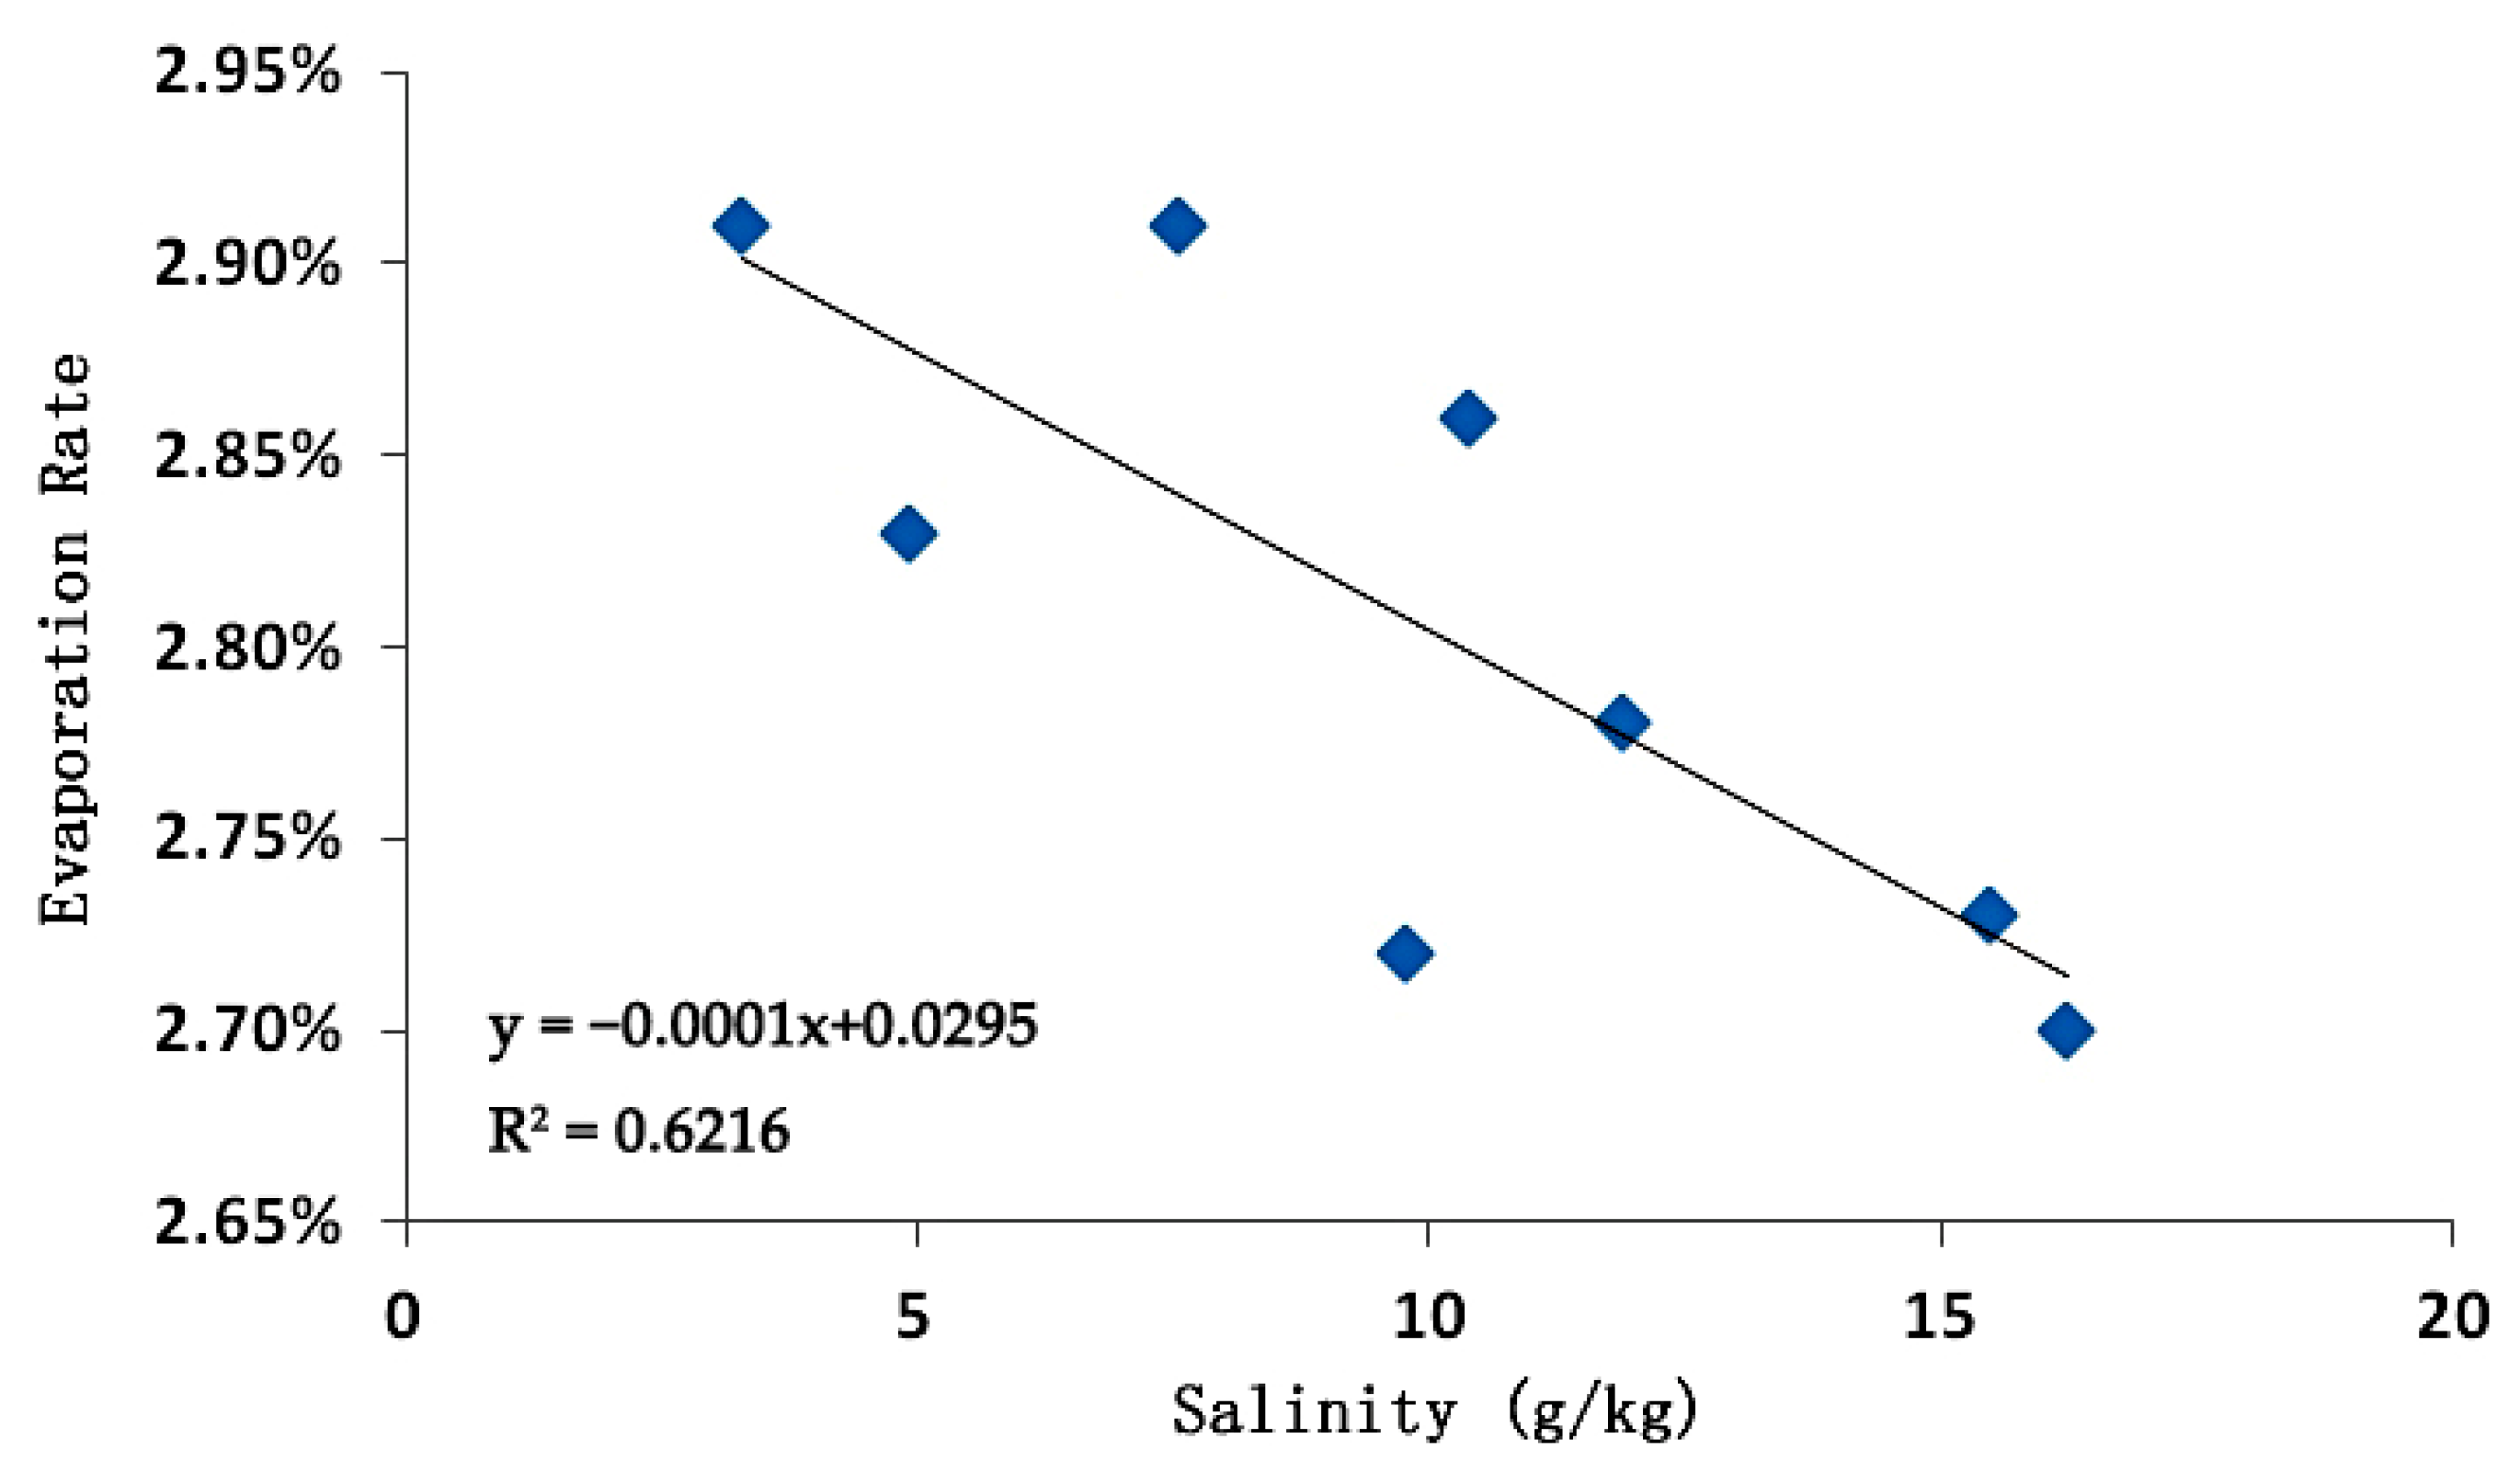
In this study, different stages of evaporation can be physically justified. Specifically, the evaporation rate during the rapid evaporation stage is the highest and remains constant, this is mainly because the soil moisture is high at this period, indicating that the evaporation of free water plays a dominant role in the soil pores. During the rapid evaporation stage, the heat transmitted by the external environment to the soil can be fully utilized for the energy consumed by free water evaporation, and the soil surface always maintains a saturated vapor pressure with its gradient remaining unchanged. As evaporation continues, the water content of the soil gradually decreases, and the corresponding free water in the pores also gradually decreases. When the water content reaches a certain critical value, both the vapor pressure gradient and the water transport capacity weaken, making it unable to meet the demand for evaporation and causing the evaporation rate to slow down, indicating that evaporation has entered the slow stage. When the surface of the soil is very dry, the amount of water supplied for evaporation in the soil further decreases, and the capillary water effect also further weakens. However, the water becomes more constrained by soil particles and made the liquid water unable to be transmitted to the surface of the soil, meaning that the evaporation process transitions from the slow stage to the final stable stage [45,46]. In addition, as the salt content of the soil sample increases, the relative evaporation rate of the soil samples shows a significant linear decrease trend. This is because the salt content of soil samples increases the salt concentration in the pore water of the samples, which will increase the osmotic suction of soil samples and thus enhance the ability to bind water, thereby reducing the evaporation rate of water [47].
The formation and development of surface shrinkage cracks in cohesive soda saline alkali soil is a complex physical process, and its development law can be summarized as the following basic steps. Firstly, some unrelated single cracks will randomly appear on the soil surface during water evaporation, these cracks will freely extend, bend, and form isolated main cracks as the water content decreases; as the soil moisture content further decreases, the main cracks in close proximity will exhibit a trend of vertical intersection, thereby dividing the soil surface into several larger initial blocks. After that, some branch cracks begin to appear on the main crack, which grow approximately perpendicular to the main crack and divide the initial block into more secondary block areas until the branch crack is perpendicular to another main crack. Note that new branch cracks may further derive branches on these barge secondary blocks and then segment the secondary block areas until all block areas reach a stable state. Finally, no new cracks will appear on the surface of the soil sample and the crack length no longer increase when all the block areas reach stability, however the crack area will continue to contract as the water content decreases until the desiccation cracking process is completely finished. The generation of desiccation cracks is a mechanical behavior of cohesive soil in an unsaturated state. Especially, the soil voids of saturated soil samples are filled with water in the initial state, and the saturation of the mud gradually decreases as water evaporation. At this point, curved liquid surfaces will form between soil particles due to the effect of surface tension, leading to the generation of capillary water pressure. The magnitude of this capillary water pressure is directly proportional to the surface tension and inversely proportional to the curvature radius of the meniscus. After that, soil particles will approach each other and the pore size will gradually decrease under the combined action of capillary water pressure and surface tension, which is reflected in the macroscopic shrinkage of the soil volume due to water loss. As the soil moisture decrease, the force exerted by the curved liquid in the pore on the soil particles becomes greater, indicating that cracks will appear on the soil surface when the magnitude of this tension exceeds the bonding strength between soil particles.
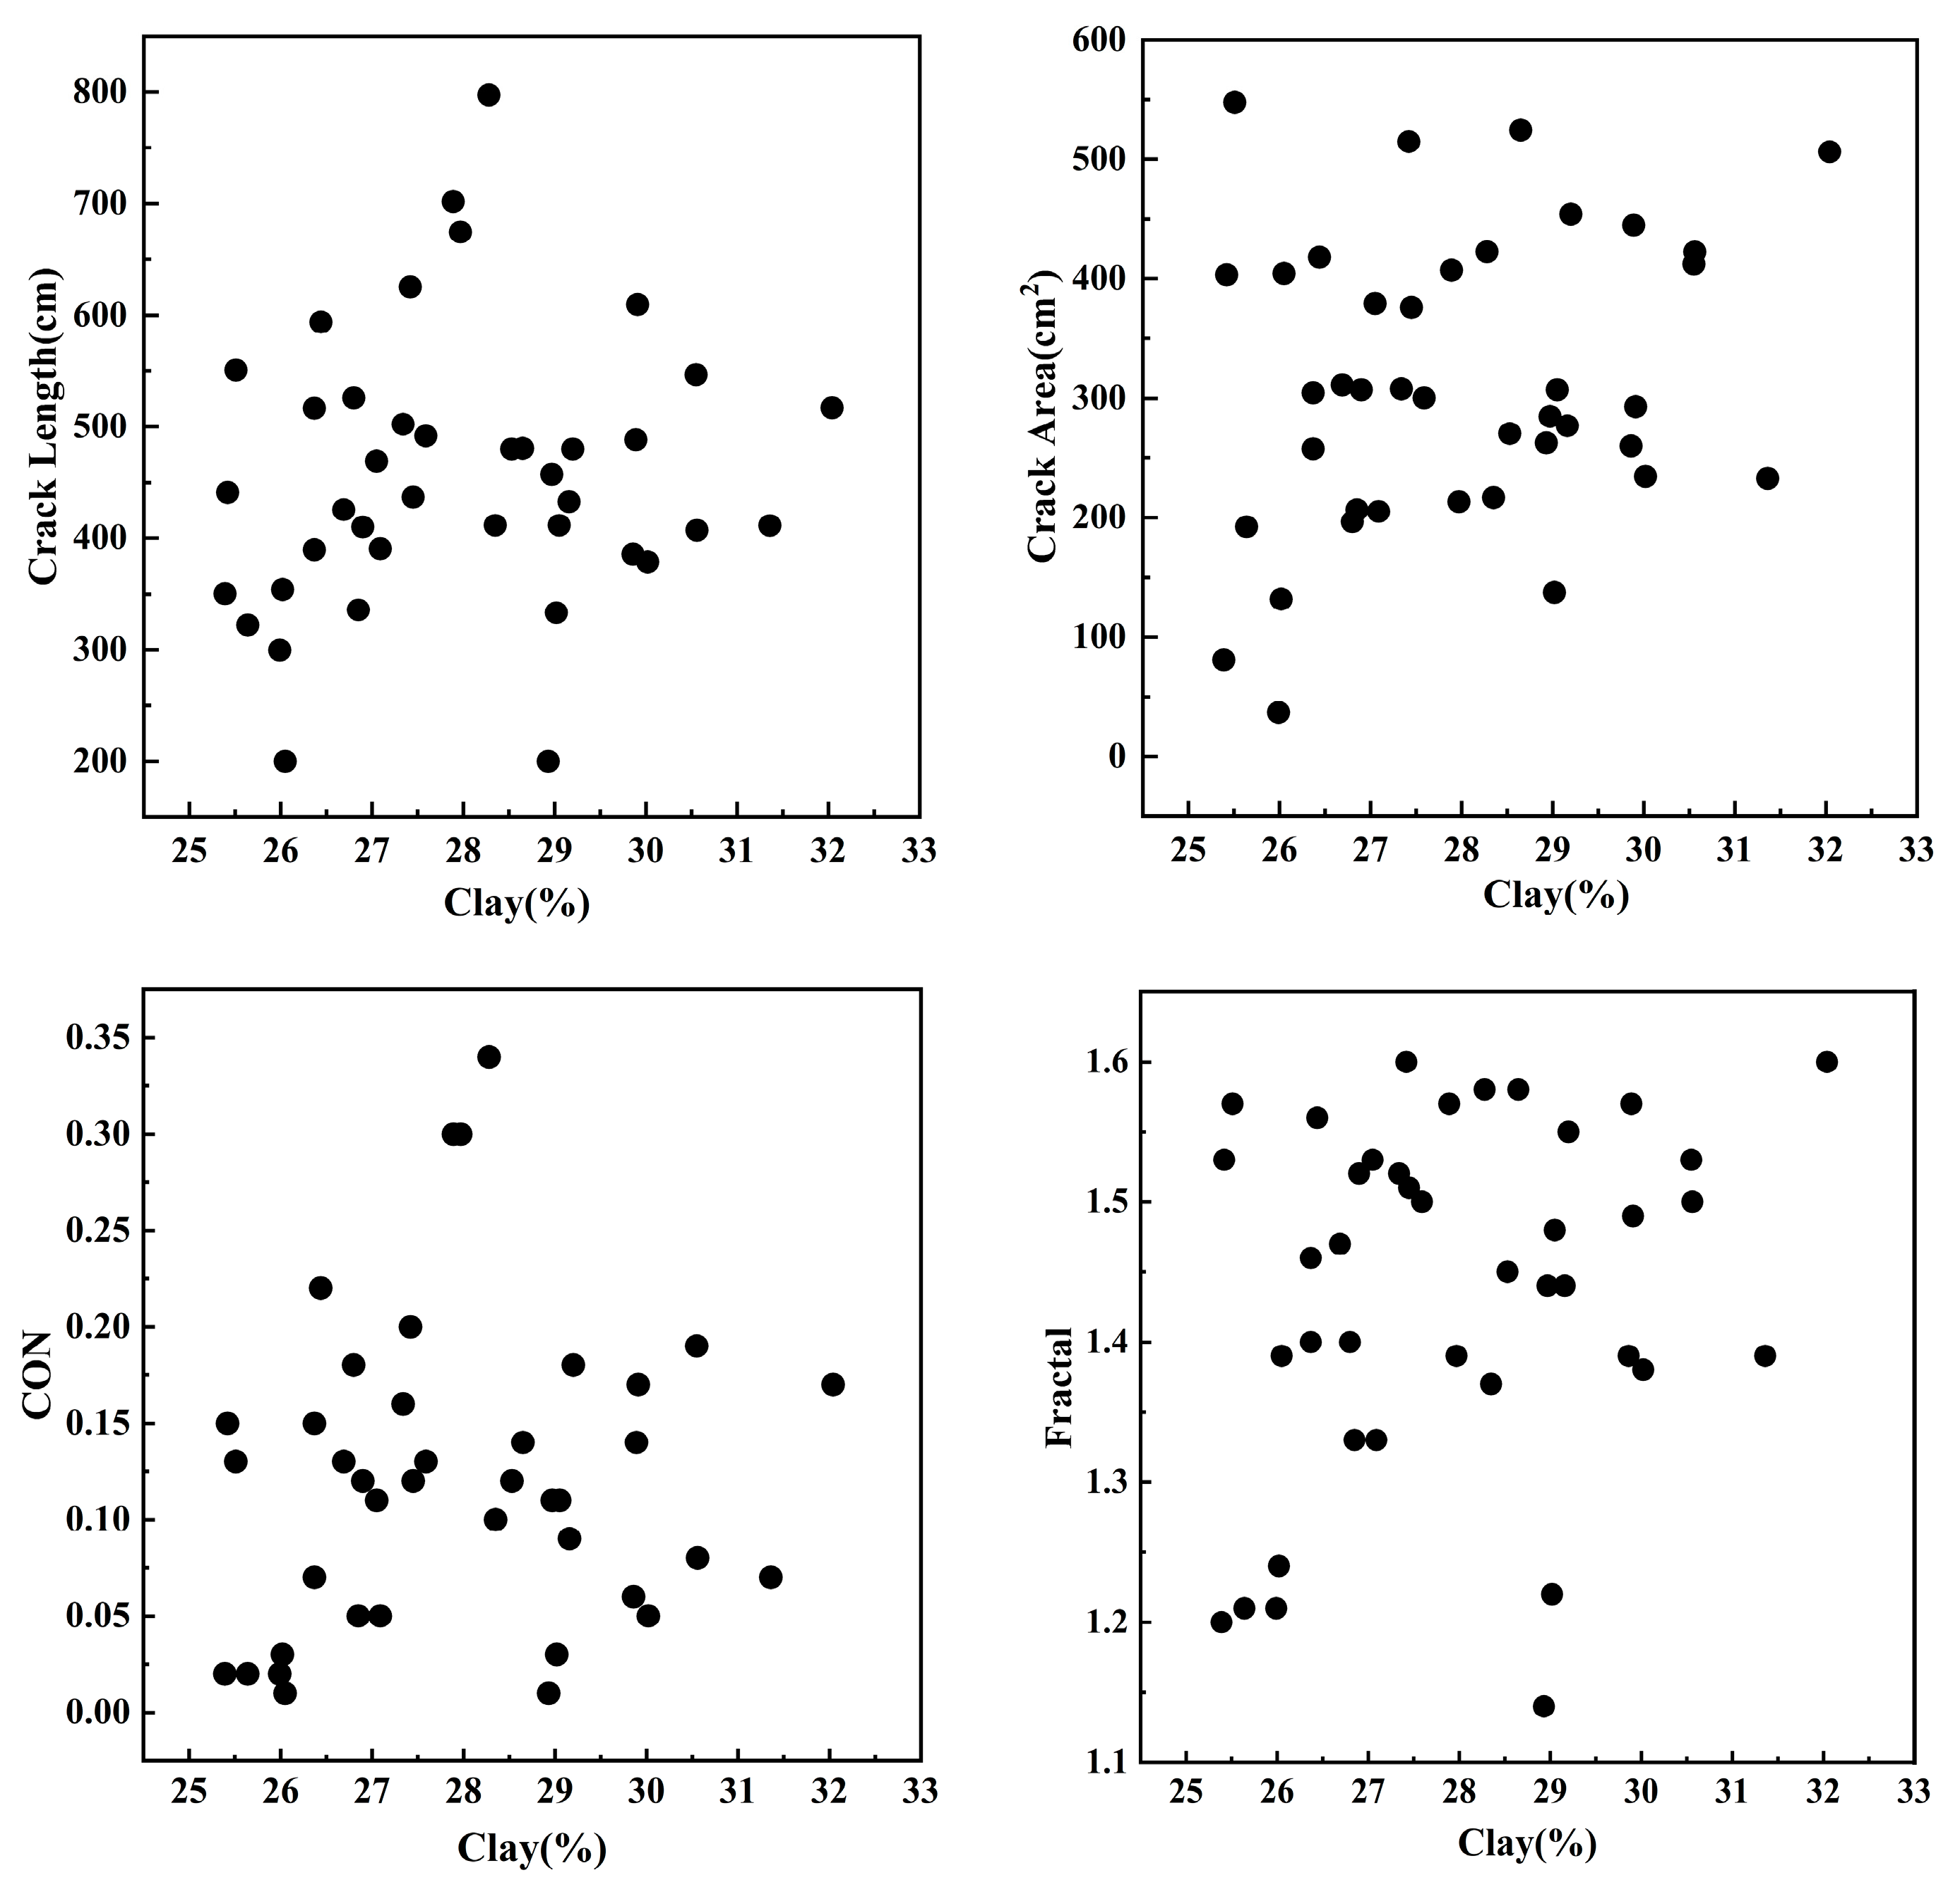
Many studies have shown that the matrix suction, tensile strength, surface energy and other mechanical properties that affect the cracking process of cohesive soil largely depend on the type of soil clay minerals, clay content and salt content and other factors [48,49,50,51], which are also affected by the experimental conditions such as temperature, relative humidity, initial water content, and the sample preparation process. It should be noted that due to the controllable soil cracking experiment conducted under the same conditions in this article, the environmental parameters such as temperature and relative humidity of soil samples are completely unchanged, and the preparation process of soil samples is also kept the same during the drying process. In addition, all soil samples in this study have basically the same mineral types due to the concentrated spatial distribution of sampling locations. The research results of Zhang et al. [52] and Wang et al. [53] on the basic properties of soda saline alkali soil in the Songnen Plain indicate that the activity index of the cohesive saline alkali soil in this area is only between 0.33 and 0.48, belonging to a typical kind of inactive clay. Their measurement results also show that the clay mineral in the saline alkali soil in the Songnen Plain has little impact on the expansion and contraction of the soil, this is mainly because the clay minerals in this area are mainly composed of illite/smectite formation (the interlaying ration above 0.5) as the original mineral and a small amount of kaolinite as the secondary mineral, which is commonly considered a typical mineral composition with poor activity.
The desiccation cracking process on the surface of cohesive soda saline-alkali soil is significantly different from that of general cohesive soil due to the difference between the three-phase structure of saline-alkali soil and neutral cohesive soil. In addition, during water evaporation, the exchangeable cations in the salt solution have a significant impact on the physical properties of the soil, thereby determining the shrinkage and cracking process of the soil surface. Specifically, a thick combined water film is formed between salinized soil particles under the interaction of exchangeable cations with soil solution (especially for the dominant cation of Na+ with a large hydrolysis radius), which will closely increase with the soil salinity. This kind of combined water film will weaken the cementation of salt-affected soils, while increasing the spacing between soil particles, thereby reducing soil cohesion and tensile strength [54,55,56,57]. In addition, the lubrication effect combined with water film can also reduce the internal friction angle between soil particles and the shear strength of the soil [58,59,60,61]. Therefore, soil salinity can greatly increase the degree of cracking, leading larger crack length and crack area. Moreover, the influence of salt on soil surface cracking can also be explained from the perspective of diffuse double layer (DDL), which is formed on the periphery of the surface charge layer due to different ions attracted to the surface of soil particles, and can be reduced by salt content of soil samples. This kind of DDL can be thinned during water evaporation and cause a reduction in the distance between different soil particles, which in turn accelerates the development of desiccation on the soil surface [62]. At the same time, GLCM texture features and fractal dimension also show an obvious response to soil salt content, which is because the crack location of the sample has obvious randomness. As a typical GLCM texture feature, CON can describe the crack degree of soil samples from a statistical perspective, which can not only overcome the influence of direction, but also reflect the spatial distribution of cracks; fractal dimension can also be used to quantify the inhomogeneity, irregularity and self-similarity of random desiccationi cracks generated on the surface of soda saline-alkali soils.
Na+ is the dominant factor determining the process of soil surface cracking, which has a high correlation with soil crack characteristics (as shown in Table 5), indicating that it can be predicted by a multiple regression model based on crack characteristics with high accuracy. This is because NaHCO3 and Na2CO3 are the main salt minerals in the salt-affected soils of the Songnen Plain, and NaCl also accounts for a considerable proportion of salt minerals. As the main cation in saline alkali soil of Songnen Plain, the content of Na+ is much higher than other cations and is closely related to the total salt content of soil samples. EC is a characterization of the conductivity of soluble ions in soil, which can be effectively used to characterize the total salt content of soil, indicating that multiple linear regression models have strong predictive ability for EC value and total soil salinity. In addition, the soil cracking process is rarely affected by K+, Ca2+ and Mg2+ since their extremely low contents measured indicating that these cations are of very low correlation with crack characteristics of soda saline-alkali soils in Songnen Plain of China. Table 6 also indicates that the accuracy of pH is also limited, this is because the pH value is directly determined by the OH content generated by the hydrolysis of CO32− and HCO3, this hydrolysis reaction is often incomplete and also easily affected by conditions such as temperature and water content. Moreover, it can be seen from Table 1 that Cl, CO32−, and HCO3 account for a large proportion of anionic content, and that the contents of CO32− and HCO3 are not stable due to the reversible hydrolysis reaction, which makes their correlation with soil crack characteristics do not show significant performance, and the stability of the predicted results is also relatively poor (confirmed by Table 6).

5. Conclusions

In this study, 40 soil samples with different salinity levels were selected from the Songnen Plain of China for desiccation cracking test under controlled laboratory conditions. The results provided basic information for understanding the dynamic change of soil moisture during water evaporation, and the variation law of geometric crack parameters with soil moisture. In conclusion, the process of desiccation cracking in soda saline-alkali soils can be divided into three stages including fast stage, slow stage and stable stage. The salt concentration in the pore water of the samples can increase the osmotic suction of soil samples and enhance the ability to bind water, causing a decrease in the evaporation rate. Na+ can dominate the cracking process rather than clay content since it determines the water film generated among soil particles, which thus can decrease tensile strength, shear strength, and friction angle of salt-affected soils. Multiple linear models were developed based on different crack characteristics, which can achieve accurate prediction of Na+, EC and the total salinity (R2 from 0.93 to 0.94, RPD from 3.09 to 3.66), and also show certain accuracy for CO32− and Cl (R2 of 0.69 and 0.74, RPD of 1.51 and 1.64, respectively), thereby providing a possibility for further understanding of the cracking mechanism and an effective measurement method of soil properties, and also showing great importance for ensuring food security, improving the salt-affected soils, and enhancing the ecological environment.

Author Contributions

Conceptualization, J.R.; methodology, J.R.; software, Z.Z.; validation, Z.Z. and S.Z.; formal analysis, S.Z. and Z.Z.; investigation, J.R. and S.Z.; resources, X.L.; data curation, Z.Z. and S.Z.; writing—original draft preparation, Z.Z.; writing—review and editing, J.R.; visualization, Z.Z.; supervision, X.L.; project administration, J.R.; funding acquisition, J.R. and X.L. All authors have read and agreed to the published version of the manuscript.

Funding

This study was supported from the Strategic Priority Research Program of the Chinese Academy of Sciences (No. XDA28110501), the Fundamental Research Funds for the Central Universities of China (No. 2022-KYYWF-0156), the University Nursing Program for Young Scholars with Creative Talents in Heilongjiang Province of China (No. UNPYSCT-2018180), and the Graduate Innovative Research Project of Harbin Normal University (No. HSDSSCX2022-05).

Institutional Review Board Statement

Not applicable.

Data Availability Statement

Not applicable.

Acknowledgments

We authors all would like to thank the assistance provided by Zhichun Wang from the Da’an Alkaline Ecological Experimental Station, Chinese Academy of Sciences for the soil property measurements.

Conflicts of Interest

The authors declare no conflict of interest.

References

  1. Stewart, R.D.; Abou Najm, M.R. Field measurements of soil cracks. Soil Sci. Soc. Am. J. 2020, 84, 1462–1476. [Google Scholar] [CrossRef]
  2. Jamalinia, E.; Vardon, P.J.; Steele-Dunne, S.C. The impact of evaporation induced cracks and precipitation on temporal slope stability. Comput. Geotech. 2020, 122, 103506. [Google Scholar] [CrossRef]
  3. Zhang, J.; Zhu, D.; Zhang, S. Shallow slope stability evolution during rainwater infiltration considering soil cracking state. Comput. Geotech. 2020, 117, 103285. [Google Scholar] [CrossRef]
  4. Yang, B.; Liu, J.; Zhao, X.; Zheng, S. Evaporation and cracked soda soil improved by fly ash from recycled materials. Land Degrad. Dev. 2021, 32, 2823–2832. [Google Scholar] [CrossRef]
  5. Hou, F.; Cheng, J.; Guan, N. Investigating the effect of soil cracks on preferential flow using a dye tracing infiltration experiment in karst in Southwest China. Land Degrad. Dev. 2023, 34, 1612–1628. [Google Scholar] [CrossRef]
  6. Poulsen, T.G.; Cai, W.; Garg, A. Water evaporation from cracked soil under moist conditions as related to crack properties and near-surface wind speed. Eur. J. Soil Sci. 2020, 71, 627–640. [Google Scholar] [CrossRef]
  7. Dai, Y.; Guan, Y.; Zhang, Q.; Sun, J.; He, X. Remote sensing monitoring and temporal and spatial characteristics of soil salinization in Aral Reclamation area. Arid Land. Geogr. 2022, 45, 1176–1185. [Google Scholar]
  8. Hassani, A.; Azapagic, A.; Shokri, N. Global predictions of primary soil salinization under changing climate in the 21st century. Nat. Commun. 2021, 12, 6663. [Google Scholar] [CrossRef]
  9. Masoud, A.A.; Koike, K.; Atwia, M.G.; El-Horiny, M.M.; Gemail, K.S. Mapping soil salinity using spectral mixture analysis of landsat 8 OLI images to identify factors influencing salinization in an arid region. Int. J. Appl. Earth Obs. 2019, 83, 101944. [Google Scholar] [CrossRef]
  10. Zhao, H.; Ma, Y.; Zhang, J.; Hu, Z.; Li, H.; Wang, Y.; Liu, J.; Li, Z. Effect of clay content on plastic shrinkage cracking of cementitious materials. Constr. Build. Mater. 2022, 342, 127989. [Google Scholar] [CrossRef]
  11. Puppala, A.J.; Manosuthikij, T.; Chittoori, B.C.S. Swell and shrinkage characterizations of unsaturated expansive clays from Texas. Eng. Geol. 2013, 164, 187–194. [Google Scholar] [CrossRef]
  12. Sridharan, A.; Jayadeva, M.S. Double-layer theory and compressibility of clays. Geotechnique 1982, 32, 133–144. [Google Scholar] [CrossRef]
  13. Tang, C.; Shi, B.; Liu, C.; Zhao, L.; Wang, B. Influencing factors of geometrical structure of surface shrinkage cracks in clayey soils. Eng. Geol. 2008, 101, 204–217. [Google Scholar] [CrossRef]
  14. Vail, M.; Zhu, C.; Tang, C.; Anderson, L.; Moroski, M.; Montalbo-Lomboy, M.T. Desiccation cracking behavior of MICP-treated bentonite. Geosciences 2019, 9, 385. [Google Scholar] [CrossRef]
  15. Tang, C.; Cui, Y.; Tang, A.; Shi, B. Shrinkage and desiccation cracking process of expansive soil and its temperature-dependent behaviour. Chin. J. Geotech. Eng. 2012, 34, 2182–2187. (In Chinese) [Google Scholar]
  16. Xie, Y.; Zhang, B.; Liu, B.; Zeng, Z.; Zhang, Y.; Zheng, Y. Shrinkage cracking and strength deterioration of red clay under cyclic drying and wetting. Alex. Eng. J. 2022, 61, 2574–2588. [Google Scholar] [CrossRef]
  17. Tian, B.; Cheng, Q.; Tang, C.; Zeng, H.; Xu, J.; Shi, B. Effects of compaction state on desiccation cracking behaviour of a clayey soil subjected to wetting-drying cycles. Eng. Geol. 2022, 302, 106650. [Google Scholar] [CrossRef]
  18. Meng, Y.; Wang, Q.; Su, W.; Ye, W.; Chen, Y. Effect of sample thickness on the self-sealing and hydration cracking of compacted bentonite. Eng. Geol. 2022, 307, 106792. [Google Scholar] [CrossRef]
  19. DeCarlo, K.F.; Shokri, N. Effects of substrate on cracking patterns and dynamics in desiccating clay layers. Water Resour. Res. 2014, 50, 3039–3051. [Google Scholar] [CrossRef]
  20. Inoue, H. Lateral flow in a clayey agricultural field with cracks. Geoderma 1993, 59, 311–325. [Google Scholar] [CrossRef]
  21. Dasog, G.S.; Shashidhara, G.B. Dimensional and volume of cracks in a vertisol under different crop covers. Soil Sci. 1993, 156, 424–428. [Google Scholar] [CrossRef]
  22. Ringrose-Voase, A.J.; Sanidad, W.B. A method for measuring the development of surface cracks in soils-application to crack development after lowland rice. Geoderma 1996, 71, 245–261. [Google Scholar] [CrossRef]
  23. Novak, V. Soil-crack characteristics-Estimation methods applied to heavy soil in the NOPEX area. Agric. For. Meteorol. 1999, 98, 501–507. [Google Scholar] [CrossRef]
  24. Samouelian, A.; Cousin, I.; Richard, G.; Tabbagh, A.; Bruand, A. Electrical resistivity imaging for detecting soil cracking at the centimetric scale. Soil Sci. Soc. Am. J. 2003, 63, 1319–1326. [Google Scholar] [CrossRef]
  25. Liu, C.; Tang, C.; Shi, B.; Suo, W. Automatic quantification of crack patterns by image processing. Comput. Geosci. 2013, 57, 77–80. [Google Scholar] [CrossRef]
  26. Wang, C.; Zhang, Z.; Liu, Y.; Fan, S. Geometric and fractal analysis of dynamic cracking patterns subjected to wetting-drying cycles. Soil Till. Res. 2017, 170, 1–13. [Google Scholar] [CrossRef]
  27. Liu, R.; Vail, M.; Koohbor, B.; Zhu, C.; Tang, C.; Xu, H.; Shi, X. Desiccation cracking in clay-bottom ash mixtures: Insights from crack image analysis and digital image correlation. Bull. Eng. Geol. Environ. 2022, 81, 139. [Google Scholar] [CrossRef]
  28. Tang, C.; Cheng, Q.; Lin, L.; Tian, B.; Zeng, H.; Shi, B. Study on the dynamic mechanism of soil desiccation cracking by surface strain/displacement analysis. Comput. Geotech. 2022, 152, 104998. [Google Scholar] [CrossRef]
  29. Taheri, S.; El-Zein, A. Desiccation cracking of polymer-bentonite mixtures: An experimental investigation. Appl. Clay Sci. 2023, 238, 106945. [Google Scholar] [CrossRef]
  30. Tang, L.; Zhao, Z.; Luo, Z.; Sun, Y. What is the role of tensile cracks in cohesive slopes? J. Rock Mech. Geotech. 2019, 11, 314–324. [Google Scholar] [CrossRef]
  31. Zhuo, Z.; Zhu, C.; Tang, C.; Xu, H.; Shi, X.; Mark, V. 3D characterization of desiccation cracking in clayey soils using a structured light scanner. Eng. Geol. 2022, 299, 106566. [Google Scholar] [CrossRef]
  32. An, R.; Wang, Y.; Zhang, X.; Chen, C.; Liu, X.; Cai, S. Quantitative characterization of drying-induced cracks and permeability of granite residual soil using micron-sized X-ray computed tomography. Sci. Total Environ. 2023, 876, 163213. [Google Scholar] [CrossRef] [PubMed]
  33. Sun, D.; Liu, X.; Yuan, S.; Pan, G.; Jiang, G.; Wang, H.; Hideo, K.; Buzzi, O. Three-dimensional characterization of cracks in undisturbed Mile expansive soil using X-ray computed tomography. Soils Found. 2023, 63, 101282. [Google Scholar]
  34. Zhang, X.; Chen, Y.; Ye, W.; Cui, Y.; Deng, Y.; Chen, B. Effect of salt concentration on desiccation cracking behavior of GMZ bentonite. Environ. Earth Sci. 2017, 76, 531. [Google Scholar] [CrossRef]
  35. Zhang, T.; Deng, Y.; Cui, Y.; Lan, H.; Zhang, F.; Zhang, H. Porewater salinity effect on flocculation and desiccation cracking behaviour of kaolin and bentonite considering working condition. Eng. Geol. 2019, 251, 11–23. [Google Scholar] [CrossRef]
  36. Xing, X.; Kuan, D.; Ma, X. Difference in loam water retention and shrinkage behavior: Effects of various types and concentrations of salt ions. Soil Till. Res. 2017, 167, 61–72. [Google Scholar] [CrossRef]
  37. Wang, C.; Feng, G.; Zhang, Z.; Huang, M.; Qi, W.; Ma, L. Geometrical and statistical analysis of dynamic crack morphology in shrink-swell soils with addition of maize roots or salinity (NaCl). Soil Till. Res. 2021, 212, 105057. [Google Scholar] [CrossRef]
  38. Li, D.; Yang, B.; Zhang, Z.; Hu, M. Effects of salt content on desiccation cracks in the clay. Environ. Earth Sci. 2021, 80, 671. [Google Scholar] [CrossRef]
  39. Eshel, G.; Levy, G.J.; Mingelgrin, U. Critical evaluation of the use of laser diffraction for particle-size distribution analysis. Soil Sci. Soc. Am. J. 2004, 68, 736–743. [Google Scholar] [CrossRef]
  40. Ren, J.; Li, X.; Zhao, K.; Fu, B.; Jiang, T. Study of an on-line measurement method for the salt parameters of soda-saline soils based on the texture features of cracks. Geoderma 2016, 263, 60–69. [Google Scholar] [CrossRef]
  41. Yang, F.; An, F.; Ma, H.; Wang, Z.; Zhou, X.; Liu, J. Variations on soil salinity and sodicity and its driving factors analysis under microtopography in different hydrological conditions. Water 2016, 8, 227. [Google Scholar] [CrossRef]
  42. Bai, Y.; Qin, Y.; Lu, X.; Zhang, J.; Chen, G.; Li, X. Fractal dimension of particle-size distribution and their relationships with alkalinity properties of soils in the western Songnen Plain, China. Sci. Rep. 2020, 10, 20603. [Google Scholar] [CrossRef]
  43. USSLS. Diagnose and Improvement of Saline and Alkali Soils; US Government Printing Office: Washington, DC, USA, 1954.
  44. Farifteh, J.; Van der Meer, F.; Atzberger, C.; Carranzza, E.J.M. Quantitative analysis of salt-affected soil reflectance spectra: A comparison of two adaptive methods (PLSR and ANN). Remote Sens. Environ. 2007, 110, 59–78. [Google Scholar] [CrossRef]
  45. Ouyang, B.; Tang, C.; Wang, D.; Xu, S.; Shi, B. Advances on soil moisture evaporation. Rock Soil Mech. 2016, 37, 625–636, 654. (In Chinese) [Google Scholar]
  46. Tang, C.; Wang, D.; Zhu, C.; Zhou, Q.; Xu, S.; Shi, B. Characterizing drying-induced clayey soil desiccation cracking process using electrical resistivity method. Appl. Clay Sci. 2018, 152, 101–112. [Google Scholar] [CrossRef]
  47. Sun, K.; Tang, C.; Wang, P.; Wang, D.; Chen, Z.; Xu, S. Effect of salt content on desiccation cracking behavior of soil. J. Eng. Geol. 2015, 23, 77–83. (In Chinese) [Google Scholar]
  48. Amarasiri, A.L.; Kodikara, J.K.; Costa, S. Numerical modeling of desiccation cracking. Int. J. Numer. Anal. Met. 2011, 35, 82–96. [Google Scholar] [CrossRef]
  49. Trabelsi, H.; Jamei, M.; Zenzri, H.; Olivella, S. Crack patterns in clayey soils: Experiments and modeling. Int. J. Numer. Anal. Met. 2012, 36, 1410–1433. [Google Scholar] [CrossRef]
  50. Cheng, Q.; Tang, C.; Chen, Z.; El-Maarry, M.R.; Zeng, H.; Shi, B. Tensile behavior of clayey soils during desiccation cracking process. Eng. Geol. 2020, 279, 105909. [Google Scholar] [CrossRef]
  51. Cordero, J.A.; Prat, P.C.; Ledesma, A. Experimental analysis of desiccation cracks on a clayey silt from a large-scale test in natural conditions. Eng. Geol. 2021, 292, 106256. [Google Scholar] [CrossRef]
  52. Zhang, G.; Yu, Q.; Wei, G.; Chen, B.; Yang, L.; Hu, C.; Li, J.; Chen, H. Study on the basic properties of the soda-saline soils in Songnen Plain. Hydrogeol. Eng. Geol. 2007, 2, 37–40. (In Chinese) [Google Scholar]
  53. Wang, W.; Wang, Q.; Zhang, J.; Chen, H. An experiment study of on the fundamental properties of the carbonate-saline soil in west of Jilin Province. J. Beijing Univ. Technol. 2011, 37, 217–224. (In Chinese) [Google Scholar]
  54. Zhang, G.; Li, J.; Yu, Q.; Zhang, B.; Yang, R.; Chen, H. Influence of salt content on shearing strength of the carbonate saline soil in Songnen Plain. Chin. J. Geol. Hazard Control 2008, 19, 128–131. (In Chinese) [Google Scholar]
  55. Li, X.; Zhao, K.; Ren, J.; Li, Y. Correlation between conductive, soluble sodium and crack of soil in west Jilin Province. Soils Crop. 2012, 1, 49–54. (In Chinese) [Google Scholar]
  56. DeCarlo, K.F.; Shokri, N. Salinity effects on cracking morphology and dynamics in 3-D desiccation clays. Water Resour. Res. 2014, 50, 3052–3072. [Google Scholar] [CrossRef]
  57. Ren, J.; Chen, Q.; Ma, D.; Xie, R.; Zhu, H.; Zang, S. Study on a fast EC measurement method of soda saline-alkali soil based on wavelet decomposition texture feature. Catena 2021, 203, 105272. [Google Scholar] [CrossRef]
  58. Shorkri, N.; Zhou, P.; Keshmiri, A. Patterns of desiccation cracks in saline bentonite layers. Transp. Porous. Med. 2015, 110, 333–344. [Google Scholar] [CrossRef]
  59. Tang, C.; Zhu, C.; Cheng, Q.; Zeng, H.; Xu, J.; Tian, B.; Shi, B. Desiccation cracking of soils: A review of investigation approaches, underlying mechanisms, and influencing factors. Earch-Sci. Rev. 2021, 216, 103586. [Google Scholar] [CrossRef]
  60. Wang, H.; Chen, X.; Wang, W. Effect of salt cation types on propagation and closure law of desiccation cracks in red soil. J. Drain. Irrig. Mach. Eng. 2021, 39, 285–291. [Google Scholar]
  61. Fujimaki, H.; Baki, H.M.F.A.E. Effect of bypass-flow on leaching of salts in a cracking soil in the Nile Delta. Water 2021, 13, 993. [Google Scholar] [CrossRef]
  62. Yang, B.; Yuan, J. Application of fractal theory to characterize desiccation cracks in contaminated clayey soil. Arab. J. Geosci. 2019, 12, 85. [Google Scholar] [CrossRef]
Figure 1. Study area and sampling points.
Agriculture 13 01153 g001
Figure 2. Photography of cracked soil surface in nature for crack scale extraction.
Agriculture 13 01153 g002
Figure 3. Standardized preprocessing of a typical cracked soil sample. (a) Geometrically corrected and cropped colorful image, (b) transformed grayscale image, (c) transformed binary image, (d) inversion of binary image, (e) skeletonization image.
Agriculture 13 01153 g003
Figure 4. Desiccation cracking process and the surface conditions of soil samples after complete drying.
Agriculture 13 01153 g004
Figure 5. The dynamic change process of soil moisture over drying time.
Agriculture 13 01153 g005
Figure 6. Fitting results between salinity levels and evaporation rate of selected soil samples.
Agriculture 13 01153 g006
Figure 7. Dynamic variation of crack length with soil moisture.
Agriculture 13 01153 g007
Figure 8. Dynamic variation of crack area with soil moisture.
Agriculture 13 01153 g008
Figure 9. Scatter diagrams between clay content and different crack characteristics.
Agriculture 13 01153 g009
Figure 10. Cross correlation heat map of soil salinity parameters.
Agriculture 13 01153 g010
Table 1. Statistical description of physical and chemical parameters of soil samples.
Soil ParameterMinMaxMeanSDCV (%)SkewnessKurtosis
Na+ (g/kg)0.1514.123.323.34100.561.783.12
K+ (g/kg)0.0050.060.020.0169.852.014.84
Ca2+ & Mg2+ (g/kg)0.11.60.450.3066.331.854.71
Cl (g/kg)0.15.251.421.42100.211.320.96
CO32− (g/kg)0.25.52.251.5368.150.82−0.50
HCO3 (g/kg)0.1251.380.9266.551.714.69
Salinity (g/kg)1.0629.738.836.6375.121.341.79
EC (ds/m)0.063.390.960.8286.141.281.40
pH8.0110.779.770.767.82−1.12−0.02
ESP1.1447.3010.8610.2694.442.024.51
Clay (%)25.3932.0427.961.716.100.40−0.60
Silt (%)28.7240.435.113.249.24−0.12−0.82
Sand (%)28.2643.9436.963.7210.05−0.31−0.70
N = 40; SD standard deviation.
Table 2. Regression models between soil moisture and crack area of selected soil samples.
SampleEquationsR2RMSE (%)
8Y = −2653.30X2 + 497.40X + 348.800.967.65
22Y = −2197.10X2 + 199.32X + 397.870.985.88
25Y = −2248.40X2 + 354.40X + 420.580.957.51
26Y = −851.83X2 − 189.48X + 288.190.987.19
31Y = −1558.60X2 − 79.70X + 373.860.958.95
35Y = −1977.50X2 + 24.38X + 406.030.987.39
39Y = −2082.10X2 + 433.09X + 286.400.994.83
X: soil moisture content (%); Y: crack area (cm2/2500 cm2).
Table 3. Statistical information of soil moisture of all soil samples after water evaporation.
MinimumMaximumMeanVariance
Soil moisture (%)0.542.341.490.05
N = 40.
Table 4. Statistical description of crack characteristics of soil samples.
Soil ParameterMinMaxMeanSDCV (%)SkewnessKurtosis
Crack Length (cm/2500 cm2)200797.18455.83121.2826.610.460.93
Crack Area (cm2/2500 cm2)36.78547.54311.57120.7338.75−0.02−0.41
CON0.010.340.120.0865.450.830.75
Fractal1.141.601.440.128.60−0.80−0.24
N = 40; SD standard deviation.
Table 5. Correlation coefficients between different soil properties and four crack characteristics.
Soil ParameterCrack Length (cm)Crack Area (cm2)CONFractal
Na+ (g/kg)0.91 **0.42 **0.93 **0.53 **
K+ (g/kg)−0.39 **−0.43 **−0.46 **−0.54 **
Ca2+ & Mg2+ (g/kg)0.27 *0.080.210.20
Cl (g/kg)0.81 **0.44 **0.84 **0.52 **
CO32− (g/kg)0.80 **0.34 *0.82 **0.53 **
HCO3 (g/kg)0.73 **0.36 *0.74 **0.51 **
Salinity (g/kg)0.93 **0.44 **0.95 **0.58 **
EC (ds/m)0.92 **0.44 **0.95 **0.58 **
pH0.68 **0.40 **0.68 **0.61 **
ESP0.89 **0.38 **0.92 **0.50 **
Clay (%)0.150.230.130.24 *
Silt (%)0.25 *0.020.110.06
Sand (%)0.29 *0.090.160.16
N = 40; * significance level = 0.05; ** significance level = 0.01.
Table 6. Multiple linear regression models for different salt parameters.
Soil ParametersEquationsR2RPDRMSE (%)
Na+ (g/kg)Y = 13.40 + 0.01X1 + 0.008X2 + 30.50X3 − 15.69X40.933.0927.72
K+ (g/kg)Y = 0.064 − 0.11X3 − 0.04X40.351.4255.81
Ca2+ & Mg2+ (g/kg)Y = −0.74 + 0.002X1 − 1.86X3 + 0.57X40.110.5566.63
Cl (g/kg)Y = 5.09 + 0.005X1 + 0.004X2 + 11.47X3 − 5.91X40.741.6454.42
CO32− (g/kg)Y = −0.22 + 0.003X1 − 0.002X2 + 13.26X3 + 0.10X40.691.5140.45
HCO3 (g/kg)Y = 0.21 + 0.003X1 + 4.03X3 − 0.67X40.550.9547.90
Salinity (g/kg)Y = 17.81 + 0.026X1 + 0.01X2 + 57.28X3 − 21.66X40.943.6620.17
EC (ds/m)Y = 2.19 + 0.003X1 + 0.001X2 + 7.78X3 − 2.67X40.933.4025.07
pHY = 4.25 + 0.001X1 − 0.002X2 + 2.99X3 + 3.84X40.531.095.73
N = 40; X1: crack length (cm/2500 cm2); X2: crack area (cm/2500 cm2); X3: CON; X4: fractal.
Disclaimer/Publisher’s Note: The statements, opinions and data contained in all publications are solely those of the individual author(s) and contributor(s) and not of MDPI and/or the editor(s). MDPI and/or the editor(s) disclaim responsibility for any injury to people or property resulting from any ideas, methods, instructions or products referred to in the content.

