Article

Study on Spatiotemporal Evolution and Influencing Factors in Cultivated Land and Construction Land in Yunnan Province in the Past 20 Years Based on Remote Sensing Interpretation

1
Institute of Land & Resources and Sustainable Development, Yunnan University of Finance and Economics, Kunming 650221, China
2
Institute of Targeted Poverty Alleviation and Development, Yunnan University of Finance and Economics, Kunming 650221, China
3
School of Economics, Yunnan University of Finance and Economics, Kunming 650221, China
*
Author to whom correspondence should be addressed.
Agriculture 2023, 13(5), 981; https://doi.org/10.3390/agriculture13050981
Submission received: 30 March 2023 / Revised: 23 April 2023 / Accepted: 27 April 2023 / Published: 29 April 2023
(This article belongs to the Special Issue Agricultural Development Strategies for Less-Favoured Areas)

Abstract

:
With the continuous development of China’s economy and the acceleration of urbanization, the phenomenon of high-quality cultivated land being converted to construction land is becoming increasingly prominent. In mountainous provinces such as Yunnan, the contradiction between cultivated land protection and blind expansion of construction land is becoming increasingly obvious. Based on the characteristic region of the mountainous province of Yunnan, this paper integrates remote sensing image interpretation of land use/land cover data in three phases (i.e., 2000, 2010, and 2020) with GIS technology and econometric methods. Through the interpretation of remote sensing images from 3 phases of Yunnan Province, a detailed calculation was conducted on the per capita cultivated land area (CULA) and per capita construction land area (COLA) and their changes in 129 counties in the province over the past 20 years (2000~2020). The spatiotemporal evolution laws and spatial pattern characteristics of CULA and COLA were analyzed, and then, the influencing factors in the quantitative characteristics of cultivated land and construction land in the province were studied further by using spatial econometric models. This study finds that the total and per capita CULA in Yunnan Province have significantly decreased over the past 20 years, which poses a threat to the national food security to a certain extent. At the same time, the total amounts of COLA and the per capita COLA have significantly increased, leading to the phenomenon of blind expansion and rough utilization of construction land. Compared with international research results, Yunnan can learn many lessons about controlling the reduction in CULA and the rapid expansion of COLA, among which the most important thing is to choose suitable urban and industrial development paths and adopt effective intensive land utilization methods. The research results of this study can provide a basic reference for mountainous provinces to formulate reasonable measures for cultivated land protection, prevent the disorderly expansion of construction land, and promote the coordinated development of urban and rural areas.

1. Introduction

Industrialization and urbanization are the necessary path and trend in economic and social development of a country or region [1]. In the process of industrialization and urbanization, due to the increase in urban land, industrial land, and other infrastructure construction land, the cultivated land area (CULA) inevitably undergoes dynamic changes [2]. Therefore, theoretically speaking, there is a mechanism of mutual influence between industrialization, urbanization, and changes in CULA [3]. On the one hand, the development of industrialization and urbanization requires the occupation of a certain scale of cultivated land, which often leads to a decrease in CULA. On the other hand, the change in cultivated land also has a reverse impact on the development of industrialization and urbanization. The usual law is that after the conversion of cultivated land to urban land, industrial land, and other infrastructure construction land, the land provides development space for industrialization and urbanization, promoting the increase in construction land area (COLA). However, the final form of net increase or decrease in CULA depends on the comprehensive effect of various factors [4]. There are four main paths for the reduction in CULA: firstly, various types of construction occupying cultivated land; secondly, ecological restoration of cultivated land; thirdly, agricultural structural adjustment (i.e., conversion of cultivated land into forest land, grassland, fish ponds, etc.); and fourthly, natural disaster damage. The main ways to increase CULA include the development of suitable reserve land resources, the reclamation of various types of abandoned land, and land consolidation. Due to the national conditions and land resource endowments of different countries and regions being different, the degree of industrialization and urbanization development, agricultural policies, and the changes in CULA and COLA are also different. Overall, as a developing country and region, especially one with a large population and limited cultivated land resources, it is necessary to maintain a considerable scale of cultivated land resources, which is also the basis for ensuring national and regional food security. This is especially true in mountainous areas, such as Yunnan Province, a mountainous province located in the southwestern border region of China, where about 94% of the land belongs to mountainous areas. The topographic characteristics of high mountains and steep slopes determine that the entire ecological environment is fragile, with limited cultivated land resources and slow economic development. In the past decade, similar to the basic national conditions in China, the per capita CULA in Yunnan Province has significantly decreased, while the per capita COLA has increased significantly [5,6], which has had a certain impact on regional food security and economic development. What factors have caused such significant changes in the per capita CULA and per capita COLA? At present, there are few researchers conducting positive discussions on this issue, and there are also few researchers conducting in-depth analysis by constructing scientific models and reasonable indicator systems. In response to the current lack of in-depth exploration of the correlation between the changes in the quantity of cultivated land and construction land and various influencing factors, as well as the lack of in-depth exploration of the spatial correlation of various influencing factors, and compared with the existing research literature, the main feature and contribution of this article lies in the organic integration and metasynthesis of remote sensing (RS) image interpretation with GIS technology and econometric methods. Based on the characteristics of mountainous provinces and the interpretation of land use/land cover data from remote sensing images in Yunnan Province’s 3 phases (i.e., 2000, 2010, and 2020), a detailed calculation of the per capita CULA and per capita COLA and their changes in 129 counties in Yunnan Province over the past 20 years (2000~2020) was conducted by using the interpretation data from the 3 phases of remote sensing images, and the spatiotemporal evolution laws and spatial pattern characteristics of CULA and COLA were analyzed. Furthermore, the spatial econometric model is used to conduct in-depth research on the influencing factors in the quantity characteristics of cultivated land and construction land in Yunnan Province, aiming to provide a basic reference for the rational formulation of cultivated land protection measures, prevention of disorderly expansion of construction land, and promotion of urban–rural coordinated development in mountainous provinces.

2. Literature Review

The research on changes in cultivated land and construction land and their influencing factors can be roughly divided into two categories from the perspective of research content: firstly, the research on land use/land cover change (LUCC) and its driving forces is included, which has been the mainstream of international research over the past 30 years, including the analysis of dynamic changes in CULA and COLA, as well as the analysis of the driving forces of these changes. For example, Li Xiubin et al. [7] studied the driving forces of cultivated land conversion in China, and Liu Jiyuan et al. [8] analyzed the changes in and driving forces of land use in China. Secondly, the study of the interactive relationships or mechanisms among industrialization, urbanization, and cultivated land change is included. This research mainly explores the role of industrialization and urbanization in cultivated land change. For example, Wang Chengjun et al. [3,9] used data from 42 countries and regions to analyze the role of industrialization and urbanization in cultivated land change. Tan Minghong et al. [10], Zhu Lifen et al. [11], and Zhang Xiaobo et al. [12] studied the impact of industrialization and urbanization development on cultivated land change in China. Deller Steven [13] and Wang et al. [14] studied the relationship between industrialization, urbanization, and cultivated land change in the United States. Jia Shaofeng et al. [15], Hao Shouyi et al. [16], and Sun Qiang et al. [17] studied the changes in cultivated land and their driving factors during Japan’s industrialization and urbanization processes. Huang Daquan et al. [18] and Liu Xinwei [19] analyzed the cultivated land changes in Japan, the Republic of Korea, Taiwan, Europe, and the United States in the process of national industrialization and urbanization by means of multi-country comparison.
From the perspective of technical means for obtaining basic data on land dynamics, there are studies on land use/land cover change (LUCC) based on two or more periods of remote sensing image interpretation and GIS technology [8,20], as well as analysis of cultivated land change using conventional historical statistical data [21,22,23]. From the perspective of analysis methods for influencing factors in cultivated land changes, qualitative descriptions are the main driving force of analysis, mainly involving factors such as economic development level, population growth, transportation expansion, urbanization level, and cultivated land protection policies [22,23]. There are also a few scholars who apply econometric methods for quantitative empirical analysis [9,10,11].
In general, there are many publications related to the study of cultivated land and construction land; however, the method of data collection is often relatively simple. Some analysis uses research data sources consisting of conventional statistical yearbooks. The advantage of this method is that the determination of land area is clear and convenient; however, this method results in data gaps, and it is difficult to subdivide the land area according to administrative units such as prefecture-level cities and counties. Using remote sensing image interpretation methods can remedy this problem. Remote sensing image interpretation is the process of analyzing the characteristic information provided by remote sensing images to identify targets or phenomena. It can generally be divided into three processes: image recognition, image measurement, and image analysis [24]. With the gradual rise of modern information technology, more and more researchers have used a combination of remote sensing (RS) image interpretation and GIS to draw land use/land cover (LULC) change maps, thereby obtaining the areas of different land use types and allowing analysis of the spatiotemporal evolution. For example, Liu Jiyuan et al. [25,26,27] (2003, 2014, 2018) conducted a continuous study of the spatiotemporal evaluation of land use change in China. Fu Bojie et al. [28] (2010) studied land use change in the Bohai Rim region, and Xiao Hongye et al. [29] (2022) analyzed the spatiotemporal characteristics of land use change in the black soil region. Existing research has shown that land cover is the most easily detected indicator of human intervention [30]. Using RS and GIS technology to generate LULC information can provide the foundation for land use planning and strategic formulation by monitoring land use and natural resources as well as urban development in the study area [31,32,33,34]. In general, the existing research has made a significant contribution to determining the quantitative characteristics and spatiotemporal evolution of cultivated land and construction land. However, there is a lack of in-depth exploration and analysis of the reasons behind the changes affecting the quantity of cultivated land and construction land. Although studies have analyzed the driving forces and influencing factors in land use change, overall, the existing research has not established an accurate and reasonable multi-dimensional indicator system or applied scientific empirical model research methods for deeper analysis. This is mainly due to the complex factors that affect land use, including factors such as overall economic development, urbanization processes, rural industrial development and rural residents’ income, cultivated land protection policies, and regional governance. Therefore, based on RS interpretation and the acquisition of LULC information, it is very important to establish a scientific analysis of influencing factors and to use appropriate models to analyze such factors.
With the advancement of RS technology, it has been increasingly feasible to accurately evaluate LULC change through the creation of up-to-date maps [35]. This allows this study to combine remote sensing interpretation of LUCC information with econometric models to deeply analyze the spatiotemporal evolution laws of and influencing factors in CULA and COLA in Yunnan Province.

3. Materials and Methods

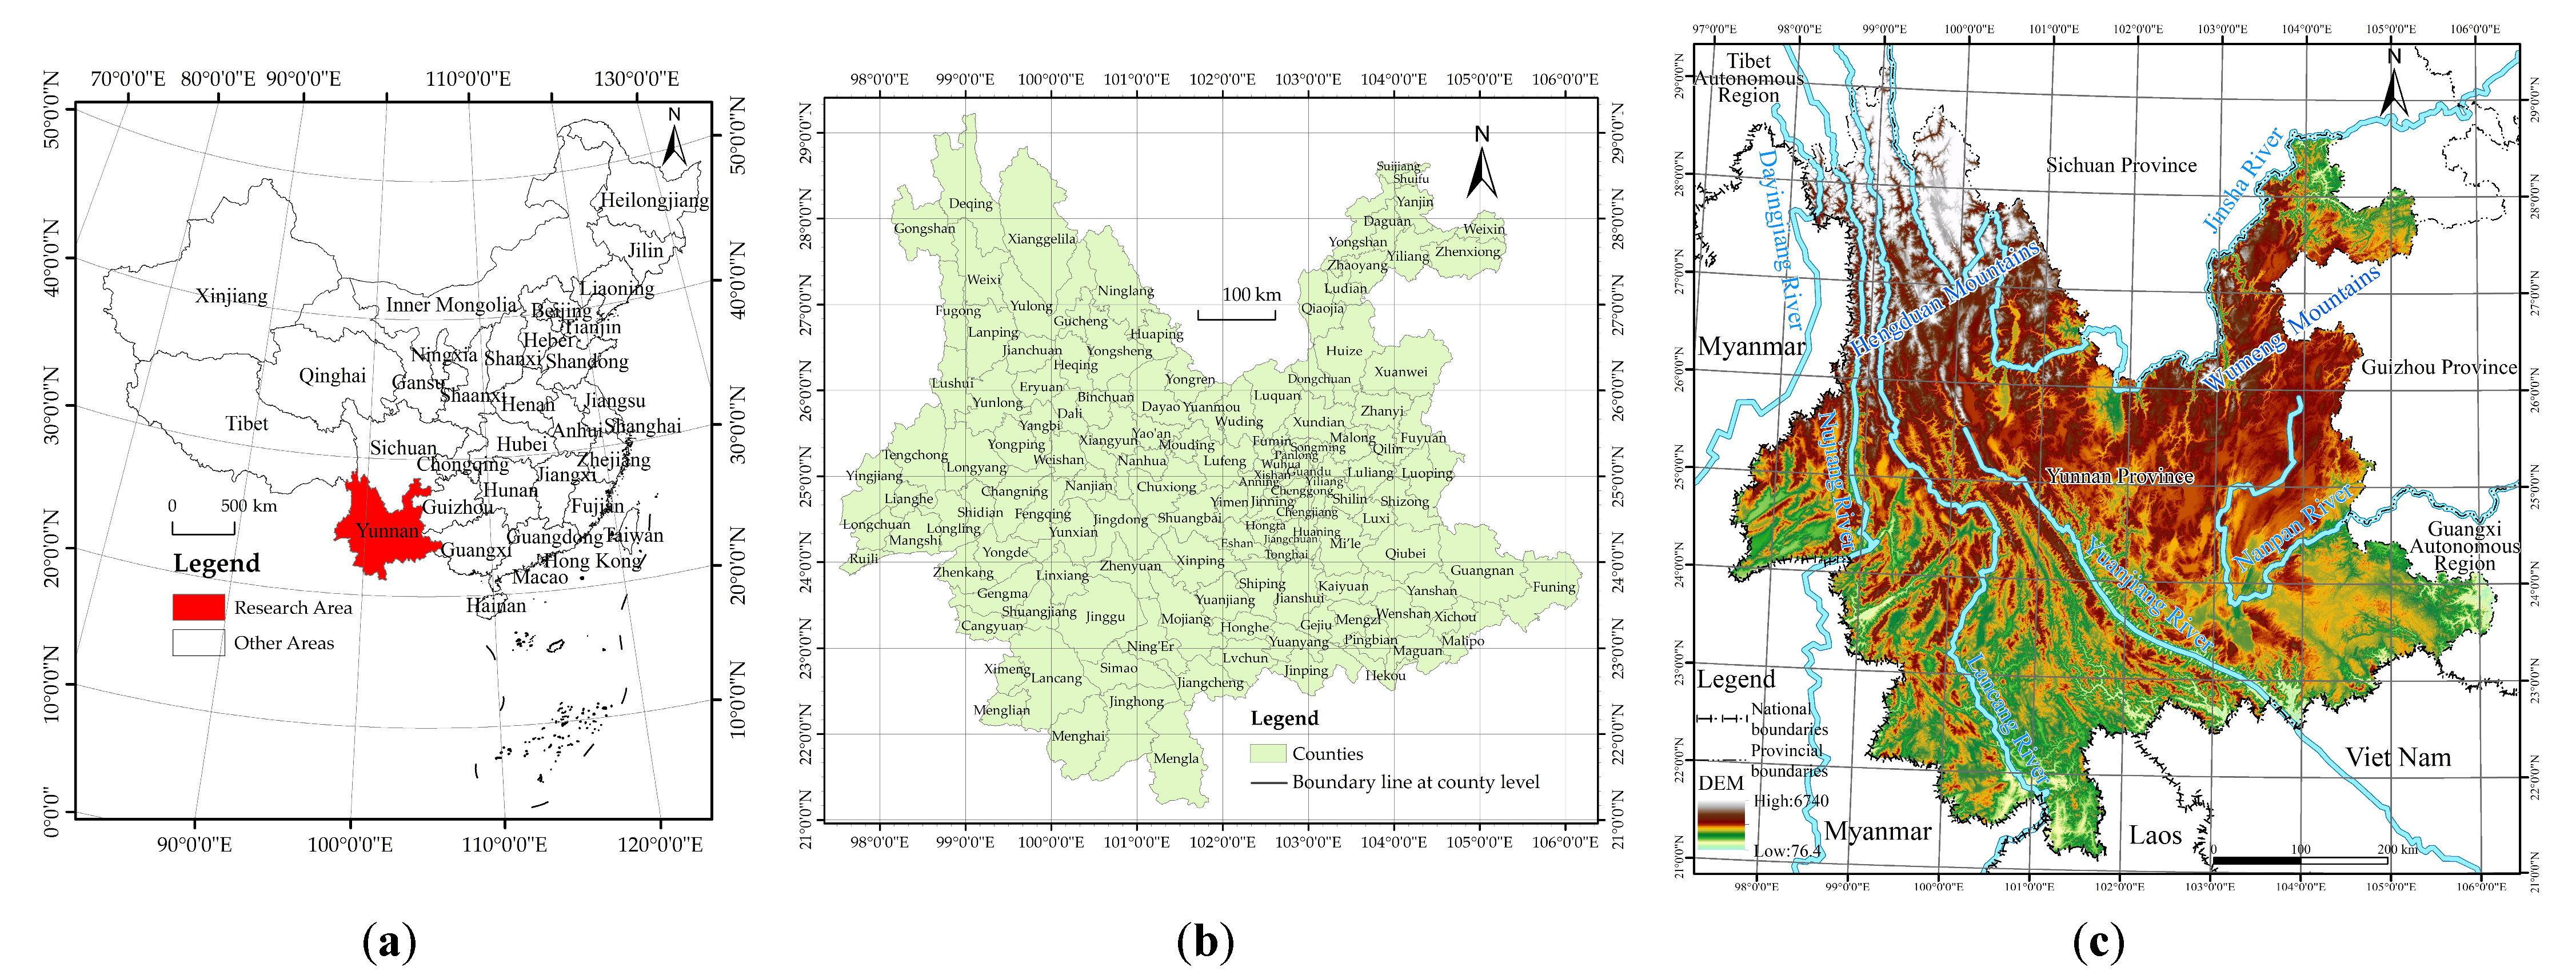
3.1. Overview of the Research Area

Yunnan is located in the southwestern border region of China, from longitude 97°31′ E to 106°11′ E and from latitude 21°8′ N to 29°15′ N, and the Tropic of Cancer crosses the southern part of the province (Figure 1a). It borders Guangxi and Guizhou in the east, faces Sichuan across the Jinsha River in the north, borders Tibet in the northwest, borders Myanmar in the west, and borders Laos and Vietnam in the south and southeast, respectively. In addition to Dehong, Nujiang, and Diqing, there are 129 county-level administrative units in the province, including 17 county-level districts, 17 county-level cities, 29 ethnic autonomous counties, and 66 non-ethnic autonomous counties [36] (Figure 1b).
Yunnan is a typical mountainous province with a predominantly mountainous terrain. In the total land area of the province, mountainous areas account for about 94%, and relatively flat basins and valleys account for about 6% [5]. The terrain of the province is characterized by high altitude in the northwest, low altitude in the southeast, and a stepwise decline from north to south (Figure 1c). The average elevation is about 2000 m, and the highest point is 6740 m above sea level, located at the main peak of the Meili Snow Mountain in the Nushan Mountains in Deqin, the border between Yunnan and Tibet. The lowest point is 76.4 m above sea level, located at the boundary between China and Vietnam in southeastern Yunnan, 6663.6 m below the highest point. Yunnan comprises mainly mountainous areas and large topographic gradients. The description “high mountains, steep slopes, and many rocks, climbing when going out” presents the basic topographic features of Yunnan. According to the measurement of the Yunnan Provincial Agricultural Zoning Office (1987) [37], about 77% (over 3/4) or more of the land in the province has a slope of over 15°, and nearly 40% (about 2/5) of the land has a steep slope of >25°. This shows the steepness of Yunnan’s topography. The mountainous terrain features mainly determine the limited CULA in Yunnan. In addition to the rapid development of urbanization and industrialization over the past 20 years, as well as the acceleration of infrastructure construction for purposes such as transportation and water conservancy, Yunnan’s cultivated land has decreased significantly, while construction land has significantly increased. According to the third national land survey of Yunnan Province [6], the total CULA in the province in 2019 was 5.396 million hectares, a net decrease of 13.59% compared to the second national land survey in 2009 (6.244 million hectares) [5]. Within this area, the paddy field area, the essence of cultivated land, decreased by 31.54% from 2009 to 2019. The reduced cultivated land, especially high-quality cultivated land with good location conditions, is mostly occupied by various types of construction, resulting in a rapid increase in the COLA. The results of the third national land survey in Yunnan Province show that in 2019, the construction land area in the province reached 1.302 million hectares, a net increase of 51.75% compared to the second national land survey in 2009 (0.8568 million hectares). In this area, the decrease in the total CULA (especially high-quality cultivated land) is not conducive to the guarantee of food security and the development of characteristic industries in mountainous provinces, which in turn affects the healthy development of agriculture and rural areas and the increase in farmers’ income. Similarly, the excessive expansion of construction land has to some extent led to extensive land use and low efficiency, which is also detrimental to the sustainable development of the economy and society in mountainous provinces.
According to Yunnan Statistical Yearbook-2021 [36], the total population of Yunnan Province at the end of 2020 was 47.22 million. The urban population was 23.63 million, accounting for 50.05%, and the rural population was 23.59 million, accounting for 49.95%. In 2020, there were 28.06 million employed people in the province, of which 12.92 million were urban employees, accounting for 46.04%; there were 15.14 million rural employees, accounting for 53.96%. Yunnan’s GDP has reached 245.22 billion CNY, of which the output value of primary industry is 359.89 billion CNY in 2020, accounting for 14.68%; the output value of secondary industry is 828.754 billion CNY, accounting for 33.80%. The per capita disposable income of all residents in 2020 was 23,295 CNY, ranking 28th (i.e., 4th from the bottom) among the 31 provinces in China. Among the residents, the per capita disposable income of rural residents was 12,842 CNY, which is also the 4th from the bottom among the 31 provinces in China [38]. In 2020, the total sown area of crops in the province was 7.0101 million hectares, of which 4.1674 million hectares were sown for grain crops, accounting for 59.45%. The total grain output of the province in that year was 18.9586 million tons, with a per capita grain output of 396 kg. The total production of oil was 0.6309 million tons, with an average of 13 kg per person. The total yield of vegetables was 25.0789 million tons, with an average of 532 kg per person. The total output of fruits was 9.6158 million tons, with an average of 204 kg per capita.

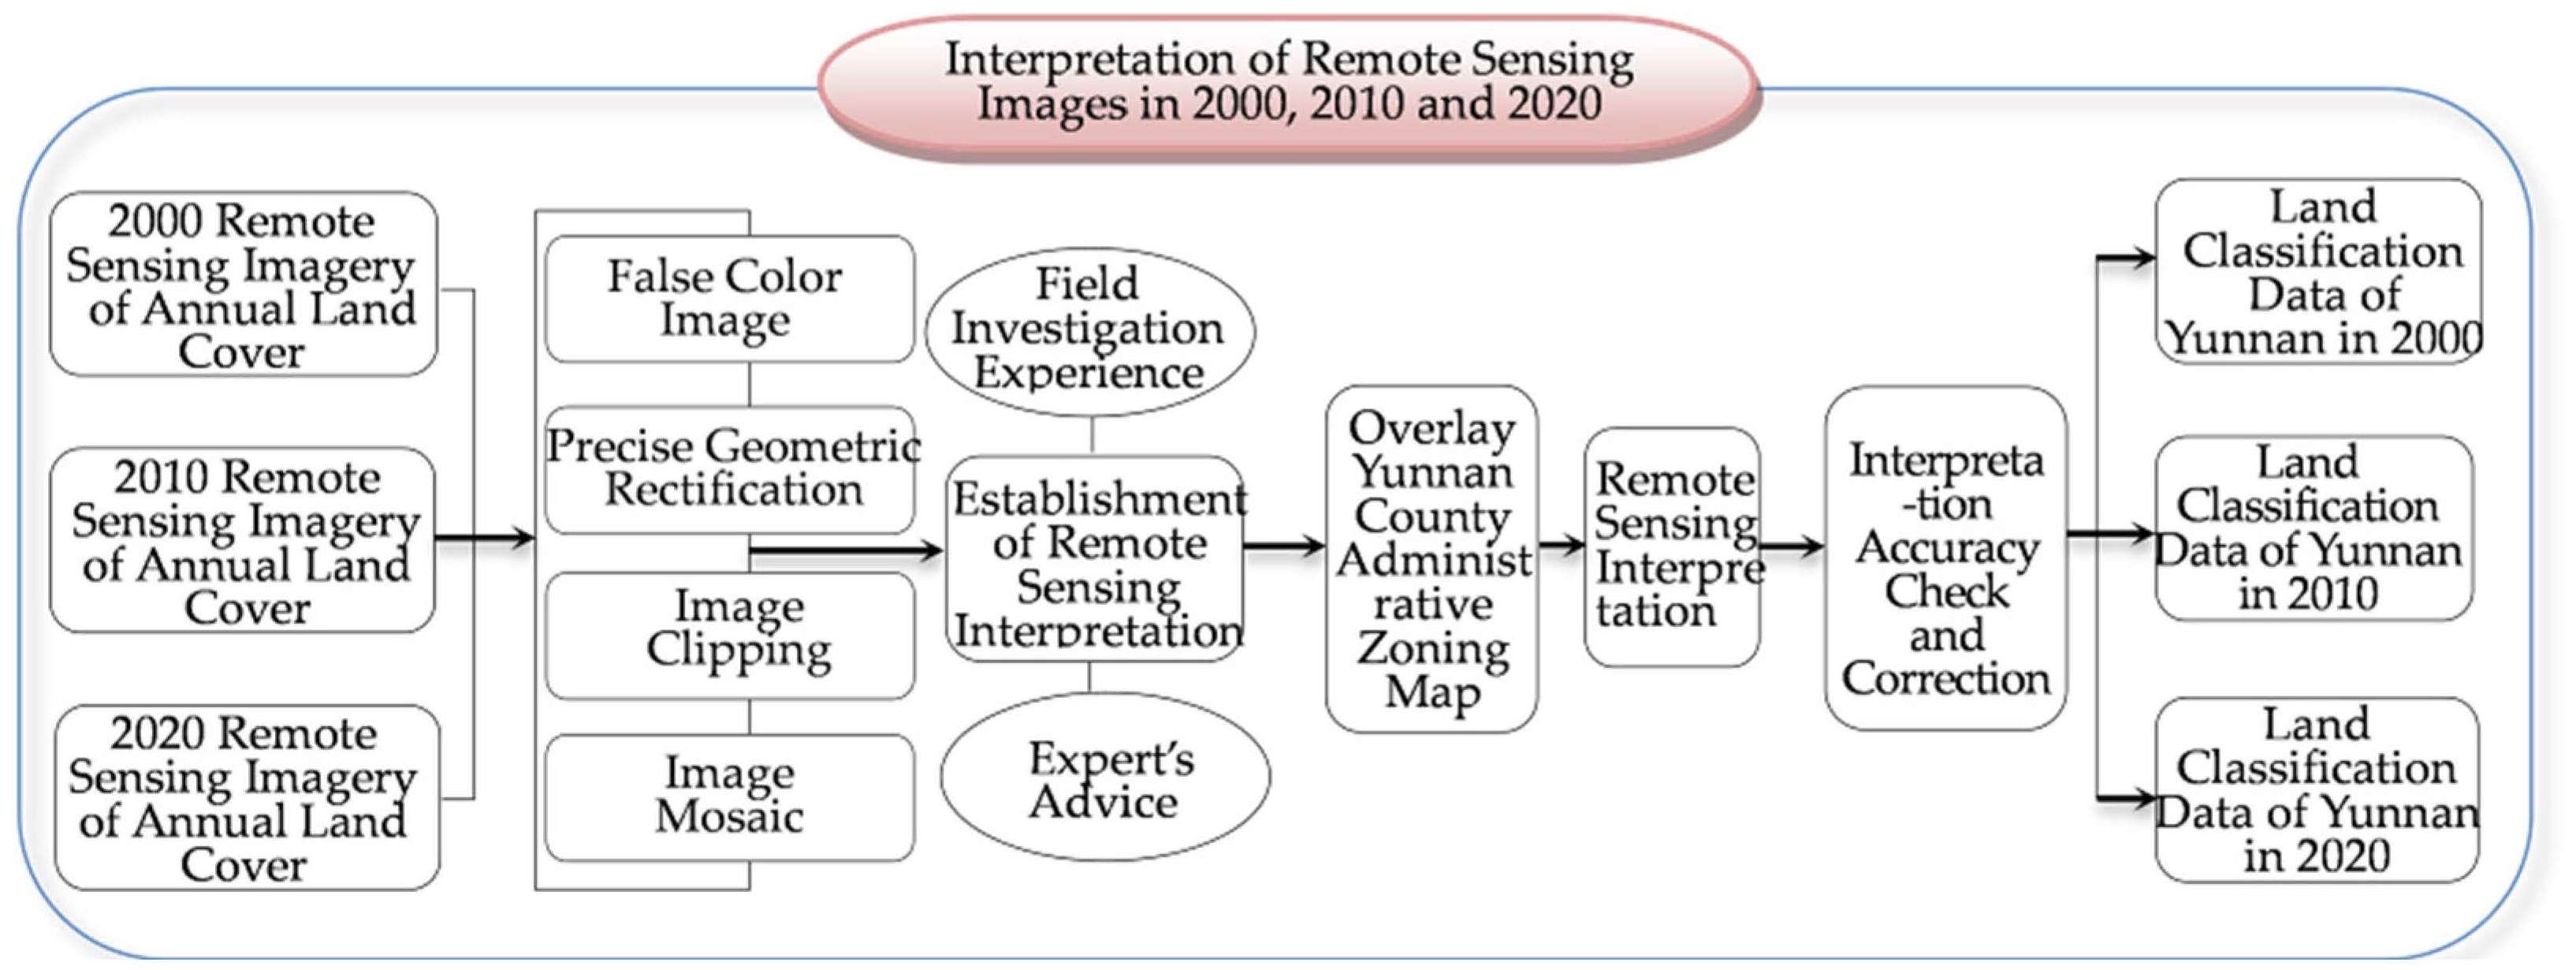
3.2. Remote Sensing Data Acquisition and Interpretation

The 3 phases of RS image data (i.e., 2000, 2010, and 2020) used in this paper are from the website (https://www.resdc.cn/, accessed on 16 June 2022) with a spatiotemporal resolution of 30 m × 30 m. On the basis of the national environmental database, the CAS has established a multi-period LULC remote sensing image database for China, using the Landsat RS images of the United States as the main information source. The areas that cannot be covered due to poor temporal phase are supplemented by China Brazil Resources Satellite data or environmental small-satellite data. In terms of temporal data, the Landsat-TM/ETM RS images from 1999–2000 are the main information sources for LULC data in 2000, the Landsat-TM RS images from 2009–2010 are the main information sources for LULC data in 2010, and the Landsat-8 RS image data are used for updating LULC RS image information in 2020. In the seasonal phase, images with less than 10% cloud content in winter are selected for interpretation according to the actual situation in Yunnan. Table 1 details the data information on the remote sensing images of three different phases used in this paper.
In accordance with Xu Xinliang, Liu Jiyuan et al. [39], and the LULC classification system established in [40,41,42], combined with the actual data for Yunnan, the three phases LULC classification system determined 6 first-level land classes and 12 second-level land classes. Figure 2 describes in detail the process of interpreting RS images to obtain LULC maps.

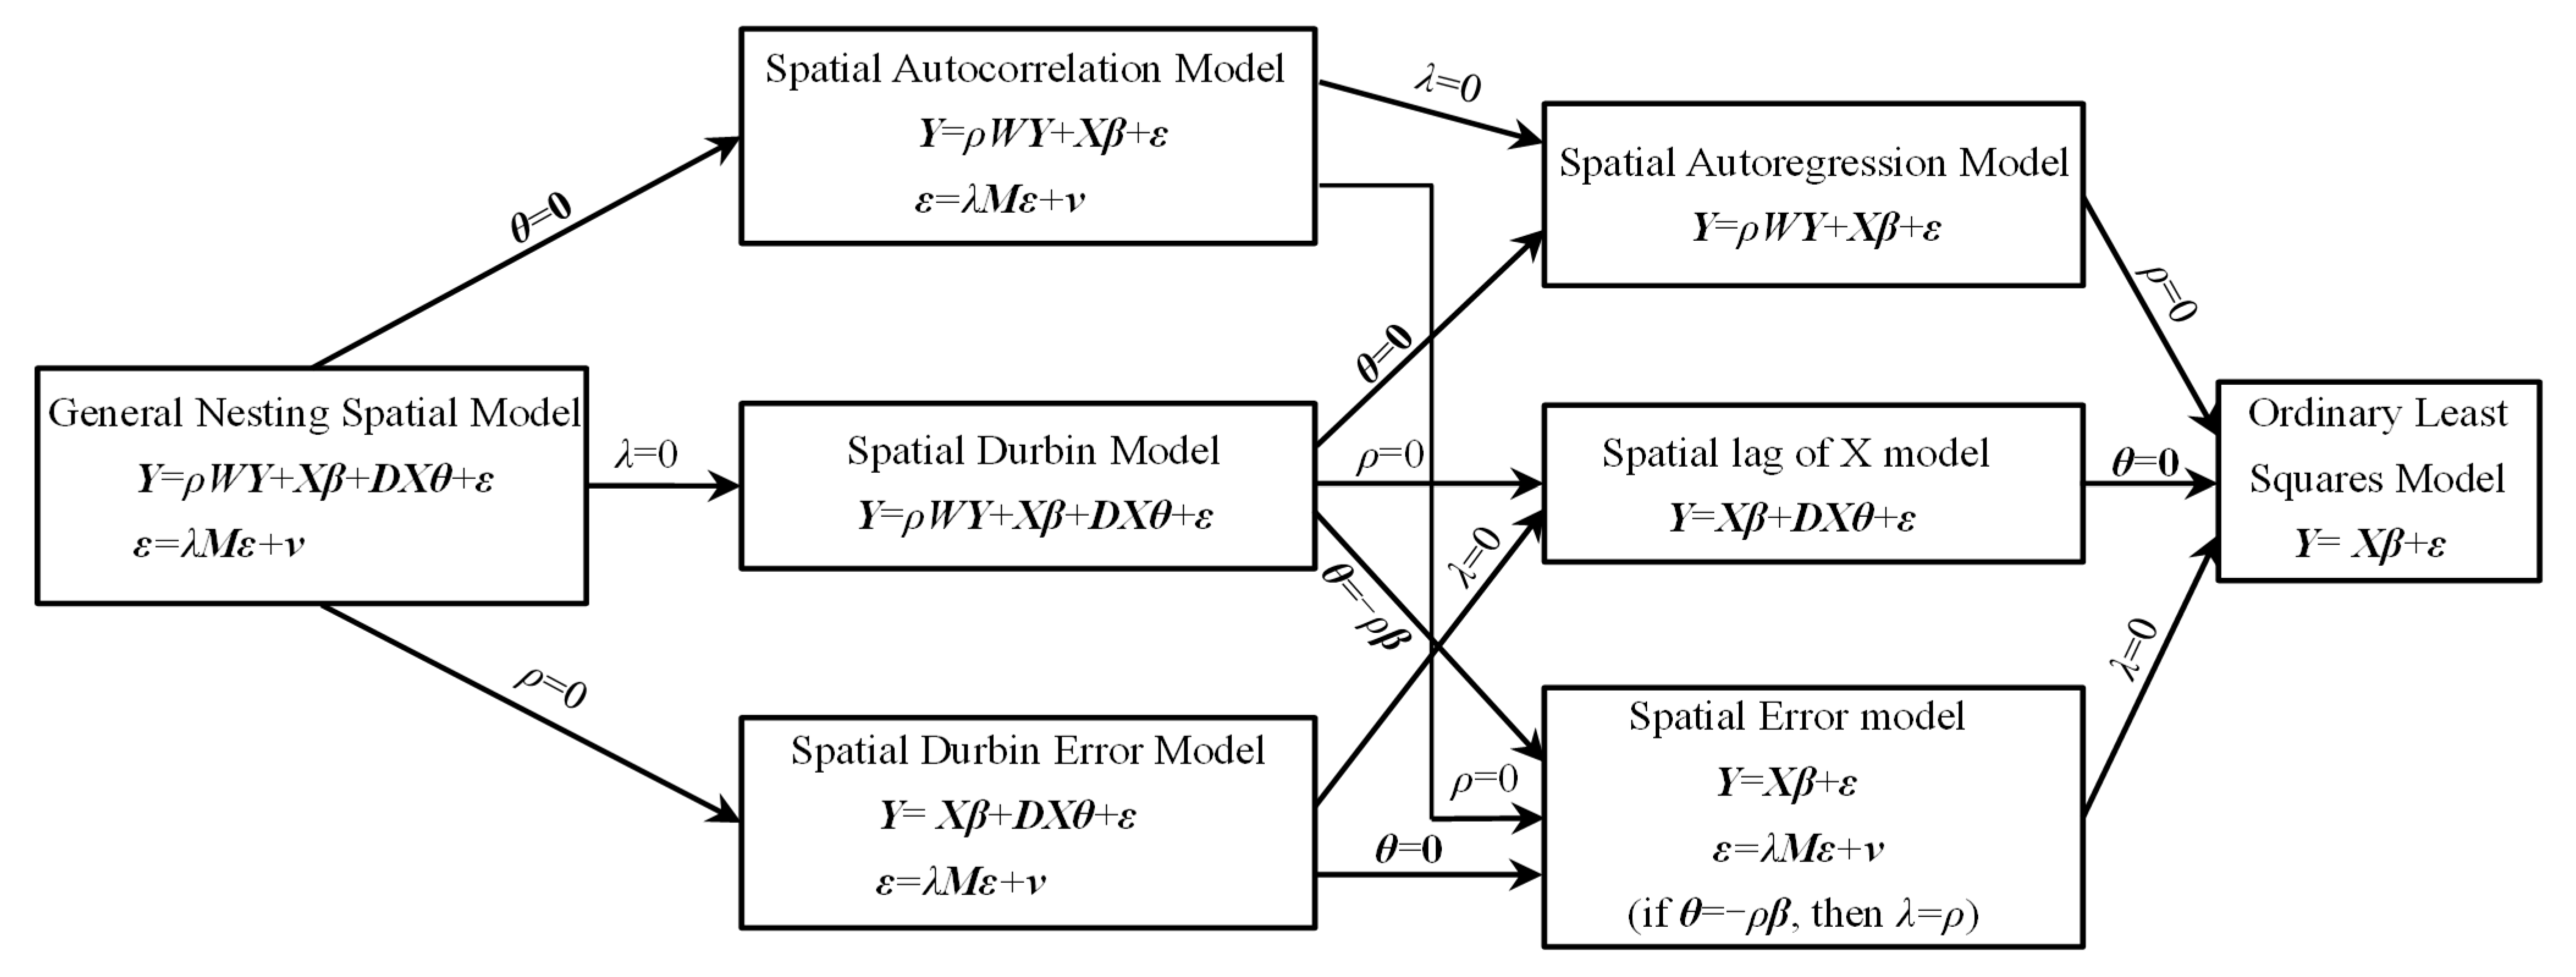
3.3. Spatial Econometric Model

The spatial econometric model has a wide range of applications. Due to its ability to better control spatial autocorrelation, spatial econometrics has increasingly become a leading mainstream discipline [43]. The first law of geography indicates that the closer things are, the more related they tend to be [44]. As this study includes the panel data of 129 counties and 3 periods, there is a significant chance of spatial autocorrelation issues. Thus, it is suitable to use spatial econometric methods to analyze the influencing factors in per capita CULA and per capita COLA [43].
Before building a model, it is essential to select a suitable spatial weight matrix. There are various forms of matrices, including the weight matrices of spatial adjacency, spatial inverse distance, and economic geographical distance. This paper proposes using the weight matrix of spatial adjacency. After establishing the matrix, it is necessary to calculate its spatial autocorrelation degree. Moran’s I can determine the spatial correlation degree between regions, and the formula can be expressed as follows [45]:
Moran s I = n e T W e e T e ( i j w i j ) = i j w i j ( x i x ¯ ) ( y i y ¯ ) S 2 ( i j w i j )
where e represents the residual matrix, W represents the spatial weight matrix, and S2 represents the variance of the observed value xi.
For data with spatial autocorrelation, using traditional estimation methods cannot effectively control spatial correlation, which can easily cause bias. Therefore, using spatial econometric models for accurate estimation seems more appropriate [46]:
Y i t = τ Y i , t 1 + ρ W i Y t + X i t β + D i X δ + u i + γ t + ε i t ε i t = λ M i ε t + v i t
where Yi,t−1 represents the first-order delayed term of Yit (i.e., when τ ≠ 0, it is a dynamic model); W, D, and M represent the spatial weight matrix; X represents the explanatory variable matrix; β and δ represent the parameter vector; ui is the fixed effect; γt represents the time effect; and εit is the residual error.
The above models are general in nature, they can be transformed under specific conditions, and Figure 3 shows in detail the transformation relations of various models and their specific conditions [47].
There are corresponding differences in each model for different types of data [48]. Generally speaking, the spatial autoregressive model with spatial autoregressive disturbances (SARAR), the spatial error model (SEM), the spatial autoregressive model (SAR), and the spatial Durbin model (SDM) are generally used for panel data. This paper intends to use these models to explore the influencing factors in per capita CULA and per capita COLA in 129 counties in Yunnan, with the aim of providing a reference for relevant departments to scientifically plan for land use applications. Figure 4 shows the steps and methods of selecting the optimal spatial econometric model in detail.

3.4. Indicator System of Influencing Factors
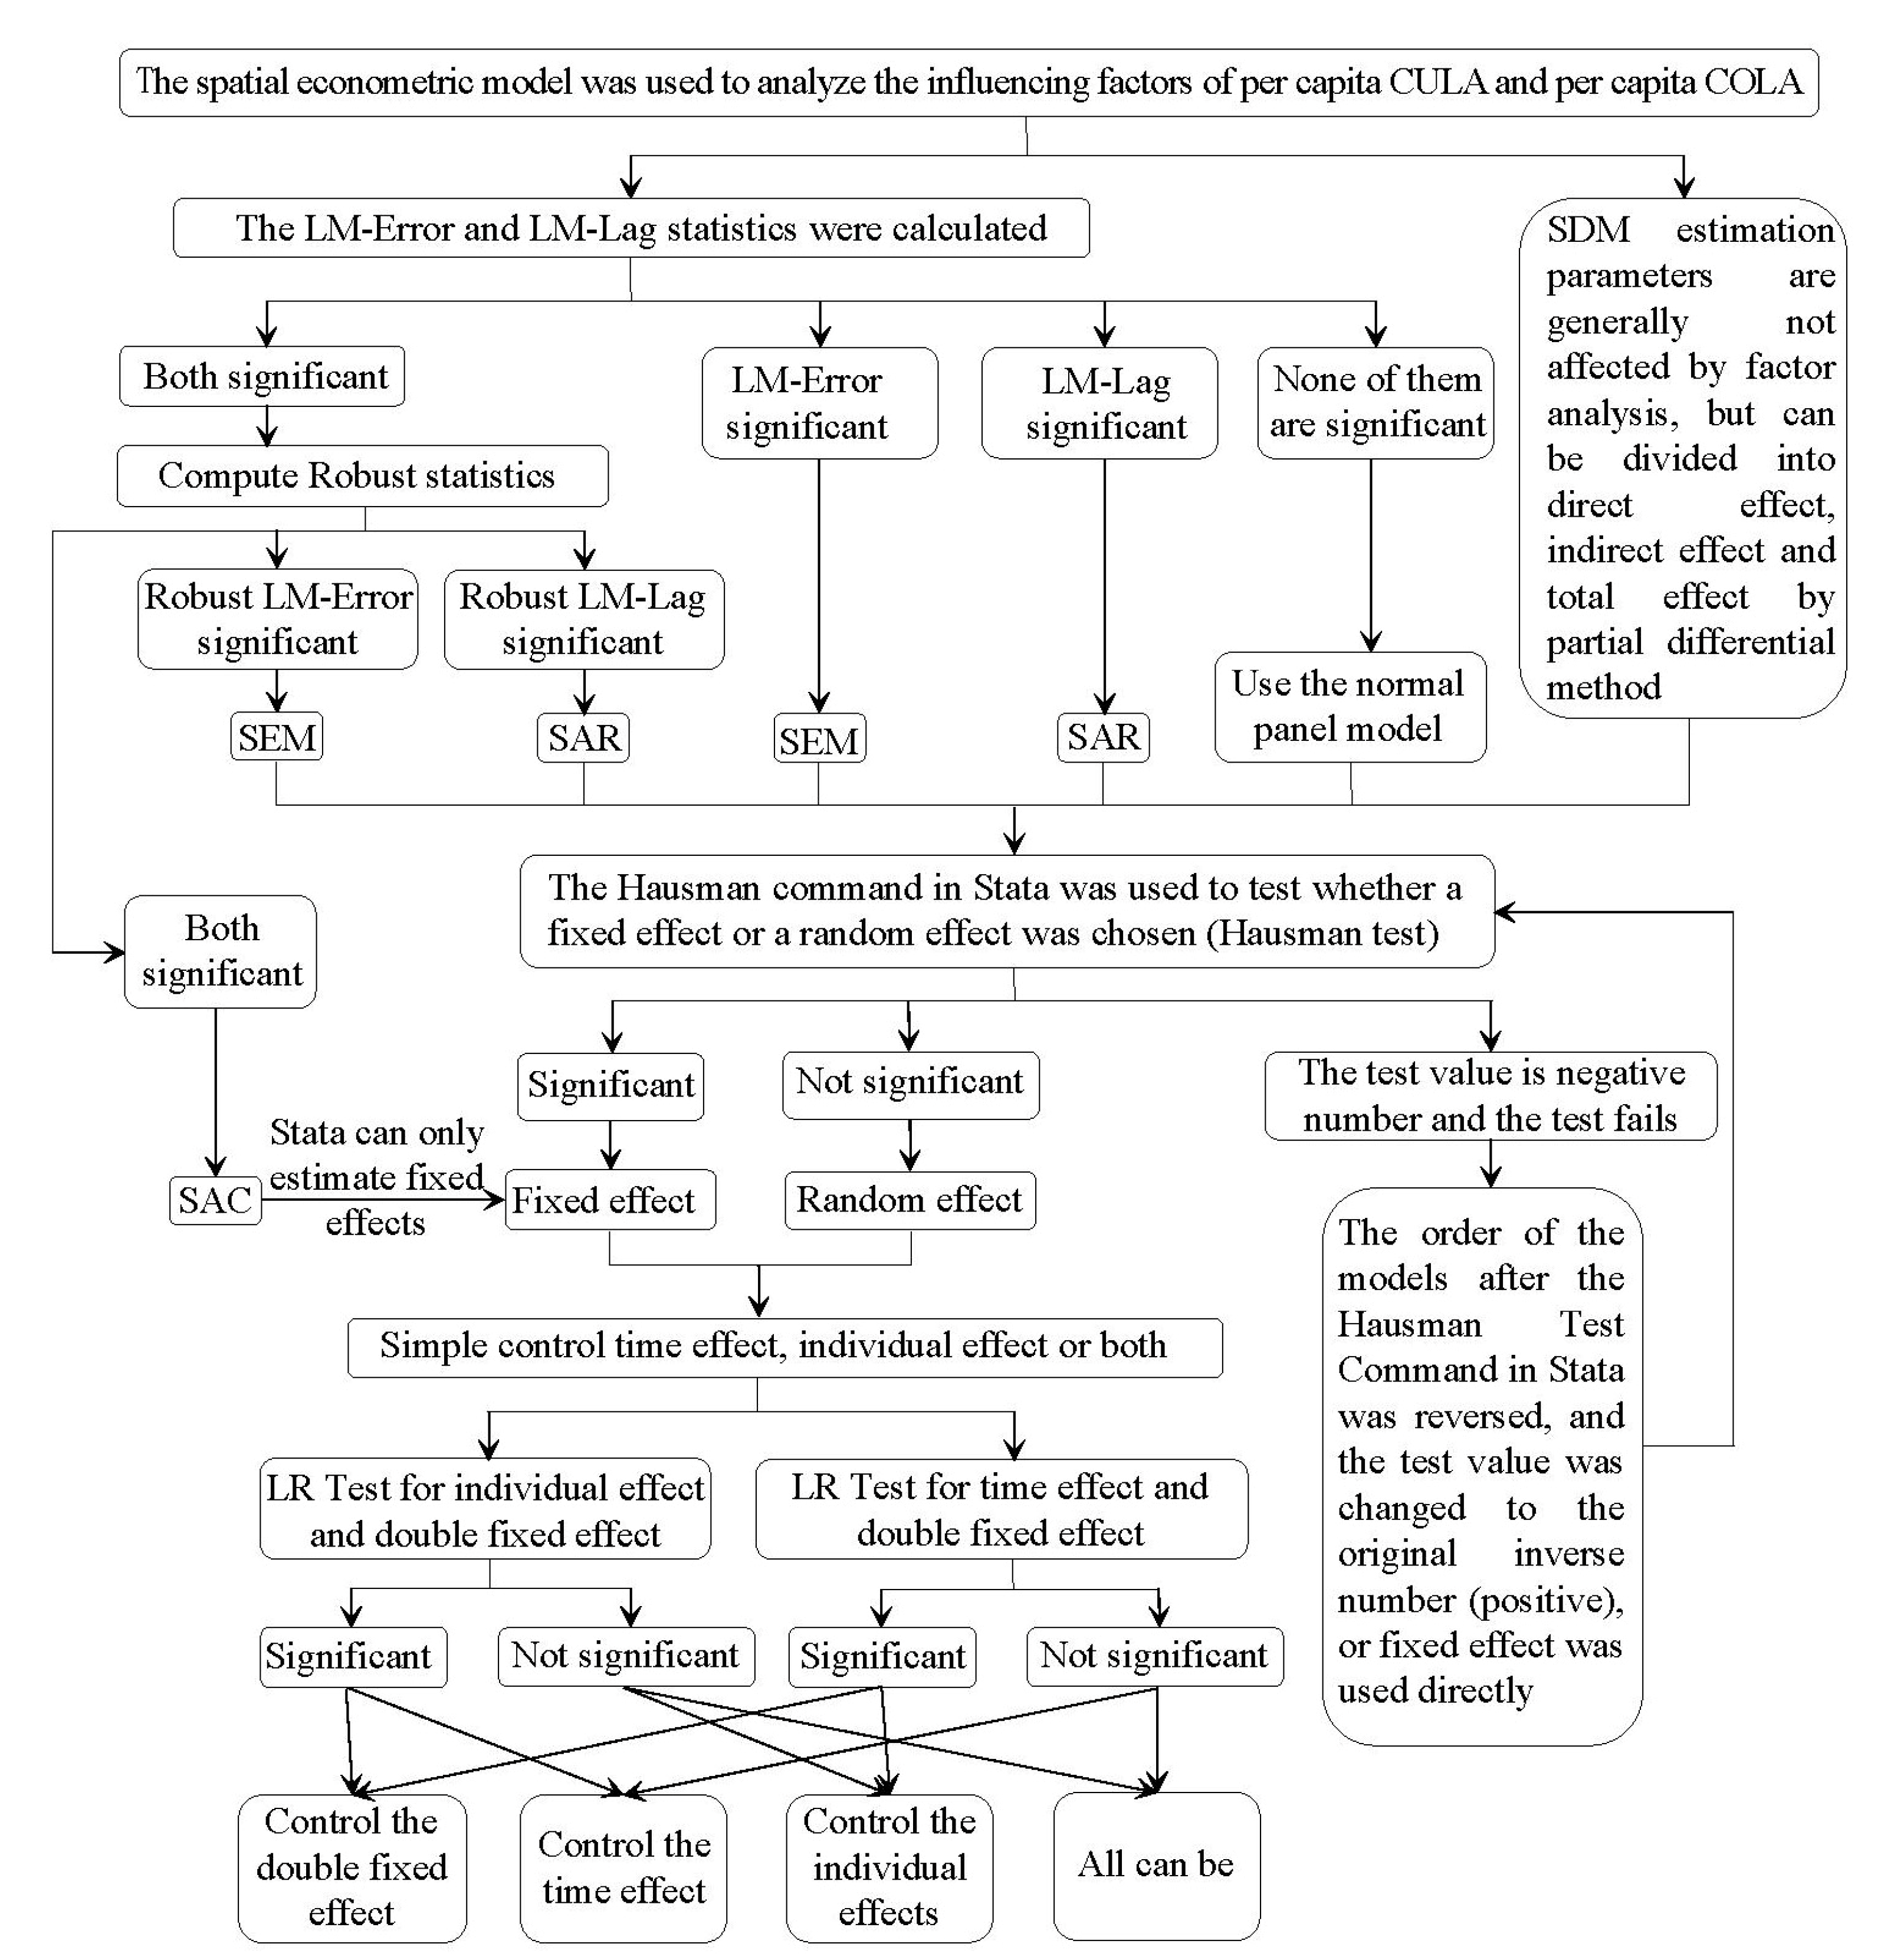
Simply comparing the total area and proportion of CULA and COLA does not take into account the element of population increase in various regions over the past 20 years. Therefore, this article intends to explore the per capita CULA and COLA as dependent variables. In the past 20 years, the per capita CULA has decreased significantly, and the per capita COLA has increased significantly. The question is thus: what factors affect the per capita CULA and per capita COLA? Few studies have provided an in-depth discussion of this issue or have conducted a comprehensive exploration of the influencing factors in per capita CULA and per capita COLA through the construction of scientific models and reasonable indicator systems. However, there remain many studies that have explored this issue directly or indirectly, resulting in a broad consensus [4]: with the advancement of urbanization, the per capita COLA will continue to expand, and this expansion is also highly likely to occupy high-quality cultivated land, leading to a reduction in the area and quality of cultivated land. Furthermore, the disorderly expansion of rural settlements will also lead to a reduction in CULA. The returning of cultivated land to forests will also reduce CULA [49]. However, the above summary is mainly based on long-term experience and statistical data and does not explore the impacts from the perspective of mathematical analysis. Referring to the indicator system used by Wang Chengjun et al. [3] (2012), Wang Chengjun et al. [9] (2013), Tan Minghong et al. [10] (2004), Zhu Lifen et al. [11] (2007), Li Jianghua et al. [22] (2006), and Du Xinbo et al. [23] (2013) in analyzing the impact of urbanization, industrialization, and other dimensions on cultivated land change, combined with the characteristics of Yunnan Province and the availability of basic data, this article intends to construct a comprehensive indicator system (Table 2).
Table 2 lists the names, calculation methods, and units of various indicators in detail. The data source for light brightness in the nighttime is DMSP/OLS and is processed by ArcGIS software. Data such as cultivated land area, construction land area, biological abundance index, and NDVI are derived from remote sensing interpretation. The data source for terrain and climate degrees of excellence is Yunnan Provincial Agricultural Zoning Committee Office (1987) [37]. The data sources for all other indicators are Yunnan Provincial Statistical Yearbook (2001–2021) and EPS platform. To ensure the stability of model estimation, this paper conducts natural logarithmic processing on the above economic data and dependent variables (per capita CULA and per capita COLA). Using natural logarithm processing has many advantages. First, using natural logarithms can alleviate or even eliminate interference of heteroscedasticity and other issues to a certain extent. Second, the vast majority of economic variables can exhibit exponential explosive growth and thus exhibit significant differences with changes in price levels. Using natural logarithms for economic variables can make data more stable, eliminate the impact of price changes to a certain extent, and make estimates more reliable. Third, using natural logarithms is helpful in studying elasticity issues, as the actual effects of the marginal increments of various economic data generally vary depending on the total amount.
Terrain and climate factors are key factors affecting CULA and COLA. Therefore, this paper proposes to adopt an evaluation method of constructing terrain and climate degrees of excellence, and it assigns 60% and 40% weights to the terrain and climate degrees of excellence, respectively, to obtain a comprehensive evaluation index (Figure 5).
Based on the above indicator system, we will further analyze and explore the influencing factors of per capita CULA and per capita COLA in Yunnan from 2000 to 2020.

3.5. Research Steps

This paper applies a comprehensive integration of multiple research methods such as remote sensing interpretation and spatial econometric models, and Figure 6 intuitively displays the steps of this study.

4. Results

4.1. Analysis of the Change Characteristics of Cultivated Land and Construction Land in Yunnan Province over the Last 20 Years

This paper uses remote sensing image data from Yunnan for three periods, namely 2000, 2010, and 2020, to interpret LULC types through human–computer interaction; then used ArcGIS to compile the third phase of the province’s LULC map (Figure 7).
This remote sensing image interpretation of Yunnan has a total land area of 38.424 million hectares. Figure 7 shows the LULC changes in Yunnan over three periods. However, due to the wide scope of the province, it is difficult to visually see the changes in CULA and COLA in Figure 7. Table 3 reports the classified land use area (unit: 10,000 hectares) and per capita area (unit: m2/person) of cultivated land and construction land.
Table 3 shows that in 2000, the cultivated area of the province was 5.51 million hectares, or 14.34% of its overall surface area. However, in 2020, the cultivated area of the province decreased to 5.40 million hectares, a net decrease of 115.20 thousand hectares (a net decrease rate of 2.09%), and the percentage of the total land area fell to 14.04%. Within the total CULA, the paddy field area dropped from 1.36 million hectares in 2000 to 1.31 million hectares in 2020, with a net reduction rate of 3.33%. With a net reduction rate of 1.69%, the area of dry land fell from 4.15 million hectares in 2000 to 4.08 million hectares in 2020. Overall, the cultivated land in Yunnan is mainly dry land, and the total CULA has decreased over the past 20 years. In particular, high-quality paddy field loss is occurring at a faster rate than dry land, according to statistics.
Although the total amount of CULA in Yunnan has not decreased significantly over the previous 20 years, due to the relatively significant increase in the population of Yunnan over the past 20 years, the decline in the per capita CULA is significant. As can be seen from Table 3, in 2000, the per capita CULA of the province was 1351.95 m2/person. However, in 2020, the per capita CULA was only 1142.69 m2/person, a decrease of 15.48% compared to 2000. Thus, although the decline in CULA in Yunnan is not significant, with the continuous increase in the total population, the average CULA per person has declined dramatically. This population growth will put additional strain on cultivated land resources, leading to a more noticeable drop in per capita CULA, which could jeopardize food security.
Table 3 demonstrates that in 2000, the total COLA was 667.20 thousand hectares, or 1.74% of the total land area. However, by 2020, the total COLA had nearly doubled, reaching 1.30 million hectares, with a net increase of 0.63 million hectares (a net growth rate of 94.38%), and the percentage of the entire land area increased to 3.38%. Urban construction land, rural settlement area and land for mining and industry increased from 0.55 million hectares before 2000 to 1.09 million hectares by 2020, with a net increase of 99.07%. The extent of other construction land increased from 118.80 thousand hectares in 2000 to 205.20 thousand hectares in 2020, with a net increase of 72.73%. Overall, the construction land in Yunnan Province is mainly composed of urban construction land, rural settlement area, and land for mining and industry; the area has nearly doubled in the previous 20 years.
Not only has the total amount of COLA in Yunnan nearly doubled the last 20 years, the per capita COLA has increased significantly. This is because, although the population of Yunnan Province has significantly increased over the last 20 years, the growth rate of the total amount of COLA has far exceeded the growth rate of the total population, making the per capita COLA increase significant. Table 3 indicates that in 2000, the per capita COLA of the province was 163.68 m2/person. However, in 2020, the per capita COLA increased to 274.66 m2/person, an increase of 67.80% compared to 2000, with a 2.62% average yearly growth.
This shows that although the total CULA has not decreased significantly in the last 20 years, with the ongoing expansion of the population, the per capita CULA has decreased significantly. In addition, the COLA in Yunnan has nearly doubled in the previous 20 years. Although the population is also growing, the per capita COLA has significantly increased over the previous 20 years as a result of the population growth rate being significantly slower than the growth rate of COLA. Although the above analysis clearly summarizes the changes in CULA and COLA in Yunnan Province as a whole, there are also significant spatiotemporal differences and regional characteristics; it is thus essential to further explore the spatiotemporal elements as well as the spatiotemporal differences of the 129 counties in Yunnan Province.

4.2. Analysis of Spatiotemporal Evolution Characteristics of CULA and COLA

4.2.1. Spatiotemporal Evolution of CULA and COLA

In order to facilitate the discussion of the changes in CULA and COLA in the 129 counties in Yunnan Province, this paper presents a spatiotemporal change map of the percentage of CULA and COLA in the total land area of Yunnan Province over the previous 20 years (Figure 8 and Figure 9).
Figure 8 shows that the percentage of CULA in various counties of Yunnan has not significantly changed over the previous 20 years. This is because the decrease in CULA in Yunnan Province has been relatively small over the previous 20 years, and thus, the decrease in CULA in various counties is not significant. This is due to the continuous implementation of the national cultivated land occupation and compensation balance policy, thereby preventing the significant reduction in cultivated land. In most counties in the northwest and south of Yunnan, the share of cultivated land is typically low from the standpoint of geographical distribution. By comparing Figure 5 and Figure 8, it can be clearly seen that areas with a high proportion are mostly areas with superior terrain conditions, as these areas are suitable for cultivation; areas with a low proportion are often areas with poor terrain conditions, as the land suitable for cultivation in these areas is very limited. Furthermore, the percentage of CULA in the main urban area of Kunming with good topographic conditions is also low, due to significant development in Kunming’s central city, increasing the area of construction land (Figure 9).
Figure 9 demonstrates that the percentage of COLA in various counties of Yunnan has undergone obvious changes in the previous 20 years, with an increase in the percentage of land used for development, especially in central Yunnan; this further validates the previous conclusions on the overall situation in Yunnan Province. In the previous 20 years, the COLA in Yunnan has nearly doubled, and the proportion of its area has also increased significantly. Especially in the area of central Yunnan, including Kunming, Qujing, Chuxiong, and other prefectures and cities, due to better economic conditions and superior geographical conditions, urbanization construction has progressed rapidly, leading to a substantial increase in the percentage of construction land area.

4.2.2. Temporal and Spatiotemporal Evolution of per Capita CULA and per Capita COLA

Although the spatiotemporal evolution analysis of the proportion of CULA and COLA can better reveal the changes in the proportion of CULA and COLA in various counties of Yunnan Province in the previous 20 years, due to the large changes in the population across Yunnan, simply analyzing the proportion of CULA and COLA in Yunnan is not sufficient to adequately describe the changing land use characteristics in Yunnan. Therefore, it is essential to study the per capita CULA and per capita COLA by looking at the spatiotemporal changes in 129 counties over the previous 20 years (Figure 10 and Figure 11).
Figure 10 shows that the change range of per capita CULA in Yunnan in the previous 20 years is generally small, and the distribution of per capita CULA in various periods is similar. Overall, the pattern of per capita CULA change is relatively small, with most counties maintaining a stable level. However, some counties in Xishuangbanna, Wenshan, Nujiang, and Diqing have seen a significant decrease in per capita CULA in recent years. Furthermore, the per capita CULA in the southeast, northeast, northwest, and central urban areas of Yunnan Province is relatively low, which might be directly connected with the total amount of CULA and population density. Although the population of Nujiang and other places in the northwest of Yunnan is somewhat sparse, the terrain consists of high mountains and deep valleys, with steep slopes. The land available for cultivation is extremely limited, so the per capita CULA is generally small; due to the high population density in Zhaotong and other places in northeast Yunnan, the per capita CULA is also small. The southeast of Yunnan belongs to the karst landform area, and the rocky desertification in some counties is significant, resulting in a relatively limited per capita cultivated area. Due to the high population density and high urbanization rate near the main urban area of Kunming, its cultivated land resources are limited, and the average cultivated area per person is small.
As can be seen from Figure 11, the per capita COLA in the province has changed significantly in the previous 20 years, which is also consistent with previous analysis. In 2000, the per capita COLA in most counties was relatively low, with the per capita COLA maintained within 200 m2/person in most counties; only the main urban area of Kunming and a few counties in the northwest and west of Yunnan had higher levels. This is because high levels of urbanization can be found in Kunming’s main urban region, which boasts a relatively developed economy and a large amount of construction land. In the northwest and some minority counties in the west, the population is sparse; thus, the per capita COLA in these areas is generally high. However, in the past 20 years, more and more counties have experienced an “explosive” increase in construction land. By 2020, the per capita COLA in most counties exceeded 250 m2/person. The rapid expansion of construction land is clear. Although the total population of Yunnan Province is also increasing, it lags behind the rate at which construction land is expanding, resulting in an explosive growth trend in the per capita COLA.

4.3. Spatial Autocorrelation Analysis and Model Selection

From the above analysis, it can be preliminarily found that the per capita CULA and per capita COLA have certain spatial agglomeration characteristics, which are generally higher in some regions and lower in others. However, the above analysis is only a preliminary result. In order to better use statistical data to illustrate the spatial agglomeration characteristics, this study calculates the Moran’s I of the per capita CULA and per capita COLA in Yunnan Province over the three periods. Table 4 reports the results of Moran’s I and Z statistics of the per capita CULA and per capita COLA of 129 counties in Yunnan.
As can be seen from Table 4, regardless of whether they were logarithmic or not, and regardless of the period, the Moran’s I of the per capita CULA and per capita COLA in Yunnan passed the 1% threshold for significance, indicating that there is a very significant spatial agglomeration characteristic of the per capita CULA and per capita COLA. Therefore, it is necessary to study the influencing factors in per capita CULA and per capita COLA using spatial econometric models.
The above results explore the spatial agglomeration characteristics of dependent variables from the perspective of statistical data; however, when constructing models to explore influencing factors, the addition of other independent variables may affect the degree of spatial autocorrelation. In other words, if the dependent variable has the characteristics of spatial agglomeration, and other independent variables may also have similar characteristics, the spatial autocorrelation problem may be “increased” or “offset” after building the model. However, if the model does not have the spatial autocorrelation, the use of spatial econometric models becomes redundant. If the model has spatial autocorrelation, there is the question of which spatial econometric model should be selected. To address these issues, it is essential to utilize OLS to estimate parameters and test the spatial autocorrelation of spatial error terms and spatial lag terms (Table 5). Due to the multicollinearity problem, this paper excludes two independent variables, namely development status of the tertiary industry (X3) and fixed assets investment (X6).
Regardless of whether the per capita CULA or the per capita COLA is used as the dependent variable, the Robust Lagrange Multiplier estimation results for the spatial error term after retaining all independent variables and excluding the collinear independent variables passed the 1% level-of-significance test. However, the Robust Lagrange Multiplier estimation results of the spatial lag term failed to pass the 10% level-of-significance test, indicating that both types of models have autocorrelation of spatial error terms; since there is no autocorrelation of spatial lag terms, it is sufficient to use a spatial error model to better control the autocorrelation of spatial error terms. However, the above discussion is only a preliminary determination of the optimal model. When actually selecting a model, further judgment needs to be made based on spatial parameters. It is also necessary to select fixed or random effects and individual or time effects according to tests.

4.4. Analysis of the Influencing Factors in per Capita CULA

According to the above analysis, although the total CULA in Yunnan has decreased slightly, in the previous 20 years, the amount of cultivated land per person has significantly decreased due to the ongoing growth in population, and the data have the characteristics of spatial agglomeration. Consequently, further investigation is required for the factors that affect the per capita area of cultivated land using spatial econometric models. Although previous tests have shown that, when using the per capita CULA as the dependent variable, it is appropriate to select the SEM as the optimal spatial econometric model for analysis, this article lists the estimation results obtained using various models; the reason for this is to facilitate the comparison of the differences between different estimation methods and further explore the robustness of the models. Based on this, this study chooses SEM as the optimal model and further determines the robustness of the model by comparing the estimated results of other spatial econometric models. It was determined that each model should choose fixed or random effects according to the Hausman test; the LR test was then used to determine whether or not to control individual effects and temporal effects. Table 6 reports the estimation and test results using traditional panel models and various spatial econometric models.
As shown in Table 6, when the spatial error model is used as the optimal model, the estimate coefficients of development status of the primary industry (X1), per capita income level of rural residents (X8), per capita grain output (X10), population urbanization level (X11), population density (X12), terrain degree of excellence (X15), and climate degree of excellence (X16) are relatively significant. This article will further explore the impact of these factors on the per capita CULA.
(1)
Development status of the primary industry (X1). The coefficient estimation of the development status of the primary industry with SEM as the optimal model is 0.0855, passing the test for 1% significance. The model indicates that when considering the spatial autocorrelation, with other factors remaining unchanged, the proportion of primary industry production value to the total number of rural residents who are registered grows by 1%, and the average per capita cultivated land area increases by 0.0855%. The estimated results of other spatial econometric models such as SARAR, SAR, and SDM are similar, with estimated values of 0.0960, 0.1101, and 0.0573, respectively. The estimated results are all positive and successfully pass the 1%, 1%, and 10% significance level tests, respectively, further indicating that the model is robust and that the development of the primary industry can significantly promote the increase in per capita CULA. Agriculture is a significant part of the development of the main industry, even though other sectors such as animal husbandry and fishing are also involved. The rapid growth of the primary industry means that the degree of agricultural development in a region has significantly improved, and the development of agriculture needs to be supported to a certain extent by reserve land resources such as farmland on a larger scale. With the further development of rural industries such as agriculture, the scale and output of grain cultivation will also be further increased, and the dependence on cultivated land will significantly increase. Therefore, the development of the primary industry can, in a certain sense, affect the planning and layout of reserve land resources such as cultivated land and can promote the growth of per capita CULA.
(2)
Per capita income level of rural residents (X8). The calculated coefficient of the per capita income level of rural people using SEM as the best model is −0.1333, passing the 1% significance level test. This means that, taking into account spatial autocorrelation and with other factors unchanged, when the per capita disposable income of rural residents increases by 1%, the per capita CULA decreases by 0.1333% on average. The estimated results of other spatial econometric models such as SARAR, SAR, and SDM are similar, with estimated values of −0.1193, −0.1650, and −0.0999, respectively. The estimated results are all negative, and they have passed the 1%, 1%, and 5% significance level tests, respectively, emphasizing further that the model is robust and that the increase in the per capita income level of rural residents has led to a significant decrease in the per capita CULA. Rural residents usually receive a large proportion of their income from migrant work and production and operating income. Due to the generally low food prices in China and the significantly higher prices of some crops with a high value added, including fruits and vegetables, as well as livestock breeding, the huge price gap has led to cultivated land being converted to cash crops or even ponds for fish cultivation, leading to the “non-grain” problem of cultivated land and further reducing CULA. In addition, as the number of rural residents working has increased and their income level has increased significantly, more and more cultivated land is being abandoned or contracted for other purposes, further reducing the area of per capita cultivated land. It can be seen that the increase in rural residents’ income is also a double-edged sword, which may pose a threat to national food security and the protection of cultivated land.
(3)
Per capita grain output (X10). Using SEM as the optimal model, the estimated coefficient of per capita grain yield is 0.0006, passing the 1% significance level test. This means that when considering spatial autocorrelation and with other factors remaining unchanged, each increase in per capita grain yield by 1 kg/person will result in an average increase of 0.06% in per capita CULA. The estimation results of other spatial econometric models, such as SARAR, SAR, and SDM, are similar, with the estimated values of 0.0005, 0.0005, and 0.0004, respectively. The predicted outcomes are all positive and all pass the 1% significance level test, further indicating that the model is robust and that the increase in per capita food production can significantly promote the increase in per capita cultivated land area. Grain production is inextricably linked to CULA. Grain production requires a large amount of cultivated land as a basic resource. Only high-quality and large-scale cultivated land can produce more food crops. With the increase in grain production, the dependence on cultivated land becomes more apparent.
(4)
Population urbanization level (X11). The coefficient estimation result for the population urbanization level using SEM as the optimal model is −0.0116, passing the test for 1% significance. This means that when considering spatial autocorrelation and with other factors remaining unchanged, the rate of population urbanization increases by 1%, and the average per capita CULA decreases by 0.0116%. The estimation results of other spatial econometric models, such as SARAR, SAR, and SDM, are similar, with estimated values of −0.0119, −0.0118, and −0.0106, respectively. The estimated results are all negative and pass the test for 1% significance, further indicating that the model is robust and that the increase in population urbanization rate has led to a significant decrease in the per capita CULA. The level of urbanization has multiple dimensions, including economy and population. This study uses the degree of urbanization of the population as determined by the ratio of the urban population to the overall population. As industrialization and urbanization continue to advance, the proportion of people living in cities will continue to rise, while that of people living in rural areas will continue to decline. Growing food on cultivated land requires a robust rural population. The decrease in the percentage of rural residents will potentially lead to a reduction in the area under cultivation, and cultivated land may be increasingly abandoned.
(5)
Population density (X12). The coefficient estimation result for population density using SEM as the optimal model is −0.0009, passing the 1% significance level test. This means that when considering spatial autocorrelation and with other factors remaining unchanged, an increase in the population urbanization rate by 1 person/km2 will lead to a decrease in the average per capita CULA of 0.09%. The estimation results of other spatial econometric models, such as SARAR, SAR, and SDM, are similar, with estimated values of −0.0009, −0.0008, and −0.0008, respectively. The predicted outcomes are all negative and pass the 1% significance level test, further indicating that the model is robust and that the increase in population density has led to a significant decrease in the per capita CULA. Based on the premise that the total amount of cultivated land remains unchanged, there is an inverse proportional relationship between population density and per capita CULA. The greater the population, the fewer resources per capita there will be. More importantly, spatial evolution analysis shows that the total area of cultivated land in Yunnan Province has decreased in the past 20 years. Although the decline is not significant, with the increase in population, the per capita CULA has decreased significantly; thus, the per capita CULA will decline as population density rises.
(6)
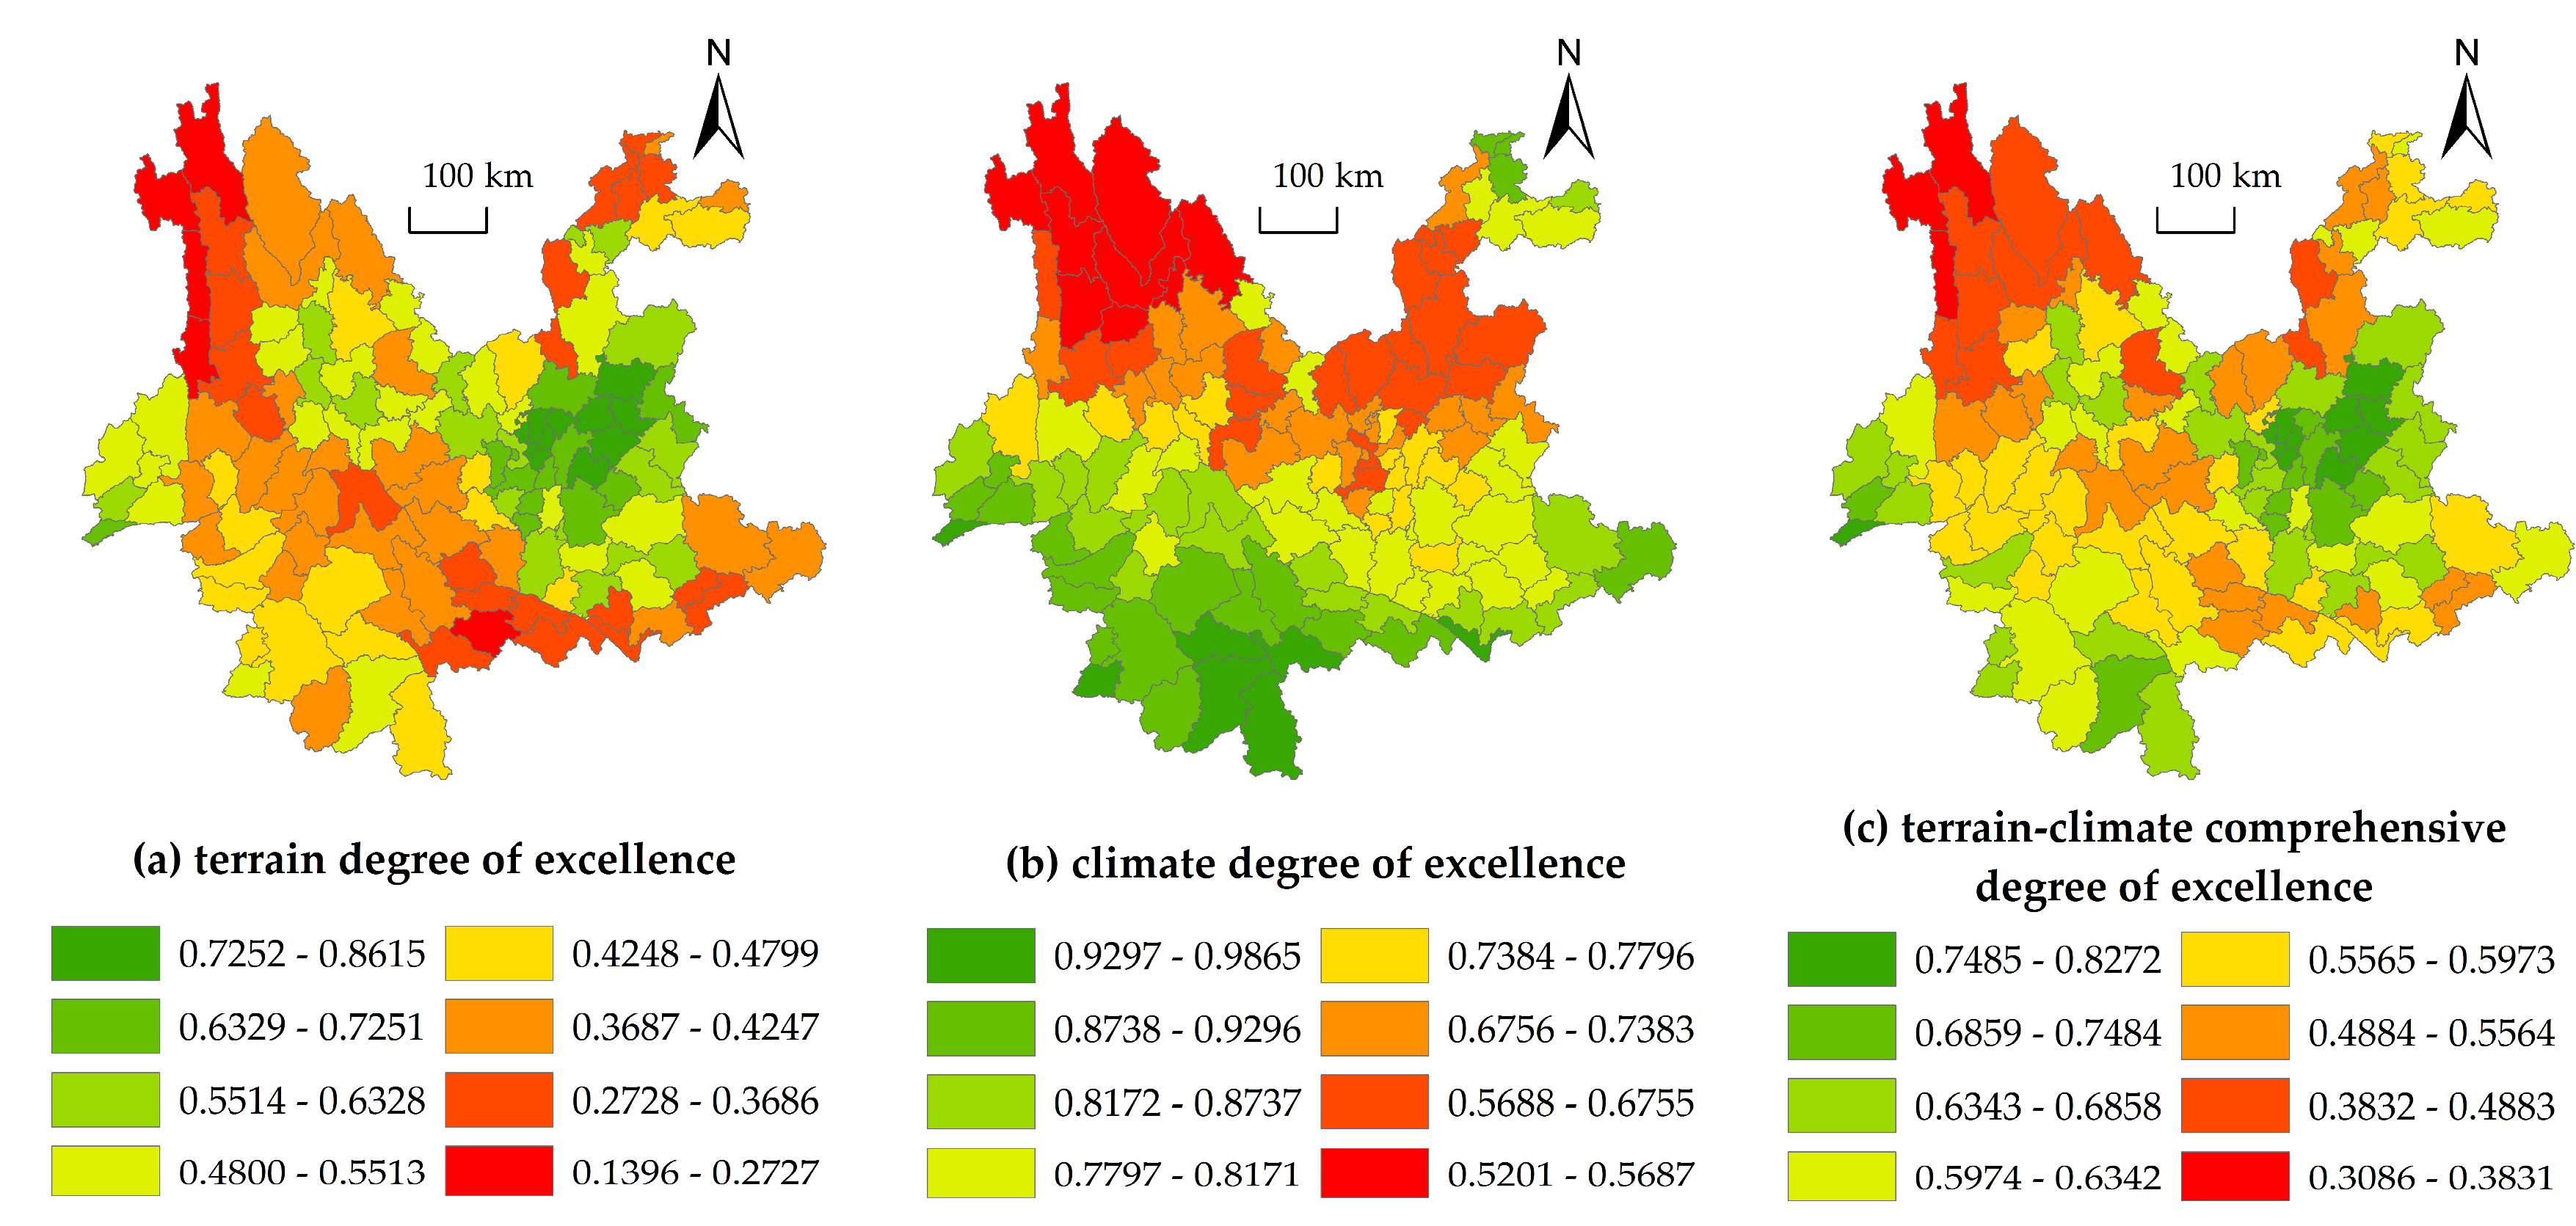
Terrain degree of excellence (X15) and climate degree of excellence (X16). The coefficient estimation results of terrain degree of excellence and climate degree of excellence using SEM as the optimal model are 0.5927 and 1.0071, respectively, and have passed the 5% and 1% significance level tests, respectively. This means that when considering spatial autocorrelation and with other factors remaining unchanged, each 0.01 unit increase in terrain degree of excellence or climate degree of excellence will result in an increase in the average per capita CULA by 0.5927% and 1.0071%, respectively. The above results indicate that terrain and climate are the key factors affecting the per capita CULA. The better the terrain and climate, the larger the per capita CULA. This conclusion is also consistent with previous analysis (Figure 5 and Figure 10). We chose the random effect model in this study because the Hausman data failed the 10% significance level test. However, if these two variables are eliminated, the Hausman statistics are significant. As the terrain and climate degrees of excellence are constant values that do not evolve with time in each county, the above results further illustrate that adding these two variables can largely explain the differential effects from individual differences. Therefore, the terrain and climate degrees of excellence are key factors affecting the per capita CULA. Yunnan has a large mountainous area. However, cultivated land is mostly distributed in areas with gentle terrain and good climatic conditions. Therefore, areas with good terrain and climatic conditions also have relatively large per capita CULA. Although the two indicators of terrain and climate do not change over time, they can largely explain the individual differences in the per capita CULA from different regions.

4.5. Analysis of the Influencing Factors in per Capita COLA

As indicated by the above analysis, the per capita COLA in Yunnan has expanded rapidly in the last 20 years, and the data have the characteristics of spatial agglomeration. Hence, it is important to further explore the influencing factors in the per capita COLA using spatial econometric models. Although previous studies have shown that when using the per capita COLA as the dependent variable, it is appropriate to select the SEM as the optimal spatial econometric model for analysis, this article lists the estimation results obtained using various models. This facilitates comparison of the differences between various estimation approaches, thereby further exploring the robustness of the model. Each model should utilize fixed or random effects, based on the Hausman test; the LR test should then be used to determine whether to control individual effects and time effects. Table 7 reports the estimation and test results using traditional panel models and various spatial econometric models.
As demonstrated by Table 7, when using the spatial error model as the optimal model, the estimated coefficients of light brightness in the nighttime (X5), per capita public financial expenditure (X7), per capita grain output (X10), population urbanization level (X11), and population density (X12) are relatively significant. This article will further analyze the impact of these factors on per capita CULA.
(1)
Light brightness in the nighttime (X5). The coefficient estimation result for light brightness in the nighttime using SEM as the optimal model is 0.0601, passing the test for 1% significance. This means that when considering spatial autocorrelation and with other factors remaining the same, every 1% increase in light brightness in the nighttime will result in an average increase of 0.0601% in per capita COLA. The estimated results of other spatial econometric models, such as SARAR, SAR, and SDM, are similar, with estimated values of 0.0608, 0.0622, and 0.0338, respectively. The estimated results are all positive, and they pass the 1%, 1%, and 5% significance level tests, respectively, further indicating that the model is robust and that the growth in light brightness in the nighttime can significantly promote an increase in the per capita COLA. Light brightness in the nighttime has a close relationship with the economic growth of a region. According to a study by Henderson et al. (2012), when the light brightness in the nighttime of a region increases by 1%, its GDP increases by approximately 0.3% [50]. Xu Kangning et al. (2015) found that simple GDP statistical variables may have a certain “virtual height”, while nighttime lighting is more authentic [51]. Due to the concrete nature of the variable of nighttime lighting, it can be used as a good alternative variable to GDP. With the continuous growth of a region’s economy, its urbanization construction will also be accelerated; the land currently designated for construction will be unable to meet the development needs of a region or a city. The increase in construction land is an unavoidable trend in economic growth. According to model estimation results, enhanced nighttime lighting is significantly associated with an increase in the per capita COLA.
(2)
Per capita public financial expenditure (X7). Using SEM as the optimal model, the estimated coefficient of per capita public finance expenditure is 0.0874, passing the test for 1% significance. This means that when considering spatiotemporal autocorrelation and with other factors remaining unchanged, when per capita public finance expenditure increases by 1%, the average per capita construction land area increases by 0.0874%. The estimation results of other spatial econometric models, such as SARAR, SAR, and SDM, are similar, with estimated values of 0.0746, 0.0418, and 0.0260, respectively. The estimation results are all positive, and the SARAR and SAR models pass the 5% and 10% significance level tests, respectively, further indicating that the model is robust and that the rise in per capita public finance spending is significantly associated with the rise in per capita COLA. In recent years, although an increasing proportion of public funds are used for poverty alleviation and rural construction [52], it is undeniable that a significant amount of public expenditure is also used for various aspects of construction investment, including that devoted to urban infrastructure. As per capita public financial expenditure increases, its investment in infrastructure construction, urbanization construction, and economic development also gradually increases, which means that more public financial investment will be used for the continuous enlargement of construction land, resulting in a continuous increase in per capita COLA.
(3)
Per capita grain output (X10). Using SEM as the optimal model, the estimated coefficient of per capita grain yield is 0.0006, passing the test for 1% significance. This means that when considering spatial autocorrelation and with other factors remaining unchanged, each increase in per capita grain yield of 1 kg/person will result in an average increase of 0.06% in per capita COLA. The estimation results of other spatial econometric models, such as SARAR, SAR, and SDM, are similar, with estimated values of 0.0006, 0.0005, and 0.0006, respectively. The estimated results are all positive and pass the test for 1% significance, further indicating that the model is robust and that the increased food output per person has a substantial positive impact on increased per capita COLA. Previous results indicate that there is a clear correlation between the increase in per capita grain production and the increase in per capita CULA, because the production of grain requires a large amount of cultivated land as a basic resource. However, the terrain and climatic conditions in areas with high per capita grain production are generally better, but this high-quality farmland can also be considered as flat land suitable for urban construction. Therefore, high-quality terrain and climatic conditions may indirectly cause the enlargement of construction land.
(4)
Population urbanization level (X11). The coefficient estimation result for the population urbanization level using SEM as the optimal model is −0.0102, passing the test for 1% significance. This means that when considering spatial autocorrelation and with other factors remaining unchanged, the average per capita construction land area decreases by 0.0102% for each 1% increase in the population urbanization rate. The estimated outcomes of other spatial econometric models, such as SARAR, SAR, and SDM, are similar, with estimated values of −0.0106, −0.0119, and −0.0107, respectively. The estimated results are all negative and pass the test for 1% significance, further indicating that the model is robust and that the increase in population urbanization rate has led to a significant decrease in the per capita COLA. The urbanization rate has various manifestations. This study uses the ratio of urban population to the overall population to characterize the urbanization level of the population. The reason why the population urbanization rate is inversely correlated with the per capita COLA is that the existing rural residential land accounts for a significant percentage of construction land. The higher the rural population, the more rural residential land there is, whose utilization efficiency is far lower than that of urban construction land. Although the advancement of urbanization will to some extent lead to the expansion of urban “pie spreading”, such per capita growth is smaller compared to the expansion of rural residential land. Compared to rural residential land expansion, a higher urban population results in the effective utilization of construction land and reduces the per capita COLA, Therefore, there is a significant correlation between an increased population urbanization rate and the reduction in per capita CULA.
(5)
Population density (X12). The coefficient estimation result for population density using SEM as the optimal model is −0.0004, passing the test for 1% significance. This means that when considering spatial autocorrelation and with other factors remaining unchanged, each increase in population density by 1 person/km2 will lead to an average decrease of 0.04% in per capita construction land. The estimated results of other spatial econometric models, such as SARAR, SAR, and SDM, are similar, with estimated values of −0.0004, −0.0003, and −0.0005, respectively. The estimated results are all negative and pass the test for 1% significance, further indicating that the model is robust and that the rise in habitational density has led to a significant decrease in the per capita COLA. Previous research has shown that in the last 20 years, the total population of Yunnan has experienced growth; however, the rate of increase in construction land area is far higher than the rate of population growth, resulting in a significant increase in the per capita COLA. Although, on the surface, the growth of population and the increase in the per capita COLA have a synchronous trend, there are many factors that affect the per capita COLA. An important advantage of econometric models is that they scientifically “decompose” these impacts and changes, so as to accurately determine true effects of each factor. Population and per capita COLA do not necessarily have a positive correlation, and model estimates indicate that increased density of the population will reduce per capita COLA. The reason for such a result can be explained from the perspective of population migration. In the last 20 years, more and more rural Chinese people have migrated to cities and central areas with rapid economic development, resulting in a significant increase in the area of urban construction land in these areas. Compared to the inefficient nature of rural residential land, the utilization efficiency of urban construction land is higher. For example, the main urban area of Kunming has experienced rapid population growth, becoming a megacity in the past 20 years, with a significant portion of the population migrating from other prefectures. Still, the per capita expansion rate of urban construction land remains limited. However, with the migration of more rural residents to cities, this inefficiently used rural residential land remains, with some areas even becoming “hollow villages”, resulting in extremely low levels of land use efficiency. As the population moves out, the population density gradually decreases, but the total area of construction land does not shrink considerably or even increase, resulting in a gradual increase in per capita construction land.

5. Discussion

In terms of the spatiotemporal evolution analysis of CULA and COLA, the change in population is an important factor; even if the change in CULA is small, a vital increase in population will lead to a decrease in per capita occupancy. Thus, it is particularly important to study the spatiotemporal evolution and influencing factors in per capita CULA and per capita COLA. Remote sensing and geographic information systems have developed quickly, and thus, it is feasible to use multi-period remote sensing image interpretation to obtain CULA and COLA. This method ensures consistency, as multi-period remote sensing images are based on the actual situation of land cover as the basis for interpretation. To this end, this article collected remote sensing images of Yunnan in 2000, 2010, and 2020 and used scientific methods to understand and translate them. Data were obtained for per capita CULA and per capita COLA and their changes in 129 counties in Yunnan in the last 20 years, contributing to the scientific analysis of the spatiotemporal evolution of the per capita CULA and per capita COLA and the underlying factors.
However, the actual data on cultivated land and construction land obtained from remote sensing image interpretation are not optimistic. The research results show that in 2000, the total CULA in the province was 5.5108 million hectares, but in 2020, the total CULA decreased to 5.3956 million hectares, a net decrease of 115.2 thousand hectares (with a net reduction rate of 2.09%). In 2000, the per capita CULA in the province was 1351.95 m2/person. However, by 2020, the per capita CULA in the province had decreased to 1142.69 m2/person, with a decrease of 15.48% compared to 2000. In addition, high-quality cultivated land such as paddy fields accounted for a large proportion of the reduced cultivated land. According to remote sensing interpretation results, the area of paddy fields in 2000 was 1.3591 million hectares, but it decreased to 1.3139 million hectares in 2020. The net reduction rate of paddy fields over the past 20 years was 3.33%, significantly exceeding the net reduction rate of dry land (1.69%). The significant reduction in per capita CULA is only one aspect, and what is even more worrying is the significant expansion of construction land. In 2000, the COLA of the province was 0.6672 million hectares, but in 2020, the COLA of the province almost doubled to 1.2969 million hectares, a net increase of 0.6297 million hectares (with a net increase rate of 94.38%). Although the total population of Yunnan Province has also been growing rapidly during the past 20 years, the growth rate of the population is far behind the expansion rate of construction land. The results of remote sensing interpretation show that the per capita COLA in the province reached 163.68 m2/person in 2000. However, by 2020, the per capita COLA in the province further increased to 274.66 m2/person, with an increase of 67.80% compared to 2000 and an average annual growth of 2.62%. This study finds that the total and per capita CULA in Yunnan Province have significantly decreased during the past 20 years, posing a threat to the country’s food security to a certain extent. At the same time, the total amount and the per capita COLA have significantly increased, leading to the phenomenon of blind expansion and rough utilization of construction land. This result has both similarities with and differences from research results worldwide.
The similarity lies mainly in the fact that with the advancement of urbanization and industrialization, urban expansion and industrial development require a certain amount of cultivated land, which means that the development of urbanization and industrialization is one of the reasons for the reduction in cultivated land. That is to say, during a certain period and under certain circumstances, the changes in cultivated land and construction land may exhibit a phenomenon of “one falls and another rises” (i.e., a decrease in CULA and an increase in COLA).
The differences are mainly due to the different national conditions of each country, and the degree of impact of urbanization and industrialization on the same changes is not consistent. According to Wang Chengjun et al. [3] (2012) and Wang Chengjun et al. [9] (2013), using econometric methods to empirically analyze data from 42 countries or regions over a period of 27 years (i.e., 1982~2009), the development of industrialization and urbanization will lead to a decrease in CULA, but its impact on cultivated land reduction is limited. In other words, this is not the main reason for cultivated land reduction. Out of the contribution of fluctuations to cultivated land changes, the total contribution of urbanization and industrialization does not exceed 40%. Agricultural policies and the behavioral habits of decision makers in the use of cultivated land have played an important role in reducing the CULA. The characteristics of land resource endowment, industrialization and urbanization models, infrastructure conditions, and other national factors have a significant impact on the changes in cultivated land. Huang Daquan et al.’s [18] empirical analysis of Taiwan, China, Japan, North America, and Western Europe shows that there is no contradiction between urban expansion and maintaining a relatively stable CULA. The key is to choose an appropriate urban development path and land use mode, with relevant policies as the guarantee.
Compared with international research results, Yunnan can learn many lessons about controlling the reduction in cultivated land and the rapid expansion of construction land. The most important thing is to choose suitable urban and industrial development paths and adopt effective intensive land utilization methods.

6. Conclusions, Policy Recommendations, and Research Prospects

6.1. Main Conclusions of the Study

(1)
Using remote sensing interpretation methods, it was found that over the past 20 years, the total and per capita CULA in Yunnan Province have significantly decreased. The total CULA has decreased from 5.5108 million hectares in 2000 to 5.3956 million hectares in 2020, with a net reduction rate of 2.09%. The per capita CULA decreased from 1351.95 m2/person in 2000 to 1142.69 m2/person in 2020, with a net decrease rate of 15.48%. At the same time, the total and per capita COLA have both significantly increased, with the total amount changing from 0.6672 million hectares in 2000 to 1.2969 million hectares in 2020, with a net increase rate of 94.38%. The per capita COLA increased from 163.68 m2/person in 2000 to 274.66 m2/person in 2020, with a net increase rate of 67.80%.
(2)
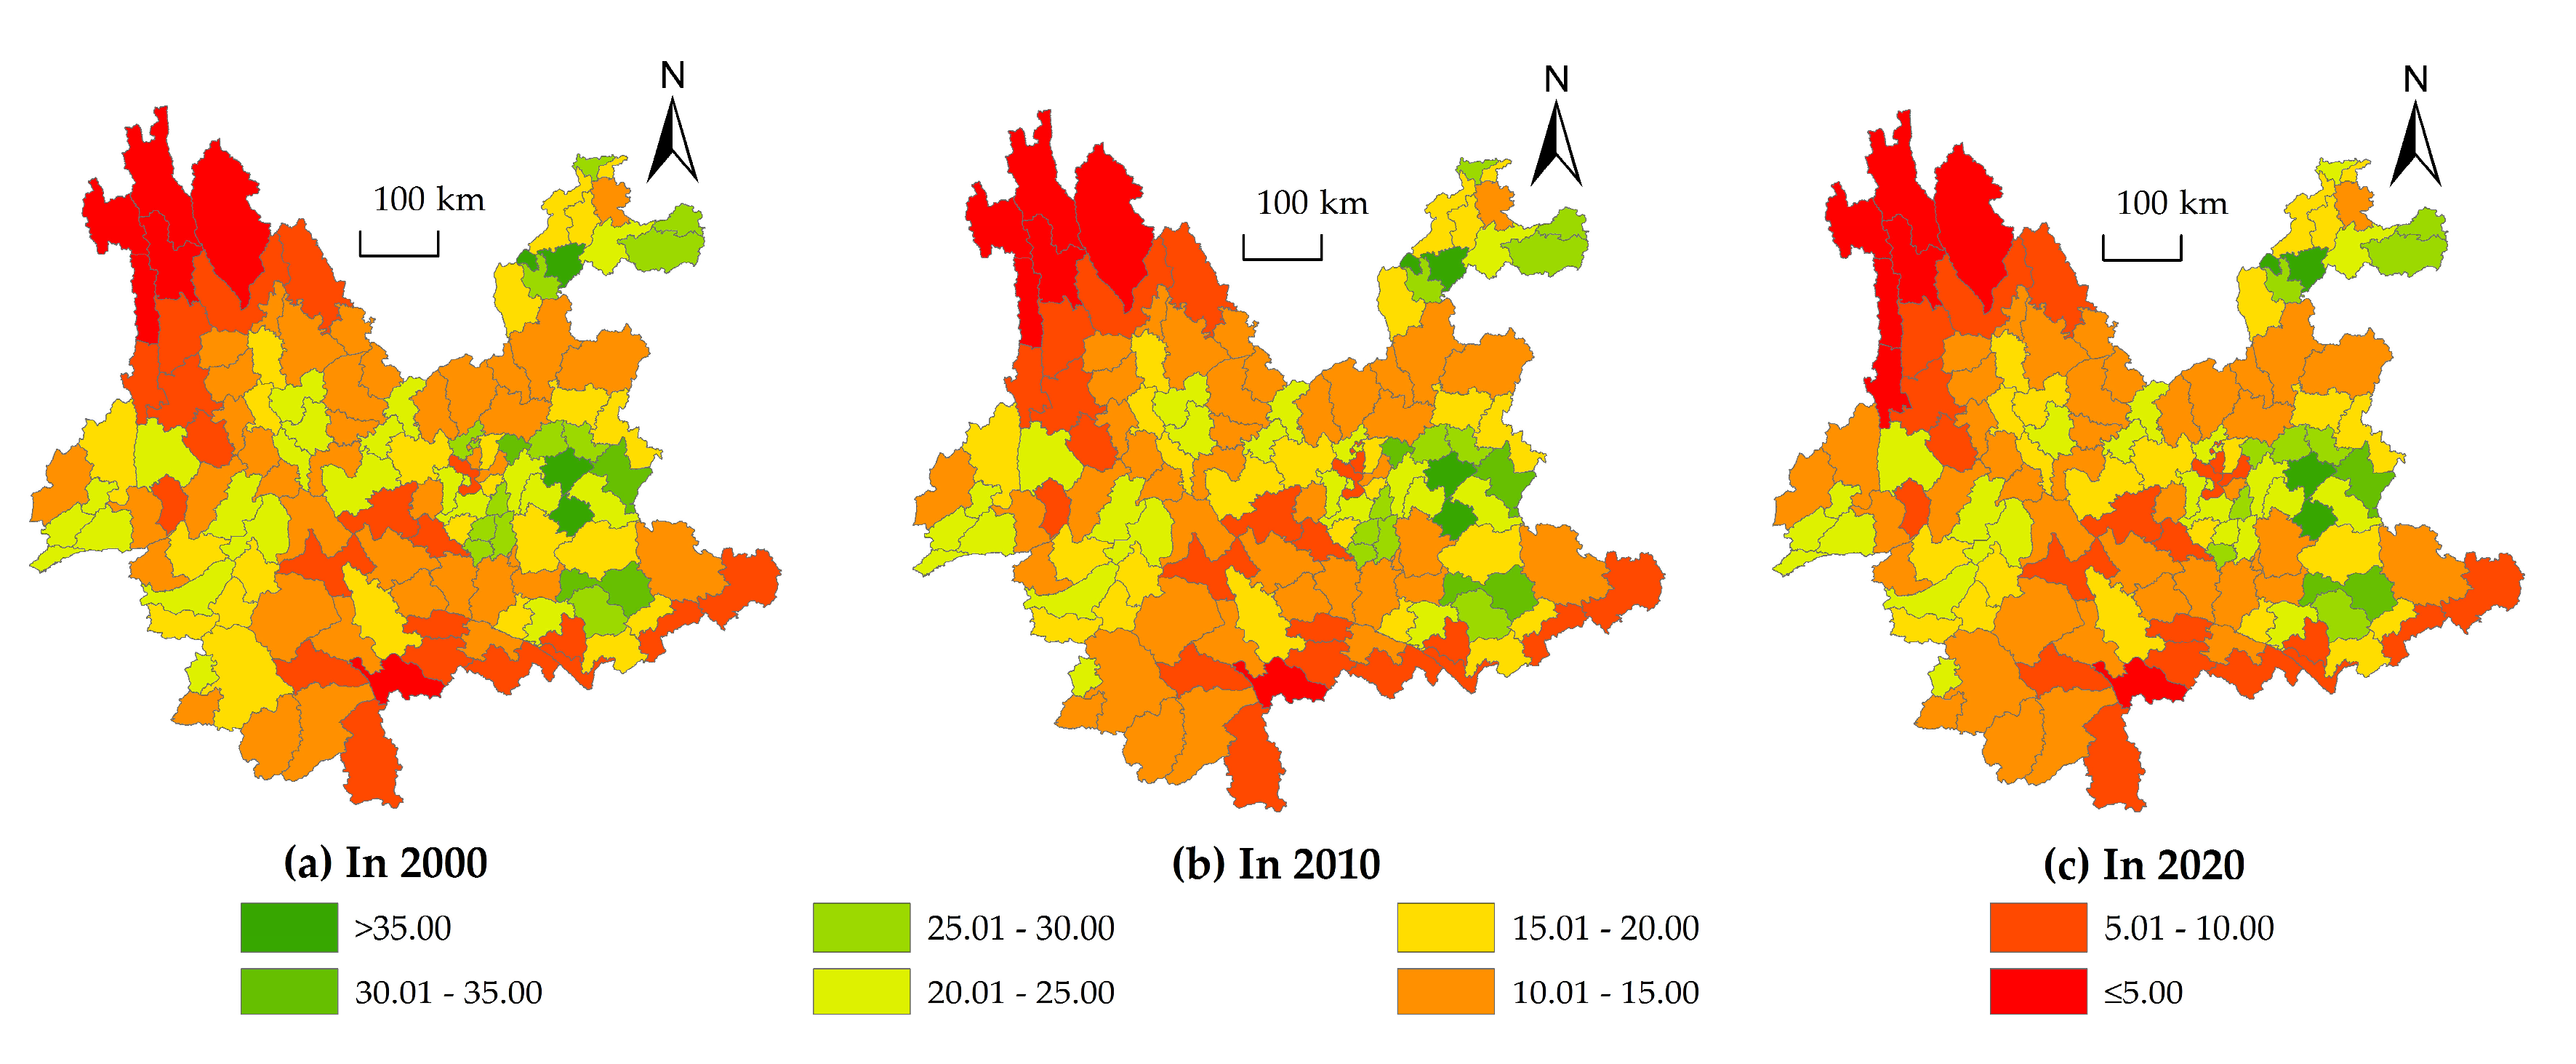
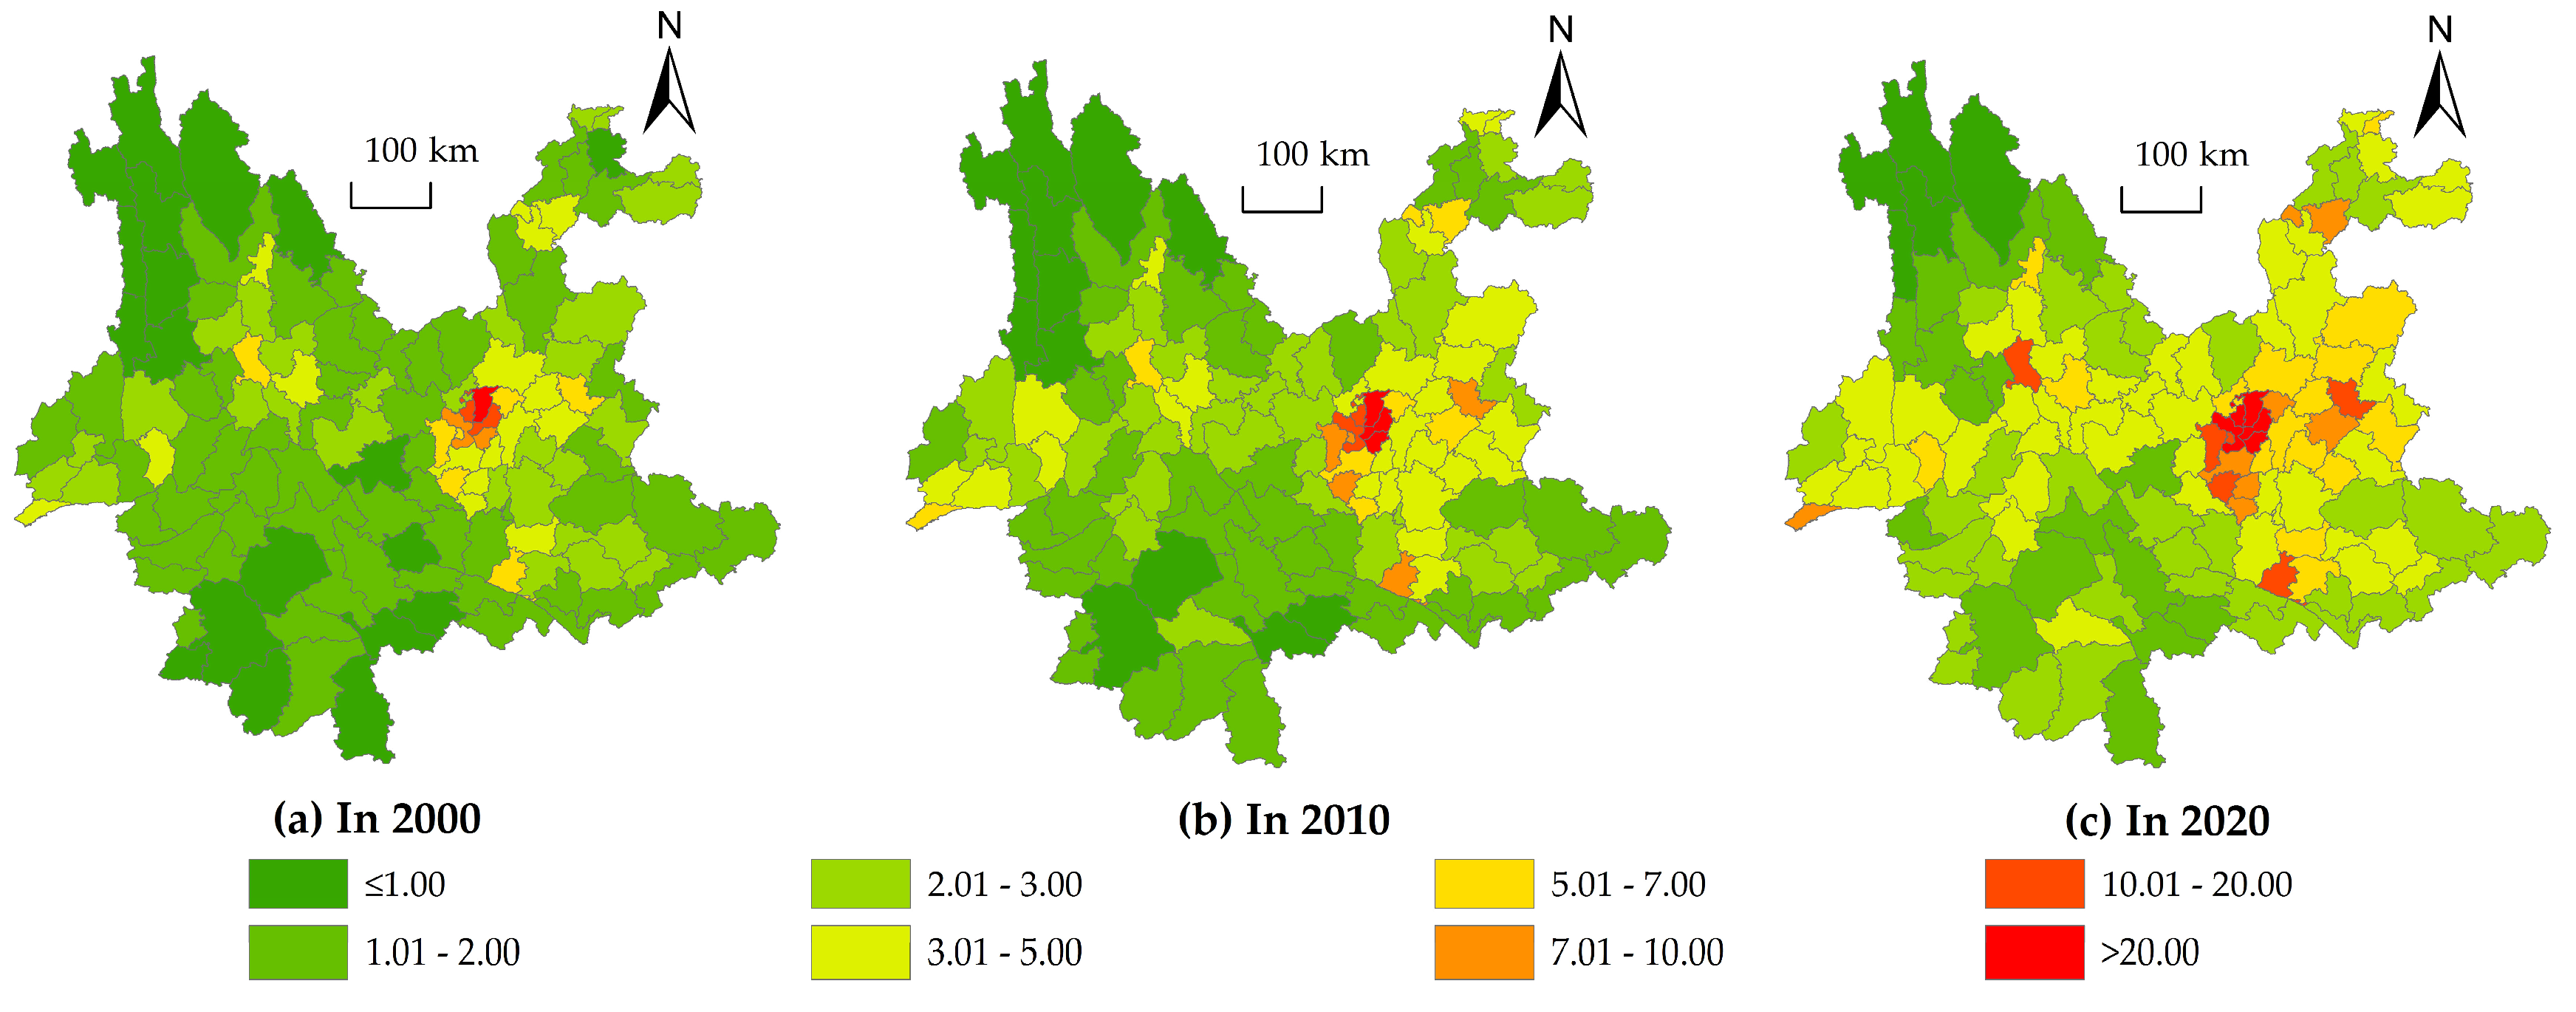
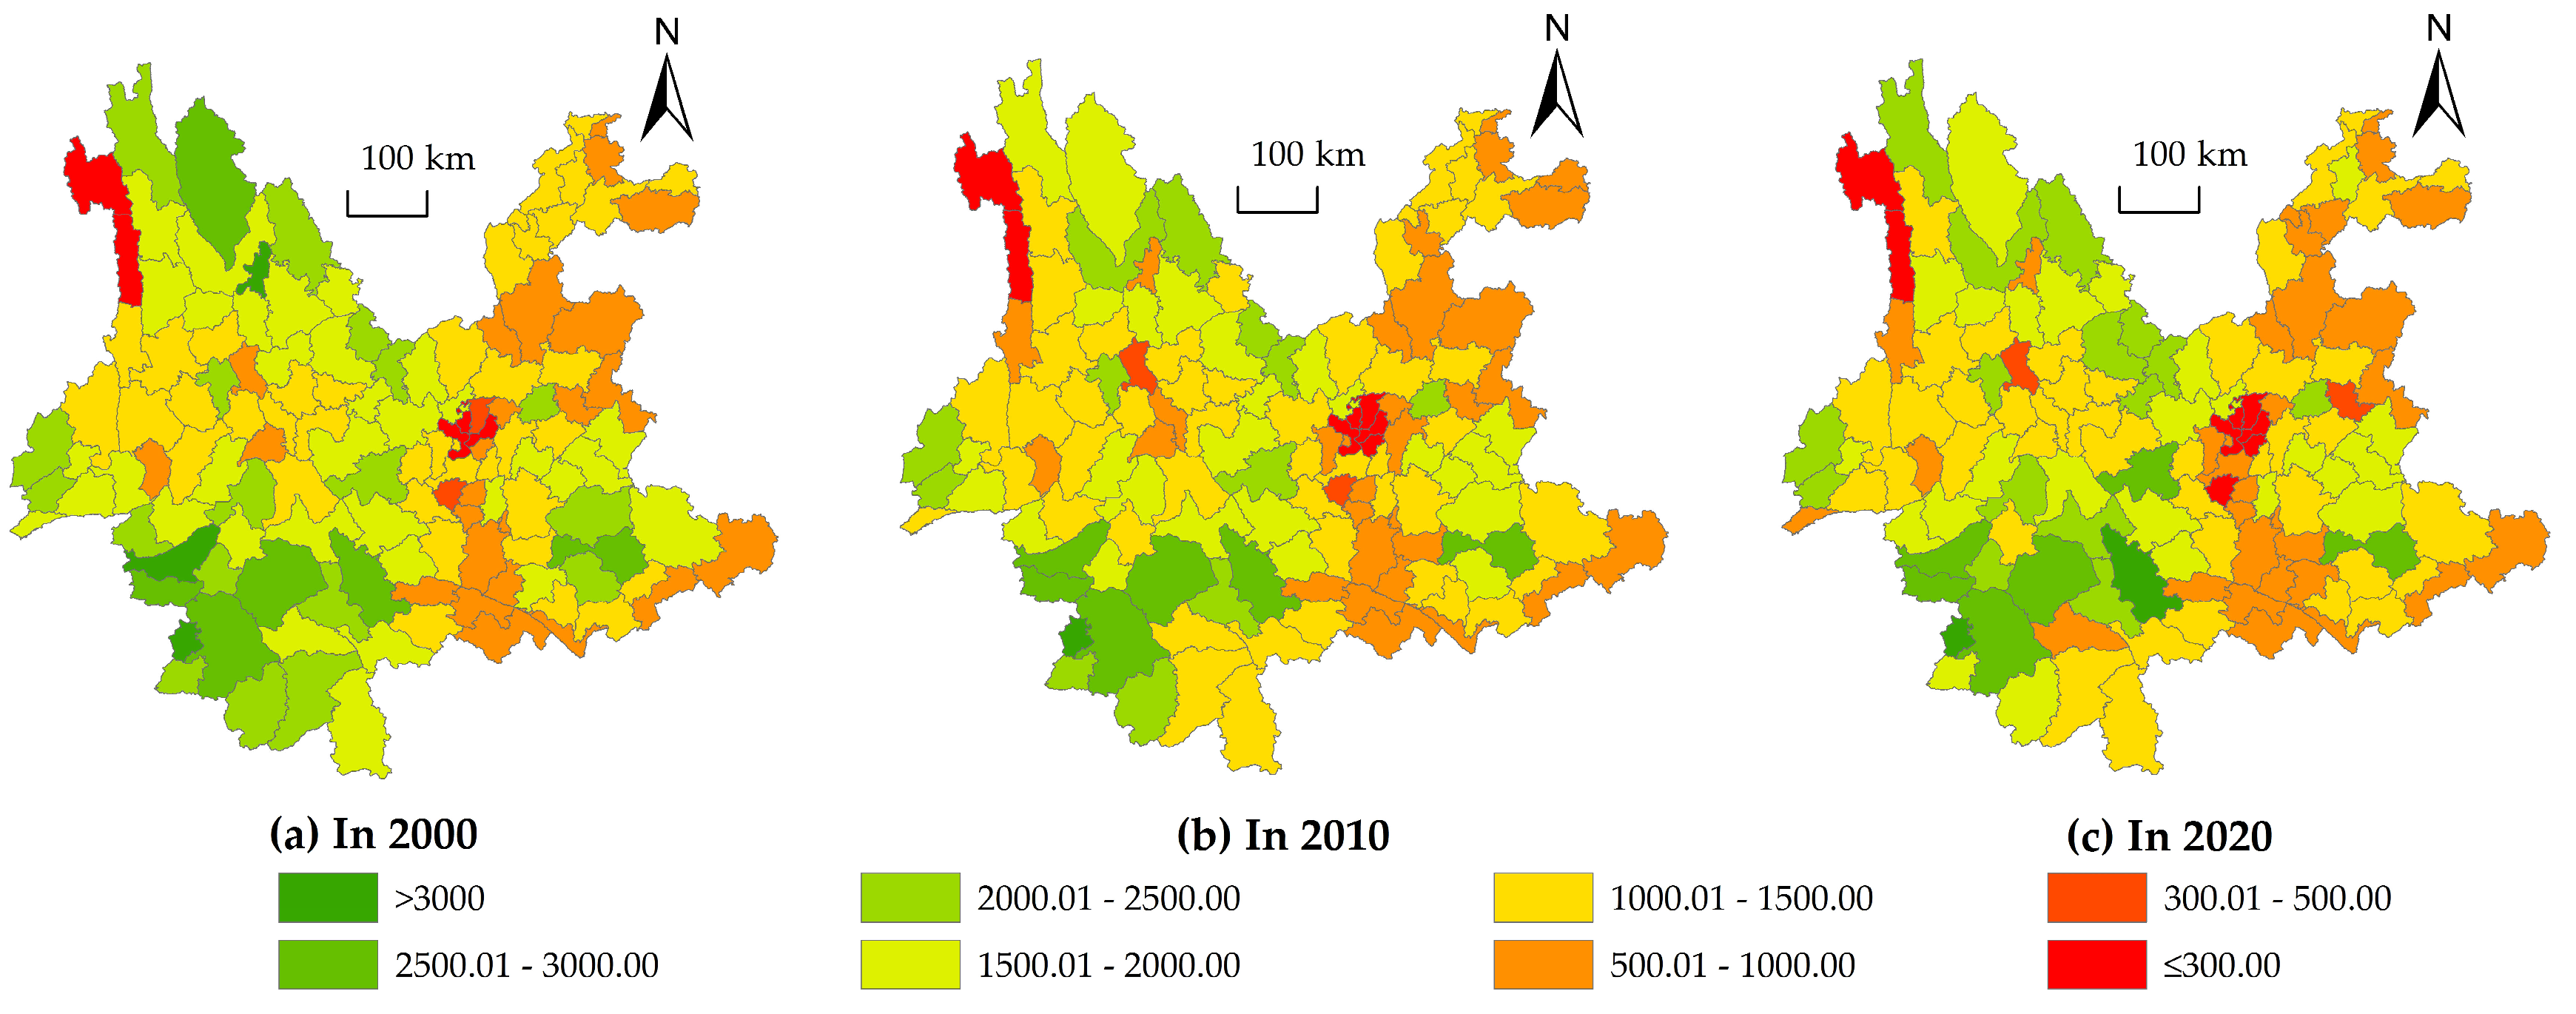
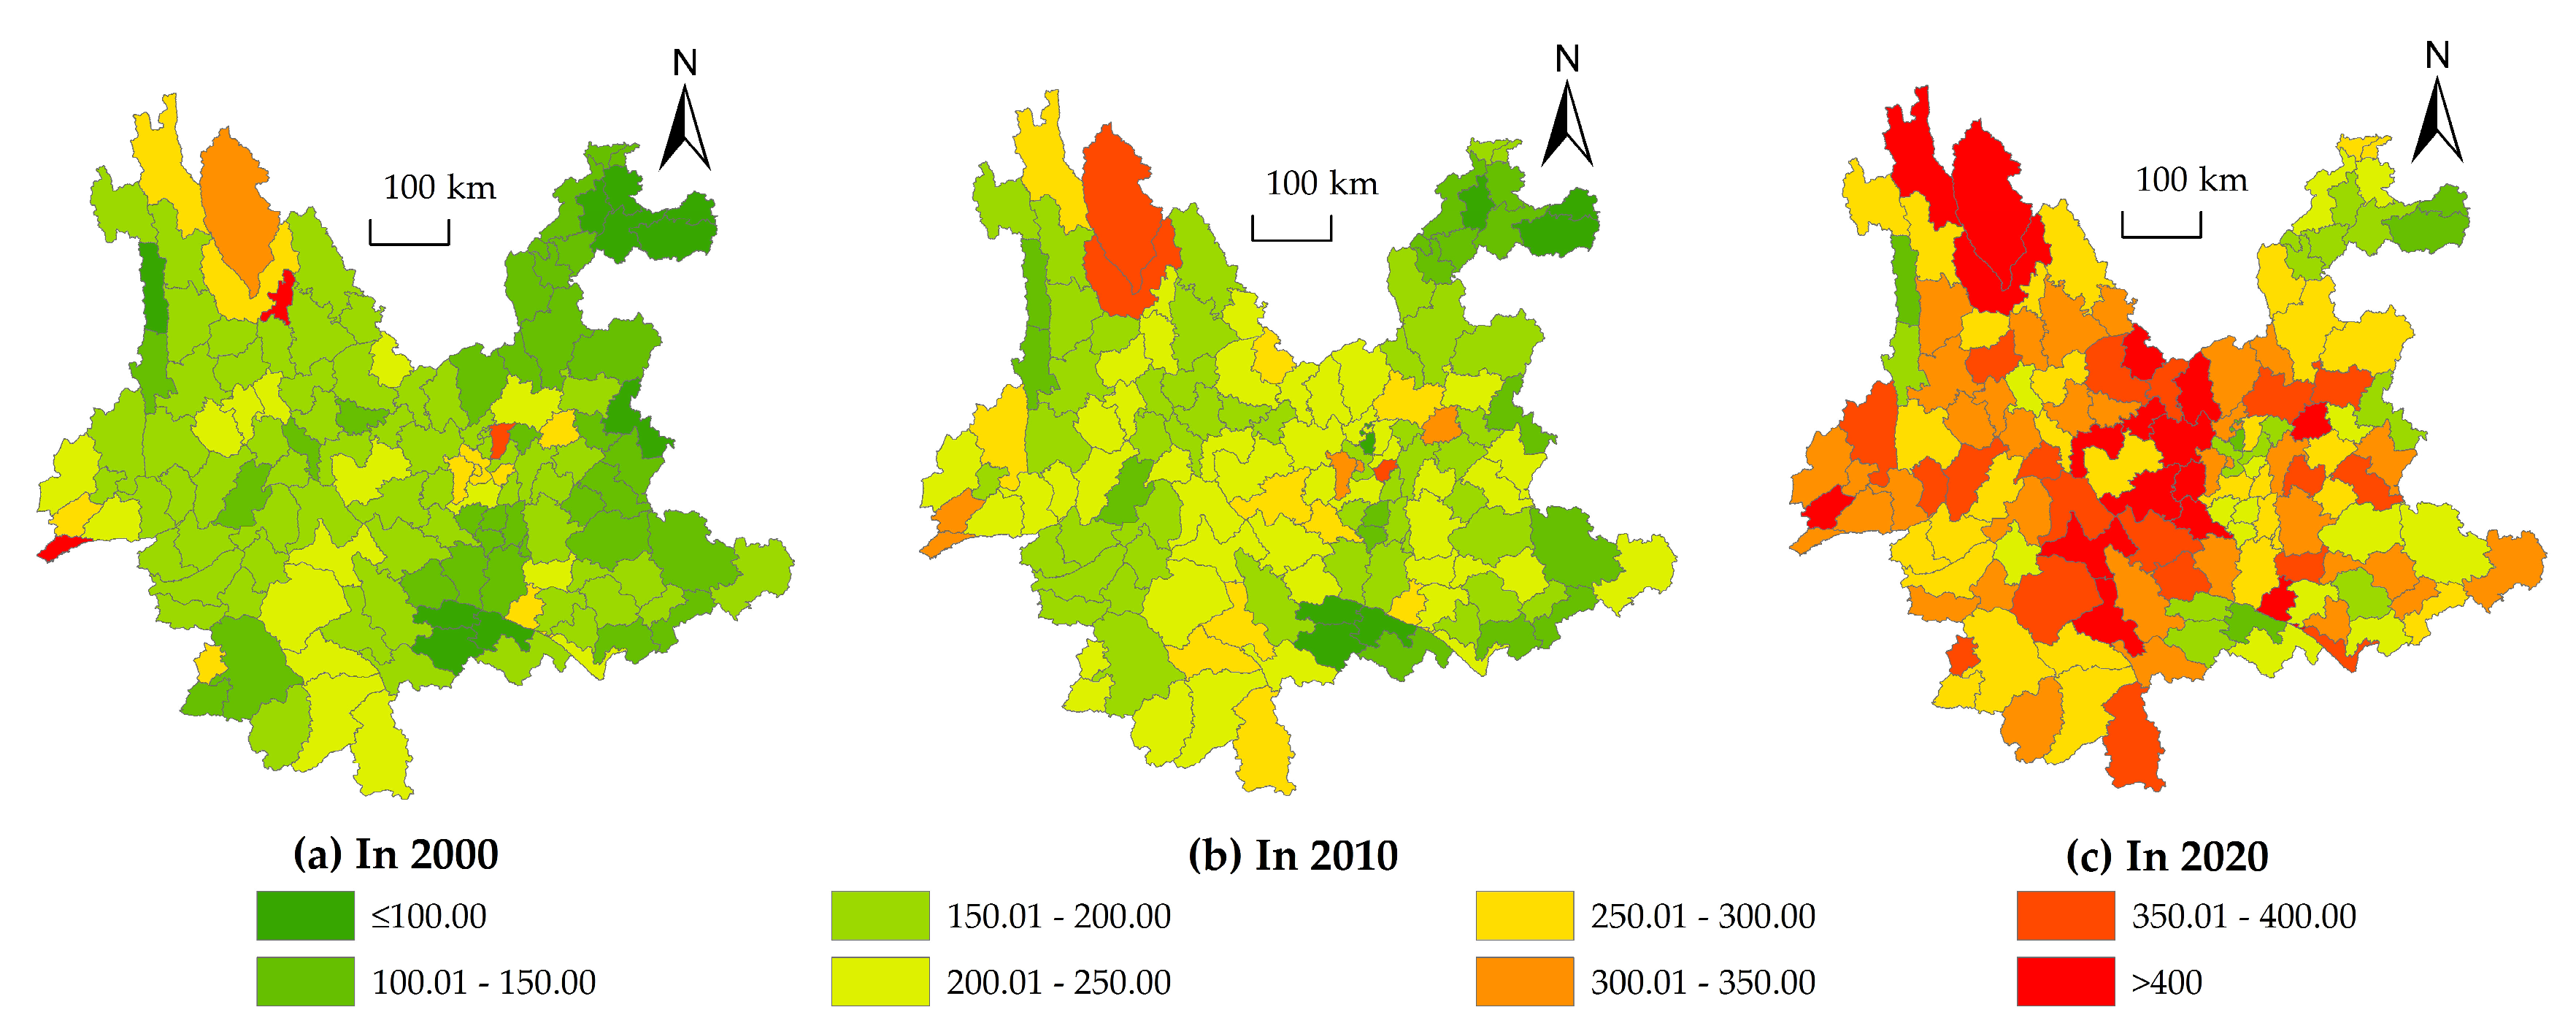
The results of spatiotemporal evolution analysis indicate that the total and per capita CULA in various counties of Yunnan have had relatively small changes over the past 20 years, but the per capita CULA in the southeast, northeast, northwest, and central urban areas of Yunnan is relatively low. During the same period, the total expansion rate of construction land in each county was relatively high, resulting in an “explosive growth” trend in the per capita COLA. By 2020, the per capita COLA in most counties had exceeded 250 m2/person, with a generally significant increase.
(3)
The analysis of the influencing factors in per capita CULA shows that improvement of the development status of the primary industry and an increase in per capita grain production can have a beneficial effect on the increase in per capita CULA. However, improvement of per capita income level of rural residents, an increase in population urbanization rate, and an increase in population density will lead to a significant decrease in per capita CULA. The analysis of the influencing factors in per capita COLA shows that an increase in population urbanization rate and population density is conducive to a decrease in per capita COLA. However, an increase in nighttime lighting brightness, per capita public financial expenditure, and per capita grain production will lead to a significant increase in per capita COLA.

6.2. Suggestions for Policy Measures

This article found that in mountainous provinces such as Yunnan, due to the limitations of mountainous terrain conditions, there are fewer cultivated land resources and there is less exploitable construction land. The prominent contradiction between the significant reduction in CULA and the significant increase in construction land during the past 20 years has obviously affected the food security and sustainable economic and social development of the mountainous province. In future development and construction, it is necessary to draw on the advanced experience of developed countries and regions, combined with the actual situation throughout Yunnan, focusing on the following policy measures:
(1)
Improve land use efficiency, optimize the layout of construction land, transform the development of cities at all levels from “extension” to “connotation”, further control the expansion speed of urban construction land, promote intensive land use, and strictly prohibit blind expansion and rough utilization.
(2)
Strictly protect existing cultivated land resources and implement a national strategy to prevent the “non-agriculturalization” and “non-grain growing” conversion of cultivated land.
(3)
Develop agricultural incentive measures, moderately develop suitable reserve land resources for cultivation, and strive to improve the quality of cultivated land.
(4)
Comprehensively consolidate the existing rural residential land (especially hollow villages), convert excess rural construction land into cultivated land and forest land, further stabilize the scale of cultivated land, moderately increase forest coverage, and improve the ecological environment.

6.3. Limitations of the Study and Prospects for Future Research

This study is based on the characteristic region of the mountainous province of Yunnan and combines the interpretation of remote sensing images of three phases with GIS and an econometric model to comprehensively integrate multiple technical methods. It conducts research on the spatiotemporal evolution laws of and influencing factors in cultivated land and construction land in Yunnan during the past 20 years. Overall, it is very meaningful and helps to promote the reasonable protection of cultivated land resources in mountainous provinces, intensive utilization of construction land, and coordinated development of urban and rural areas. However, the study in this paper belongs to a macro-perspective, and the main limitation is that micro-analysis (such as large-scale county-level remote sensing image interpretation data analysis) has not yet been carried out simultaneously; thus, the study does not combine macro-analysis with micro-research.
In future research, it is necessary to strengthen the following two aspects: The first is to select several typical counties of different types, use large-scale remote sensing image interpretation data, and carry out in-depth analysis at micro-level to make up for the limitations of this macro-level research. The second is to continue to pay attention to the provincial remote sensing image interpretation data and socio-economic statistical data in the future (such as in 2025 and 2030) and continue to carry out long-term research on the spatiotemporal evolution laws for and influencing factors in cultivated land and construction land in mountainous provinces.

Author Contributions

Conceptualization, X.C. and R.Y.; methodology, R.Y.; software, X.C.; validation, X.C. and R.Y.; formal analysis, R.Y.; investigation, X.C.; resources, R.Y.; data curation, X.C. and R.Y.; writing—original draft preparation, X.C. and R.Y.; writing—review and editing, X.C. and R.Y.; visualization, R.Y.; supervision, R.Y.; project administration, R.Y. All authors have read and agreed to the published version of the manuscript.

Funding

This research was funded by Yunnan University of Finance and Economics Graduate Innovation Fund Project (2023YUFEYC002).

Institutional Review Board Statement

Not applicable.

Informed Consent Statement

Not applicable.

Data Availability Statement

The RS image data in the study were collected from “https://www.resdc.cn/” (accessed on 16 June 2022). The DEM data were collected from “http://www.gscloud.cn” (accessed on 17 May 2022). The county boundaries of Yunnan Province were from “https://yunnan.tianditu.gov.cn/MapResource” (accessed on 9 March 2022). The economic and social statistical data are from the following website: “https://www.epsnet.com.cn/index.html#/Index” (accessed on 10 November 2022).

Conflicts of Interest

The authors declare no conflict of interest.

References

  1. Harris, J.R.; Todaro, M.P. Migration, Unemployment and Development: A Two-sector Analysis. Am. Econ. Rev. 1970, 60, 126–142. [Google Scholar]
  2. Huang, J.; Rozelle, S. Environmental Stress and Grain Yields in China. Am. J. Agric. Econ. 1995, 76, 853–864. [Google Scholar] [CrossRef]
  3. Wang, C.j.; Fei, X.M. Study on Industrialization, Urbanization and Mechanism of Arable Land Conversion Based on 42 Countries Samples. Areal Res. Dev. 2013, 32, 117–122. [Google Scholar]
  4. Yang, Z.S.; Li, Y.Y.; Zou, Z.; He, Y.M. Study on Land Resources Development and Utilization Planning of Yunnan Province in the Great Development of Western China, 1st ed.; Yunnan Science and Technology Press: Kunming, China, 2003. [Google Scholar]
  5. Yang, Z.S.; Zhao, Q.G.; Xin, L. Yunnan Land Resources, 1st ed.; China Science and Technology Press: Beijing, China, 2014. [Google Scholar]
  6. Office of the Leading Group of the Third National Land Survey of Yunnan Province; Department of Natural Resources of Yunnan Province; Statistics Bureau of Yunnan Province. Main Data Bulletin of the Third National Land Survey of Yunnan Province. Yunnan Daily. 22 December 2021. Available online: https://www.yn.gov.cn/sjfb/tjgb/202112/t20211221_231929.html (accessed on 5 January 2023).
  7. Li, X.B.; Sun, L.X. Driving Forces of Arable Land Conversion in China, 1st ed.; Cornell University: New York, NY, USA, 1997. [Google Scholar]
  8. Liu, J.Y.; Zhang, Z.X.; Xu, X.L.; Kuang, W.H.; Zhou, M.C.; Zhang, S.W.; Li, R.D.; Yan, C.Z.; Yu, D.S.; Wu, S.X.; et al. Spatial Patterns and Driving Forces of Land Use Change in China in the Early 21st Century. Acta Geogr. Sin. 2009, 64, 1411–1420. [Google Scholar] [CrossRef]
  9. Wang, C.J.; He, X.R.; Fei, X.M. Study on the Effect of Industrialization and Urbanization on Cultivated Land Change: An Empirical Analysis Based on International Perspective. J. Agrotech. Econ. 2012, 31, 49–56. [Google Scholar]
  10. Tan, M.H.; Li, X.B.; Lu, C.H. The Expansion of Construction Land and Its Occupation of Cultivated Land in Large and Medium-sized Cities of China in the 1990s. Sci. China Ser. D Earth Sci. 2004, 34, 1157–1165. [Google Scholar]
  11. Zhu, L.F.; Huang, J.K. Urbanization and Cultivated Land Changes in China. Econ. Res. J. 2007, 53, 137–145. [Google Scholar]
  12. Zhang, X.B.; Mount, T.D.; Boisvert, R.N. Industrialization, Urbanization and Land Use in China, 1st ed.; Cornell University: New York, NY, USA, 2008. [Google Scholar]
  13. Steven, D. Urban Growth, Rural Land Conversion and the Fiscal Well-Being of Local Municipalities, 1st ed.; Cornell University: New York, NY, USA, 2003. [Google Scholar]
  14. Wang, J.T.; Zhang, H.Z. The Interactive Relation between Industrialization, Urbanization and Land System: The American Experience. Asia-Pac. Econ. Rev. 2009, 25, 52–56. [Google Scholar]
  15. Jia, S.F.; Zhang, J.Y. Change and Experience of Cultivated Land Use in Urbanization Process in Japan. China Popul. Resour. Environ. 2003, 13, 31–34. [Google Scholar]
  16. Hao, S.Y.; Wang, J.T.; Zhang, C.Z. International Study of Industrialization, Urbanization and the Evolution of Rural Land System: A Case in Japan. Shanghai J. Econ. 2007, 27, 40–50. [Google Scholar]
  17. Sun, Q.; Cai, Y.L. Historical Experiences of Cropland Conservation and Land Management in Japan. Acta Sci. Nat. Univ. Pekin. 2008, 44, 249–256. [Google Scholar]
  18. Huang, D.Q.; Zheng, W.Y. Experience of Urbanization & the Protection of Cultivated Land from Other Countries and Regions. China Land Sci. 2005, 19, 38–43. [Google Scholar]
  19. Liu, X.W. Analysis of Land Use in Golden Development Stage in Japan, South Korea and China Taiwan. Land Resour. Inf. 2006, 3, 50–56. [Google Scholar]
  20. Zhao, X.L.; Zhang, Z.X.; Wang, X.; Zuo, L.J.; Liu, B.; Yi, L.; Xu, J.Y.; Wen, Q.K. Analysis of Chinese Cultivated Land’s Spatial-temporal Changes and Causes in Recent 30 Years. Trans. Chin. Soc. Agric. Eng. 2014, 30, 1–11. [Google Scholar]
  21. Shi, J.; Zhang, F.R.; Zhao, T.T. Spatiotemporal Changes in Cultivated Land Area in China from 1998 to 2006. Resour. Sci. 2008, 30, 1191–1198. [Google Scholar]
  22. Li, J.H.; Zhao, J.Z.; Chen, W.B.; Chen, F.G.; Zhao, X.M. Cultivated Land Change and Social Economic Driving Forces of Jiangxi Province over the Past 50 Years. Acta Agric. Univ. Jiangxiensis 2006, 28, 467–471. [Google Scholar]
  23. Du, X.B.; Zhou, W.; Si, H.J.; Cao, Y.G.; Cai, C.Y. Driving Forces of Cultivated Land Change in Qinghai Province during 2000–2008. Res. Soil Water Conserv. 2013, 20, 180–186. [Google Scholar]
  24. Zhao, Y.S. Principles and Methods for Analysis of Remote Sensing Applications, 2nd ed.; Science Press: Beijing, China, 2013. [Google Scholar]
  25. Liu, J.Y.; Zhang, Z.X.; Zhuang, D.F.; Wang, Y.M.; Zhou, W.C.; Zhang, S.W.; Li, R.D.; Jiang, N.; Wu, S.X. A Study on the Spatial-temporal Dynamic Changes of Land-use and Driving Forces Analyses of China in the 1990s. Geogr. Res. 2003, 22, 1–12. [Google Scholar]
  26. Liu, J.Y.; Kuang, W.H.; Zhang, Z.X.; Xu, X.L.; Qin, Y.W.; Ning, J.; Zhou, W.C.; Zhang, S.W.; Li, R.D.; Yan, C.Z.; et al. Spatiotemporal Characteristics, Patterns, and Causes of Land-use Changes in China since the Late 1980s. J. Geogr. Sci. 2014, 24, 195–210. [Google Scholar] [CrossRef]
  27. Liu, J.Y.; Ning, J.; Kuang, W.H.; Xu, X.L.; Zhang, S.W.; Yan, C.Z.; Li, R.D.; Wu, S.X.; Hu, Y.F.; Du, G.M.; et al. Spatio-temporal Patterns and Characteristics of Land-use Change in China during 2010–2015. Acta Geogr. Sin. 2018, 73, 789–802. [Google Scholar]
  28. Fu, B.J.; Chen, L.D.; Cai, Y.L.; Li, X.B. Study on Land Use Change and Sustainable Use in the Areas around Bo Hai, 1st ed.; Science Press: Beijing, China, 2004. [Google Scholar]
  29. Xiao, H.Y.; Liu, G.D.; Yang, Z.; Fang, N.; Dai, H.M.; Liu, K.; Han, X.M.; Zhu, H. Spatio-temporal Change in Land Uses of the Black Soil Area in Northeast China over the Past Half Century. Geophys. Geochem. Explor. 2022, 46, 1037–1049. [Google Scholar]
  30. Sayedain, S.A.; Maghsoudi, Y.; Eini-Zinab, S. Assessing the Use of Cross-Orbit Sentinel-1 Images in Land Cover Classification. Int. J. Remote Sens. 2020, 41, 7801–7819. [Google Scholar] [CrossRef]
  31. Ramanamurthy, B.V.; Victorbabu, N. Land Use Land Cover (LULC) Classification with Wasteland Demarcation Using Remote Sensing and GIS Techniques. Mater. Sci. Eng. 2021, 1025, 12–35. [Google Scholar] [CrossRef]
  32. Liang, J.; Xu, J.C.; Shen, H.F.; Fang, L. Land-use Classification via Constrained Extreme Learning Classifier Based on Cascaded Deep Convolutional Neural Networks. Eur. J. Remote Sens. 2020, 53, 219–232. [Google Scholar] [CrossRef]
  33. McCarty, D.A.; Kim, H.W.; Lee, H.K. Evaluation of Light Gradient Boosted Machine Learning Technique in Large Scale Land Use and Land Cover Classification. Environments 2020, 7, 84. [Google Scholar] [CrossRef]
  34. Rajendran, G.B.; Kumarasamy, U.M.; Zarro, C.; Divakarachari, P.B.; Ullo, S.L. Land-Use and Land-Cover Classification Using a Human Group-Based Particle Swarm Optimization Algorithm with an LSTM Classifier on Hybrid Pre-Processing Remote-Sensing Images. Remote Sens. 2020, 12, 4135. [Google Scholar] [CrossRef]
  35. Li, X.; Hu, T.; Gong, P.; Du, S.; Chen, B.; Li, X.; Dai, Q. Mapping Essential Urban Land Use Categories in Beijing with a Fast Area of Interest (AOI)-Based Method. Remote Sens. 2021, 13, 477. [Google Scholar] [CrossRef]
  36. Statistics Bureau of Yunnan Province. Yunnan Statistical Yearbook-2021, 1st ed.; China Statistics Press: Beijing, China, 2021. [Google Scholar]
  37. Office of Yunnan Provincial Agricultural Zoning Commission. Land Area of Different Climatic Zones and Slopes in Yunnan Province, 1st ed.; Yunnan Science and Technology Press: Kunming, China, 1987. [Google Scholar]
  38. National Bureau of Statistics of the People’s Republic of China. China Statistical Yearbook-2021, 1st ed.; China Statistics Press: Beijing, China, 2021. [Google Scholar]
  39. Xu, X.L.; Liu, J.Y.; Zhang, S.W.; Li, R.D.; Yan, C.Z.; Wu, S.X.; Multi-Period Land Use and Land Cover Monitoring Data Set in China (CNLUCC). Beijing: Resource and Environment Science Registration and Publication System, Institute of Geographic Sciences and Natural Resources Research, Chinese Academy of Sciences. Available online: http://www.resdc.cn/DOI (accessed on 26 December 2018).
  40. Liu, J.Y.; Liu, M.L.; Deng, X.Z.; Zhuang, D.F.; Zhang, Z.X.; Luo, D. The land use and land cover change database and its relative studies in China. J. Geograph. Sci. 2002, 12, 275–282. [Google Scholar]
  41. Liu, J.Y.; Liu, M.L.; Zhuang, D.F.; Zhang, Z.X.; Deng, X.Z. Study on Spatial Pattern of Land-use Change in China during 1995–2000. Sci. China Ser. D 2003, 46, 373–384. [Google Scholar]
  42. Kuang, W.H.; Zhang, S.W.; Du, G.M.; Yan, C.Z.; Wu, S.X.; Li, R.D.; Lu, D.S.; Pan, T.; Ning, J.; Guo, C.Q.; et al. Remotely Sensed Mapping and Analysis of Spatio-temporal Patterns of Land Use Change Across China in 2015–2020. Acta Geogr. Sin. 2022, 77, 1056–1071. [Google Scholar]
  43. Yang, R.Y.; Zhong, C.B. Analysis on Spatio-Temporal Evolution and Influencing Factors of Air Quality Index (AQI) in China. Toxics 2022, 10, 712. [Google Scholar] [CrossRef] [PubMed]
  44. Tobler, W. A Computer Movie Simulating Urban Growth in the Detroit Region. Econ. Geogr. 1970, 46, 234–240. [Google Scholar] [CrossRef]
  45. Moran, P. Notes on Continuous Stochastic Phenomena. Biometrika 1950, 37, 17–23. [Google Scholar] [CrossRef] [PubMed]
  46. Yang, Z.S.; Yang, R.Y.; Liu, F.L. Spatio-temporal Evolution and Influencing Factors of Urban-rural Income Gap in Yunnan Province Based on Poverty Classification. Geogr. Res. 2021, 40, 2252–2271. [Google Scholar]
  47. Elhorst, J.P. Spatial Econometrics: From Cross-Sectional Data to Spatial Panels, 1st ed.; Springer: Berlin/Heidelberg, Germany, 2014. [Google Scholar]
  48. Yang, R.Y.; Zhong, C.B.; Yang, Z.S.; Liu, F.L.; Peng, H.Y. Analysis on Poverty Influencing Factors in Deep Poverty County of Karst Rocky-desertified Area in Southwest China. World Reg. Stud. 2022, 31, 1298–1309. [Google Scholar]
  49. Yang, Z.S. Study on Land Use Changes and Its Ecological Effects in Different Landform Areas in Yunnan Province Driven by China’s Project of Converting Farmland to Forest, 1st ed.; China Science and Technology Press: Beijing, China, 2011. [Google Scholar]
  50. Henderson, V.; Storeygard, A.; Weil, D.N. Measuring Economic Growth from Outer Space. Am. Econ. Rev. 2012, 102, 994–1028. [Google Scholar] [CrossRef]
  51. Xu, K.N.; Chen, F.L.; Liu, X.Y. The Truth of China Economic Growth: Evidence from Global Night-time Light Data. Econ. Res. J. 2015, 9, 17–29. [Google Scholar]
  52. Yang, R.Y.; Zhong, C.B.; Yang, Z.S.; Wu, Q.J. Analysis on the Effect of the Targeted Poverty Alleviation Policy on Narrowing the Urban-Rural Income Gap: An Empirical Test Based on 124 Counties in Yunnan Province. Sustainability 2022, 14, 12560. [Google Scholar] [CrossRef]
Figure 1. Geographic location of the study area. (a) Location of Yunnan Province in China; (b) distribution of 129 counties in Yunnan Province; (c) digital elevation model map of Yunnan Province.
Agriculture 13 00981 g001
Figure 2. Remote sensing image interpretation in 2000, 2010, and 2020 in Yunnan Province.
Agriculture 13 00981 g002
Figure 3. Relationship and Simplified Conditions of Various Spatial Econometric Models.
Agriculture 13 00981 g003
Figure 4. Selection and Test Steps of Spatial Econometrics Model.
Agriculture 13 00981 g004
Figure 5. The Terrain Degree of Excellence, Climate Degree of Excellence, and Terrain–Climate Comprehensive Degree of Excellence of Each County in Yunnan Province.
Agriculture 13 00981 g005
Figure 6. The Steps of Spatiotemporal Evolution and Influencing Factors in Cultivated Land and Construction Land in Yunnan Province in the Past 20 Years.
Agriculture 13 00981 g006
Figure 7. LULC Map of Yunnan in 2000, 2010, and 2020.
Agriculture 13 00981 g007
Figure 8. Spatiotemporal Changes in the Proportion of CULA in each County of Yunnan Province in the past 20 Years (Unit: %).
Agriculture 13 00981 g008
Figure 9. Spatiotemporal Changes in the Proportion of COLA in each County of Yunnan Province in the past 20 Years (Unit: %).
Agriculture 13 00981 g009
Figure 10. Spatiotemporal Changes in Per Capita CULA in each County of Yunnan Province in the past 20 Years (Unit: m2/person).
Agriculture 13 00981 g010
Figure 11. Spatiotemporal Changes in Per Capita COLA in each County of Yunnan Province in the past 20 Years (Unit: m2/person).
Agriculture 13 00981 g011
Table 1. Detailed Information on the Remote Sensing Images of Three Different Phases.
YearRemote Sensing Image DataSpatial Resolution
2000Landsat-TM/ETM remote sensing images from December 1999 to February 200030 m × 30 m
2010Landsat-TM remote sensing images from December 2009 to February 201030 m × 30 m
2020Landsat-8 remote sensing images from January 2020 to February 202030 m × 30 m
Table 2. Index System and Calculation Method for Influencing Factors in Per Capita CULA and Per Capita COLA in Yunnan Province.
DimensionsVariablesMethod of CalculationNameUnit
Dependent VariablesPer Capita Cultivated Land Area (CULA)ln (total area of local cultivated land/total population)Y1m2/person
Per Capita Construction Land Area (COLA)ln (total area of local construction land/total population)Y2m2/person
Industrial EconomyDevelopment Status of Primary Industryln (primary industry output value/rural registered residence population)X1CNY/person
Development Status of Secondary Industryln (secondary industry output value/urban registered residence population)X2CNY/person
Development Status of Tertiary Industryln (tertiary industry output value/total population)X3CNY/person
Industrial Structureoutput value of secondary and tertiary industries/GDP × 100%X4%
Light Brightness in the Nighttimeln (average brightness of night lights + 0.01)X5None
Investment ExpenditureFixed Assets Investmentln (total fixed assets investment/total population)X6CNY/person
Per Capita Public Financial Expenditureln (public finance expenditure/total population)X7CNY/person
Rural DevelopmentPer Capita Income Level of Rural Residentsln (per capita disposable income of rural residents)X8CNY/person
Proportion of Rural Employeesrural employees/total rural populationX9%
Per Capita Grain Outputtotal grain output/total populationX10kg/person
Population StructurePopulation Urbanization Level(total population − agricultural population)/total population × 100%X11%
Population Densitytotal population/land areaX12person/km2
Ecological EnvironmentBiological Abundance IndexAbio × (0.35 × woodland area + 0.21 × grassland area + 0.28 × water area + 0.11 × cultivated land area + 0.04 × construction land area + 0.01 ×unused land area)/total land area; where Abio = 511.2642X13None
Normalized Difference Vegetation Index (NDVI)average local NDVI in the current yearX14None
Geographical ConditionsTerrain Degree of Excellence1 × proportion of land area with slope ≤ 8° + 0.75 × proportion of land area with a slope of 8~15° + 0.5 × land area ratio with a slope of 15~25° + 0.25 × land area ratio with a slope of 25~35° + 0.9 × proportion of water area and land areaX15None
Climate Degree of Excellence1 × lower thermosphere + 0.8 × medium warm layer + 0.5 × high cold layer + 0.9 × Other X16None
Table 3. The Classified Area of Cultivated Land and Construction Land in Yunnan Province from 2000 to 2020.
First-Level Land Use TypeSecond-Level Land Use TypeLand Use Classified Areas (Unit: 1 × 10⁴ Hectares; m2/Person)
200020102020
Cultivated LandPaddy Field135.91134.53131.39
Dry Farmland415.17411.43408.17
Total551.08545.96539.56
Cultivated Land (Per Capita)Paddy Field (Per Capita)333.42292.35278.26
Dry Farmland (Per Capita)1018.52894.09864.43
Total (Per Capita)1351.951186.441142.69
Construction LandUrban Construction Land, Rural Settlement Area, and Land for Mining and Industry54.8474.86109.17
Other Building Land11.8811.8720.52
Total66.7286.73129.69
Construction Land (Per Capita)Urban Construction Land, Rural Settlement Area, and Land for Mining and Industry (Per Capita)134.54162.68231.20
Other Building Land (Per Capita)29.1425.8043.46
Total (Per Capita)163.68188.48274.66
Table 4. Calculation Results of Moran’s I of Per Capita CULA and Per Capita COLA in Yunnan Province in Three Periods.
DimensionUsing Natural LogarithmItems200020102020Annual Average
Per Capita Cultivated AreaNoMoran’s I0.447 ***0.424 ***0.408 ***0.446 ***
Z statistics8.5878.1477.8458.575
YesMoran’s I0.474 ***0.506 ***0.551 ***0.524 ***
Z statistics9.2269.94110.81910.262
Per Capita Construction Land AreaNoMoran’s I0.156 ***0.269 ***0.296 ***0.275 ***
Z statistics3.6895.2465.7405.356
YesMoran’s I0.329 ***0.308 ***0.320 ***0.331 ***
Z statistics6.4625.9906.2196.414
Note: *** indicates passing the significance level tests of 1%.
Table 5. Results of Spatial Autocorrelation Test.
Dependent VariablesTypesStatisticsAll Independent Variables Are ConsideredIndependent Variables Except Collinear Variables Are Considered
Statistical Valuesp ValuesStatistical Valuesp Values
Per Capita CULASpatial ErrorMoran’s I1.869 *0.0621.800 *0.072
LM41.365 ***0.00040.092 ***0.000
Robust LM39.213 ***0.00037.842 ***0.000
Spatial LagLM3.061 *0.0803.346 *0.067
Robust LM0.9090.3411.0960.295
Per Capita COLASpatial ErrorMoran’s I1.643 *0.1001.734 *0.083
LM27.990 ***0.00035.981 ***0.000
Robust LM26.763 ***0.00034.358 ***0.000
Spatial LagLM2.1640.1412.866 *0.090
Robust LM0.9370.3331.2420.265
Note: * represent significant levels of p = 0.05. *** indicates passing the significance level tests of 1%.
Table 6. Estimation Results of the Econometric Model for the Analysis of the Influencing Factors in the Per Capita CULA.
ItemsRESARAR(FE)SAR(RE)SEM(RE)SDM(RE)
Development Status of the Primary Industry (X1)0.1236 **
(0.0573)
0.0960 ***
(0.0276)
0.1101 ***
(0.0341)
0.0855 ***
(0.0330)
0.0573 *
(0.0322)
Development Status of the Secondary Industry (X2)−0.0169
(0.0167)
0.0035
(0.0133)
−0.0069
(0.0158)
0.0035
(0.0157)
0.0297 *
(0.0158)
Industrial Structure (X4)0.0024
(0.0015)
0.0012
(0.0011)
0.0019
(0.0013)
0.0009
(0.0013)
−0.0010
(0.0013)
Light Brightness in the Nighttime (X5)−0.0064
(0.0153)
−0.0158
(0.0101)
−0.0065
(0.0122)
−0.0219 *
(0.0122)
−0.0222 *
(0.0119)
Per Capita Public Financial Expenditure (X7)−0.0281
(0.0216)
−0.0333 **
(0.0158)
−0.0177
(0.0182)
−0.0318 *
(0.0189)
0.0594 **
(0.0293)
Per Capita Income Level of Rural Residents (X8)−0.1561 ***
(0.0434)
−0.1193 ***
(0.0318)
−0.1650 ***
(0.0343)
−0.1333 ***
(0.0376)
−0.0999 **
(0.0423)
Proportion of Rural Employees (X9)−0.0011
(0.0012)
−0.0003
(0.0009)
−0.0018
(0.0011)
−0.0004
(0.0011)
−0.0010
(0.0010)
Per Capita Grain Output (X10)0.0006 ***
(0.0001)
0.0005 ***
(0.0001)
0.0005 ***
(0.0001)
0.0006 ***
(0.0001)
0.0004 ***
(0.0001)
Population Urbanization Level (X11)−0.0117 ***
(0.0021)
−0.0119 ***
(0.0010)
−0.0118 ***
(0.0013)
−0.0116 ***
(0.0012)
−0.0106 ***
(0.0012)
Population Density (X12)−0.0009 ***
(0.0001)
−0.0009 ***
(0.0000)
−0.0008 ***
(0.0001)
−0.0009 ***
(0.0001)
−0.0008 ***
(0.0001)
Biological Abundance Index (X13)0.0048 **
(0.0022)
0.0008
(0.0018)
0.0036 **
(0.0018)
0.0033 *
(0.0018)
0.0014
(0.0018)
NDVI (X14)0.0447 *
(0.0261)
0.0046
(0.0351)
0.0588 *
(0.0339)
0.0314
(0.0423)
−0.0076
(0.0560)
Terrain Degree of Excellence (X15)0.5762
(0.3589)
0.6307 **
(0.2708)
0.5927 **
(0.2902)
0.6182
(0.4504)
Climate Degree of Excellence (X16)1.0085 **
(0.4662)
0.7914 **
(0.3169)
1.0071 ***
(0.3388)
−0.3780
(0.7493)
_cons6.0737 ***
(0.6293)
4.6455 ***
(0.5736)
6.3563 ***
(0.5488)
2.4399 ***
(0.7895)
Parameter ρ−0.0234
(0.0536)
0.2388 ***
(0.0484)
0.5168 ***
(0.0588)
Parameter λ0.5258 ***
(0.0636)
0.5257 ***
(0.0709)
LR Test: Individual Effect33.10 ***
(0.0072)
LR Test: Time Effect−1390.18
(1.0000)
Hausman Test16.35
(0.1759)
7.70
(0.8079)
16.35
(0.1759)
9.09
(0.6956)
Individual EffectYes
Time EffectNo
Within R20.84100.83790.82330.83560.8630
Sample Size387387387387387
Note: The robust standard error approach was used to estimate the outcomes above. The significance level test was passed at 10%, 5%, and 1%, respectively, as denoted by the symbols *, **, and ***. According to Hausman test statistics and LR test statistics, this study chooses the optimal models and controls various effects: FE represents fixed effect model and RE represents random effect model.
Table 7. Estimation Results of the Econometric Model for the Analysis of the Influencing Factors in the Per Capita COLA.
ItemsFESARAR(FE)SAR(FE)SEM(FE)SDM(FE)
Development Status of the Primary Industry (X1)0.0838
(0.0572)
0.0985 **
(0.0474)
0.1439 ***
(0.0447)
0.0899 *
(0.0464)
0.0624
(0.0436)
Development Status of the Secondary Industry (X2)−0.0085
(0.0277)
−0.0285
(0.0213)
−0.0283
(0.0204)
−0.0264
(0.0213)
−0.0166
(0.0211)
Industrial Structure (X4)−0.0001
(0.0023)
0.0000
(0.0018)
0.0017
(0.0016)
−0.0003
(0.0017)
−0.0001
(0.0017)
Light Brightness in the Nighttime (X5)0.0217
(0.0202)
0.0608 ***
(0.0163)
0.0622 ***
(0.0156)
0.0601 ***
(0.0163)
0.0338 **
(0.0159)
Per Capita Public Financial Expenditure (X7)−0.0081
(0.0469)
0.0746 **
(0.0294)
0.0418 *
(0.0231)
0.0874 ***
(0.0264)
0.0260
(0.0397)
Per Capita Income Level of Rural Residents (X8)−0.1602 **
(0.0630)
0.0583
(0.0527)
−0.0059
(0.0460)
0.0653
(0.0531)
−0.1157 **
(0.0567)
Proportion of Rural Employees (X9)−0.0031 *
(0.0017)
−0.0024
(0.0015)
−0.0042 ***
(0.0014)
−0.0020
(0.0014)
−0.0026 *
(0.0014)
Per Capita Grain Output (X10)0.0005 ***
(0.0001)
0.0006 ***
(0.0001)
0.0005 ***
(0.0001)
0.0006 ***
(0.0001)
0.0006 ***
(0.0001)
Population Urbanization Level (X11)−0.0107 ***
(0.0020)
−0.0106 ***
(0.0017)
−0.0119 ***
(0.0016)
−0.0102 ***
(0.0016)
−0.0107 ***
(0.0016)
Population Density (X12)−0.0006 ***
(0.0001)
−0.0004 ***
(0.0001)
−0.0003 ***
(0.0001)
−0.0004 ***
(0.0001)
−0.0005 ***
(0.0001)
Biological Abundance Index (X13)−0.0055
(0.0037)
0.0000
(0.0030)
−0.0012
(0.0030)
0.0003
(0.0029)
−0.0016
(0.0028)
NDVI (X14)0.0301
(0.0521)
0.0622
(0.0566)
0.0767 *
(0.0421)
0.0529
(0.0587)
−0.1156
(0.0745)
Parameter ρ0.0974
(0.1134)
0.4117 ***
(0.0499)
0.4242 ***
(0.0588)
Parameter λ0.4980 ***
(0.1185)
0.5793 ***
(0.0573)
LR Test: Individual Effect100.48 ***
(0.0000)
56.89 ***
(0.0000)
53.15 ***
(0.0000)
56.25 ***
(0.0000)
25.58 **
(0.0292)
LR Test: Time Effect681.62 ***
(0.0000)
−649.43
(1.0000)
−649.48
(1.0000)
−648.82
(1.0000)
−658.33
(1.0000)
Hausman Test44.32 ***
(0.0000)
35.84 ***
(0.0003)
24.98 **
(0.0149)
60.88 ***
(0.0000)
Individual EffectYesYesYesYesYes
Time EffectYesNoNoNoNo
Within R20.88380.83830.84480.83450.8823
Sample Size387387387387387
Note: The robust standard error approach was used to estimate the outcomes above. The significance level test was passed at 10%, 5%, and 1%, respectively, as denoted by the symbols *, **, and ***. According to Hausman test statistics and LR test statistics, this study chooses the optimal models and controls various effects. FE represents fixed effect model and RE represents random effect model.
Disclaimer/Publisher’s Note: The statements, opinions and data contained in all publications are solely those of the individual author(s) and contributor(s) and not of MDPI and/or the editor(s). MDPI and/or the editor(s) disclaim responsibility for any injury to people or property resulting from any ideas, methods, instructions or products referred to in the content.

