Article

Non-Destructive Appraisal of Macro- and Micronutrients in Persimmon Leaves Using Vis/NIR Hyperspectral Imaging

by
Maylin Acosta
1,
Isabel Rodríguez-Carretero
1,
José Blasco
2,
José Miguel de Paz
1 and
Ana Quiñones
1,*
1
Centro Para el Desarrollo de la Agricultura Sostenible, Instituto Valenciano de Investigaciones Agrarias (IVIA), CV-315, km 10.7, Moncada, 46113 Valencia, Spain
2
Centro de Agroingeniería, Instituto Valenciano de Investigaciones Agrarias (IVIA), CV-315, km 10.7, Moncada, 46113 Valencia, Spain
*
Author to whom correspondence should be addressed.
Agriculture 2023, 13(4), 916; https://doi.org/10.3390/agriculture13040916
Submission received: 22 March 2023 / Revised: 13 April 2023 / Accepted: 20 April 2023 / Published: 21 April 2023
(This article belongs to the Special Issue Applications of Data Analysis in Agriculture)

Abstract

:
Visible and near-infrared (Vis/NIR) hyperspectral imaging (HSI) was used for rapid and non-destructive determination of macro- and micronutrient contents in persimmon leaves. Hyperspectral images of 687 leaves were acquired in the 500–980 nm range over 6 months, covering a complete vegetative cycle. The average reflectance spectrum of each leaf was extracted, and foliar ionomic analysis was used as a reference method to determine the actual concentration of the nutrients in the leaves. Analyses were performed via emission spectrometry (ICP-OES) for macro- and micronutrients after microwave digestion and using the Kjeldahl method to quantify nitrogen. Partial least square regression (PLS-R) was used to predict the nutrient concentration based on spectral data from the leaf using actual values of each element as predictor variables. Several methods were used to pre-process the spectra, including Savitzky–Golay (SG) smoothing, standard normal variate (SNV) and first (1D) and second derivatives (2D). Seventy-five percent of the samples were used to calibrate and validate the model by cross-validation, whereas the remaining twenty-five % were used as an independent test set. The best performance of the models for the test set achieved an R2 = 0.80 for nitrogen. Results were also satisfactory for phosphorous, calcium, magnesium and boron, with determination coefficient R2 values of 0.63, 0.66, 0.58 and 0.69, respectively. For the other nutrients, lower prediction rates were attained (R2 = 0.48 for potassium, R2 = 0.38 for iron, R2 = 0.24 for copper, R2 = 0.23 for zinc and R2 = 0.22 for manganese). The variable importance in projection (VIP) was used to extract the most influential bands for the best-predicted nutrients, which were N, K and B.

1. Introduction

Persimmon (Diospyros kaki Thunberg) is a crop that is native to China, which grows in tropical and subtropical areas and has adapted well to the Mediterranean climate [1]. Cultivation of the cultivar ‘Rojo Brillante’ has grown exponentially in recent years in Spain, which is currently ranked second for the world production of this fruit [2]. It is essential to ensure fair handling practices during the growing period in order to produce good quality persimmons, including the implementation of optimum nutrient management according to the nutritional status of the trees at each phenological stage. However, only a little bit of research has been carried out on the nutritional requirements of persimmon. Moreover, the previous studies were conducted mainly in Japan, Australia and New Zealand for local varieties other than ‘Rojo Brillante’, the predominant variety in Spain.
Plant nutrients can be divided into two broad categories: macronutrients and micronutrients. Both types are essential for plant growth and yield since they are constituents of several structures involved in storing energy or in numerous enzymatic and metabolic processes. Research into the beneficial effects of the nutrient fertilisation of crops was pioneered by von Liebig in the 19th century, when he described the essential roles of nutrients in plant development [3]. Macronutrients such as nitrogen (N), phosphorous (P), potassium (K), sulphur (S), manganese (Mg) and calcium (Ca) are major constituents of cell structures and organic compounds and are therefore required in large amounts [4]. In contrast, micronutrients are involved in multiple metabolic and enzymatic processes, as well as in the synthesis of chlorophyll, and typically are needed in small amounts [5]. Micronutrients such as zinc (Zn), manganese (Mn), copper (Cu) and boron (B) are involved in chlorophyll formation (photosynthesis), as well as root cell division and elongation. At the same time, iron (Fe) is a critical component of photosynthesis, respiratory electron transport and a cofactor of multiple redox enzymes.
The capacity of the soil to supply the nutrients require to achieve good crop development, and production is usually insufficient. Hence, there is a need to apply rational fertilisation plans at regular intervals. Malagón and Monzó [6] proposed three fertiliser applications for persimmon in Spain. The first application in mid-March comprised an N-P-K or N-P-K-Mg complex, the second included a nitrogenous fertiliser (nitric-ammoniacal) and magnesium and a third application was based on potassium nitrate. These proposed doses are only indicative since any fertilisation plan must be adjusted to the nutritional status of the plants, the agronomic conditions, the soil composition and the irrigation water.
The ionomic analysis of leaves is a traditional method used to determine the nutritional status of plants, which is costly, laborious and time-consuming, resulting in delays between field sampling and ionomic diagnosis. Therefore, the need for fast, non-destructive and high-throughput alternative technologies for crop monitoring has led to the use or development of new sensors [7]. In agriculture, the potential of visible and near-infrared (Vis/NIR) spectral reflectance has already been studied for different purposes [8], including the assessment of nutrient concentration. These developments have enabled the estimation of a wide variety of plant chemical properties and physiological processes based on leaf optical properties of living tissue. Estimating these features from sheet reflectance is based on variations in the absorption of organic molecular bonds, mainly C-H, N-H and O-H bonds, resulting in vibrational excitation at specific electromagnetic spectrum wavelengths. Exploiting the relationships of light to organic bonds allows plant spectroscopy to characterise the chemical and physiological state of plants [9].
Hyperspectral imaging (HSI) is a novel and emerging technology adapted for several applications in agriculture. HSI is a combination of spectroscopic and imaging techniques that allows the identification of chemical components and their spatial distribution in a sample [10]. Due to these characteristics, it is becoming an important tool in precision agriculture for rapid assessment of crop nutrition [11]. In olive orchards, Gómez-Casero et al. [12] estimated K deficiencies through the hyperspectral imaging of leaves in the 400–900 nm range and found changes in the NIR region. They stated that the normalised difference vegetation index (NDVI) could be used to estimate the K concentration in olive trees with high precision.
In pear tree leaves, Jin et al. [13] detected N, P and K deficiencies using a handheld miniature spectrometer operating from 900 to 1700 nm in reflectance mode. They used 42 recognition models based on random forest, support vector machine (SVM), gradient boosting decision tree and extreme gradient boosting (XGBoost). The highest accuracy was achieved using SVM via pre-processing based on SNV and genetic algorithm feature extraction, which enabled them to reach correct classification rates of 82.06% and 80.25%, respectively.
N, P and K contents in oilseed rape leaves were investigated by Zhang et al. [14] using Vis/NIR hyperspectral imaging and least-squares support vector machines (LS-SVM). The results were an R2 of 0.88 for N and an R2 of 0.71 for P, while using partial least square regression (PLS-R) resulted in an R2 of 0.75 for K. Christensen et al. [15] used hyperspectral imaging (400–750 nm) to predict the P content in barley plants from the canopy spectral reflectance, with an accuracy rate of 74%.
Yanli et al. [16] estimated N and P concentrations in citrus leaves from hyperspectral images of the adaxial and abaxial sides of each leaf. The performances of five pre-processing methods, i.e., Savitzky–Golay smoothing (SG), standard normal variate (SNV), multiplicative scatter correction (MSC) and first derivative (1D) and second derivative (2D), were tested using linear partial least squares (PLS) and nonlinear LS SVM models. The results showed that PLS and SG-PLS achieved the best performance in predicting N (R = 0.90, RMSEP = 0.104) and P (R = 0.92, RMSEP = 0.051) concentrations, respectively. Additionally, Li et al. [17] explored the ability of this technology to predict P content in litchi leaves using canopy reflectance. The results using cross-validation showed that optimal spectral indices selected by correlation analyses achieved the highest accuracy in retrieving P content at each growth stage (R2 = 0.54–0.98, RMSECV = 0.02–0.03).
In contrast, only one study related to persimmons was found. Visconti and de Paz [18] obtained a regression model to predict chloride (Cl) in persimmon leaves, with an R2 of 0.78, an RMSE of 0.34% Cl and a ratio performance deviation (RPD) of 2.18. Moreover, they stated that wavelengths between 390 and 472 nm and 690 and 692 nm correlated positively with the Cl content.
While the estimation of macronutrients, especially N, P, and K, has been previously studied using hyperspectral imaging in some species, micronutrients have been studied to a lesser extent. Moreover, no studies on determining nutrient concentration using spectral data for persimmons have been found. Developing a tool to perform a rapid nutritional diagnosis at a lower cost would allow the efficient fertiliser management of crops, leading to earlier decisions on fertilisation, while also reducing costs and the potential risk of contamination. Therefore, this work advances in the study of the potential of Vis/NIR hyperspectral imaging to determine the foliar concentration of macro (N, P, K, Ca, Mg, S and Na) and micronutrients (Fe, Cu, Mn, Zn and B) in persimmon leaves as a new tool alternative to conventional slow and complex laboratory analyses.

2. Materials and Methods

2.1. Field Experiment

Leaves were sampled from an experimental plot of 48 six-year-old persimmon (Diospyros kaki) trees, ‘Rojo Brillante’, located at the Instituto Valenciano de Investigaciones Agrarias (IVIA) in Moncada (Valencia), Spain. Six treatments (Table 1) involving four nitrogen levels in combination with three doses of potassium were applied to create variability in the foliar nutrient status. The six fertilisation treatments combined N doses of 0%, 33% and 50% fertilisation units (FU) of total crop requirement with K doses of 0% and 50% FU as per crop requirements, and the control included 100% of the N and K crop requirements. The doses of N and K were assessed based on the characteristics of the plantation, such as age, variety, rootstock and framework (5 × 5 m). Fertilisation treatments were applied from April to September.
Foliar sampling was carried out monthly (June, July, September, October, November and December 2020) by taking six leaves from the summer flush leaves of each tree, and the third or fourth leaves from the axilla of reproductive sprouting were placed at the four orientations. Hence, 24 leaves were collected per treatment and month, totalling 144 leaves. Once collected, the leaves were immediately sealed in plastic bags and taken to the laboratory at air temperature. The leaves were washed with phosphate-free soap and rinsed with Milli Q water to remove any remaining dust or contamination. After drying, leaves were labelled and attached to a white surface to flatten them during image acquisition.

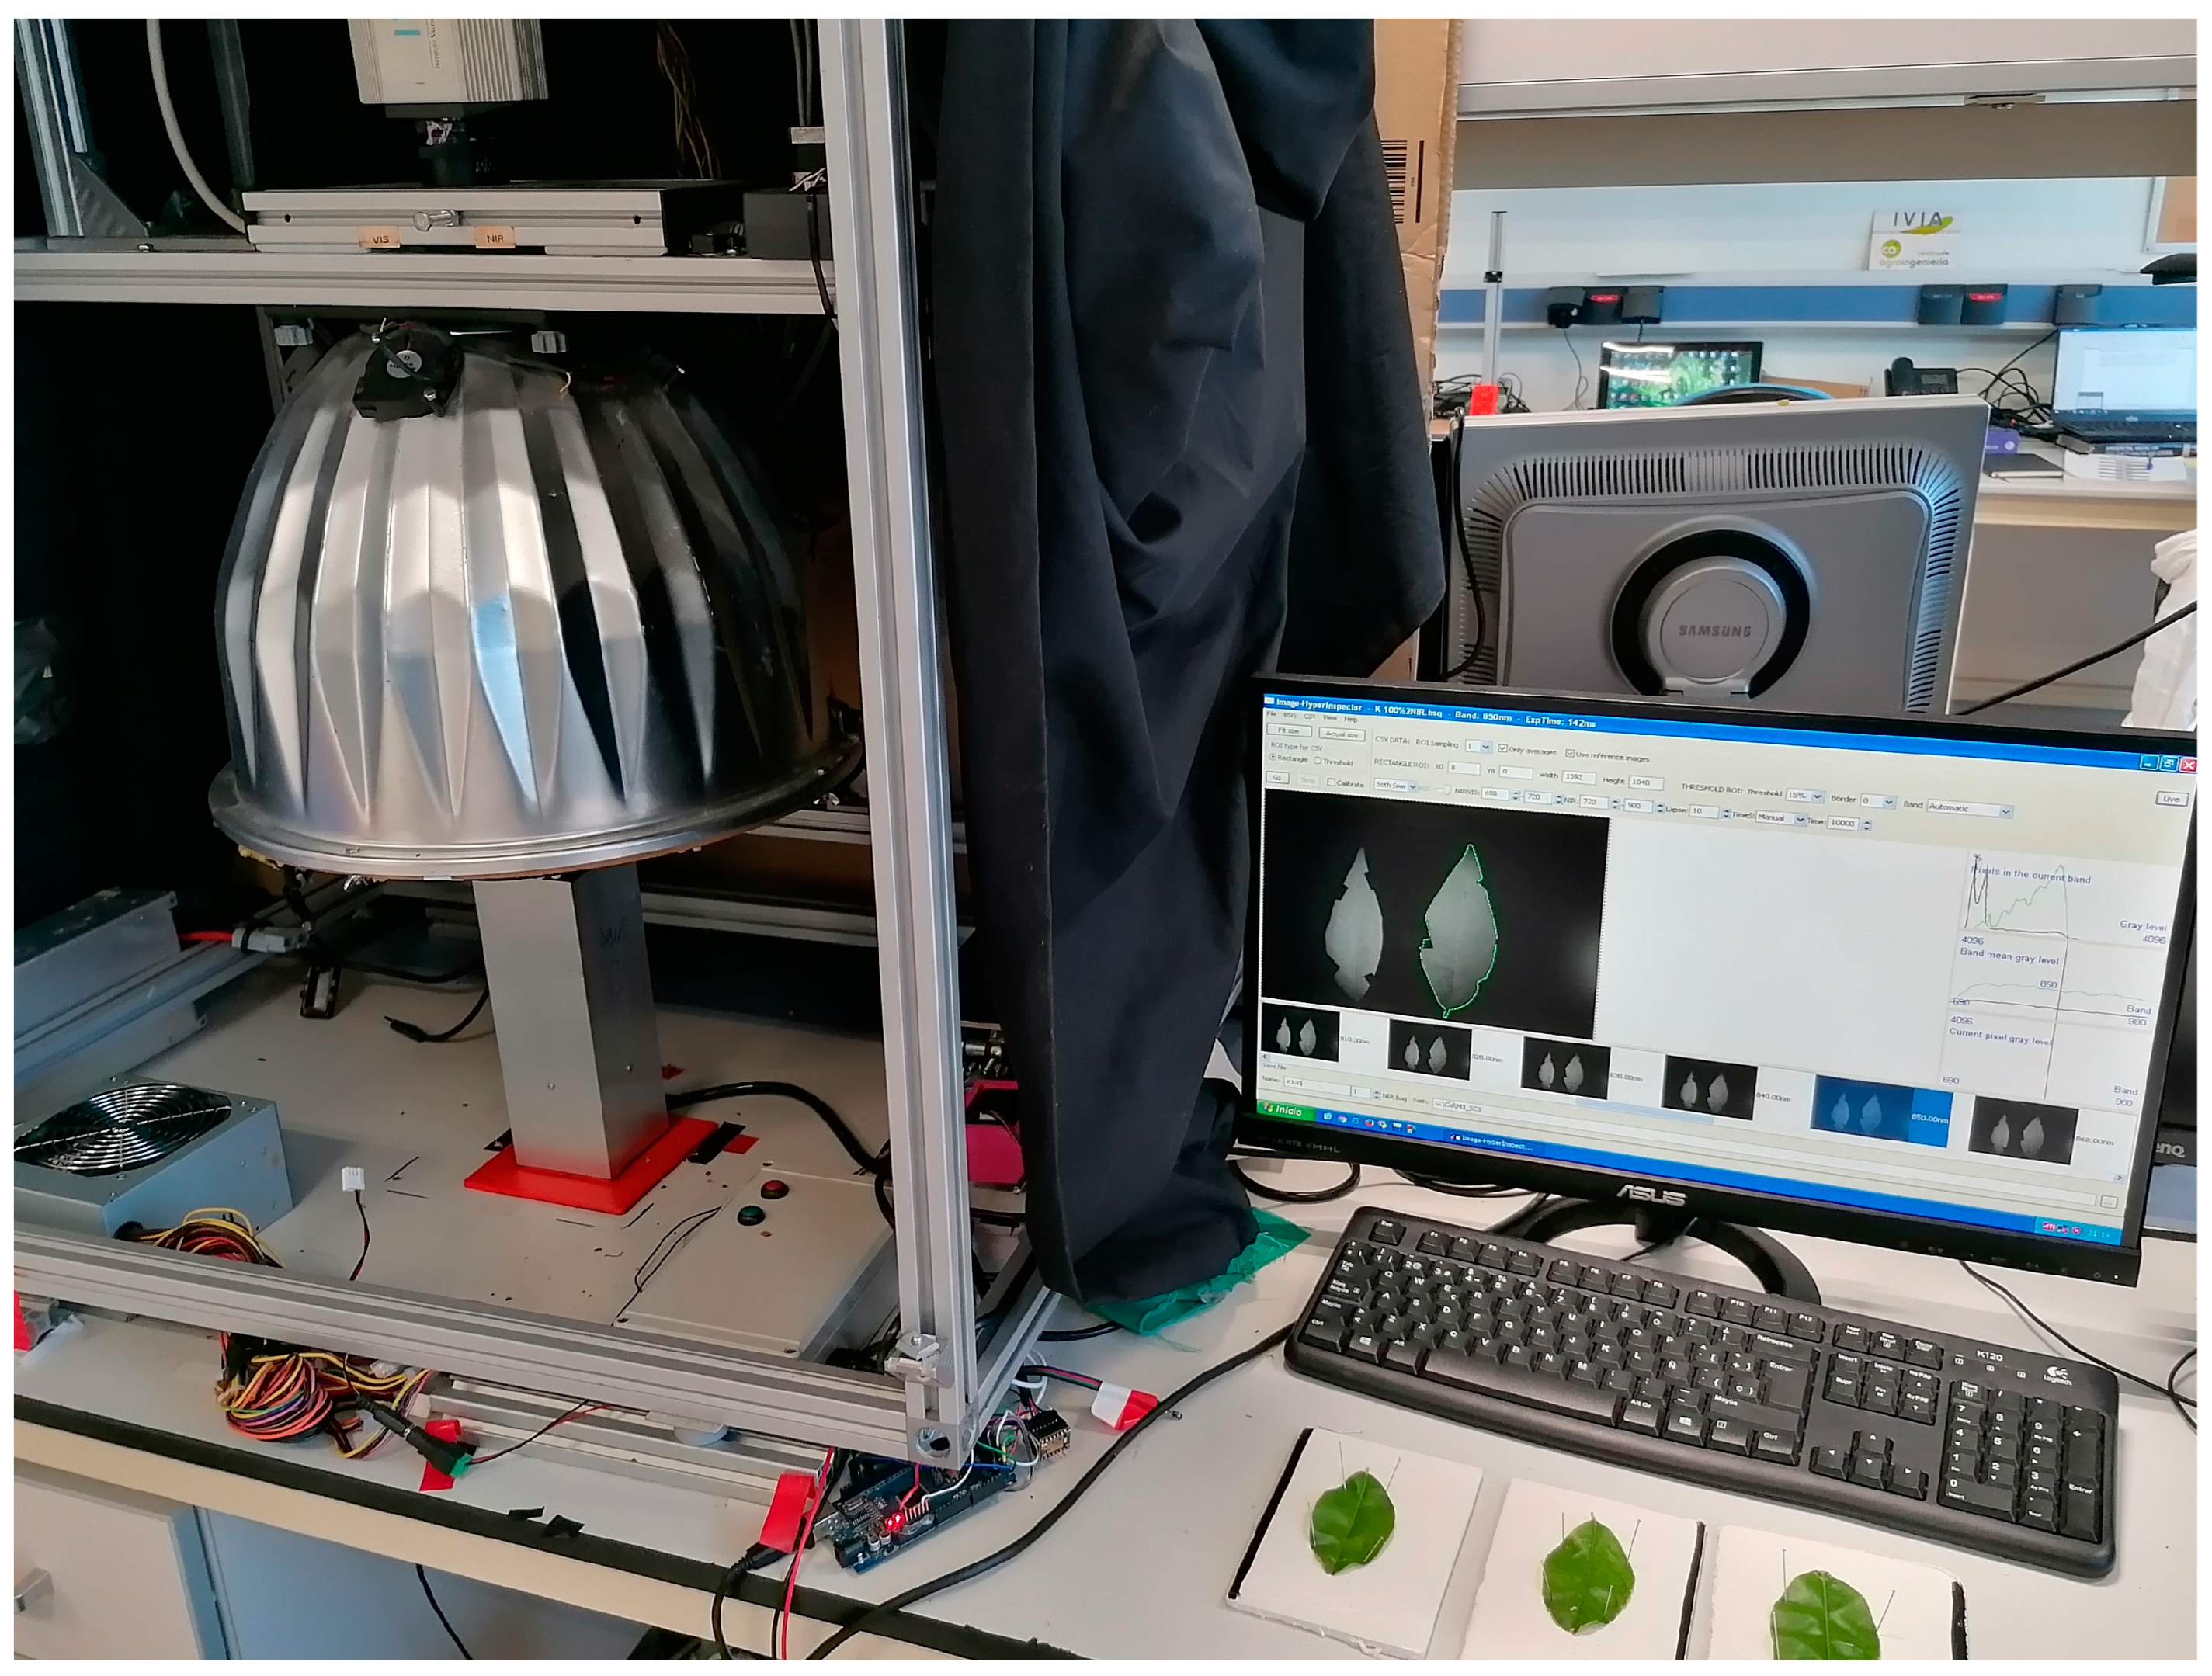
2.2. Spectral Measurements of the Leaves

The hyperspectral images were acquired with an industrial camera (CoolSNAP ES, Photometrics, AZ, USA) coupled with two tunable liquid crystal filters (Varispec VIS-07 and NIR-07, Cambridge Research & Instrumentation, Inc., Hopkinton, MA, USA). The camera was configured to acquire images with a size of 1392 × 1040 pixels and a spatial resolution of 0.14 mm/pixel in the operating spectral range of 500–980 nm in steps of 10 nm (49 bands). Each hyperspectral image acquisition captured with this configuration required 40 s. To optimise the dynamic range of the camera, avoid saturated images and correct the spectral sensitivity of the different elements of the system, a calibration of the integration time of each band was performed, capturing the average grey level of a reference white (Spectralon 99%, Labsphere, Inc., North Sutton, NH, USA). Calibration was performed with a threshold of 1%. Hyperspectral images were taken of these 6 leaves (one image per leaf), resulting in 144 images of leaves. The scene was illuminated with indirect light from twelve halogen bulbs (37 W) (Eurostar IR Halogen MR16. Ushio America, Inc., CA, USA) arranged inside a hemispherical aluminium diffuser (Figure 1).
Images were corrected using white and dark references. Dark was captured by switching off the lamps and covering the lens with a cap to prevent light from infiltrating the camera. The correction was performed using Equation (1):
II0Idark/IwhiteIdark
where I0 is the raw image that was acquired of the leaf, Iwhite is the image of the standard white reference and Idark is the image of the dark reference.

2.3. Ionomic Leaf Analysis

The leaves were dried in an oven (Selecta, Dry big, Spain) at 65 °C for a minimum of 72 h until a constant weight was reached. They were then crushed with a refrigerated grinder (IKA M20, Germany) and stored at 4 °C until later analysis to quantify the concentration of the nutrients. For foliar ionomic analysis, the nutrients were extracted from the solid samples using microwave-assisted acid digestion (ETHOS UP, Milestone Srl, Sorisole, Italy). To this end, 0.200 g of the crushed samples were weighed with a precision of ±0.003 g, and 4 mL of Milli Q water plus 4 mL of nitric acid (HNO3) and 2 mL of hydrogen peroxide (H2O2), were added to each sample. The samples with the added reagents were allowed to stand for 15 to 20 min. In the extracted solution, macro- and micronutrients were determined using an atomic emission spectrometer with inductively coupled plasma (iCAP 7000, Thermo Scientific, Barcelona, Spain). The Kjeldahl method (Kjeltec 8200, FOSS Iberia, S.A., Barcelona, Spain) was used for organic N [19].

2.4. Data Analysis

Leaf nutrient concentrations determined using the conventional laboratory analyses were taken as the reference for building the nutrient estimation models based on spectral information. Descriptive statistics (mean, standard deviation, minimum and maximum, median, first and third quartiles, skewness, kurtosis and coefficient of variation) were obtained from the samples used in the experiments.
During the acquisition of hyperspectral images, undesired effects caused by electromagnetic noise, equipment sensitivity and changes in temperature and illumination may occur. Another aspect that adversely affects the measurements is the scattering of the incident radiation due to the texture of the sample or changes in the refractive index of the material, causing unwanted variations in spectral reflection [8]. These effects can be minimised using pre-processing operations. Five pre-processing procedures were used in this study: mean centring (MC), which consists of centring each variable by subtracting the mean of all the elements, SG smoothing [20] to reduce random noise and increase the signal-to-noise ratio and SNV, which corrects the spectra for changes in optical path length and light scattering. After SNV correction, all spectra have a mean of 0 and a standard deviation of 1 [21]. First and second derivatives were used to eliminate constant baseline shifts and shifts that vary in a linear manner with wavelength, respectively [22].
A table was created for each nutrient studied, in which each sample was arranged in rows, and the columns showed the reflectance value at each wavelength (X variables). A final column was added with the reference value of the nutrient obtained from the ionomic analysis. These tables were used to build the predictive models. Data were split into two sets: a training set composed of 75% (515) of the samples used for calibration and cross-validation (CV), and a testing set consisting of the remaining 25% (172) of the samples used for independent external validation.
Partial least square (PLSR) is a classical linear modelling method applied to many fields, including nutrient estimation from spectral data [23]. Its primary role is to extract the principal components from independent variables with synthetic consideration of the dependent variables and establish a regression model between the optimal principal components and the dependent variables [24]. In this work, the predictor variables were the wavelengths, while the response variables were the concentrations given by the ionomic analysis. CV was applied to determine the optimum number of factors in the PLS-R model and estimate the uncertainty in the training set [25]. To avoid possible overfitting of the PLSR model, the number of PLS-R factors retained in each final model was chosen to maximise the R2 and to minimise the root mean square error prediction (RMSE). R2 is a measure of goodness-of-fit that represents the level of explained variability of the model, the remaining variation being attributed to random error. In contrast, RMSE measures the differences between the predicted and measured values and quantifies the accuracy by comparing the prediction errors of different models. Therefore, the performance of the models was evaluated in terms of the R2 and the RMSE in the independent test set. Statistical tests were performed using The Unscrambler X V9.7 (Camo Software, Oslo, Norway).
Several methods can be combined with PLS to obtain the most relevant subset of bands that retain the most valuable information and with the smallest errors. Among them is the competitive adaptive reweighted sampling method (CARS), which can select the variables with large coefficients in a multivariate linear regression model (MLR), and the successive projections algorithm (SPA) employs simple projection to select variables with a minimum of collinearity. On the other hand, Uninformative Variable Elimination (UVE) is a variable elimination method that is repeated as long as the RMSE of cross-validation (RMSECV) decreases [26]. However, UVE removes uninformative variables, not necessarily the most important ones, and may eliminate important variables if they are highly correlated with other variables. VIP (Variable Importance in Projection) is a popular method for variable selection in multivariate statistical models and detects small changes in the data. VIP measures both correlation and contribution of variables to the model based on the scores achieved and provides a variable importance ranking for model interpretation [27]. Therefore, the wavelengths with the highest importance were selected using this method. VIP scores are calculated as the weighted sum of squares as a product of the variance explained by the model and give an estimate of the importance of each variable (i.e., wavelength) in the latent variable model [28]. A VIP score higher than 1 was set to indicate essential bands [29]. This step was performed using the statistical software ParLeS [30]. To obtain the minimum number of bands that maximises the result, the evolution of the prediction success rate was studied as a function of the number of selected bands. First, R2 was obtained using the band with the highest VIP score on the independent test set. Then, models based on PLS-R were created iteratively, with one more band being included in the model based on its VIP score and the R2 being obtained until a maximum of 20 bands were acquired.

3. Results and Discussion

3.1. Foliar Nutrient Concentration

Table 2 shows the basic statistics obtained from ionomic analyses of all nutrients for the leaves sampled during all the experiments. In addition, the results are highlighted for the samples collected in July, as this month is stated as being one of the most suitable ones for the foliar sampling of ‘Rojo Brillante’ persimmons for nutritional diagnosis. The values obtained can be considered within the normal ranges for this crop in Valencia (Spain), with the exception of the values of the concentrations of Zn and B, which showed values below the reference values [1].

3.2. Predictive Analyses

Table 3 shows the results of the PLS-R models acquired for each nutrient using the best pre-processing technique. The best result for the test set was achieved for the prediction of N (R2 = 0.80) using MC + 1D pre-treatments, with an RMSEP of 0.16. Additionally, for K (R2 = 0.66) and P (R2 = 0.62), relatively good values were obtained with low RMSEP values. The best prediction for P was achieved using raw spectra, while the best performance for K was achieved using MC.
For micronutrients, B showed an R2 of 0.69, with a relatively low RMSEP. Other nutrients, especially micronutrients, achieved poorer results, as was the case of Cu, Mn, Zn and Na.

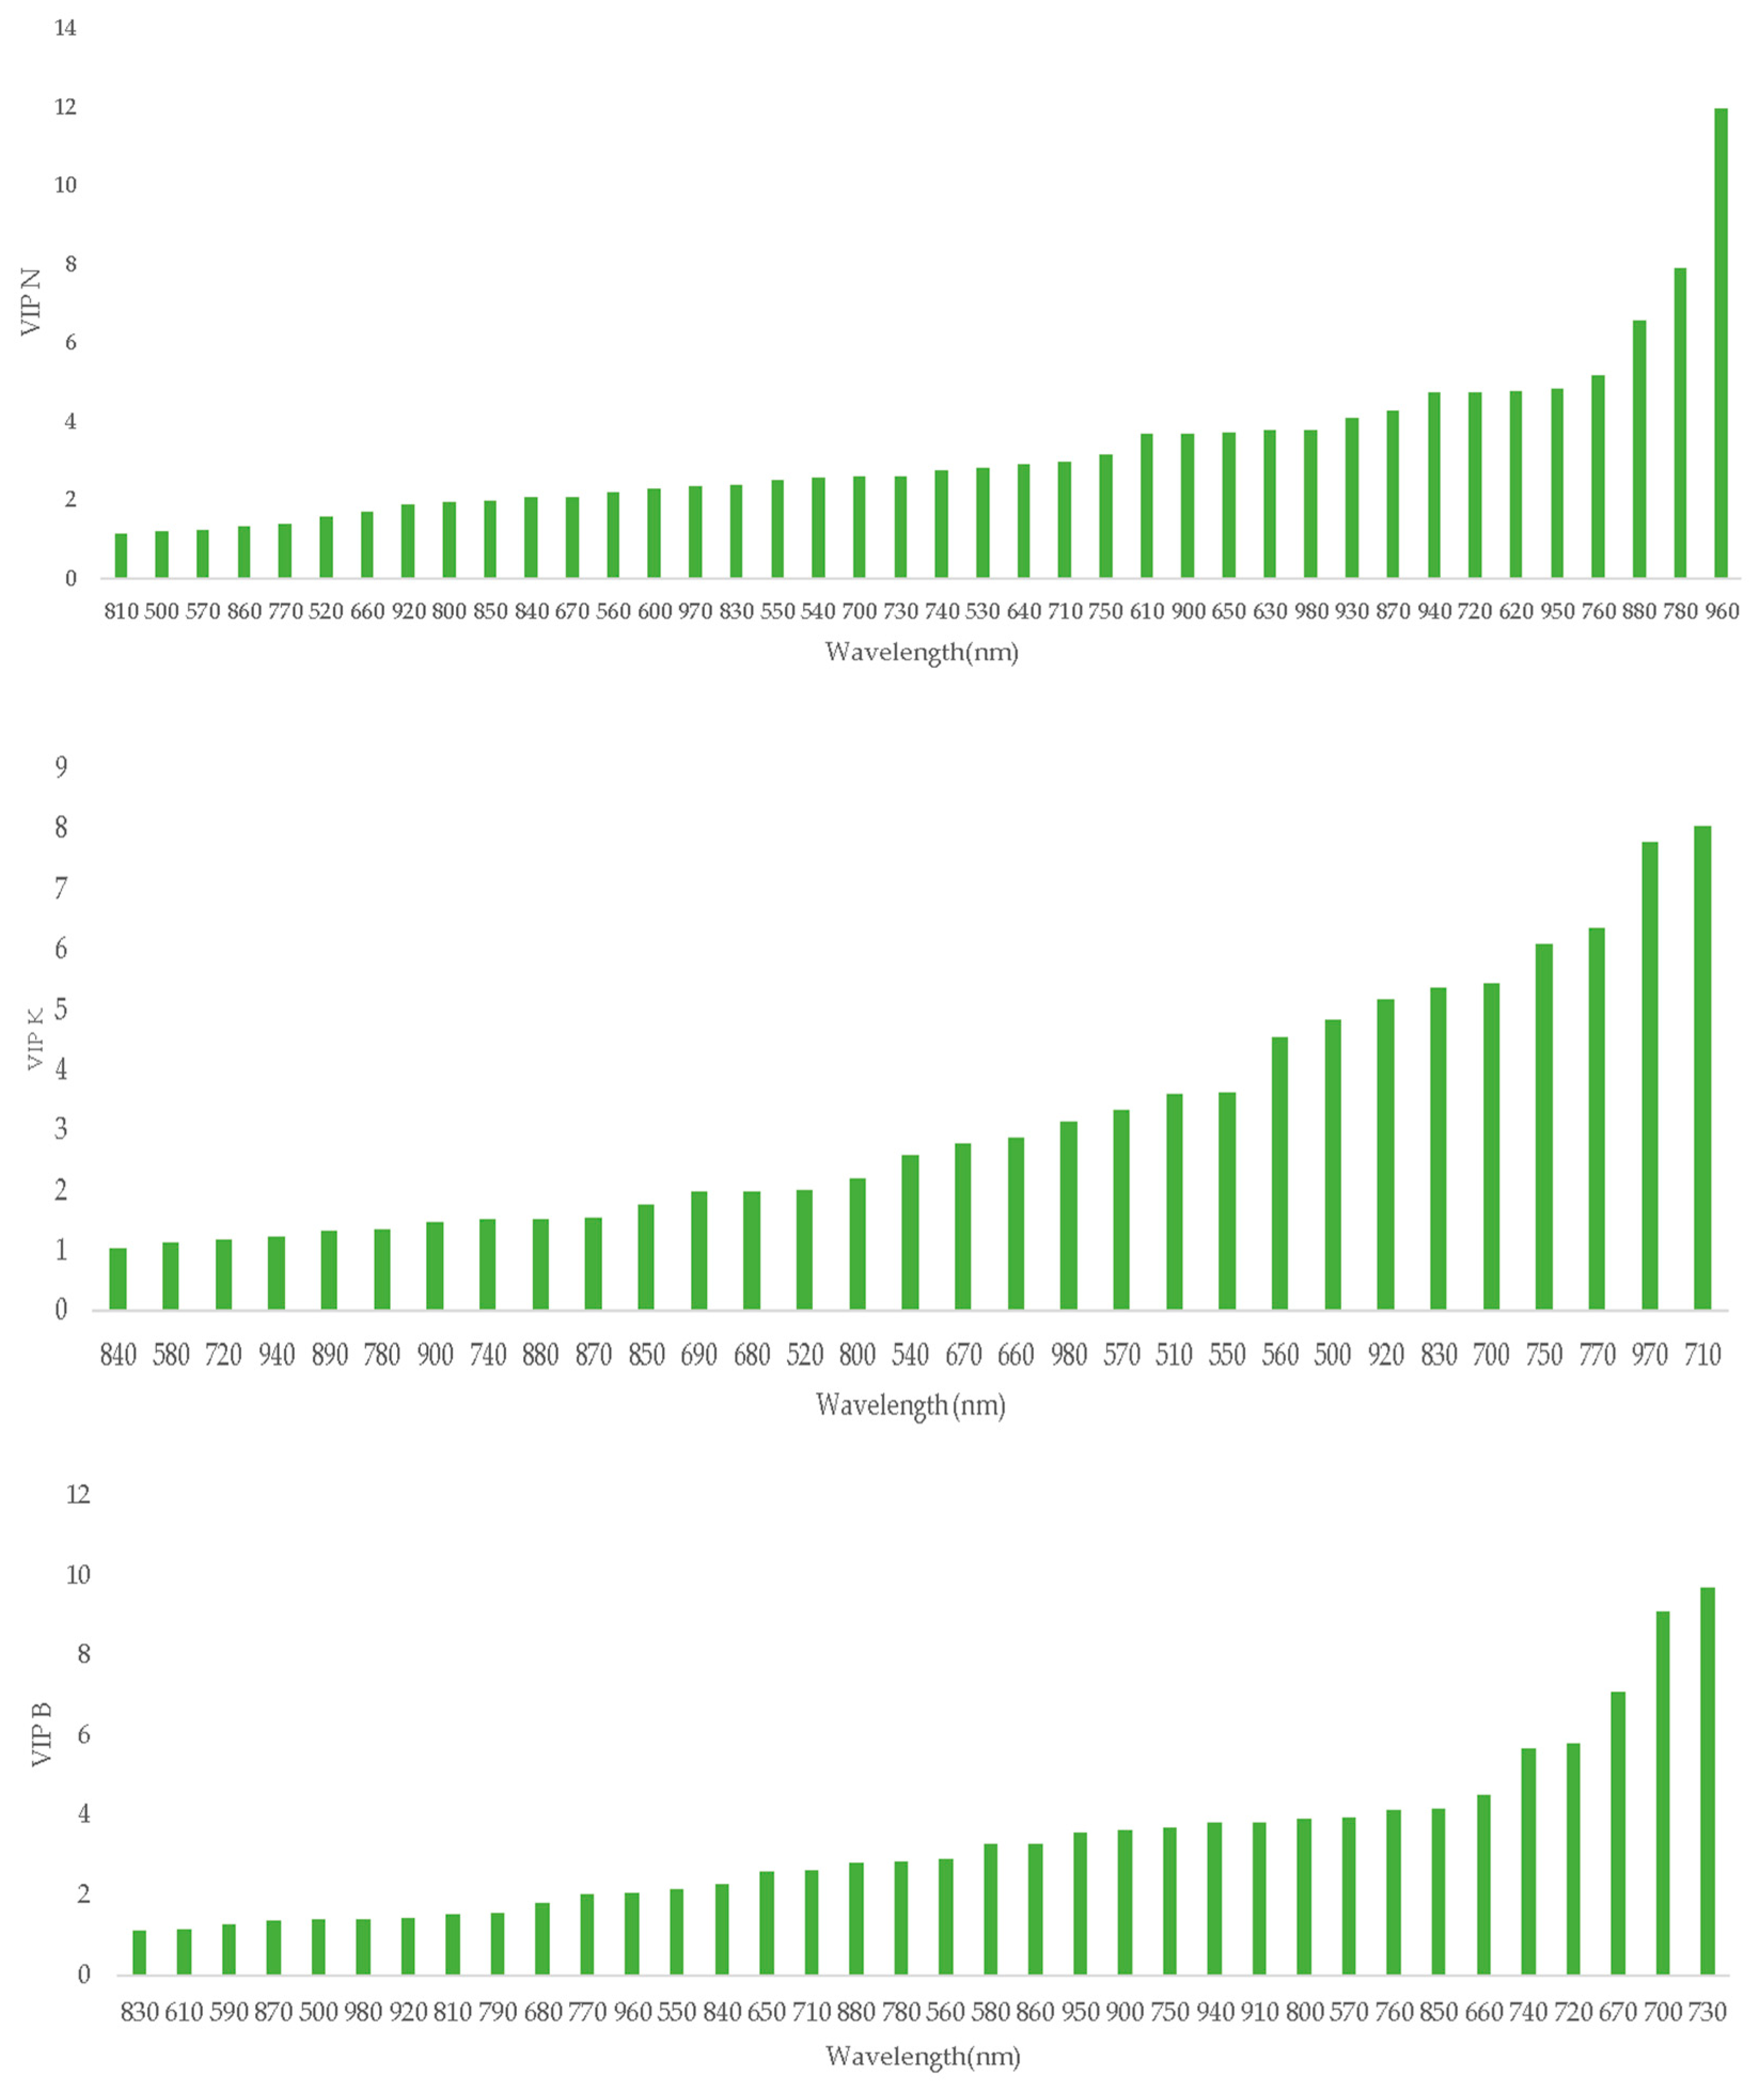
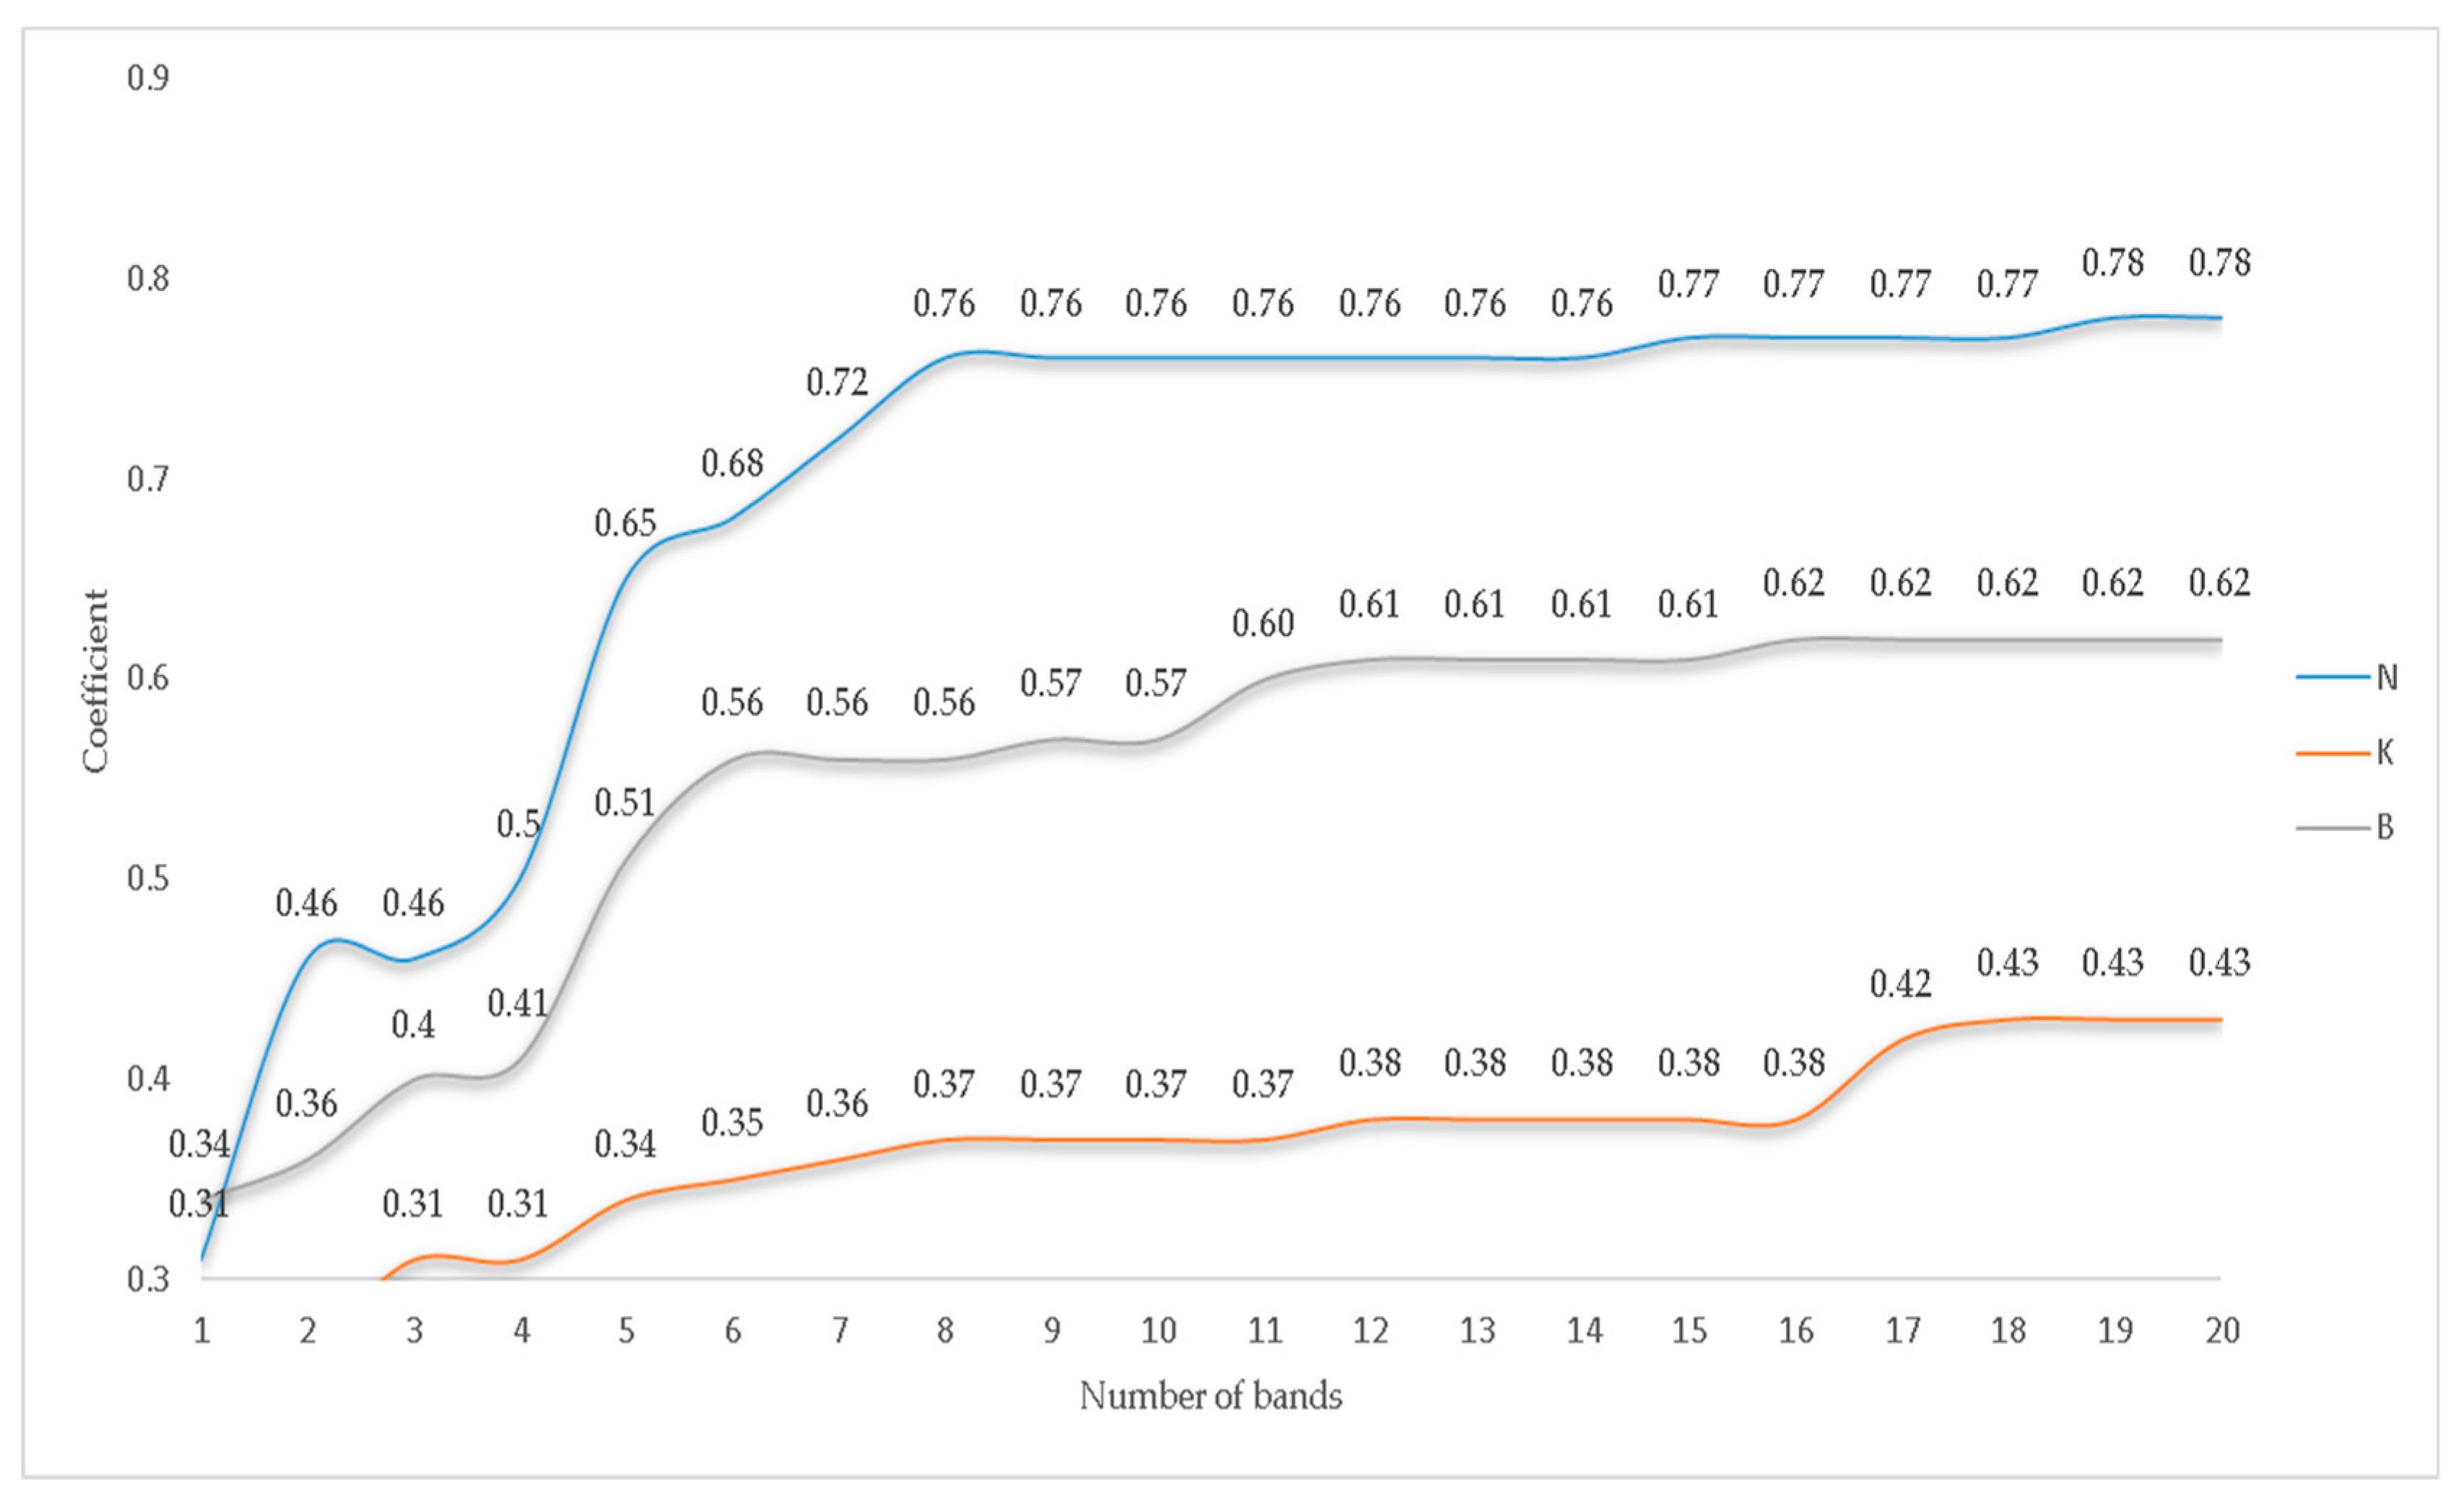
3.3. Selection of Optimal Wavelengths

The most important bands were selected for those nutrients with the highest results (R2 > 0.65) in Table 3, which were N, K and B. A method based on the VIP scores was used to select the most important bands to predict the concentration of these nutrients. Figure 2 shows the bands with a VIP score higher than 1 for N (40 bands), K (32 bands) and B (36 bands).
To select the minimum number of important bands capable of predicting the concentration of each nutrient, successive models were created, starting with the single band with the highest VIP score and increasing the number of bands iteratively. Figure 3 shows the R2 achieved for each number of bands used in the model. Considering the evolution of the R2, the number of bands selected for N was set to 8, the number of bands for B was 11, while for K, 17 bands were selected.
Table 4 shows the results achieved using only the selected variables. In general, the results for N and B were slightly lower than those obtained using the entire spectrum, which indicates that using only a small set of variables is enough to make accurate estimations. The estimation of N using 8 bands out of 49 achieved an R2 of 0.76 and an RMSE of 0.18 for the test set in this case using MC as the pre-treatment, which is similar to that obtained using the entire spectrum. Furthermore, B could also be modelled with the 11 wavelengths selected, with an R2 of 0.61 and an RMSE of 10.42, which were achieved using MC. However, for K, an R2 of only 0.43 was reached with the bands chosen, which is lower than that when the whole spectrum is used, and therefore, it was considered that a reduced number of bands could not be selected to make a relatively accurate prediction.

3.4. Discussion

In this study, we tested the potential of reflectance spectroscopy to non-destructively characterise nutrient prediction in plants. Specifically, the relevant points of this study were to assess the use of hyperspectral images to detect and predict the concentration of nutrients in persimmon leaves by developing models based on PLSR. Macro- and micronutrients of persimmon leaves were assessed using Vis/NIR hyperspectral imaging using PLS-R to obtain correlations with the concentrations determined by destructive ionomic analyses. The best prediction was achieved for macronutrients. Specifically, this was achieved using the MC + 1D pre-treatment for N, with R2 = 0.80 in the test set. These results are consistent with those of other studies that achieved similar coefficients or determination for the estimation of N content in other woody crops [31] using PLS-R. Ye et al. [32] obtained an R2 of 0.77 for predicting the N content in apple leaves using hyperspectral imaging and PLS-R. Additionally, Malmir et al. [33] obtained an R2 of 0.76 for predicting N and P contents in cacao leaves, while Zhang et al. [14] reported an R2 of 0.71 for rapeseed in the 380–1030 nm range.
A good estimation model was obtained in the test set with an R2 = 0.68 and a relatively low RMSE, which is similar to Abenina et al. [34], who obtained an R2 = 0.67 for peach leaves. Zhang et al. [14] predicted the K content in fresh rapeseed leaves with an R2 = 0.75. In addition, the results are superior to those obtained by Malmir et al. [33] in cacao leaves, only reaching an R2 = 0.35 in CV using both the whole spectrum and selected wavelengths. The PLS-R model developed for Ca only reached an R2 of 0.54 and RMSE = 0.77. However, they obtained a better result for cacao leaves with a higher accuracy of R2 = 0.76 using CV. For S and Na, the PLS-R performed worse with R2 = 0.37 and 0.27, respectively.
Regarding micronutrients, the B content was the best predicted one, with R2 = 0.69 and RMSE of 9.59. Similar results were found by de Oliveira and Santana [35], who achieved an R2 of 0.68 in the 500–790 nm range for eucalyptus leaves. For the other micronutrients, the predictive capacity was lower (R2 < 0.34). This could be due to several reasons, such as the relatively low concentration of micronutrients that could be due to the sensitivity of the equipment used, the low variation range of some micronutrients such as Cu or Zn, or that other spectral ranges must be used to detect these elements. Pandey et al. [9] obtained better results, but in the range from 550 to 1700 nm. However, the results were lower than they were, for macronutrients.
De Silva et al. [36] reported better results for Cu, Mn and Zn, while they were similar for Na. However, their results are very different between CV and P sets. In some cases, especially for micronutrients, the results achieved using leave-one-out (LOO) CV were much lower than those achieved using the prediction set, and this fact is not explained considering that LOO-CV uses the whole dataset for model fitting, so the expected results should be, at least, similar. Moreover, this work was conducted on macadamia, where the concentration of some micronutrients is very different from that of persimmons. For instance, the concentrations found for Cu in our study varied from 3 to 9 mg/kg, while, in the study on macadamia, the concentrations varied from 3 to 62 mg/kg, which could explain to achieve better correlations. The same happens with the other micronutrients. Moreover, the RMSE values were relatively large, while the RPD was relatively low. Oliveira and Santana [35] achieved better results, who obtained R2 values for eucalyptus leaves of 0.78, 0.79, and 0.31 for Cu, Mn and Zn, respectively. However, only results using CV and not any independent test set were provided, and the RMSE is not shown. As in the case of [35], the concentrations found for micronutrients were much larger in eucalyptus than they were in persimmons. For example, in the case of Mn, the values of the eucalyptus leaves ranged from 288 to 4096 mg/kg, while in persimmons, they were between 32 and 295 mg/kg.
The selection of the important bands performed for the nutrients with the highest R2 gave similar results for N and B. However, no selection was possible for K. So, in general, the entire spectrum is needed to achieve the best performance of this technique.
Hyperspectral imaging has limitations for its use in the open field regarding other spectral methods such as portable spectrophotometers or specific devices such as chlorophyll meters. However, they also have several advantages, such as the possibility of being transported on agricultural vehicles or robots to collect images from entire plants and give precise diagnostics of the plot. Therefore, further work is needed to transfer the proposed approach from the laboratory settings to protected agrosystems and open field conditions, which is essential for the practical application of this technology [37,38].

4. Conclusions

The nutrient concentration in persimmon leaves was estimated by Vis/NIR hyperspectral imaging in the 500 to 980 nm range using partial least squares regression. The macronutrients studied included N, P, K, Ca, Mg, Na and S, while the microelements were Fe, Cu, Mn, Zn and B. The elements that achieved a satisfactory level of prediction were N, P, K and B in all cases with an R2 higher than 0.62.
Using a method based on the VIP scores, a selection of essential wavelengths was carried out for the nutrients that achieved predictions with an R2 higher than 0.65, which were N, K and B. Initially, bands with a VIP score greater than one were selected. However, this resulted in the selection of too many bands; so, models were made to calculate the R2, starting with only the wavelength with the highest VIP score and successively adding the rest of the bands with the highest VIP scores. Based on the R2 achieved, a total of 8, 11 and 17 bands were selected for N, B and K, respectively. However, in the case of K, the results indicated that the entire spectrum was necessary to make more accurate predictions.
The results indicate that a non-destructive technique such as Vis/NIR hyperspectral imaging is a promising alternative for nutritional diagnostics of persimmon leaves under laboratory conditions as a preliminary step to performing nutritional diagnostics in the field. This would be the first work on persimmon cultivation using hyperspectral imaging technology to predict nutrients. It is confirmed that reflectance spectroscopy can successfully characterise nutrient determination and provide detailed information on each nutrient of interest for plant performance.

Author Contributions

Conceptualisation, A.Q., J.B. and M.A.; methodology A.Q., J.M.d.P., J.B. and M.A.; software I.R.-C. and M.A.; validation, I.R.-C. and M.A.; formal analysis, A.Q., J.B. and M.A.; investigation, A.Q., J.M.d.P., J.B. and M.A.; resources, A.Q. and J.B.; data curation, J.B.; writing original draft preparation, M.A.; writing—review and editing, A.Q., J.M.d.P. and J.B.; supervision A.Q., J.M.d.P. and J.B.; funding acquisition, A.Q. and J.B.; All authors have read and agreed to the published version of the manuscript.

Funding

This work is co-funded by MICIN-AEI through project TED2021-130117B-C31, GVA-IVIA through projects 52203 and 52204, and the EU through the European Regional Development Fund (ERDF) of the Generalitat Valenciana 2021–2027.

Institutional Review Board Statement

Not applicable.

Informed Consent Statement

Not applicable.

Data Availability Statement

Not applicable.

Conflicts of Interest

The authors declare no conflict of interest.

References

  1. Albiach, R.; Climent, C.; Canet, R.; Pomares, F. Soil Fertility and Nutritional State of Persimmon Rojo Brillante Plantations in the Ribera Alta (Valencia, Spain). Commun. Soil Sci. Plant Anal. 2012, 43, 2767–2776. [Google Scholar] [CrossRef]
  2. FAOSTAT. «FAOSTAT, 2017». Available online: https://www.fao.org/faostat/en/#home (accessed on 13 April 2023).
  3. Kirkby, E. Introduction, Definition and Classification of Nutrients; Elsevier Ltd.: Amsterdam, The Netherlands, 2011. [Google Scholar] [CrossRef]
  4. Hawkesford, M.; Horst, W.; Kichey, T.; Lambers, H.; Schjoerring, J.; Møller, I.S.; White, P. Functions of Macronutrients. In Marschner’s Mineral Nutrition of Higher Plants, 3rd ed.; Elsevier Inc.: Amsterdam, The Netherlands, 2011; pp. 135–189. [Google Scholar] [CrossRef]
  5. Broadley, M.; Brown, P.; Cakmak, I.; Rengel, Z.; Zhao, F. Function of Nutrients: Micronutrients. In Marschner’s Mineral Nutrition of Higher Plants, 3rd ed.; Elsevier Inc.: Amsterdam, The Netherlands, 2011; pp. 191–248. [Google Scholar] [CrossRef]
  6. Malagón, J.; Monzó, J.C. Diseño de la plantación de caqui y su manejo en los primeros años del cultivo. Agrícola Vergel Frutic. Hortic. Floric. 2015, 34, 61–67. [Google Scholar]
  7. Cubero, S.; Marco-noales, E.; Aleixos, N.; Barbé, S.; Blasco, J. Robhortic: A field robot to detect pests and diseases in horticultural crops by proximal sensing. Agriculture 2020, 10, 276. [Google Scholar] [CrossRef]
  8. Walsh, K.B.; Blasco, J.; Zude-Sasse, M.; Sun, X. Visible-NIR ‘point’ spectroscopy in postharvest fruit and vegetable assessment: The science behind three decades of commercial use. Postharvest Biol. Technol. 2020, 168, 111246. [Google Scholar] [CrossRef]
  9. Pandey, P.; Ge, Y.; Stoerger, V.; Schnable, J.C. High throughput in vivo analysis of plant leaf chemical properties using hyperspectral imaging. Front. Plant Sci. 2017, 8, 1348. [Google Scholar] [CrossRef]
  10. Lorente, D.; Aleixos, N.; Gómez-Sanchis, J.; Cubero, S.; García-Navarrete, O.L.; Blasco, J. Recent Advances and Applications of Hyperspectral Imaging for Fruit and Vegetable Quality Assessment. Food Bioprocess Technol. 2012, 5, 1121–1142. [Google Scholar] [CrossRef]
  11. Peron-Danaher, R.; Russell, B.; Cotrozzi, L.; Mohammadi, M.; Couture, J. Incorporating Multi-Scale, Spectrally Detected Nitrogen Concentrations into Assessing Nitrogen Use Efficiency for Winter Wheat Breeding Populations. Remote Sens. 2021, 13, 3991. [Google Scholar] [CrossRef]
  12. Gómez-Casero, M.T.; López-Granados, F.; Peña-Barragán, J.M.; Jurado-Expósito, M.; García-Torres, L.; Fernández-Escobar, R. Assessing Nitrogen and Potassium Deficiencies in Olive Orchards through Discriminant Analysis of Hyperspectral Data. J. Am. Soc. Hortic. Sci. 2007, 132, 611–618. [Google Scholar] [CrossRef]
  13. Jin, X.; Wang, L.; Zheng, W.; Zhang, X.D.; Liu, L.; Li, S.; Rao, Y.; Xuan, J. Predicting the nutrition deficiency of fresh pear leaves with a miniature near-infrared spectrometer in the laboratory. Meas. J. Int. Meas. Confed. 2022, 188, 110553. [Google Scholar] [CrossRef]
  14. Zhang, X.; Liu, F.; He, Y.; Gong, X. Detecting macronutrients content and distribution in oilseed rape leaves based on hyperspectral imaging. Biosyst. Eng. 2013, 115, 56–65. [Google Scholar] [CrossRef]
  15. Christensen, L.K.; Bennedsen, B.S.; Jørgensen, R.N.; Nielsen, H. Modelling nitrogen and phosphorus content at early growth stages in spring barley using hyperspectral line scanning. Biosyst. Eng. 2004, 88, 19–24. [Google Scholar] [CrossRef]
  16. Yanli, L.; Qiang, L.; Shaolan, H.; Shilai, Y.; Xuefeng, L.; Rangjin, X.; Yongqiang, Z.; Lie, D. Prediction of nitrogen and phosphorus contents incitrus leavesbased onhyperspectral imaging. Int. J. Agric. Biol. Eng. 2015, 8, 80–88. [Google Scholar]
  17. Li, D.; Wang, C.; Jiang, H.; Peng, Z.; Yang, J.; Su, Y.; Song, J.; Chen, S. Monitoring litchi canopy foliar phosphorus content using hyperspectral data. Comput. Electron. Agric. 2018, 154, 176–186. [Google Scholar] [CrossRef]
  18. Visconti, F.; de Paz, J.M. Non-destructive assessment of chloride in persimmon leaves using a miniature visible near-infrared spectrometer. Comput. Electron. Agric. 2019, 164, 104894. [Google Scholar] [CrossRef]
  19. Bremner, J.M. Inorganic forms of nitrogen. Agronomy 1965, 9, 1179–1237. [Google Scholar]
  20. Savitzky, A.; Golay, M.J.E. Smoothing and differentiation of data by simplified least squares procedures. Anal. Chem. 1964, 36, 1627–1639. [Google Scholar] [CrossRef]
  21. Barnes, R.J.; Dhanoa, M.S.; Lister, S.J. Standard Normal Variate Transformation and De-Trending of Near-Infrared Diffuse Reflectance Spectra. Appl. Spectrosc. 1989, 43, 772–777. [Google Scholar] [CrossRef]
  22. Li, Y.; Sun, Y.; Jiang, J.; Liu, J. Spectroscopic determination of leaf chlorophyll content and color for genetic selection on Sassafras tzumu. Plant Methods 2019, 15, 73. [Google Scholar] [CrossRef]
  23. Burnett, A.C.; Anderson, J.; Davidson, K.J.; Ely, K.S.; Lamour, J.; Li, Q.; Morrison, B.D.; Yang, D.; Rogers, A.; Serbin, S.P. A best-practice guide to predicting plant traits from leaf-level hyperspectral data using partial least squares regression. J. Exp. Bot. 2021, 72, 6175–6189. [Google Scholar] [CrossRef]
  24. Geladi, P.; Kowalski, B.R. Partial least-squares regression: A tutorial. Anal. Chim. Acta 1986, 185, 1–17. [Google Scholar] [CrossRef]
  25. Stone, M.; Brooks, R.J. Continuum Regression: Cross-Validated Sequentially Constructed Prediction Embracing Ordinary Least Squares, Partial Least Squares and Principal Components Regression. J. R. Stat. Soc. Ser. B (Methodol.) 1990, 52, 237–258. [Google Scholar] [CrossRef]
  26. Tang, G.; Huang, Y.; Tian, K.; Song, X.; Yan, H.; Hu, J.; Xiong, Y.; Min, S. A new spectral variable selection pattern using competitive adaptive reweighted sampling combined with successive projections algorithm. Analyst 2014, 139, 4894. [Google Scholar] [CrossRef] [PubMed]
  27. Chong, I.G.; Jun, C.H. Performance of some variable selection methods when multicollinearity is present. Chemom. Intell. Lab. Syst. 2005, 78, 103–112. [Google Scholar] [CrossRef]
  28. Sorochan Armstrong, M.D.; de la Mata, A.P.; Harynuk, J.J. Review of Variable Selection Methods for Discriminant-Type Problems in Chemometrics. Front. Anal. Sci. 2022, 2, 867938. [Google Scholar] [CrossRef]
  29. Stoessel, D.; Stellmann, J.P.; Willing, A.; Behrens, B.; Rosenkranz, S.C.; Hodecker, S.C.; Stürner, K.H.; Reinhardt, S.; Fleischer, S.; Deuschle, C.; et al. Metabolomic Profiles for Primary Progressive Multiple Sclerosis Stratification and Disease Course Monitoring. Front. Hum. Neurosci. 2018, 12, 226. [Google Scholar] [CrossRef]
  30. Viscarra Rossel, R.A. ParLeS: Software for chemometric analysis of spectroscopic data. Chemom. Intell. Lab. Syst. 2008, 90, 72–83. [Google Scholar] [CrossRef]
  31. Petisco, C.; García-Criado, B.; Vázquez de Aldana, B.R.; Zabalgogeazcoa, I.; Mediavilla, S.; García-Ciudad, A. Use of near-infrared reflectance spectroscopy in predicting nitrogen, phosphorus and calcium contents in heterogeneous woody plant species. Anal. Bioanal. Chem. 2005, 382, 458–465. [Google Scholar] [CrossRef]
  32. Ye, X.; Abe, S.; Zhang, S. Estimation and mapping of nitrogen content in apple trees at leaf and canopy levels using hyperspectral imaging. Precis. Agric. 2020, 21, 198–225. [Google Scholar] [CrossRef]
  33. Malmir, M.; Tahmasbian, I.; Xu, Z.; Farrar, M.B.; Bai, S.H. Prediction of macronutrients in plant leaves using chemometric analysis and wavelength selection. J. Soils Sediments 2020, 20, 249–259. [Google Scholar] [CrossRef]
  34. Abenina, M.I.A.; Maja, J.M.; Cutulle, M.; Melgar, J.C.; Liu, H. Prediction of Potassium in Peach Leaves Using Hyperspectral Imaging and Multivariate Analysis. AgriEngineering 2022, 4, 400–413. [Google Scholar] [CrossRef]
  35. de Oliveira, L.F.R.; Santana, R.C. Estimation of leaf nutrient concentration from hyperspectral reflectance in Eucalyptus using partial least squares regression. Sci. Agric. 2020, 77. [Google Scholar] [CrossRef]
  36. De Silva, A.L.; Trueman, S.J.; Kämper, W.; Wallace, H.M.; Nichols, J.; Hosseini Bai, S. Hyperspectral Imaging of Adaxial and Abaxial Leaf Surfaces as a Predictor of Macadamia Crop Nutrition. Plants 2023, 12, 558. [Google Scholar] [CrossRef] [PubMed]
  37. Cotrozzi, L.; Peron, R.; Tuinstra, M.R.; Mickelbart, M.V.; Couture, J.J. Spectral Phenotyping of Physiological and Anatomical Leaf Traits Related with Maize Water Status. Plant Physiol. 2020, 184, 1363–1377. [Google Scholar] [CrossRef]
  38. Cotrozzi, L.; Couture, J.J. Hyperspectral assessment of plant responses to multi-stress environments: Prospects for managing protected agrosystems. Plants People Planet 2020, 2, 244–258. [Google Scholar] [CrossRef]
Figure 1. Acquisition of the hyperspectral imaging of the leaves.
Agriculture 13 00916 g001
Figure 2. Wavelengths VIP scores higher than 1 for N (top), K (middle) and B (bottom).
Agriculture 13 00916 g002
Figure 3. Coefficient R2 obtained by the models as a function of the number of bands used for N, K and B.
Agriculture 13 00916 g003
Table 1. Fertiliser doses (kg/ha) for each treatment.
TreatmentNK2OP2O3CaOMgO
T1 (N-0%)011038.862.525.3
T2 (N-33%)3511038.862.525.3
T3 (N-50%)5311038.862.525.3
T4 (K2O-0%)106038.862.525.3
T5 (K2O-50%)1065538.862.525.3
Control (N and K2O-100%)10611038.862.525.3
Table 2. Ionomic analysis of the persimmon leaves. Concentrations are expressed in g/100 g for macronutrients (N, P, K, Ca, Mg, S and Na) and mg/kg for micronutrients (Fe, Zn, Mn, B and Cu) based on the weight of dry matter.
NutrientAverage
Cycle
Standard DeviationCoefficient
of Variation
JulyCycleRangeStd BiasKurtosis
Min–MaxMin–Max
N1.740.390.221.62–2.301.06–2.821.752.481.09
P0.110.060.550.13–0.300.04–0.300.268.875.6
K1.940.530.281.08–2.300.83–2.962.130.712.53
Ca2.71.410.520.30–2.110.30–6.526.220.810.17
Mg0.50.20.390.17–0.580.17–0.950.780.681.26
S0.180.040.210.20–0.250.11–0.290.181.941.41
Na0.010.010.790.01–0.060.005–0.060.075.734.16
Fe39.5215.450.3931.00–69.0013.22–81.7768.543.361.36
Zn6.622.910.444.00–14.002.02–15.6813.663.790.32
Mn181.0772.920.432.00–118.0032.81–295.02262.212.662.27
B48.7622.890.4712.00–26.0012.18–102.1089.920.062.49
Cu3.481.530.444.00–9.001.33–8.977.645.071.80
Table 3. Comparative statistics for the calibration, cross-validation and test sets of the model generated by PLS-R for essential nutrients using all wavelengths.
NutrientPre-TreatmentLVCalibrationCross-ValidationTest
RMSECR2RMSECVR2RMSEPR2
NMC + 1D60.140.840.140.830.160.80
PRaw spectra50.010.690.010.680.010.62
KMean centre100.880.680.900.640.830.67
CaRaw spectra120.680.650.730.600.770.54
MgRaw spectra110.110.650.110.600.120.58
SRaw spectra120.030.450.030.370.030.37
NaRaw spectra30.010.280.010.200.010.27
FeRaw spectra129.430.449.910.3810.320.34
ZnRaw spectra122.580.502.820.403.370.20
MnMC + SNV948.810.2451.450.1649.850.22
BMC118.690.729.340.709.590.69
CuMC + 1D60.840.310.890.230.930.24
Table 4. Results of PLS-R using the selected bands for N and B.
NutrientWavelengths (nm)Pre-Treatment* LVCalibrationCross-ValidationTest
RMSECR2RMSECVR2RMSEPR2
N620, 720, 760, 780, 880, 940, 950, 960MC30.160.790.170.770.180.76
B730, 700, 670, 720, 740, 660, 850, 760, 570, 800, 910MC510.120.6210.270.6210.420.61
* LV: latent variables.
Disclaimer/Publisher’s Note: The statements, opinions and data contained in all publications are solely those of the individual author(s) and contributor(s) and not of MDPI and/or the editor(s). MDPI and/or the editor(s) disclaim responsibility for any injury to people or property resulting from any ideas, methods, instructions or products referred to in the content.

