Article

An Improved Mask RCNN Model for Segmentation of ‘Kyoho’ (Vitis labruscana) Grape Bunch and Detection of Its Maturity Level

1
College of Mathematics and Computer Science, Zhejiang A&F University, Hangzhou 311300, China
2
Key Laboratory of Forestry Intelligent Monitoring and Information Technology of Zhejiang Province, Hangzhou 311300, China
3
China Key Laboratory of State Forestry and Grassland Administration on Forestry Sensing Technology and Intelligent Equipment, Hangzhou 311300, China
4
College of Food and Health, Zhejiang A&F University, Hangzhou 311300, China
5
Department of Biomedical Informatics, Harvard Medical School, Boston, MA 02115, USA
*
Author to whom correspondence should be addressed.
These authors contributed equally to this work.
Agriculture 2023, 13(4), 914; https://doi.org/10.3390/agriculture13040914
Submission received: 2 April 2023 / Revised: 17 April 2023 / Accepted: 19 April 2023 / Published: 21 April 2023
(This article belongs to the Section Digital Agriculture)

Abstract

:
The ‘Kyoho’ (Vitis labruscana) grape is one of the mainly fresh fruits; it is important to accurately segment the grape bunch and to detect its maturity level for the construction of an intelligent grape orchard. Grapes in the natural environment have different shapes, occlusion, complex backgrounds, and varying illumination; this leads to poor accuracy in grape maturity detection. In this paper, an improved Mask RCNN-based algorithm was proposed by adding attention mechanism modules to establish a grape bunch segmentation and maturity level detection model. The dataset had 656 grape bunches of different backgrounds, acquired from a grape growing environment of natural conditions. This dataset was divided into four groups according to maturity level. In this study, we first compared different grape bunch segmentation and maturity level detection models established with YoloV3, Solov2, Yolact, and Mask RCNN to select the backbone network. By comparing the performances of the different models established with these methods, Mask RCNN was selected as the backbone network. Then, three different attention mechanism modules, including squeeze-and-excitation attention (SE), the convolutional block attention module (CBAM), and coordinate attention (CA), were introduced to the backbone network of the ResNet50/101 in Mask RCNN, respectively. The results showed that the mean average precision (mAP) and mAP0.75 and the average accuracy of the model established with ResNet101 + CA reached 0.934, 0.891, and 0.944, which were 6.1%, 4.4%, and 9.4% higher than the ResNet101-based model, respectively. The error rate of this model was 5.6%, which was less than the ResNet101-based model. In addition, we compared the performances of the models established with MASK RCNN, adding different attention mechanism modules. The results showed that the mAP and mAP0.75 and the accuracy for the Mask RCNN50/101 + CA-based model were higher than those of the Mask RCNN50/101 + SE- and Mask RCNN50/101 + CBAM-based models. Furthermore, the performances of the models constructed with different network layers of ResNet50- and ResNet101-based attention mechanism modules in a combination method were compared. The results showed that the performance of the ResNet101-based combination with CA model was better than the ResNet50-based combination with CA model. The results showed that the proposed model of Mask RCNN ResNet101 + CA was good for capturing the features of a grape bunch. The proposed model has practical significance for the segmentation of grape bunches and the evaluation of the grape maturity level, which contributes to the construction of intelligent vineyards.

1. Introduction

The ‘Kyoho’ (Vitis labruscana) grape is mainly a fresh fruit, and there is no post-ripening period after picking; so, it is very important to obtain information about the fruit’s maturity and ripening time to select the best picking period for the high quality of ‘Kyoho’ grapes after picking [1]. The traditional method of judging the maturity of the ‘Kyoho’ grape bunch mainly relies on manual destructive detection, such as tasting or checking for skin color changes, by the fruit farmer. However, this method has disadvantages: it is highly subjective and inefficient, and there is a limited professional ability to judge the maturity of ‘Kyoho’ grape bunch [2]. In order to maintain the quality of the grapes, vineyards need to be carefully managed so that the quantity and quality of the grapes are well balanced and maximum vineyard profitability is achieved. This vineyard management can be difficult as workers should closely monitor the quantity and quality of bunches throughout the growing season to avoid the overripening of large amounts of fruit [3]. At the same time, the decrease in the agricultural labor force and the increase in costs have presented significant challenges to wine grape growers and managers [4]. In addition, the overripe ‘Kyoho’ grape is prone to becoming rotten fruit; it is easily damaged by birds and does not respond well to transportation and storage [5]. Therefore, it is necessary to explore a fast, accurate, and non-destructive prediction method for ‘Kyoho’ grape bunch maturity to assist farmers in the rational distribution of labor and to reduce the waste of human resources; this would not only help to improve the commodity rate of ‘Kyoho’ grapes, it would also provide a research basis for robot picking. As a result, to improve the commercial rate of grape clusters it is important to know how to quickly and accurately judge the ripeness of grape clusters.
In recent years, with the progress and rapid development of image processing, more and more methods of deep learning have been applied to agricultural production. This also plays an important role in object detection and instance segmentation. The deep learning method was used to detect the maturity of the ‘Kyoho’ grape bunch in the natural environment [6]. Compared with the traditional taste or chemical methods, it not only did not damage the fruit growth condition, it also improved the detection rate. However, in the natural growing environment of ‘Kyoho’ grapes, a series of problems need to be solved with regard to bunch detection and recognition, such as different light levels, different angles, and the difficult identification of leaf occlusion.
The traditional method of judging grape ripeness has been studied by scholars since the early 1980s. As early as 1980, Lee and Boume used the puncture method to detect the hardness and sugar content of grapes to judge their maturity [7], but the puncture method is a destructive test and is not suitable for the detection of grape maturity. In 2003, Herrera et al. used a portable near-infrared spectrometer combined with a contact probe to detect the total soluble solid content of post-harvest Chardonnay and Cabernet Sauvignon to judge the grape maturity [8]. In 2010, Ghozlen et al. used optical sensors to determine the maturity of grape panicles in the field by detecting the anthocyanin content of grape kernels [9]. In 2011, Bramley et al. installed a sensor on a harvester to detect the grape bunch maturity in the vineyard [10]. However, this method can only detect one bunch of grapes at a time, which is inefficient, and the price of optical sensors is very high; thus, they cannot be popularized.
With the continuous development of image processing, some scholars have combined the maturity of fruits with images. In 2012, Rodriguez-Pulido et al. carried out histogram threshold processing on CIELAB and HIS color space with an image analysis method and realized the rapid judgment of the ripeness of multiple grapes at the same time [9]. However, this study was carried out in the positive laboratory and did not consider many of the interference factors existing in the complex field environment. In 2014, Rahman and Hellicar used image processing and computational intelligence methods to roughly divide the field grape bunch into two types of ripe and unripe grapes according to the brown characteristics of ripe grapes [11]. In 2016, Pothen and Nuske developed an image analysis algorithm to classify grape panes into four levels and used a texture feature description combined with a random forest algorithm to realize the recognition of grape panes [12]. In 2018, Luo et al. used a K-means algorithm to realize the identification of ripe grape bunches in the field [13]. In 2015, Liu et al. used a support vector machine (SVM) algorithm to identify grape bunches in the natural environment, and the accuracy rate was 88.0% [14]. In 2018, Perez-Zavala et al. [15] used the same method and achieved an accuracy of 88.61%. The above studies used shallow machine learning algorithms to identify grape bunches, with low accuracy and relatively cumbersome feature extraction processes.
Since deep learning was proposed, there has been continuous experimentation and research by scholars. In recent years, the convolutional neural network (CNN) has been gradually applied to classification, object detection, and background segmentation. For example, Aggarwal et al. presented a stacked ensemble-based deep learning classification model based on Human Protein Atlas images [16]. Gulzar et al. constructed a fruit image classification model based on MobileNetV2 with a deep transfer learning technique [17]. Hamid et al. established a seed classification model with a deep learning convolutional neural network of MobileNetV2 [18]. Some scholars have used the Faster R-CNN network to detect different fruits (melon, avocado, mango [19], orange, apple, etc.) by using RGB and NIR images and their combinations. Grimm et al. used the full convolutional neural network (FCN) with VGG-Net 16 as the backbone to segment and detect many organs, including grape berries; the accuracy of the berry detection was 86.60%, and the F1 value was 87.60% [20]. Fu et al. proposed that the background in an apple image should be removed by depth feature first, and Faster R-CNN was used for apple detection, with an average detection accuracy of 89.3% [21]. Parvathi et al. used ResNet50 as the backbone network of Faster R-CNN to detect coconut maturity, and the accuracy rate reached 89.4% [22]. A supervised learning method was used to train FCN for plant leaf detection, and the pixel accuracy reached 91%. In 2020, Wan et al. took into account the characteristics of fruit images in natural light and the hanging state of fruit; they optimized the convolution layer and pooling layer of the Faster R-CNN model [23] and achieved high accuracy in the apple, mango, and citrus datasets. In 2020, Mai et al. [24] proposed a Faster R-CNN model with classifier fusion. In the region candidate stage, three different levels of features were used to train three classifiers for object classification; the stage was composed of a simple convolutional layer, and a new loss function with a classifier correlation coefficient was introduced to train the region candidate network. It improved the reliability of the Faster R-CNN network in small target fruit detection. In 2022, Lei et al. proposed a new backbone network ResNet50-FPN-ED to improve the mask region convolutional neural network (Mask RCNN) instance segmentation in order to improve detection and segmentation performance in complex environments, such as the cluster shape changes, leaf shadows, tree trunk occlusion, and grape overlap [25]. However, the average accuracy of the proposed model in object detection and instance segmentation reached 60.1% and 59.5%, respectively. In 2022, Wei et al. proposed a two-stage instance segmentation method based on an optimized Mask RCNN to solve the various difficulties of intelligent grape picking in a complex orchard environment [26]. It not only accelerates the speed of the model but also greatly improves the accuracy of the model and meets the storage resource requirements of the mobile robot. The mean average precision (mAP) and mean average recall (mAR) of the optimized Mask RCNN are 76.3% and 81.1%, respectively.
Due to the influence of the complex natural environment background, the research work on the feature extraction and target detection of ‘Kyoho’ grape bunch maturity is facing great challenges. Color is one of the most important characteristics for determining fruit ripeness. The color of an item is determined by the light reflected from it; these changes serve as a foundation for image processing and analysis [
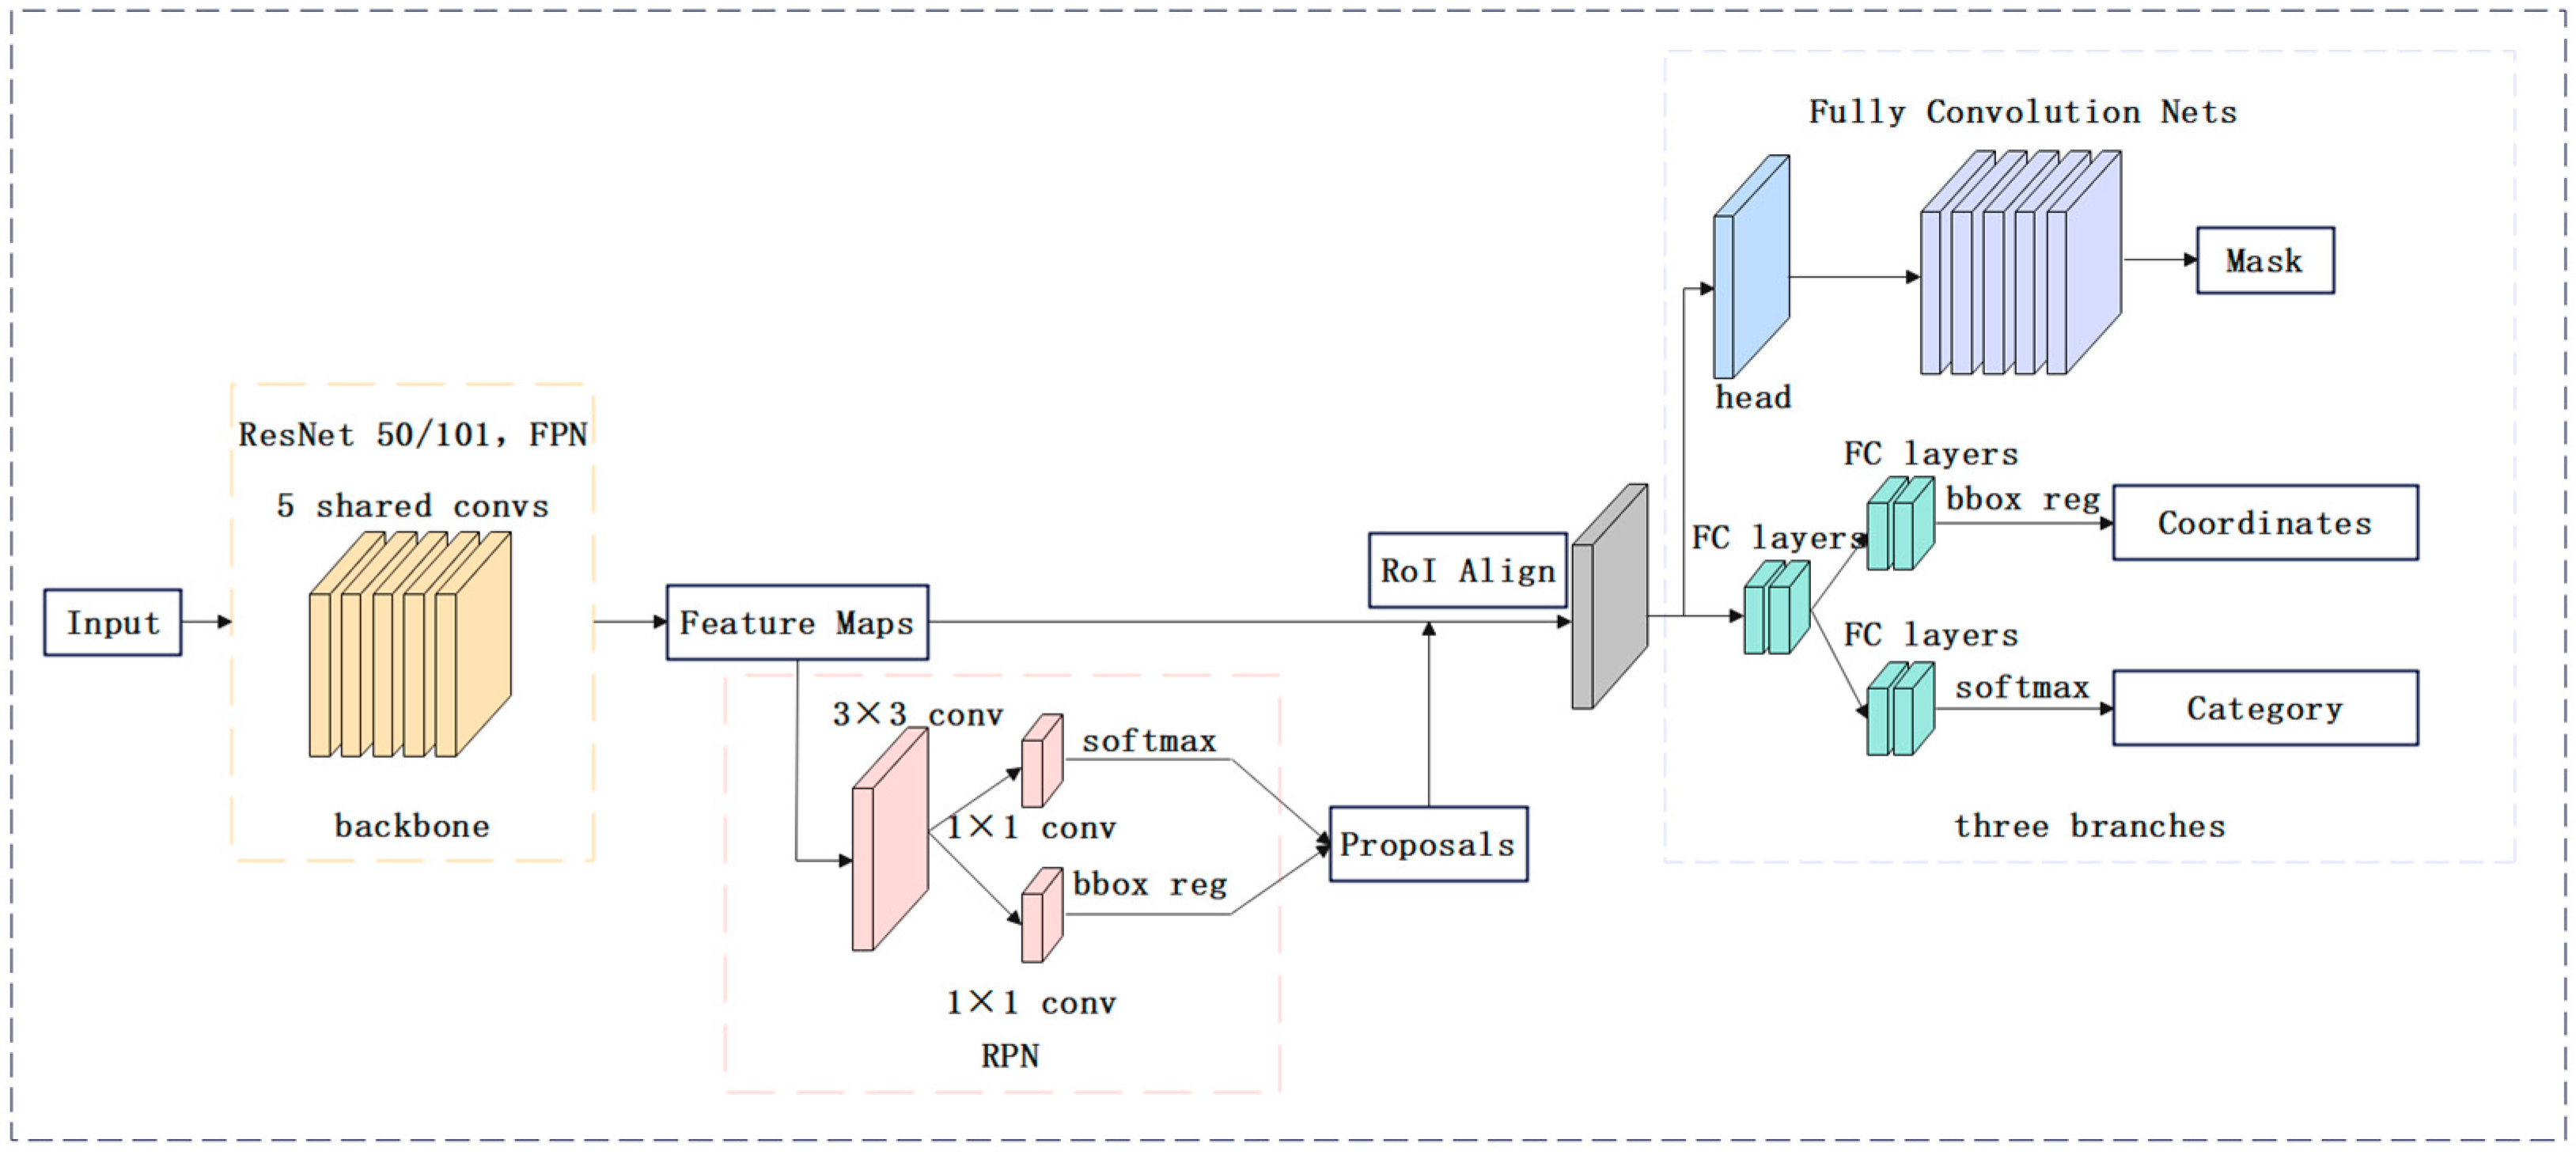
27]. In this paper, grape panicle images are taken as the research object, and the ripeness of the ‘Kyoho’ grape panicle is divided into four grades, from maturity level 1 to maturity level 4, according to the color of the fruit skin, so as to judge the best picking time and the expected picking time of this grape bunch. This paper deeply analyzes the Mask RCNN [28] network and its development prospect based on the mmdetection framework; it optimizes and improves the existing algorithm by analyzing the current algorithm and proposes an optimization method combined with the Mask RCNN algorithm. The optimized algorithm results are obtained by a comparison with the existing Mask RCNN algorithm. The experimental results show that the proposed method improves the accuracy of its maturity detection and segmentation. Because the Mask RCNN algorithm has good instance segmentation performance, it solves the problem of the difficultly that exists in detecting grape bunches under occlusion or overlap. At the same time, the experiment can be applied to the intelligent picking of agricultural products and other fields, which solves the problem of the large use of manpower in the traditional picking process, saves human resources to a large extent, and is a qualitative breakthrough in computer-aided agriculture.
The goal of this research is to investigate a model that can not only accurately segment the grape bunch but can also evaluate the maturity of the grape bunch. In this study, a Mask RCNN-based algorithm is improved by the addition of an attention mechanism module to establish a grape bunch segmentation and maturity level detection model. We first collected a dataset of grape bunches in different stages of maturity from different angles and backgrounds in natural environments. Then, an improved grape bunch segmentation and maturity evaluation model was proposed by combining a Mask RCNN network and an attention mechanism. The model has practical significance in that it helps in the maturity judgment of the ‘Kyoho’ grape in order for artificial intelligence to pick grapes. In addition, the model can judge the maturity level of the ‘Kyoho’ grape and provide a basis for a further evaluation of the time required for grape ripening, avoiding the wasteful situation of picking too early or too late.
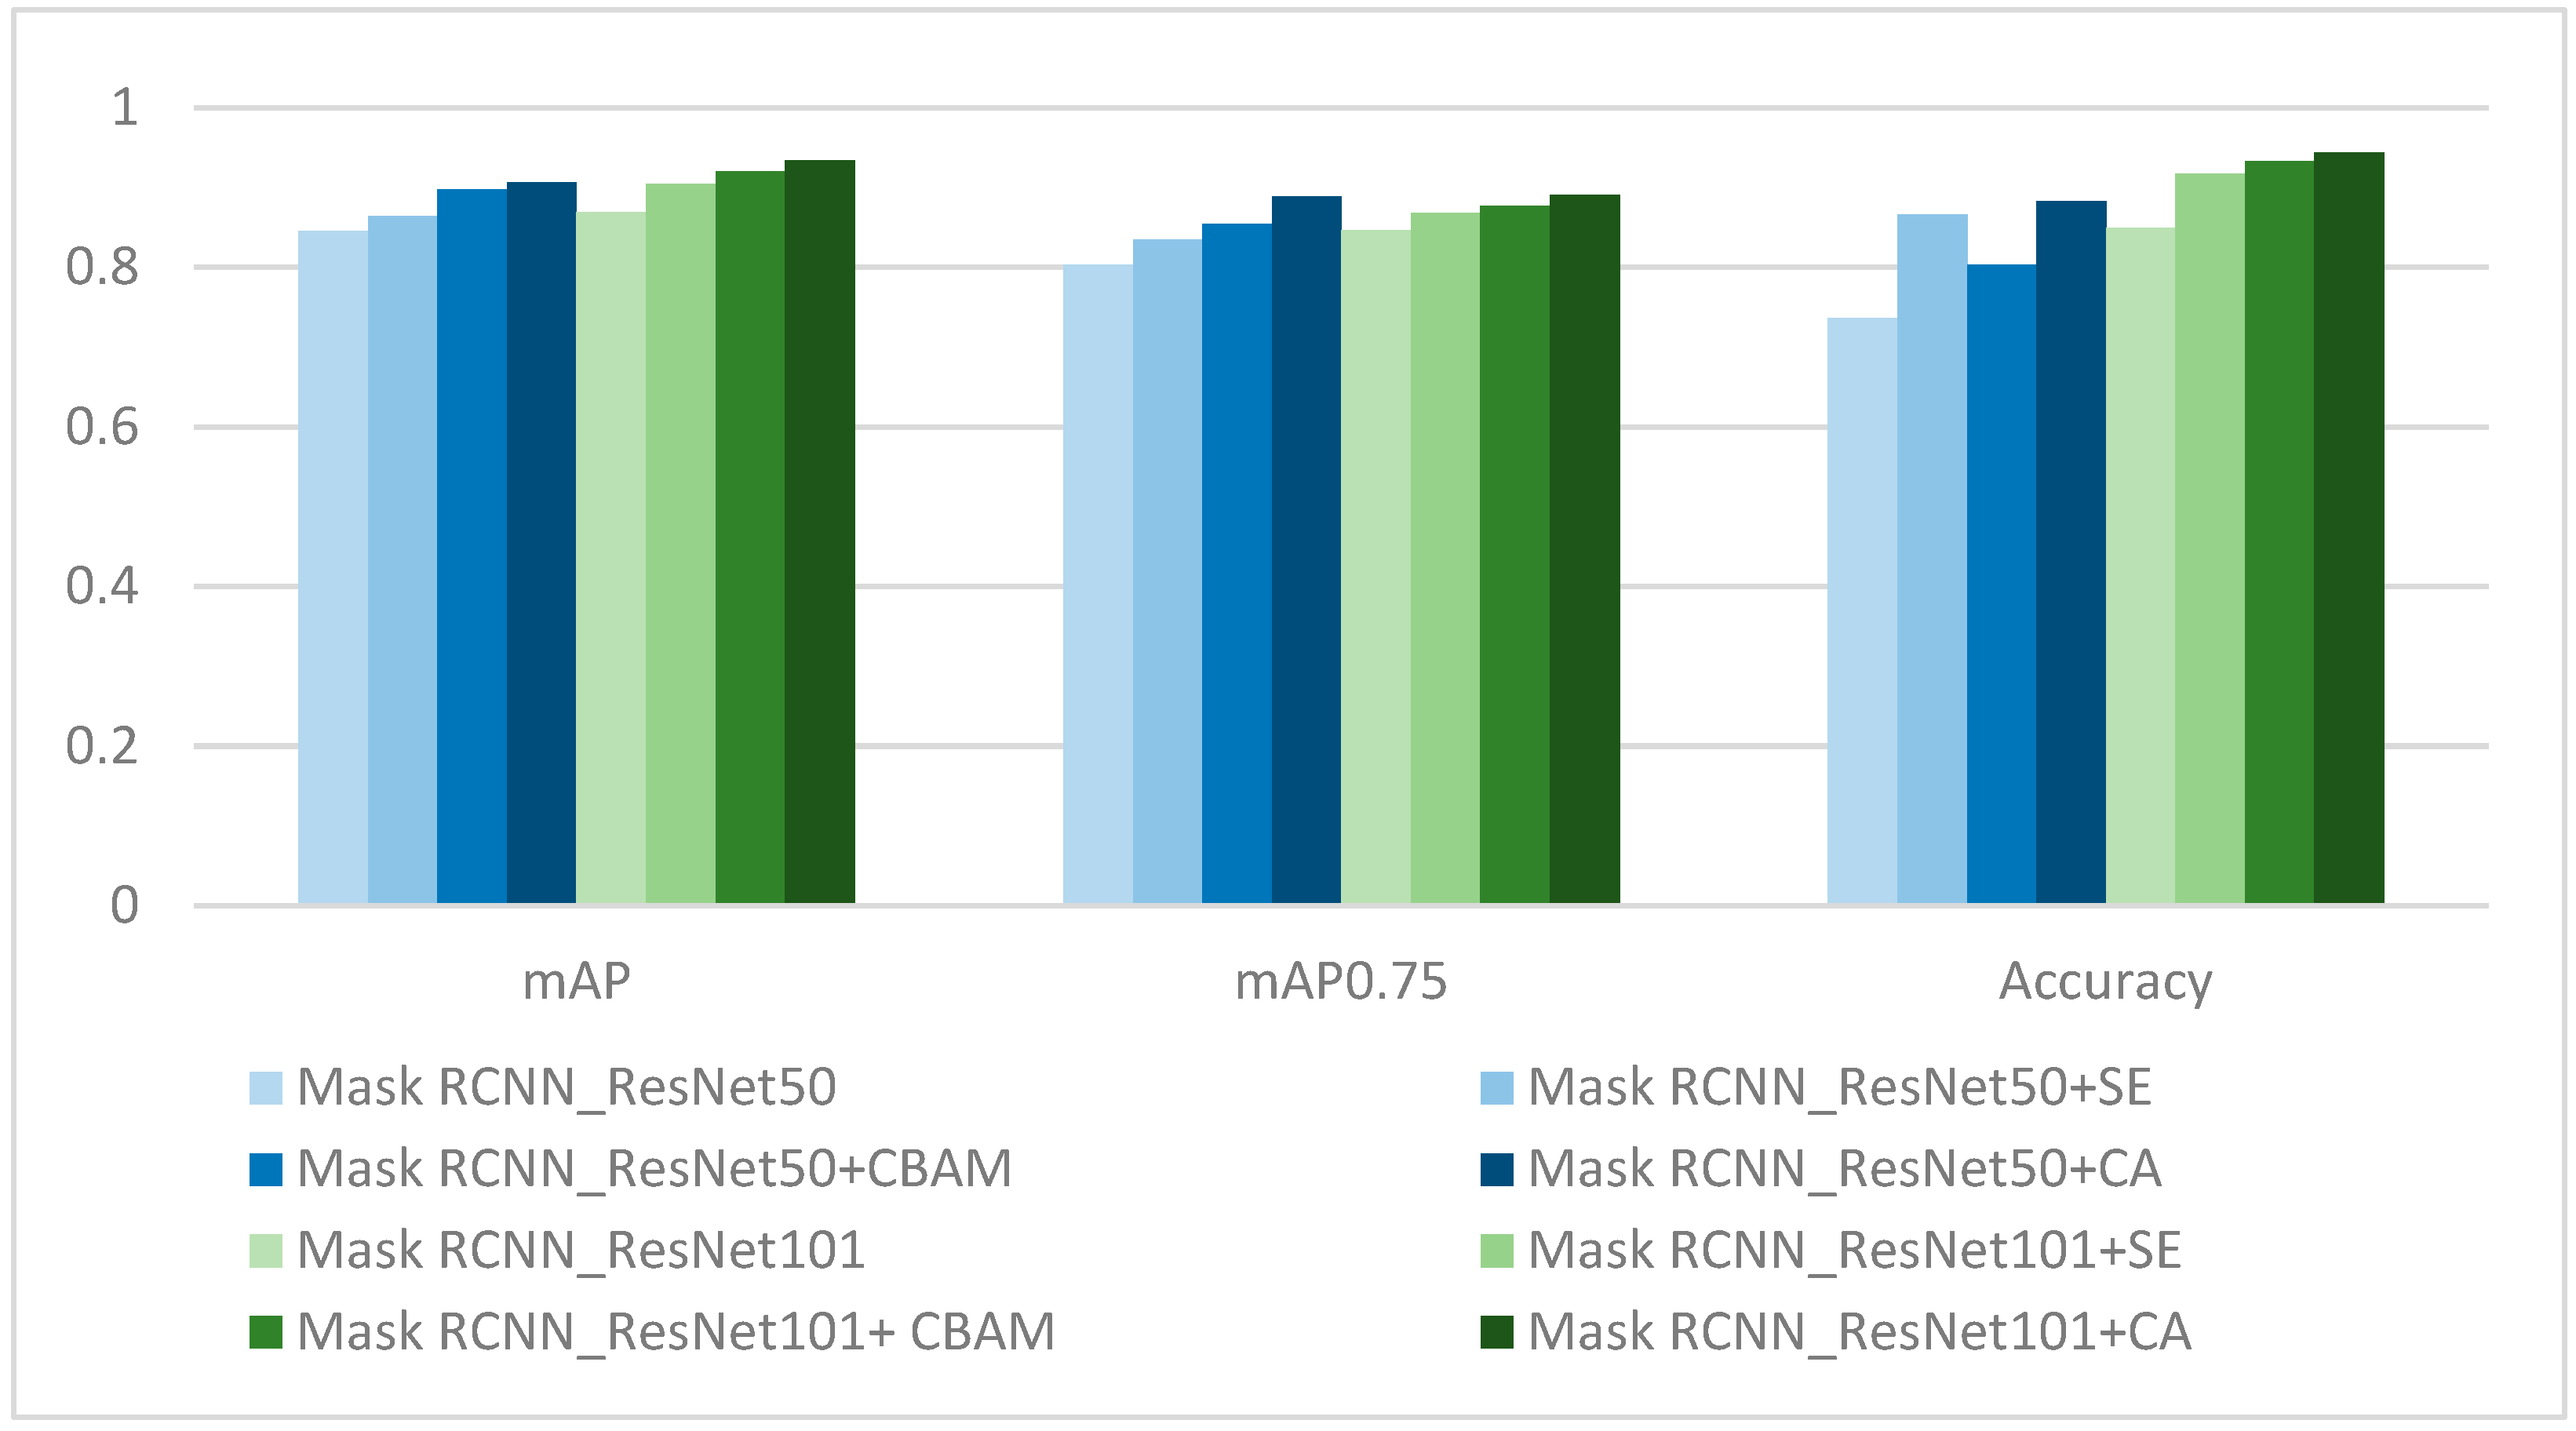
The main contributions of this work include the following. First, we collected one dataset, including grape bunches of four different maturity levels, collected from different views and backgrounds in the real word of the vineyard. Second, we designed an improved segmentation and classification model by combining Mask RCNN and an attention mechanism of coordinated attention, which has higher precision for the segmentation of the grape bunch and the evaluation of the grape maturity level. The mean average precision (mAP), mAP0.75 and the average accuracy of the model reached 0.934, 0.891, and 0.944. In the process of this model design, we compared the performances of different models established with YoloV3 [29], Solov2 [30], Yolact [
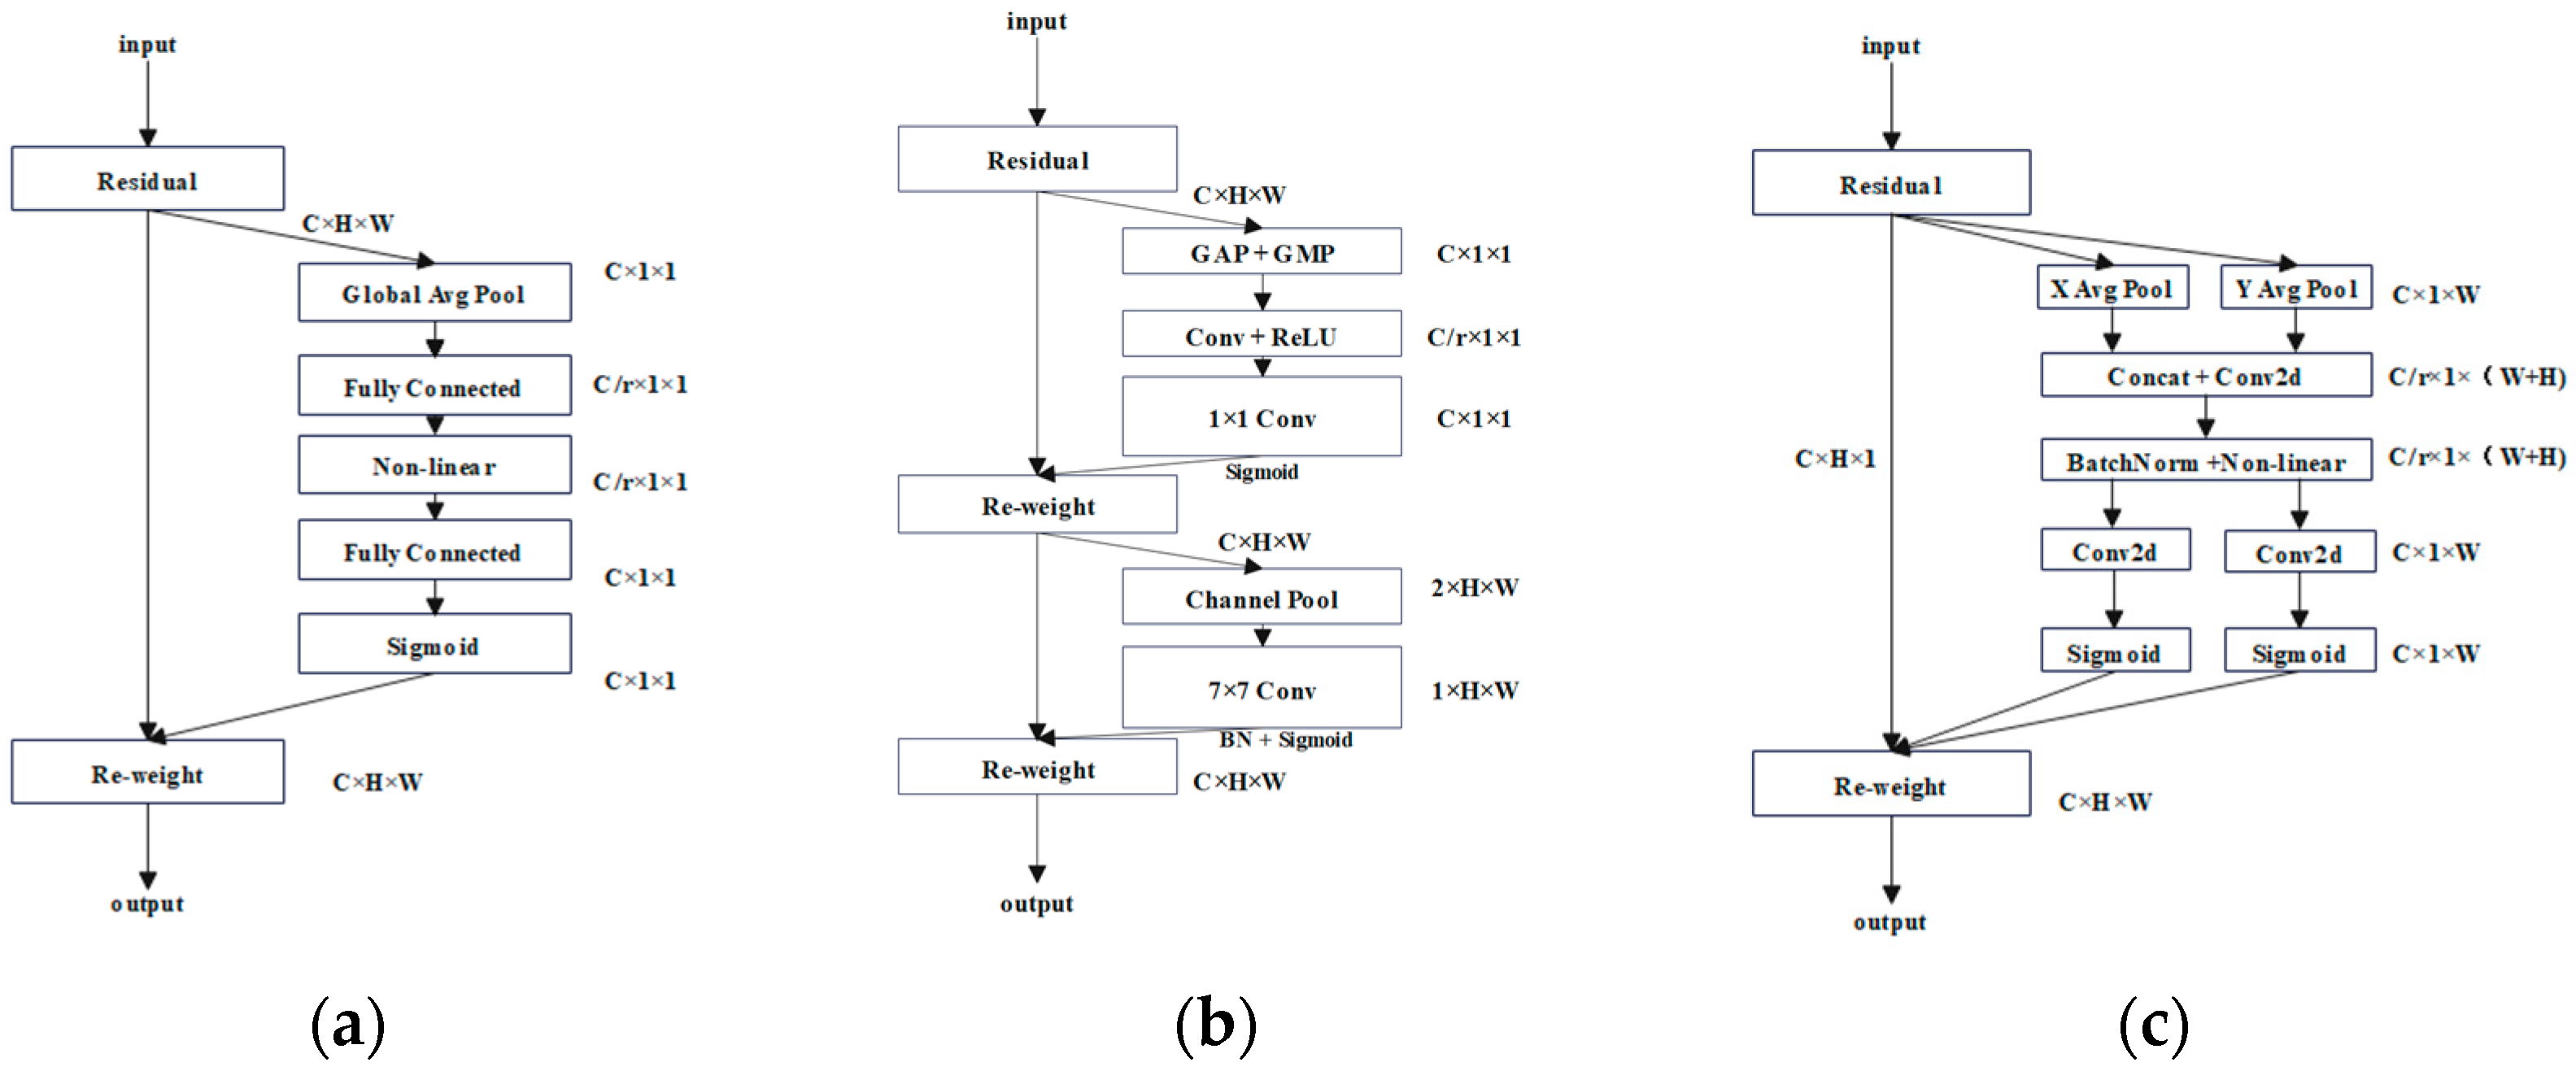
31], and Mask RCNN to select the backbone network. Then, three different attention mechanism modules, including squeeze-and-excitation attention (SE) [32], the convolutional block attention module (CBAM) [
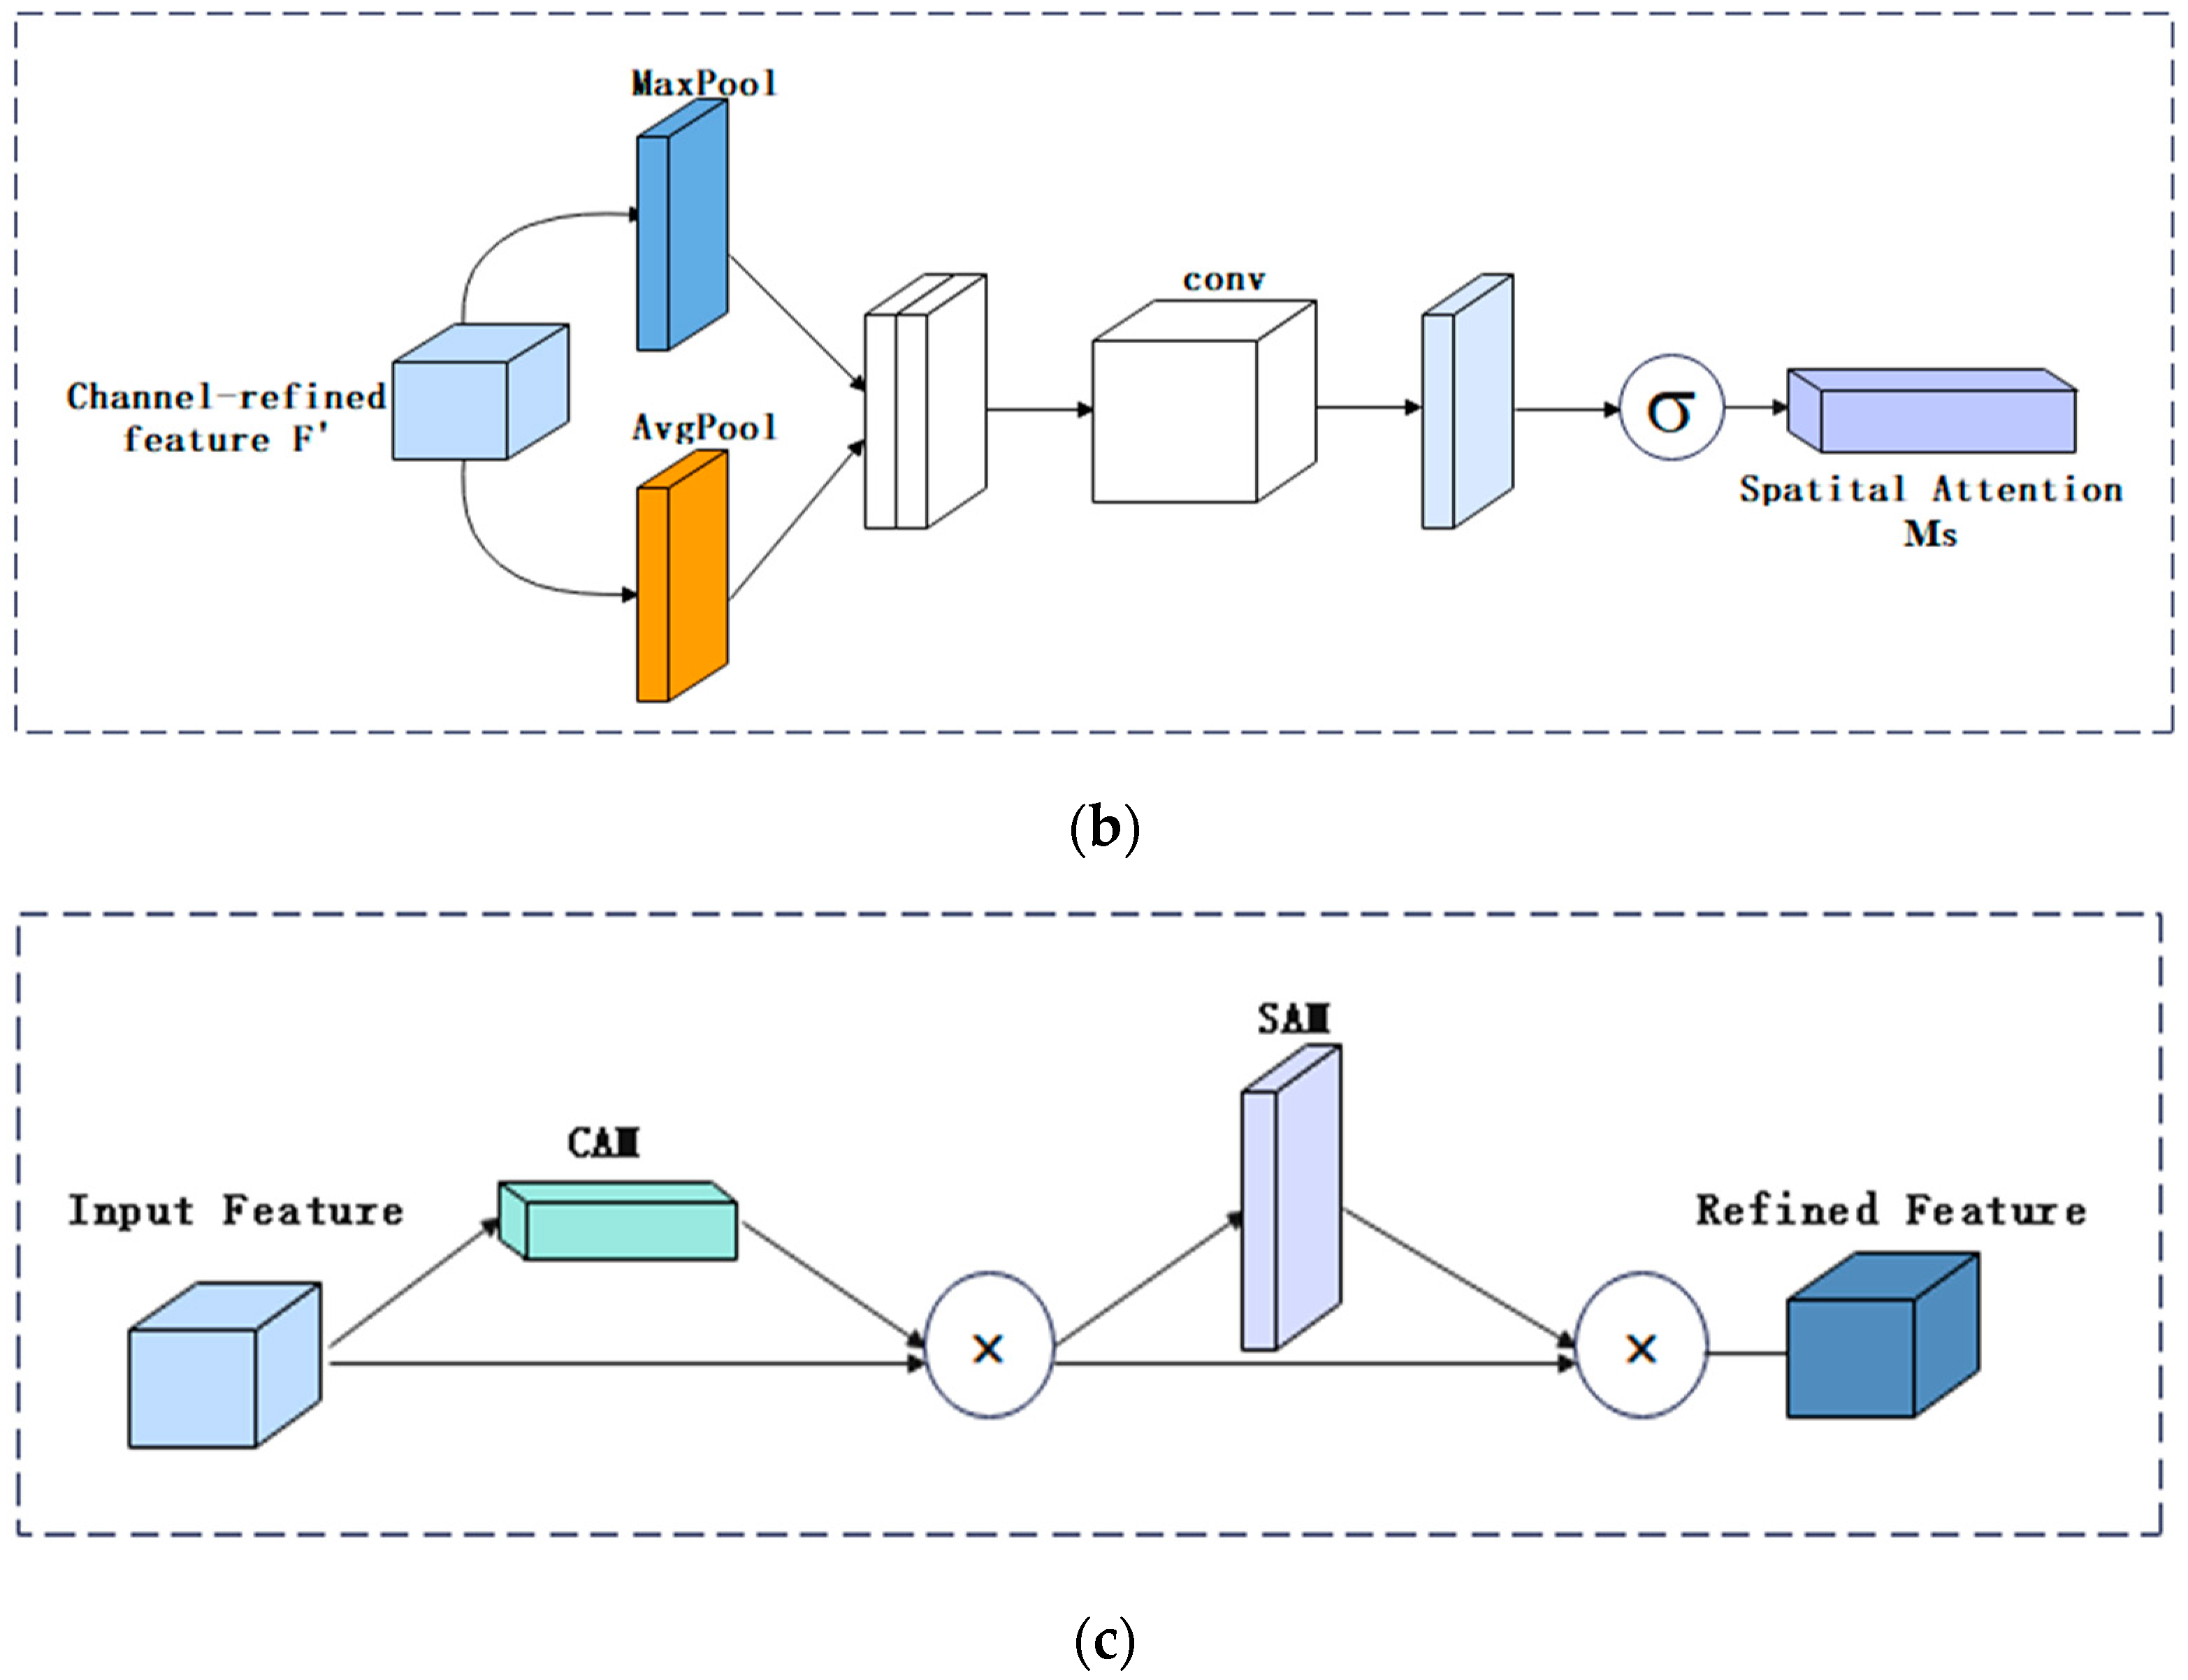
33], and coordinate attention (CA) [
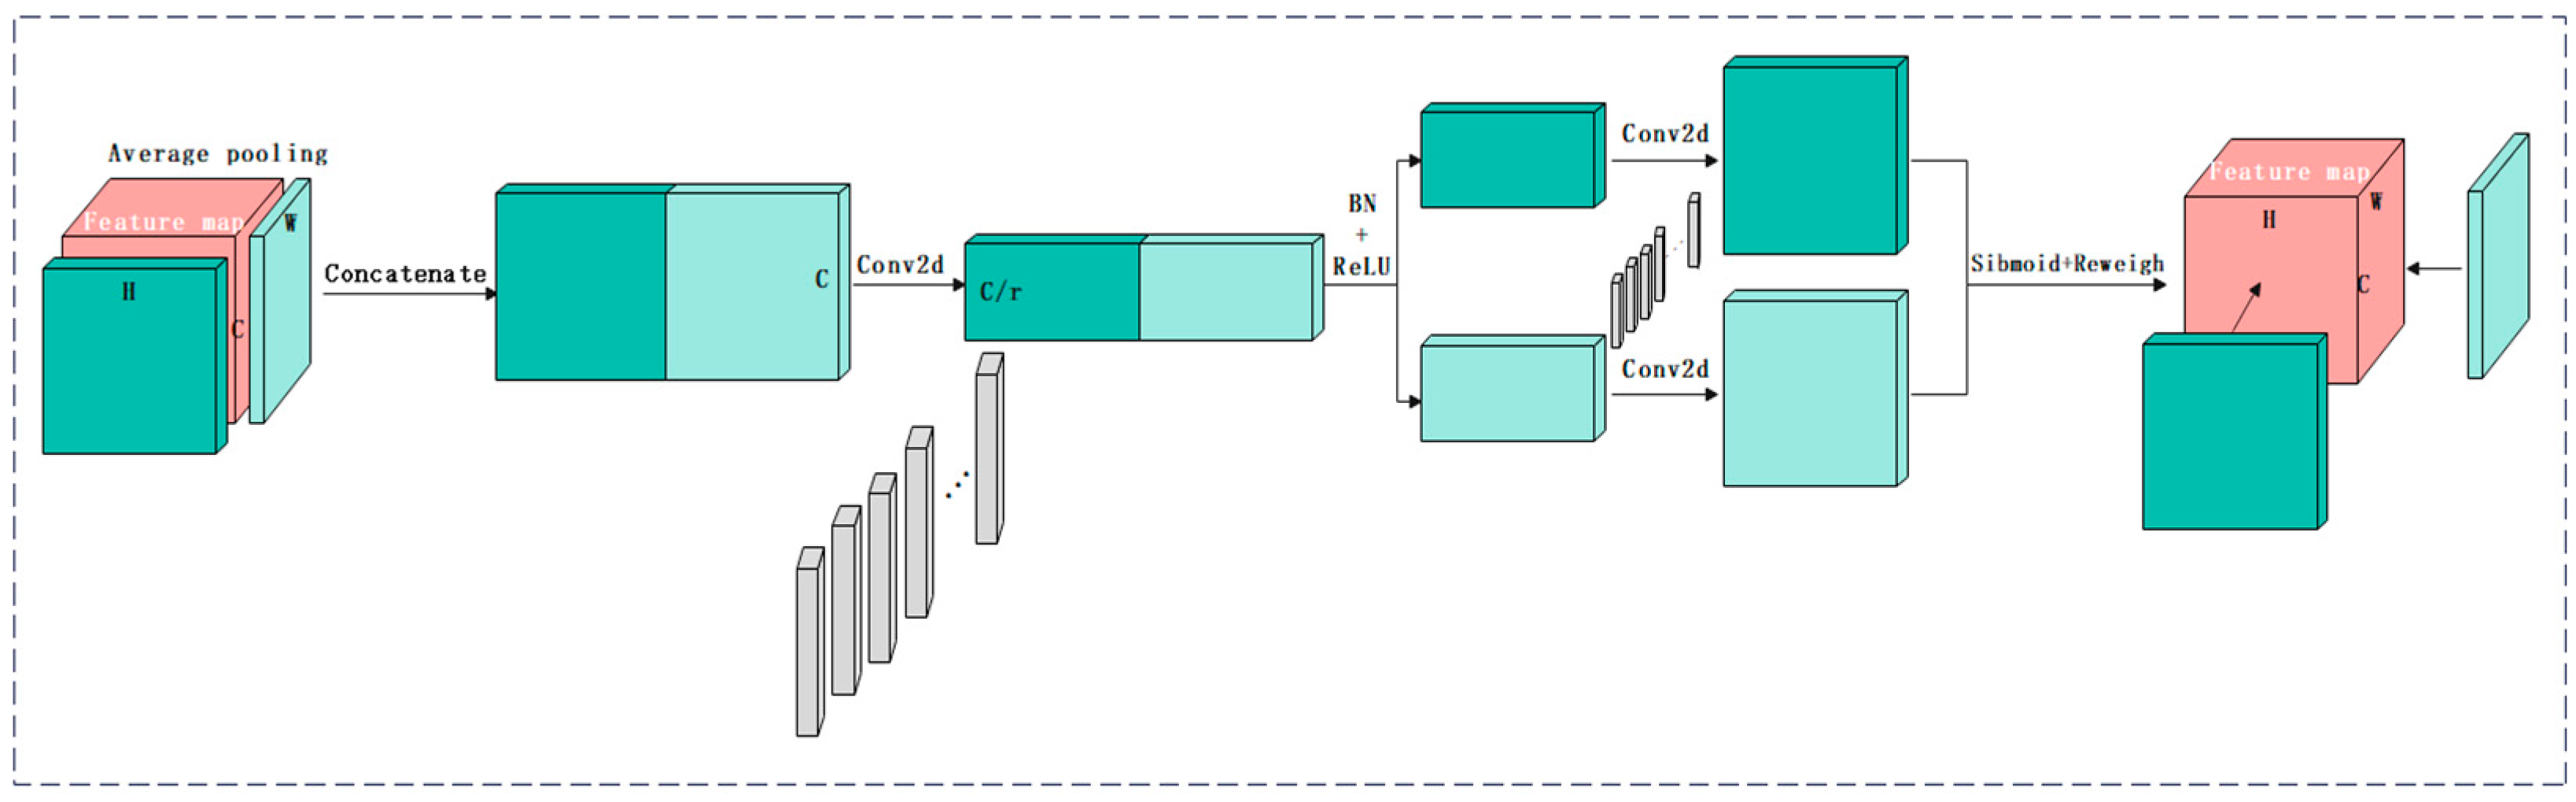
34], were introduced to the backbone network of the Mask RCNN, respectively. In addition, the performances of models constructed with a combination of different network layers of ResNet50- and ResNet101-based [
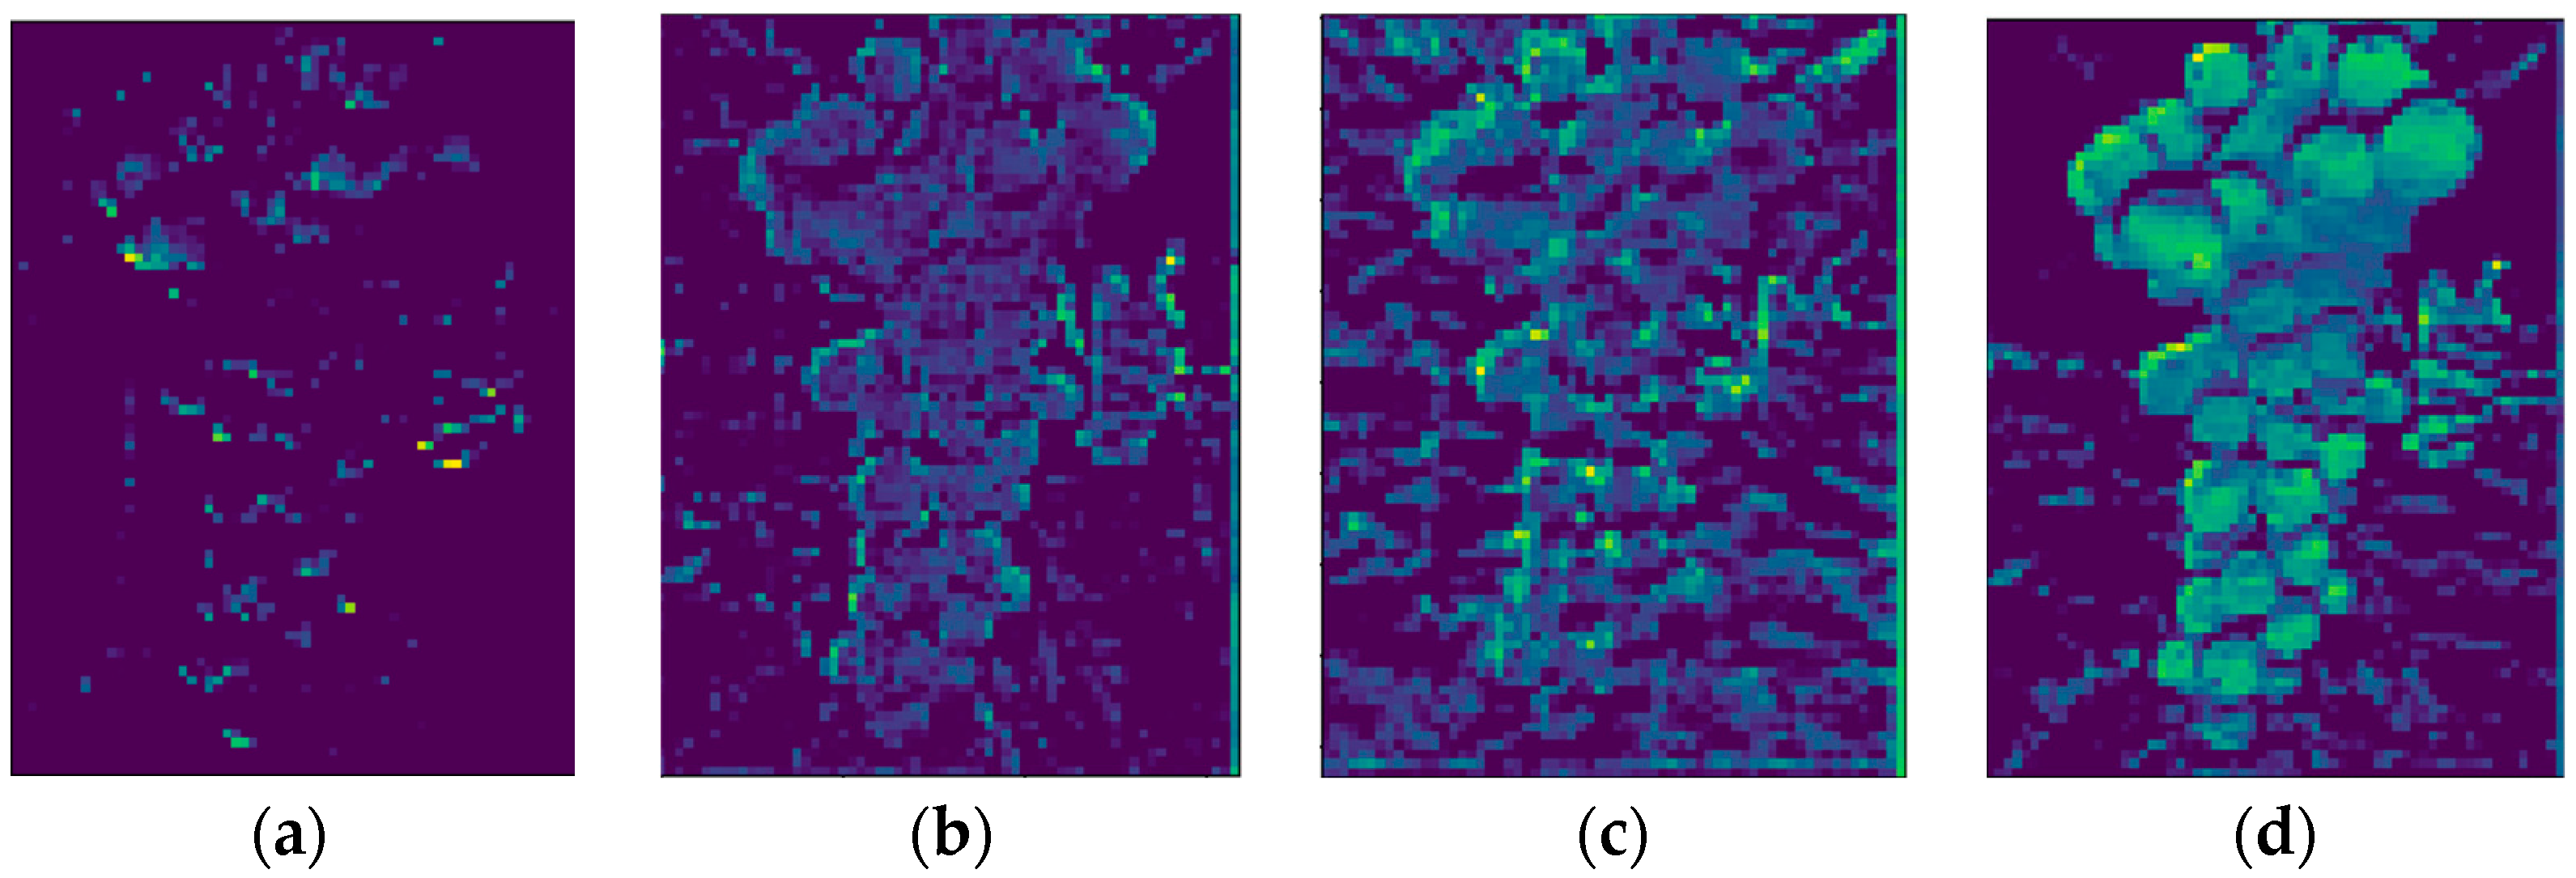
35] attention mechanism modules were compared. The experimental results showed that the segmentation and classification ability of this model was higher than those of the above models. Finally, feature visualization was analyzed.

2. Materials and Methods

2.1. Experimental Dataset

In this study, all the ‘Kyoho’ grape images were collected from the ‘Kyoho’ grape base, which has good light transmission, in Pujiang County, Zhejiang Province, China. RGB images of the ‘Kyoho’ grapes were obtained using a mobile phone camera (HUAWEI P40, Huawei Technologies Co., Ltd., Shen Zhen, China) which had 50 megapixels. The distance of the mobile phone camera from the ‘Kyoho’ grape ears was 20–40 cm, and the pixel resolution was 3072 × 096 (3:4). During image collection, the ‘Kyoho’ grapes were photographed from different angles (elevation angle and flat angle), with different light (backlight and downlight), and in a block or not. After the image collection of the ‘Kyoho’ grapes, the data were named according to the time of image collection. A total of 601 images were applied, in which one or more grape bunches with different maturity levels were present in each image. As a result, 656 ‘Kyoho’ grape bunches were used. Examples of the grape bunches from the different shooting angles are shown in Figure 1 below.
The grape bunches were divided into four groups according to the maturity levels, based on the skin color of the bunch, from maturity level 1 to maturity level 4, with 163, 214, 204, and 75 bunch samples, respectively. Maturity level 1 was the immature stage: all the granules of the ‘Kyoho’ grape bunch were green. Maturity level 2 was the color transition stage: the grape granules had just changed from cyan to red. Maturity level 3 was the about-to-mature stage: the grape granules were purple in a large area and cyan in a small area. Maturity level 4 was the mature stage: the granules of the ‘Kyoho’ grapes had completely transformed into purple, as shown in Figure 2.
The COCO format dataset was used in this study and was divided into a training set and a validation set. The training set contained 588 bunches, and the validation set contained 68 bunches. Finally, labelling software was used to calibrate all the images and to generate the corresponding JSON files for training and testing. The annotated data are shown in Figure 3 below.

2.2. Mask RCNN Network Combined with Attention Mechanism Module

2.2.1. Mask RCNN Network

The Mask RCNN network is an algorithm for multiple tasks such as target detection and segmentation. On the basis of Faster RCNN, a branch for target mask prediction was added; that is, a full convolutional neural network was used to segment each region of interest suggested by the RCNN so as to realize classification, positioning, and segmentation at the same time. The main structure of Mask RCNN includes a backbone network, a region selection network, alignment operation, classifier and border regress, and mask segmentation [28]. The Mask RCNN network adopts a two-stage structure. In the first stage, the backbone network, namely the deep residual network, is used to extract feature maps of different stages from the input image. Secondly, it uses the top-down and horizontal connection structure of the feature pyramid network to fuse features of different scales so that it has strong semantic information and strong spatial information at the same time. Thirdly, a fixed number of anchor boxes are set for each pixel on these feature maps, and multiple candidate regions with different sizes are obtained by calculating the intersection between each anchor box and the real box labeled on the image. Finally, the region proposal network is used to perform binary classification (i.e., foreground/background) and border regression on the candidate ROIs; to filter out the ROI with low classification scores; and to set the ratio of positive and negative samples to 1:3 to alleviate the class imbalance problem and reduce the calculation of unnecessary information in the second stage. In the second stage, two alignment operations are performed: (1) the ROI selected in the first stage is aligned, and the ROI in the original image is made to correspond with the pixels in the feature map; (2) the ROIs with different sizes are converted to a uniform size. Secondly, in order to reduce the error caused by the pooling process, the bilinear interpolation method is used to calculate each pixel value from the adjacent grid points on the feature map, and the important feature information contained in the ROI is obtained to complete the classification, regression, and segmentation tasks. Finally, by adding segmentation branches to the fully connected layer, each pixel on each ROI is classified and predicted by regression, and the final binary mask is output. The network structure framework is shown in Figure 4.

2.2.2. Squeeze-and-Excitation Attention (SE)

The attention module is a technology that enables the model to focus on important information and fully absorb learning [36]. It can help the network to quickly lock the part to be processed and to reduce unnecessary calculation loss and is a very useful method to reduce the amount of network calculation.
The input feature map was processed by channel-wise maximum pooling and average pooling at the same time so as to obtain a feature map with 1 channel number, which had the same size and contained the spatial information of the image. The pooling was carried out in the channel dimension to compress the channel size and facilitate the later learning of the spatial features. Then, the two feature maps were concatenated between the channels, and a spatial feature map was obtained by convolution and activation function. Finally, the corresponding multiplication was performed with the original input feature map to obtain the final feature map output. The network structure diagram is shown in Figure 5.

2.2.3. Convolutional Block Attention Module (CBAM)

The CBAM is composed of a channel attention module and a spatial attention module. The CBAM is a lightweight attention module, consisting of two independent sub-modules, including a channel attention mechanism and a spatial attention mechanism. It integrates an attention map with an input feature graph to optimize the adaptive features. In the process of image feature extraction, the relevance of the channel and space should be used to enhance the expression ability of the target features so as to inhibit the expression of the invalid features. In this paper, the CBAM module was introduced into ResNet to improve the accuracy of the detection model and segmentation effect. The detection accuracy of the grape spike detection model in the natural environment is often determined by the feature extraction quality of ResNet; so, the category of targets in the experiment has a strong correlation with its effect on each channel and the location of targets in the picture. The network structure diagram is shown in Figure 6.

2.2.4. Coordinate Attention (CA)

CA is a new efficient attention mechanism. In order to alleviate the loss of position information caused by 2D global pooling, channel attention is decomposed into two parallel (x and y direction) 1D feature coding processes to effectively integrate spatial coordinate information into the generated attention graph. More specifically, two one-dimensional global pooling operations are used to aggregate the input features in the vertical and horizontal directions into two independent direction-aware feature graphs, respectively. Then, the two feature graphs embedded with specific directional information are encoded into two attention graphs, each of which captures the long-range dependence of the input feature graphs along a spatial direction. Therefore, the location information is stored in the generated attention map, and the two attention maps are then multiplied onto the input feature map to enhance the representation of the feature map. Since this kind of attention operation can distinguish spatial directions and generate a coordinate-aware feature map, the proposed method is called coordinate attention. The network structure diagram is shown in Figure 7.

2.2.5. Improved Mask RCNN Network Model

Three different attention mechanism modules, including the SE, CBAM, and CA, were introduced to the backbone network of ResNet to establish a grape maturity level detection model, respectively. The structures of the improved network modules are shown in Figure 8. In this study, the attention mechanism module was embedded into the residual modules to make the attention moment of the model feature extraction focus on the information target, improving the quality of the image feature extraction and thus increasing the accuracy of the grape bunch maturity detection model.

2.3. Evaluation Indexes for Model

In this experiment, average precision (AP), mean average precision (mAP), and mAP0.75 were used as the evaluation indicators.
AP is defined as the mean of the precision under different recall rates, which is the integral of precision over recall and can be expressed as follows.
A P = 0 1 P R d R
In Formula (1), P is the precision rate, which is defined as the detection accuracy rate of all the detected objects, and R is the recall rate, which is defined as the detection accuracy rate of all the positive samples, and they are expressed, respectively, as:
P = T P T P + F P
R = T P T P + F N
In Formulas (2) and (3), TP represents the number of correctly identified detections of targets, FP is the number of missed detections and false detections, and FN is the number of objects detected as other kinds of objects.
The index of mAP is the average of AP; n represents the number of target types, and APi is the average accuracy of the ith target. The calculation formula is shown in Formula (4):
m A P = i = 1 n A P i n    
The index of mAP0.75 is the average AP value when the intersection over union (IoU) threshold is 0.75; n represents the number of target types; AP0.75i is the average precision of the ith target when the IoU threshold is 0.75, and its calculation formula is shown in Formula (5):
m A P 0.75 = i = 1 n A P 0.75 i   n
Accuracy measures the probability that an algorithm correctly identifies an instance of each class. Accuracy is defined as the division of the number of positive class instances by the total number of instances correctly predicted by the classifier. The expression is shown in Formula (6). The threshold value in this study was set to 0.5 when computing the TP and TN values.
A c c u r a c y = T P + T N n    

3. Results

3.1. Experimental Environment and Parameter Settings

The proposed algorithm is based on the mmdetection framework released in September 2022 with version 2.25.2 and Mask RCNN. The system uses Windows 11, the processor is 12th Gen Intel(R) Core (TM) i7-12700H, and the graphics card is NVIDIA GeForce RTX 3060. The software of PyCharm with the 2022.2 version was used for image processing and data analysis.
Before training, the image size was normalized to 800 pixels × 500 pixels. In this paper, the Mask RCNN model with a 50-layer residual network (ResNet50) and a 101-layer residual network (ResNet101) as a backbone network and the improved Mask RCNN model were studied in the segmentation of the grape ear image. In this paper, in order to address the small dataset situation, we pre-trained the Mask RCNN weight model on the coco dataset to speed up the running speed and feature learning process. A stochastic gradient descent algorithm with a learning rate of 0.0025 and a momentum of 0.9 was used as the optimization algorithm in the training of this model. To improve the segmentation accuracy, two images were used on a single GPU as a mini-batch training set. The parameters are shown in Table 1.

3.2. Performance Comparison between Models Established with Different CNN Networks

In order to select the base network with a good performance, we first verified the validity of the model established by Mask RCNN; this study performed training and test experiments on Solov2, YoLov3, and Yolact, as well as Mask RCNN, which included Mask RCNN_ResNet50 and Mask RCNN_ResNet101 in the maturity level detection dataset. The mAPs for each maturity level and for all the maturity levels are shown in Table 2.
It can be seen from Table 2 that the performance of the model established with Mask RCNN was better than the models constructed with the Solov2, Yolov3, and Yolact networks. The mean average precision of ResNet50 as the backbone network was 10.7%, 9.5%, and 4.7% higher than that of Solov2, Yolov3, and Yolact, respectively. The mean average precision of ResNet101 as the backbone network was 13%, 11.8%, and 7% higher than that of Solov2, Yolov3, and Yolact, respectively. This proves that the base network of ResNet chosen in this study had a better performance. As a result, the Mask RCNN ResNet was used as the base network to establish a maturity detection model for the grape bunch.
Compared with the models established with Mask RCNN ResNet50 and Mask RCNN ResNet101, the mAP was increased from 0.846 to 0.869, with increases of 2.3%. This result demonstrates that the deeper backbone network structure made the training of the network more adequate and that the evaluation metrics were effectively improved.
For the identification of each maturity level of the grape bunch, we found that the accuracy of maturity level 1 and level 4 was better than the accuracy of maturity level 2 and level 3. This may be because the granules of the grape bunch for level 1 and level 4 go to one color, green for level 1 and amethyst for level 4. For level 2 and level 3, the colors of granules in the same bunch changed from green to amethyst, which made them harder to identify.

3.3. Performance Comparison of Models Established by Combining Mask RCNN with Different Attention Mechanisms

The network training loss and accuracy convergence curve of the ‘Kyoho’ grape string maturity detection model is shown in Figure 9. As can be seen from the curve in the figure, regardless of the attention mechanism mentioned in this article, the loss value decreases as the epoch increases and eventually becomes stable. The convergence speed of ResNet101 is slightly faster, and the final stable loss value is slightly lower than that of ResNet50. After the introduction of the attention mechanism in the Mask RCNN, the model obtained better performance, and the subsequent work proved that it could accurately locate grape cluster information and identify maturity.
In order to verify and demonstrate the performance of the model established by the improved algorithm, the comparative experiments were performed by adding different attention mechanisms to Mask RCNN, including SE, CBAM, and CA, respectively. Table 3 and Table 4 show the performances of the models established by combining different attention mechanisms with Mask RCNN ResNet50 and Mask RCNN ResNet101, respectively.
Table 3 shows that after the introduction of the attention mechanisms to Mask RCNN ResNet50, the performances of mAP and mAP0.75 and the accuracy were all improved. Among them, after the addition of the attention mechanism of CA to Mask RCNN ResNet50, mAP and mAP0.75 and the accuracy were 0.907, 0.889, and 0.883, respectively.
Table 4 shows the performances of the models established by combining the different attention mechanisms with Mask RCNN ResNet50 and Mask RCNN ResNet101, respectively.
Table 4 shows that after the introduction of the attention mechanisms to Mask RCNN ResNet101, the performances of mAP and mAP0.75 and the accuracy were all improved. Among them, after the addition of the attention mechanism CA to Mask RCNN ResNet101, mAP and mAP0.75 and the accuracy were 0.934, 0.891, and 0.944, respectively.
Figure 10 shows a qualitive comparison of the performances between the proposed model established by combining Mask RCNN ResNet101 with coordinate attention and the models constructed by the original Mask RCNN ResNet50/101, as well as Mask RCNN ResNet50/101 combined with the attention mechanisms of squeeze-and-excitation attention and the convolutional block attention module, respectively.
From Figure 10, we can see that when the three different kinds of attention were introduced, mAP and mAP0.75 and the accuracy were all higher than the original Mask RCNN-based models. In addition, the performances of the series of models established with the deeper network of ResNet101 were better than the corresponding series of models constructed with the ResNet50-based models.
Table 5 and Table 6 show the quantitative comparison of the performances between the different models established with Mask RCNN ResNet50/101 when combined with the attention mechanisms SE, CBAM, and CA, respectively.
Table 5 shows that when three different kinds of attention were introduced in ResNet50 + SE, ResNet50 + CBAM, and ResNet50 + CA, mAP was 1.8%, 5.2%, and 6.1% higher than ResNet50, respectively. mAP0.75 was 3.2%, 5.1%, and 8.6% higher than ResNet50, respectively. The accuracy was 13%, 6.7%, and 14.7% higher than ResNet50, respectively.
Table 6 shows that when three different kinds of attention were introduced in ResNet50 + SE, ResNet50 + CBAM, and ResNet50 + CA, mAP was 3.6%, 5.1%, and 6.5% higher than ResNet50, respectively. mAP0.75 was 2.1%, 3.0%, and 4.4% higher than ResNet50, respectively. The accuracy was 6.7%, 8.3%, and 9.4% higher than ResNet50, respectively.
The results show that the model established by combining Mask RCNN ResNet and the attention mechanisms can extract more effective features and improve the accuracy of the identification of the maturity level of the grape bunch. A comparison was made of the performances of the models established with Mask RCNN ResNet50 and Mask RCNN ResNet101 combined with the attention mechanisms, respectively; from Table 3 and Table 5, we can see that the performances of the models established by the combining of Mask RCNN ResNet101 and the attention mechanisms are better than the combining of Mask RCNN ResNet50 and the attention mechanisms. Among them, mAP and mAP0.75 and the accuracy of Mask RCNN ResNet101 + CA are 2.7%, 0.2%, and 6.1% higher than those of Mask RCNN ResNet50 + CA. The results proved that the deeper network level can fully extract effective information and can have a better detection and segmentation effect.

3.4. Feature Visualization

In the feature extraction stage, the feature maps mostly display the image detail feature information and focus on the local features, shape, and detailed texture information of the target. In this study, the images of the grape bunch were randomly selected from the datasets, and the features extracted from the established models were visualized, as shown in Figure 11a–h, respectively. The brighter the color, the higher contribution of the model. It can be seen from Figure 11 that the feature map of the ‘Kyoho’ grape bunch obtained by the improved model is more obvious and that more detailed features are obtained for the image in the input network. In addition, the feature information is more significant, which enhances the feature extraction ability of the network. Comparing the improved feature maps with the original network of Mask RCNN ResNet50/101, it is clear that by introducing the SE, CBAM, and CA modules, the effect is significantly improved in the ResNet50/101 backbone network. The target information can well suppress the other irrelevant target information and reduce the interference of the target background information. It can improve the ability of the network model to extract features and improve the recognition rate.
Figure 12 shows one example of the detection results for the models established by the different methods used in this study. From Figure 12, we can see that there was a deviation in the prediction of the maturity level category for the different models. The model established with ResNet + SE and ResNet + CBAM had a mediocre test effect, and the results of the maturity level judgment were fuzzy, while the model of ResNet + CA was more accurate in the prediction of the maturity level. For the performance of segmentation, the improved algorithm performed better, and the segmentation of the bottom and the edge of the grape bunch was more detailed.

4. Discussion

In this paper, the attention module was introduced into the backbone network of Mask RCNN to segment and identify the maturity of the “Kyoho” grape bunch. The performance of the model established by the combining of Mask RCNN_ResNet101 and coordinate attention was significantly higher than that of the other models.
First, the comparison of the established models with the other common networks of Solov2, Yolov3, and Yolact showed that the Mask RCNN can not only better detect the grape bunch but can also better segment the grape bunch by adding mask branches. At the same time, to solve the problem related to the fact that the feature map could not be accurately aligned with the original pixels, Mask RCNN used ROI to align the pixels, meeting the accuracy requirements of the image segmentation.
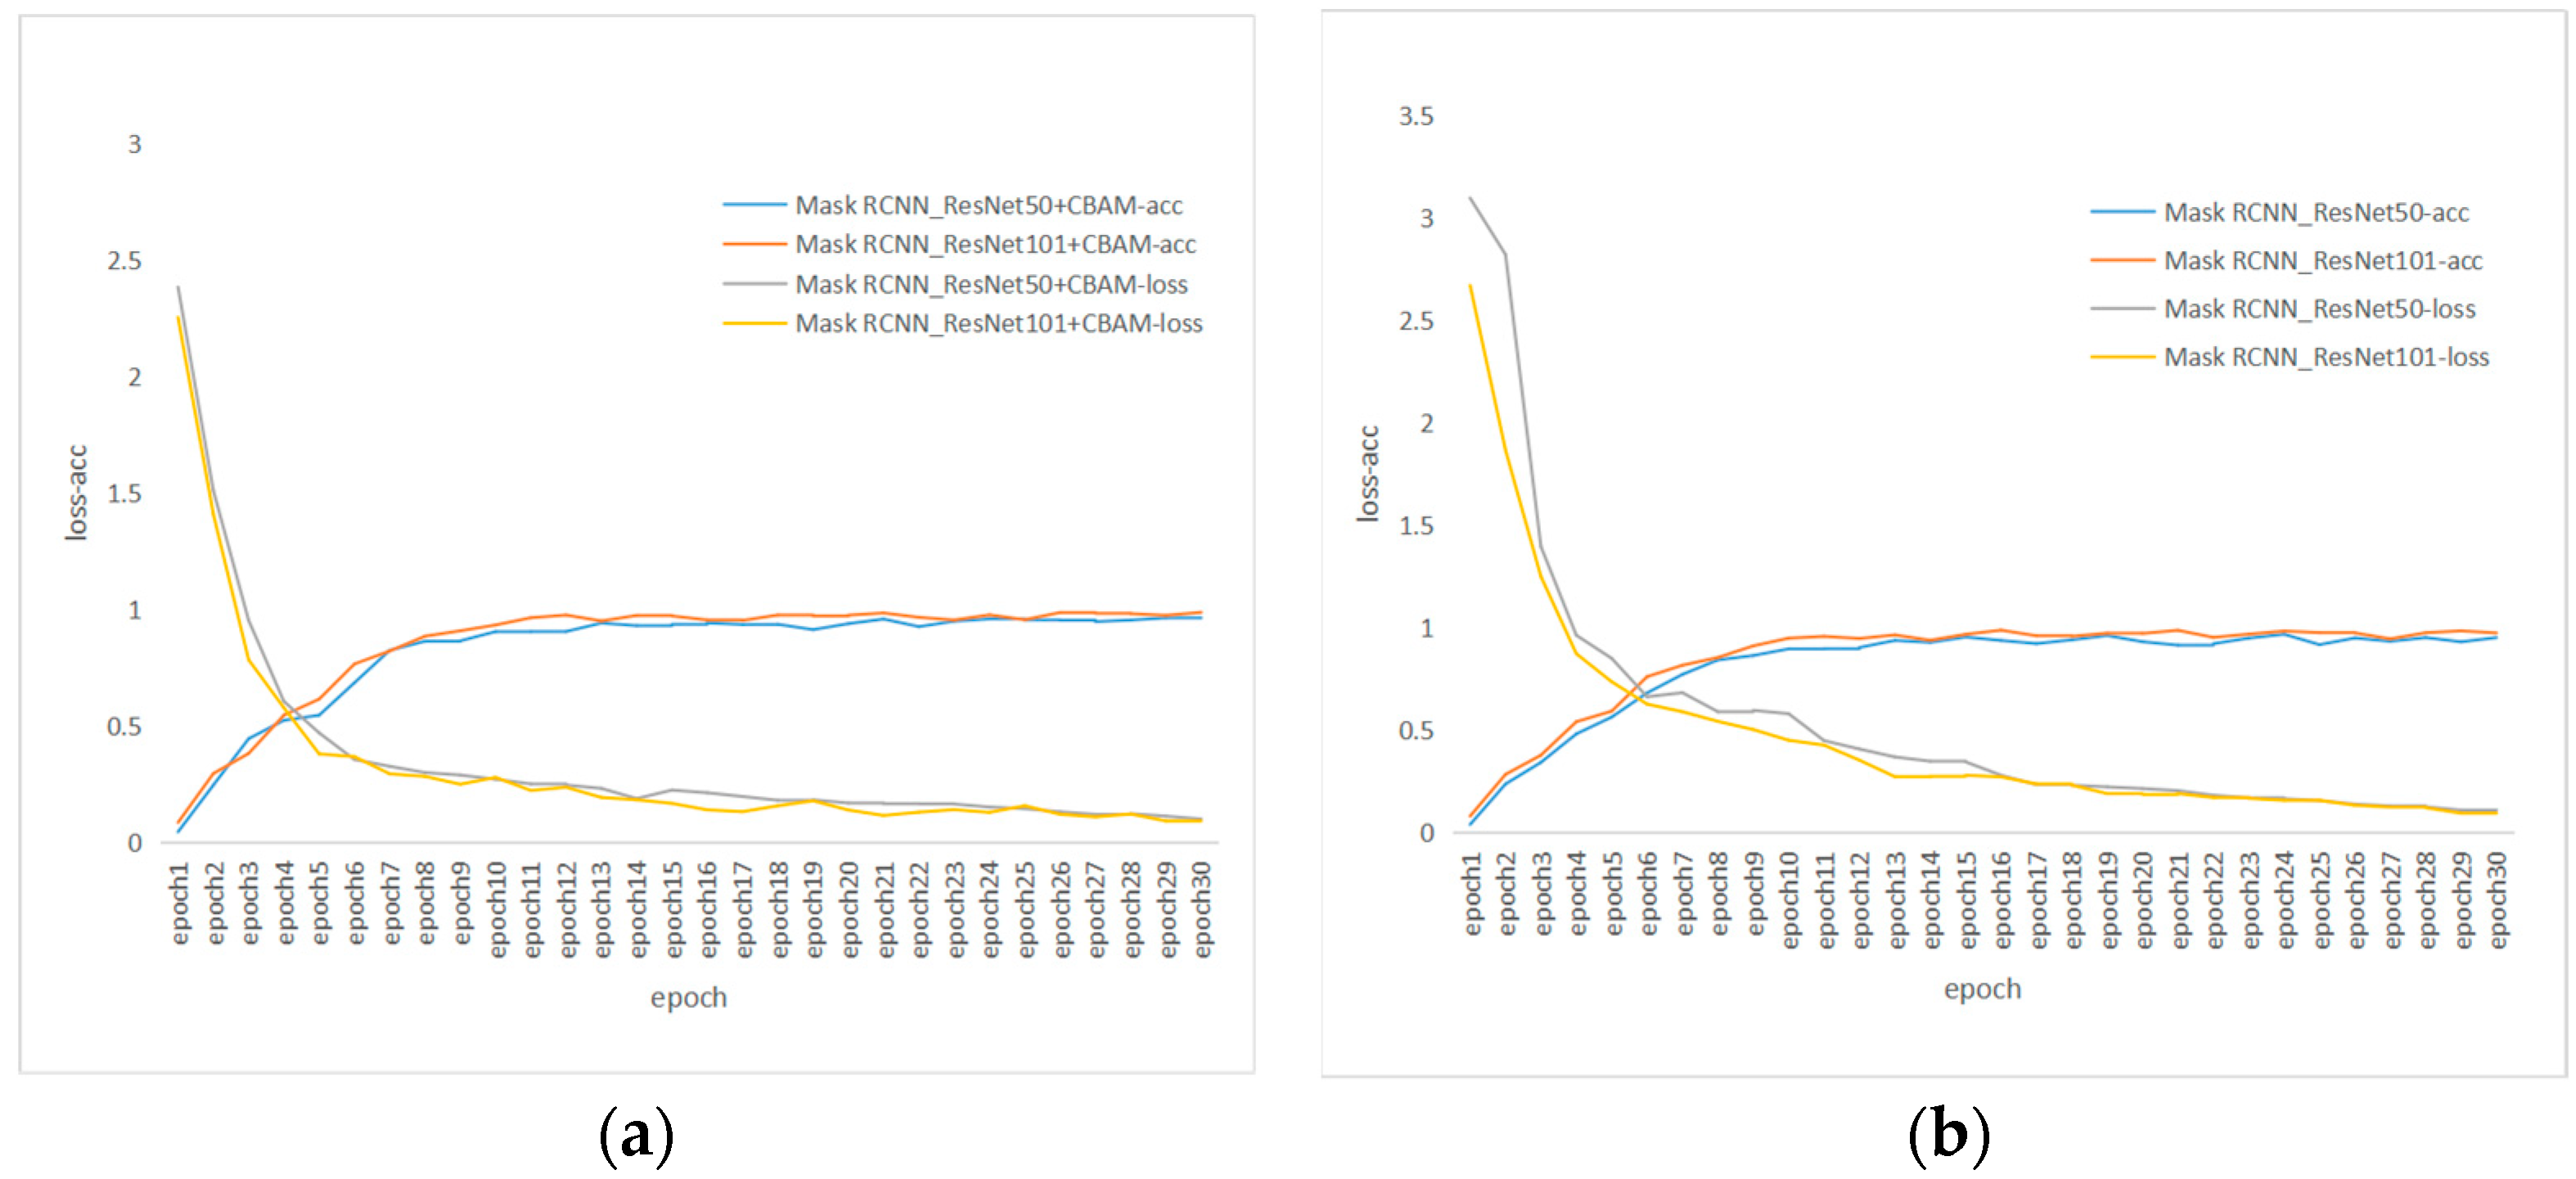
Second, ResNet101 and ResNet50 were used as the backbone networks to combine the different attention mechanism modules, respectively. Compared with the deep network, with the depth of the network layer the sensitivity field was larger; the features covered by the pixel blocks of the same size were richer; the image features extracted were more advanced; and the detection performance was significantly improved. On the same algorithm basis, the results of this paper further proved that the models established with the ResNet101-based methods were more accurate than the ResNet50-based methods.
Third, after the introduction of the attention mechanism module to the Mask RCNN, the module enhanced the attention of the ‘Kyoho’ grape bunch extraction; selected the focus position; generated more distinguishable feature representation; and made the model focus on the specific part of the input data, thus improving the ability and accuracy of the model in grape bunch extraction.
Fourth, the comparison of the three attention mechanisms shows that SE only focused on constructing the interdependence between channels, ignoring the spatial features. CBAM introduced the large-scale convolution kernel to extract the spatial features and took the maximum value and the average value of the multiple channels at each position as the weighting coefficients. Therefore, this weighting only considered the local range of information. CA carried out maximum pooling in the horizontal and vertical directions, and then transformed it to encode the spatial information. The spatial information was fused by means of weighted channels. The experiment shows that combining Mask RCNN and the attention mechanism module of CA can improve the performance of the grape maturity level detection model.
Fifth, the results of the image of the grape bunch acquired in different views, including the elevation image, flat image, backlight image, and downlight image, as well as the block image, showed that the model established by combining mask RCNN ResNet and the attention mechanisms could adapt to different complex backgrounds, improving the detection accuracy of the maturity level of the grape bunch.
The research of this paper is helpful in detecting the maturity level of the ‘Kyoho’ grape. At the same time, image processing was introduced into agriculture to provide help for the intelligent picking of ‘Kyoho’ grape. The estimated picking time of ‘Kyoho’ grapes can be deduced according to the maturity level of the grape bunch combined with the grape growth cycle, effectively avoiding the phenomenon of overripening or inaccurate picking time in the growth process of ‘Kyoho’ grapes. However, in the process of testing, it was found that there were still some errors in the segmentation of the edge of the grape bunch case. At the same time, the dataset used in this paper was small, and the data with regard to a complicated background should be collected later for an experimental supplement, which needs to be improved through subsequent experimental research.

5. Conclusions

In this paper, we proposed a modified and fully automatic grape bunch segmentation and maturity level identification algorithm based on Mask RCNN and attention mechanisms. To improve the accuracy of grape bunch segmentation, an attention mechanism module was added to the ResNet residual module of the Mask RCNN network. It helped the network to focus on important feature information while suppressing noise during training. The different deep layer networks of ResNet50 and ResNet101 were used as backbone networks to establish a maturity detection module of the grape bunch; the results showed that using deeper network layers can improve the segmentation accuracy of the grape bunches. In addition, the different attention mechanisms of SE, CBAM, and CA were introduced into the backbone network, respectively, to establish a maturity level detection model; the results showed that the performance of the model established by adding CA was significantly improved. In general, the proposed scheme was of great significance for automatic grape bunch segmentation and maturity level detection for picking in a natural environment. The improvement of the algorithm improved the detection accuracy of the grape maturity level to a certain extent. This model can provide rapid and accurate segmentation of grape bunches and detection of the maturity level, which contributes to the construction of intelligent vineyards and helps artificial intelligence to pick grapes and evaluate when to pick grapes. This not only helps to improve the commodity rate of ‘Kyoho’ grape but also provides a research basis for robot picking. This model we proposed needs to be validated and improved by a larger dataset with a more complicated background. In addition, a more accurate and faster model needs to be studied and developed in future studies.

Author Contributions

Conceptualization, Y.L.; formal analysis, J.W.; investigation, Y.W. and Y.L.; data curation, J.Z.; funding acquisition, Y.L. and D.X.; methodology, Y.W.; writing—original draft, Y.L. and Y.W.; writing—review, Y.L. and J.W.; visualization, Y.W. All authors have read and agreed to the published version of the manuscript.

Funding

This research was supported by grant (LQ21H180001) from the Natural Science Foundation of Zhejiang Province, grant (2019RF065) from the Research Development Foundation of Zhejiang A&F University, grant (20YJC630173) from the Ministry of Education of Humanities and Social Science Project, and grant (72001190) from the National Natural Science Foundation of China.

Institutional Review Board Statement

Not applicable.

Data Availability Statement

The data presented in this study are available on request from the corresponding author.

Conflicts of Interest

The authors declare no conflict of interest.

References

  1. Anderson, N.T.; Walsh, K.B.; Wulfsohn, D. Technologies for Forecasting Tree Fruit Load and Harvest Timing—From Ground, Sky and Time. Agronomy 2021, 11, 1409. [Google Scholar] [CrossRef]
  2. Yunling, L.; Tianyu, Z.; Ming, J.; Libo; Jianli, S. Research Progress of Grape Quality Nondestructive Testing Method Based on Machine Vision. Trans. Chin. Soc. Agric. Mach. 2022, 53, 299–308. [Google Scholar]
  3. Bellvert, J.; Mata, M.; Vallverdú, X.; Paris, C.; Marsal, J. Optimizing precision irrigation of a vineyard to improve water use efficiency and profitability by using a decision-oriented vine water consumption model. Precis. Agric. 2020, 22, 319–341. [Google Scholar] [CrossRef]
  4. Lu, S.; Liu, X.; He, Z.; Zhang, X.; Liu, W.; Karkee, M. Swin-Transformer-Yolov5 for Real-Time Wine Grape Bunch Detection. Remote Sens. 2022, 14, 5853. [Google Scholar] [CrossRef]
  5. Piazzolla, F.; Pati, S.; Amodio, M.L.; Colelli, G. Effect of Harvest Time on Table Grape Quality During on-Vine Storage. J. Sci. Food Agric. 2016, 96, 131–139. [Google Scholar] [CrossRef]
  6. Qiu, C.; Tian, G.; Zhao, J.; Liu, Q.; Xie, S.; Zheng, K. Grape Maturity Detection and Visual Pre-Positioning Based on Improved Yolov4. Electronics 2022, 11, 2677. [Google Scholar] [CrossRef]
  7. Lee, C.Y.; Bourne, M.C. Changes in Grape Firmness During Maturation. J. Texture Stud. 1980, 11, 163–172. [Google Scholar] [CrossRef]
  8. Herrera, J.; Guesalaga, A.; Agosin, E. Shortwave–near Infrared Spectroscopy for Non-Destructive Determination of Maturity of Wine Grapes. Meas. Sci. Technol. 2003, 14, 689. [Google Scholar] [CrossRef]
  9. Ben Ghozlen, N.; Cerovic, Z.G.; Germain, C.; Toutain, S.; Latouche, G. Non-Destructive Optical Monitoring of Grape Maturation by Proximal Sensing. Sensors 2010, 10, 10040–10068. [Google Scholar] [CrossRef]
  10. Bramley, R.; Le Moigne, M.; Evain, S.; Ouzman, J.; Florin, L.; Fadaili, E.M.; Hinze, C.; Cerovic, Z. On-the-Go Sensing of Grape Berry Anthocyanins During Commercial Harvest: Development and Prospects. Aust. J. Grape Wine Res. 2011, 17, 316–326. [Google Scholar] [CrossRef]
  11. Rahman, A.; Hellicar, A. Identification of Mature Grape Bunches Using Image Processing and Computational Intelligence Methods. In Proceedings of the 2014 IEEE Symposium on Computational Intelligence for Multimedia, Signal and Vision Processing (CIMSIVP), Orlando, FL, USA, 9–12 December 2014. [Google Scholar]
  12. Pothen, Z.; Nuske, S. Automated Assessment and mAPping of Grape Quality through Image-Based Color Analysis. IFAC-PapersOnLine 2016, 49, 72–78. [Google Scholar] [CrossRef]
  13. Luo, L.; Tang, Y.; Lu, Q.; Chen, X.; Zhang, P.; Zou, X. A Vision Methodology for Harvesting Robot to Detect Cutting Points on Peduncles of Double Overlapping Grape Clusters in a Vineyard. Comput. Ind. 2018, 99, 130–139. [Google Scholar] [CrossRef]
  14. Liu, S.; Whitty, M. Automatic Grape Bunch Detection in Vineyards with an Svm Classifier. J. Appl. Log. 2015, 13, 643–653. [Google Scholar] [CrossRef]
  15. Pérez-Zavala, R.; Torres-Torriti, M.; Cheein, F.A.; Troni, G. A Pattern Recognition Strategy for Visual Grape Bunch Detection in Vineyards. Comput. Electron. Agric. 2018, 151, 136–149. [Google Scholar] [CrossRef]
  16. Aggarwal, S.; Gupta, S.; Gupta, D.; Gulzar, Y.; Juneja, S.; Alwan, A.A.; Nauman, A. An Artificial Intelligence-Based Stacked Ensemble Approach for Prediction of Protein Subcellular Localization in Confocal Microscopy Images. Sustainability 2023, 15, 1695. [Google Scholar] [CrossRef]
  17. Gulzar, Y. Fruit Image Classification Model Based on MobileNetV2 with Deep Transfer Learning Technique. Sustainability 2023, 15, 1906. [Google Scholar] [CrossRef]
  18. Yasir, H.; Sharyar, W.; Arjumand, B.S.; Ali, A.; Yonis, G. Smart seed classification system based on MobileNetV2 architecture. In Proceedings of the 2022 2nd International Conference on Computing and Information Technology (ICCIT), Tabuk, Saudi Arabia, 25–27 January 2022. [Google Scholar]
  19. Ren, S.; He, K.; Girshick, R.; Sun, J. Faster R-Cnn: Towards Real-Time Object Detection with Region Proposal Networks. In Proceedings of the Advances in Neural Information Processing Systems 28, (NIPS 2015), Montreal, QC, Canada, 7–12 December 2015. [Google Scholar]
  20. Grimm, J.; Herzog, K.; Rist, F.; Kicherer, A.; Töpfer, R.; Steinhage, V. An adaptable approach to automated visual detection of plant organs with applications in grapevine breeding. Biosyst. Eng. 2019, 183, 170–183. [Google Scholar] [CrossRef]
  21. Fu, L.; Majeed, Y.; Zhang, X.; Karkee, M.; Zhang, Q. Faster R–CNN–based apple detection in dense-foliage fruiting-wall trees using RGB and depth features for robotic harvesting. Biosyst. Eng. 2020, 197, 245–256. [Google Scholar] [CrossRef]
  22. Parvathi, S.; Selvi, S.T. Detection of maturity stages of coconuts in complex background using Faster R-CNN model. Biosyst. Eng. 2021, 202, 119–132. [Google Scholar] [CrossRef]
  23. Wan, S.; Goudos, S. Faster R-Cnn for Multi-Class Fruit Detection Using a Robotic Vision System. Comput. Netw. 2020, 168, 107036. [Google Scholar] [CrossRef]
  24. Mai, X.; Zhang, H.; Jia, X.; Meng, M.Q.-H. Faster R-Cnn with Classifier Fusion for Automatic Detection of Small Fruits. IEEE Trans. Autom. Sci. Eng. 2020, 17, 1555–1569. [Google Scholar] [CrossRef]
  25. Shen, L.; Su, J.; Huang, R.; Quan, W.; Song, Y.; Fang, Y.; Su, B. Fusing Attention Mechanism with Mask R-CNN for Instance Segmentation of Grape Cluster in the Field. Front. Plant Sci. 2022, 2528. [Google Scholar] [CrossRef]
  26. Jia, W.; Wei, J.; Zhang, Q.; Pan, N.; Niu, Y.; Yin, X.; Ding, Y.; Ge, X. Accurate Segmentation of Green Fruit Based on Optimized Mask Rcnn Application in Complex Orchard. Front. Plant Sci. 2022, 13, 955256. [Google Scholar] [CrossRef]
  27. Mamat, N.; Othman, M.F.; Abdulghafor, R.; Alwan, A.A.; Gulzar, Y. Enhancing Image Annotation Technique of Fruit Classification Using a Deep Learning Approach. Sustainability 2023, 15, 901. [Google Scholar] [CrossRef]
  28. He, K.; Gkioxari, G.; Dollár, P.; Girshick, R. Mask R-CNN. In Proceedings of the IEEE International Conference on Computer Vision, Honolulu, HI, USA, 21–26 July 2017; pp. 2961–2969. [Google Scholar]
  29. Redmon, J.; Farhadi, A. Yolov3: An Incremental Improvement. arXiv 2018, arXiv:180402767. [Google Scholar]
  30. Wang, X.; Zhang, R.; Kong, T.; Li, L.; Shen, C. Solov2: Dynamic and Fast Instance Segmentation. Adv. Neural Inf. Process. Syst. 2020, 33, 17721–17732. [Google Scholar]
  31. Bolya, D.; Zhou, C.; Xiao, F.; Lee, Y.J. Yolact: Real-Time Instance Segmentation. In Proceedings of the IEEE/CVF International Conference on Computer Vision, Seoul, Republic of Korea, 27 October–2 November 2019; pp. 9157–9166. [Google Scholar]
  32. Hu, J.; Shen, L.; Sun, G. Squeeze-and-Excitation Networks. In Proceedings of the IEEE Conference on Computer Vision and Pattern Recognition, Salt Lake City, UT, USA, 18–23 June 2018; pp. 7132–7141. [Google Scholar]
  33. Woo, S.; Park, J.; Lee, J.-Y.; Kweon, I.S. Cbam: Convolu-tional Block Attention Module. In Proceedings of the European Conference on Computer Vision (ECCV), Munich, Germany, 8–14 September 2018; pp. 3–19. [Google Scholar]
  34. Hou, Q.; Zhou, D.; Feng, J. Coordinate Attention for Efficient Mobile Network Design. In Proceedings of the IEEE/CVF Conference on Computer Vision and Pattern Recognition, Nashville, TN, USA, 20 June–25 July 2021; pp. 13713–13722. [Google Scholar]
  35. He, K.; Zhang, X.; Ren, S.; Sun, J. Deep Residual Learning for Image Recognition. In Proceedings of the IEEE Conference on Computer Vision and Pattern Recognition, Las Vegas, NV, USA, 26 June–1 July 2016; pp. 770–778. [Google Scholar]
  36. Oktay, O.; Schlemper, J.; Folgoc, L.L.; Lee, M.; Heinrich, M.; Misawa, K.; Mori, K.; McDonagh, S.; Hammerla, N.Y.; Kainz, B. Attention U-Net: Learning Where to Look for the Pancreas. arXiv 2018, arXiv:180403999. [Google Scholar]
Figure 1. Examples of grape bunch images: (a) elevation image; (b) flat image; (c) backlight image; (d) downlight image; (e) screened image; (f) open image.
Agriculture 13 00914 g001
Figure 2. Maturity morphology of ‘Kyoho’ grapes at different stages: (a) maturity level 1; (b) maturity level 2; (c) maturity level 3; (d) maturity level 4.
Agriculture 13 00914 g002
Figure 3. Dataset calibration diagram: (a) original image; (b) label of maturity grade; (c) calibrated image.
Agriculture 13 00914 g003
Figure 4. Mask RCNN structure diagram.
Agriculture 13 00914 g004
Figure 5. SE structure diagram.
Agriculture 13 00914 g005
Figure 6. CBAM structure diagram: (a) channel attention module; (b) spatial attention module; (c) convolutional block attention module.
Agriculture 13 00914 g006aAgriculture 13 00914 g006b
Figure 7. CA structure diagram.
Agriculture 13 00914 g007
Figure 8. Schematic diagrams for the combining of ResNet and attention mechanism modules: (a) ResNet + SE; (b) ResNet + CBAM; (c) ResNet + CA.
Agriculture 13 00914 g008
Figure 9. Loss and accuracy variation: (a) loss and accuracy changes of Mask RCNN_ResNet50 and Mask RCNN_ResNet101; (b) loss and accuracy changes of Mask RCNN_ResNet50 + SE and Mask RCNN_ResNet101 + SE; (c) loss and accuracy changes of Mask RCNN_ResNet50 + CBAM and Mask RCNN_ResNet101 + CBAM; (d) loss and accuracy changes of Mask RCNN_ResNet50 + CA and Mask RCNN_ResNet101 + CA.
Agriculture 13 00914 g009aAgriculture 13 00914 g009b
Figure 10. Qualitive comparison of performance between different models established with Mask RCNN Res-Net50/101 + SE/CBAM/CA, respectively.
Agriculture 13 00914 g010
Figure 11. Comparison of feature maps of different models: (a) the feature map with ResNet50 as the backbone network; (b) the feature map with ResNet50 + SE as the backbone network; (c) the feature map with ResNet50 + CBAM as the backbone network; (d) the feature map with ResNet50 + CA as the backbone network; (e) the feature map with ResNet101 as the backbone network; (f) the feature map with ResNet101 + SE as the backbone network; (g) the feature map with ResNet101 + CBAM as the backbone network; (h) the feature map with ResNet101 + CA as the backbone network.
Agriculture 13 00914 g011aAgriculture 13 00914 g011b
Figure 12. Examples of detection results for models established by different models: (a) detection result with model established by ResNet50; (b) detection result with model established by ResNet50 + SE; (c) detection result with model established by ResNet50 + CBAM; (d) detection result with model established by ResNet50 + CA; (e) detection result with model established by ResNet101; (f) detection result with model established by ResNet101 + SE; (g) detection result with model established by ResNet101 + CBAM; (h) detection result with model established by ResNet101 + CA.
Agriculture 13 00914 g012
Table 1. Experimental model parameters.
Training ParameterParameter Value
Input picture size800 × 500
Batch size2
Epochs30
OptimizerSGD
Learning rate0.0025
Weight Decay0.0001
Momentum0.9
Table 2. Experimental comparison between Mask RCNN and common networks.
ModelmAPAP for Level 1AP for Level 2AP for Level 3AP for Level 4
Solov20.7390.8090.6590.7090.777
Yolov30.7390.8500.5070.7490.898
Yolact0.7990.8950.6890.7160.897
Mask RCNN_ResNet500.8460.9670.7640.7660.887
Mask RCNN_ResNet1010.8690.9470.7540.8180.956
AP is the mean average precision; AP is the average precision.
Table 3. Comparison of performances of models established by combining Mask RCNN ResNet50 and the different attention mechanisms SE, CBAM, and CA, respectively.
ModelmAPmAP0.75Accuracy
Mask RCNN ResNet500.8460.8030.736
Mask RCNN ResNet50 + SE0.8640.8350.866
Mask RCNN ResNet50 + CBAM0.8980.8540.803
Mask RCNN ResNet50 + CA0.9070.8890.883
mAP is the mean average precision; mAP0.75 is the mean average precision value when the intersection over union threshold was set at 0.75.
Table 4. Comparison of performance for models established by combining Mask RCNN ResNet101 and the different attention mechanisms SE, CBAM, and CA, respectively.
ModelmAPmAP0.75Accuracy
Mask RCNN ResNet1010.8690.8470.850
Mask RCNN ResNet101 + SE0.9050.8680.917
Mask RCNN ResNet101 + CBAM0.9200.8770.933
Mask RCNN ResNet101 + CA0.9340.8910.944
mAP is the mean average precision; mAP0.75 is the mean average precision value when the intersection over union threshold was set at 0.75.
Table 5. Incremental comparison between Mask RCNN ResNet50-based model and the combination of Mask RCNN ResNet50 with three attention mechanism-based models.
ModelmAP VariationmAP0.75 VariationAccuracy Variation
Mask RCNN ResNet50///
Mask RCNN ResNet50 + SE1.8%3.2%13%
Mask RCNN ResNet50 + CBAM5.2%5.1%6.7%
Mask RCNN ResNet50 + CA6.1%8.6%14.7%
mAP is the mean average precision; mAP0.75 is the mean average precision value when the intersection over union threshold was set at 0.75.
Table 6. Incremental comparison between Mask RCNN ResNet101-based model and the combination of Mask RCNN ResNet101 with three attention mechanism-based models.
ModelmAP VariationmAP0.75 VariationAccuracy Variation
Mask RCNN ResNet101///
Mask RCNN ResNet101 + SE3.6%2.1%6.7%
Mask RCNN ResNet101 + CBAM5.1%3.0%8.3%
Mask RCNN ResNet101 + CA6.5%4.4%9.4%
mAP is the mean average precision; mAP0.75 is the mean average precision value when the intersection over union threshold was set at 0.75.
Disclaimer/Publisher’s Note: The statements, opinions and data contained in all publications are solely those of the individual author(s) and contributor(s) and not of MDPI and/or the editor(s). MDPI and/or the editor(s) disclaim responsibility for any injury to people or property resulting from any ideas, methods, instructions or products referred to in the content.

