Article

The Effect of Glutamine as Feed Additive on Selected Parameters of the Nonspecific Immune Response in Pigs

1
Department of Epizootiology and Clinic of Infectious Diseases, Faculty of Veterinary Medicine, University of Life Sciences in Lublin, Głęboka 30, 20-612 Lublin, Poland
2
Department of Animal Physiology, Faculty of Veterinary Medicine, University of Life Sciences in Lublin, 20-950 Lublin, Poland
3
Department of Preventive Veterinary and Avian Diseases, Faculty of Veterinary Medicine, University of Life Sciences in Lublin, Głęboka 30, 20-612 Lublin, Poland
4
Department of Animal Breeding and Product Quality Assessment, Poznań University of Life Sciences, Wołynska 33, 60-637 Poznań, Poland
5
Department of Pharmacology, Toxicology and Environmental Protection, University of Life Sciences, 20-950 Lublin, Poland
6
Department of Animal Nutrition and Feed Science, National Research Institute of Animal Production, Krakowska St. 1, 32-083 Balice, Poland
7
Department of Botany, Mycology, and Ecology, Maria Curie-Skłodowska University, Akademicka 19, 20-033 Lublin, Poland
*
Author to whom correspondence should be addressed.
Agriculture 2023, 13(4), 912; https://doi.org/10.3390/agriculture13040912
Submission received: 31 March 2023 / Revised: 14 April 2023 / Accepted: 18 April 2023 / Published: 21 April 2023

Abstract

:
The use of feed additives containing glutamine can influence the growth and development of piglets during the weaning period. The aim of this study was to determine the effect of feed supplementation with 0.5% L-glutamine on selected parameters of the nonspecific immune response of pigs. The research was carried out on 60 pigs (Polish Large White × Polish Landrace), from 28 days of age to slaughter. The obtained results showed an increased percentage of phagocytic cells (monocytes and granulocytes) and oxygen blast cells in pigs between 28 and 70 days of age, proving that non-specific immune mechanisms were stimulated, which contributed to the improvement of the processes of antigen elimination from the body. The increase in the percentage of cells expressing SWC3, CD11b/CD18+, CD14+ and CD14+CD16+ molecules on granulocytes and monocytes during this period resulted in the enhancement of the host defense mechanisms by stimulating phagocytosis and enhancing the mechanisms of a non-specific immune response. The high concentration of TNF-α and IL-1β as well as Il-10 in the experimental group indicates the cellular phenotype of the Th1-type response, and the maintenance of the immune balance between the pro-inflammatory and anti-inflammatory responses and ensuring the homeostasis of the organism.

1. Introduction

Pig production is an important and dynamically growing sector of the economy all over the world. The last 30 years have seen the rapid growth of industrial production systems, one feature of which is optimized feeding systems that increase production intensity and improve production parameters determining the profitability of pig farming [1]. The basis of modern feeding strategies that meet the nutritional needs of animals of various ages and production groups is the use of energy-balanced feed mixtures containing the necessary nutrients, including amino acids and microelements in organic and inorganic forms [2]. The principle of early weaning of piglets, which is one of the foundations of modern production systems, is unfortunately associated with various factors leading to gastrointestinal dysfunctions in piglets, increasing the risk of diarrhea and reducing the potential of local immunity of the intestinal mucosa [3].
One means of preventing these adverse phenomena is the use of feed additives containing glutamine, which favorably influences the growth and development of pigs, the productivity of gilts and sows, and intestinal motility in piglets during the weaning period [4,5]. Glutamine has been shown to be an important energy substrate for immune cells, as it influences their functioning and, indirectly, the regulation of homeostasis in the body [6]. The effect of glutamine on immune processes is also evidenced by the fact that it functions as a regulator of the expression of genes associated with cytokine production by T cells involved in phagocytosis and antigen presentation [7]. Glutamine is also a source of nitrogen essential for the synthesis of purines, pyrimidines, nucleotides, and amino sugars, and it stimulates lymphocyte proliferation [8]. Another important function of glutamine is its effect on the synthesis of glutathione, a strong antioxidant protecting cells in conditions of oxidative stress [9]. This amino acid plays an important role in the nitrogen metabolism in the body, is essential for the synthesis of nitric oxide in macrophages and monocytes, and also stimulates arginine synthesis [9].
Feed supplementation with glutamine has beneficial effects on the gastrointestinal tract of pigs, especially piglets with low body weight or those weaned early [10,11]. The literature also indicates that glutamine helps to reduce the effects of weaning stress in piglets through its positive effect on the epithelial cells of the small intestine, ensuring the structural and functional integrity of the intestines, and by enhancing immune and antioxidant functions through its effect on lymphocytes and reticuloendothelial cells [3,12,13,14].
Despite the many published research results on the effect of glutamine ingested with feed on the growth, development and health of pigs, little attention has been paid to its effect on the immune response in pigs. Studies carried out in humans and on mice and rat models indicate that glutamine is essential in lymphocyte proliferation and the production of cytokines IL-1, IL-6, IL-8 and TNF-α by monocytes and macrophages, and also to ensure the phagocytic and secretory activity of macrophages. It also determines the microbicidal capacity of neutrophils and supports the synthesis of NK cells taking part in cytokine production [8,12,15,16]. The available data indicate that the use of 0.5% glutamine in pigs in the post-weaning period has an anti-inflammatory effect by reducing the concentration of pro-inflammatory cytokines, i.e., TNF-α, IL-1β and IL-6 in the serum [17,18]. Similarly, the administration of 2% glutamine in the feed of castrated piglets reduced the inflammatory response by reducing TNF-α concentration [17]. Wu et al. [19], showed that the use of glutamine in pigs experimentally poisoned with deoxynivalenol (DON), which reduces the concentration of pro-inflammatory IL-2 and TNFα. Yu et al. [20] showed that the use of glutamine in pigs affects the stimulation of both cellular and humoral responses. These authors experimentally demonstrated that feed supplementation with 1% glutamine resulted in a higher IgG titer in the serum of piglets, which was able to neutralize FMD antibodies in LPS-challenged animals. However, the exact mechanism by which glutamine influences the immune response is not fully understood. An analysis of previous research results confirms the beneficial effect of glutamine on macrophage and lymphocyte activity, expressed in part as an increase in the ability of macrophages to produce cytokines TNFα, IL-1β and IL-6 and as an increased lymphocyte reactivity to mitogens [8,21,22]. The hypothesis of these studies assumes that feed supplementation with glutamine leads to an increase in the percentage of monocyte and granulocyte phagocytic cells and oxygen bursts in pigs between 28 and 70 days of age, which strengthens the mechanisms of the non-specific immune response, compared to the group of pigs not receiving glutamine supplementation in the feed. The aim of the study was to determine the effect of feed supplementation with glutamine on selected parameters of the nonspecific immune response in pigs. Given the lack of such studies in the available literature, the research should be considered original and pioneering.

2. Materials and Methods

2.1. Experimental Animals

All experimental procedures were approved by The Local Ethics Committee on Animal Experimentation of the University of Life Sciences in Lublin, Poland (51/2017) and were in compliance with Directive 2010/63/EU of the European Parliament and of the Council on the protection of animals used for scientific purposes. Throughout the experimental period, the health status of pigs was monitored by a veterinarian.
The experiment was carried out on a private pig farm with a closed production cycle. Screening tests at the National Veterinary Institute in Puławy confirmed that the farm was free from infectious diseases affecting pigs. The study was conducted on 60 crossbred barrows (Polish Large White × Polish Landrace) with an initial body weight of 13 kg +/−0.3 kg. The pigs were divided into two groups of 30 pigs each (six replicates of five pigs per group): group I—control and group II—experimental. The control and experimental groups were kept on opposite sides of the barn aisle and had no direct contact with each other. This prevented accidental contamination of the feed of the control group with glutamine. Animals from individual pens had only visual and auditory contact with each other, which is in accordance with the welfare recommendations. The experiment started on the 28th day of the pigs’ lives. Each pig from group I and II was marked with an ear tag. Each ear tag had an individual animal number. All pigs used in the experiment were born at term via natural birth. Until weaning at the age of 28 days, all piglets were housed with their own mothers and not relocated to other sows, and fed with a standard feed mixture (piglets were accustomed to the solid feed from the 7th day of age), which was the same for all animals. After weaning the pigs were kept in group pens with plastic slatted flooring, with each group (control and experimental) in a separate pen. The temperature in the pens was maintained at 28 °C, using cooling and/or heating systems when needed. The hygiene conditions in the animals’ housing were good.
Experimental animals were fed ad libitum with a complete feed mixture in automatic feeders. Water was supplied continuously. The feeding program was developed in accordance with the Polish Nutrition Recommendations for Pigs [23]. No antibiotics or vaccines were used in the animals during the experiment. The compositions of the feed mixtures that were administered to the pigs in the control and experimental groups are listed in Table 1 and Table 2. The L-glutamine supplement: Wuhan Yuancheng Gongchuang Technology Co., LTD, Wuhan, Hubei, China; purity ≥ 99.5%. The amount of glutamine in pig diets was analyzed with an INGOS AAA400 apparatus (Ingos Corp., Prague, Czech Republic) using the AOAC method 994.12, and the obtained results confirmed 34 g/kg of glutamine in the basal feed in the control group and 33.5 g/kg in the basal feed mixture in the experimental group for the experimental time. During the remainder of the rearing period (71–160 days of age), pigs in both groups received the same diet, without L-glutamine supplementation (Table 1). At 160 days of age, all pigs were sent for slaughter.

2.2. Blood Samples Collection

Peripheral blood samples from the external jugular vein were collected into heparin, EDTA-K2 and clotting-activator tubes (Medlab Products, Poland). Blood was collected from all animals used in the experiment at 28, 70 and 160 days of age. Blood samples were transported within 1 h at +4–8 °C. Samples with EDTA-K2 and heparin were analyzed in flow cytometer immediately after delivery to the laboratory. Serum was obtained by centrifugation at room temperature (20–22 °C) for 15 min at 1000× g and then stored at −80 °C for further analysis.

2.3. Determination of Selected Immune Response Parameters

Cytometric analysis of the samples was performed at up to 20,000 events per second in a flow cytometer (BD FACSVerse™, Becton Dickinson, Franklin Lakes, Brea, NJ, USA) according to the methodology described by Laskowska et al. [24]. Monoclonal antibodies to porcine cell surface molecules labeled with a fluorochrome were used in the study: SWC3 (Mouse Anti-Porcine Monocyte/Granulocyte): FITC (clone 74-22-15, Beckman Coulter, Inc., Fullerton, CA, USA), CD11b (clone CA16. 3E10, Bio-Rad, Puchheim, Germany), secondary antibodies to CD11b-Rabbit F(ab’)2 anti-mouse IgG:FITC (STAR9b, Bio-Rad, Puchheim, Germany), CD18: RPE (clone YFC118.3 Bio-Rad, Puchheim, Germany), Mouse anti Pig CD14:FITC (MIL2 clone, Bio-Rad, Puchheim, Germany), Mouse anti Pig CD16:RPE (G7 clone, Bio-Rad, Puchheim, Germany), negative mouse control IgG1:FITC, Mouse IgG1:RPE Negative Control and Mouse IgG2b:FITC Negative Control. The study used direct cell labeling. SWC3:FITC+, CD11b:FITC+/CD18:RPE+, CD14:FITC+ and CD14:FITC+/CD16:RPE+ were assayed separately in each blood sample (Figure 1 and Figure 2). The immunophenotype (CD) of blood cells was assessed according to Sinkora et al. [25].

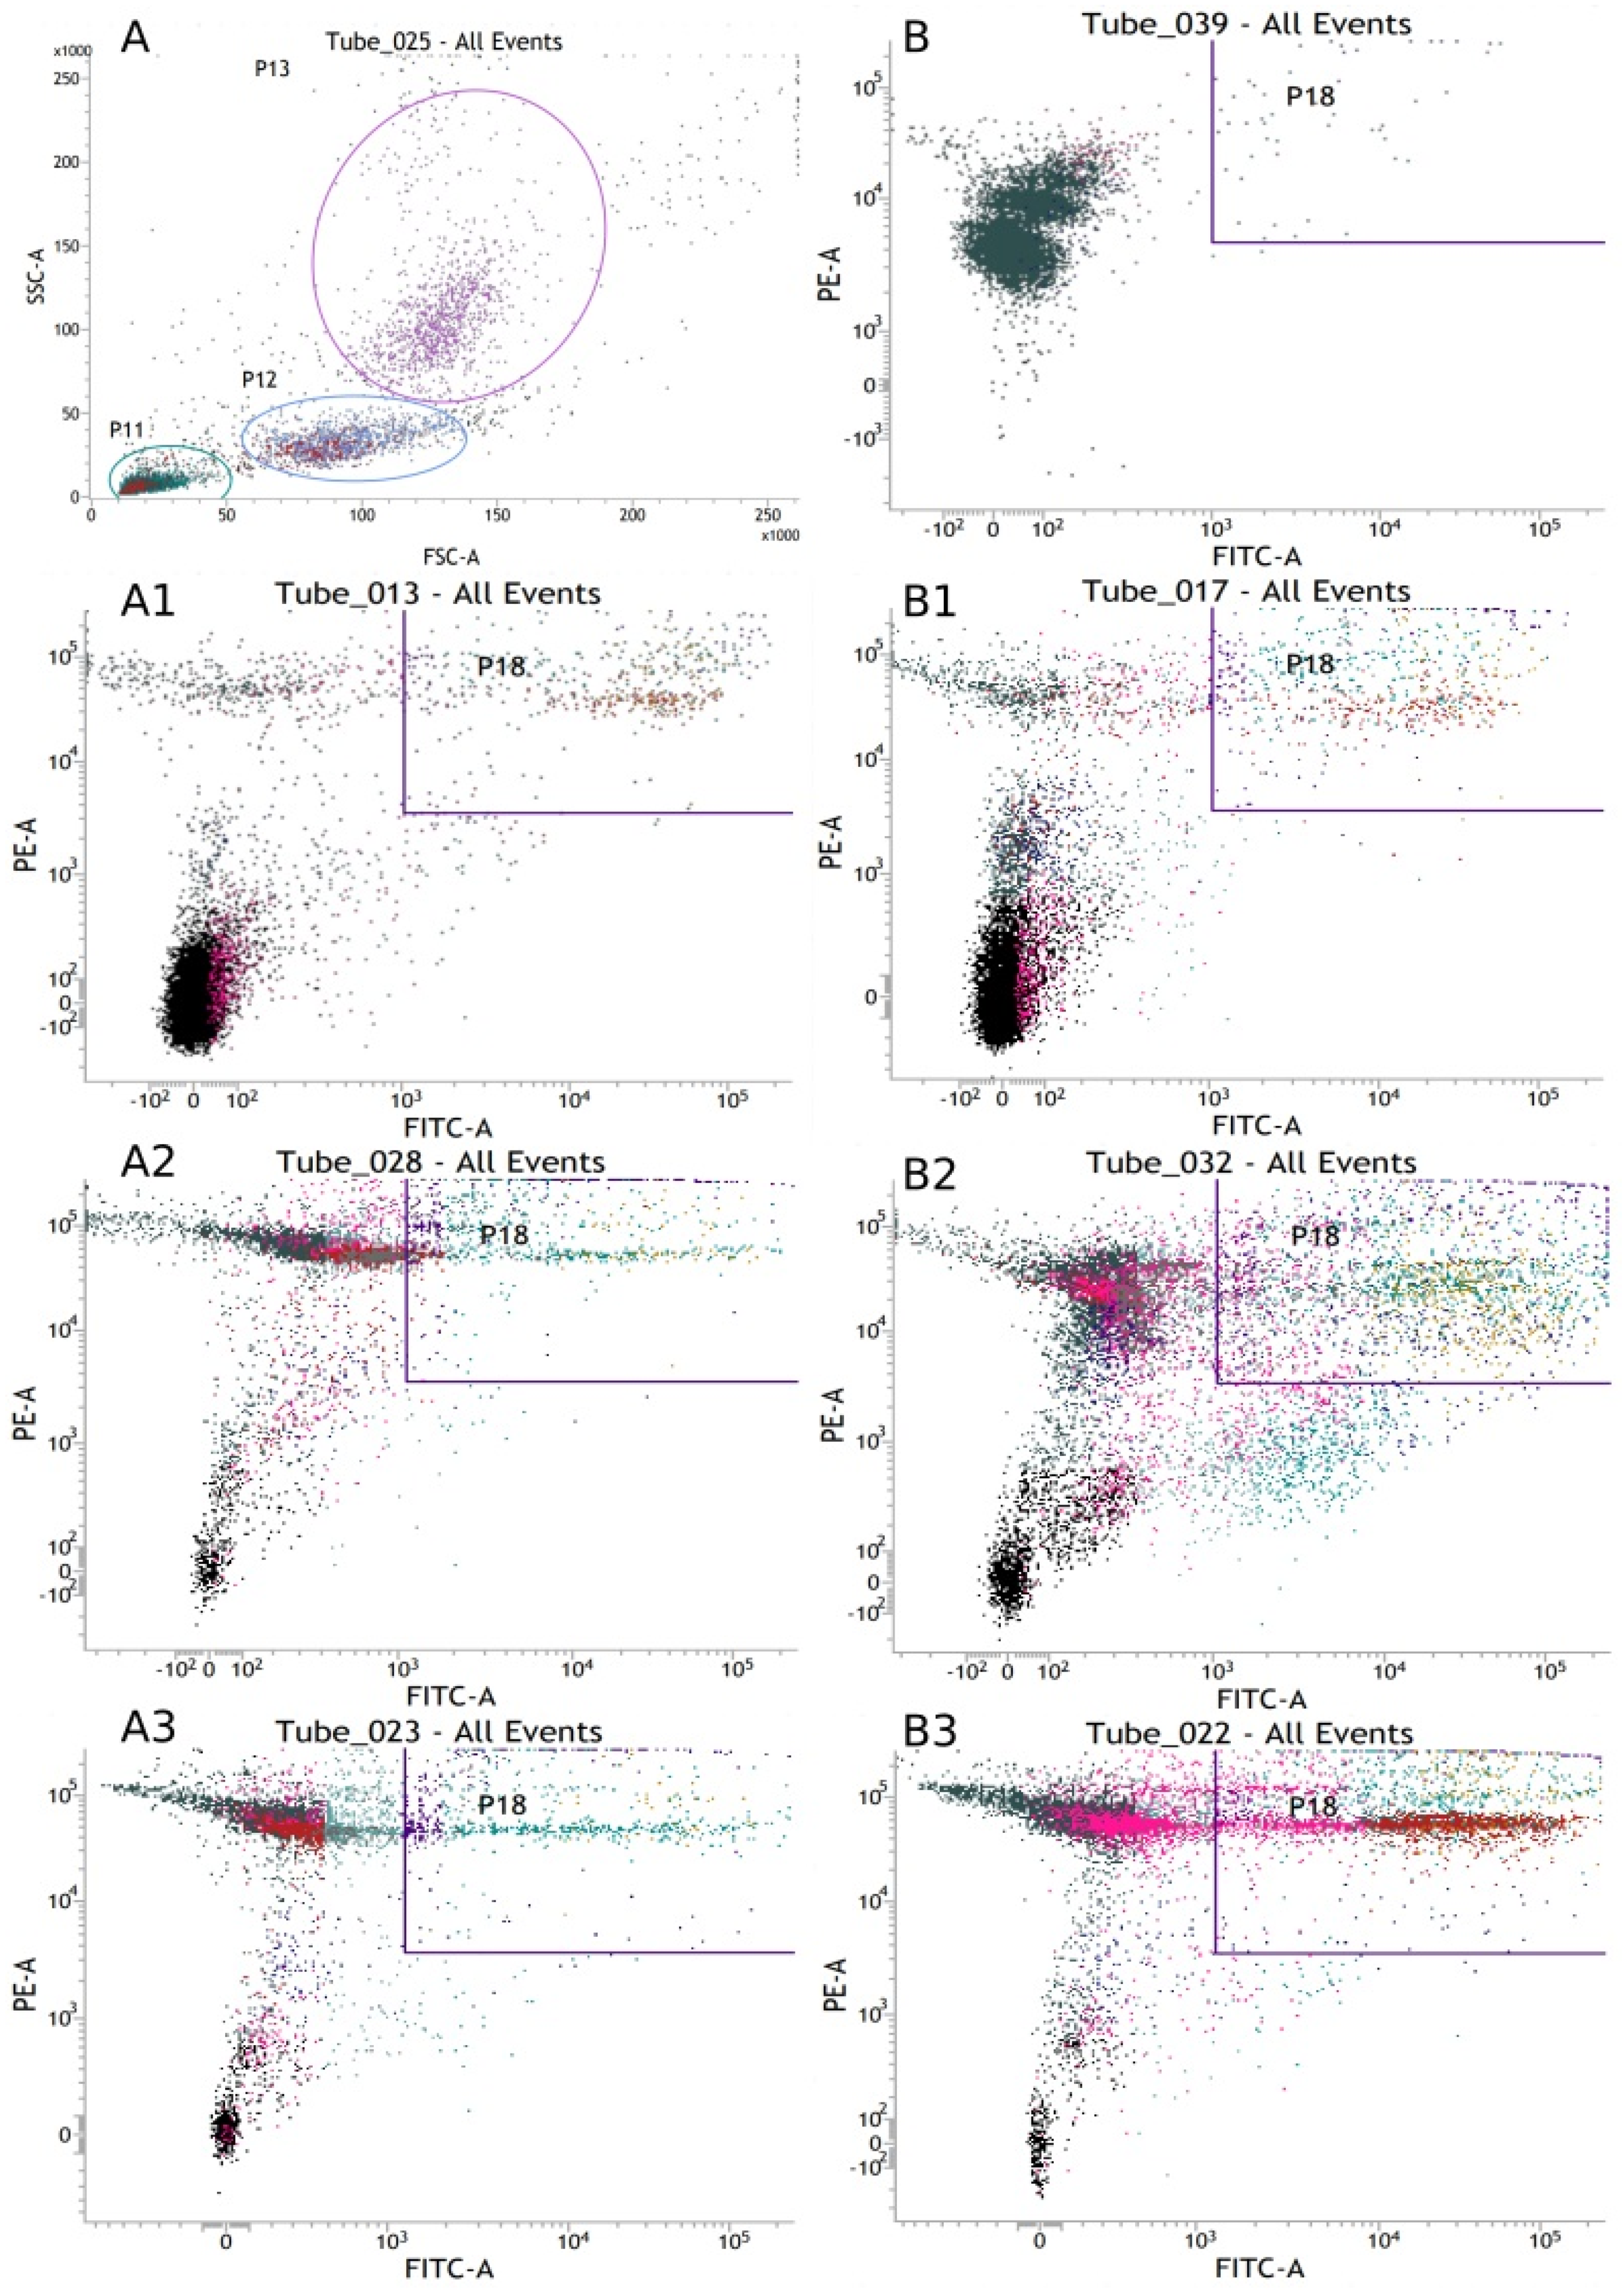
2.4. Assessment of Phagocytosis

The Phagotest™ (ORPEGEN Pharma, Heidelberg, Germany) was prepared using reagent kit for the quantitative determination of the phagocytic activity of monocytes and granulocytes in heparinized whole blood. Reagent kit contained opsonized E. coli-FITC bacteria. The samples were prepared according to instruction of PHAGOTEST™ version 07/14 (Glycotope Biotechnology GmbH, Berlin, Germany). The samples were analyzed by flow cytometry. Detailed data are presented in Table 3 and Figure 3.

2.5. Respiratory Burst of Granulocytes and Monocytes

The Phagoburst™ (ORPEGEN Pharma, Heidelberg, Germany) was prepared using a reagent kit for the quantification of the oxidative burst activity of monocytes and granulocytes in heparinized whole blood. The reagent kit contained fluorogenic substrate dihydrorhodamine (DHR) 123. The samples were prepared according to the instructions of PHAGOBURST™ version 10/14 (Glycotope Biotechnology GmbH, Berlin, Germany). The samples were analyzed by flow cytometry. Detailed data are presented in Table 4.

2.6. Determination of the Bacteriolytic Activity of Lysozyme (LZM) in the Peripheral Blood of Pigs

The lysozyme concentration in the serum of pigs from groups I and II (Figure 2) was determined by the Hankiewicz and Świerczek method [26]. See Figure 2.

2.7. Assay of IL-1β, IL-6, IL-10 and TNF-α in Pig Serum

ELISA kits (Wuhan Fine Biotech Co., Ltd., East Lake High-Tech Development District, Wuhan, Hubei Province, China) were used to determine IL-1β, IL-6, IL-10 and TNF-α in pig serum. All assays were performed according to the manufacturer’s protocols. All samples were tested in triplicate. See Table 5.

2.8. Assay of L-Glutamine and Glutamate in Pig Serum

Serum free amino acid concentrations (L-glutamine and glutamate, nmol/mL) were analyzed by ion exchange chromatography using an INGOS AAA-400 amino acid analyzer (INGOS Corp., Prague, Czech Republic). Amino acid separation was performed using an OSTION LG FA analytical column (3 mm × 200 mm) and lithium citrate buffers. Amino acids were derivatized with ninhydrin, and their determination was based on retention time in comparison to the standards, using a photocell combined with a computer. Apparatus-integrated MIKRO software (INGOS Corp., Prague, Czech Republic) was used for amino acid evaluation. Each sample was tested in duplicate. The results were expressed as mean and standard deviation (±SD). See Figure 4.

2.9. Statistical Analysis

After testing the data for normality and homoscedasticity, an analysis of variance of the data was performed, followed by non-parametric tests. Friedman’s test for repeated measures and post hoc tests were used to compare the effect of time on the results within the control group (group I) and the experimental group (group II). The grouping variable was the time of sample analysis: day 28, 70 and 160. The results were additionally confirmed by the Kendall’s coefficient of concordance (W), which can take values from 0 to 1. The Mann–Whitney U test was used to show the statistical significance of the differences between the control and experimental groups at the same time of measurement as the grouping variable. The results were expressed as mean and SD, and differences were considered significant at p < 0.05. Statistical analyses were performed using Statistica 13.2 software (Stat. Soft, Inc., Krakow, Poland). Principal component analysis (PCA) was used to explain the relationships between the presented blood parameters and to identify the factors of variability. Before PCA, the data were centered. Analyses were performed with the statistical package (MVSP) program version 3.1 [27]. See Figure 5 and Table 6.

3. Results

3.1. Determination of Selected Immune Response Parameters

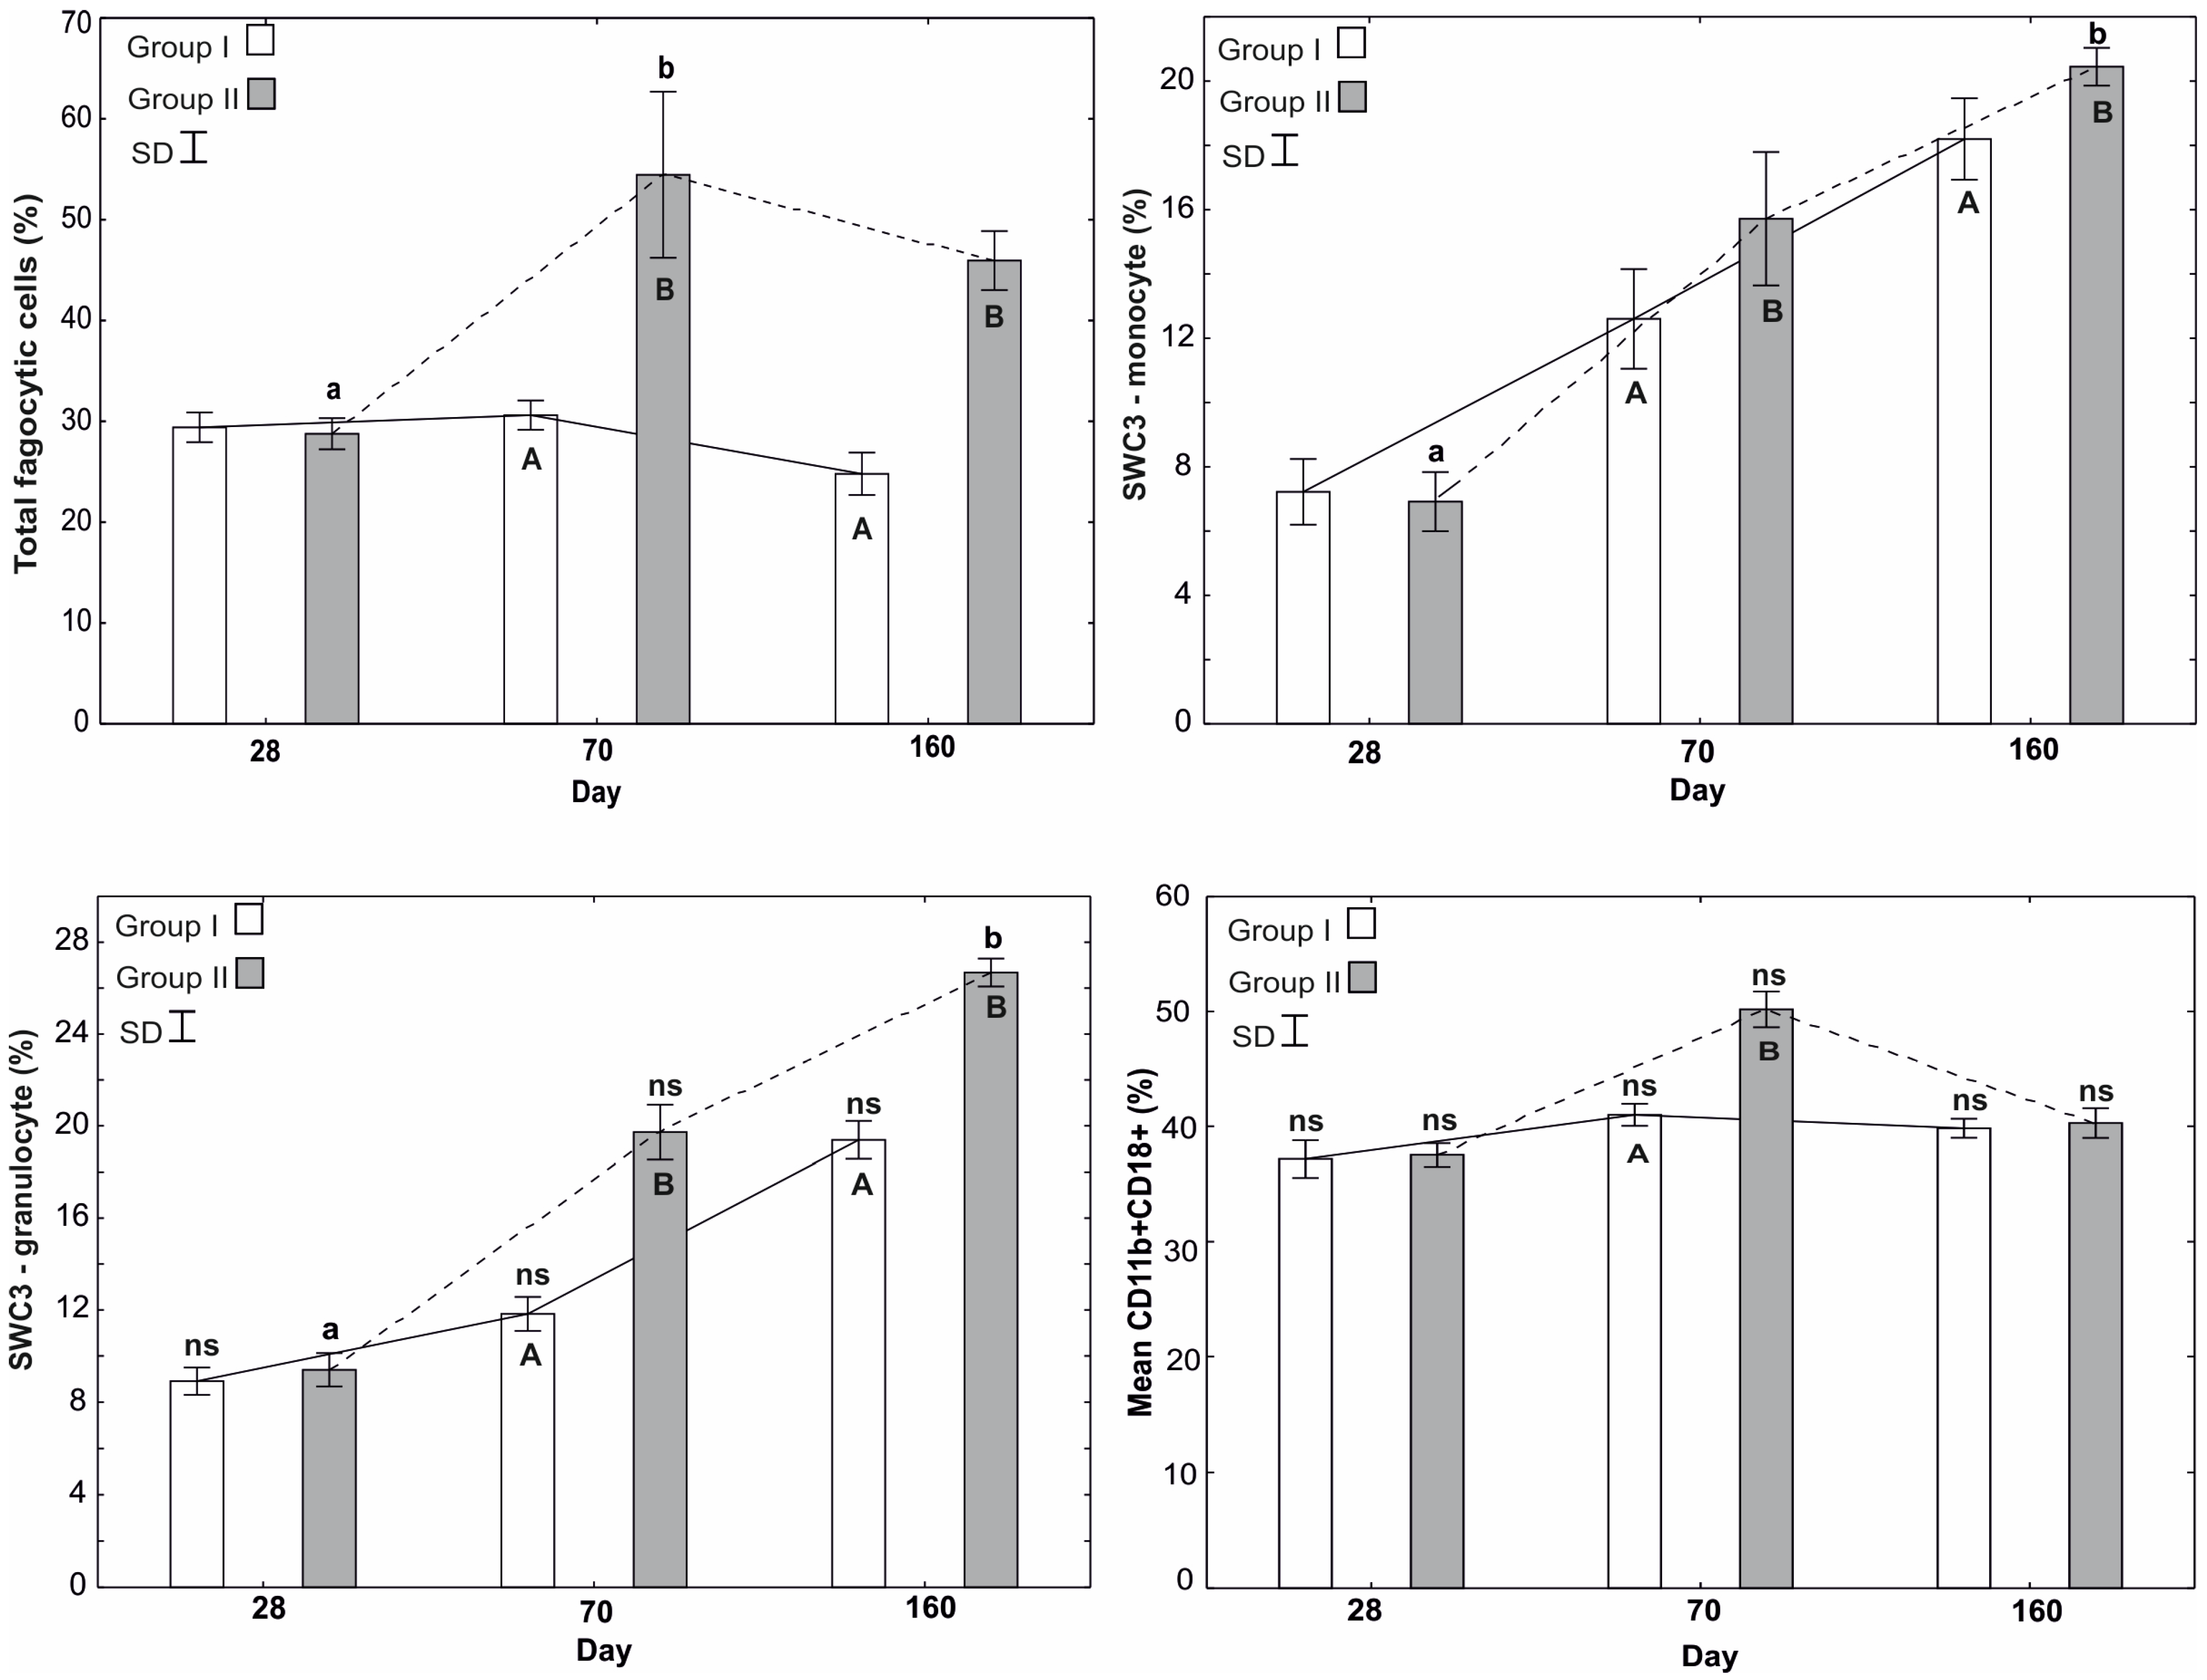
3.1.1. Mean Total Phagocyte Count

The results are shown in Figure 1. In the experimental group (group II), at 70 days of age, there was a statistically significant increase (p ≤ 0.05) in the total number of phagocytes and their percentage relative to the start of the experiment (28 days of age). A comparison of the total phagocyte count between the control group and the group receiving glutamine showed no statistically significant differences at 28 days of age, but there was a statistically significant increase (p ≤ 0.05) in the experimental group at 70 and 160 days.

3.1.2. Percentages of SWC3-Monocytes and SWC3-Granulocytes

The results are shown in Figure 1. The analysis of SWC3-monocytes (%) and SWC3-granulocytes (%) in the control and experimental groups showed a statistically significant increase (p ≤ 0.05), in these parameters during the experiment. The final percentage of monocytes (160 days of age) was statistically significantly higher (p ≤ 0.05) than at the start of the experiment (28 days of age) in both groups. Similar results were obtained for the percentage of granulocytes. A comparison of the percentage of monocytes and granulocytes between the control and experimental groups showed statistically significant differences (p ≤ 0.05) at 70 and 160 days of age. The percentage of monocytes and granulocytes in the blood of pigs was higher in the experimental group than in the control group.

3.1.3. Mean Percentage of CD11b+CD18+

The results are shown in Figure 1. There were no statistically significant differences in the mean CD11b+CD18+ percentage in the control group of pigs on all study days. Similar relationships were observed in the experimental group; the % CD11b+CD18+. The analysis of the percentage of CD11b+CD18+ between the control and experimental groups of pigs showed statistically significant differences (p ≤ 0.05) at 70 days of age. At 28 and 160 days of age, the percentages of CD11b+CD18+ in both groups were similar.

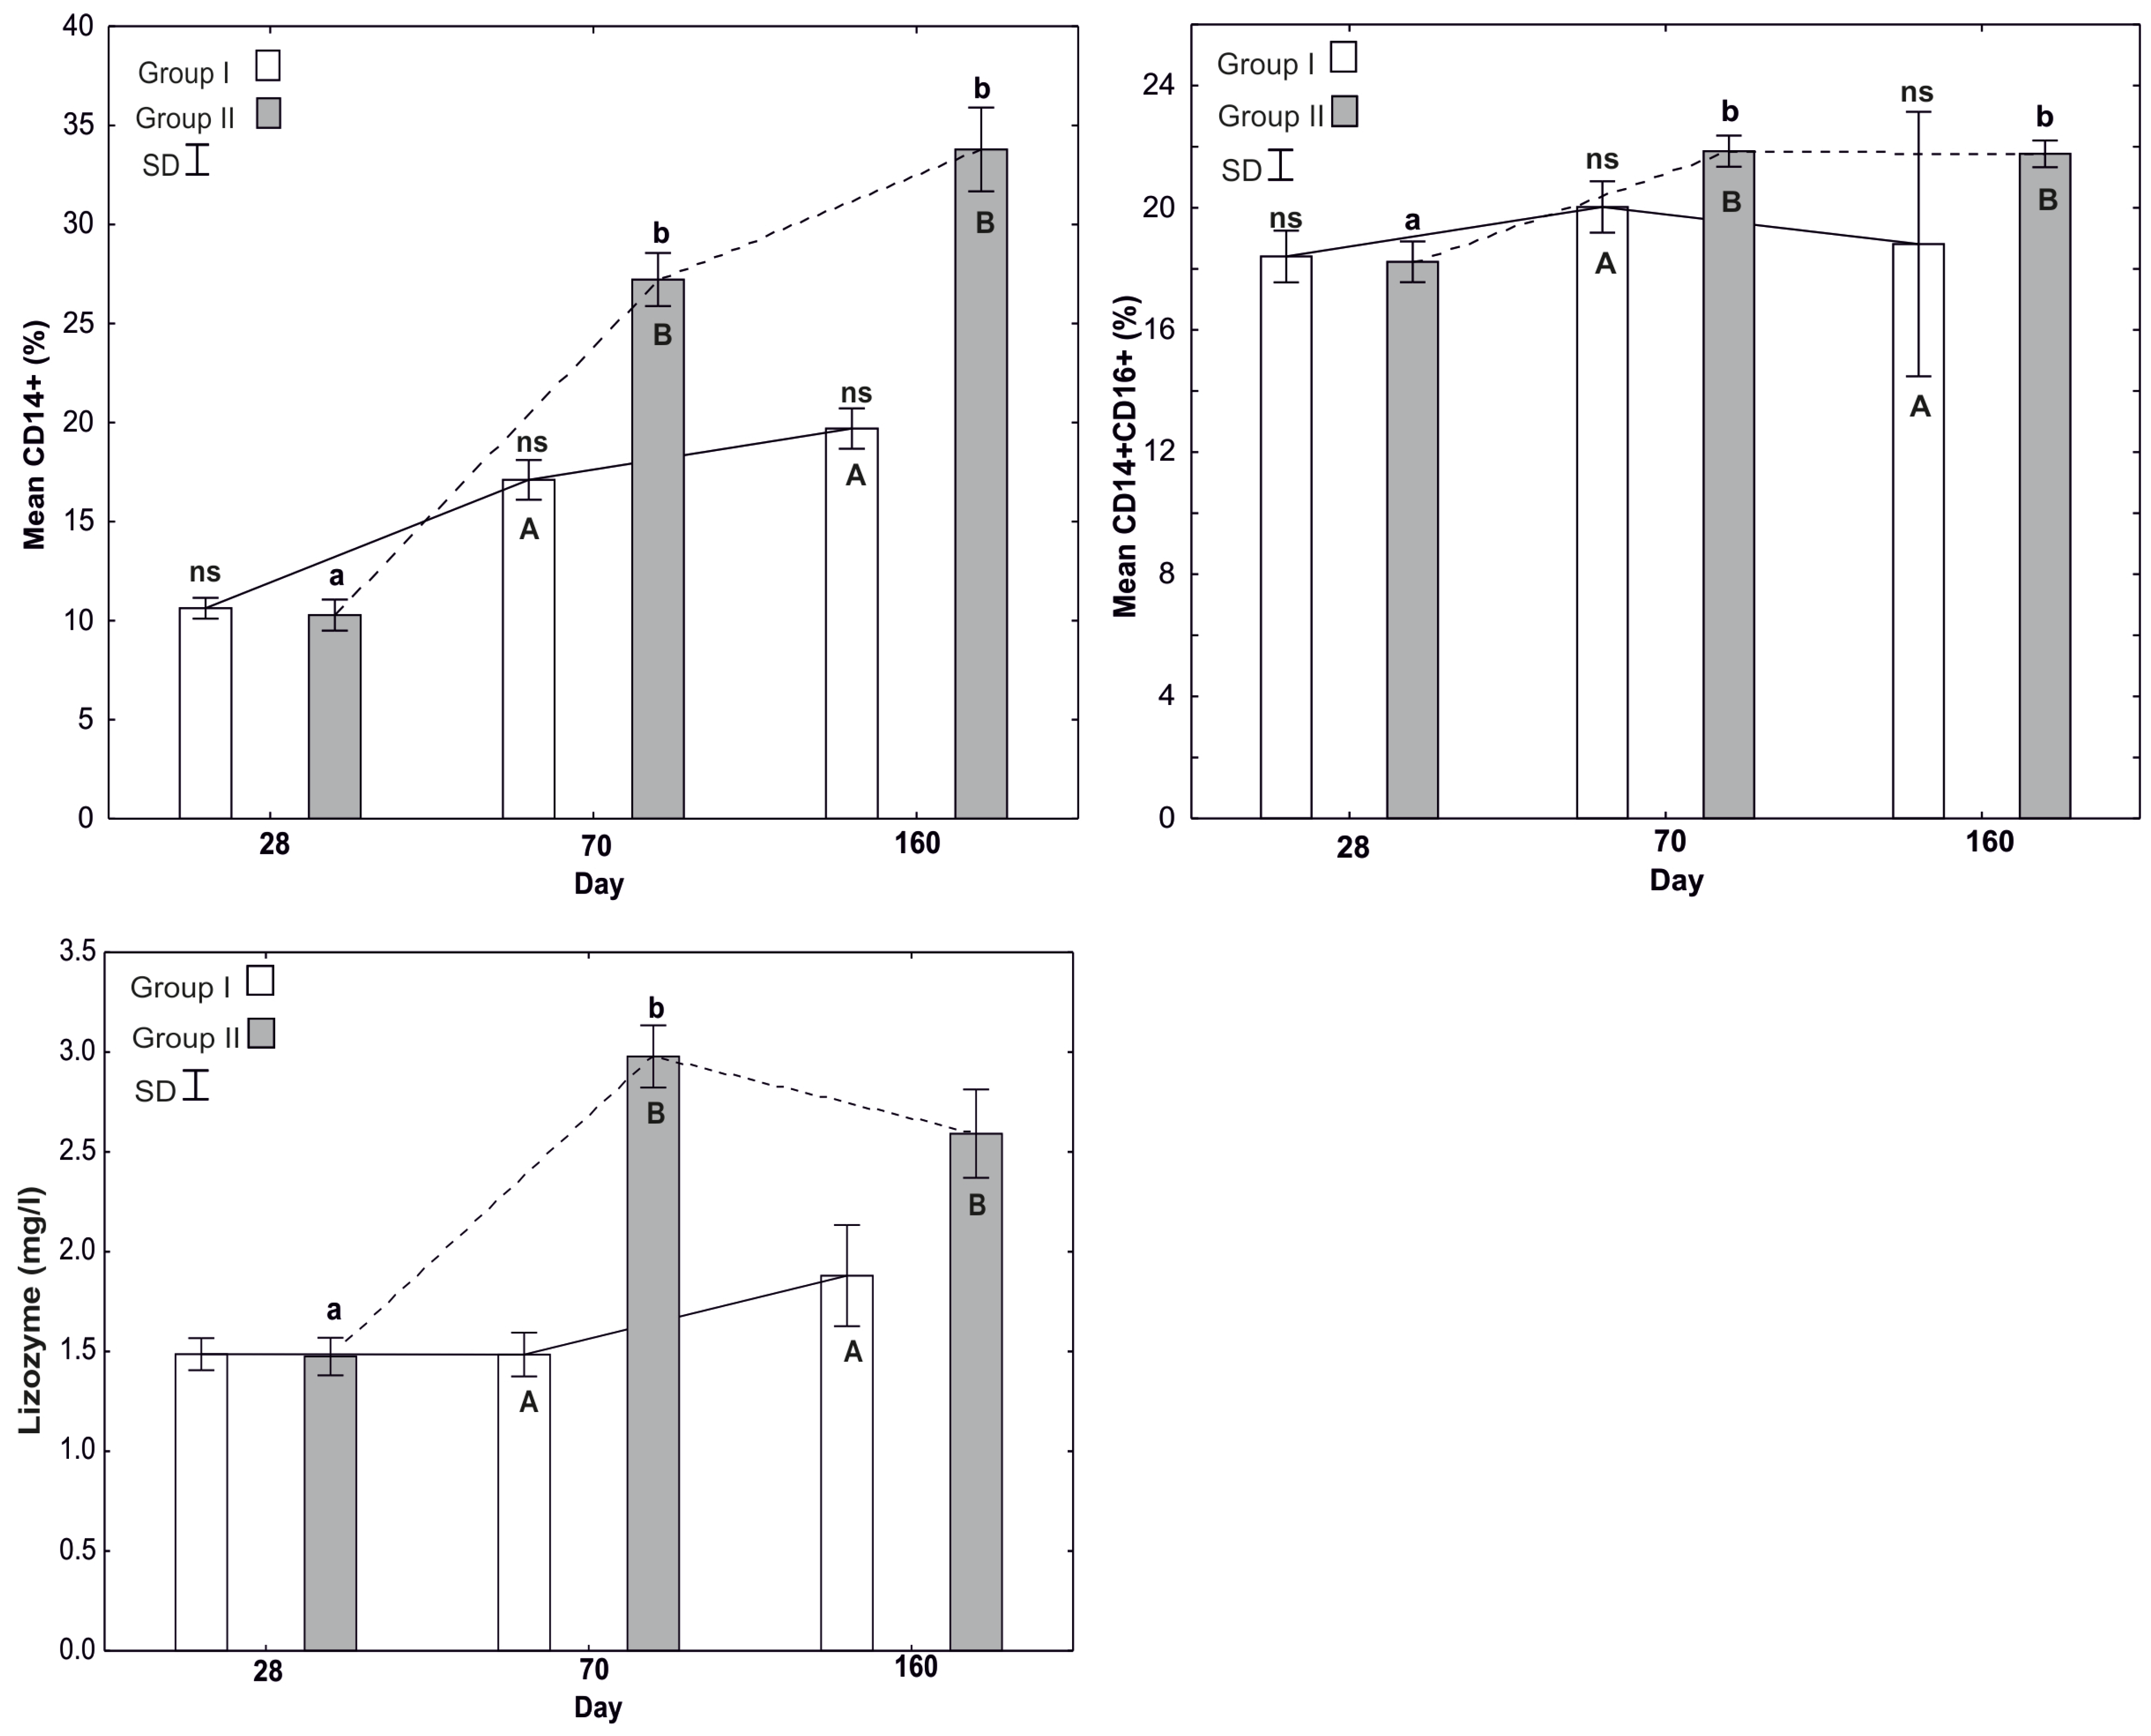
3.1.4. Mean Percentage of CD14+

The results are shown in Figure 2. The mean percentage of CD14+ in the experimental group gradually increased during the experiment. Statistically significant differences (p ≤ 0.05) in this parameter were observed between the start of the experiment (28 days of age) and 70–160 days in the experimental group. Compared to the control group, the mean percentage of CD14+ was statistically significantly higher (p ≤ 0.05) in the experimental group at both 70 and 160 days of age.

3.1.5. Mean Percentage of CD14+CD16+

The results are shown in Figure 2. No statistically significant differences were observed on individual days of the study in the mean percentage of CD14+CD16+ in the control group. In the experimental group, the percentage of CD14+CD16+ increased significantly at 70 days (p ≤ 0.05), and similar values were observed at 160 days. Comparison of the percentages of CD14+CD16+ between the two groups showed significant statistical differences (p ≤ 0.05) at 70 and 160 days of age, with a higher percentage in the experimental group.

3.1.6. Oxidative Burst of Granulocytes and Monocytes

The results are presented in Table 4. Significant increases (p ≤ 0.05) in oxidative bursts of granulocytes and monocytes under the influence of E. coli stimuli were observed in the group receiving the L-glutamine supplement compared to the control group at 70 and 160 days of age (Table 4).

3.1.7. Mean Fluorescence Intensity of Peripheral Blood Phagocytic Cells

The results are presented in Table 3. In the supplemented group, a statistically significant higher mean fluorescence intensity of peripheral blood was observed on day 70 and 160 of the study compared to day 28 of the study. A significant increase (p ≤ 0.05) in the mean fluorescence intensity of peripheral blood phagocytic cells was observed in the L-glutamine-supplemented group compared to the control at 70 and 160 days of age.

3.2. Determination of Bacteriolytic Activity of Lysozyme (LZM) in the Peripheral Blood of Pigs

The results are shown in Figure 2. The mean concentration of lysozyme (mg/L) within the control group (group I) showed no statistically significant differences depending on the measurement time. Within the experimental group (group II), statistically significant differences (p ≤ 0.05), in the lysozyme concentration were observed between the start of the experiment at 28 days of age and at 70 days of age. Comparison of the lysozyme level between groups showed statistically significant differences (p ≤ 0.05) at 70 and 160 days of age, when the lysozyme level was significantly higher in the experimental group than in the control group.

3.3. Serum Concentrations of IL-1β, IL-6, IL-10, and TNF-α

The results are presented in Table 5. Compared to the control group, there were significant increases (p ≤ 0.05) in the serum concentrations of IL-1β, IL-6, and TNF-α in pigs from the supplemented group at 70 days of age. However, at 160 days of age, an increase in the serum concentrations of IL-1β, TNF-α, and IL-10 was observed in the supplemented group compared to the control group. In the supplemented group, a statistically significant higher level (p ≤ 0.05), of serum concentration of IL-1β and IL-6 was observed on the 70th and 160th days of the study compared to the 28th day of the study. The highest level of TNF-α in the supplemented group was observed on day 70 of the study, and it was statistically significantly higher (p ≤ 0.05) compared to day 28 and day 160 of the study. In the supplemented group, a statistically significant higher level of IL-10 was observed on day 160 of the study compared to the remaining days of the study.

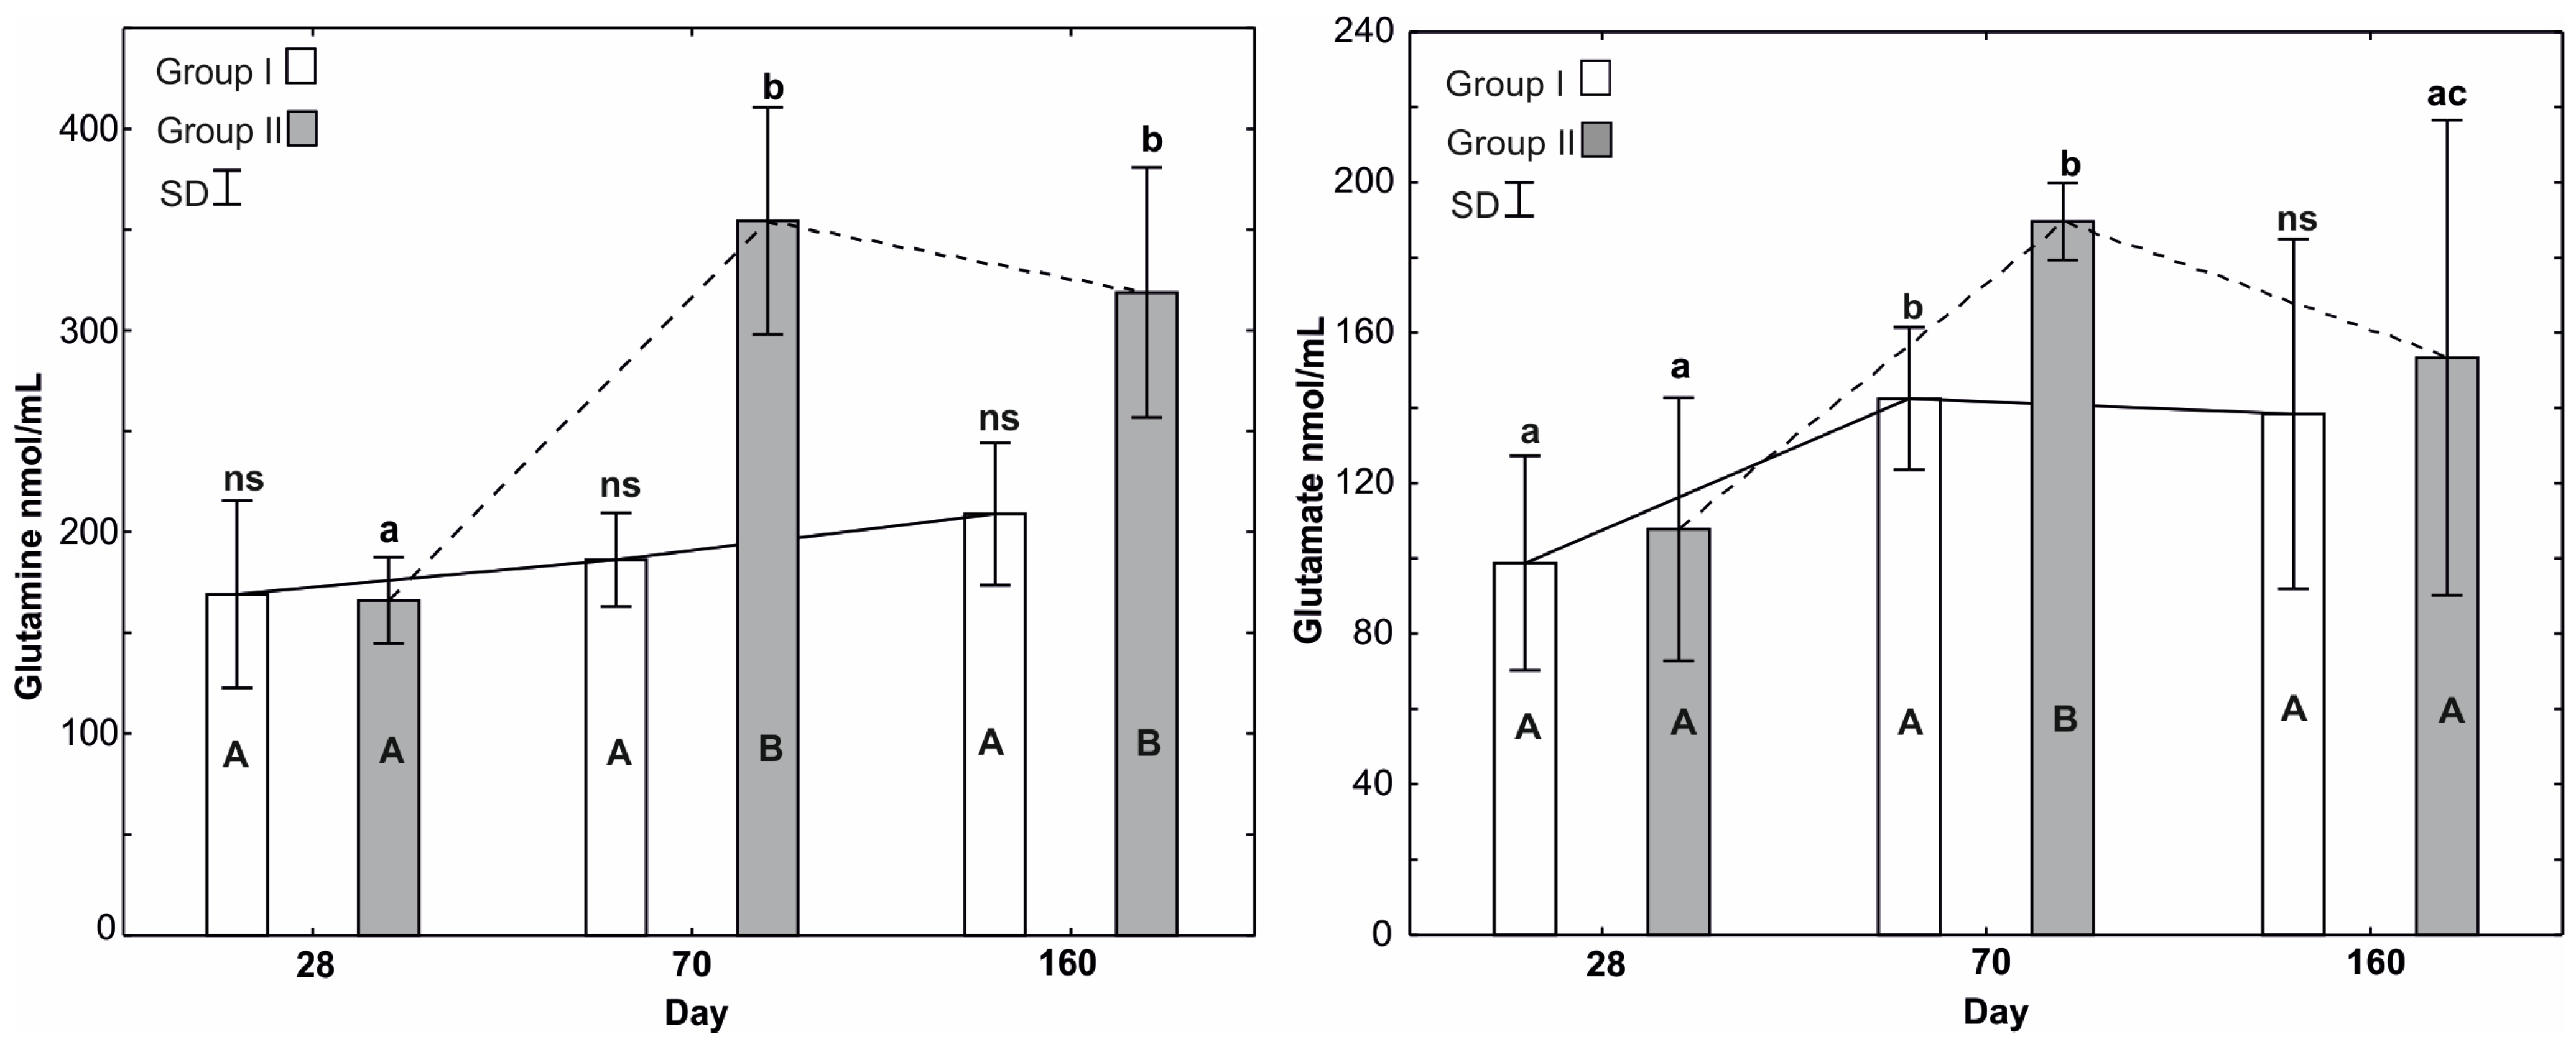
3.4. Mean Glutamine and Glutamate Levels

The results are shown in Figure 4. The analysis of the mean glutamine level (mmol/mL) in the control group (group I) showed no statistically significant differences in time and was similar at 28, 70 and 160 days of age. This was confirmed by the low value of Kendall’s coefficient of concordance, W = 0.15. In the experimental group (group II), time was a factor that significantly influenced the level of glutamine, as confirmed by Kendall’s coefficient of concordance, W = 0.34, for p = 0.0028. At 70 days of age, there was a two-fold increase in the glutamine concentration compared to the start of the experiment at 28 days of age, and at 160 days, it was significantly higher (p ≤ 0.05) than at 28 days. A comparison of the glutamine concentration in the control and experimental groups on individual days of the study showed no significant differences at 28 days, but statistically significant differences throughout the duration of the experiment. The glutamine concentration in the experimental group was significantly higher (p ≤ 0.05) than in the control group at both 70 and 160 days of age.
The analysis of the mean level of glutamate (nmol/mL) in the control and experimental groups showed statistically significant differences (p ≤ 0.05). In the control group, the glutamate level increased significantly at 70 days of age and remained at a comparable level at 160 days, which was confirmed by the Kendall coefficient, W = 0.47, p = 0.038. In the experimental group, the glutamate level at 70 days of age increased significantly compared to the start of the experiment at 28 days of age, and at 160 days, it decreased significantly compared to day 70 (p ≤ 0.05). The significant relationship between the glutamate level and the measurement time was confirmed by the high value of the Kendall coefficient, W = 0.60. A comparison of glutamate levels between the control (I) and experimental (II) groups on individual days showed no significant differences on the 28th and 160th days of the pigs’ life, but at 70 days of age, it was statistically significantly higher (p ≤ 0.05) in the experimental group than in the control group.

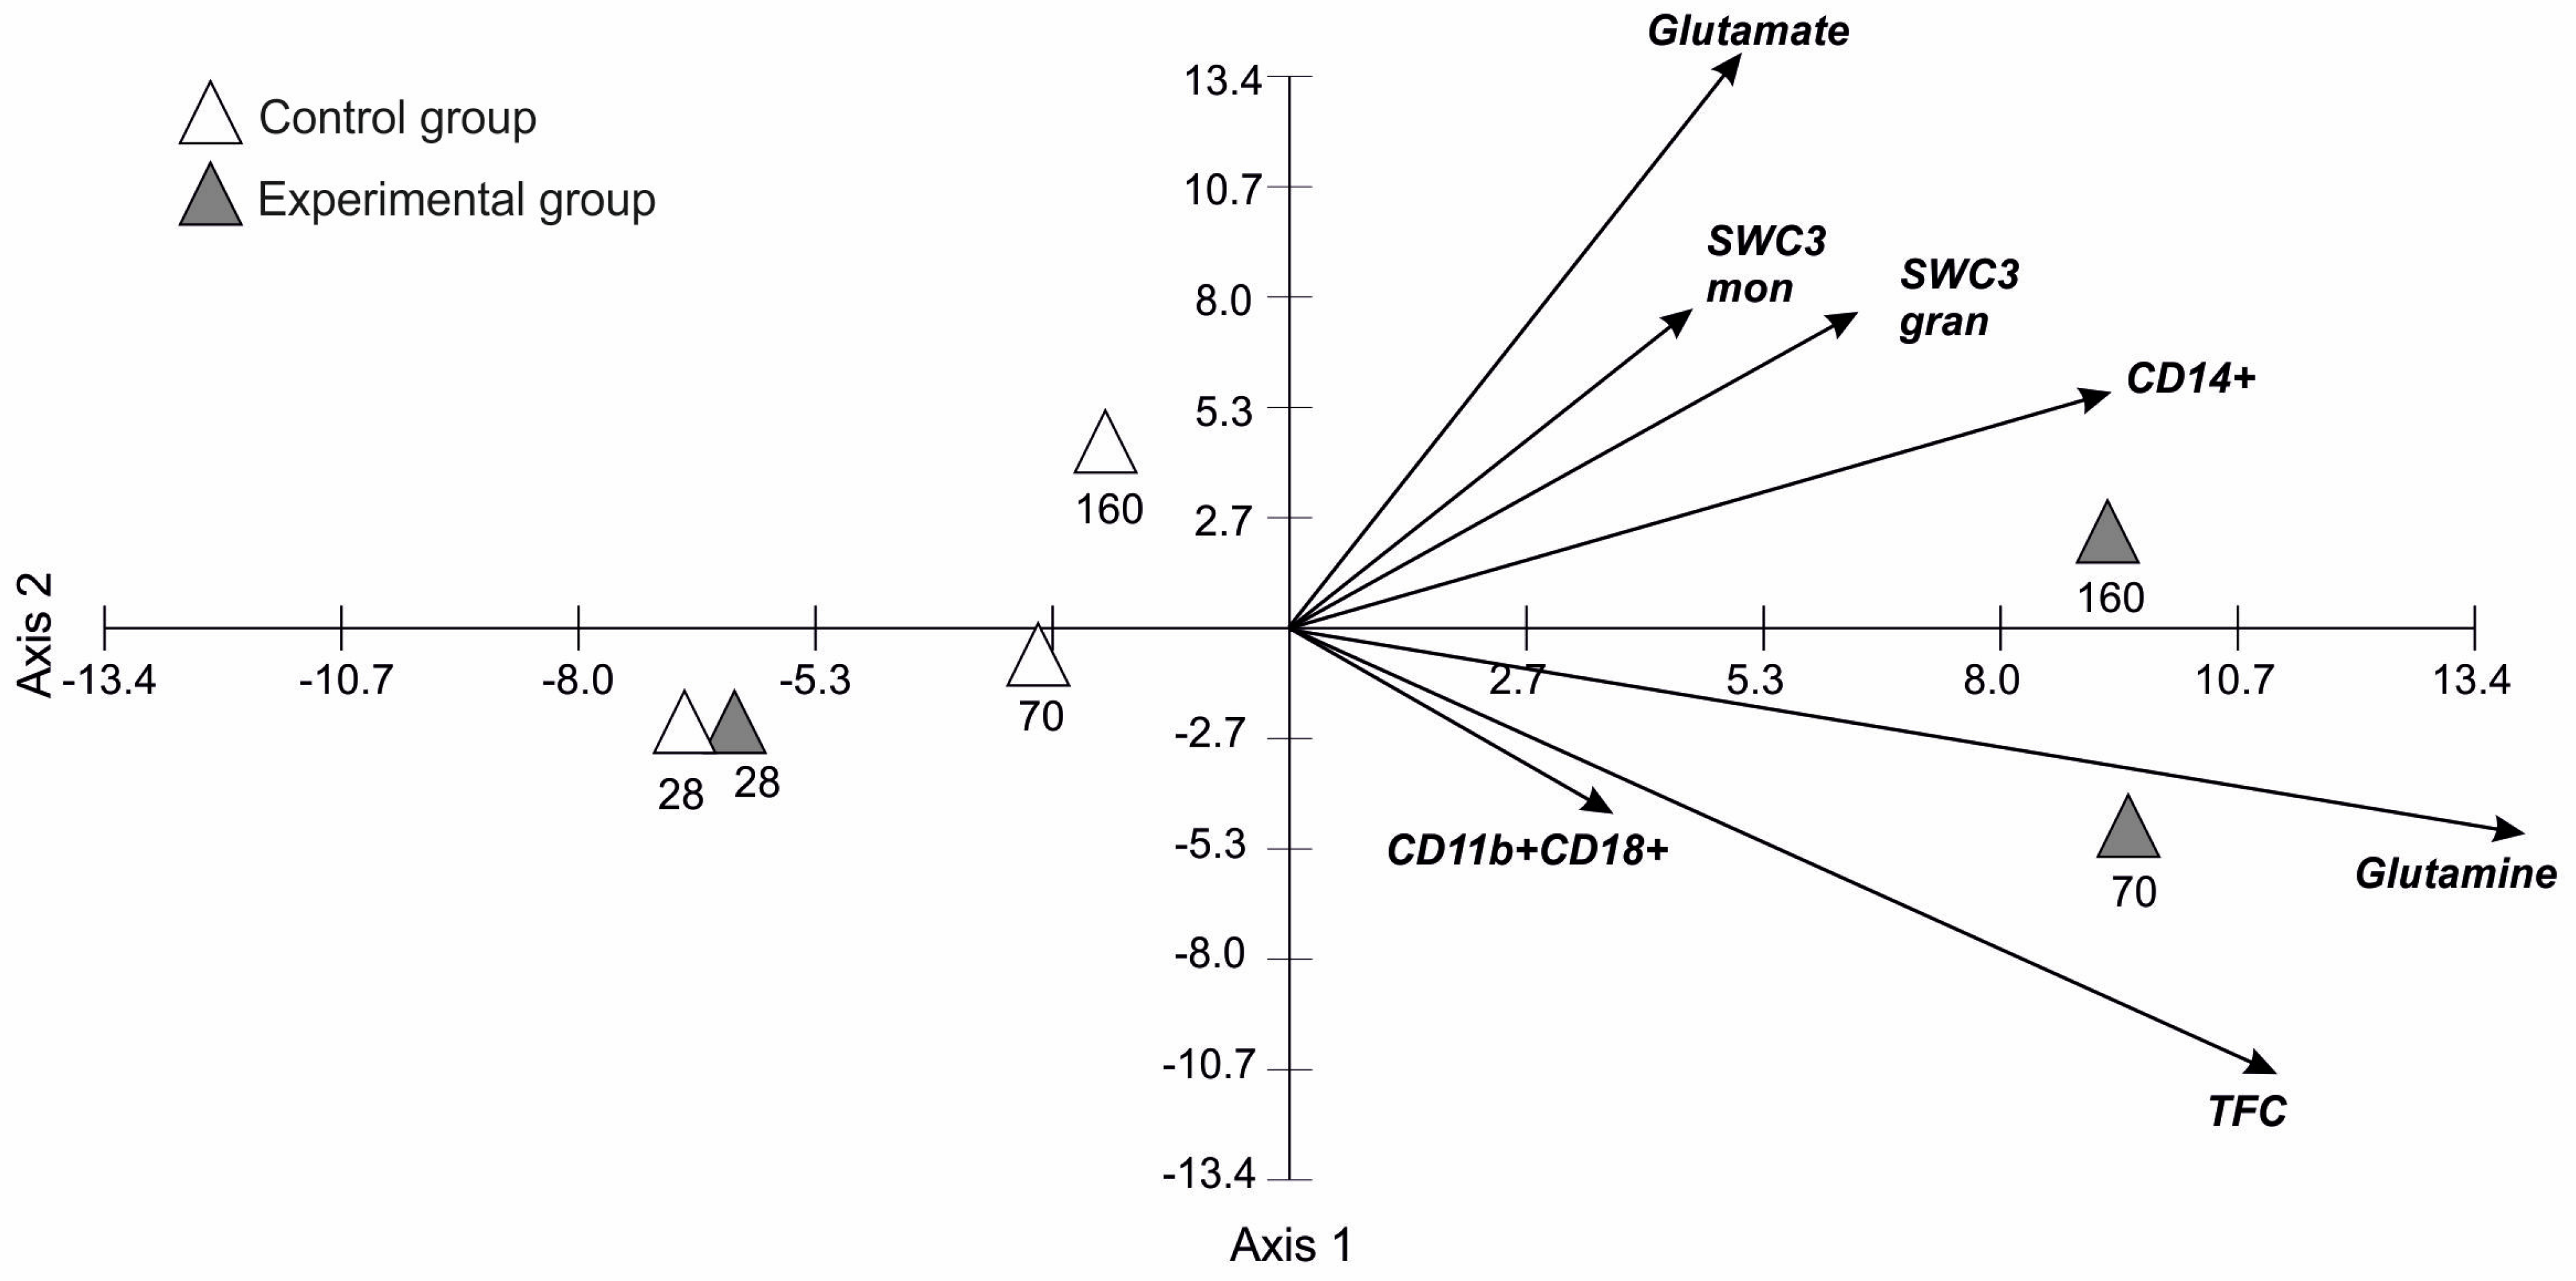
3.5. Principal Component Analysis for Blood Parameters in Time

Figure 5 shows the results of the PCA ordination of the blood samples in time. The eigenvalues of the first (267.35), second (55.07), third (8.26), and fourth (1.29) axes indicate the presence of one gradient, within which the samples are differentiated in terms of the time, and the day of measurement of immune blood parameters (Table 6). The first three axes explain 99.60% of the variability (80.53% the first axis, 16.59% the second axis, 2.46% the third axis), which proves that the traits correlated with the first axis are very important for interpreting the differentiation and correlations between these blood factors. The levels of all the blood factors analyzed over time are clearly positively correlated with the first axis (Figure 5). The levels of SWC3 monocyte, SWC3 granulocyte, CD14+ and glutamate are positively correlated with the second axis, whereas Total Fagocytic Cells, CD11b+CD18+ and glutamine are negatively correlated with the second axis of the ordination diagram. The first axis represents a gradient along which the concentration of all the blood parameters analyzed increases over time and as a function of the level of glutamine in the diet. The variation between the samples is also evident. Two groups can be distinguished in the ordination space of the PCA: a group of control samples (white triangles) in which the level of the examined parameters is the lowest, and a group of experimental samples (grey triangles) in which the average level of the blood factors increases over time. The groups that were studied at the beginning (day 28) of the experiment, as with the control groups, are characterized by the lowest level of examined blood factors.

4. Discussion

The enhancement of the functions of immune cells, especially lymphocytes and macrophages, is an important element of protection of the body against invasion by various microbes, their proliferation, and the development of diseases [28,29]. The in vitro tests showed that glutamine acts on various elements of the immune system, enhancing the immune response in part by increasing macrophage activity and regulating phagocytosis and respiratory bursts [30,31,32]. These processes are especially important during the weaning period, in which various co-existing stress factors and the decrease in passive immunity makes animals more susceptible to environmental infections with high incidence and mortality rates [33]. The experiment showed a statistically significantly higher percentage of phagocytic cells at 70 and 160 days of life of the pigs receiving glutamine compared to control group. The increase in the percentage of phagocytic cells between 28- and 70-days-of-life piglets supplemented with glutamine also seems to be particularly significant. The increase in the potential of the nonspecific immune response under the influence of glutamine was additionally confirmed by the analysis of the average fluorescence intensity of the cells, which on days 70 and 160 of the study was significantly higher in the experimental group than in the control group. The increase in the average fluorescence intensity of the cells during that period in the group of pigs receiving glutamine, in conjunction with the increased capacity of these cells for phagocytosis and respiratory bursts, is indicative of increased phagocyte activity, manifested as the more-effective elimination of microbes from the body. These findings also indirectly suggest an increase in the efficiency of intracellular killing of microbes by phagocytes, which enhances the body’s defenses and raises the animals’ overall health status. Data in the available literature indicate that glutamine used as a feed additive has been shown to prevent damage to the intestinal epithelium, stimulate the growth of the intestinal villi, inhibit the apoptosis of enterocytes, and regulate the fluid and electrolyte balance, which together improve the functional state of the intestines [34,35]. In addition, Di Giancamillo et al. [33] showed that pigs fed a diet with a 0.5% glutamine supplement for 28 days after weaning had a higher percentage of lymphatic follicles, epithelial cells, macrophages and intra-epithelial lymphocytes in the intestinal mucosa. An increase in the production of the population of these cells, demonstrated in these studies, provides significant support for the immune system in defense against infection. This is of particular importance in pigs, especially in the post-weaning period when diarrheal diseases cause significant economic losses. Phagocytosis is inhibited in conditions of glutamine deficiency, as confirmed by studies using murine macrophages exposed to Escherichia coli [36], yeast cells [37] and sheep erythrocytes [31]. The results of our experiment indicate that the supplementation of pigs with 0.5% glutamine guarantees its appropriate serum levels and influences the formation of macrophages. Active macrophages with a high phagocytic potential have the ability to initiate antibacterial or antiviral reactions by activating lymphocytes and modulating the release of cytokines that regulate inflammatory processes.
The functioning of the nonspecific immune response relies in part on the activity of specialized cells, such as neutrophils, monocytes and macrophages, which have the ability to present antigens and release cytokines and also take part in the activation and regulation of mechanisms of specific immunity [6]. In the present study, the percentage of cells with SWC3 (monocyte/granulocyte) expression at 70 and 160 days of age was statistically significantly higher in the group of pigs receiving glutamine than in the controls. Similar results were obtained in the case of SWC3 expression on monocytes. A higher expression of the SWC3 receptor on monocytes was noted at 70 and 160 days of age in the group of pigs receiving glutamine. The high glutamate concentration shown in the pigs at 70 days of age, in combination with the high percentage of granulocytes with SWC3 expression, the increase in respiratory burst, and the production of pro-inflammatory cytokines, suggests the full activation of phagocytic processes taking part in the body’s response to invasion by pathogens and effective elimination of microbes in oxygen-dependent and oxygen-independent processes. The results seem to confirm the findings of Curi et al. [38], who showed that the neutrophil function is dependent on glutamine intake. The results are also in agreement with those published by Spittler et al. [39], and Furukawa et al. [40], who showed that low glutamine concentrations reduce the expression of receptors, including major histocompatibility complex receptors on monocytes, which leads to the impairment of antigen presentation. It should be noted that, up to about 35 days of age, the chemotactic and phagocytic mechanisms in pigs are significantly impaired due to the morphological and functional immaturity of phagocytic cells [41]. For this reason, the peri-weaning period is conducive to various infections, which can result in illness and death. The use of glutamine as a feed supplement in the diet of pigs increases the phagocytic activity of cells and is manifested as an overall increase in the percentage of phagocytic cells in body fluids and tissues, especially in the intestinal mucosa, in which systemic metabolic processes are initiated [35,42,43]. Glutamine plays an important role in macrophage induction, and therefore its action in the intestines of piglets in the peri-weaning period probably results in an increase in the percentage of macrophages in the GALT [8]. The activity of peripheral phagocytes depends on the activation of integrin receptors influencing phagocytosis [44,45], including surface receptor integrin CD11b/CD18 (macrophage-1 antigen–Mac-1, complement receptor 3–CR3), present in monocytes, macrophages and neutrophils. Furukawa et al. [40] showed that a low glutamine concentration decreases the expression of adhesion molecule CD54 and IgG FC receptor (Fcγ R1/CD64), and complement receptors 3 (CD11b/CD18) and 4 (CD11c/CD18). These changes were accompanied by a decrease in the cellular ATP concentration, which negatively affected phagocytosis. The results of the present study showed that CD11b/CD18+ expression on granulocytes and monocytes increased between 28 and 70 days of age in the group of pigs receiving glutamine, after which it decreased up to 160 days of age. The increased expression of receptor CD11b/CD18+ on polymorphonuclear cells, including phagocytic cells (neutrophils), indicates their activation, induced by exposure to various antigens, as well as in connection with migration to the sites of inflammation and the elimination of antigens. These results, in combination with the percentage of phagocytic cells and the increase in respiratory bursts, demonstrate that the increase in CR3 expression on granulocytes and monocytes induced by glutamine should be treated as a marker of stimulation of phagocytosis, and thus stimulation of the nonspecific immune response.
The increase in respiratory burst in the group of pigs receiving glutamine observed at 70 and 160 days of age, together with the results for CR3 and SWC3 expression and the intensity of phagocytosis, are evidence of the release of reactive oxygen species (ROS) during respiratory burst and suggest stimulation of an anti-infective response and activation of phagocytes induced by the feed additive. For a comprehensive assessment of the potential of the nonspecific immune response, it is also important to analyze CD14+ and CD16+ expression on phagocytic cells, mainly monocytes [46]. An increase in the percentage of cells with CD14+CD16+ expression is generally linked to the development of inflammation and recruitment of neutrophils to its focus, and is usually indicative of recurrent infections [47,48,49]. The high percentage of cells with CD14+ and CD14+CD16+ expression in the experimental group at 70 and 160 days of age indicates stimulation of the GALT in the gastrointestinal tract and the possible occurrence of local inflammation associated with the change in the intestinal microbiome during weaning. Glutamine, by stimulating monocytes and macrophages, increases their microbicidal activity, thereby enhancing nonspecific immune response mechanisms. Some of these cells may be tissue macrophages arising during individual development due to stimulation by antigens/superantigens [50]. In addition, CD14, the adaptor molecule of the TLR signaling pathway, plays an important role in bacterial infection as a receptor of lipopolysaccharide (LPS), which activates signaling pathways of cells and thereby leads to the release of pro-inflammatory cytokines [51]. The high percentage of cells with expression of this molecule in the pigs fed a diet with added glutamine suggests an enhancement of the immune response and anti-inflammatory and immunoregulatory effects in which the Th1/Th2 balance is maintained.
One of the important elements of the humoral nonspecific immune response is lysozyme [52]. In the present study, the highest lysozyme concentration was noted on day 70 in the pigs receiving glutamine. Together with the results pertaining to SWC3 expression and the percentage of phagocytic cells, this indicates the release of lysozyme by activated monocytes and macrophages. The gradual decrease in the serum lysozyme concentration from day 70 to the end of the experiment indicates a lack of inflammation, in part owing to the stabilization of the intestinal microbiome.
The important functions of macrophages include the capacity to release pro-inflammatory factors, including IL-1, IL-6 and TNFα, but also synthesis of cytokines inhibiting the immune system, such as IL-4 and IL-10 [53]. These contrasting functions of macrophages are associated in part with the need to suppress an inflammatory response after the completion of phagocytosis. The experiment conducted in the present study demonstrated that the synthesis of pro-inflammatory TNF-α and IL-1β was strongly stimulated between days 70 and 160 of the experiment in pigs receiving glutamine with their feed. Such high TNF-α concentrations may be linked to the response of PBMCs to the bacterial stimulus from the intestinal microbiome, which increases the local production of this cytokine. The high concentrations of TNF-α and IL-1β shown in the pigs from the experimental group indicate a cellular phenotype of the Th1 response and confirm the activation of nonspecific immune response mechanisms based on phagocyte activity. Wallace and Keast [31] showed that an extracellular supply of glutamine in mice leads to an increase in the secretion of IL-1β by LPS-stimulated macrophages. Similar observations were reported by Yassad et al. [54] and by Murphy and Newsholme [55], who following administration of glutamine in mice showed increased secretion of IL-6 and TNF-α by LPS-stimulated macrophages.
The increase in the concentration of TNF-α in the experimental group may also indicate the activation of dendritic cells (DC) in the lamina propria of the intestines, which release TNF-α [56,57] and are involved in recognizing and eliminating intestinal antigens. The stimulation of phagocytosis by TNF-α may result in the simultaneous release of IL-6 from macrophages. A statistically significant increase in the concentration of IL-6 was shown in the experimental group at 70 days of age, which, together with the increase in the percentage of CD11b/CD18+ cells and of phagocytic cells, confirms that this cytokine is produced by these cells in response to feed supplementation with glutamine. An increase in the concentration of this cytokine at the same time increases TNF-α production, which is also confirmed by the results obtained in the experimental group. One of the important factors influencing the production of IL-6 seems to be the composition of the intestinal microbiome of pigs and the need to maintain a state of controlled inflammation in the post-weaning period [58]. This hypothesis may be supported by the research of Pie et al. [59], who showed that the concentration of pro-inflammatory cytokines IL-1β, IL-6 and TNF-α in pigs increases in the post-weaning period in response to the change in antigens stimulating the intestinal epithelium and to changes in how the pigs are fed and their living conditions. In contrast with the cytokines mentioned above, IL-10 has a suppressive effect on the immune response and inhibits the synthesis and release of pro-inflammatory cytokines, including IL-1, TNFα, IL-6 and IL-12 [56]. A high IL-10 concentration was noted in the pigs in the experimental group only on day 160 of the study. It seems likely that in the final period of fattening, IL-10 is responsible for limiting the severity of inflammation, supporting the humoral immune response, and controlling processes of intestinal homeostasis, which is linked to the immunoregulatory function of this cytokine and its role in suppressing the immune response.
It should be emphasized that the supplementation of pigs with glutamine has a multidirectional effect, e.g., it improves production parameters, but also affects the immune system, which increases the overall health of the animals [60,61]. The use of glutamine in feed increases the synthesis of digestive enzymes, digestibility and absorption of nutrients in the gastrointestinal tract, and affects their metabolism, e.g., increasing protein synthesis [61,62]. This is of particular importance in diseases of the gastrointestinal tract, in which the structure and function of the intestines are disturbed [61,62,63]. The use of glutamine in pigs with an inflammatory process; for example, in the post-weaning period, in stress or bacterial infections of the gastrointestinal tract; may affect the maintenance of the intestinal barrier function and inhibit the atrophy of the intestinal mucosa villi. The results of the experiment indicate that glutamine is of particular importance in modulating the pro- and anti-inflammatory response. The observed increase in the concentration of IL-1β, IL-10 and TNF-α in the groups of pigs receiving glutamine indicates its participation in the control of inflammation and maintaining the immune tolerance of the body, which prevents excessive inflammatory reactions. In addition, the stimulation of macrophages and monocytes after the use of glutamine can facilitate the elimination of pathogens from the body and improve the processes of phagocytosis and oxygen burst. In practice, this will reduce the use of antibiotics in feed and thus reduce production costs and provide safer food for consumers.

5. Conclusions

It can be concluded that the increased percentage of phagocytic cells and oxygen blast cells in piglets supplemented with L-glutamine indicates the stimulation of non-specific immune mechanisms, which contributed to the efficient elimination of the antigen from the body. The increase in the percentage of cells expressing SWC3, CD11b/CD18+, CD14+ and CD14+CD16+ molecules on granulocytes and monocytes in piglets supplemented with L-glutamine supported the body’s defenses by stimulating phagocytosis and activating a non-specific immune response. High concentrations of TNF-α, IL-1β and IL-10 in piglets supplemented with L-glutamine indicate the cellular phenotype of the Th1 type response and, on the other hand, the maintenance of the immune balance between the pro-inflammatory and anti-inflammatory reaction and ensuring homeostasis of the organism. The use of L-glutamine in the diet of pigs can be recommended as a supplement to enhance the immune response in the post-weaning period. Further studies are necessary to determine the role of glutamine in the immunological processes in pigs, especially in the context of the development of local defense mechanisms of the gastrointestinal tract (GALT) and its effect on enterocytes.

Author Contributions

Conceptualization, Ł.S.J., A.C. and M.H.; methodology, Ł.S.J., E.T., A.M., M.H., A.B. and M.Ś.; software, E.T., A.R. and M.Ś.; validation, A.C.; formal analysis, A.B. and Z.G.; investigation, E.T., Ł.S.J., A.B., A.R. and M.Ś.; resources, M.B. and S.N.; data curation, S.N.; writing—original draft preparation, Ł.S.J., A.M. and E.T.; writing—review and editing, Ł.S.J., E.T. and A.M.; visualization, A.R.; supervision, Z.G.; project administration, Ł.S.J. and E.T. All authors have read and agreed to the published version of the manuscript.

Funding

This research received no external funding.

Institutional Review Board Statement

The study complies with the European Directive 2010/63/EU. All procedures used in the research were approved by the Local Ethics Committee on Animal Experimentation of the University of Life Sciences in Lublin, Poland (51/2017).

Data Availability Statement

All data generated or analyzed during this study are included in this published article, and are available on request from the corresponding author.

Acknowledgments

The authors wish to thank the Butchers, Kusio Wiesław, Załazy 3A, 26-704 Przyłęk, Poland, for supporting research.

Conflicts of Interest

The authors certify that they have no affiliations with or involvement in any organization or entity with any financial interest (such as honoraria, educational grants, participation in speakers’ bureaus, membership, employment, consultancies, stock ownership, or other equity interest, expert testimony or patent-licensing arrangements), or non-financial interest (such as personal or professional relationships, affiliations, knowledge or beliefs) in the subject matter or materials discussed in this manuscript.

References

  1. Tokach, M.D.; Goodband, B.D.; O’Quinn, T.G. Performance-enhancing technologies in swine production. Anim. Front. 2016, 6, 15–21. [Google Scholar] [CrossRef]
  2. Blavi, L.; Solà-Oriol, D.; Llonch, P.; López-Vergé, S.; Martín-Orúe, S.M.; Pérez, J.F. Management and feeding strategies in early life to increase piglet performance and welfare around weaning: A Review. Animals 2021, 11, 302. [Google Scholar] [CrossRef]
  3. He, J.; Feng, G.D.; Ao, X.; Li, Y.F.; Qian, H.X.; Liu, J.B.; He, Z.Z. Effects of L-glutamine on growth performance, antioxidant ability, immunity and expression of genes related to intestinal health in weanling pigs. Livest. Sci. 2016, 189, 102–109. [Google Scholar] [CrossRef]
  4. Zou, T.D.; Deng, C.X.; Wang, Z.R.; Ye, Y.L.; You, J.M. Dietary alanyl-glutamine improves growth performance of weaned piglets through maintaining intestinal morphology and digestion-absorption function. Animal 2019, 13, 1826–1833. [Google Scholar] [CrossRef]
  5. Liao, S.F. Invited Review: Maintain or improve piglet gut health around weanling: The fundamental effects of dietary amino acids. Animals 2021, 11, 1110. [Google Scholar] [CrossRef]
  6. Newsholme, P.; Curi, R.; Curi, T.C.P.; Murphy, C.J.; Garcia, C.; de Melo, M.P. Glutamine metabolism by lymphocytes, macrophages, and neutrophils: Its importance in health and disease. J. Nutr. Biochem. 1999, 10, 316–324. [Google Scholar] [CrossRef] [PubMed]
  7. Newsholme, P.; Procopio, J.; Lima, M.M.R.; Pithon-Curi, T.C.; Curi, R. Glutamine and glutamate—Their central role in cell metabolism and function. Cell Biochem. Funct. 2003, 21, 1–9. [Google Scholar] [CrossRef] [PubMed]
  8. Cruzat, V.; Macedo Rogero, M.; Noel Keane, K.; Curi, R.; Newsholme, P. Glutamine: Metabolism and immune function, supplementation and clinical translation. Nutrients 2018, 10, 1564. [Google Scholar] [CrossRef] [PubMed]
  9. Wu, G.; Fang, Y.Z.; Yang, S.; Lupton, J.R.; Turner, N.D. Glutathione metabolism and its implications for health. J. Nutr. 2004, 134, 489–492. [Google Scholar] [CrossRef]
  10. Alverdy, J.C. Effects of glutamine-supplemented diets on immunology of the gut. J. Parenter. Enteral Nutr. 1990, 14, 109–113. [Google Scholar] [CrossRef]
  11. Ji, F.J.; Wang, L.X.; Yang, H.S.; Hu, A.; Yin, Y.L. Review: The roles and functions of glutamine on intestinal health and performance of weaning pigs. Animal 2019, 13, 2727–2735. [Google Scholar] [CrossRef] [PubMed]
  12. Li, P.; Yin, Y.L.; Li, D.; Kim, S.W.; Wu, G. Amino acids and immune function. Br. J. Nutr. 2007, 98, 237–252. [Google Scholar] [CrossRef] [PubMed]
  13. Duttlinger, A.W.; Kpodo, K.R.; Schinckel, A.P.; Richert, B.T.; Johnson, J.S. Effects of increasing dietary L-glutamine to replace antibiotics on pig health and performance following weaning and transport. Transl. Anim. Sci. 2020, 4, txaa157. [Google Scholar] [CrossRef] [PubMed]
  14. Xiong, X.; Tan, B.; Song, M.; Ji, P.; Kim, K.; Yin, Y.; Liu, Y. Nutritional intervention for the intestinal development and health of weaned pigs. Front. Vet. Sci. 2019, 6, 46. [Google Scholar] [CrossRef] [PubMed]
  15. Coeffier, M.; Miralles-Barrachina, O.; Le Pessot, F.; Lalaude, O.; Daveau, M.; Lavoinne, A.; Lerebours, E.; Dechelotte, P. Influence of glutamine on cytokine production by human gut in vitro. Cytokine 2001, 13, 148–154. [Google Scholar] [CrossRef]
  16. Field, C.J.; Johnson, I.R.; Schley, P.D. Nutrients and their role in host resistance to infection. J. Leukoc. Biol. 2002, 71, 16–32. [Google Scholar] [CrossRef]
  17. Hsu, C.B.; Lee, J.W.; Huang, H.J.; Wang, C.H.; Lee, T.T.; Yen, H.T.; Yu, B. Effects of supplemental glutamine on growth performance, plasma parameters and LPS-induced immune response of weaned barrows after castration. Asian Australas. J. Anim. Sci. 2012, 25, 674–681. [Google Scholar] [CrossRef]
  18. Singleton, K.D.; Wischmeyer, P.E. Glutamine attenuates inflammation and NF-κB activation via Cullin-1 deneddylation. Biochem. Biophys. Res. Commun. 2008, 373, 445–449. [Google Scholar] [CrossRef]
  19. Wu, L.; Wang, W.; Yao, K.; Zhou, T.; Yin, J.; Li, T.; Yang, L.; He, L.; Yang, X.; Zhang, H.; et al. Effects of dietary arginine and glutamine on alleviating the impairment induced by deoxynivalenol stress and immune relevant cytokines in growing pigs. PLoS ONE 2013, 8, e69502. [Google Scholar] [CrossRef]
  20. Yu, I.T.; Wu, J.F.; Yang, P.C.; Liu, C.Y.; Lee, D.N.; Yen, H.T. Roles of glutamine and nucleotides in combination in growth, immune responses and FMD antibody titres of weaned pigs. Anim. Sci. 2002, 75, 379–385. [Google Scholar] [CrossRef]
  21. Wasinski, F.; Gregnani, M.F.; Ornellas, F.H.; Bacurau, A.V.N.; Câmara, N.O.; Araujo, R.C.; Bacurau, R.F. Lymphocyte glucose and glutamine metabolism as targets of the anti-inflammatory and immunomodulatory effects of exercise. Mediators Inflamm. 2014, 2014, 326803. [Google Scholar] [CrossRef]
  22. Wells, S.M.; Kew, S.; Yaqoob, P.; Wallace, F.A.; Calder, P.C. Dietary glutamine enhances cytokine production by murine macrophages. Nutrition 1999, 15, 881–884. [Google Scholar] [CrossRef] [PubMed]
  23. Grela, E.R.; Skomiał, J. (Eds.) Polish Pig Feeding Recommendations. In The Nutritional Recommendations and Nutritional Value of Pig Feed; Kielanowski Institute of Animal Physiology and Nutrition Polish Academy of Sciences: Jabłonna, Poland, 2020; pp. 1–125. (In Polish) [Google Scholar]
  24. Laskowska, E.; Jarosz, Ł.S.; Grądzki, Z. Effect of the EM Bokashi® Multimicrobial Probiotic Preparation on the Non-specific Immune Response in Pigs. Probiotics Antimicro. Prot. 2019, 11, 1264–1277. [Google Scholar] [CrossRef]
  25. Sinkora, M.; Sinkorova, J.; Holtmeier, W. Development of γδ thymocyte subsets during prenatal and postnatal ontogeny. Immunology 2005, 115, 544–555. [Google Scholar] [CrossRef]
  26. Hankiewicz, J.J.; Świerczek, E.E. Studies on serum and urinary lysozyme. Pol. Arch. Intern. Med. 1974, 51, 591–597. [Google Scholar]
  27. Kovach, W. MVSP—A Multivariate Statistical Package for Windows, version 3.1; Kovach Computing Services: Pentraeth, UK, 1999. [Google Scholar]
  28. Pithon-Curi, T.C.; De Melo, M.P.; Curi, R. Glucose and glutamine utilization by rat lymphocytes, monocytes and neutrophils in culture: A comparative study. Cell Biochem. Funct. 2004, 22, 321–326. [Google Scholar] [CrossRef] [PubMed]
  29. Gordon, S.; Martinez, F.O. Alternative activation of macrophages: Mechanism and functions. Immune 2010, 32, 593–604. [Google Scholar] [CrossRef]
  30. Liang, M.; Wang, X.; Yuan, Y.; Zhou, Q.; Tong, C.; Jiang, W. Different effect of glutamine on macrophage tumor necrosis factor-alpha release and heat shock protein 72 expression in vitro and in vivo. Acta Biochim. Biophys. Sin. 2009, 41, 171–177. [Google Scholar] [CrossRef]
  31. Wallace, C.; Keast, D. Glutamine and macrophage function. Metabolism 1992, 41, 1016–1020. [Google Scholar] [CrossRef] [PubMed]
  32. Ren, W.; Xia, Y.; Chen, S.; Wu, G.; Bazer, F.W.; Zhou, B.; Tan, B.; Zhu, G.; Deng, J.; Yin, Y. Glutamine metabolism in macrophages: A novel target for obesity/type 2 diabetes. Adv. Nutr. 2019, 10, 321–330. [Google Scholar] [CrossRef] [PubMed]
  33. Di Giancamillo, A.; Domeneghini, C.; Paratte, R.; Dell’Orto, V.; Bontempo, V. Oral feeding with L-glutamine and nucleotides: Impact on some GALT (gut associated lymphoid tissue) parameters and cell proliferation/death rates in weaning piglets. Ital. J. Anim. Sci. 2003, 2, 364–366. [Google Scholar]
  34. Rao, R.; Samak, G. Role of glutamine in protection of intestinal epithelial tight junctions. J. Epithel. Biol. Pharmacol. 2012, 5, 47–54. [Google Scholar] [PubMed]
  35. Shan, Y.; Shan, A.; Li, J.; Zhou, C. Dietary supplementation of arginine and glutamine enhances the growth and intestinal mucosa development of weaned piglets. Livest. Sci. 2012, 150, 369–373. [Google Scholar] [CrossRef]
  36. Spittler, A.; Winkler, S.; Gotzinger, P.; Oehler, R.; Willhiem, M.; Tempfer, C.; Weigel, G.; Fugger, R.; Boltz-Nitulescu, G.; Roth, E. Influence of glutamine on the phenotype and function of human monocytes. Blood 1995, 86, 1564–1569. [Google Scholar] [CrossRef] [PubMed]
  37. Parry-Billings, M.; Evans, J.C.; Calder, P.C.; Newsholme, E.A. Does glutamine contribute to immunosuppression after burns? Lancet 1990, 336, 523–525. [Google Scholar] [CrossRef] [PubMed]
  38. Curi, T.C.; De Melo, M.P.; De Azevedo, R.B.; Zorn, T.M.; Curi, R. Glutamine utilization by rat neutrophils: Presence of phosphate-dependent glutaminase. Am. J. Physiol. Cell Physiol. 1997, 273, 1124–1129. [Google Scholar] [CrossRef]
  39. Spittler, A.; Holzer, S.; Oehler, R.; Boltz-Nitulescu, G.; Roth, E. A glutamine deficiency impairs the function of cultured human monocytes. Clin. Nutr. 1997, 16, 97–99. [Google Scholar] [CrossRef]
  40. Furukawa, S.; Saito, H.; Inoue, T.; Matsuda, T.; Fakatsu, K.; Han, I.; Ikeda, S.; Hidemura, A. Supplemental glutamine augments phagocytosis and reactive oxygen intermediate production by neutrophils and monocytes from postoperative patients in vitro. Nutrition 2000, 16, 323–329. [Google Scholar] [CrossRef] [PubMed]
  41. Vega-Lopez, M.A.; Bailey, M.; Telemo, E.; Stokes, C.R. Effect of early weaning on the development of immune cells in the pig small intestine. Vet. Immunol. Immunopathol. 1995, 44, 319–327. [Google Scholar] [CrossRef]
  42. Bain, C.C.; Mowat, A.M. Macrophages in intestinal homeostasis and inflammation. Immunol. Rev. 2014, 260, 102–117. [Google Scholar] [CrossRef]
  43. Xing, S.; Zhang, B.; Lin, M.; Zhou, P.; Li, J.; Zhang, L.; Gao, F.; Zhou, G. Effects of alanyl-glutamine supplementation on the small intestinal mucosa barrier in weaned piglets. Asian Australas. J. Anim. Sci. 2017, 30, 236–245. [Google Scholar] [CrossRef] [PubMed]
  44. Kallio, R.; Aalto, H.; Takala, A.; Ohtonen, P.; Collan, J.; Siitonen, S.; Joensuu, H.; Syrjala, H.; Repo, H. Expression of CD11b/CD18 adhesion molecules on circulating phagocytes-a novel aid to diagnose infection in patients with cancer. Support Care Cancer 2008, 16, 1389–1396. [Google Scholar] [CrossRef] [PubMed]
  45. May, R.C.; Machesky, L.M. Phagocytosis and the actin cytoskeleton. J. Cell Sci. 2001, 114, 1061–1077. [Google Scholar] [CrossRef]
  46. Fairbairn, L.; Kapetanovic, R.; Beraldi, D.; Sester, D.P.; Tuggle, C.K.; Archibald, A.L.; Hume, D.A. Comparative analysis of monocyte subsets in the pig. J. Immunol. 2013, 190, 6389–6396. [Google Scholar] [CrossRef] [PubMed]
  47. Chamorro, S.; Revilla, C.; Alvarez, B.; Alonso, F.; Ezquerra, A.; Domínguez, J. Phenotypic and functional heterogeneity of porcine blood monocytes and its relation with maturation. Immunology 2005, 114, 63–71. [Google Scholar] [CrossRef]
  48. Fabriek, B.O.; Dijkstra, C.D.; van den Berg, T.K. The macrophage scavenger receptor CD163. Immunobiology 2005, 210, 153–160. [Google Scholar] [CrossRef]
  49. Zhao, C.; Tan, Y.C.; Wong, W.C.; Sem, X.; Zhang, H.; Han, H.; Ong, S.M.; Wong, K.L.; Yeap, W.H.; Sze, S.K.; et al. The CD14+/lowCD16+ monocyte subset is more susceptible to spontaneous and oxidant-induced apoptosis than the CD14+CD16 subset. Cell Death Dis. 2010, 1, e95. [Google Scholar] [CrossRef]
  50. Ziegler-Heitbrock, L. The CD14+ CD16+ blood monocytes: Their role in infection and inflammation. J. Leukoc. Biol. 2007, 81, 584–592. [Google Scholar] [CrossRef]
  51. Wu, Z.; Liu, Y.; Dong, W.; Zhu, G.; Wu, S.; Bao, W. CD14 in the TLRs signaling pathway is associated with the resistance to E. coli F18 in Chinese domestic weaned piglets. Sci. Rep. 2016, 6, 24611. [Google Scholar] [CrossRef]
  52. Nyachoti, C.M.; Kiarie, E.; Bhandari, S.K.; Zhang, G.; Krause, D.O. Weaned pig responses to Escherichia coli K88 oral challenge when receiving a lysozyme supplement. J. Anim. Sci. 2012, 90, 252–260. [Google Scholar] [CrossRef]
  53. Arango Duque, G.; Descoteaux, A. Macrophage cytokines: Involvement in immunity and infectious diseases. Front. Immunol. 2014, 5, 491. [Google Scholar] [CrossRef] [PubMed]
  54. Yassad, A.; Lavoinne, A.; Bion, A.; Daveau, M.; Husson, A. Glutamine accelerates interleukin-6 production by rat peritoneal macrophages in culture. FEBS Lett. 1997, 413, 81–84. [Google Scholar] [CrossRef]
  55. Murphy, C.J.; Newsholme, P. The importance of glutamine metabolism in murine macrophages and human monocytes to L-arginine biosynthesis and rates of nitrite or urea production. Clin. Sci. 1998, 95, 397–407. [Google Scholar] [CrossRef]
  56. De Moreno de LeBlanc, A.; Chaves, S.; Carmuega, E.; Weill, R.; Antoine, J.; Perdigon, G. Effect of long-term continuous consumption of fermented milk containing probiotic bacteria on mucosal immunity and the activity of peritoneal macrophages. Immunobiology 2008, 213, 97–108. [Google Scholar] [CrossRef] [PubMed]
  57. Zoumpopoulou, G.; Foligne, B.; Christodoulou, K.; Grangette, C.; Pot, B.; Tsakalidou, E. Lactobacillus fermentum ACA-DC 179 displays probiotic potential in vitro and protects against trinitrobenzene sulfonic acid (TNBS)-induced colitis and Salmonella infection in murine models. Int. J. Food Microbiol. 2008, 121, 18–26. [Google Scholar] [CrossRef] [PubMed]
  58. Nowland, T.L.; Plush, K.J.; Barton, M.; Kirkwood, R.N. Development and function of the intestinal microbiome and potential implications for pig production. Animals 2019, 9, 76. [Google Scholar] [CrossRef]
  59. Pie, S.; Lalles, J.P.; Blazy, F.; Laffitte, J.; Séve, B.; Oswald, I.P. Weaning is associated with an upregulation of expression of inflammatory cytokines in the intestine of piglets. J. Nutr. 2004, 134, 641–647. [Google Scholar] [PubMed]
  60. Pardo, A.L.; Poveda, A.P.; da Silva, C.; dos Santos, A.; Venâncio, E.; Arantes, V.; Nogueira, E. Effect of L-glutamine levels in piglets diets challenged with Escherichia coli lipopolysacharides. Revista MVZ Córdoba 2014, 19, 4328–4337. [Google Scholar] [CrossRef]
  61. Yi, G.F.; Carroll, J.A.; Allee, G.L.; Gaines, A.M.; Kendall, D.C.; Ursy, J.L.; Toride, Y.; Izuru, S. Effect of glutamine and spray-dried plasma on growth performance, small intestinal morphology, and immune responses of Escherichia coli K88+-challenged weaned pigs. J. Anim. Sci. 2005, 83, 634–643. [Google Scholar] [CrossRef]
  62. Ewaschuk, J.B.; Murdoch, G.K.; Johnson, I.R.; Madsen, K.L.; Field, C.J. Glutamine supplementation improves intestinal barrier function in a weaned piglet model of Escherichia coli infection. Brit. J. Nutr. 2011, 106, 870–877. [Google Scholar] [CrossRef]
  63. Cabrera, R.A.; Ursy, J.L.; Arellano, C.; Nogueira, E.T.; Kutschenko, M.; Moeser, A.J. Effects of creep feeding and supplemental glutamine or glutamine plus glutamate (Aminogut) on pre- and post-weaning growth performance and intestinal health of piglets. J. Anim. Sci. Biotech. 2013, 4, 29. [Google Scholar] [CrossRef] [PubMed]
Figure 1. Percentages of total phagocytic cells, SWC3 on monocytes, SWC3 on granulocytes, and CD11+CD18+ in the peripheral blood of pigs. Values are expressed as mean and standard deviation (α ± SD). One-way ANOVA followed by Friedman’s and Mann–Whitney U test was used to show the significance of statistical differences (p ≤ 0.05) between the control and experimental groups. Capital letters indicate statistically significant results between groups (U test), and lower-case letters indicate significant differences in the Friedman test and post hoc tests. I—control group, and II—experimental group.
Agriculture 13 00912 g001
Figure 2. Percentages of CD14+ and CD14+CD16+ cells and the lysozyme concentration in the peripheral blood of pigs. Values are expressed as mean and standard deviation (α ± SD). One-way ANOVA followed by Friedman’s and Mann–Whitney U test was used to show the significance of statistical differences (p ≤ 0.05) between the control and experimental groups. Capital letters indicate statistically significant results between groups (U test), and lower-case letters indicate significant differences in the Friedman test and post hoc tests. I—control group, and II—experimental group.
Agriculture 13 00912 g002
Figure 3. Flow cytometric analysis of phagocytosis in blood of pigs (dot plots). (A)—pig white blood cells—lymphocytes (P11), monocytes (P12), and granulocytes (P13), (B)—phagocytosis-negative control; (A1)—phagocytic cells in pigs at 28 days of age in control group; (A2)—phagocytic cells in pigs at 70 days of age in control group; (A3)—phagocytic cells in pigs at 160 days of age in control group; (B1)—phagocytic cells in pigs at 28 days of age in the experimental group; (B2)—phagocytic cells in pigs at 70 days of age in experimental group; (B3)—phagocytic cells in pigs at 160 days of age in experimental group; P18—gate containing cells phagocytizing E. coli labeled with FITC (fluorescein isothiocyanate).
Agriculture 13 00912 g003
Figure 4. Glutamine and glutamate concentrations (nmol/mL) in the peripheral blood of pigs. Values are expressed as mean and standard deviation (α ± SD). One-way ANOVA followed by Friedman’s and Mann–Whitney U test was used to show the significance of statistical differences (p ≤ 0.05) between the control and experimental groups. Capital letters indicate statistically significant results between groups (U test), and lower-case letters indicate significant differences in the Friedman test and post hoc tests. I—control group, and II—experimental group.
Agriculture 13 00912 g004
Figure 5. Results of PCA based on the mean level of blood factors in time.
Agriculture 13 00912 g005
Table 1. Ingredients content of the pigs’ feed mixtures (as-fed basis).
ItemPhase 0
Preweaning,
7–28 Days of Age
Phase 1 Prestarter, 28–42 Days of Age
about 13–20 kg Body Weight
Phase 2 Starter, 42–70 Days of Age
about 20–35 kg Body Weight
Phase 3 Grower, 71–98 Days of Age
about 35–60 kg Body Weight
Phase 4 Finisher, 98–160 Days of Age
about 60–100 kg Body Weight)
Experimental Period
Ingredient (%)All animalsGroup IGroup IIGroup IGroup IIAll animalsAll animals
Wheat24.8215.015.015.015.015.015.0
Barley10.010.010.010.010.038.4239.04
Triticale-10.010.015.015.015.015.0
Corn19.027.6227.1225.3624.86--
Soybean meal10.016.016.018.018.014.012.0
Wheat bran---10.010.012.015.0
Soybean oil4.03.33.33.03.02.51.5
Skimmed milk
powder
12.010.010.0----
Dried whey10.05.05.0----
Fish meal8.0------
Sodium chloride0.10.150.150.320.320.280.26
Phosphate 1-Ca-0.280.280.500.500.300.15
Limestone0.81.201.201.501.501.401.2
Vitamin/mineral
premix
0.50.50.50.50.50.50.5
L-Lysine0.370.480.480.450.450.340.23
DL-Methionine0.240.250.250.170.170.110.03
L-Threonine0.170.220.220.200.200.150.09
L-Glutamine--0.5-0.5--
Table 2. The nutritional value of the pigs’ feed mixtures (as-fed basis).
ItemPhase 0
Preweaning,
7–28 Days of Age
Phase 1 Prestarter, 28–42 Days of Age
about 13–20 kg Body Weight
Phase 2 Starter, 42–70 Days of Age
about 20–35 kg Body Weight
Phase 3 Grower, 71–98 Days of Age
about 35–60 kg Body Weight
Phase 4 Finisher, 98–160 Days of Age
about 60–100 kg Body Weight)
Experimental Period
Metabolizable
Energy (MJ)
14.213.913.413.012.6
Crude protein200.0180.0170.0160.0156.0
Dry matter894.0888.0880.0880.0880.0
Crude fiber20.224.035.043.045.0
Crude ash58.752.053.252.849.5
Ether extract60.652.852.344.235.4
N-free extractives554.5579.2569.5580.0594.1
Phosphorus
(digestible)
4.03.02.72.52.2
Calcium8.57.67.66.85.6
Lysine16.114.212.210.59.1
Methionine
+ Cystine
9.88.57.46.65.7
Threonine10.08.87.66.85.8
Tryptophan2.82.52.42.52.4
Table 3. Mean fluorescence intensity of peripheral blood phagocytic cells in pigs from groups I and II. Values are expressed as mean and standard deviation (α +/− SD).
DayMean Fluorescence Intensity (%)
Group IGroup II
28188.75 ± 22.2 a183.47 ± 23.1 a
70156.87 ± 15.4 bA299.02 ± 23.1 bB
160170.36 ± 10.6 bA287.24 ± 12.8 bB
Values are expressed as mean and standard deviation (α ± SD). One-way ANOVA followed by Friedman’s and Mann–Whitney U test was used to show the significance of statistical differences (p ≤ 0.05) between the control and experimental groups. Capital letters indicate statistically significant results between the groups on the day of the test, and lowercase letters indicate significant differences in a given group. I—control group, and II—experimental group.
Table 4. Granulocyte and monocyte oxidative burst under E. coli stimulation of pigs from groups I and II. Values are expressed as mean and standard deviation (α +/− SD).
DayOxidized Cells (%)
E. coli Stimulation
Group IGroup II
2849.23 ± 6.3 a47.9 ± 7.8 a
7059.62 ± 7.2 aA82.14 ± 11.2 bB
16056.1 ± 9.3 aA72.4 ± 6.5 bB
Values are expressed as mean and standard deviation (α ± SD). One-way ANOVA followed by Friedman’s and Mann–Whitney U test was used to show the significance of statistical differences (p ≤ 0.05) between the control and experimental groups. Capital letters indicate statistically significant results between the groups on the day of the test, and lowercase letters indicate significant differences in a given group. I—control group, and II—experimental group.
Table 5. Serum concentrations of IL-1β, IL-6, TNF-α and IL-10 in pigs from groups I and II. Values are expressed as the mean and standard deviation (α +/− SD).
IL-1βIL-6TNF-αIL-10
DayIIIIIIIIIIII
2834.91 ± 2.25 a34.22 ± 3.82 a41.82 ± 4.53 a44.12 ± 5.11 a27.98 ± 6.54 a26.64 ± 3.22 a45.25 ± 6.54 a43.21 ± 8.16 a
7045.18 ± 6.11 aA93.11 ± 7.38 bB61.35 ± 7.25 aA127.42 ± 11.62 bB38.16 ± 9.25 aA112.62 ± 11.08 bB41.13 ± 6.22 a46.72 ± 9.25 a
16051.21 ± 5.14 bA88.74 ±6.72 bB129.12 ± 13.21 b135.42 ± 10.29 b47.23 ± 12.33 bA84.94 ± 11.13 cB58.23 ± 11.14 aA75.36 ± 7.14 bB
Values are expressed as mean and standard deviation (α ± SD). One-way ANOVA followed by Friedman’s and Mann–Whitney U test was used to show the significance of statistical differences (p ≤ 0.05) between the control and experimental groups. Capital letters indicate statistically significant results between the groups on the day of the test, and lowercase letters indicate significant differences in a given group. I—control group, and II—experimental group.
Table 6. Results of PCA based on the average level of blood factors of the control and experimental groups differing in the presence of glutamine in the diet. Values in bold are statistically significant for p < 0.05.
VariablesAxis 1Axis 2Axis 3Axis 4
Eigenvalues267.3555.078.261.29
Percentage80.5316.592.490.39
Cumulative Percentages80.5397.1299.6099.99
Lysozyme0.04−0.010.02−0.13
Total Fagocytic Cells0.66−0.64−0.25−0.12
SWC3_mon0.270.460.360.11
SWC3_gran0.380.45−0.09−0.72
Mean CD11b+CD18+0.22−0.270.88−0.06
Mean CD14+0.550.34−0.160.55
Mean CD14+CD16+0.10−0.020.010.37
Glutamate0.340.92−0.020.05
Glutamine0.92−0.33−0.03−0.20
Disclaimer/Publisher’s Note: The statements, opinions and data contained in all publications are solely those of the individual author(s) and contributor(s) and not of MDPI and/or the editor(s). MDPI and/or the editor(s) disclaim responsibility for any injury to people or property resulting from any ideas, methods, instructions or products referred to in the content.

