
Influence of Conservation Agriculture on Durum Wheat Grain, Dough Texture Profile and Pasta Quality in a Mediterranean Region
 , ,
, ,
Abstract
:1. Introduction
2. Materials and Methods
2.1. Site Description
2.2. Climatic Conditions
2.3. Experimental Design and Agronomic Management Systems
2.4. Grain Analysis and Semolina Milling
2.5. Dough Texture Profile Analysis
2.6. Pasta Processing and Quality Analysis
2.7. Statistical Analysis
3. Results
3.1. Grain Quality and Semolina Yield
3.2. Dough Texture Profile
3.3. Pasta Quality
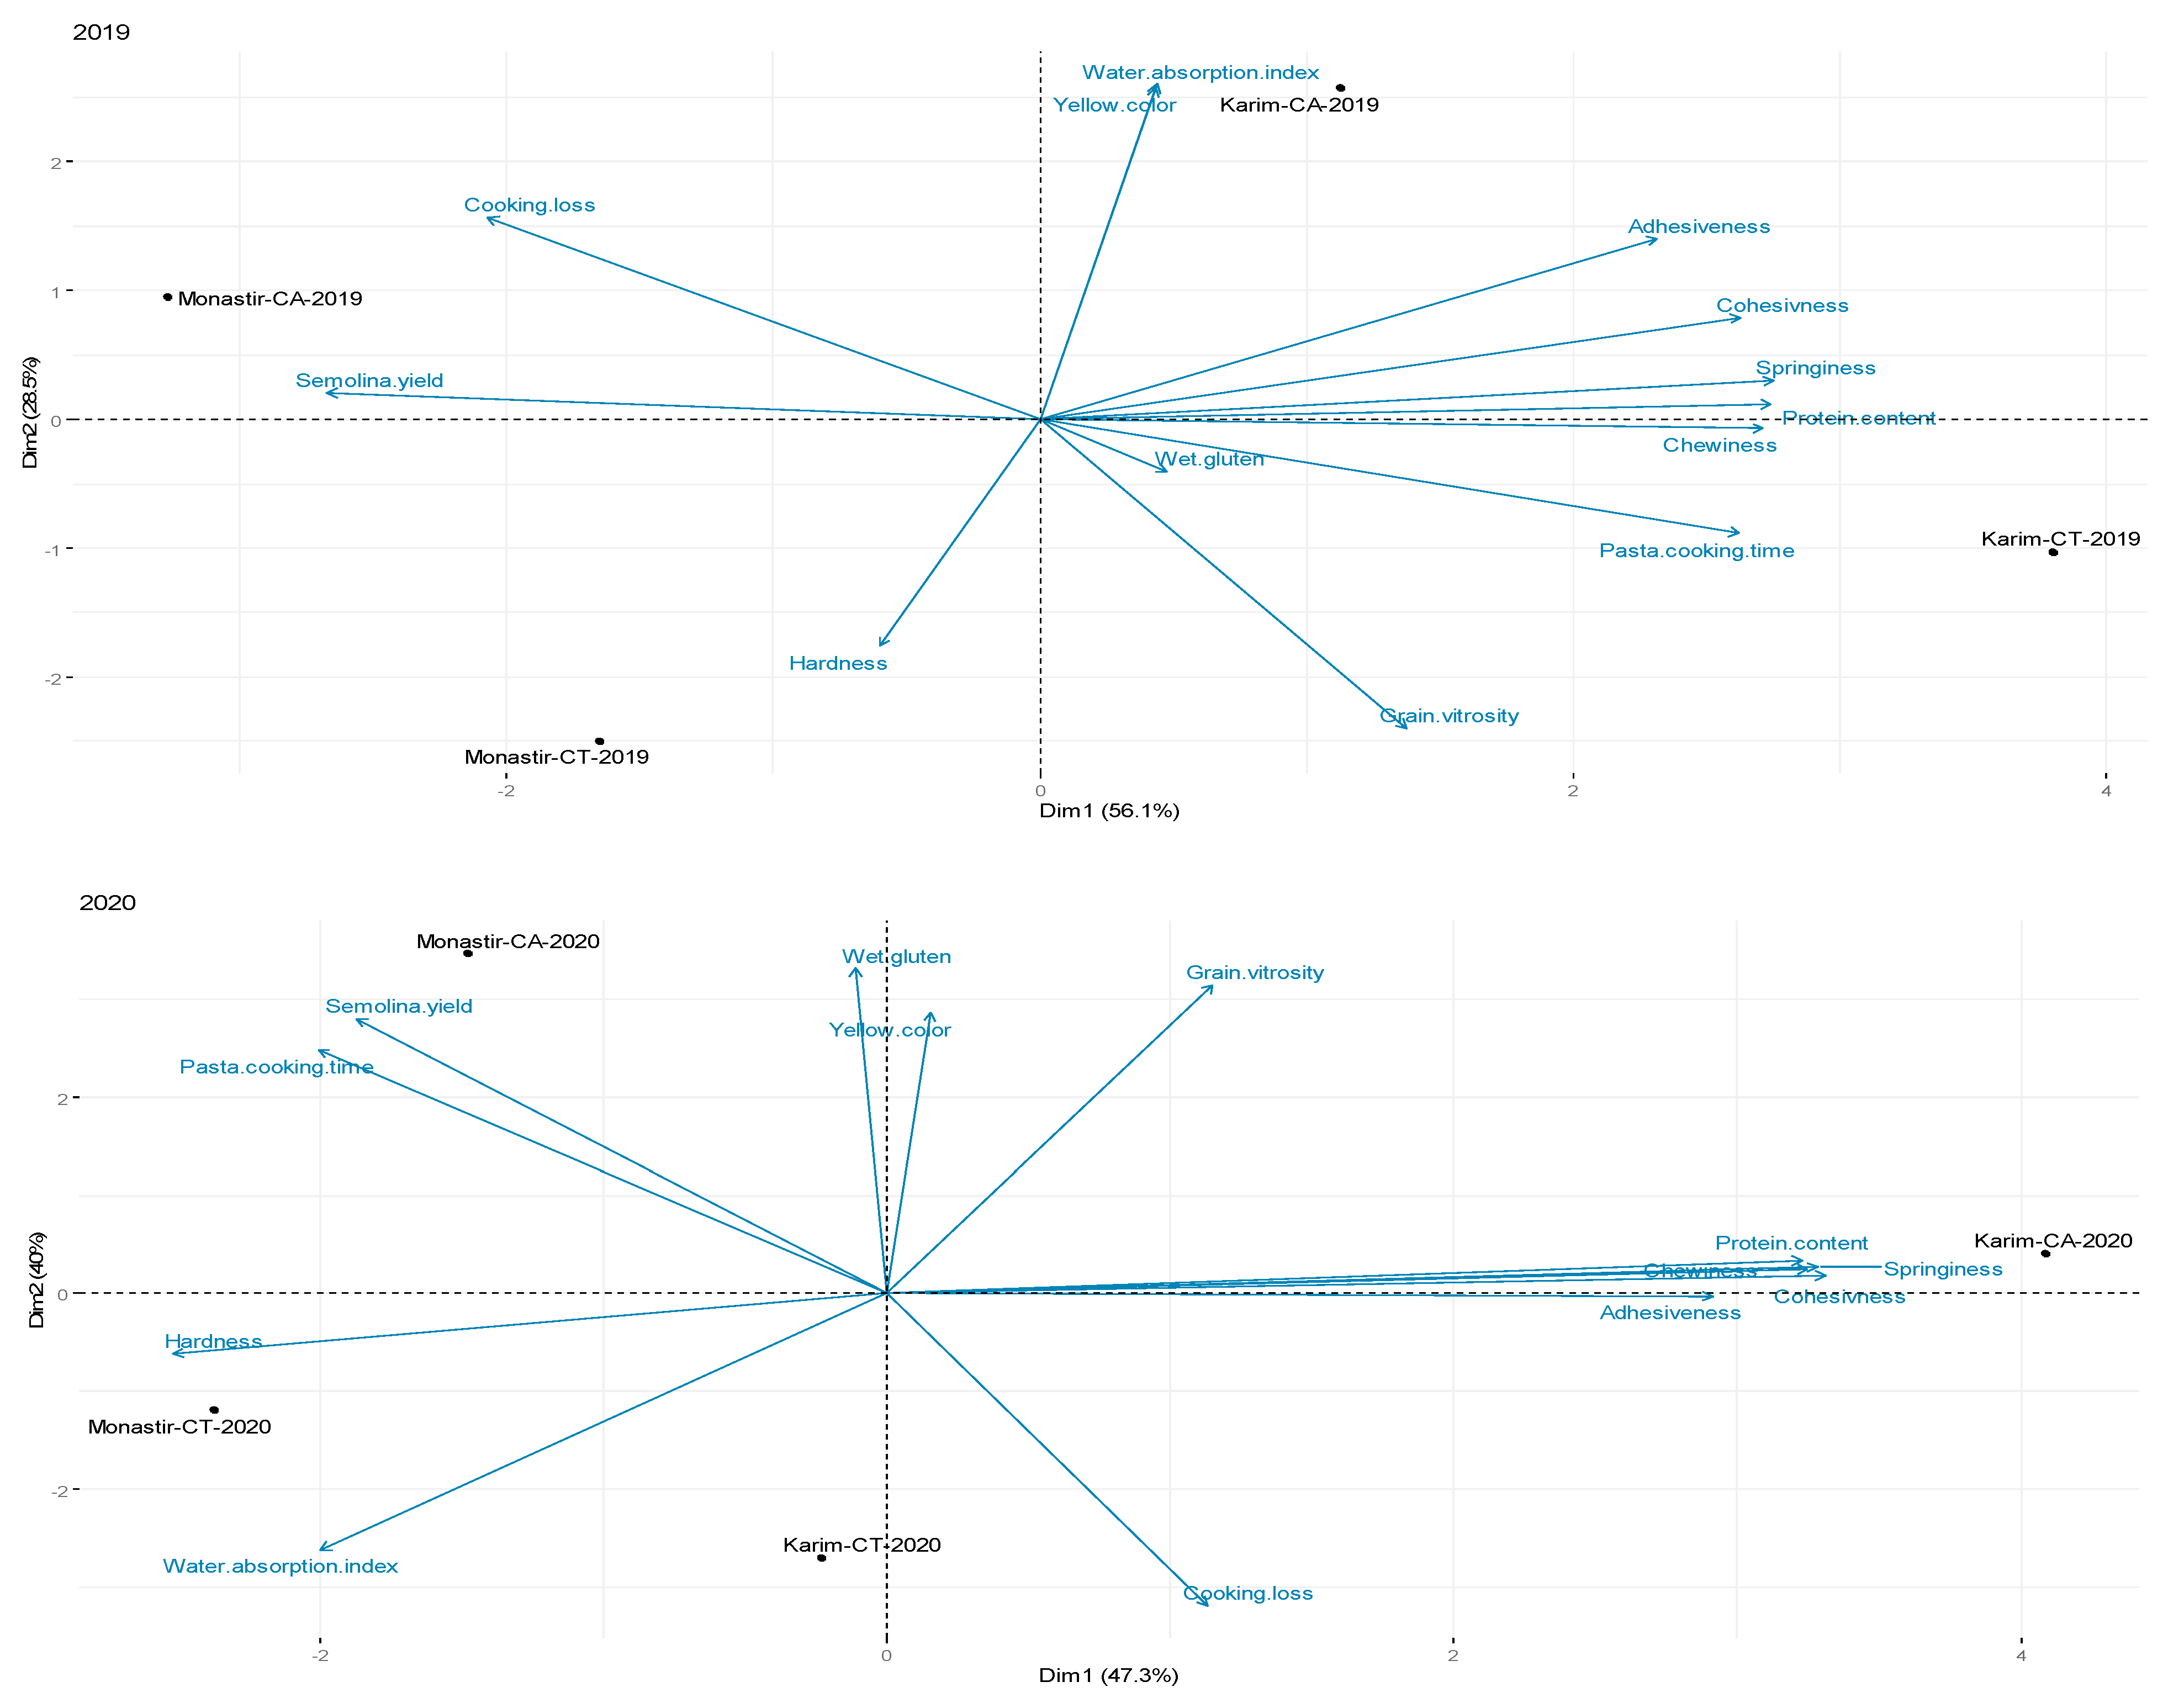
3.4. PCA Biplot
4. Discussion
4.1. Grain Quality and Semolina Yield
4.2. Dough Texture Profile
4.3. Pasta Quality
5. Conclusions
- The grain vitrosity was affected by SM only in the wet year, which increased under CA, while the protein content and wet gluten were affected by SM in both years, and the CA resulted in higher values in the dry year only.
- Dough hardness was always higher under CT, but dough adhesiveness, springiness, chewiness, and cohesiveness were higher under CA only in the dry year, which positively correlated with the protein content.
- The pasta yellowness was increased under CA rather than CT in both seasons. The pasta cooking time was higher under CA in the dry year thanks to the protein content and quality, while the cooking loss and water absorption index were lower in the same season.
- The “Karim” variety gave a high protein content, dough adhesiveness, springiness, chewiness, and cohesiveness, while the “Monastir” variety resulted in a higher semolina yield and dough hardness.
- Interaction soil management and variety were affected in both years, but only in terms of the pasta’s yellowness and dough’s hardness.
Author Contributions
Funding
Institutional Review Board Statement
Data Availability Statement
Conflicts of Interest
References
- Lhomme, J.P.; Mougou, R.; Mansour, M. Potential impact of climate change on durum wheat cropping in Tunisia. Clim. Change 2009, 96, 549–564. [Google Scholar] [CrossRef]
- Latiri, K.; Lhomme, J.P.; Annabi, M.; Setter, T.L. Wheat production in Tunisia: Progress, inter-annual variability and relation to rainfall. Eur. J. Agron. 2010, 33, 33–42. [Google Scholar] [CrossRef]
- ONAGRI. Observatoire National de L’agriculture. 2021. Available online: http://www.onagri.nat.tn/uploads/lettre/LETTRE-1-2022-VERSION.F.pdf (accessed on 20 March 2023).
- Kassam, A.H.; Basch, G.; Friedrich, T.; Shaxson, F.; Goddard, T.; Amado, T.; Crabtree, B.; Hongwen, L.; Mello, I.; Pisante, M.; et al. Sustainable soil management is more than what and how crops are grown. In Principles of Soil Management in Agro-Ecosystems, 1st ed.; Advances in Soil Science; Lal, R., Stewart, B.A., Eds.; CRC Press; Taylor & Francis Group: Boca Raton, FL, USA, 2013; Chapter 14; pp. 338–399. [Google Scholar]
- Lal, R. Climate Change and Soil Degradation Mitigation by Sustainable Management of Soils and Other Natural Resources. Agric. Res. 2012, 1, 199–212. [Google Scholar] [CrossRef]
- Anderson, W.K.; Impiglia, A. Management of dryland wheat. In Bread Wheat; FAO: Rome, Italy, 2002; ISBN 92-5-104809-6. [Google Scholar]
- Lal, R. Soil Carbon Sequestration Impacts on Global Climate Change and Food Security. Science 2004, 304, 1623–1627. [Google Scholar] [CrossRef] [PubMed]
- Hobbs, P.R.; Sayre, K.; Gupta, R. The Role of Conservation Agriculture in Sustainable Agriculture. Philos. Trans. R. Soc. B Biol. Sci. 2008, 363, 543–555. [Google Scholar] [CrossRef] [PubMed]
- Rinaldi, M.; Almeida, A.S.; Álvaro Fuentes, J.; Annabi, M.; Annicchiarico, P.; Castellini, M.; Cantero Martinez, C.; Cruz, M.G.; D’Alessandro, G.; Gitsopoulos, T.; et al. Open Questions and Research Needs in the Adoption of Conservation Agriculture in the Mediterranean Area. Agronomy 2022, 12, 1112. [Google Scholar] [CrossRef]
- Derpsch, R. No-Tillage and Conservation Agriculture: A Progress Report. No-Till Farming Syst. 2008, 3, 7–39. [Google Scholar]
- M’hamed, H.C.; Bahri, H.; Annabi, M.; Frija, A.; Idoudi, Z. Historical Review and Future Opportunities for Wider Scaling of Conservation Agriculture in Tunisia. In Conservation Agriculture in Africa: Climate Smart Agricultural Development; CABI: Wallingford, UK, 2022; pp. 137–150. [Google Scholar]
- Sithole, N.J.; Magwaza, L.S.; Mafongoya, P.L. Conservation Agriculture and Its Impact on Soil Quality and Maize Yield: A South African Perspective. Soil Tillage Res. 2016, 162, 55–67. [Google Scholar] [CrossRef]
- Shrestha, J.; Subedi, S.; Timsina, K.; Chaudhary, A.; Kandel, M.; Tripathi, S. Conservation agriculture as an approach towards sustainable crop production: A Review. Farming Manag. 2020, 5, 7–15. [Google Scholar]
- Eze, S.; Dougill, A.J.; Banwart, S.A.; Hermans, T.D.G.; Ligowe, I.S.; Thierfelder, C. Impacts of Conservation Agriculture on Soil Structure and Hydraulic Properties of Malawian Agricultural Systems. Soil Tillage Res. 2020, 201, 104639. [Google Scholar] [CrossRef]
- Ngwira, A.R.; Thierfelder, C.; Lambert, D.M. Conservation Agriculture Systems for Malawian Smallholder Farmers: Long-Term Effects on Crop Productivity, Profitability and Soil Quality. Renew. Agric. Food Syst. 2013, 28, 350–363. [Google Scholar] [CrossRef]
- Parihar, C.M.; Yadav, M.R.; Jat, S.L.; Singh, A.K.; Kumar, B.; Pradhan, S.; Chakraborty, D.; Jat, M.L.; Jat, R.K.; Saharawat, Y.S.; et al. Long Term Effect of Conservation Agriculture in Maize Rotations on Total Organic Carbon, Physical and Biological Properties of a Sandy Loam Soil in North-Western Indo-Gangetic Plains. Soil Tillage Res. 2016, 161, 116–128. [Google Scholar] [CrossRef]
- Azooz, R.H.; Arshad, M.A. Soil Infiltration and Hydraulic Conductivity under Long-Term No-Tillage and Conventional Tillage Systems. Can. J. Soil Sci. 1996, 76, 143–152. [Google Scholar] [CrossRef]
- Verhulst, N.; Govaerts, B.; Verachtert, E.; Castellanos-Navarrete, A.; Mezzalama, M.; Wall, P.; Deckers, J.; Sayre, K.D. Conservation Agriculture, Improving Soil Quality for Sustainable Production Systems. In Advances in Soil Science: Food Security and Soil Quality, 1st ed.; Lal, R., Stewart, B.A., Eds.; CRC Press: Boca Raton, FL, USA, 2010; pp. 137–208. [Google Scholar]
- Greb, B.W. Effect of Surface-Applied Wheat Straw on Soil Water Losses by Solar Distillation. Soil Sci. Soc. Am. J. 1966, 30, 786–788. [Google Scholar] [CrossRef]
- Martínez, I.; Chervet, A.; Weisskopf, P.; Sturny, W.G.; Etana, A.; Stettler, M.; Forkman, J.; Keller, T. Two Decades of No-till in the Oberacker Long-Term Field Experiment: Part I. Crop Yield, Soil Organic Carbon and Nutrient Distribution in the Soil Profile. Soil Tillage Res. 2016, 163, 141–151. [Google Scholar] [CrossRef]
- Obalum, S.E.; Obi, M.E. Physical Properties of a Sandy Loam Ultisol as Affected by Tillage-Mulch Management Practices and Cropping Systems. Soil Tillage Res. 2010, 108, 30–36. [Google Scholar] [CrossRef]
- Zemmouri, B.; Lammoglia, S.-K.; Bouras, F.-Z.; Seghouani, M.; Rebouh, N.Y.; Latati, M. Modelling human health risks from pesticide use in innovative legume-cereal intercropping systems in Mediterranean conditions. Ecotoxicol. Environ. Saf. 2022, 238, 113590. [Google Scholar] [CrossRef]
- Pandey, V.L.; Mahendra Dev, S.; Jayachandran, U. Impact of Agricultural Interventions on the Nutritional Status in South Asia: A Review. Food Policy 2016, 62, 28–40. [Google Scholar] [CrossRef]
- López-Bellido, L.; López-Bellido, R.J.; Castillo, J.E.; López-Bellido, F.J. Effects of Long-Term Tillage, Crop Rotation and Nitrogen Fertilization on Bread-Making Quality of Hard Red Spring Wheat. Field Crops Res. 2001, 72, 197–210. [Google Scholar] [CrossRef]
- IPO. International Pasta Organization. Available online: https://internationalpasta.org/pasta/ (accessed on 17 June 2022).
- Bresciani, A.; Pagani, M.A.; Marti, A. Pasta-Making Process: A Narrative Review on the Relation between Process Variables and Pasta Quality. Foods 2022, 11, 256. [Google Scholar] [CrossRef]
- Gao, X.; Tong, J.; Guo, L.; Yu, L.; Li, S.; Yang, B.; Wang, L.; Liu, Y.; Li, F.; Guo, J.; et al. Influence of Gluten and Starch Granules Interactions on Dough Mixing Properties in Wheat (Triticum aestivum L.). Food Hydrocoll. 2020, 106, 105885. [Google Scholar] [CrossRef]
- Padalino, L.; Mastromatteo, M.; Lecce, L.; Spinelli, S.; Conte, A.; Del Nobile, M.A. Effect of Raw Material on Cooking Quality and Nutritional Composition of Durum Wheat Spaghetti. Int. J. Food Sci. Nutr. 2015, 66, 266–274. [Google Scholar] [CrossRef] [PubMed]
- Troccoli, A.; Borrelli, G.M.; De Vita, P.; Fares, C.; Di Fonzo, N. Durum wheat quality: A multidisciplinary concept. J. Cereal Sci. 2000, 32, 99–113. [Google Scholar] [CrossRef]
- Danga, B.O.; Ouma, J.P.; Wakindiki, I.I.; Bar-Tal, A. Legume—Wheat rotation effects on residual soil moisture, nitrogen and wheat yield in tropical regions. Adv. Agron. 2009, 101, 315–349. [Google Scholar] [CrossRef]
- Osunbitan, J.A.; Oyedele, D.J.; Adekalu, K.O. Tillage Effects on Bulk Density, Hydraulic Conductivity and Strength of a Loamy Sand Soil in Southwestern Nigeria. Soil Tillage Res. 2005, 82, 57–64. [Google Scholar] [CrossRef]
- Grahmann, K.; Verhulst, N.; Buerkert, A.; Ortiz-Monasterio, I.; Govaerts, B. Nitrogen use efficiency and optimization of nitrogen fertilization in conservation agriculture. CAB Rev. Perspect. Agric. Veter. Sci. Nutr. Nat. Resour. 2013, 8, 1–19. [Google Scholar] [CrossRef]
- Woźniak, A.; Rachoń, L. Effect of Tillage Systems on the Yield and Quality of Winter Wheat Grain and Soil Properties. Agriculture 2020, 10, 405. [Google Scholar] [CrossRef]
- Djouadi, K.; Mekliche, A.; Dahmani, S.; Ladjiar, N.I.; Abid, Y.; Silarbi, Z.; Hamadache, A.; Pisante, M. Durum Wheat Yield and Grain Quality in Early Transition from Conventional to Conservation Tillage in Semi-Arid Mediterranean Conditions. Agriculture 2021, 11, 711. [Google Scholar] [CrossRef]
- Pagnani, G.; Galieni, A.; D’Egidio, S.; Visioli, G.; Stagnari, F.; Pisante, M. Effect of Soil Tillage and Crop Sequence on Grain Yield and Quality of Durum Wheat in Mediterranean Areas. Agronomy 2019, 9, 488. [Google Scholar] [CrossRef]
- Abdedayem, W.; M’Barek, S.B.; Souissi, A.; Laribi, M.; Araar, C.; Kouki, H.; Fakhfakh, M.; Yahyaoui, A. Septoria tritici blotch disease progression and physiological traits variation in durum wheat variety mixtures. J. New Sci. 2021, 80, 4664–4674. [Google Scholar]
- ISO 5983–1:2005; Animal Feeding Stuffs—Determination of Nitrogen Content and Calculation of Crude Protein Content—Part 1: Kjeldahl Method. International Organization for Standardization (Geneva, Switzerland). ISO: London, UK, 2005.
- AACC International. Approved Methods of Analysis, 10th ed.; American Association of Cereal Chemists International: St. Paul, MN, USA, 2000. [Google Scholar]
- Borrelli, G.M.; Troccoli, A.; Di Fonzo, N.; Fares, C. Durum Wheat Lipoxygenase Activity and Other Quality Parameters That Affect Pasta Color. Cereal Chem. 1999, 76, 335–340. [Google Scholar] [CrossRef]
- Armero, E.; Collar, C. Texture Properties of Formulated Wheat Doughs. Z. Für Leb. Forsch. A 1997, 204, 136–145. [Google Scholar] [CrossRef]
- Hajji, T.; Sfayhi-Terras, D.; EL Felah, M.; Rezgui, S.; Ferchichi, A. Incorporation of β-Glucans into Pasta Extracted from Two Tunisian Barley Cultivars. Int. J. Food Eng. 2016, 12, 701–710. [Google Scholar] [CrossRef]
- Cleary, L.; Brennan, C. The Influence of a (1→3)(1→4)-β-d-Glucan Rich Fraction from Barley on the Physico-Chemical Properties and in Vitro Reducing Sugars Release of Durum Wheat Pasta. Int. J. Food Sci. Technol. 2006, 41, 910–918. [Google Scholar] [CrossRef]
- R Core Team. R: A Language and Environment for Statistical Computing; R Foundation for Statistical Computing: Vienna, Austria, 2017. [Google Scholar]
- Kaspar, T.C.; Jaynes, D.B.; Parkin, T.B.; Moorman, T.B.; Singer, J.W. Effectiveness of oat and rye cover crops in reducing nitrate losses in drainage water. Agric. Water Manag. 2012, 110, 25–33. [Google Scholar] [CrossRef]
- Landi, A. Durum Wheat, semolina and pasta quality characteristics for an Italian food company. In Durum Wheat Quality in the Mediterranean Region; Di Fonzo, N., Kaan, F., Nachit, M., Eds.; CIHEAM: Zaragoza, Spain, 1995; pp. 33–42. [Google Scholar]
- Wozniak, A. The Effect of Tillage Systems on Yield and Quality of Durum Wheat Cultivars. Turk. J. Agric. For. 2013, 37, 133–138. [Google Scholar] [CrossRef]
- Colecchia, S.A.; De Vita, P.; Rinaldi, M. Effects of Tillage Systems in Durum Wheat under Rainfed Mediterranean Conditions. Cereal Res. Commun. 2015, 43, 704–716. [Google Scholar] [CrossRef]
- Brooks, A.; Jenner, C.; Aspinall, D. Effects of Water Deficit on Endosperm Starch Granules and on Grain Physiology of Wheat and Barley. Funct. Plant Biol. 1982, 9, 423–436. [Google Scholar] [CrossRef]
- Kherif, O.; Keskes, M.I.; Pansu, M.; Ouaret, W.; Rebouh, Y.-N.; Dokukin, P.; Kucher, D.; Latati, M. Agroecological modeling of nitrogen and carbon transfers between decomposer micro-organisms, plant symbionts, soil and atmosphere in an intercropping system. Ecol. Model. 2021, 440, 109390. [Google Scholar] [CrossRef]
- Latati, M.; Dokukin, P.; Aouiche, A.; Rebouh, N.Y.; Takouachet, R.; Hafnaoui, E.; Hamdani, F.Z.; Bacha, F.; Ounane, S.M. Species Interactions Improve Above-Ground Biomass and Land Use Efficiency in Intercropped Wheat and Chickpea under Low Soil Inputs. Agronomy 2019, 9, 765. [Google Scholar] [CrossRef]
- Thierfelder, C.; Wall, P.C. Effects of Conservation Agriculture Techniques on Infiltration and Soil Water Content in Zambia and Zimbabwe. Soil Tillage Res. 2009, 105, 217–227. [Google Scholar] [CrossRef]
- Moreira, S.; Kiehl, J.; Prochnow, L.; Pauletti, V.; Neto, L.; Resende, Á. Soybean Macronutrient Availability and Yield as Affected by Tillage System. Acta Sci. Agron. 2019, 42, e42973. [Google Scholar] [CrossRef]
- Sissons, M.; Kadkol, G.; Taylor, J. Genotype by Environment Effects on Durum Wheat Quality and Yield-Implications for Breeding. Crop Breed. Genet. Genom. 2020, 2, 2020018. [Google Scholar] [CrossRef]
- Park, E.Y.; Baik, B.-K.; Machado, S.; Gollany, H.T.; Fuerst, E.P. Functional and Nutritional Characteristics of Soft Wheat Grown in No-Till and Conventional Cropping Systems. Cereal Chem. 2015, 92, 332–338. [Google Scholar] [CrossRef]
- Trad, H.; Ayed, S.; Teixeira da Silva, J.; Othmani, A.; Bouhaouel, I.; Helel, R.; Slim-Amara, H. Quality Assessment of Durum Wheat Landraces and Modern Varieties through Physico-Chemical Properties. IOSR J. Agric. Vet. Sci. 2022, 15, 56–67. [Google Scholar] [CrossRef]
- Wang, K.; Fu, B.X. Inter-Relationships between Test Weight, Thousand Kernel Weight, Kernel Size Distribution and Their Effects on Durum Wheat Milling, Semolina Composition and Pasta Processing Quality. Foods 2020, 9, 1308. [Google Scholar] [CrossRef] [PubMed]
- Kerbouai, I.; Cheikh M’hamed, H.; Jenfaoui, H.; Riahi, J.; Mokrani, K.; Jribi, S.; Arfaoui, S.; Sassi, K.; Ben Ismail, H. Long-Term Effect of Conservation Agriculture on the Composition and Nutritional Value of Durum Wheat Grains Grown over Two Years in a Mediterranean Environment. J. Sci. Food Agric. 2022, 102, 7379–7386. [Google Scholar] [CrossRef] [PubMed]
- Victoriano, L.G.; Vera, N.G.; Simental, S.S.; Hernández, J.P.; Lira, A.Q.; Martini, J.P. Quality Properties of Doughs and Noodles Using Chayotextle (Sechiem edule) Flours. Food Sci. Technol. 2021, 41, 158–166. [Google Scholar] [CrossRef]
- Li, Q.; Liu, R.; Wu, T.; Zhang, M. Interactions between Soluble Dietary Fibers and Wheat Gluten in Dough Studied by Confocal Laser Scanning Microscopy. Food Res. Int. 2017, 95, 19–27. [Google Scholar] [CrossRef]
- Barak, S.; Mudgil, D.; Khatkar, B.S. Influence of Gliadin and Glutenin Fractions on Rheological, Pasting, and Textural Properties of Dough. Int. J. Food Prop. 2014, 17, 1428–1438. [Google Scholar] [CrossRef]
- Mironeasa, S.; Ungureanu-Iuga, M.; Zaharia, D.; Mironeasa, C. Rheological Analysis of Wheat Flour Dough as Influenced by Grape Peels of Different Particle Sizes and Addition Levels. Food Bioprocess Technol. 2019, 12, 228–245. [Google Scholar] [CrossRef]
- García-Molina, M.D.; Barro, F. Characterization of Changes in Gluten Proteins in Low-Gliadin Transgenic Wheat Lines in Response to Application of Different Nitrogen Regimes. Front. Plant. Sci. 2017, 8, 257–269. [Google Scholar] [CrossRef] [PubMed]
- Liu, D.; Song, S.; Tao, L.; Yu, L.; Wang, J. Effects of Common Buckwheat Bran on Wheat Dough Properties and Noodle Quality Compared with Common Buckwheat Hull. LWT 2022, 155, 112971. [Google Scholar] [CrossRef]
- Hüttner, E.K.; Bello, F.D.; Arendt, E.K. Rheological Properties and Bread Making Performance of Commercial Wholegrain Oat Flours. J. Cereal Sci. 2010, 52, 65–71. [Google Scholar] [CrossRef]
- Guardianelli, L.; Puppo, M.C.; Salinas, M.V. Influence of Pistachio By-Product from Edible Oil Industry on Rheological, Hydration, and Thermal Properties of Wheat Dough. LWT 2021, 150, 111917. [Google Scholar] [CrossRef]
- Souza, E.J.; Martin, J.M.; Guttieri, M.J.; O’Brien, K.M.; Habernicht, D.K.; Lanning, S.P.; McLean, R.; Carlson, G.R.; Talbert, L.E. Influence of Genotype, Environment, and Nitrogen Management on Spring Wheat Quality. Crop Sci. 2004, 44, 425–432. [Google Scholar] [CrossRef]
- Ficco, D.B.M.; Mastrangelo, A.M.; Trono, D.; Borrelli, G.M.; De Vita, P.; Fares, C.; Beleggia, R.; Platani, C.; Papa, R. The Colours of Durum Wheat: A Review. Crop Pasture Sci. 2014, 65, 1–15. [Google Scholar] [CrossRef]
- Calzarano, F.; Stagnari, F.; D’Egidio, S.; Pagnani, G.; Galieni, A.; Di Marco, S.; Metruccio, E.; Pisante, M. Durum Wheat Quality, Yield and Sanitary Status under Conservation Agriculture. Agriculture 2018, 8, 140. [Google Scholar] [CrossRef]
- Rouphael, Y.; Schwarz, D.; Krumbein, A.; Colla, G. Impact of Grafting on Product Quality of Fruit Vegetables. Sci. Hortic. 2010, 127, 172–179. [Google Scholar] [CrossRef]
- Johansson, E.; Branlard, G.; Cuniberti, M.; Flagella, Z.; Hüsken, A.; Nurit, E.; Peña, R.J.; Sissons, M.; Vazquez, D. Genotypic and Environmental Effects on Wheat Technological and Nutritional Quality. In Wheat Quality for Improving Processing and Human Health, 1st ed.; Igrejas, G., Ikeda, T.M., Guzmán, C., Eds.; Springer: Berlin/Heidelberg, Germany, 2020; Chapter 8; pp. 171–204. [Google Scholar]
- Gulia, N.; Khatkar, B.S. Quantitative and Qualitative Assessment of Wheat Gluten Proteins and Their Contribution to Instant Noodle Quality. Int. J. Food Prop. 2015, 18, 1648–1663. [Google Scholar] [CrossRef]
- Chandrashekar, A.; Kirleis, A.W. Influence of Protein on Starch Gelatinization in Sorghum. Influ. Protein Starch Gelatinization Sorghum 1988, 65, 457–462. [Google Scholar]
- Sözer, N.; Kaya, A. Changes in Cooking and Textural Properties of Spaghetti Cooked with Different Levels of Salt in the Cooking Water. J. Texture Stud. 2003, 34, 381–390. [Google Scholar] [CrossRef]
- Kaplan Evlice, A. The Effect of Durum Wheat Genotypes on Cooking Quality of Pasta. Eur. Food Res. Technol. 2022, 248, 815–824. [Google Scholar] [CrossRef]
- Padalino, L.; Mastromatteo, M.; Lecce, L.; Spinelli, S.; Contò, F.; Del Nobile, M.A. Effect of Durum Wheat Cultivars on Physico-Chemical and Sensory Properties of Spaghetti: Effect of Wheat Cultivars on Spaghetti Properties. J. Sci. Food Agric. 2014, 94, 2196–2204. [Google Scholar] [CrossRef] [PubMed]


| Soil Characteristics | Value | |
|---|---|---|
| Soil texture | Clay (g kg−1) | 340 |
| Silt (g kg−1) | 455.6 | |
| Sand (g kg−1) | 194.4 | |
| Soil chemicals | Soil organic matter (g kg−1) | 6.3 |
| pH | 7.49 | |
| Nitrogen (g kg−1) | 1.62 | |
| Potassium (g kg−1) | 1.06 | |
| Phosphorus (mg kg−1) | 64.38 | |
| 2019 | 2020 | |||||
|---|---|---|---|---|---|---|
| CA | CT | Total Mean | CA | CT | Total Mean | |
| Grain vitrosity (%) | ||||||
| Karim | 91.33 ± 2.16 | 74.75 ± 2.82 | 83.04 ± 9.36 | 92.50 ± 2.05 | 93.75 ± 1.00 | 93.13 ± 1.59 |
| Monastir | 87.92 ± 1.26 | 75.17 ± 2.38 | 81.54 ± 7.19 | 92.33 ± 0.58 | 94.33 ± 0.76 | 93.33 ± 1.25 |
| Total mean | 89.63 ± 2.45 | 74.96 ± 2.34 | 92.42 ± 0.58 | 94.04 ± 0.86 | ||
| Soil management (SM) | (130.29) ** | NS | ||||
| Variety (V) | NS | NS | ||||
| SMxV | NS | NS | ||||
| Protein content (%/dw) | ||||||
| Karim | 12.18 ± 0.09 | 12.88 ± 0.09 | 12.53 ± 0.39 | 16.59 ± 0.10 | 15.26 ± 0.35 | 15.93 ± 0.77 |
| Monastir | 10.11 ± 0.24 | 10.96 ±0.18 | 10.53 ±0.50 | 14.81 ±0.08 | 13.58 ±0.08 | 14.20 ±0.68 |
| Total mean | 11.15 ±1.15 | 11.92 ±1.06 | 15.70 ±0.98 | 14.42 ±0.94 | ||
| Soil management (SM) | (65.66) ** | (139.01) ** | ||||
| Variety (V) | (440.31) ** | (252.79) ** | ||||
| SMxV | NS | NS | ||||
| Wet gluten (%/dw) | ||||||
| Karim | 14.17 ± 0.71 | 22.40 ± 0.90 | 18.23 ± 4.57 | 24.60 ± 1.95 | 23.17 ± 2.10 | 23.88 ± 1.98 |
| Monastir | 21.20 ± 0.60 | 15.10 ± 0.50 | 18.15 ± 3.38 | 27.40 ± 1.77 | 23.23 ± 1.10 | 25.32 ± 2.64 |
| Total mean | 17.68 ± 3.90 | 18.75 ± 4.05 | 26.00 ± 2.26 | 23.20 ± 1.50 | ||
| Soil management (SM) | (7.10) * | (7.50) * | ||||
| Variety (V) | NS | NS | ||||
| SMxV | (320.45) ** | NS | ||||
| Semolina yield (%) | ||||||
| Karim | 37.61 ± 0.25 | 36.68 ± 1.56 | 37.15 ± 1.13 | 37.29 ± 1.61 | 36.96 ± 0.31 | 37.13 ± 1.05 |
| Monastir | 40.65 ± 1.47 | 38.82 ± 0.92 | 39.74 ± 1.48 | 38.85 ± 0.51 | 38.01 ± 0.51 | 38.43 ± 0.65 |
| Total mean | 39.13 ± 1.91 | 37.75 ± 1.64 | 38.07 ± 1.37 | 37.49 ± 0.69 | ||
| Soil management (SM) | NS | NS | ||||
| Variety (V) | (14.53) ** | (6.36) * | ||||
| SMxV | NS | NS | ||||
| 2019 | 2020 | |||||
|---|---|---|---|---|---|---|
| CA | CT | Total Mean | CA | CT | Total Mean | |
| Hardness (g) | ||||||
| Karim | 575.67 ± 8.02 | 532.67 ± 10.26 | 554.17 ± 24.95 | 557.33 ± 1.15 | 571.67 ± 13.01 | 564.50 ± 11.40 |
| Monastir | 502.33 ± 4.93 | 769.67 ± 8.39 | 636.00 ± 146.55 | 584.00 ± 15.10 | 655.00 ± 15.00 | 619.50 ± 41.15 |
| Total mean | 539.00 ± 40.61 | 651.17 ± 130.08 | 570.67 ± 17.47 | 613.33 ± 47.34 | ||
| Soil management (SM) | (571.16) ** | (35.03) ** | ||||
| Variety (V) | (304.01) ** | (58.21) ** | ||||
| SMxV | (1093.02) ** | (15.45) ** | ||||
| Adhesiveness (g.s−1) | ||||||
| Karim | −1264.66 ± 69.53 | −1137.27 ± 7.23 | −1200.96 ± 82.60 | −2705.71 ± 228.94 | −1139.86 ± 30.10 | −1922.79 ± 870.00 |
| Monastir | −711.99 ± 18.38 | −721.57 ± 45.88 | −716.78 ± 31.70 | −1079.09 ± 5.27 | −1545.24 ± 80.50 | −1312.16 ± 260.37 |
| Total mean | −988.32 ± 306.11 | −929.42 ± 229.57 | −1892.40 ± 902.63 | −1342.55 ± 228.59 | ||
| Soil management (SM) | (5.68) * | (60.64) ** | ||||
| Variety (V) | (383.82) ** | (74.78) ** | ||||
| SMxV | NS | (207.04) ** | ||||
| Springiness | ||||||
| Karim | 0.34 ± 0.05 | 0.40 ± 0.02 | 0.37 ± 0.05 | 0.84 ± 0.01 | 0.35 ± 0.05 | 0.60 ± 0.27 |
| Monastir | 0.21 ± 0.01 | 0.24 ± 0.03 | 0.23 ± 0.02 | 0.33 ± 0.06 | 0.33 ± 0.06 | 0.33 ± 0.06 |
| Total mean | 0.28 ± 0.07 | 0.32 ± 0.09 | 0.59 ± 0.29 | 0.34 ± 0.05 | ||
| Soil management (SM) | (7.52) * | (68.38) ** | ||||
| Variety (V) | (78.03) ** | (84.08) ** | ||||
| SMxV | NS | (68.38) ** | ||||
| Chewiness (g) | ||||||
| Karim | 72.83 ± 17.72 | 85.95 ± 4.74 | 79.39 ± 13.65 | 297.64 ± 14.20 | 76.90 ± 12.28 | 187.27 ± 121.49 |
| Monastir | 31.90 ± 4.30 | 53.45 ± 6.05 | 42.67 ± 12.70 | 69.51 ± 16.56 | 77.88 ± 16.94 | 73.70 ± 15.67 |
| Total mean | 52.36 ± 25.21 | 69.70 ± 18.46 | 183.57 ± 125.72 | 77.39 ± 13.24 | ||
| Soil management (SM) | (9.21) * | (148.12) ** | ||||
| Variety (V) | (41.32) ** | (169.46) ** | ||||
| SMxV | NS | (172.42) ** | ||||
| Cohesiveness | ||||||
| Karim | 0.37 ± 0.06 | 0.40 ± 0.01 | 0.39 ± 0.04 | 0.63 ± 0.03 | 0.38 ± 0.02 | 0.51 ± 0.14 |
| Monastir | 0.30 ± 0.02 | 0.29 ± 0.01 | 0.30 ± 0.02 | 0.36 ± 0.03 | 0.36 ± 0.02 | 0.36 ± 0.02 |
| Total mean | 0.34 ± 0.06 | 0.35 ± 0.06 | 0.50 ± 0.15 | 0.37 ± 0.02 | ||
| Soil management (SM) | NS | (77.01) ** | ||||
| Variety (V) | (23.45) ** | (98.61) ** | ||||
| SMxV | NS | (77.01) ** |
| 2019 | 2020 | |||||
|---|---|---|---|---|---|---|
| CA | CT | Total Mean | CA | CT | Total Mean | |
| Yellow Index (b*) (%) | ||||||
| Karim | 26.43 ± 1.00 | 20.29 ± 0.30 | 23.36 ± 3.43 | 24.78 ± 0.90 | 20.11 ± 0.14 | 22.45 ± 2.62 |
| Monastir | 21.54 ± 0.58 | 19.14 ± 0.23 | 20.34 ± 1.37 | 25.69 ± 0.32 | 24.26 ± 2.15 | 24.98 ± 1.58 |
| Total mean | 23.99 ± 2.78 | 19.72 ± 0.68 | 25.24 ± 0.78 | 22.19 ± 2.65 | ||
| Soil management (SM) | (148.35) ** | (19.99) ** | ||||
| Variety (V) | (74.23) ** | (13.76) ** | ||||
| SMxV | (28.38) ** | (5.66) * | ||||
| Optimum cooking time (min) | ||||||
| Karim | 9.41 ± 0.20 | 9.87 ± 0.27 | 9.64 ± 0.33 | 8.21 ± 0.11 | 7.46 ± 0.08 | 7.83 ± 0.42 |
| Monastir | 9.03 ± 0.06 | 9.37 ± 0.02 | 9.20 ± 0.19 | 10.61 ± 0.33 | 9.88 ± 0.23 | 10.25 ± 0.47 |
| Total mean | 9.22 ± 0.25 | 9.62 ± 0.32 | 9.41 ± 1.34 | 8.67 ± 1.34 | ||
| Soil management (SM) | (16.08) ** | (35.51) ** | ||||
| Variety (V) | (19.17) ** | (381.15) ** | ||||
| SMxV | NS | NS | ||||
| Cooking loss (%) | ||||||
| Karim | 6.23 ± 0.87 | 4.60 ± 0.95 | 5.42 ± 1.20 | 5.60 ± 0.15 | 5.85 ± 0.41 | 5.73 ± 0.31 |
| Monastir | 6.23 ± 0.18 | 5.74 ± 0.78 | 5.99 ± 0.57 | 4.39 ± 0.11 | 5.55 ± 0.22 | 4.97 ± 0.65 |
| Total mean | 6.23 ± 0.56 | 5.17 ± 0.99 | 5.00 ± 0.67 | 5.70 ± 0.34 | ||
| Soil management (SM) | (5.85) * | (23.41) ** | ||||
| Variety (V) | NS | (27.35) ** | ||||
| SMxV | NS | (9,70) * | ||||
| Water absorption index | ||||||
| Karim | 2.38 ± 0.05 | 2.25 ± 0.11 | 2.32 ± 0.10 | 2.18 ± 0.04 | 2.50 ± 0.10 | 2.34 ± 0.19 |
| Monastir | 2.33 ± 0.05 | 2.05 ± 0.03 | 2.19 ± 0.15 | 2.18 ± 0.13 | 2.64 ± 0.15 | 2.41 ± 0.28 |
| Total mean | 2.35 ± 0.05 | 2.15 ± 0.13 | 2.18 ± 0.08 | 2.57 ± 0.14 | ||
| Soil management (SM) | (27.26) ** | (35.88) ** | ||||
| Variety (V) | (10.58) * | NS | ||||
| SMxV | NS | NS |
| 2019 | 2020 | |||
|---|---|---|---|---|
| Factor 1 | Factor 2 | Factor 1 | Factor 2 | |
| Eigen values | 7.3 | 3.7 | 6.1 | 5.2 |
| Variance (%) | 56.1 | 28.5 | 47.3 | 40 |
| Cumulative % | 56.1 | 84.6 | 47.3 | 87.3 |
| Variable correlations | ||||
| Grain vitrosity | 0.496 | −0.866 | 0.337 | 0.920 |
| Protein content | 0.990 | 0.042 | 0.945 | 0.099 |
| Wet gluten | 0.171 | −0.148 | −0.032 | 0.970 |
| Semolina yield | −0.966 | 0.073 | −0.547 | 0.821 |
| Hardness | −0.217 | −0.635 | −0.737 | −0.181 |
| Springiness | 0.994 | 0.108 | 0.962 | 0.079 |
| Cohesiveness | 0.950 | 0.285 | 0.969 | 0.055 |
| Chewiness | 0.979 | −0.027 | 0.951 | 0.073 |
| Adhesiveness | 0.836 | 0.506 | 0.853 | −0.007 |
| Yellow color | 0.158 | 0.929 | 0.046 | 0.836 |
| Pasta cooking time | 0.947 | −0.320 | −0.587 | 0.726 |
| Pasta cooking loss | −0.748 | 0.567 | 0.331 | −0.933 |
| Water absorption index | 0.159 | 0.939 | −0.585 | −0.766 |
Disclaimer/Publisher’s Note: The statements, opinions and data contained in all publications are solely those of the individual author(s) and contributor(s) and not of MDPI and/or the editor(s). MDPI and/or the editor(s) disclaim responsibility for any injury to people or property resulting from any ideas, methods, instructions or products referred to in the content. |
© 2023 by the authors. Licensee MDPI, Basel, Switzerland. This article is an open access article distributed under the terms and conditions of the Creative Commons Attribution (CC BY) license (https://creativecommons.org/licenses/by/4.0/).
Share and Cite
Kerbouai, I.; Sfayhi, D.; Sassi, K.; M’hamed, H.C.; Jenfaoui, H.; Riahi, J.; Arfaoui, S.; Chouaibi, M.; Ben Ismail, H. Influence of Conservation Agriculture on Durum Wheat Grain, Dough Texture Profile and Pasta Quality in a Mediterranean Region. Agriculture 2023, 13, 908. https://doi.org/10.3390/agriculture13040908
Kerbouai I, Sfayhi D, Sassi K, M’hamed HC, Jenfaoui H, Riahi J, Arfaoui S, Chouaibi M, Ben Ismail H. Influence of Conservation Agriculture on Durum Wheat Grain, Dough Texture Profile and Pasta Quality in a Mediterranean Region. Agriculture. 2023; 13(4):908. https://doi.org/10.3390/agriculture13040908
Chicago/Turabian StyleKerbouai, Imene, Dorra Sfayhi, Khaled Sassi, Hatem Cheikh M’hamed, Houda Jenfaoui, Jouhaina Riahi, Slim Arfaoui, Moncef Chouaibi, and Hanen Ben Ismail. 2023. "Influence of Conservation Agriculture on Durum Wheat Grain, Dough Texture Profile and Pasta Quality in a Mediterranean Region" Agriculture 13, no. 4: 908. https://doi.org/10.3390/agriculture13040908